Article

Appropriate Nitrogen Form and Application Rate Can Improve Yield and Quality of Autumn Tea with Drip Irrigation

1
Center for Agricultural Water Research in China, China Agricultural University, Beijing 100083, China
2
Agricultural and Rural Bureau of Lanshan District, Rizhao 276807, China
3
Shandong Survey and Design Institute of Water Conservancy Co., Ltd., Jinan 250013, China
4
Lanshan Provincial Agricultural High-Tech Industrial Development Zone, Rizhao 276812, China
*
Author to whom correspondence should be addressed.
Agronomy 2023, 13(5), 1303; https://doi.org/10.3390/agronomy13051303
Submission received: 15 April 2023 / Revised: 23 April 2023 / Accepted: 26 April 2023 / Published: 6 May 2023
(This article belongs to the Section Soil and Plant Nutrition)

Abstract

:
Applying nitrogen fertilization is an important way to improve the yield and quality of autumn tea (Camellia sinensis L.), but the effects of nitrogen application rate and nitrogen form still remain unclear. Field experiments were conducted in a drip-irrigated tea garden in Rizhao City, China in 2020 and 2021. The effects of nitrogen application levels (N: 0 kg·hm−2, CK; N: 45 kg·hm−2, U1; 75 kg·hm−2, U2; and 105 kg·hm−2, U3) and nitrogen application forms (ammonium bicarbonate, AB; ammonium bicarbonate + urea, UAB; and urea, U) on soil moisture, as well as nitrogen spatiotemporal change, and autumn tea yield and quality, were studied. Results showed that applying ammonium bicarbonate or urea through a drip irrigation system can significantly increase the tea plant evapotranspiration and the autumn tea yield and quality (including free amino acids and tea polyphenols). With the same nitrogen application, the urea fertilization treatment had the higher ammonium nitrogen content within the 0–60 cm soil layer. The application form of nitrogen fertilizer had a significant impact on the yield of autumn tea, and the yield increasing ability was U > UAB > AB. The partial factor productivity of applied nitrogen under the AB treatment was the lowest. The yield-increasing effect of nitrogen fertilizer can be observed only 16–18 days after topdressing through the drip irrigation system. In 2020 and 2021, the yield of autumn tea under the U3 treatment increased by 40.6% and 23.0%, respectively, compared with the CK treatment. In conclusion, the topdressing with urea 105 kg·hm−2 with drip irrigation for tea plants in autumn is recommended. This recommendation will provide a theoretical basis for efficient irrigation and yield increase in tea gardens.

1. Introduction

The area of tea planting (Camellia sinensis L.) in China is the largest in the world. The output of autumn tea accounts for more than 25% of the annual tea industry in China [1]. Given that autumn green tea is more bitter and astringent than spring tea [2,3], improving the aroma and taste of autumn tea is essential to improving its economic benefits.
The aroma of tea is mostly determined by the mass of secondary metabolites, which consist of three major characteristic constituents: tea polyphenols, free amino acids (mainly theanine), and caffeine. Compared with spring green tea, autumn teas have more tea polyphenols, which cause a bitter taste, and fewer amino acids, which mainly affect the umami taste; approximately 70% of the umami taste intensity of green tea is due to amino acids [4]. In tea plants, most amino acids are synthesized in the roots and then transported to the leaves [5]. A reasonable nitrogen application rate has a positive impact on the tea root growth [6] and can significantly increase the content of tea amino acid, caffeine, and catechin [7,8]. According to Tang et al. [9], to produce 1000 kg of autumn green tea, 8.8 kg of nitrogen (N), 1.0 kg of phosphorus (P), and 3.2 kg of potassium (K) are required, and tea plants need a large amount of N, which accounts for about 4.5% of the dry weight of tea [3,10]. Therefore, the amino acid content that dominates the quality of tea is mainly determined by the efficiency of nitrogen absorption by the roots of the tea tree.
The nitrogen form is important for nitrogen uptake efficiency of tea roots. Ammonium (NH4+) and nitrate (NO3) are important inorganic N sources readily available to plants, but have different assimilation and absorption mechanisms. Tea is widely considered to be acid-tolerant and prefers NH4+-rich environments, rather than NO3-rich ones [11], as tea roots show a high capacity for NH4+ assimilation, can increase key enzyme activities, and improve carbohydrate status [12]. When NH4+-based fertilizer is applied to the soil, NH4+-N is rapidly nitrated, and the utilization rate of crops for NH4+-N decrease [13]. Nitrification will also lead to soil acidification. The proper pH for tea growth is about 4.2 [14], and, when the pH is less than 3.8, or higher than 5.0, it is not conducive for tea tree growth. NH4+-based fertilizers, such as ammonium bicarbonate and urea, can help prevent rapid nitrification, and improve the nitrogen use efficiency and yield of tea [15]. The incubation experiment of Wang et al. [15] showed that nitrogen forms (ammonium bicarbonate, urea, and ammonium sulfate) had different effects on the soil of tea gardens. On the basis of this study, we conducted field experiments in autumn tea gardens to explore the effects of nitrogen forms on tea tree growth and tea production.
When people are pursuing more yield and higher quality tea, improper fertilizer management, such as excessive fertilization [16,17], can lead to decreased tea quality [18] and tea garden pollution [19]. How to apply nitrogen fertilizer rationally and efficiently is becoming an urgent problem related to the sustainable development of tea gardens. Currently, the forms of fertilizer used in tea gardens are becoming increasingly diverse, including organic manures [20,21], rapeseed cake [6], and chemical fertilizers [22]. However, all these fertilizers are applied through ditching manually [23]. Compared to traditional fertilization methods, drip fertilization systems have been repeatedly proven to be beneficial for forming a good root structure, improving crop yield and quality, and reducing environmental risks [24]. Transport and transformation of nitrogen under drip irrigation should be quite different from that under traditional fertilization methods, and the nitrogen use efficiency should be much higher. However, few research studies have been conducted in this respect.
The objectives of this research were to investigate the effects of nitrogen form (ammonium bicarbonate and urea) and application rate on soil nitrate nitrogen and ammonium nitrogen content, and autumn tea yield and quality under drip irrigation.

2. Materials and Methods

2.1. Experimental Site

Field experiments were performed in the fall of 2020 and 2021, respectively, at the Graduate Practice Base of China Agricultural University in Rizhao City, Shandong Province, China (35°27′ N, 119°25′ E), with an altitude of 35 m. The experimental site has a temperate and monsoonal climate. An automatic weather station (SMC6152, Beijing Unism Technologies, Inc., Beijing, China) was installed in the experimental field to automatically observe and record air temperature and rainfall (Figure 1). The variation ranges of daily maximum temperature, daily minimum temperature, and daily average temperature in September 2020 were 20.8–34.4 °C, 12.2–22.7 °C, and 17.8–26.5 °C, respectively. The average temperature for the whole of September 2020 was 17.0 °C. The variation ranges of daily maximum temperature, daily minimum temperature, and daily average temperature in September 2021 were 20.4–29.7 °C, 15.8–23.0 °C, and 18.3–26.1 °C, respectively. The average temperature of the whole of September 2021 was 21.2 °C. Thus, the average temperature in September 2021 was nearly 4.2 °C higher than that in 2020. In September 2020, there was 64.8 mm of rainfall in total. In September 2021, the total rainfall was 160.8 mm, 96 mm higher than in 2020. Accordingly, the entire irrigation amount in 2021 was 40 mm, 42 mm lower than that in 2020.
The tea plants in spring, 2021, did not germinate until the end of May, due to severe winter freeze damage, which might affect the autumn tea garden production, while the tea garden was harvested typically in spring, 2020. Therefore, the meteorological data of the two winters (December 2019 to February 2020, and December 2020 to February 2021) are now displayed and compared. The lowest temperature in the first winter was −12.3 °C, and the duration of temperatures below −9 °C was 9.4 h; the lowest temperature in the second winter was −15.7 °C; the duration of temperatures below −9 °C was 61.9 h.
The soil texture of the experimental site was sandy loam, and the average bulk density, at a depth of 0–60 cm, was 1.4 g·cm–3. The average field water capacity was 24.3% (v/v), and the average pH value was 5.0. The organic matter, total nitrogen, total phosphorus, available potassium, and alkali hydrolyzable nitrogen, before the experiments, were 20.2 g kg–1, 1.2 g·kg–1, 0.7 g·kg−1, 72.9 mg·kg−1, and 82.3 mg·kg−1, respectively.

2.2. Experimental Design

Three fertilization methods were designed as ammonium bicarbonate (AB), urea (U), and 1:1 mixed nitrogen fertilizer, containing ammonium bicarbonate and urea (UAB). The nitrogen application rate of the three treatments was 105 kg·hm−2. The nitrogen application rate of urea was considered an experimental factor, and three levels of the nitrogen application rate were designed: 45 kg·hm−2 (U1), 75 kg·hm−2 (U2), and 105 kg·hm−2 (U3). In addition, the CK treatment without additional nitrogen fertilizer was set as the control. Overall, six treatments (Table 1) with three replicates each and a randomized block design were adopted.
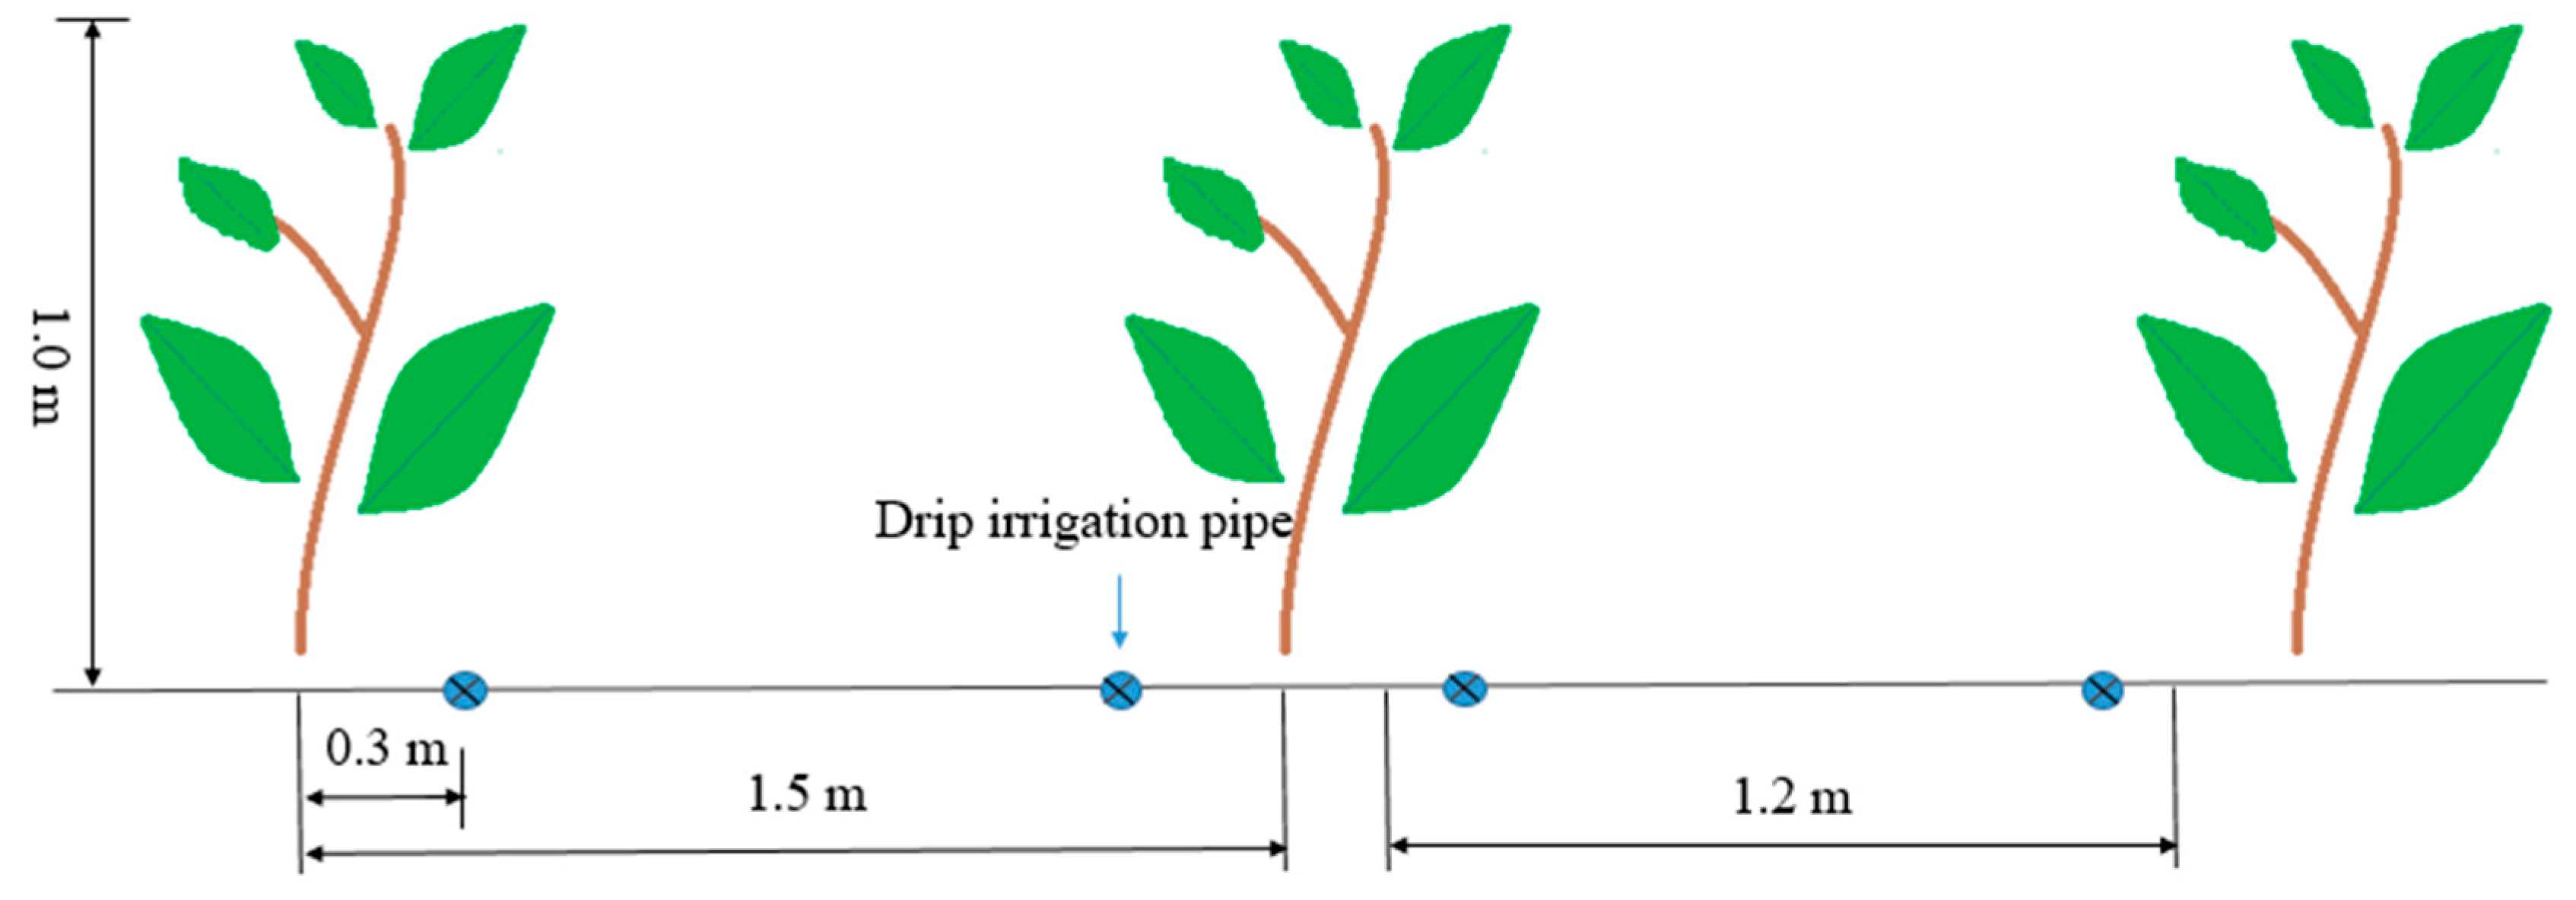
‘Fuding Dabai’ tea had been planted from east to west in 2010. In each plot, there were five rows of tea trees, and the plot area was 41.3 m2. Each row was 1.5 m wide, 5.5 m long, and each tea tree row’s width and height were approximately 1.0 m. The experimental tea garden was irrigated by a drip irrigation system. The distance between two adjacent irrigation emitters was 0.3 m, and the flow rate of the emitter was 2.0 L·h−1. Therefore, each ridge of tea tree was irrigated by two drip irrigation tapes. The drip irrigation tapes were arranged in the open space between wide tea ridges, and the distance between drip irrigation tapes was 0.8 m (Figure 2).

2.3. Irrigation Regime

Dial vacuum tensiometers (SL-50, Beijing Shunlong Ltd., Beijing, China) were placed, after calibrating in three plots from AB, UAB, and U3 treatments, to monitor the soil moisture content at 0.15 m directly below the drip irrigation belt. The lower limit of irrigation was set at −15 kPa. When the numerical reading of the tensiometer dropped to −15 kPa, the drip irrigation system started to operate, until the soil water content increased up to 90% of the field water capacity. The irrigation quota was strictly controlled by a water-flowmeter to ensure that all plots had the same amount of water. Irrigation was conducted three times in September 2020, and the quotas were 35 mm on 2 September, 9 mm on 9 September, and 38 mm on 18 September. In September 2021, the tea plants were irrigated by 8 mm on 7 September and 32 mm on 15 September.

2.4. Fertilizer Regime

Since 70% of the annual nitrogen fertilizer and all phosphorus and potassium fertilizers were applied to the tea garden in the early spring and early summer of each year, only nitrogen fertilizer, accounting for 30% of the annual amount of nitrogen fertilizer, was added in autumn. The fertilizer management in the spring and summer of these two years was the same. The topdressing in the fall of 2020 was divided into three equal parts: 2 September, 9 September, and 18 September. Topdressing was divided into two equal parts in the fall of 2021: on 7 September and 15 September.

2.5. Observation Indexes and Sampling

2.5.1. Soil Moisture Content, Soil Nitrate Nitrogen and Ammonium Nitrogen Content

Soil moisture content was determined 1 day before and 1, 3, 5, and 7 days after each irrigation event by the drying method. Soil samples were collected from each treatment in the middle of the representative plot. They were collected in a direction perpendicular to the dripline with horizontal distances of 0, 20, and 40 cm, and at soil depths of 20, 40, 60, and 80 cmd. After the soil samples were collected, the holes left were backfilled with soil, marked for reference, and positioned, before the following soil sampling. Every sample was divided into two parts: one part was used in determining soil moisture content, and the other was frozen quickly and preserved until the end of the field experiment, and was used in determining the nitrate and ammonium nitrogen content in the soil. We mixed the three soil samples from each layer and used the mixed samplings to determine the nitrogen content to represent the content of each layer. Available NH4+ and NH3 were extracted by potassium chloride solutions (2.0 mol·L–1). The ammonium nitrogen content was determined by indophenol blue spectrophotometry (NY/T 1849-2010), and the nitrate nitrogen content was determined by ultraviolet spectrophotometry (GB/T 32737-2016).

2.5.2. Evapotranspiration of Tea Trees

The evapotranspiration (ET) of tea trees in September was computed by the water balance method [25], and was calculated using Equation (1):
E T = I + K + P R D + Δ S
where I is irrigation amount (in mm), and K is groundwater recharge. Given that the groundwater table was below 10 m, the groundwater recharge should be ignored; P is precipitation (in mm), R is runoff, and D is deep seepage. The irrigation quota was calculated according to the soil moisture content before irrigation, the upper limit of irrigation was 90%, and the planned moist layer in soil was 0.6 m, so runoff and deep seepage were considered negligible; ΔS is the change of soil water storage within 0.9 m soil layer, and the required soil moisture content at 0.1, 0.3, 0.5, 0.7, and 0.9 m depths were measured by the weighing method.

2.5.3. Tea Yield and Quality Composition

From 12 September to 2 October each year, autumn tea was picked three times. Before the start of the autumn fertilization experiment each year, the tea trees of the experimental plot were selected manually. The weight of the fresh leaves picked on 1 September 2020 and 2 September 2021 showed no significant difference among the yields of each experimental plot before topdressing.
All the bud heads of one bud and two leaves in each plot, were picked manually and weighed immediately. The total output of fresh leaves in the autumn was determined and converted into kg·hm−2. The fresh leaves of the second batch of harvested tea in 2020, and all three batches of tea in 2021, were dried ground, and sent to the Tea Quality Inspection and Supervision Center, Ministry of Agriculture and Rural Affairs, P.R.C, to test tea polyphenols and free amino acids in the tea. The determination standards were GB/T 8305-2013 and GB/T 8314-2013.

2.6. Nitrogen Application Productivity

The partial factor productivity of applied nitrogen [26] is the yield of tea leaves per kilogram of nitrogen application, expressed as kg·kg−1 of applied N in each treatment. Nitrogen application productivity provides an index for quantifying the efficiency of fertilizer management in tea gardens.

2.7. Statistical Analysis

SPSS 24 software was used for variance and correlation analyses. Differences in variance analysis results among treatments were determined using an LSD test at p < 0.05.

3. Results

3.1. Soil Moisture Content

A downward trend for soil water content was observed during the picking season (Figure 3). The average soil moisture content within the 0–60 cm soil layer was 14.2% in September 2020, and 15.8% in 2021, 1.6% higher than in 2020. At the same nitrogen application rate, the average soil moisture content was 14.1% (AB), 14.7% (UAB), and 14.0% (U) in 2020, and 15.2% (AB), 16.5% (UAB), and 15.7% (U3) in 2021. At the 20 cm soil layer, the soil moisture content of each treatment did not vary, but the soil moisture content at 40 and 60 cm depths showed that the soil moisture content of the UAB treatment was higher than that of the U3 and AB treatments.

3.2. Evapotranspiration of Tea Plants

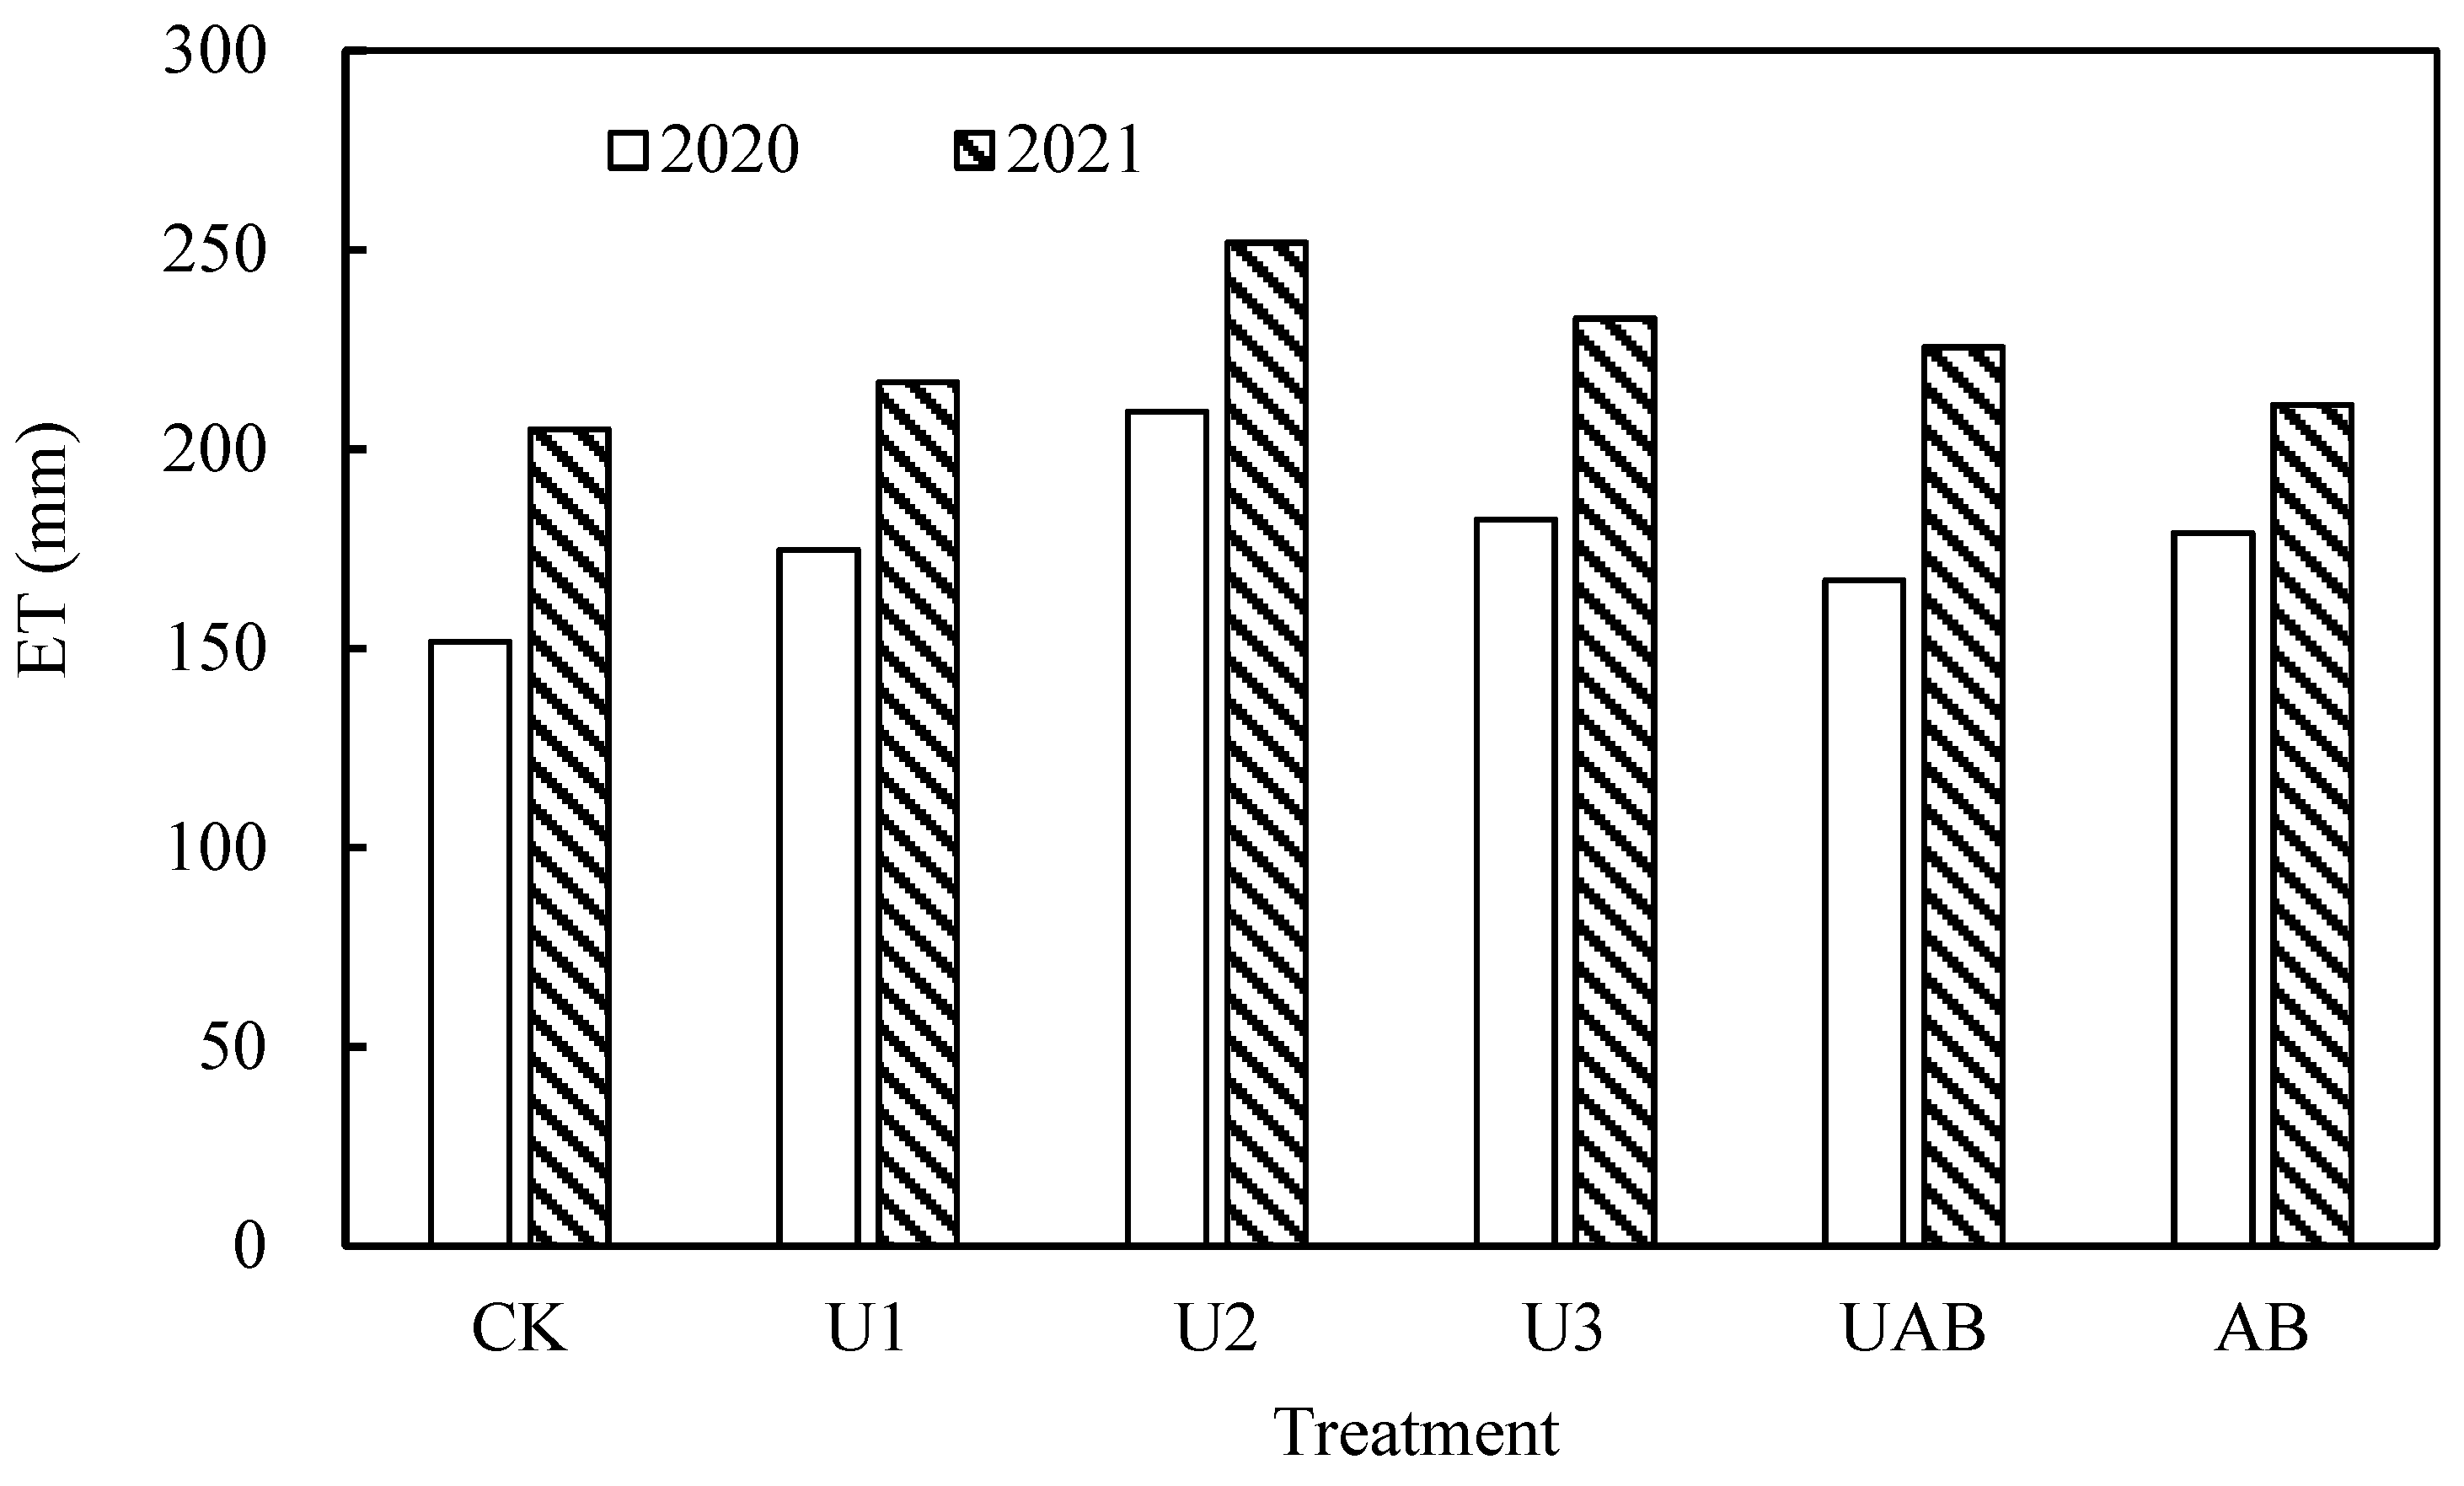
In the tea-picking season in 2020 (2 September to 2 October), the ET of tea trees ranged from 152 mm to 209 mm (Figure 4), and the average ET was 177 mm. The U2 treatment had the most extensive ET of 209 mm, 37.5% larger than the CK treatment (152 mm). During the tea-picking season in 2021, the ET ranged from 205 mm to 252 mm, and the average ET of all treatments was 224 mm. The U2 treatment had the largest ET, and the CK treatment had the lowest. The ET of the U2 treatment was 22.8% higher than that of the CK treatment. The ET values of all treatments in September 2021 were all larger than those in 2020, and the difference in each treatment between the two years ranged from 32.1 mm to 58.5 mm. Compared with the CK, in U1 and U2 treatments in 2020 and 2021, ET increased with nitrogen application. However, the ET of the U3 treatment was higher than the ET of CK and U1, but lower than the ET of U2, indicating that ET increases, and then decreases, with increasing nitrogen application.

3.3. Changes of Nitrate Nitrogen and Ammonium Nitrogen Content at 0–60 cm Soil Layer

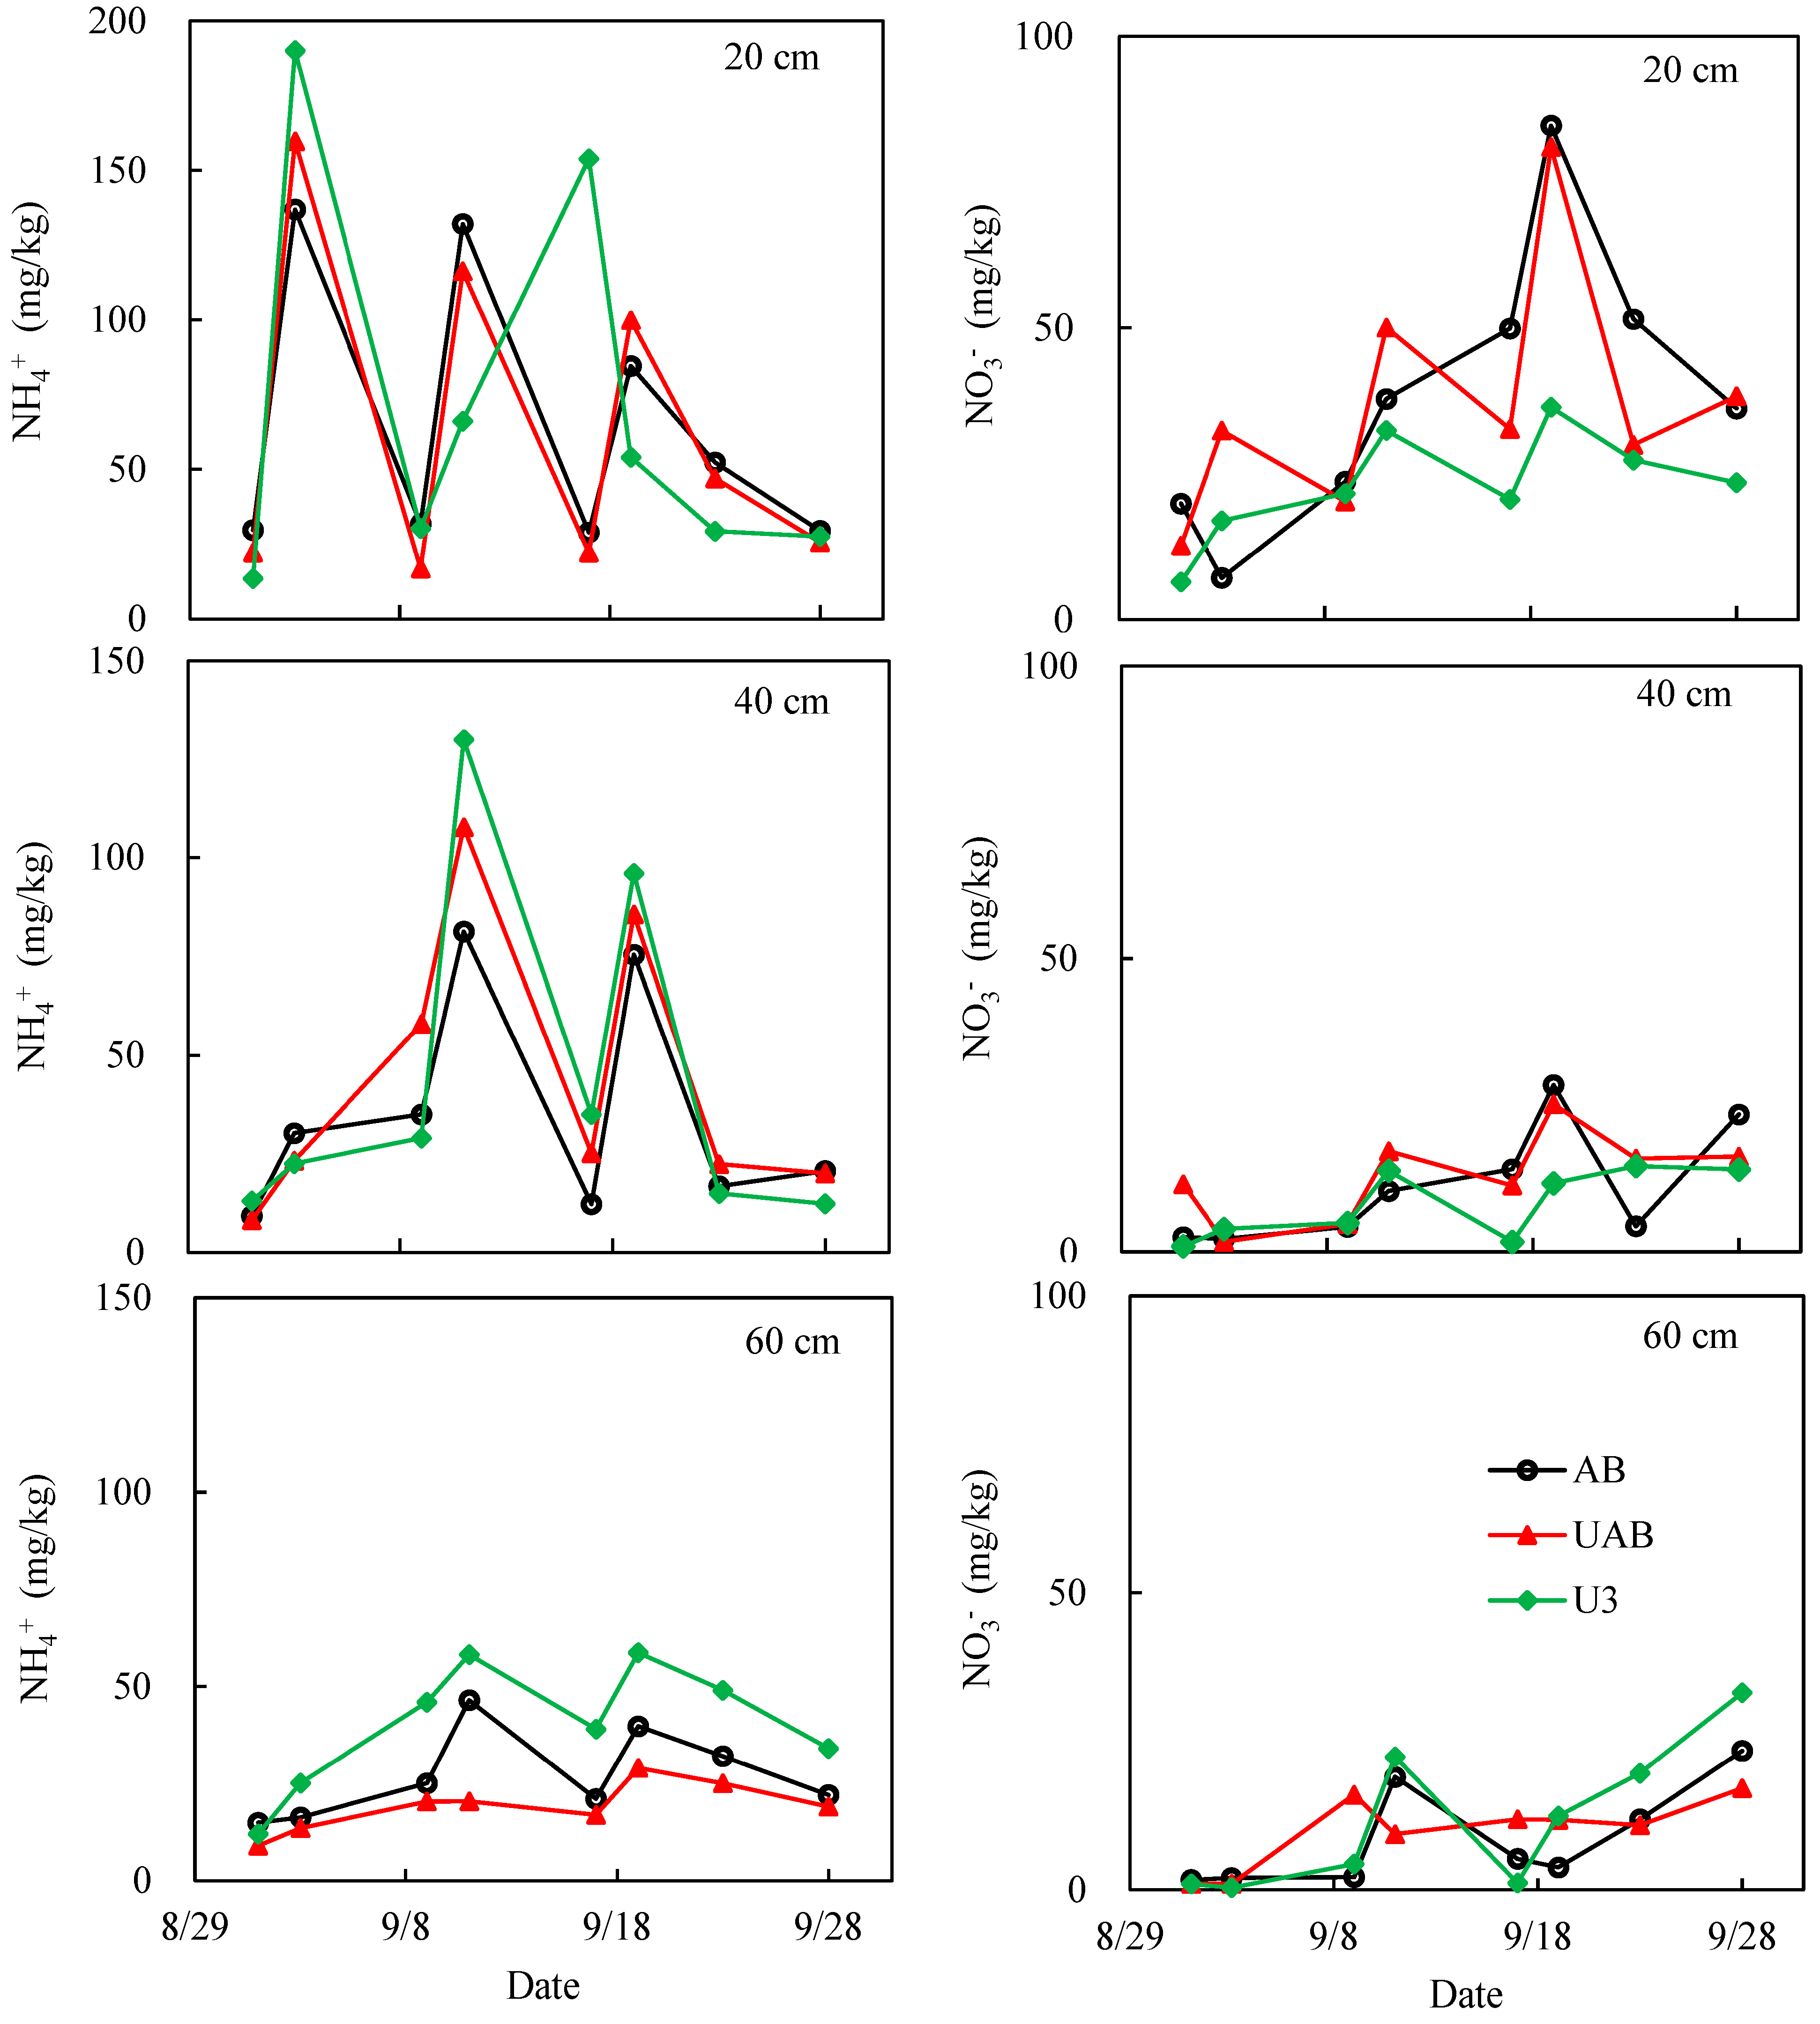
The fluctuation in soil nitrogen content at a 20 cm depth was greater than the fluctuations at 40 cm and 60 cm depths (Figure 5 and Figure 6) in 2020 and 2021. The concentration of NH4+ at the 60 cm soil layer basically fluctuated below 50 mg·kg−1, and the concentration of NO3 was basically below 50 mg·kg−1 in the 40 cm soil layer. No time lag was observed for the change of NH4+ or NO3 content at each soil depth. In September 2020, the concentrations of NH4+ and NO3 at 20 cm increased, and then decreased, three times; the content of NH4+ and NO3 at 40 cm increased, and then decreased, twice; and two more minor fluctuations were observed at the 60 cm soil layer. When the amount of applied N was the same, the concentration of NH4+ in the U3 treatment was higher than in the UAB and AB treatments. Within the 0–60 cm soil layer, the concentrations of NH4+ under the U3 treatment were always the highest, and NO3 under U3 was lower than that under AB and UAB. In September 2021, the concentrations of NH4+ and NO3 at 20 cm increased, and then decreased, twice; at 40 cm, the concentration of NH4+ fluctuated twice, and that of NO3 fluctuated only once; at 60 cm, the fluctuation was smaller than that at 40 cm. No matter the concentrations of NH4+ or NO3, the difference between different treatments is not obvious.

3.4. Yield

Although only a difference of two days was observed in the two-year harvest period in September, the rules presented by different batches were inconsistent (Figure 7). In 2020, the yield of the first harvest under each treatment was significantly higher than that of the second and third harvests. The U3 treatment had the highest yields on 13 September (198.6 kg·hm−2) and 20 September (137.8 kg·hm−2), and the UAB treatment had the highest yield on 29 September (120.0 kg·hm−2). No significant difference among the yields of all treatments was found on 13 September. The yields of the U3, UAB, and AB treatments on 20 September were significantly higher than those of the U1 and U2 treatments, which were significantly higher than the yields of the CK treatments. On 29 September, the yield of the U2 treatment was not significantly different from the yields of the U3, UAB, and AB treatments, and they were significantly higher than the yield of the U1 treatment, while the U1 treatment was significantly higher than the CK treatment. The average total yield of all treatments in the 2020 fall was 403.2 kg·hm−2. The U3 treatment had the highest total yield (450.6 kg·hm−2), 40.6% higher than the CK treatment. The total yields of the U3 and UAB treatments were significantly higher than the total yield of the U1 treatment, and the total yield of the U1 treatment was significantly higher than that of the CK treatment. No significant difference was found among the total yields of the U2, UAB, AB, and U3 treatments. When the applied nitrogen fertilization form was urea, the total yield of the U3 treatment was significantly higher than that of the U1 treatment (18.4%), and U2 and U3 had no significant difference.
In 2021, the yield of the third batch of each treatment was much higher than those of the previous two batches. For the first batch (5 days after the first topdressing), the yield ranged from 102.4 kg·hm−2 to 117.2 kg·hm−2, and the range of the second batch was 33.2–41.0 kg·hm−2. No significant difference was found among different treatments in the first and second batches. The yield of the third batch ranged from 196.5–296.3 kg·hm−2. The average yield of each treatment picked for the third batch was 229.1 kg·hm−2, which was 107.0% and 525.9% higher than the average yields of the first batch (110.7 kg·hm−2) and the second batch (36.6 kg·hm−2), respectively. In the third batch, U3 was significantly higher than UAB; UAB was significantly higher than AB, U2, and U1; AB, U2, and U1 were significantly higher than CK. No significant difference was found among AB, U2, and U1. The U3 treatment had the highest yield in the third batch (269.3 kg·hm−2), which was 37.0% higher than the lowest yield from the CK treatment. The average total yield of all treatments in autumn, 2021, was 375.6 kg·hm−2. The U3 treatment had the highest total yield of 412.2 kg·hm−2, 23.0% higher than the CK treatment. The total yields of the U3, UAB, and AB treatments were significantly higher than those of the U2 and U1 treatments, and the total yield of the U2 treatment was 11.2%, significantly higher than that of the CK treatment.

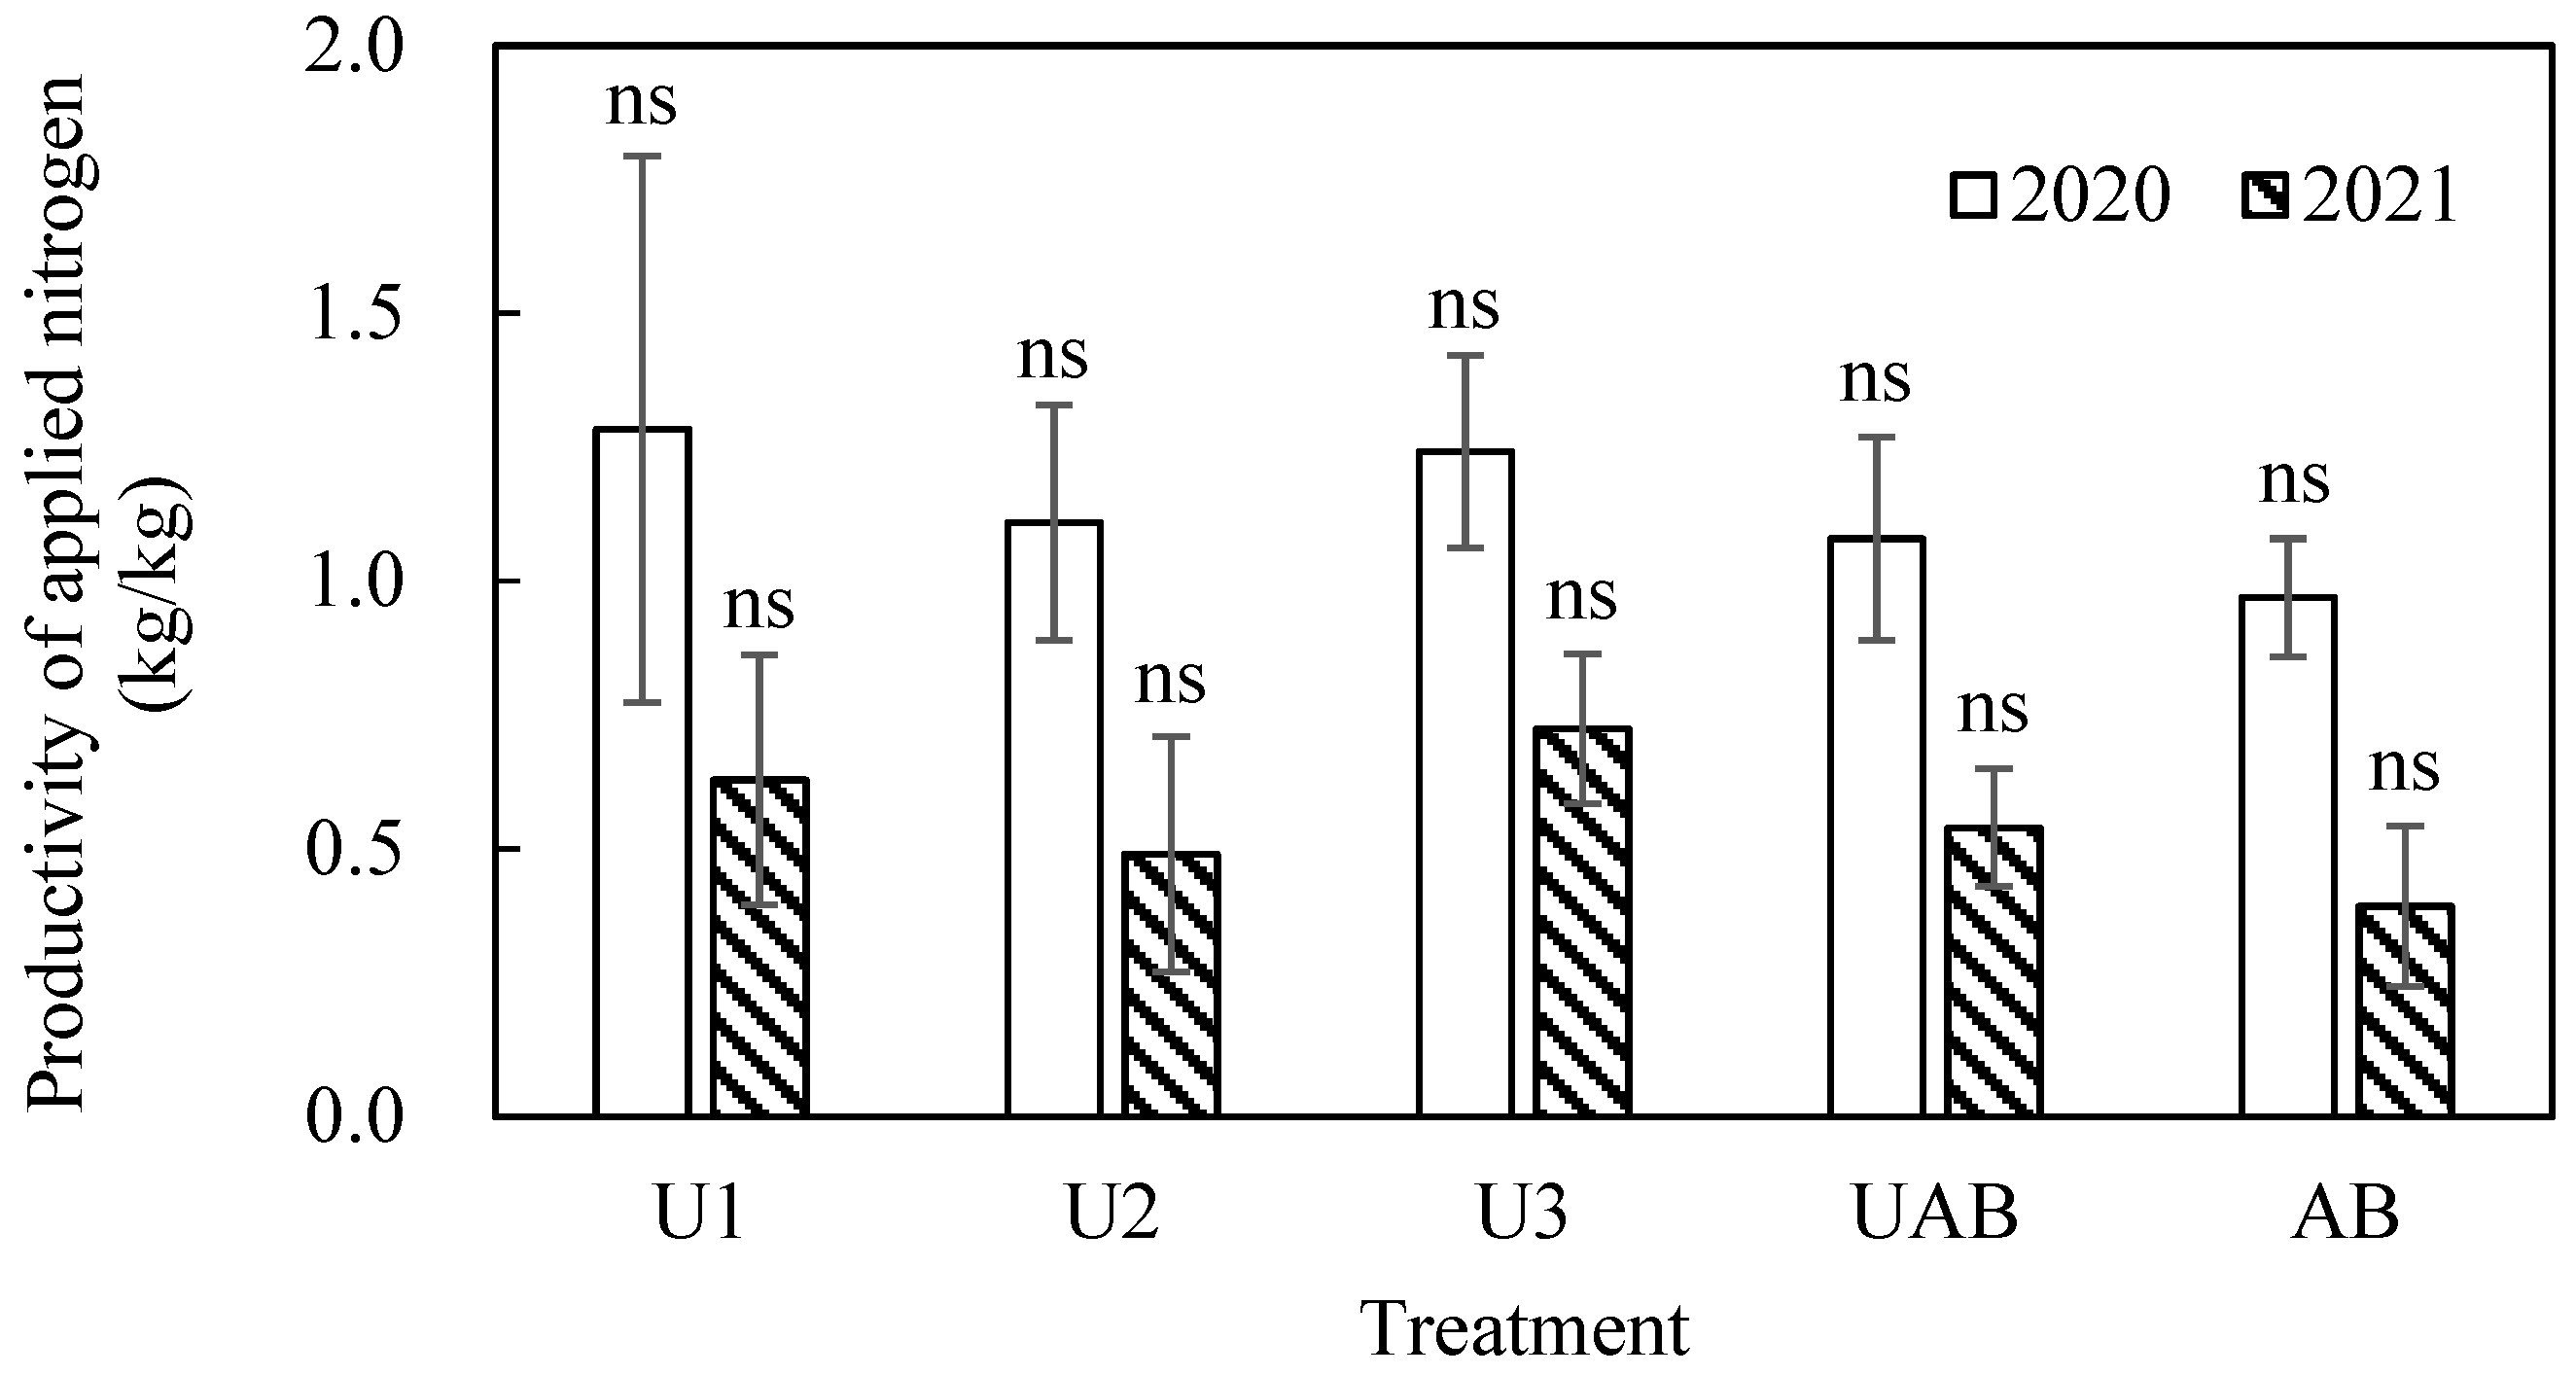
3.5. Productivity of Applied Nitrogen

The productivity of applied nitrogen in all fertilized treatments in autumn, 2020, was higher than that in autumn, 2021 (Figure 8). In 2020, the U1 treatment had the highest productivity of applied nitrogen (1.3 kg·kg−1), and the AB treatment had the lowest 1.0 kg·kg−1. In 2021, the U3 treatment had the highest productivity (0.7 kg·kg−1), and the AB treatment had the lowest (only 0.4 kg·kg−1). Comparisons among the AB, UAB, and U3 treatments showed that the productivity of nitrogen fertilizer decreased with an increasing proportion of ammonium bicarbonate in fertilizers. No matter whether it was in 2020 or 2021, there was no significant difference in partial factor productivity of applied nitrogen among treatments (p > 0.05).

3.6. Quality Component

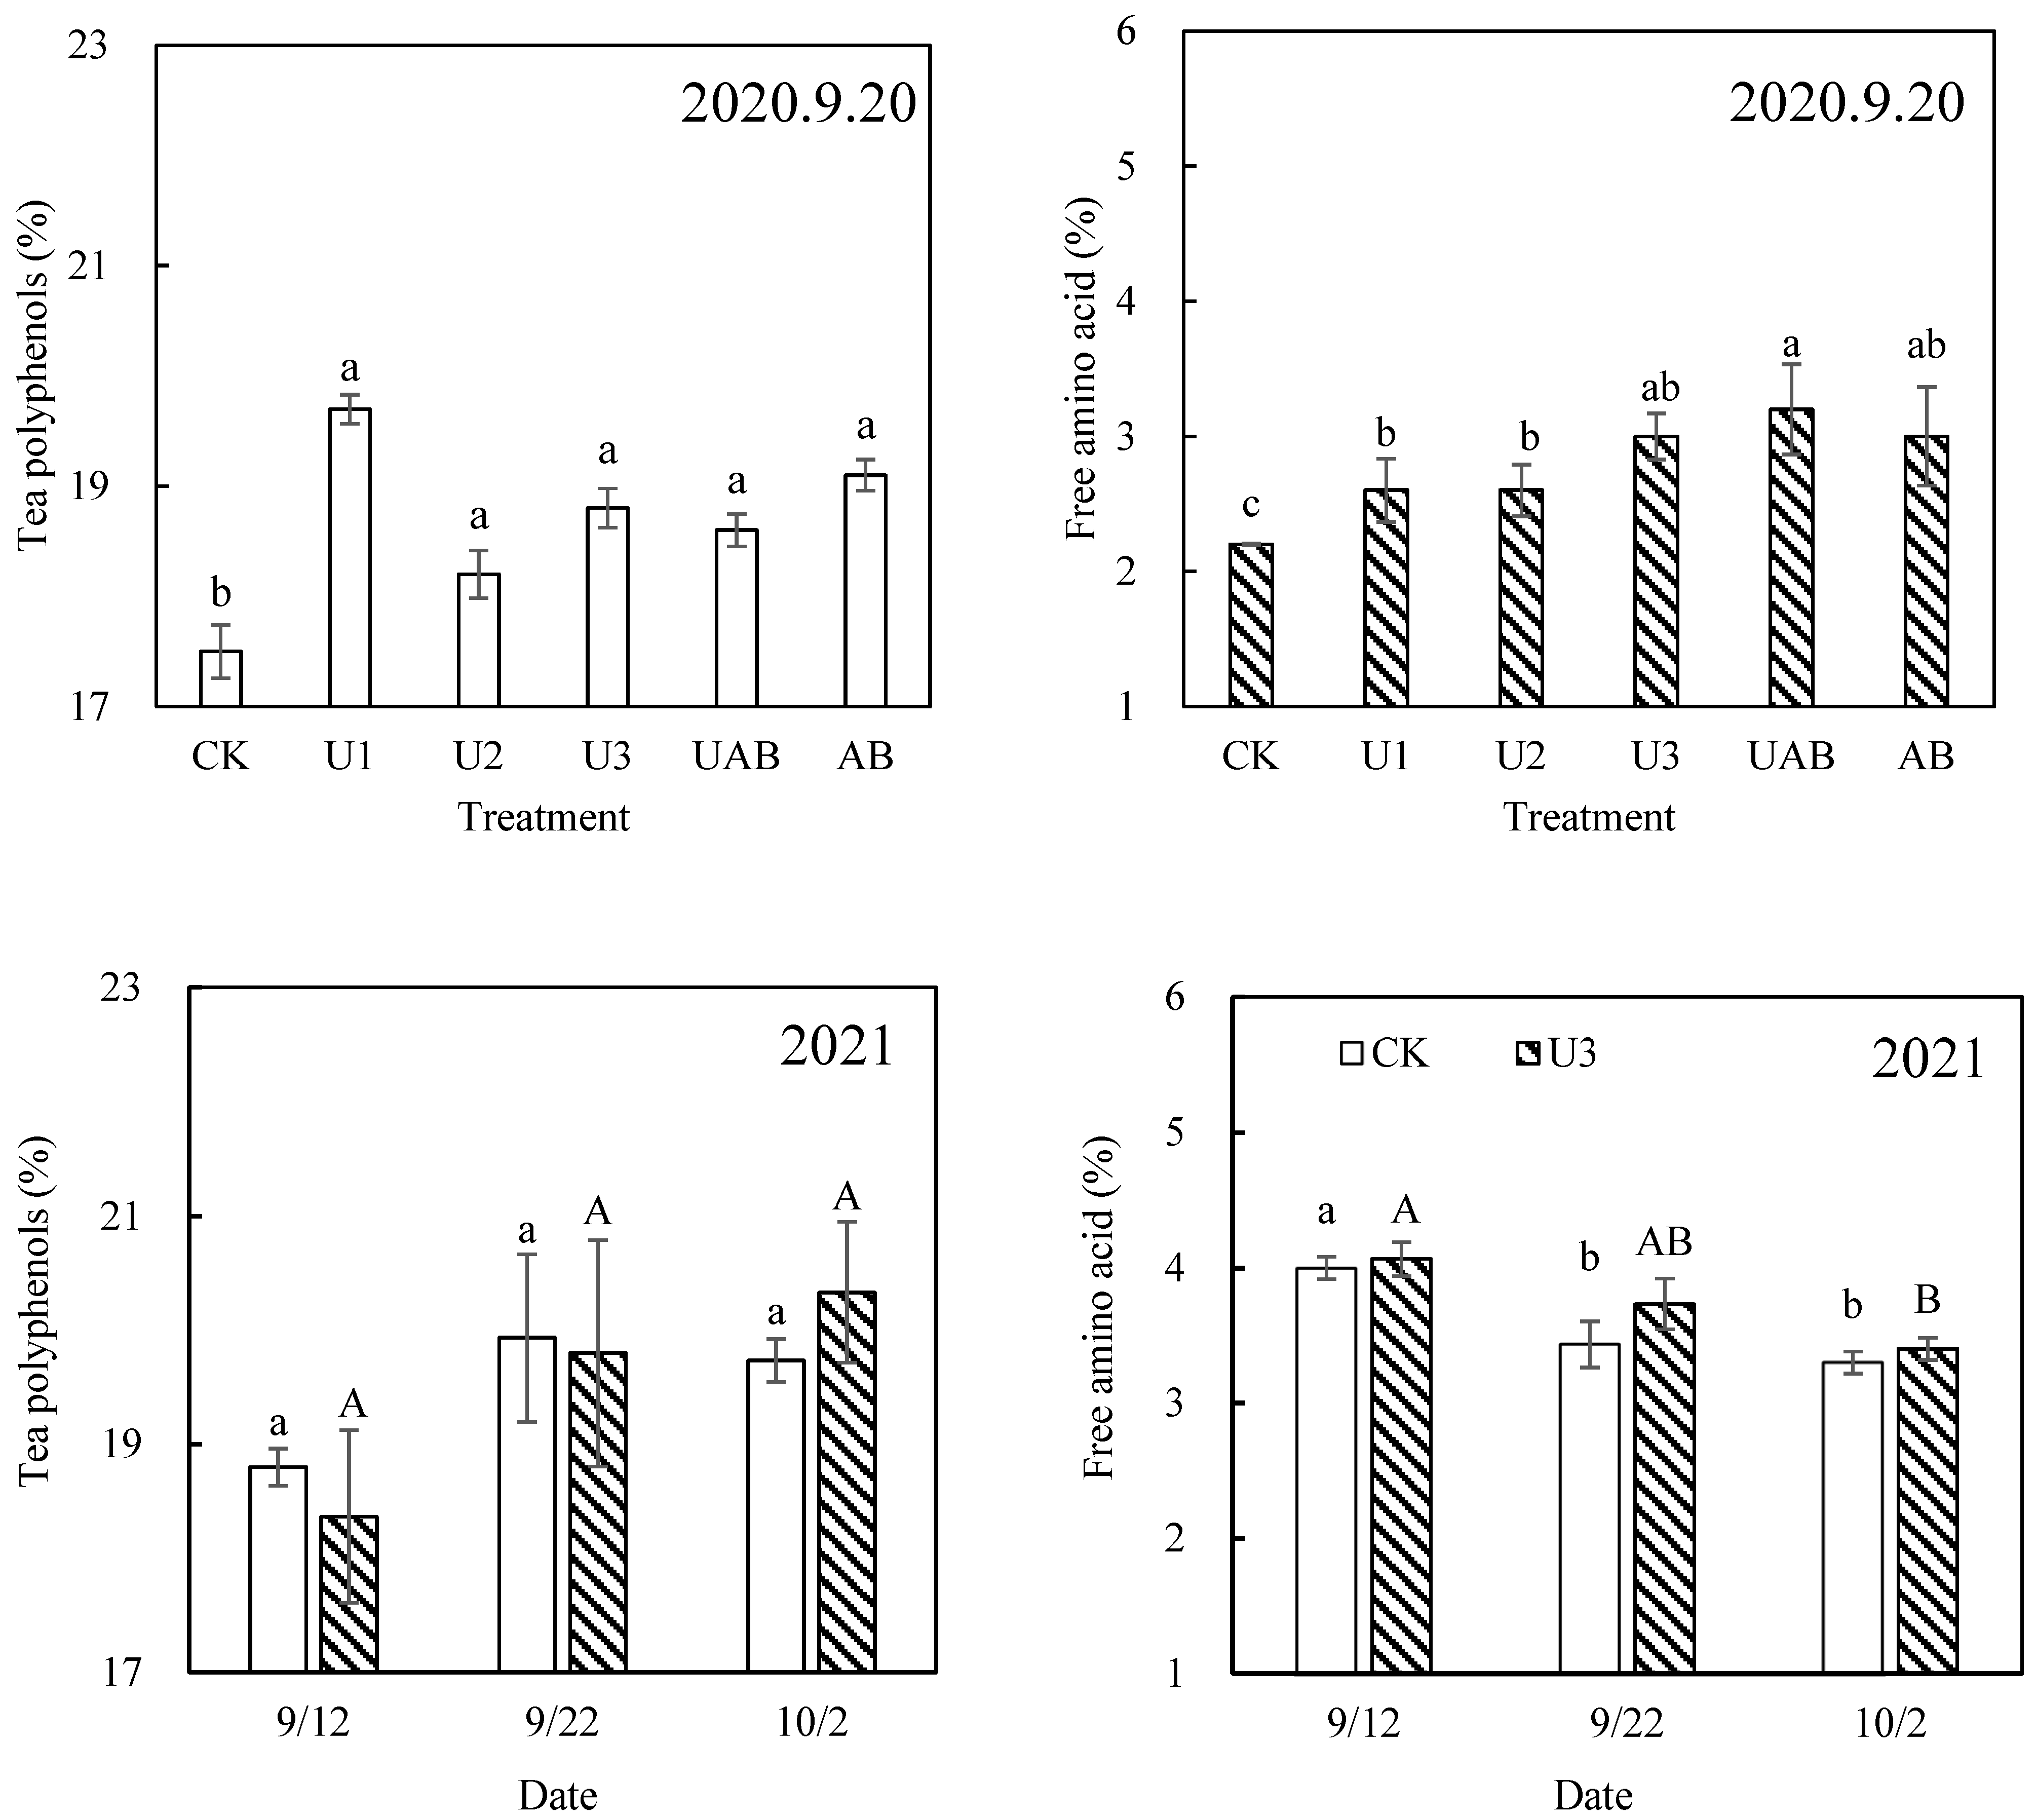
In autumn, 2020, the content of tea polyphenols under the CK treatment was significantly lower than those in nitrogen fertilized treatments, and the effect of the nitrogen application method, or amount, on the content of tea polyphenols was not significant (Figure 9). The free amino acid content of the CK treatment was significantly lower than that in other treatments. The comparisons among the AB, UAB, and U3 treatments showed that nitrogen application form had no significant effect on the free amino acids of tea leaves. In the UAB treatment, the tea’s free amino acids content was significantly higher than that of the U1, U2, and CK treatments, indicating that free amino acid content increases with nitrogen application.
In September 2021, the tea quality of different picking batches was investigated. No matter whether it was the CK or U3 treatment, the content of free amino acids in the tea leaves picked on 12 September was significantly higher than that on 22 September and 2 October. There was no significant difference between the tea polyphenol content under different picking periods, but there was a trend of increasing with time. That is, the content of tea polyphenols increased with time, whereas free amino acid content decreased. The content of tea polyphenols in the U3 treatment was lower than that in the CK treatment on 12 September and 22 September. By 2 October, the content of tea polyphenols in the U3 treatment was higher than that in the CK treatment. The free amino acid content of the U3 treatment was higher than that of the CK treatment.

4. Discussion

The crop water requirement of tea in China is about 1205 mm per year [27], and the average water demand of autumn tea trees is 232–352 mm (from August to October, 92 days) [28]. The ET values in this experiment were only calculated from 2 September to 2 October, and varied from 152 mm to 253 mm. The contract daily water consumption was 5.1–8.4 mm, higher than what Zheng et al. [29] found, which seems reasonable if the differences in climate, soil, tea varieties, and other factors are taken into consideration. Comparisons between the ETs of all treatments in September 2021 and those in September 2020 showed that the ET values increased by 32.1–58.5 mm, and differences were mainly caused by rainfall and irrigation. The ET values of the U2 treatment were the highest in both years, whereas the ET values of the CK treatment were the lowest. The effect of the nitrogen application mode on ET was not obvious. Comparison among the CK, U1, and U2 treatments showed that the ET values increased with the amount of urea applied, consistent with previous research results [30,31]. However, the ET of U3 was smaller than U2 in two years, indicating that the relationship between ET and the amount of urea application is not monotonically increasing. When the amount of nitrogen application reaches a critical value, ET might increase with the amount of nitrogen application. After reaching a critical value, ET might decrease with increasing nitrogen application. The crucial value for tea plants under such conditions was estimated to range from 75 kg·hm−2 to 105 kg·hm−2.
The concentrations of NH4+ and NO3 fluctuated slightly with the topdressing event at a soil depth of 60 cm, showing that the main wet area for drip irrigation and topdressing was about 60 cm deep and was the most active part of tea roots [32]. In the 0–60 cm soil layer, tea plants are well-adapted to NH4+-rich environments and exhibit a high capacity for NH4+ and glutamine synthetase activity in fibrous roots [12]. This means that applying nitrogen fertilizer and water through a drip irrigation system can quickly supplement nitrogen for the main roots of tea trees, which is conducive to autumn tea harvesting.
The productivity of the U1 treatment was similar to that of the U3 treatment. Although the nitrogen application method had no significant impact on the total autumn yield for two years, the yield of the U3 treatment on the third batch in autumn, 2021, was significantly higher than that of the UAB treatment, and the total output of the UAB treatment was significantly higher than that of the AB treatment, indicating that the yield of tea increases with the proportion of urea. In other words, with the same amount of nitrogen, the effect of urea on increased yield was better than that of ammonium bicarbonate, possibly because the ammonia volatilization of ammonium bicarbonate is greater than that of urea, accounting for 18.2% and 8.8% of nitrogen application, respectively [33,34].
The autumn tea yields in 2021 were quite different from those in 2020. Especially, changes were observed over time in the picking batches. These changes were considered to be caused by suffering such severe frost damage in January 2021, which led to the total annihilation of spring tea and affected autumn tea [35]. Chun et al. [36] considered air temperatures below −9 °C as a warning indicator of tea garden freeze damage. Thus, the second winter was much colder than the first year, leading to severe freezing injury to the tea garden. Under such circumstances, the autumn tea yield in the second batch in September 2021 decreased sharply to less than 50 kg·hm−2, and a large wave of yield broke out in the third batch (up to more than 200 kg·hm−2). In the third batch, the yield was significantly affected by the form of fertilizer application. The increased proportion of urea in nitrogen fertilizer increased the yield. The surge in the yield of the third batch of the CK treatment can be explained by the warmer weather. The average daily temperature in the same period in 2020 (from 23 September to 2 October) was 19.8 °C, while the average temperature in 2021 was 22.6 °C, 2.8 °C higher, indicating that increased air temperature can not only prolong the harvest period, but also improve the yield.
It is worth noting the relationship between the fertilization event time and yield increase. In 2020, no apparent yield increase with nitrogenous fertilizer was found in the first batch, 11 days after the first fertilization, and 4 days after the second fertilization. The first time the yield increase was observed was in the second picking batch, 17 days after the first fertilization, 10 days after the second, and 2 days after the third. In 2021, the first time the yield increase was observed was 24 days after the first topdressing and 16 days after the second fertilization; that is to say, the tea yield increase effect of nitrogen fertilization could be seen in about two weeks. It took much less time and effort than the conventional method of manually burying autumn fertilizer into the soil in early July [37,38].
Besides the fact that the free amino acid content increased significantly, the tea polyphenol contents in treatments with nitrogen fertilizer were significantly higher than that of the CK treatment, indicating that nitrogen fertilizer improved the content of not only free amino acids, but also tea polyphenols in autumn tea, consistent with research conducted by Kumar et al. [39] and Chen et al. [40]. It is interesting to find that there were significant differences among the quality components of different picking batches, which may be due to meteorological conditions [41,42]. Free amino acids decrease when air temperatures drop [43]. In this experiment in 2021, the temperature decreased with time (from 2 September to 12 September, the average temperature was 23.8 °C; from 13 September to 22 September, 22.9 °C; from 22 September to 2 October, 22.6 °C). Thus, the content of free amino acids decreased. By contrast, tea polyphenols increased with the picking period in September 2021, inconsistent with existing research [44,45]. Catechins are the major compounds of tea polyphenols, and low temperatures suppress the expression of catechin biosynthesis-related genes, decrease the content of total esterified catechins, and increase the content of total non-esterified catechins in tea plants [46]. Accordingly, the sensitive factors of tea polyphenols require further study.
As an ecosystem, the species diversity of tea gardens [47] is likely to change with fertilization management. The diseases and pests that may be caused in the following growing season should inevitably affect tea yield and quality, and their prevention and control measures [48] may also need improvements, accordingly. Since this research only focuses on the impact of nitrogen fertilizer on tea output, the comprehensive utilization of land, and the future disease and pesticide management in tea gardens requires further research.

5. Conclusions

The tea garden studies demonstrated that applying ammonium bicarbonate or urea through a drip irrigation system can significantly increase the tea plant evapotranspiration, yield, and quality, including free amino acids and tea polyphenols of autumn tea. With the same nitrogen application, the urea fertilization treatments had higher ammonium nitrogen content than the AB or UAB treatments within the 0–60 cm soil layer. The application form of nitrogen fertilizer had a significant impact on the yield of autumn tea, and the yield increasing ability was U3 > UAB > AB. The partial factor productivity of applied nitrogen under the AB treatment was the lowest. The tea yield increase effect of nitrogen fertilizer can be observed only 16–18 days after topdressing through the drip irrigation system. In 2020 and 2021, the yield of autumn tea under the U3 treatment increased by 40.6% and 23.0%, respectively, compared with the CK treatment. It is suggested to apply 105 kg N hm−2 urea as topdressing with drip irrigation for tea gardens in autumn, and this recommendation will provide a theoretical basis for efficient water-saving irrigation and yield increase of the tea garden.

Author Contributions

Experiment, Z.H., B.L. and Y.P.; Calculation, Z. Huang.; Analysis, F.W.; writing—original draft preparation, Z.H., B.L. and Y.P.; writing—review and editing, Z.H. and F.W.; supervision, F.W. and Z.D. All authors have read and agreed to the published version of the manuscript.

Funding

This work was supported by the National Natural Science Foundation Program of China (NO. 51579240), and the Project of the Ministry of Water Resources Special Research Fund for Public Welfare Industries (NO. 201501017).

Data Availability Statement

The data presented in this study are available upon request from the corresponding author.

Acknowledgments

The authors would like to thank the editors and reviewers for their valuable comments on this research.

Conflicts of Interest

The authors declare no conflict of interest.

References

  1. Pang, Y.; Wang, F.A.; Huang, Z.A.; Li, B.B.; Hu, F.C.; Xia, Y.C. Improving yield and quality of autumn tea with drip irrigation under appropriate nitrogen and potassium fertilization. Trans. Chin. Soc. Agric. Eng. 2019, 35, 98–103. [Google Scholar]
  2. Dai, W.; Qi, D.; Yang, T.; Lv, H.; Guo, L.; Zhang, Y.; Zhu, Y.; Peng, Q.; Xie, D.; Tan, J.; et al. Nontargeted analysis using ultra performance liquid chromatography-quadrupole time-of-flight mass spectrometry uncovers the effects of harvest season on the metabolites and taste quality of tea (Camellia sinensis L.). J. Agric. Food Chem. 2015, 63, 9869–9878. [Google Scholar] [CrossRef] [PubMed]
  3. Xiao, Y.; Li, M.; Liu, Y.; Xu, S.; Zhong, K.; Wu, Y.; Gao, H. The effect of Eurotium cristatum (MF800948) fermentation on the quality of autumn green tea. Food Chem. 2021, 358, 129848. [Google Scholar] [CrossRef] [PubMed]
  4. Kaneko, S.; Kumazawa, K.; Masuda, H.; Henze, A.; Hofmann, T. Molecular and sensory studies on the umami taste of Japanese green tea. J. Agric. Food Chem. 2006, 54, 2688–2694. [Google Scholar] [CrossRef]
  5. Ruan, L.; Wei, K.; Wang, L.; Cheng, H.; Wu, L.; Li, H. Characteristics of free amino acids (the quality chemical components of tea) under spatial heterogeneity of different nitrogen forms in tea (Camellia sinensis) plants. Molecules 2019, 24, 415. [Google Scholar] [CrossRef]
  6. Manzoor; Ma, L.; Ni, K.; Ruan, J. Effect of integrated use of rapeseed cake, biochar and chemical fertilizers on root growth, nutrients use efficiency and productivity of tea. Agronomy 2022, 12, 1823. [Google Scholar] [CrossRef]
  7. Wang, Y.; Fu, D.; Pan, L.; Sun, L.; Ding, Z. The coupling effect of water and fertilizer on the growth of tea plants [Camellia sinensis (L.) O. Kuntz]. J. Plant Nutr. 2016, 39, 620–627. [Google Scholar] [CrossRef]
  8. Fan, K.; Zhang, J.; Wang, M.; Qian, W.; Sun, L.; Shen, J.; Ding, Z.; Wang, Y. Development and application of SNP-KASP markers based on genes related to nitrogen uptake, assimilation and allocation in tea plant (Camellia sinensis L.). Agronomy 2022, 12, 2534. [Google Scholar] [CrossRef]
  9. Tang, S.; Liu, Y.; Zheng, N.; Li, Y.; Ma, Q.; Xiao, H.; Zhou, X.; Xu, X.; Jiang, T.; He, P.; et al. Temporal variation in nutrient requirements of tea (Camellia sinensis) in China based on QUEFTS analysis. Sci. Rep. 2020, 10, 1745. [Google Scholar] [CrossRef]
  10. Ruan, L.; Wei, K.; Wang, L.; Cheng, H.; Zhang, F.; Wu, L.; Bai, P.; Zhang, C. Characteristics of NH4+ and NO3 fluxes in tea (Camellia sinensis) roots measured by scanning ion-selective electrode technique. Sci. Rep. 2016, 6, 38370. [Google Scholar] [CrossRef]
  11. Yang, X.; Ni, K.; Shi, Y.; Yi, X.; Zhang, Q.; Fang, L.; Ma, L.; Ruan, J. Effects of long-term nitrogen application on soil acidification and solution chemistry of a tea plantation in China. Agric. Ecosyst. Environ. 2018, 252, 74–82. [Google Scholar] [CrossRef]
  12. Ruan, J.; Gerendás, J.; Härdter, R.; Sattelmacher, B. Effect of nitrogen form and root-zone pH on growth and nitrogen uptake of tea (Camellia sinensis) plants. Ann. Bot. 2007, 99, 301–310. [Google Scholar] [CrossRef] [PubMed]
  13. Boschiero, B.; Mariano, E.; Trivelin, P. “Preferential” ammonium uptake by sugarcane does not increase the 15N recovery of fertilizer sources. Plant Soil 2018, 429, 253–269. [Google Scholar] [CrossRef]
  14. Yamashita, H.; Fukuda, Y.; Yonezawa, S.; Morita, A.; Ikka, T. Tissue ionome response to rhizosphere pH and aluminum in tea plants (Camellia sinensis L.), a species adapted to acidic soils. Plant-Environ. Interact. 2020, 1, 152–164. [Google Scholar] [CrossRef]
  15. Wang, J.; Tu, X.; Zhang, H.; Cui, J.; Ni, K.; Chen, J.; Cheng, Y.; Zhang, J.; Chang, S. Effects of ammonium-based nitrogen addition on soil nitrification and nitrogen gas emissions depend on fertilizer-induced changes in pH in a tea plantation soil. Sci. Total Environ. 2020, 747, 141340. [Google Scholar] [CrossRef] [PubMed]
  16. Claudia, M.; Julia, S.; Rudolf, S. Short-term nitrogen uptake of barley from differently processed biogas digestate in pot experiments. Energies 2019, 12, 696. [Google Scholar]
  17. Sitienei, K.; Kamiri, H.W.; Nduru, G.M.; Kamau, D.M. Nutrient budget and economic assessment of blended fertilizer use in Kenya tea industry. Appl. Environ. Soil Sci. 2018, 2563293. [Google Scholar] [CrossRef]
  18. Qiao, C.; Xu, B.; Han, Y.; Wang, J.; Wang, X.; Liu, L.; Liu, W.; Wan, S.; Tan, H.; Liu, Y.; et al. Synthetic nitrogen fertilizers alter the soil chemistry, production and quality of tea. A meta-analysis. Agron. Sustain. Dev. 2018, 38, 10. [Google Scholar] [CrossRef]
  19. Krzyżaniak, M.; Stolarski, M.; Warmiński, K. Life cycle assessment of giant miscanthus: Production on marginal soil with various fertilisation treatments. Energies 2020, 13, 1931. [Google Scholar] [CrossRef]
  20. Ipinmoroti, R.; Adeoye, G.; Makinde, E. Effects of urea-enriched organic manures on soil fertility, tea seedling growth and pruned yield nutrient uptake in Ibadan, Nigeria. Bulg. J. Agric. Sci. 2008, 14, 592–597. [Google Scholar]
  21. Islam, M.; Yaseen, T.; Traversa, A.; Ben Kheder, M.; Brunetti, G.; Cocozza, C. Effects of the main extraction parameters on chemical and microbial characteristics of compost tea. Waste Manag. 2016, 52, 62–68. [Google Scholar] [CrossRef] [PubMed]
  22. Yu, J.; Lin, S.; Shaaban, M.; Ju, W.; Fang, L. Nitrous oxide emissions from tea garden soil following the addition of urea and rapeseed cake. J. Soil. Sediment. 2020, 20, 3330–3339. [Google Scholar] [CrossRef]
  23. Sui, C.; Guan, X.; Zhang, W.; Zeng, B.; Zhang, Q.; Luo, L.; Hu, L.; Liu, L. Tea plant growth and soil nutrients in response to the application of fertilizer in Guizhou province, China. Agron. J. 2022, 114, 2011–2020. [Google Scholar] [CrossRef]
  24. Li, C.; Li, Y.; Cui, D.; Li, Y.; Zou, G.; Thompson, R.; Wang, J.; Yang, J. Integrated crop-nitrogen management improves tomato yield and root architecture and minimizes soil residual N. Agronomy 2022, 12, 1617. [Google Scholar] [CrossRef]
  25. Yang, K.; Wang, F.; Shock, C.; Kang, S.; Huo, Z.; Song, N.; Ma, D. Potato performance as influenced by the proportion of wetted soil volume and nitrogen under drip irrigation with plastic mulch. Agric. Water Manag. 2017, 179, 260–270. [Google Scholar] [CrossRef]
  26. Sidhu, H.; Jat, M.; Singh, Y.; Sidhu, R.; Gupta, N.; Singh, P.; Singh, P.; Jat, H.S.; Gerard, B. Sub-surface drip fertigation with conservation agriculture in a rice-wheat system: A breakthrough for addressing water and nitrogen use efficiency. Agric. Water Manag. 2019, 216, 273–283. [Google Scholar] [CrossRef]
  27. Chapagain, A.K.; Hoekstra, A.Y. The water footprint of coffee and tea consumption in the Netherlands. Ecol. Econ. 2007, 64, 109–118. [Google Scholar] [CrossRef]
  28. Yi, J.; Li, Y.; Gu, S. Temporal-spatial variations of water requirement for tea plants in Guizhou Province during 1961–2010. Chin. Agric. Sci. Bull. 2015, 31, 167–173. [Google Scholar]
  29. Zheng, S.; Ni, K.; Ji, L.; Zhao, C.; Chai, H.; Yi, X.; He, W.; Ruan, J. Estimation of evapotranspiration and crop coefficient of rain-fed tea plants under a subtropical climate. Agronomy 2021, 11, 2332. [Google Scholar] [CrossRef]
  30. Nie, T.; Chen, P.; Zhang, Z.; Qi, Z.; Lin, Y.; Xu, D. Effects of different types of water and nitrogen fertilizer management on greenhouse gas emissions, yield, and water consumption of paddy fields in cold region of China. Int. J. Environ. Res. Public Health 2019, 16, 1639. [Google Scholar] [CrossRef]
  31. Ye, T.; Ma, J.; Zhang, P.; Shan, S.; Liu, L.; Tang, L.; Cao, W.; Liu, B.; Zhu, Y. Interaction effects of irrigation and nitrogen on the coordination between crop water productivity and nitrogen use efficiency in wheat production on the North China Plain. Agric. Water Manag. 2022, 271, 107787. [Google Scholar] [CrossRef]
  32. Liu, R.; Kang, Y.; Wan, S.; Pei, L. Evaluation of methods of nutrient and water management on tea performance and nutrient loss in the Danjiangkou Reservoir area, China. Arch. Acker Pflanzenbau Bodenkd. 2016, 62, 1123–1135. [Google Scholar] [CrossRef]
  33. Cai, G.; Zhu, Z.; Trevitt, F.; Freney, J.; Simpson, J. Nitrogen loss from ammonium bicarbonate and urea fertilizers applied to flooded rice. Fertil. Res. 1986, 10, 203–215. [Google Scholar] [CrossRef]
  34. Sha, Z.; Ma, X.; Wang, J.; Li, Y.; Xu, W.; Tang, A.; Goulding, K.; Liu, X. Model the relationship of NH3 emission with attributing factors from rice fields in China: Ammonia mitigation potential using a urease inhibitor. Atmosphere 2022, 13, 1750. [Google Scholar] [CrossRef]
  35. Zhu, X. Cause and prevention of tea freezing injury. Agric. Henan 2015, 11, 12–13. (In Chinese) [Google Scholar]
  36. Chun, J.; Jeong, I.; Choi, H. A simple method for testing freezing resistance based on chlorophyll fluorescence in tea. Korean J. Crop Sci. 2000, 45, 322–327. [Google Scholar]
  37. Long, L.; Shi, Y.; Ma, L.; Ruan, J. Characterization of young shoot population, yield, and nitrogen demands of tea (Camellia sinensis L.) harvested under different standards. Horticulturae 2022, 8, 275. [Google Scholar] [CrossRef]
  38. Ma, L.; Yang, X.; Shi, Y.; Yi, X.; Ji, L.; Cheng, Y.; Ni, K.; Ruan, J. Response of tea yield, quality and soil bacterial characteristics to long-term nitrogen fertilization in an eleven-year field experiment. Appl. Soil Ecol. 2021, 166, 103976. [Google Scholar] [CrossRef]
  39. Kumar, R.R.; Marimuthu, S.; Manivel, L. Fertilizer nitrogen recovery in tea as influenced by nitrogen levels. Commun. Soil Sci. Plan Anal. 1999, 30, 1747–1758. [Google Scholar] [CrossRef]
  40. Chen, P.; Lin, S.; Liu, C.; Su, Y.; Cheng, H.; Shiau, J.; Chen, I. Correlation between nitrogen application to tea flushes and quality of green and black teas. Sci. Hortic. 2015, 181, 102–107. [Google Scholar] [CrossRef]
  41. Wakamatsu, M.; Yamanouchi, H.; Sahara, H.; Iwanaga, T.; Kuroda, R.; Yamamoto, A.; Minami, Y.; Sekijima, M.; Yamada, K.; Kajiya, K. Catechin and caffeine contents in green tea at different harvest periods and their metabolism in miniature swine. Food Sci. Nutr. 2019, 7, 2769–2778. [Google Scholar] [CrossRef] [PubMed]
  42. Wang, M.; Yang, J.; Li, J.; Zhou, X.; Xiao, Y.; Liao, Y.; Tang, J.; Dong, F.; Zeng, L. Effects of temperature and light on quality-related metabolites in tea [Camellia sinensis (L.) Kuntze] leaves. Food Res. Int. 2022, 161, 111882. [Google Scholar] [CrossRef] [PubMed]
  43. Kang, S.; Zhang, Q.; Li, Z.; Yin, C.; Feng, N.; Shi, Y. Determination of the quality of tea from different picking periods: An adaptive pooling attention mechanism coupled with an electronic nose. Postharvest Biol. Technol. 2023, 197, 112214. [Google Scholar] [CrossRef]
  44. Xiang, P.; Wilson, I.; Huang, J.; Zhu, Q.; Tan, M.; Lu, J.; Liu, J.; Gao, S.; Zheng, S.; Lin, D.; et al. Co-regulation of catechins biosynthesis responses to temperature changes by shoot growth and catechin related gene expression in tea plants (Camellia sinensis L.). J. Hortic. Sci. Biotechnol. 2021, 96, 228–238. [Google Scholar] [CrossRef]
  45. Sun, P.; Zhang, Z.; Zhu, Q.; Zhang, G.; Xiang, P.; Lin, Y.; Lai, Z.; Lin, J. Identification of miRNAs and target genes regulating catechin biosynthesis in tea (Camellia sinensis). J. Integr. Agric. 2018, 17, 1154–1164. [Google Scholar] [CrossRef]
  46. Wijeratne, M.; Anandacoomaraswamy, A.; Amarathunga, M.; Ratnasiri, J.; Basnayake, B.; Kalra, N. Assessment of impact of climate change on productivity of tea (Camellia sinensis L.) plantations in Sri Lanka. J. Natl. Sci. Found. Sri Lanka 2007, 35, 119–126. [Google Scholar] [CrossRef]
  47. Peng, Z.; Yin, M.; Shen, M.; Sun, C.; Wang, B. A comparison of butterfly species and functional diversity among three land use types of forest tea garden and vegetable garden. Environ. Monit. 2022, 14, 11–18+30. [Google Scholar]
  48. Gao, Z.; Hu, G.; Wang, H.; Bi, F.; Wang, J. Residue monitoring and pollution characteristics of pyrethroid pesticides in tea-planted and agricultural soils in Jiangsu Province. Environ. Monit. 2021, 13, 42–46. [Google Scholar]
Figure 1. Comparison of temperature and precipitation in September 2020 and 2021.
Agronomy 13 01303 g001
Figure 2. Distribution of drip irrigation belts between two tea ridges.
Agronomy 13 01303 g002
Figure 3. Change in soil moisture content within 60 cm soil layer in September 2020 and 2021.
Agronomy 13 01303 g003
Figure 4. Evapotranspiration of tea trees in September 2020 and 2021.
Agronomy 13 01303 g004
Figure 5. Soil ammonium and nitrate nitrogen content in the 0–60 cm soil layer in September 2020.
Agronomy 13 01303 g005
Figure 6. Soil ammonium and nitrate nitrogen content in the 0–60 cm soil layer in September 2021.
Agronomy 13 01303 g006
Figure 7. Tea yield of autumn tea in 2020 and 2021. The vertical bars represent standard deviations (n = 3). The different capital letters represent the significant differences (p < 0.05) in the yield of the second batch of autumn tea, and the different lowercase letters represent the significant differences (p < 0.05) in the yield of the third batch of tea under the U3 treatment. The sign “ns” indicates that there is no significant difference in the series data (p > 0.05).
Agronomy 13 01303 g007
Figure 8. Partial factor productivity of applied nitrogen in fertilized treatments. The vertical bars represent standard deviations (n = 3). The sign “ns” indicates that there is no significant difference in the series data (p > 0.05).
Agronomy 13 01303 g008
Figure 9. Comparison among N application forms on 20 September 2020, regarding free amino acid and tea polyphenol content of tea. Different letters represent significant differences at p < 0.05. A comparison of free amino acid and tea polyphenol content of tea in the U3 treatment with those of the CK treatments at three picking stages of autumn tea in 2021. The different lowercase letters represent the significant differences (p < 0.05) in the quality of each batch of tea under the CK treatment, and the different capital letters represent the significant differences (p < 0.05) in the quality of each batch of tea under the U3 treatment. The vertical bars represent standard deviations (n = 3).
Agronomy 13 01303 g009
Table 1. Treatments design.
Treatment Fertilization MethodAutumn Nitrogen Amount/(kg·hm−2)
U1Urea45
U2Urea75
U3Urea105
ABAmmonium bicarbonate105
UABUrea + Ammonium bicarbonate105
CKno0
Disclaimer/Publisher’s Note: The statements, opinions and data contained in all publications are solely those of the individual author(s) and contributor(s) and not of MDPI and/or the editor(s). MDPI and/or the editor(s) disclaim responsibility for any injury to people or property resulting from any ideas, methods, instructions or products referred to in the content.