Article

Development of Lycium barbarum–Forage Intercropping Patterns

1
State Key Laboratory of Efficient Production of Forest Resources, Yinchuan 750002, China
2
Institute of Wolfberry Science, Ningxia Academy of Agriculture and Forestry Sciences, Yinchuan 750002, China
3
Center of Agriculture Science and Technology Development, Yinchuan 750002, China
4
College of Geographical Sciences and Planning, Ningxia University, Yinchuan 750021, China
5
China-Arab Joint International Research Laboratory for Featured Resources and Environmental Governance in Arid Regions, Yinchuan 750021, China
6
College of Life Science and Technology, Ningxia Vocational and Technical University, Yinchuan 750021, China
*
Author to whom correspondence should be addressed.
These authors contributed equally to this work.
Agronomy 2023, 13(5), 1365; https://doi.org/10.3390/agronomy13051365
Submission received: 23 March 2023 / Revised: 8 May 2023 / Accepted: 9 May 2023 / Published: 12 May 2023
(This article belongs to the Special Issue Effects of Tillage, Cover Crop and Crop Rotation on Soil)

Abstract

:
The intercropping patterns of protected cultivations have been widely used to increase productivity and sustainability in modern agriculture. However, there have been few studies of wolfberry intercropping cultivated by clean tillage. We introduced 10 forages into wolfberry cultivation through land productivity and an interspecific competitiveness analysis, and we screened out the appropriate intercropping modes to provide a scientific basis for wolfberry green cultivation and pasture production. The results showed that the wolfberry–forage intercropping land equivalent ratio (LER) of greenhouse and field tests increased from 29% to 59% and from 62% to 170%, respectively, when compared with the monoculture weighted mean, showing significant yield advantages (p < 0.05), particularly in wolfberry–mangold, wolfberry–ryegrass, wolfberry–alfalfa, and wolfberry–clover. The aggressivity of interspecific competitiveness analysis showed that the forage introduction did not affect the dominant competitive position of wolfberry. In addition, wolfberry–forage intercropping could promote the monetary advantage index (MAI). Wolfberry–mangold, wolfberry–ryegrass, and wolfberry–alfalfa performed well, with MAI values of 827.63, 994.18, and 1918.57 for fruit and 2106.54, 1706.27, and 3103.13 for biomass, respectively. Finally, wolfberry–mangold, wolfberry–ryegrass, and wolfberry–alfalfa were screened out, which can form a new mode of wolfberry and forage production.

1. Introduction

Wolfberry (L. barbarum) is centered along the Yellow River valley of northwestern China [1] and particularly in the Ningxia Hui Autonomous Region, where wolfberry output, quality, and industrialized level are richly endowed by nature [2]. Clean tillage, the traditional way of cultivation, leaves three meters exposed between rows; this exposed area comprises nearly 90% of the total land resource waste [3]. This traditional farming and agricultural production mode has seriously threatened the productivity and stability of the agricultural ecosystem [4]. In addition, with the urbanization and the improvement in people’s living standards, the dietary structure of residents has changed from grain consumption to animal food consumption, which has further promoted the rapid development of animal husbandry, increased the demand gap for forage, and formed a new food crisis [5,6]. Therefore, an approach to L. barbarum production that uses land and resources more efficiently, possesses a low risk to yields, and is environmentally friendly is needed urgently [7].
Forest grass intercropping can organically combine trees and grass in the same area of land in terms of temporal and spatial distribution, effectively alleviate land contention for agriculture and forestry, and promote the increase in and income from agriculture, forestry, animal husbandry, and sideline industries [8]. It has been widely used for fruit trees, such as apple [9], pear [10], and peach [11], and the types of grass in the intercropping of forest and grass are mostly leguminous plants [12,13], gramineae plants [3,14], or natural grass [15], which are used between the rows as mulch. This has been popularized for a long time and has developed mature forage production patterns [16].
In Europe and America, forest and grass intercropping began earlier, and the selection and application of forest and grass intercropping have been studied extensively. Forest and grass intercropping in Europe focuses mainly on the utilization of above-ground resources of forest and grass as well as the differences in time and space. Through setting different forest and grass plant allocation modes, the optimal allocation mode is screened to ultimately achieve the stability and efficiency of forest tree and forage production [16]. The intercropping mode of forest and grass in America is mostly that of combined agriculture, forest, and animal husbandry. Research focuses mainly on the intercropping species relationship, allelopathy, and the influence of shading on the growth of forage [17]. The “courtyard intercropping” model of India, Thailand, and other countries is a classic case of intercropping of forest and grass. This model utilizes farmers as units to carry out production practice and can be carried out widely nationwide, playing an important role in the development and application of the international intercropping model of forest and grass [18]. The intercropping of forest and grass in China is used mainly to protect the growth of grassland with strong regional characteristics, primarily concentrated in desertification, semi-desertification, and the intercropping of forest and grass [19]. At present, research into the basic theory of the intercropping mode of forest and grass is still being developed and, thus, needs to be explored further.
The intercropping system usually has a higher biological yield, so selecting suitable varieties to form the intercropping system is a feasible planting method to effectively alleviate the supply crisis of animal feed [20]. Zhu [3] found that in areas with equal emphasis on agriculture and animal husbandry, intercropping can significantly improve the utilization rate of land resources, which is important to help guarantee the efficient and sustainable development of agriculture and animal husbandry. Wolfberry production and animal husbandry are the industries with the most local advantages and characteristics in Ningxia [21,22,23]. At present, the total planting area of Lycium barbarum in the entire region is up to 23.33 thousand hectares, and the clearing tillage method has been adopted for many years [22]. Therefore, on the basis of the effective utilization of land resources, the 3 m row spacing of Lycium barbarum can provide sufficient planting conditions and development space for pasture production. Therefore, in this study, the current situation of forage planting and the effective and full utilization of land by intercropping were comprehensively considered. The intercropping of Lycium barbarum and 10 types of forage resources in the Ningxia Region was carried out, and the land productivity, interspecific competitiveness, and production benefits were studied in order to obtain higher economic benefits and guide agricultural production. At the same time, it provides the basis for the study of the interspecific interaction effect of the subsequent intercropping dominance.

2. Materials and Methods

2.1. Plants and Experimental Site Description

The new line 401 L. barbarum plants used in this study were selected at Ningxia Academy of Agriculture and Forestry Sciences, Institute of Wolfberry Science. The 10 types of grasses, seeds of leguminous, gramineous, and Chenopodiaceae plants were bought from Ningxia Yuan sheng Lv yang Forest and Grass Ecological Engineering Co., Ltd. (Yinchuan, China). A total of 21 treatments (10 types of wolfberry–forage intercropping, 1 wolfberry monocropping, and 10 forage monocroppings) for field and greenhouse experiments were assigned in Zhongning and Yinchuan, respectively. The field experiments were conducted from April 2019 to October 2021 at the Zhongqi Group Chinese Wolfberry Production Base (37°48′ N, 105°67′ E) at Zhongning in the region of central Ningxia, and the greenhouse experiment was conducted from October 2019 to April 2021 at the garden farm of Ningxia Academy of Agriculture and Forestry Sciences (38°20′ N, 106°16′ E) at Yinchuan in the north of Ningxia, which is located in northwestern China (Figure 1). To ensure the same soil conditions in the field and the greenhouse experiments, the soil for the greenhouse experiment was taken from a depth of 0–20 cm from the field experiment site. The experimental site possesses a temperate continental climate. In this region, the summer is hot and dry (daily maximum temperatures can reach 39.0 °C in July), whereas the winter and early spring are always cold and dry (daily minimum temperatures can reach −17.0 °C in January). The average annual rainfall at the experimental site was 202.1 mm, where 61% of the total rainfall occurred in the summer (June–August). On average, the total annual evaporation at this site is 2387 mm, and the evaporation is approximately 12 times that of precipitation. Agriculture in this region is dependent on natural precipitation and drip irrigation [3].

2.2. Experimental Design: Wolfberry–Forage Plant Interactions

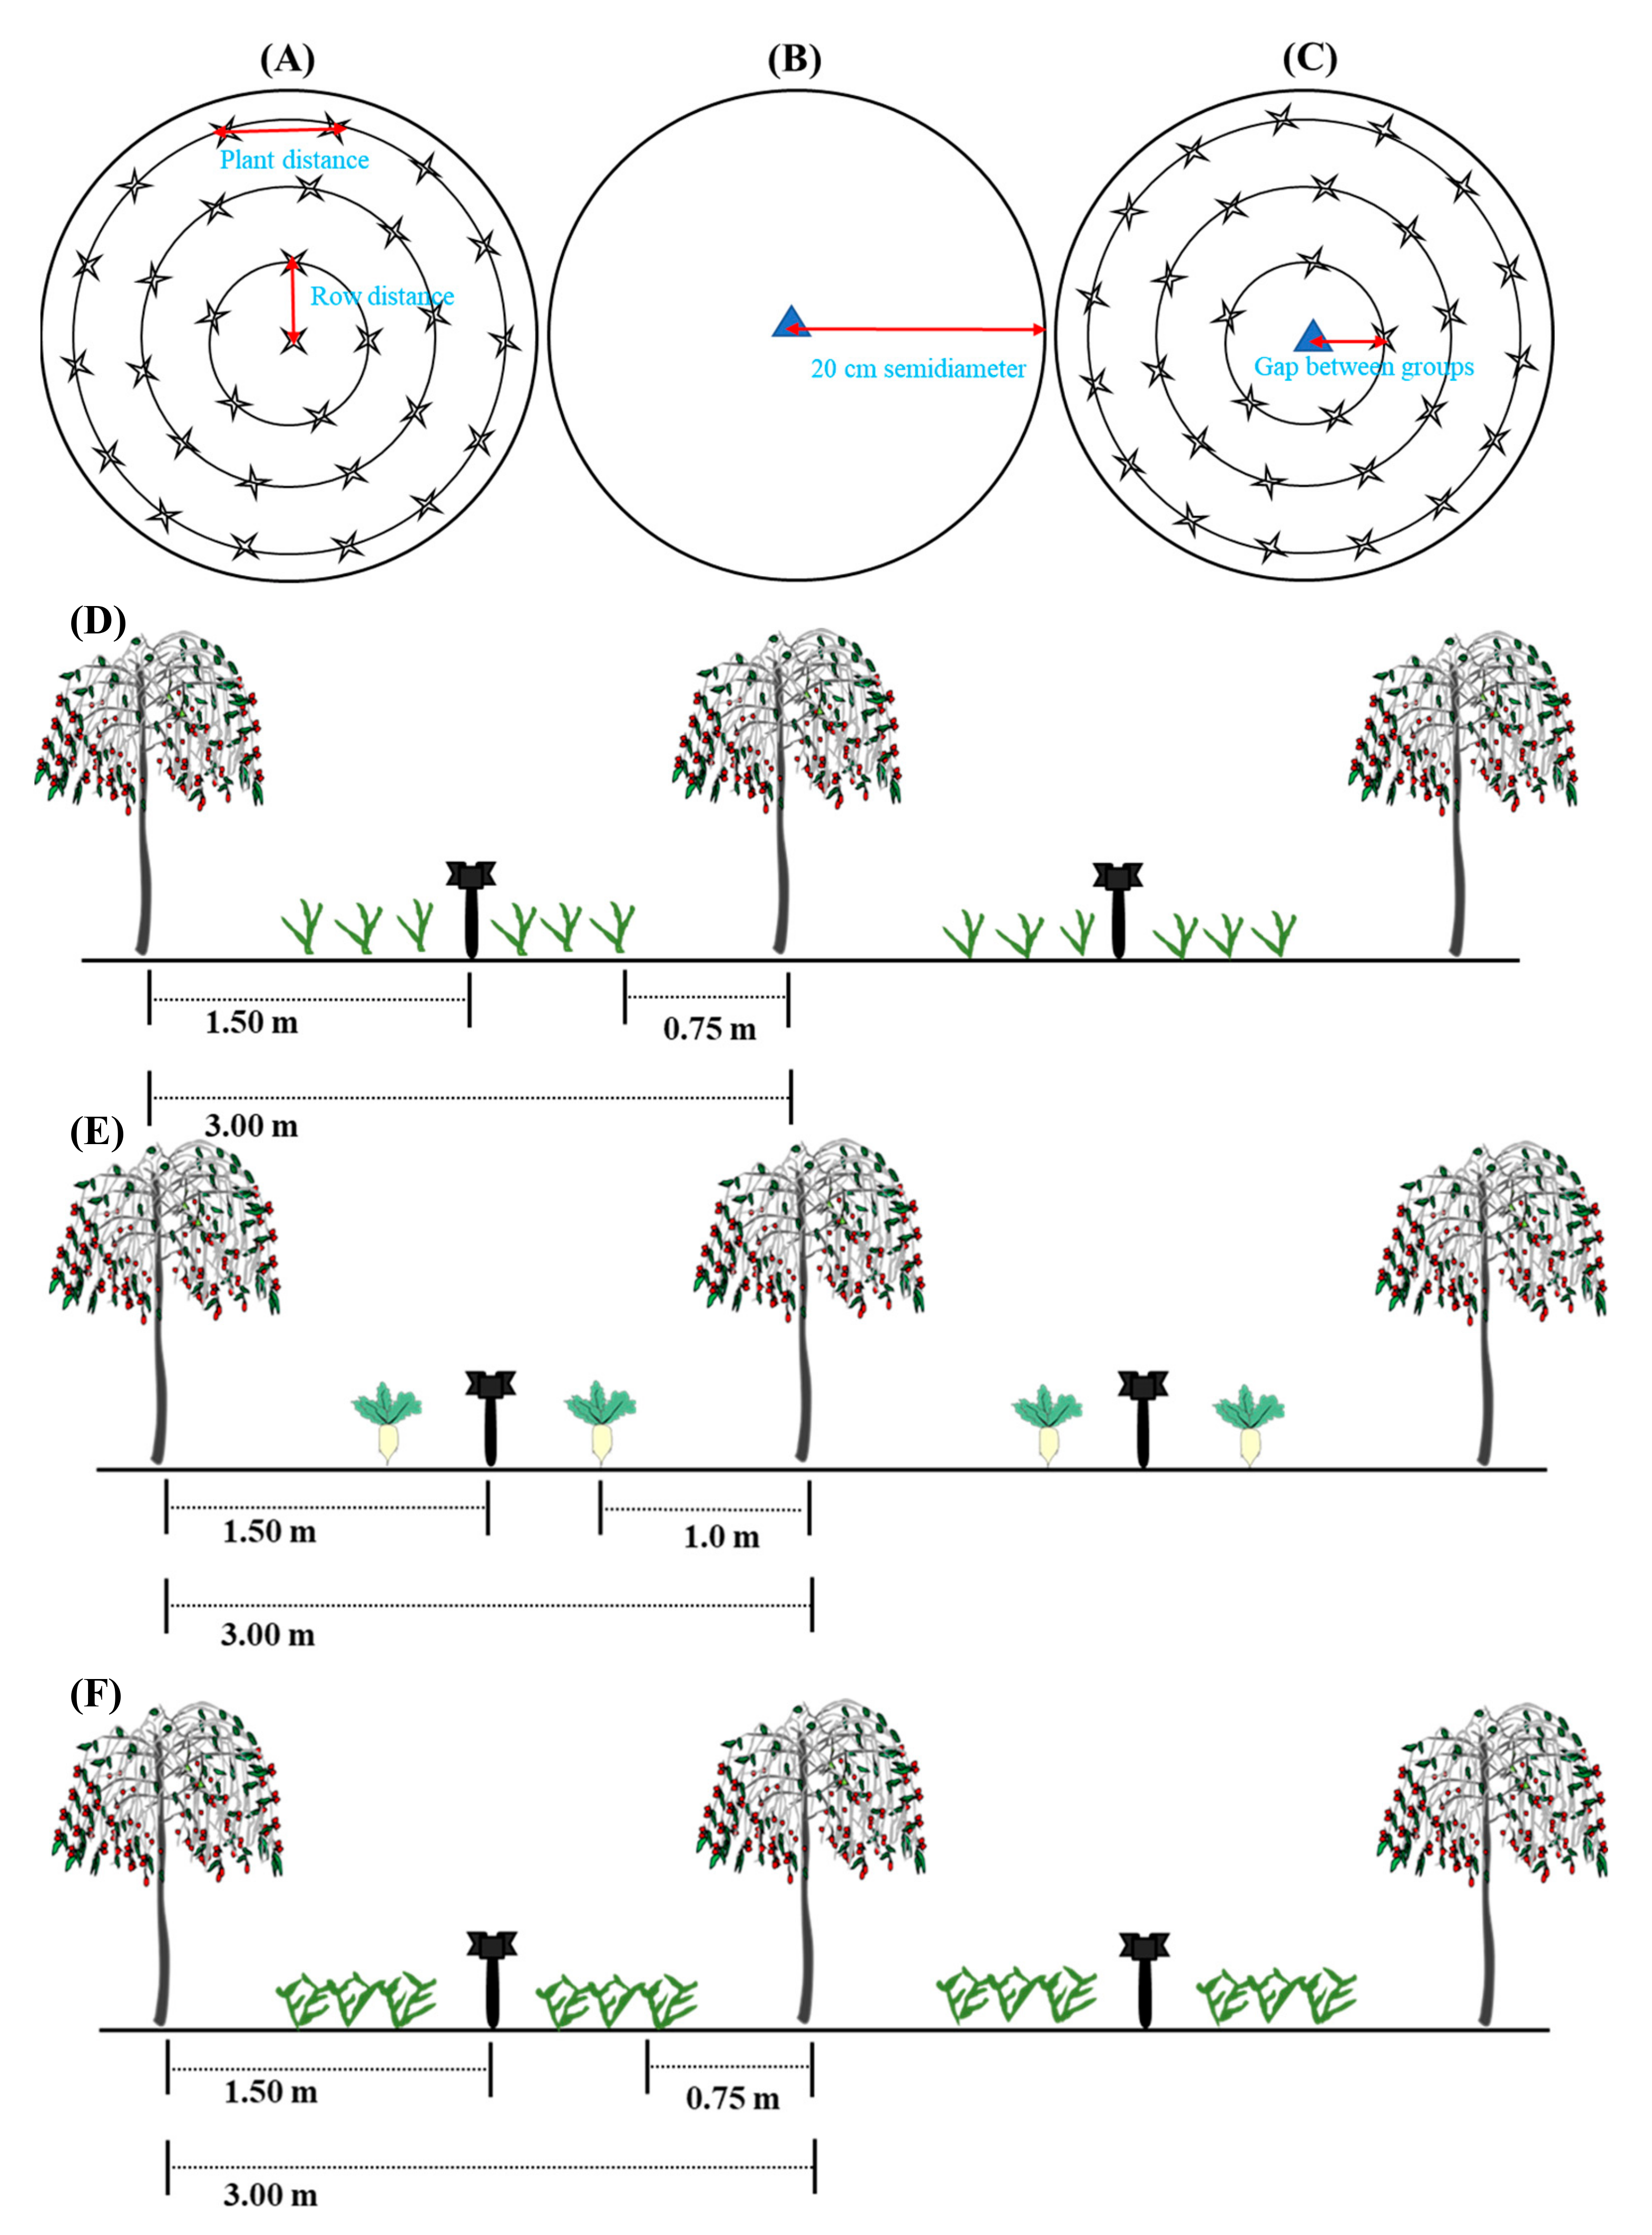
2.2.1. Experimental Design and Management

The greenhouse experiment was carried out in plastic root control devices (40 cm diameter × 40 cm height) filled with soil from the field experimental site, and each treatment was conducted in a completely randomized design with six replicates, for a total of 220 devices. The L. barbarum trees of the field experiment were planted in 2016, with 1 m plant spacing and 3 m row spacing; each treatment was replicated three times, and each replicate contained 3 rows, with 80 trees in each row. The three cultivation system treatments were: L. barbarum monoculture, forage monoculture, and L. barbarum–forage intercropping of L. barbarum rows with a cover crop of ryegrass, oats, sweet sorghum, Kudouzi, Lvyuan 5, Stipas, wheatgrass, white clover, mangold, and alfalfa between rows. Intercropping types can be divided into three categories, which are wolfberry–leguminous, wolfberry–gramineous, and wolfberry–chenopodiaceae. The monoculture and intercropping schematic diagrams of the field and greenhouse can be seen in Figure 2. For every treatment, weeds in the inter-rows were controlled monthly by farmers and mechanical machinery. The specific arrangements of planting patterns in different years and test sites are shown in Table 1 and Table 2. The experimental design was identical to a previous study [3], except the field seed-sowing was kept 1.0 m away from the wolfberry trees (Figure 2D–F, Table 3).

2.2.2. Experimental Sample Collection

The greenhouse was not limited by the growing season. The experimental materials were sown in early September of 2019, and the pasture materials were mowed at the same time as the field experiment. The cutting frequency of ryegrass, Lvyuan 5, alfalfa, white clover, Stipas, wheatgrass, Kudouzi, mangold, sweet sorghum, and oats were 6, 6, 7, 5, 4, 6, 1, 2, 2, and 3 stubbles each year, respectively. After the last harvest, mangold, sweet sorghum, and oats could be sown and ploughed.
In the field experiment, ryegrass, Lvyuan 5, alfalfa, white clover, and wheatgrass were all sown in autumn (10 September 2018); oats, Stipas, sweet sorghum, Kudouzi, and mangold were sown during 10–20 March in 2019, 2020, and 2021. Ryegrass, Lvyuan 5, wheatgrass, alfalfa, white clover, oats, Stipas, sweet sorghum, Kudouzi, and mangold had cutting frequencies of 4, 4, 4, 5, 3, 2, 2, 1, 1, and 1 stubbles each year, respectively. Ryegrass, Lvyuan 5, wheatgrass, and Stipas were in the booting stage, alfalfa and white clover were in the budding stage, oats were in the heading stage, mangold was in the late tuber growth stage, sweet sorghum was in the milk-ripening stage, and Kudouzi was in the drum stage of their harvest cycles. In addition to mangold, which was sown by hole sowing, some other forages were seeded in strips by a small seeder.

2.3. Relative Index Measurements of Wolfberry and Forage

2.3.1. Determination of Above-Ground Biomass and Yield of Forage

Each forage material in the field was sampled at 5 points; the entire plant of mangold was chosen from a 1 m sample section, and fresh samples were weighed at each point. From the other 9 forage grasses, samples of 1 square meter with 5 cm stubble were cut randomly then placed in the drying room for drying. The total biological yield (fresh weight) of forage was calculated according to the mowing periods and times. The greenhouse test measured the yield of the entire root controller, and the remainder was sampled in the same way as in the field.

2.3.2. Determination of Added Biomass and Yield of Wolfberry

Six wolfberry trees were randomly selected under monocropping and intercropping treatments in the field, then the number of new branches were counted, the length and weight were measured, and the leaf area was scanned to determine size. The wolfberry yield was recorded from the first batch of fresh fruits to the end of autumn fruits, then the yield per plant and per unit area was counted. In addition, 20 wolfberry fruits were randomly selected from each treatment, and the weight of a single fruit from the field test was recorded. All the measurements were used to calculate the added biomass (fresh weight) of L. barbarum and the LER of the different wolfberry–forage intercroppings. A ruler was used to measure the length of the new branches, and an LA-S plant image analyzer was used to measure the leaf area of L. barbarum.

2.4. Evaluation of Wolfberry–Forage Intercropping Patterns

2.4.1. Contribution of Wolfberry and Forage to Productivity Advantage

The land equivalent ratio (LER) is defined as the relative area of land under isolated planting conditions. This was used to measure the productivity of each cultivation system, and the methods were the same as in a previous study [3], where LER = (Ytc/Yt) + (Yct/Yc). Here, Ytc = L. barbarum yield in the intercropping system, Yt = the productivity of L. barbarum in the monoculture, Yct = the yield of herbage of Gramineous plants in the intercropping system, and Yc = the yield of herbage of Gramineous plants in the monoculture. Monocropping weighting is an expression of measuring land productivity, and it is usually used to compare the intercropping productivity. The weighted mean = Yt × Ot + Yc × Oc, where Ot = the proportion of area occupied by L. barbarum in the intercropping, and Oc = the proportion of area occupied by Gramineous plants in the intercropping. If LER > 1, there is a productive advantage, and if LER ≤ 1, there is no productive advantage.

2.4.2. Interspecific Competitiveness Evaluation of Wolfberry–Forage Intercropping

Aggressivity refers to the ability of one plant to compete with another plant for water, nutrients, and other related resources under the intercropping mode. Afw = Yfi/(Yfm×Zf) − Ywi/(Ywm × Zw), where Afw = the competitiveness of forage grass compared with wolfberry, Yfi = the fresh grass yield of forage in the total area of the intercropping, Yfm = the fresh grass yield of the monoculture forage, Ywi = the productivity of L. barbarum in the intercropping, Ywm = the proportion of area occupied by L. barbarum in the intercropping, Zf = the proportion of area occupied by forage in the intercropping, and Zw = the proportion of area occupied by L. barbarum in the intercropping.
Relative crowding coefficient (K)
Wit [24] introduced the relative crowding coefficient (K) into the theory of plant competition, which can be used to assess the magnitude of interspecific competitiveness within an intercropping system. On the basis of the yield index, the K value is used to measure the dominance of the intercropping and the dominance of various components in the intercropping population in intercropping studies. Kf = Yfi × Zw/{(Yfm − Yfi) × Zf}, Kw = Ywi × Zf/{(Ywm − Ywi) × Zw}, where Kf = the relative crowding coefficients of the forage system, Kw = the relative crowding coefficients of the wolfberry system (the one with the higher value indicates that it has stronger competitiveness), Yfi = the fresh forage grass yield in the intercropping system, Yfm = the fresh forage grass yield in the monoculture, Ywi = the annual production of wolfberry in the intercropping system, Ywm = the annual production of wolfberry in the monoculture, Zw = the proportion of area occupied by wolfberry in the intercropping, and Zf = the proportion of area occupied by forage in the intercropping.
The competition ratio (CR), which can be used to evaluate the competitiveness of different species in an intercropping system, was introduced into plant competition theory by Willey and Rao [25]. Considering that CR takes into account the proportion of intercropping patterns, it is more aligned with the actual production than is LER, and it is more comprehensive than the encroachment and relative crowding coefficient, so it can be a good measurement of interspecific competitiveness. CRfw = (PLERf/PLERw) × (Zw/Zf), where CRfw = the competitiveness of forage relative to wolfberry. If CRfw > 1, it shows that the competitive ability of forage was stronger than that of wolfberry, and if CRfw ≤ 1, it shows that the competitive ability of forage was weaker than that of wolfberry. PLERf = the partial land equivalent ratio of forage, PLERw = the partial land equivalent ratio of wolfberry, Zw = the proportion of area occupied by wolfberry in the intercropping, and Zf = the proportion of area occupied by forage in the intercropping.
The currency advantage index is an economic benefit index under the intercropping mode, and its formula is as follows: MAI = (Yfi × Zf + Ywi × Zw) × (1 − 1/LER), where Yfi = the fresh forage grass yield in the intercropping system, Ywi = the annual production of wolfberry in the intercropping system, Zw = the proportion of area occupied by wolfberry in the intercropping, and Zf = the proportion of area occupied by forage in the intercropping.

2.5. Statistical Analyses

Microsoft Excel 2007 was used for data analysis and graph generation, and SPSS software (Version 17.0, SPSS Inc., Chicago, IL, USA) was used for statistical analysis. Data were examined for homogeneity and normality of variances by the Levene and Shapiro–Wilk tests, respectively. The data set was analyzed by one-way ANOVA, and the group means were compared using Tukey’s test at p < 0.05. The difference between the means was determined using the least significant difference (LSD) test (p < 0.05). One-way ANOVA and the group means of dates were compared using Tukey’s test (p < 0.05). The difference between the means was determined using the least significant difference (LSD) test (p < 0.05), where differences were indicated by different letters. The “corr.test” function in Corrplot v0.1.0 calculated the Spearman correlations among component parameters and plotted the correlations.

3. Results and Analyses

3.1. Growth and Biological Yield Advantage of Intercropping Patterns

All intercropping patterns in the greenhouse experiment were based on the yield index of wolfberry. Because there was no production of wolfberry in the first year of the greenhouse experiments, only the branch number, branch length, leaf area of wolfberry, and above-ground forage biomass of 10 forage species were used to calculate the intercropping LER in the greenhouse experiments. The mean values of LER based on the wolfberry branch number, branch length and the leaf area were 1.25 ± 0.02, 1.35 ± 0.10, and 1.59 ± 0.09, respectively, showing a significant advantage in intercropping productivity (t-test, p < 0.001) (Figure 3).
One field experimental site was located at Zhongning, where a 4-year-old wolfberry plant with yield basis was used to calculate the LER with the biological yield of 10 forage species, respectively. The other field experimental site was located at Yinchuan, where there was an annual cutting of seedlings but no production of wolfberry cuttings during the first year; thus, only branch number, branch length, leaf area of wolfberry, and above-ground forage biomass of 10 forage species were used to calculate the intercropping LER. The mean values of LER based on wolfberry branch number, branch length, leaf area, single fruit weight, and the wolfberry yield were 2.70 ± 0.03, 1.62 ± 0.10, 1.70 ± 0.01, 2.08 ± 0.01, and 1.77 ± 0.01, respectively, showing a significant advantage in intercropping productivity (t-test, p < 0.001) (Figure 4).

3.2. Yield and Intercropping Advantage of Different Intercropping Patterns

3.2.1. Yield and Intercropping Advantage of Different Intercropping Patterns in Greenhouse

The LER of the greenhouse wolfberry–forage intercropping model based on the above-ground biomass was 0.62~2.14. The 10 forages can be divided into gramineae, leguminous, and Chenopodioideae. The results of comparative analysis showed that the LERs of different forage intercroppings with wolfberry had significant differences (p < 0.05). As a concrete manifestation, the LERs of wolfberry intercultivated with gramineae and legumes were greater than 1, and the growth rate was approximately 10%, although the growth trend was not obvious.
When Chenopodioideae was intercultivated with lycium barbarum, the LER increased significantly, with a growth rate greater than 90%. However, the LER increased significantly when wolfberry was intercultivated with Chenopodioideae, with a growth rate greater than 90%. Further analysis of LER based on the above-ground biomass found that there were also differences among plants in the same family and genus. In the intercropping mode of wolfberry–Gramineae, the LERs of ryegrass and stipa were significantly increased; wolfberry–ryegrass was the most significant intercropping mode, which increased the land yield by more than 65%. For the wolfberry intercropping with wheatgrass, the LER was significantly reduced, with a yield reduction of approximately 22%, and the LER of wolfberry–sweet sorghum showed no significant change. However, during this experiment, with the influence of the ecological niche, it was found that the tall sweet sorghum plants seriously affected the formation of the canopy structure, which was unfavorable for the production management and acquisition of economic benefits in later periods, so it was deemed not to be a good intercropping material. In the intercropping mode of wolfberry–legumes, the LER based on wolfberry added biomass, and the yields of alfalfa and white clover were significantly increased, by 40% and 19%, respectively. The productivity of the wolfberry–Kudouzi intercropping pattern decreased significantly, with the yield decreasing approximately 21%. In the intercropping of wolfberry–chenopodioideae, the LER of wolfberry–mangold reached 2.14 and was shown to have the most significant combination of productivity advantages (Table 4).

3.2.2. Yield and Intercropping Advantage of Different Intercropping Patterns in the Field

In the field trial, the LERs of the intercropping pattern based on the biological yield of the above-ground part of the forage grasses and the new biomass of wolfberry ranged from 0.63 to 1.96 (p < 0.05; Table 5). The LERs of the intercropping pattern based on the biological yield of the above-ground part of the forage and the fruit yield of wolfberry ranged from 0.95 to 1.84 when wolfberry was intercropped with 10 forage materials. Overall, the intercropping pattern had significantly higher land use efficiency than the monoculture (p < 0.05; Table 6).
The comparison of monocropping weighted averages and intercropping yields based on the biological yield of the above-ground portion of Graminaceae forage with the added biomass of wolfberry showed that the added biomass of the above-ground portion of the intercropping pattern was significantly higher than the monocropping weighted average (p < 0.05), except for wheatgrass and sweet sorghum, which were significantly lower, by 37% and 25%, respectively. Among them, intercropping ryegrass, Stipas, and Lvyuan 5 increased the yield by 98%, 42%, and 29%, respectively, showing a significant yield increase (p < 0.05). The LER based on the new biomass of wolfberry increased by 87%, 28%, and 21%, respectively; intercropping oats increased the yield by 13%, but the difference was not significant. All the results are shown in Table 5. The comparison of the monocropping weighted averages and the intercropping yields based on the biological yield of the above-ground portion of Graminaceae forage with the yield of wolfberry showed that the added biomass of the above-ground portion of the intercropping pattern was significantly higher than the monocropping weighted average (p < 0.05), except for wheatgrass and sweet sorghum, which were significantly lower by 18% and 37%. In addition, intercropping ryegrass, Lvyuan 5, oats, and Stipas increased the yields up to 74%, 48%, 31%, and 18%, respectively. Moreover, the LER increases based on the fruit yield of wolfberry were 80%, 51%, 43%, and 28%, respectively, showing significant yield increases (p < 0.05), as reported in Table 6.
For the comparison of the monocropping weighted averages and intercropping yields based on the biological yield of the above-ground parts of Leguminous forage grasses and the new biomass of wolfberry, it was found that, except for the 12% yield reduction of Kudouzi, which was not significant (p > 0.05), the new biomass of above-ground parts of the wolfberry–alfalfa and wolfberry–white clover intercropping patterns were significantly higher than the monocropping weighted average, with the highest yield increases of 63% and 44% for the intercropped alfalfa and white clover, respectively. In addition, their LER yield increases were 59% and 24%, respectively, based on the new biomass level of wolfberry, which showed significant yield increases (p < 0.05). Results are reported in Table 5. The yield comparison between wolfberry and legume forage based on the biological yield of the above-ground part of the forage and wolfberry yield showed that the yield decrease was not significant (p > 0.05) in the wolfberry–white clover intercropping pattern, and the yield of wolfberry was significantly higher than that of the monocropping weighted average. The wolfberry yield in monocropping had no significant difference from that of the wolfberry–white clover intercropping pattern, and the wolfberry–alfalfa pattern increased the yield of wolfberry by 68%. However, the wolfberry yield was significantly decreased by 42% (p < 0.05) for the wolfberry–Kudouzi pattern. In addition, the LER based on the fruit yield level of wolfberry increased the yield to 63% and 31%, respectively, showing significant yield increases (p < 0.05), as reported in Table 6.
From the comparison of the monocropping weighted averages and the intercropping yields based on both wolfberry increased biomass and wolfberry yield with the biological yield of the above-ground parts of Chenopodioideae forage, we found that the intercropping pattern of wolfberry–mangold could increase the yield by 73.29%, which had a significant advantage over the wolfberry–gramineae and wolfberry–leguminous intercropping patterns. In addition, the LER based on the new biomass and fruit yield level of wolfberry increased the yield by 84% and 80%, respectively, a significant yield increase.

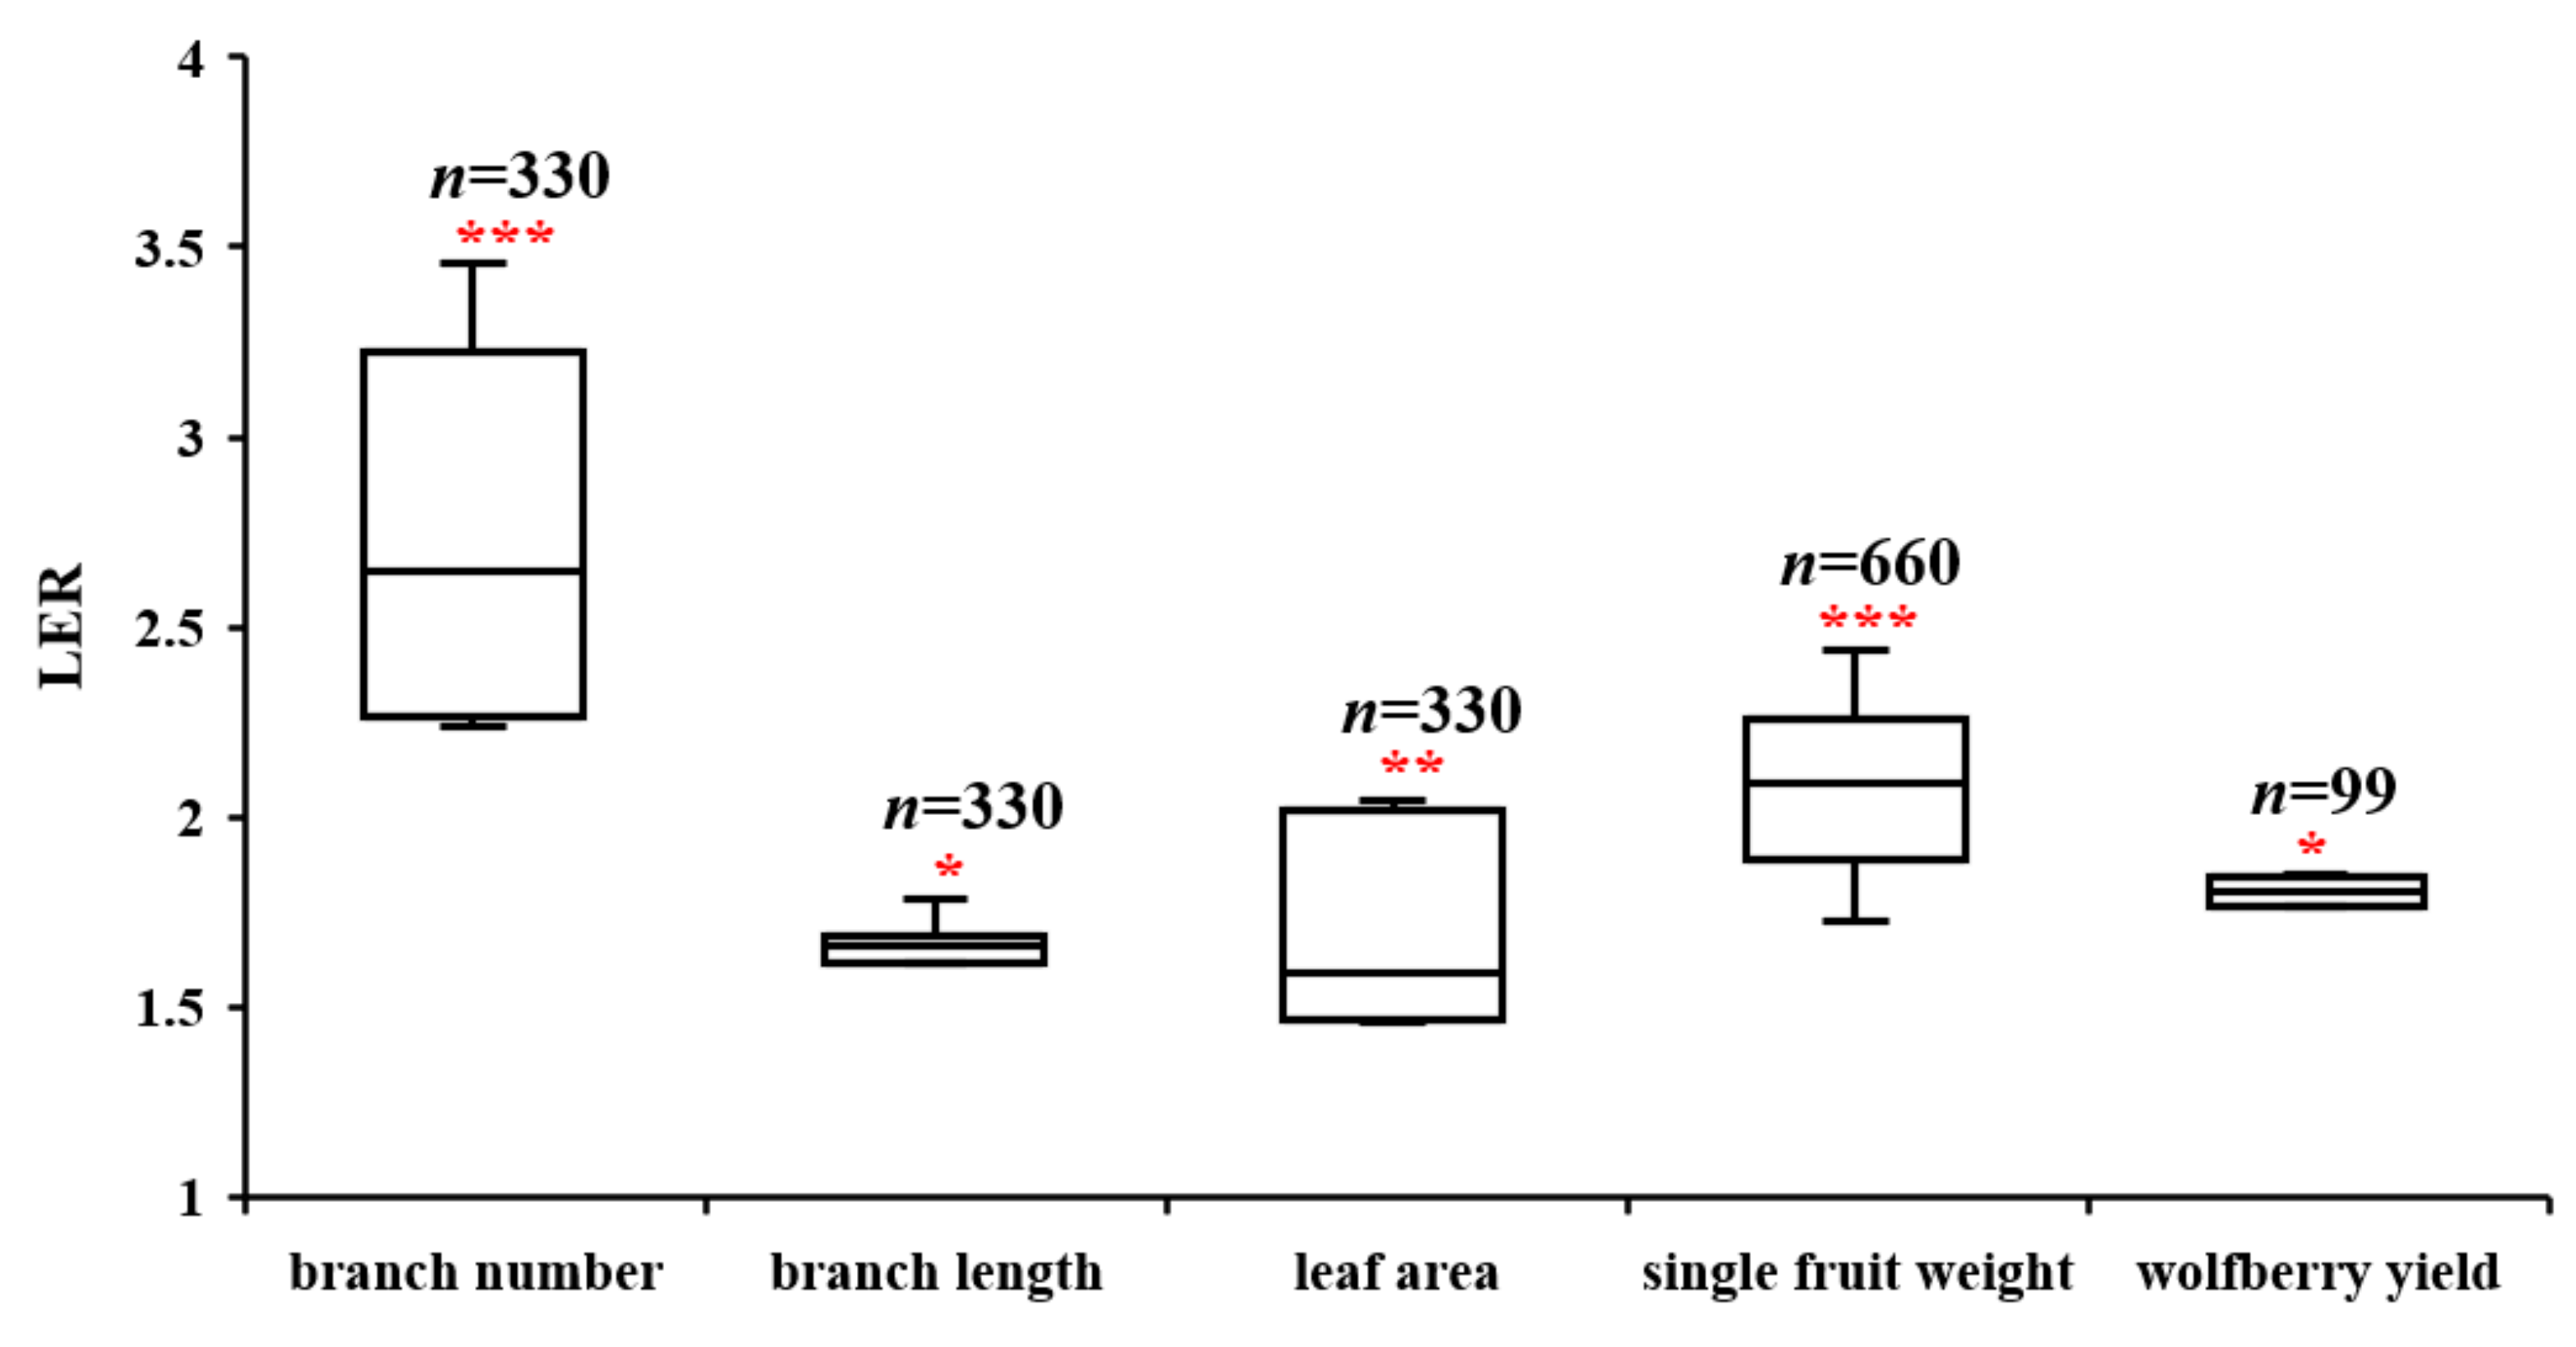
3.2.3. Evaluation of Interspecific Competitiveness

On the basis of the evaluation of competitiveness of the fruit yield of wolfberry and the 3-year experiment, the results of which are shown in Table 7, the Afw of the 10 wolfberry–forage patterns were all less than 0, indicating that the introduction of these 10 forages did not affect the dominant competitive position of wolfberry. In addition, on the basis of the competitiveness evaluation of the newly increased biomass of wolfberry, the competitive advantage of Lvyuan 5 increased by 12% after the introduction of the intercropping system. Therefore, we speculate that the intercropping system of wolfberry–Lvyuan 5 could significantly promote the increase in the yield of Lvyuan 5. The crowding coefficient of the ten types of forage ranged from 0.27 to 5.69. As a concrete manifestation, the crowding coefficient of wolfberry based on the fruit yield ranged from 2.82 to 186.72, and the crowding coefficients of the forages were always smaller than that of wolfberry, which further indicated that wolfberry had stronger competitiveness. The crowding coefficient based on the increased biomass of wolfberry ranged from −31.1 to 39.61. The crowding coefficients of Lvyuan 5, ryegrass, and alfalfa were lower than that of wolfberry, which indicates that these three forages had obvious competition potential in the intercropping patterns. In addition, the competitive ratios of the 10 intercropping patterns varied from the fruit yield and biomass of wolfberry. The CRfw values based on fruit yield of wolfberry were all less than 1. When compared with the test value 1 (p < 0.001), it was found that although the competitive advantages of the 10 forage grasses were lower than that of wolfberry, we found that alfalfa, mangold, ryegrass, and Lvyuan 5 also showed obvious competitive advantages in the wolfberry–forage intercropping system.
Furthermore, the monetary advantage index under the different intercropping patterns was analyzed, and the production efficiency of this cropping pattern was evaluated. According to the average value of the currency dominance index of 3 years, the three intercropping combinations of wolfberry–mangold, wolfberry–alfalfa, and wolfberry–ryegrass were remarkable; based on the wolfberry fruit yield, the monetary advantage indexes were 1918.57, 994.18, and 827.63, respectively. More importantly, these three materials that are based on the new biomass of wolfberry also had the best performance, and the MAIs of wolfberry–mangold, wolfberry–alfalfa, and wolfberry–ryegrass were 3103.13, 2106.54, and 1706.27, respectively.

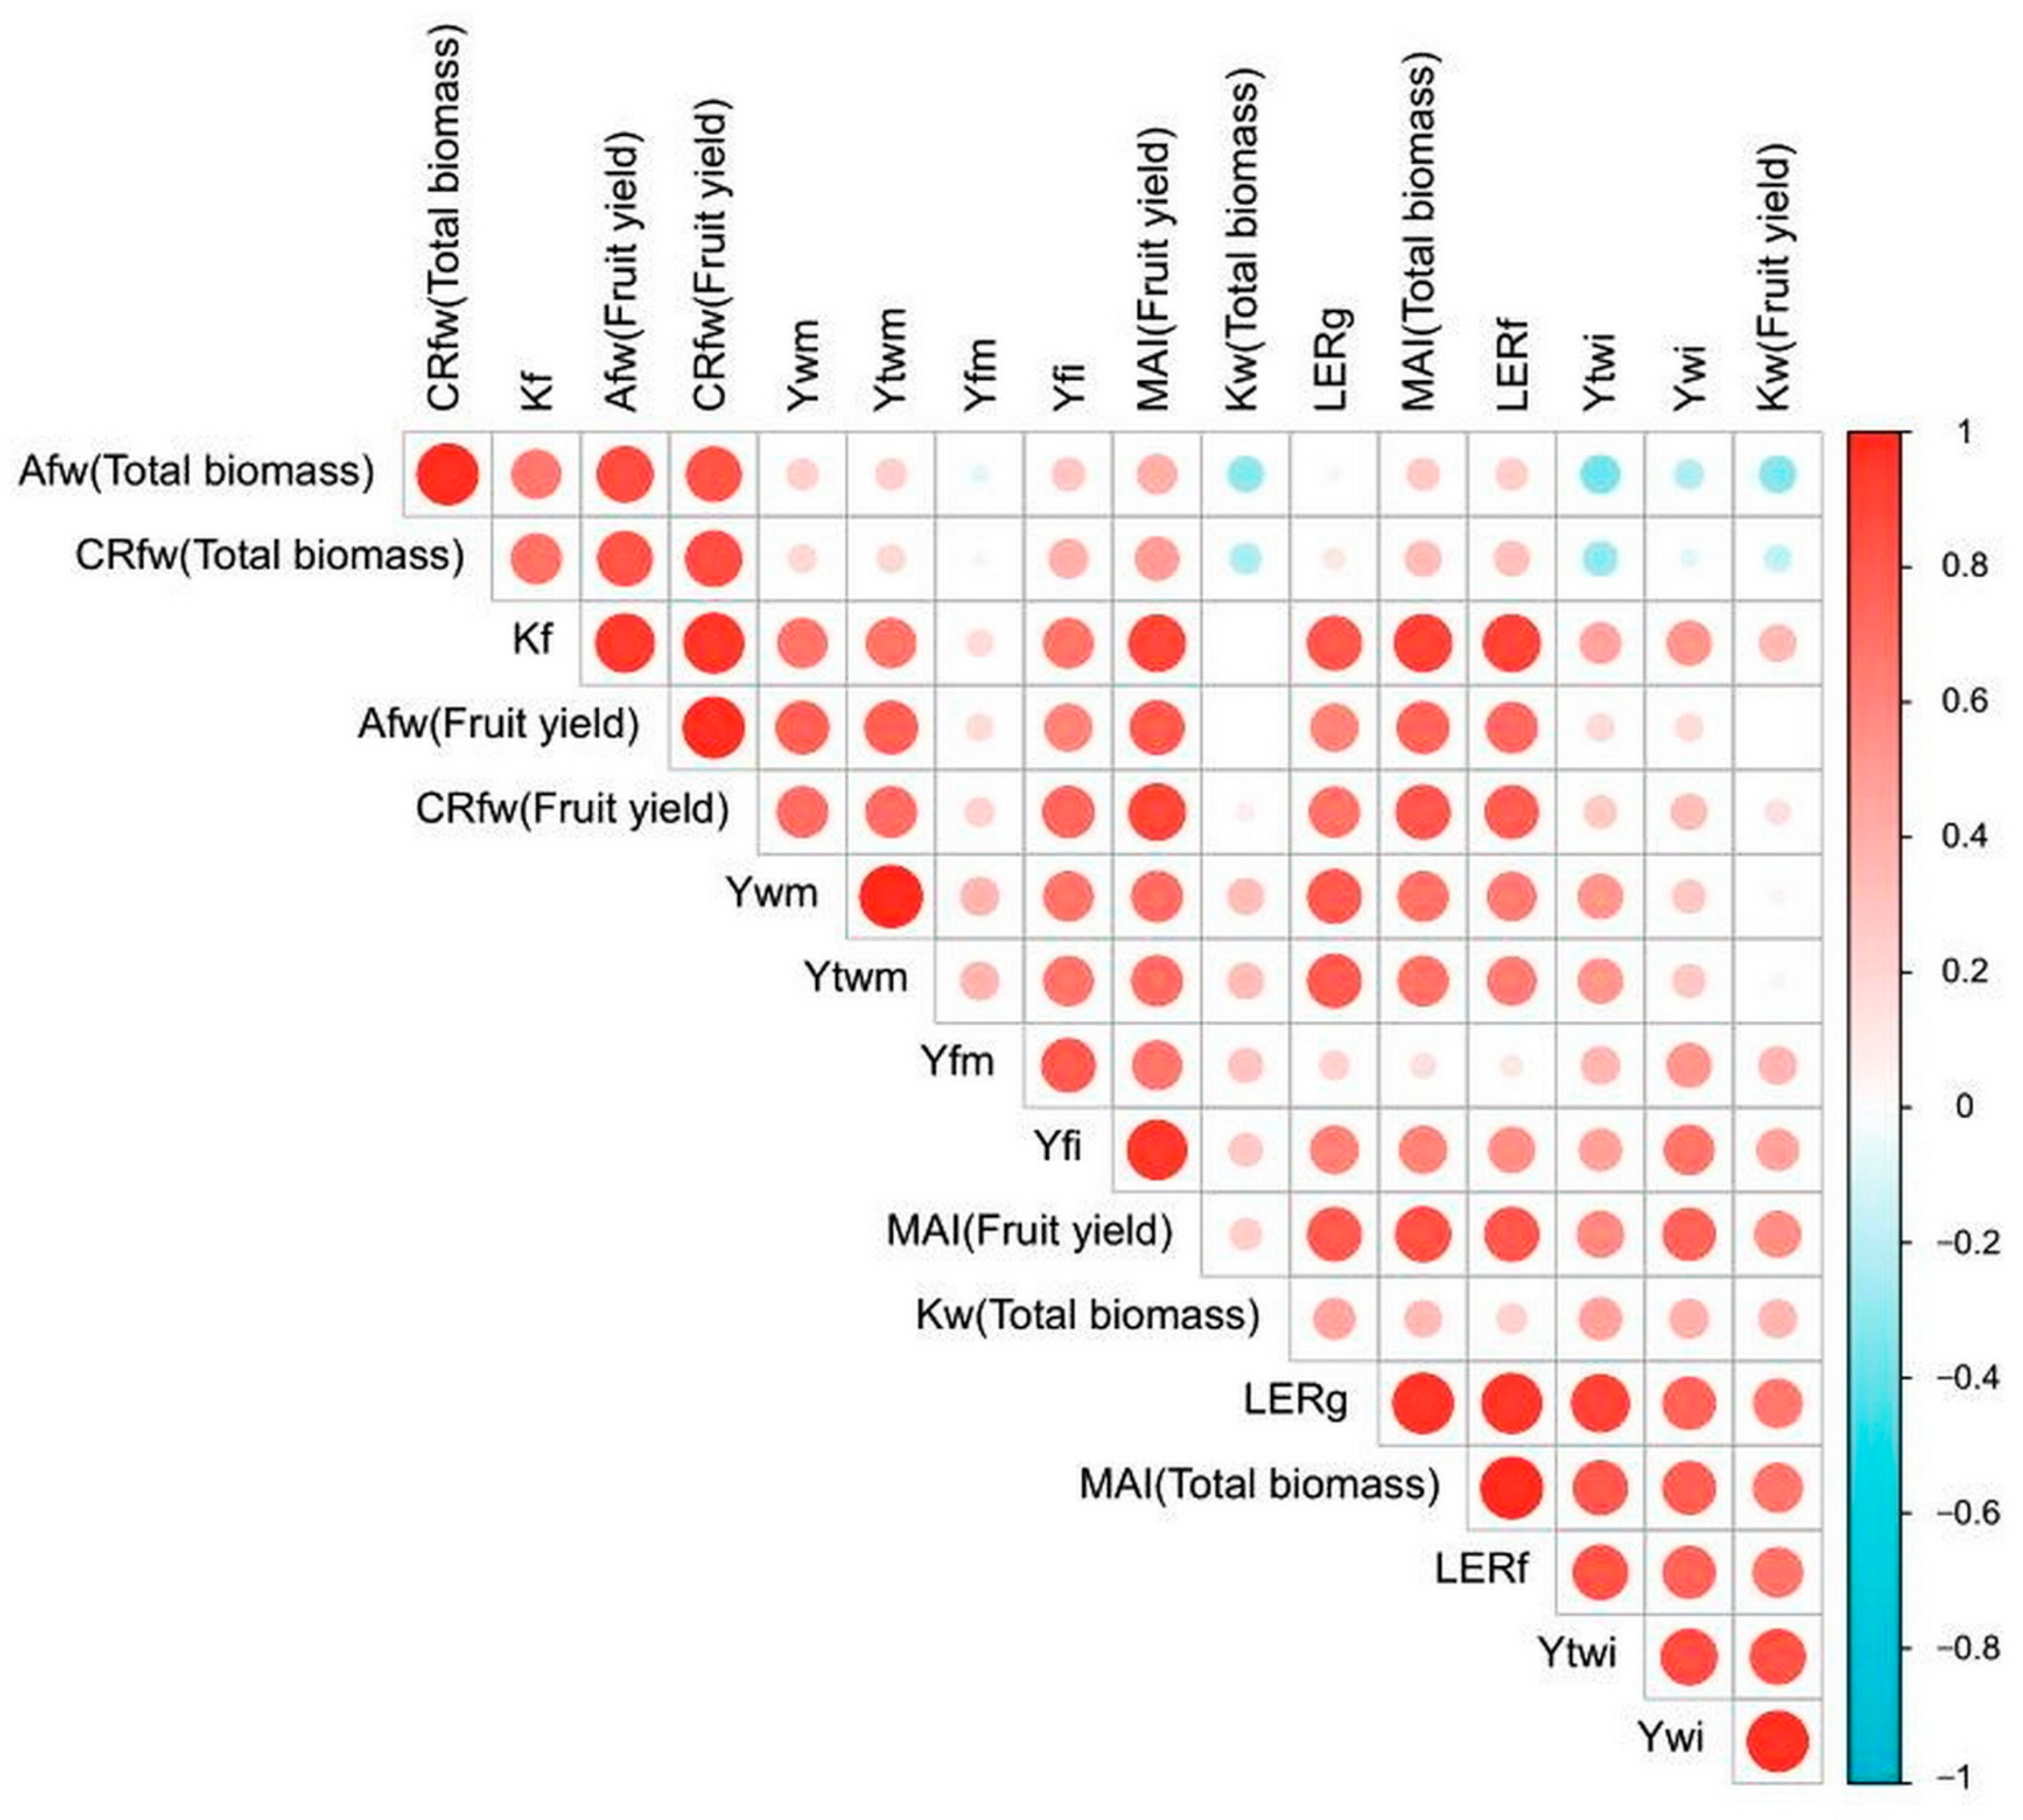
3.2.4. Descriptive and Correlational Analyses of Growth and Yield Factors

According to the correlation analysis (Figure 5), the correlation between land equivalent ratio and various intercropping factors are as follows: LERf was markedly positively correlated with LERg, MAI (total biomass), Ywi, and Ytwi (p < 0.01) and was positively correlated with Kw (fruit yield) and MAI (fruit yield) (p < 0.05). There was a positive correlation for the intercropping yield between forage and wolfberry (p < 0.05); the correlation coefficient between Yfi and Ywi was 0.64, and the correlation coefficient between Yfi and total Ytwi was 0.46. The yield of forage intercropping Yfi was positively correlated with Kf (0.64), Afw (0.58), CRfw (fruit yield) (0.69), Afw (total biomass), and CRfw (total biomass) (p < 0.05), which further indicated that intercropping could promote an increase in productivity. Moreover, Ywi had remarkable positive correlations with LERf, LERg, and MAI (total biomass) (p < 0.01) and was positively related to Yfi and Kf (p < 0.05).
Afw (total biomass) was markedly positively correlated with CRfw (total biomass) (0.96), Afw (fruit yield) (0.81), and CRfw (fruit yield) (0.77) in the competitiveness of the intercropping patterns (p < 0.01). Afw (fruit yield) was remarkably positively correlated with CRfw (fruit yield) (0.96), MAI (fruit yield) (0.74), MAI (total biomass) (0.7), Ywm (0.72), and Ytwm (0.72) (p < 0.01). CRfw (fruit yield) was remarkably positively correlated with MAI (fruit yield), MAI (total biomass), and LERf (p < 0.01) and was positively correlated with Yfi, Ywm, Ytwm, and LERg (p < 0.05). Kf was remarkably positively correlated with Afw (fruit yield) (0.89), CRfw (fruit yield) (0.93), MAI (fruit yield), MAI (total biomass), LERf, and LERg (p < 0.01) and was positively correlated with Yfi, Ywi, and Ytwi (p < 0.05). Kw (total biomass) was remarkably positively correlated with Kf, MAI (fruit yield), Ywm, and Ytwm (p < 0.01) and was positively correlated with Yfi, Afw (fruit yield), and CRfw (fruit yield) (p < 0.05). Kw (fruit yield) was remarkably positively correlated with Ywi and Ytwi (p < 0.01) and was positively correlated with LERf, LERg, MAI (fruit yield), and MAI (total biomass) (p < 0.05). MAI (fruit yield) was remarkably positively correlated with LERg, MAI (total biomass), LERf, and Ywi (p < 0.01) and was positively correlated with Ytwi and Kw (fruit yield) (p < 0.05). MAI (total biomass) was remarkably positively correlated with LERf, LERg, Ywi, Ytwi, CRfw (fruit yield), MAI (fruit yield), and Kf (p < 0.01). It was positively correlated with Kw (fruit yield), Yfi, Ywm, Ytwm, and Afw (fruit yield) (p < 0.05).

4. Discussion

The greenhouse intercropping pattern in this study showed an overall significant intercropping productivity advantage on the basis of the mean values of LERs calculated for the biological yields of the 10 forages and the growth of wolfberry, which ranged from 1.25 to 1.59 (t-test, p < 0.001; Figure 3). The mean values of the LERs calculated for the field intercropping model based on the biological yields of the 10 forages and the growth, fruit weight per fruit, and yield of wolfberry ranged from 1.62 to 2.70, with an overall result of highly significant intercropping productivity advantages (t-test, p < 0.001; Figure 4). The results showed that the 10 forage grasses showed an overall significant productivity advantage with the wolfberry intercropping, which is in line with Cardinale [26], who studied 44 grassland ecophytes and analyzed the system productivity and biodiversity, finding that 79% of the high-diversity communities had 1.7 times more biomass than single-species communities. In addition, researchers conducting European gram–legume intercropping trials found that the intercropping increased the total productivity [27], which is consistent with the findings of this study. In addition, an integrated analysis of the yield advantage under published intercropping patterns by Yu [28] found that the mean LER values of all intercropping patterns was 1.22, and 81% of them had LER values greater than 1, indicating that the majority of the intercropping patterns had higher land use efficiency than did monocropping. This is generally consistent with the results of our study.

4.1. Yield Differences under Different Wolfberry–Forage Intercropping Patterns

Intercropping patterns, as typical representatives of interspecific interactions, can effectively utilize nutrients, light, and water resources and improve plant yields, and they are widely used in many countries [29]. Our 3-year field and greenhouse trials showed that the yields and LERs were varied under the different intercropping combinations. We divided the 10 forage grasses into three categories by family, i.e., Gramineae, Leguminosae, and Chenopodioideae, and found that the yield growth rates of both Gramineae and Leguminosae were 10% when intercropped with wolfberry, but the difference was not significant compared with the monocropping; the yield growth rate of Chenopodioideae was greater than 90%, which shows significant advantages. Further analysis of the yield changes in intercropping individual forages with wolfberry revealed that not all the intercropping combinations had yield advantages, and only six of the ten intercropping combinations could significantly contribute to the yield increases, with the most significant yield increases occurring when intercropped with mangold, ryegrass, and alfalfa. This finding is consistent with those of Lan [30], who found that not all intercropping combinations have yield advantages and to obtain intercropping advantages, the selection and combination of the intercropping plant species is very important in obtaining an intercropping advantage. This result is also consistent with a previous study which found that rational intercropping can promote plant growth [31].
In anthropogenic agricultural production systems [32] and semi-natural grassland ecosystems [33,34], an increase in plant diversity has been shown to enhance the ecosystem function, especially in terms of productivity gains. Another study found that the richer the plant species in the community, the more it was able to reduce the adverse effects of harmful microorganisms in the soil on plant growth and to have a significant effect on increasing ecosystem productivity [35]. Studies have also reported that intercropping can reduce competition among individuals, reduce light loss, create a favorable environment for the growth and development of individual plants, and fully utilize resources, thus increasing the overall plant productivity [36]. Our experimental design used forages with different canopy structures matched with different growth periods and different depths of root systems, thus exploiting the spatial and temporal differences in plant resources and maximizing agricultural productivity. Comparisons of LERs based on the wolfberry growth rate, yield, and forage biomass showed that the intercropping systems produced greater LERs than did the monocropping systems. Intercropping increased the branches of wolfberry and produced a significant increase in the yields in the field trials, which is consistent with previous studies [35,37]. Gram–legume intercropping is commonly used in European countries, and the majority of experimental studies found that intercropping maximizes the total productivity [27], which is consistent with our findings.

4.2. Competitiveness Differences under Different Wolfberry–Forage Intercropping Patterns

Plants in intercropping systems have competitive relationships, and the growth of intercropping plants is inhibited when the competitive ability of one plant for resources, nutrients, etc., is greater than that of another plant. Aggressivity (A), relative crowding coefficient (K), and competitive ratio (CR), as important measures of interspecific competition, are effective in evaluating the intensity and overall effect of interspecific competition in the intercropping systems [38]. We studied the competitiveness of intercropping systems constructed from 10 forage grasses and wolfberry and found that there were significant differences among the different intercropping combinations. In the evaluation of the competitiveness based on the fruit yield of wolfberry, we found that the Afw values of all 10 intercropping forages on wolfberry were less than 0, and the Kf values were always less than Kw based on fruit yield, indicating that the competitiveness of all 10 forages was less than that of wolfberry; therefore, the introduction of the forages did not affect the dominant competitive position of wolfberry for an agroecosystem dominated by wolfberry, which is consistent with the results of other researchers in orchard forage studies, where fruit trees were found to be more competitive than forage [39,40,41]. In addition, the values of A differed significantly at the different family levels, and the overall performance of forage competitiveness in terms of both the fruit yield and overall biomass was in the order of mangold, Gramineae, and Leguminosae forages, which is in line with the findings of Fang Lin [42,43] in that Gramineae forages have more competitiveness than Leguminosae forages. In addition, CR is considered to be a better indicator of intercropping competitiveness in interspecific relationships [44,45], and it was found that CRfw was positively correlated with A and K, further validating the above findings that Chenopodioideae > Gramineae > Leguminosae in terms of competitive performance. Although the competitive advantage of all 10 forage grasses was lower than that of wolfberry, we found that alfalfa, mangold, ryegrass, and Lvyuan 5 also had significant competitive advantages in the intercropping system and were important factors in determining the overall productivity of the wolfberry–forage intercropping.

4.3. Production Efficiency Differences under Different Wolfberry–Forage Intercropping Patterns

The purpose of the intercropping is to promote the maximum ecological and economic benefits per unit area of land [46,47,48]. Intercropping can improve the overall productivity and economic benefits of agroecosystems by reducing the competition among individuals, reducing loss of light, creating a favorable environment for the growth and development of individual plants, and fully utilizing resources [49]. Moreover, intercropping has advantages, such as high productivity, high efficiency, resistance to being overwhelmed, and high resource utilization, which provide better ecological, social, and economic benefits compared with monocropping [50,51]. The introduction of the monetary advantage index (MAI) can describe the existence of the intercropping advantage in terms of economic efficiency [52,53]. From an analysis of the MAIs in different intercropping patterns, the best performing materials were found to be mangold, ryegrass, alfalfa, Lvyuan 5, and white clover, in that order. Moreover, the changes in MAI of these five forages involved in the intercropping were consistent with the changes in LER, with the wolfberry–mangold combination having the highest MAI (3103.13, 1918.57) as well as the highest LER (1.84, 1.80). From the correlation analysis, it was found that other competitiveness indicators showed the same trend, which is consistent with the results of previous studies [54]. Among the intercropping combinations considered in this study, wolfberry–mangold, wolfberry–ryegrass, wolfberry–alfalfa, wolfberry–Lvyuan 5, and wolfberry–white clover showed good LERf, LERg, CRfw, and MAI values under the intercropping pattern, which indicated that the best productivity was achieved in wolfberry–mangold, followed by wolfberry–ryegrass, wolfberry–alfalfa, wolfberry–Lvyuan 5, and wolfberry–white clover, in that order.

5. Conclusions

The development of wolfberry–forage intercropping patterns can increase the supply of forage production while satisfying wolfberry production, which not only increases land productivity, environmental utilization, and significantly improves land production efficiency but also alleviates the current demand for forage that is needed for the development of the breeding industry. At the same time, with the transformation and application of research results, a new pattern of wolfberry planting and forage production will be formed, which has important practical significance for the development of the wolfberry industry and animal husbandry in the Ningxia Region. The main conclusions are as follows: The analysis of wolfberry–forage intercropping patterns based on productivity, interspecific competitiveness, and production efficiency found that the mean values of LERs for greenhouse and field intercropping patterns ranged from 1.25 to 1.59 and 1.62 to 2.70, respectively, showing a significant yield advantage; the interspecific competitiveness of all 10 wolfberry–forage intercropping patterns was smaller than that of the wolfberry monocropping, indicating that the introduction of forage grass did not affect the dominant competitive position of wolfberry. Eight of the ten intercropping patterns had higher MAIs than did monocropping, among which the MAIs of wolfberry–mangold, wolfberry–ryegrass, and wolfberry–alfalfa intercropping patterns showed better performance. The MAIs based on fruit were 827.63, 994.18, and 1918.57, and the MAIs based on biomass were 2106.54, 1706.27, and 3103.13 respectively. Our findings highlight the importance of plant–plant interactions and the value of the plant–soil feedback framework in understanding potentially positive relationships between plant diversity and multiple functions in terrestrial ecosystems. We ultimately screened five significantly superior wolfberry–forage intercropping combinations, which were wolfberry–mangold, wolfberry–ryegrass, wolfberry–alfalfa, wolfberry–Lvyuan 5, and wolfberry–white clover patterns.

Author Contributions

L.Z. and J.H. conceived and designed the study; X.L. (Xiaoying Li) and L.Z. performed the experiments and collected all data; Y.C. and J.H. designed the full experiment; K.Q. provided laboratory facilities for analysis of plant growth; F.W., Y.Z. and X.L. (Xiaojie Liang) contributed reagents/materials/tools; X.Z., X.N. and Y.L. revised the manuscript and provided help with the trials. All authors have read and agreed to the published version of the manuscript.

Funding

This research was funded by the Natural Science Foundation of Ningxia (2022AAC03420, 2022AAC03024), Ningxia Academy of Agriculture and Forestry Sciences “14th Five-Year” agricultural high-quality development and ecological protection science and technology innovation demonstration project (NGSB-2021-2-03), the Key R&D Program of Ningxia Hui Autonomous Region (2021BEF02004), the National Natural Science Foundation of China (Grant No. 42067022), and the Scientific Research Project of Ningxia Higher Education Institutions (NYG2022172).

Data Availability Statement

The datasets supporting the results presented in this manuscript are included within the article.

Conflicts of Interest

The authors declare no conflict of interest.

References

  1. Amagase, H.; Farnsworth, N.R. A review of botanical characteristics, phytochemistry, clinical relevance in efficasscy and safety of Lycium barbarum fruit (Goji). Food Res. Int. 2011, 44, 1702–1717. [Google Scholar] [CrossRef]
  2. Wen, S.P.; Wang, C.; Zhang, Z.H. Lycium Barbarum Industry Dvevlopment and Technological Innovation Trends in the Whole Industry Chain in Ningxia. Agric. Outlook 2018, 14, 53–58+64. [Google Scholar]
  3. Zhu, L.; He, J.; Tian, Y.; Li, X.; Li, Y.; Wang, F.; Qin, K.; Wang, J. Intercropping Wolfberry with Gramineae plants improves productivity and soil quality. Sci. Hortic. 2022, 292, 110632. [Google Scholar] [CrossRef]
  4. Rajib, M.A.; Ahiablame, L.; Paul, M. Modeling the effects of future land use change on water quality under multiple scenarios: A case study of low-input agriculture with hay/pasture production. Sustain. Water Qual. Ecol. 2016, 8, 50–66. [Google Scholar] [CrossRef]
  5. Carberry, P.S.; Liang, W.L.; Twomlow, S.; Holzworth, D.P.; Dimes, J.P.; Mcclelland, T.; Huth, N.I.; Chen, F.; Hochman, Z.; Keating, B.A. Scope for improved eco-efficiency varies among diverse cropping systems. Proc. Natl. Acad. Sci. USA 2013, 110, 8381–8386. [Google Scholar] [CrossRef]
  6. Padgham, J. Agricultural Development under a Changing Climate: Opportunities and Challenges for Adaptation; World Bank: Washington, DC, USA, 2012. [Google Scholar]
  7. Martin-Guay, M.O.; Paquette, A.; Dupras, J.; Rivest, D. The new Green Revolution: Sustainable intensification of agriculture by intercropping. Sci. Total Environ. 2017, 615, 767–772. [Google Scholar] [CrossRef]
  8. Link, C.M.; Thevathasan, N.V.; Gordon, A.M.; Isaac, M.E. Determining tree water acquisition zones with stable isotopes in a temperate tree-based intercropping system. Agrofor. Syst. 2015, 89, 611–620. [Google Scholar] [CrossRef]
  9. Ahmad, S.; Khan, P.A.; Verma, D.K.; Mir, N.H.; Sharma, A.; Wani, S.A. Forage Production and Orchard Floor Management through Grass/Legume Intercropping in Apple Based Agroforestry Systems; AkiNik Publications: New Delhi, India, 2018. [Google Scholar]
  10. Köhl, J.; Wenneker, M.; Haas, B.H.D.; Anbergen, R.H.N.; Plas, C.H.; Kastelein, P. Inoculum Sources of the Post-Harvest Pathogens Neofabraea spp. and Cadophora spp. in Dutch Apple and Pear Orchards; Wageningen University: Wageningen, The Netherlands, 2015. [Google Scholar]
  11. Forey, O.; Temani, F.; Wery, J.; Jourdan, C.; Metay, A. Effect of combined deficit irrigation and grass competition at plantation on peach tree root distribution. Eur. J. Agron. 2017, 91, 16–24. [Google Scholar] [CrossRef]
  12. Liu, X.; Rahman, T.; Song, C.; Yang, F.; Yang, W. Relationships among light distribution, radiation use efficiency and land equivalent ratio in maize-soybean strip intercropping. Field Crops Res. 2018, 224, 91–101. [Google Scholar] [CrossRef]
  13. Hu, F.; Tan, Y.; Yu, A.; Zhao, C.; Fan, Z.; Yin, W.; Chai, Q.; Coulter, J.A.; Cao, W. Optimizing the split of N fertilizer application over time increases grain yield of maize-pea intercropping in arid areas. Eur. J. Agron. 2020, 119, 126117. [Google Scholar] [CrossRef]
  14. Gao, Y.; Wu, P.; Zhao, X.; Wang, Z. Growth, yield, and nitrogen use in the wheat/maize intercropping system in an arid region of northwestern China. Field Crops Res. 2014, 167, 19–30. [Google Scholar] [CrossRef]
  15. Zhang, R.; Huang, Q.; Yan, T.; Yang, J.; Li, M. Effects of intercropping mulch on the content and composition of soil dissolved organic matter in apple orchard on the loess plateau. J. Environ. Manag. 2019, 250, 109531. [Google Scholar] [CrossRef]
  16. Borden, K.A.; Isaac, M.E.; Thevathasan, N.V.; Gordon, A.M.; Thomas, S.C. Estimating coarse root biomass with ground penetrating radar in a tree-based intercropping system. Agrofor. Syst. 2014, 88, 657–669. [Google Scholar] [CrossRef]
  17. Bouttier, L.; Paquette, A.; Messier, C.; Rivest, D.; Olivier, A.; Cogliastro, A. Vertical root separation and light interception in a temperate tree-based intercropping system of Eastern Canada. Agrofor. Syst. 2014, 88, 693–706. [Google Scholar] [CrossRef]
  18. Evers, A.K.; Bambrick, A.; Lacombe, S.; Dougherty, M.C.; Bradley, R.L. Potential Greenhouse Gas Mitigation through Temperate Tree-Based Intercropping Systems. Open Agric. J. 2010, 4, 49–57. [Google Scholar] [CrossRef]
  19. Bakshi, M.; Singh, M.P.; Wadhwa, M.; Singh, B. Evaluation of Forest Grasses as Livestock Feed. Livest. Res. Rural. Dev. 2005, 17, 1–15. [Google Scholar]
  20. Knörzer, H.; Graeff-Hönninger, S.; Guo, B.; Pu, W.; Claupein, W. The Rediscovery of Intercropping in China: A Traditional Cropping System for Future Chinese Agriculture—A Review; Springer: Amsterdam, The Netherlands, 2009. [Google Scholar] [CrossRef]
  21. Chen, Q.H.; Wang, C.L. Advantage of Ningxia Wolfberry Industry and Strategy of Improving Its Export Competitive Power. Res. Agric. Mod. 2008, 29, 151–154. [Google Scholar]
  22. Zhang, Z.; Wen, S.; Wang, J. Current situation, existing problems countermeasures in development of top quality chinese wolfberry products in Ningxia. J. Agric. Sci. 2014, 35, 46–50. [Google Scholar]
  23. Li, J.Y.; Xu, B.; Yang, X.C.; Jin, Y.X.; Gao, T.; Yu, H.D.; Ma, H.L.; Qin, Z.H.; Zhao, L.N. Temporal and spatial variations of grassland desertification in Lingwu and Yanchi of Ningxia, China. In Proceedings of the Second International Conference on Agro-geoinformatics IEEE, Fairfax, VA, USA, 12–16 August 2013. [Google Scholar]
  24. Wit, C. On Competition; Pudoc: Wageningen, The Netherlands, 1960. [Google Scholar]
  25. Willey, R.W.; Rao, M.R. A competitive ratio for quantifying competition between intercrops. Exp. Agric. 1980, 16, 117–125. [Google Scholar] [CrossRef]
  26. Cardinale, B.J.; Wrigh, J.P.; Cadotte, M.W.; Carroll, I.T.; Hector, A.; Srivastava, D.S.; Loreau, M.; Weis, J.J. Impacts of plant diversity on biomass production increase through time because of species complementarity. Proc. Nat. Acad. Sci. USA 2007, 104, 18123–18128. [Google Scholar] [CrossRef]
  27. Karkanis, A.; Ntatsi, G.; Lepse, L.; Fernandez, J.A.; Savvas, D. Faba Bean Cultivation—Revealing Novel Managing Practices for More Sustainable and Competitive European Cropping Systems. Front. Plant Sci. 2018, 9, 1115. [Google Scholar] [CrossRef] [PubMed]
  28. Yu, Y.; Stomph, T.J.; Makowski, D.; van Der Werf, W. Temporal niche differentiation increases the land equivalent ratio of annual intercrops: A meta-analysis. Field Crops Res. 2015, 184, 133–144. [Google Scholar] [CrossRef]
  29. Hamzei, J.; Seyyedi, M. Energy use and input–output costs for sunflower production in sole and intercropping with soybean under different tillage systems. Soil Tillage Res. 2016, 157, 73–82. [Google Scholar] [CrossRef]
  30. Yufeng, L.; Hongliang, L.; Sicun, Y.; Jianguo, S.; Long, L.I. Yield and inter-specific interactions in maize/chickpea intercrop under different application rates of P in irrigated sierozem along the Yellow River in Northwest China. Chin. J. Eco-Agric. 2010, 18, 6. [Google Scholar]
  31. Xia, W.; Wu, F.; Zhou, X.; Fu, X.; Yue, T.; Xu, W.; Kai, P.; Liu, S. Effects of Intercropping with Potato Onion on the Growth of Tomato and Rhizosphere Alkaline Phosphatase Genes Diversity. Front. Plant Sci. 2016, 7, 846. [Google Scholar]
  32. Ringeval, B.; Nowak, B.; Nesme, T.; Delmas, M.; Pellerin, S. Contribution of anthropogenic phosphorus to agricultural soil fertility and food production. Glob. Biogeochem. Cycles 2015, 28, 743–756. [Google Scholar] [CrossRef]
  33. Akhalkatsi, M. Climate Global Change on Reproduction and Diversity of Agricultural Plants in Semi-Arid Regions of Georgia (Caucasus Ecoregion). Agric. Res. Technol. Open Access J. 2017, 3, 555619. [Google Scholar] [CrossRef]
  34. Hector, A.; Schmid, B.; Beierkuhnlein, C.; Caldeira, M.C.; Diemer, M.; Dimitrakopoulos, P.G.; Finn, J.A.; Freitas, H.; Giller, P.S.; Good, J.; et al. Plant diversity and productivity experiments in European grasslands. Science 1999, 286, 1123–1127. [Google Scholar] [CrossRef]
  35. Eisenhauer, N.; Reich, P.B.; Scheu, S. Increasing plant diversity effects on productivity with time due to delayed soil biota effects on plants. Basic Appl. Ecol. 2012, 13, 571–578. [Google Scholar] [CrossRef]
  36. Zhang, D.; Zhang, C.; Tang, X.; Li, H.; Zhang, F.; Rengel, Z.; Whalley, W.R.; Davies, W.J.; Shen, J. Increased soil phosphorus availability induced by faba bean root exudation stimulates root growth and phosphorus uptake in neighbouring maize. New Phytol. 2016, 209, 823–831. [Google Scholar] [CrossRef]
  37. Shi, X.W.; Guang-Ping, Q.I.; Wang, J.H.; Kang, Y.X.; Yan-Lin, M.A.; Wang, J.H.; Zhang, Z.P. Effects of wolfberry-legume intercropping on soil temperature and wolfberry fruit yield in Yellow River Pumping Irrigation Region of Gansu. J. Gansu Agric. Univ. 2018, 6, 111–119. [Google Scholar]
  38. Sadeghpour, A.; Jahanzad, E.; Esmaeili, A.; Hosseini, M.B.; Hashemi, M. Forage yield, quality and economic benefit of intercropped barley and annual medic in semi-arid conditions: Additive series. Field Crops Res. 2013, 148, 43–48. [Google Scholar] [CrossRef]
  39. Abtahi, M.; Majidi, M.M.; Mirlohi, A.; Saeidnia, F. Association analysis for seed yield, forage yield and traits related to drought tolerance in orchardgrass (Dactylis glomerata). Crop Pasture Sci. 2018, 69, 1150. [Google Scholar] [CrossRef]
  40. Majidi, M.M.; Araghi, B.; Barati, M.; Mirlohi, A. Polycross Genetic Analysis of Forage Yield and Related Traits in Dactylis glomerata. Crop Sci. 2015, 55, 203–210. [Google Scholar] [CrossRef]
  41. Fatemeh, S.; Mahdi, M.M.; Aghafakhr, M.; Benyamin, A. Physiological responses of drought tolerance in orchardgrass (Dactylis glomerata) in association with persistence and summer dormancy. Crop Pasture Sci. 2018, 69, 515–526. [Google Scholar]
  42. Lin, F.; Liu, X.J.; Tong, C.C.; Yong, W.U.; University, G.A. A study of root system characteristics and carbon and nitrogen metabolism of alfalfa and four grass forages in monoculture or intercropped. Acta Prataculturae Sin. 2019, 28, 45–54. [Google Scholar]
  43. Lin, F.; Liu, X.J.; Tong, C.C.; Wu, Y. Characteristics of light energy utilization of intercropping alfalfa/gramineae forage based on yield effect. Chin. J. Appl. Ecol. 2020, 31, 2963–2976. [Google Scholar]
  44. Ren, Y.Y.; Wang, Z.L.; Wang, X.L.; Zhang, S.Q. The effect and mechanism of intercropping pattern on yield and economic benefit on the Loess Plateau. Acta Ecol. Sin. 2015, 35, 4168–4177. [Google Scholar]
  45. Nedunchezhiyan, M. Evaluation of sweet potato (Ipomoea batatas) based strip intercropping systems for yield, competition indices and nutrient uptake. Indian J. Agron. 2011, 56, 98–103. [Google Scholar]
  46. Mousavi, S.R.; Eskandari, H. A General Overview on Intercropping and Its Advantages in Sustainable Agriculture. J. Appl. Environ. Biol. 2011, 1, 482–486. [Google Scholar]
  47. Zhu, L.; Tian, Y.; Wang, J.; Qin, K.; He, J. Plant allelopathy and its application in grassland agroecosystem. Soils Crops 2021, 9, 1–14. [Google Scholar]
  48. Li, L. Intercropping enhances agroecosystem services and functioning: Current knowledge and perspectives. Chin. J. Eco-Agric. 2016, 24, 403–415. [Google Scholar]
  49. Zheng, W.; Li, Y.; Gong, Q.; Zhang, H.; Wang, Z. Improving yield and water use efficiency of apple trees through intercrop-mulch of crown vetch (Coronilla varia L.) combined with different fertilizer treatments in the Loess Plateau. Span. J. Agric. Res. 2016, 14, e1207. [Google Scholar] [CrossRef]
  50. Gautam, P.; Lal, D.B.; Rana, R. Intercropping: An Alternative Pathway for Sustainable Agriculture. Pop. Kheti 2014, 1, 216–220. [Google Scholar]
  51. Alemayehu, D.; Shumi, D.; Afeta, T. Effect of Variety and Time of Intercropping of Common Bean (Phaseolus vulgaris L.) With Maize (Zea mays L.) on Yield Components and Yields of Associated Crops and Productivity of the System at Mid-Land of Guji, Southern Ethiopia. Adv. Crop Sci. Technol. 2018, 6, 1–9. [Google Scholar] [CrossRef]
  52. Jahanzad, E.; Sadeghpour, A.; Hoseini, M.B.; Barker, A.V.; Hashemi, M.; Afshar, R.K. Competition, Nitrogen Use Efficiency, and Productivity of Millet–Soybean Intercropping in Semiarid Conditions. Crop Sci. 2015, 55, 2842–2851. [Google Scholar] [CrossRef]
  53. Amanullah; Khalid, S.; Khalil, F. Imranuddin. Influence of irrigation regimes on competition indexes of winter and summer intercropping system under semi-arid regions of Pakistan. Sci. Rep. 2020, 10, 8129. [Google Scholar] [CrossRef]
  54. Lin, F. Study on the Mechanism of Improvement of Production Potential and Nutrient Quality of Alfalfa/Gramineae Grasses Intercropping and the Utilization Effect of Livestock; Gansu Agricultural University: Lanzhou, China, 2019. [Google Scholar]
Figure 1. Study areas and sampling sites in the Ningxia Hui Autonomous Region, northwestern China (YC—Yinchuan Region, garden farm of Ningxia Academy of Agriculture and Forestry Sciences; ZN—Zhongning Region, Zhongqi Group Chinese Wolfberry Production Base).
Agronomy 13 01365 g001
Figure 2. Greenhouse and field experiment schematics (AC) and (DF): (A) forage monoculture, (B) L. barbarum monoculture, and (C) L. barbarum–forage intercropping of greenhouse experiment at the garden farm of Ningxia Academy of Agriculture and Forestry Sciences; (D) L. barbarum-gramineous intercropping, (E) L. barbarum–Chenopodiaceae intercropping, (F) L. barbarum–leguminous intercropping of field experiment on the Zhongqi Group Chinese Wolfberry Production Base at Zhongning in northwest China.
Agronomy 13 01365 g002
Figure 3. Greenhouse intercropping LER values for growth and forage biomass of wolfberry. Notes: LERs were pooled to conduct t-tests if changes in wolfberry branch number, branch length, leaf area, and above-ground biomass differed from one. * denotes LER greater than one; ** and *** denote LER significantly greater than one (p < 0.001).
Agronomy 13 01365 g003
Figure 4. Field intercropping LER for growth and grass biomass of wolfberry. Notes: LERs were pooled to conduct t-tests if changes in wolfberry yield and growth indicators and above-ground biomass differed from one. * denotes LER greater than one; ** and *** denotes LER significantly greater than one (p < 0.001).
Agronomy 13 01365 g004
Figure 5. Spearman correlation analysis of the correlations of LER with various related indicators of the wolfberry–forage intercroppings.
Agronomy 13 01365 g005
Table 1. Planting arrangements of different planting patterns in each experimental site from 2019 to 2021.
Cropping SystemTreatmentSampling Sites
Greenhouse (Yinchuan)Field (Zhongning)
intercroppingWolfberry–ryegrassО ∆ ✯О ∆ ✯
Wolfberry–oatsО ∆О ∆ ✯
Wolfberry–sweet sorghumО ∆О ∆ ✯
Wolfberry–KudouziО ∆О ∆ ✯
Wolfberry–Lvyuan 5О ∆ ✯О ∆ ✯
Wolfberry–StipasО ∆О ∆ ✯
Wolfberry–wheatgrassО ∆О ∆ ✯
Wolfberry–white cloverО ∆ ✯О ∆ ✯
Wolfberry–mangoldО ∆ ✯О ∆ ✯
Wolfberry–alfalfaО ∆ ✯О ∆ ✯
monocroppingRyegrassО ∆ ✯О ∆ ✯
OatsО ∆О ∆ ✯
Sweet sorghumО ∆О ∆ ✯
KudouziО ∆О ∆ ✯
Lvyuan 5О ∆ ✯О ∆ ✯
StipasО ∆О ∆ ✯
WheatgrassО ∆О ∆ ✯
White cloverО ∆ ✯О ∆ ✯
MangoldО ∆ ✯О ∆ ✯
AlfalfaО ∆ ✯О ∆ ✯
WolfberryО ∆ ✯О ∆ ✯
Note: О denotes 2019; ∆ denotes 2020; ✯ denotes 2021.
Table 2. Monoculture specifications for each test site from 2019 to 2021.
Cropping SystemGreenhouse TestField Test
Row Distance (cm)Plant Distance (cm)Seeding Rate (g/m2)Depth (cm)Row Distance (cm)Plant Distance (cm)Seeding Rate (g/m2)Depth (cm)
ryegrass2--7.5210--4.53
oats4--45315--22.54
sweet sorghum5--7.5330--3.54
kudouzi3--7.5320--33
lvyuan 52--7.5210--4.53
stipas1--80.510--3.51
wheatgrass4--4.51.520--2.51.5
white clover3--15115--51.5
mangold101062302033
alfalfa3--6.51.515--3.52
Table 3. Intercropping specifications for field test site from 2019 to 2021.
Cropping SystemField Test
Row Distance (cm)Plant Distance (cm)Number of LinesGap between Groups (cm)
wolfberry–ryegrass10--11100
wolfberry–oats15--897.5
wolfberry–sweet sorghum30--4105
wolfberry–kudouzi20--6100
wolfberry–lvyuan 510--11100
wolfberry–stipas10--11100
wolfberry–wheatgrass10--11100
wolfberry–white clover15--897.5
wolfberry–mangold50203100
wolfberry–alfalfa15--897.5
Table 4. Monocropping weighted and land equivalent ratios (LERs) of wolfberry and forage under treatments of greenhouse test level in 2019, 2020, and 2021.
TreatmentYearGramineous Yield (kg/T)Increased Biomass (kg/T)Above-Ground Biomass (kg/T)
MonocroppingIntercroppingMonocroppingIntercroppingMonocropping Weighted AverageIntercropping YieldLER
20191.12 ± 0.08 a0.56 ± 0.01 b1.66 ± 0.16 a0.98 ± 0.08 b1.31 ± 0.07 b1.54 ± 0.02 a1.09 ns
wolfberry–
lvyuan 5
20201.30 ± 0.01 a0.68 ± 0.04 b1.90 ± 0.19 a1.19 ± 0.06 b1.51 ± 0.10 b1.87 ± 0.06 a1.15 *
20211.36 ± 0.06 a0.80 ± 0.06 b2.30 ± 0.19 a1.25 ± 0.09 b1.69 ± 0.07 b2.05 ± 0.12 a1.13 ns
20191.44 ± 0.16 a0.52 ± 0.03 b1.66 ± 0.16 a0.82 ± 0.13 b1.52 ± 0.11 a1.34 ± 0.10 a0.85 *
wolfberry–
oats
20201.20 ± 0.08 a0.49 ± 0.01 b1.90 ± 0.19 a1.06 ± 0.13 b1.45 ± 0.05 a1.55 ± 0.08 a0.96 ns
20211.23 ± 0.03 a0.46 ± 0.06 b2.30 ± 0.19 a1.29 ± 0.16 b1.61 ± 0.04 a1.75 ± 0.03 a0.94 ns
20191.72 ± 0.01 a0.56 ± 0.03 b1.66 ± 0.16 a0.51 ± 0.10 b1.70 ± 0.12 a1.07 ± 0.05 b0.63 **
wolfberry–
wheatgrass
20201.58 ± 0.14 a0.54 ± 0.07 b1.90 ± 0.19 a0.58 ± 0.11 b1.69 ± 0.09 a1.12 ± 0.01 b0.65 **
20211.86 ± 0.12 a0.70 ± 0.01 b2.30 ± 0.19 a0.87 ± 0.12 b2.02 ± 0.13 a1.57 ± 0.03 b0.75 *
20191.32 ± 0.10 a0.76 ± 0.09 b1.66 ± 0.16 a1.24 ± 0.08 b1.44 ± 0.03 b2.00 ± 0.12 a1.32 **
wolfberry–stipas20201.74 ± 0.12 a0.80 ± 0.03 b1.90 ± 0.19 a1.55 ± 0.08 b1.80 ± 0.07 b2.35 ± 0.12 a1.27 *
20211.50 ± 0.02 a0.54 ± 0.05 b2.30 ± 0.19 a1.56 ± 0.10 b1.78 ± 0.06 b2.10 ± 0.07 a1.04 ns
20192.02 ± 0.18 a1.30 ± 0.07 b1.66 ± 0.16 a1.86 ± 0.08 a1.90 ± 0.09 b3.16 ± 0.23 a1.76 ***
wolfberry–
ryegrass
20202.42 ± 0.13 a1.20 ± 0.02 b1.90 ± 0.19 b2.07 ± 0.10 a2.24 ± 0.15 b3.27 ± 0.26 a1.59 ***
20212.16 ± 0.10 a1.40 ± 0.10 b2.30 ± 0.19 a2.18 ± 0.08 a2.21 ± 0.19 b3.58 ± 0.19 a1.60 ***
201921.02 ± 2.37 a5.82 ± 1.02 b1.66 ± 0.16 a1.23 ± 0.13 b14.25 ± 2.52 a7.05 ± 1.07 b1.02 ns
wolfberry–
sweet sorghum
202019.87 ± 2.08 a6.03 ± 0.89 b1.90 ± 0.19 a1.52 ± 0.09 b13.58 ± 2.01 a7.55 ± 0.90 b1.10 ns
202124.75 ± 3.69 a5.46 ± 0.77 b2.30 ± 0.19 a1.69 ± 0.12 b16.89 ± 1.69 a7.15 ± 1.62 b0.95 ns
W-GMean4.98 ± 0.52 A1.59 ± 0.21 B1.96 ± 0.18 A1.30 ± 0.09 B3.92 ± 0.61 A2.89 ± 0.28 B1.10 ns
20190.87 ± 0.09 a0.13 ± 0.01 b1.66 ± 0.16 a0.78 ± 0.02 b1.15 ± 0.06 a0.91 ± 0.01 a0.62 **
wolfberry–
kudouzi
20201.02 ± 0.03 a0.10 ± 0.02 b1.90 ± 0.19 a1.41 ± 0.01 b1.33 ± 0.08 a1.51 ± 0.07 a0.84 *
20210.93 ± 0.10 a0.16 ± 0.01 b2.30 ± 0.19 a1.69 ± 0.09 b1.41 ± 0.19 b1.85 ± 0.12 a0.90 ns
wolfberry–
alfalfa
20201.08 ± 0.09 a0.69 ± 0.03 a1.90 ± 0.19 a1.52 ± 0.10 a1.37 ± 0.07 b2.21 ± 0.14 a1.44 ***
20211.32 ± 0.10 a0.73 ± 0.09 b2.30 ± 0.19 a1.58 ± 0.12 b1.66 ± 0.10 b2.31 ± 0.12 a1.24 *
20190.68 ± 0.01 a0.28 ± 0.06 b1.66 ± 0.16 a1.70 ± 0.09 a1.02 ± 0.02 b1.98 ± 0.09 a1.43 **
wolfberry–
white clover
20201.00 ± 0.05 a0.18 ± 0.00 b1.90 ± 0.19 a1.81 ± 0.05 a1.32 ± 0.08 b1.99 ± 0.10 a1.13 ns
20211.08 ± 0.07 a0.20 ± 0.02 b2.30 ± 0.19 a1.90 ± 0.11 b1.51 ± 0.06 b2.10 ± 0.14 a1.01 ns
W-LMean1.08 ± 0.07 A0.36 ± 0.03 B1.96 ± 0.18 A1.54 ± 0.07 B1.35 ± 0.07 B1.90 ± 0.10 A1.12 ns
201914.22 ± 1.06 a10.89 ± 1.37 b1.66 ± 0.16 a1.75 ± 0.11 a9.83 ± 1.79 b12.64 ± 2.66 a1.82 ***
wolfberry–
mangold
202017.01 ± 2.19 a14.68 ± 2.01 b1.90 ± 0.19 a1.77 ± 0.09 a11.72 ± 1.04 b16.45 ± 0.09 a1.79 ***
202115.66 ± 1.77 b18.32 ± 2.42 a2.30 ± 0.19 a2.23 ± 0.12 a10.99 ± 2.01 b20.55 ± 2.47 a2.14 ***
W-CMean15.63 ± 1.67 A14.63 ± 1.93 B1.96 ± 0.18 A1.92 ± 0.11 B10.84 ± 1.61 B16.55 ± 1.74 A1.92 ***
Note: Mean values (x ± SE) followed by the same letter were not significantly different using LSD (p < 0.05); ANOVA of square-root-transformed data (n = 3). W-G, W-L, and W-C denote wolfberry–gramineae, wolfberry–leguminous, and wolfberry–chenopodioideae, respectively. ns denotes LER had no significant difference when compared with 1, * denotes LER greater than one; ** and *** denotes LER significantly greater than one (p < 0.001). a and b explains the difference analysis of all the data between different years; A and B explains the differences between the mean values of each indicator.
Table 5. Increased biomass and land equivalent ratios (LERs) of wolfberry and forage under treatments of the field test level in 2019, 2020 and 2021.
TreatmentYearGramineous Yield (kg/667 m2)Increased Biomass (kg/667 m2)Above-Ground Biomass (kg/667 m2)
MonocroppingIntercroppingMonocroppingIntercroppingMonocropping Weighted AverageIntercropping YieldLER
20193293.38 ± 140.49 a2138.92 ± 110.72 b4412.50 ± 495.30 a2606.09 ± 216.53 b4613.30 ± 202.45 b4745.01 ± 326.77 a1.26 *
wolfberry–lvyuan 520202937.95 ± 136.77 a1957.37 ± 63.92 b5051.51 ± 388.98 a3157.42 ± 201.33 b4994.24 ± 142.09 b5114.80 ± 121.45 a1.31 **
20212770.60 ± 144.24 a1917.65 ± 70.11 b6111.01 ± 526.37 a3322.20 ± 208.88 b5121.74 ± 206.87 b5239.854 ± 208.77 a1.26 *
20193610.48 ± 124.01 a2397.72 ± 154.08 b4412.50 ± 495.30 a2169.77 ± 177.09 b4011.49 ± 162.45 b4567.49 ± 165.96 a1.11 ns
wolfberry–oats20203156.19 ± 116.33 a1867.04 ± 140.00 b5051.51 ± 388.98 a2802.98 ± 363.44 b4103.85 ± 78.89 b4670.00 ± 277.53 a1.11 ns
20213320.71 ± 107.99 a2010.35 ± 132.66 b6111.01 ± 526.37 a3428.75 ± 350.88 b4715.86 ± 233.78 b5439.09 ± 466.89 a1.13 ns
20192312.78 ± 164.60 a917.42 ± 104.07 b4412.50 ± 495.30 a1351.69 ± 88.45 b3362.64 ± 102.37 a2269.11 ± 178.96 b0.69 **
wolfberry–wheatgrass20202106.64 ± 163.97 a708.02 ± 66.77 b5051.51 ± 388.98 a1545.48 ± 101.67 b3579.07 ± 232.74 a2253.50 ± 130.62 b0.63 **
20211926.98 ± 161.44 a691.72 ± 99.35 b6111.01 ± 526.37 a2303.85 ± 78.22 b4019.00 ± 121.96 a2995.57 ± 128.99 b0.73 *
20192091.95 ± 179.23 a896.74 ± 95.18 b4412.50 ± 495.30 a3290.06 ± 190.52 b3252.23 ± 98.89 b4186.81 ± 301.56 a1.19 *
wolfberry–stipas20201791.96 ± 169.81 a892.85 ± 103.66 b5051.51 ± 388.98 a4102.50 ± 177.43 b3421.73 ± 77.34 b4995.35 ± 266.84 a1.33 **
20211688.15 ± 188.92 a710.51 ± 45.29 b6111.01 ± 526.37 a4140.89 ± 281.76 b3899.58 ± 135.64 b4851.40 ± 199.35 a1.12 ns
20193611.79 ± 100.01 a3123.62 ± 259.56 b4412.50 ± 495.30 a4945.70 ± 178.78 b4012.14 ± 201.87 b8069.326 ± 377.56 a1.96 ***
wolfberry–ryegrass20203786.48 ± 166.88 a3038.74 ± 281.32 b5051.51 ± 388.98 a5502.54 ± 233.09 b4418.99 ± 199.07 b8541.28 ± 368.54 a1.87 ***
20213740.65 ± 125.97 a3213.45 ± 89.07 b6111.01 ± 526.37 a5792.25 ± 201.22 b4925.83 ± 207.43 b9005.70 ± 299.87 a1.78 ***
201910,639.36 ± 800.30 a3158.61 ± 157.09 b4412.50 ± 495.30 a3264.41 ± 308.44 b7525.93 ± 566.89 a6423.02 ± 465.99 b1.04 ns
wolfberry–sweet sorghum202010,242.39 ± 916.43 a3082.51 ± 140.21 b5051.51 ± 388.98 a4020.30 ± 291.88 b7646.95 ± 394.08 a7102.84 ± 407.29 b1.10 ns
20219388.89 ± 567.00 a2713.80 ± 201.88 b6111.01 ± 526.37 a4487.31 ± 288.89 b7749.95 ± 521.46 a7201.11 ± 366.55 b1.02 ns
W-GMean4186.85 ± 277.96 a2004.80 ± 122.22 b5191.68 ± 361.14 a3457.45 ± 137.56 b4689.26 ± 234.98 b5462.26 ± 269.88 a1.20 *
20193828.33 ± 104.76 a1390.33 ± 87.56 b4412.50 ± 495.30 a2076.65 ± 89.96 b4120.42 ± 88.32 a3466.98 ± 244.31 b0.75 *
wolfberry–kudouzi20203516.87 ± 121.02 a808.90 ± 45.99 b5051.51 ± 388.98 a3749.36 ± 101.43 b4284.19 ± 155.46 a4558.26 ± 261.80 a0.92 ns
20213476.68 ± 89.16 a801.19 ± 77.54 b6111.01 ± 526.37 a4478.61 ± 252.37 b4793.85 ± 174.08 b5279.80 ± 197.56 a0.91 ns
20195907.25 ± 169.73 a5182.18 ± 150.19 b4412.50 ± 495.30 a3991.26 ± 197.88 b5159.88 ± 227.99 b9173.43 ± 343.19 a1.74 ***
wolfberry–alfalfa20205279.17 ± 125.10 a4311.06 ± 143.87 b5051.51 ± 388.98 a4033.01 ± 188.56 b5165.34 ± 209.17 b8344.07 ± 277.43 a1.58 ***
20215676.63 ± 69.77 a4625.43 ± 109.77 b6111.01 ± 526.37 a4178.85 ± 102.33 b5893.82 ± 155.44 b8804.28 ± 256.38 a1.46 ***
20193240.63 ± 169.16 a1383.73 ± 111.08 b4412.50 ± 495.30 a4509.68 ± 200.67 a3826.56 ± 125.60 b5893.42 ± 200.67 a1.39 **
wolfberry–white clover20202936.30 ± 99.16 a993.32 ± 67.33 b5051.51 ± 388.98 a4812.09 ± 213.43 a3993.90 ± 277.86 b5805.61 ± 188.44 a1.24 *
20212910.56 ± 116.55 a945.52 ± 69.45 b6111.01 ± 526.37 a5036.56 ± 300.59 b4510.78 ± 263.98 b5982.08 ± 277.30 a1.10 ns
W-LMean4059.03 ± 133.26 a2220.20 ± 97.44 b5191.67 ± 452.53 a4096.23 ± 194.71 b4625.35 ± 179.86 b6316.43 ± 245.68 a1.23 *
201910,980.08 ± 466.70 a8416.92 ± 411.09 b4412.50 ± 495.30 a4645.33 ± 127.31 a7696.29 ± 267.99 b13,062.25 ± 571.32 a1.86 ***
wolfberry–mangold20209739.57 ± 301.19 a8209.06 ± 204.00 b5051.51 ± 388.98 a4700.40 ± 266.06 b7395.53 ± 233.07 b12,909.47 ± 406.38 a1.82 ***
20219332.63 ± 355.87 a7647.04 ± 368.99 b6111.01 ± 526.37 a5915.80 ± 197.90 a7721.82 ± 401.90 b13,562.85 ± 476.51 a1.83 ***
W-CMean10,017.43 ± 367.92 a8091.04 ± 327.56 b5191.68 ± 450.66 a5087.18 ± 197.35 a7604.55 ± 307.56 b13,178.21 ± 480.21 a1.84 ***
Note: Mean values (x ± SE) followed by the same letter were not significantly different using LSD (p < 0.05); ANOVA of square-root-transformed data (n = 3). W-G, W-L, and W-C denote wolfberry–gramineae, wolfberry–leguminous, and wolfberry–chenopodioideae, respectively. ns denotes LER had no significant difference when compared with 1, * denotes LER greater than one; ** and *** denotes LER significantly greater than one (p < 0.001). a and b explains the difference analysis of all the data between different years.
Table 6. Yield and land equivalent ratios (LERs) of wolfberry and forage under treatments of the field test level in 2019, 2020, and 2021.
TreatmentYearGramineous Yield (kg/667 m2)Increased Biomass (kg/667 m2)Fruit Yield (kg/667 m2)
MonocroppingIntercroppingMonocroppingIntercroppingMonocropping Weighted AverageIntercropping YieldLER
20193293.38 ± 140.49 a2138.92 ± 110.72 b902.18 ± 103.68 a711.62 ± 32.32 b2097.788 ± 127.41 b2850.55 ± 209.67 a1.46 ***
wolfberry–lvyuan 520202937.95 ± 136.77 a1957.37 ± 63.92 b856.39 ± 99.67 a694.64 ± 37.66 b1897.17 ± 133.08 b2652.01 ± 177.09 a1.50 ***
20212770.60 ± 144.24 a1917.65 ± 70.11 b783.05 ± 45.32 a663.45 ± 55.80 b1776.82 ± 106.54 b2581.10 ± 159.03 a1.56 ***
20193610.48 ± 124.01 a2397.72 ± 154.08 b892.18 ± 46.17 a743.33 ± 38.09 b2251.33 ± 187.95 b3141.05 ± 344.01 a1.45 ***
wolfberry–oats20203156.19 ± 116.33 a1867.04 ± 140.00 b856.39 ± 39.88 a708.62 ± 24.99 b2006.29 ± 111.00 b2575.67 ± 209.60 a1.38 **
20213320.71 ± 107.99 a2010.35 ± 132.66 b783.05 ± 50.09 a694.64 ± 47.99 a2051.88 ± 146.57 b2704.99 ± 177.35 a1.45 **
20192312.78 ± 164.60 a917.42 ± 104.07 b822.18 ± 67.34 a638.72 ± 37.54 b1567.48 ± 98.32 a1556.14 ± 176.45 a1.16 *
wolfberry–wheatgrass20202106.64 ± 163.97 a708.02 ± 66.77 b856.39 ± 86.11 a611.19 ± 29.87 b1481.52 ± 121.56 a1319.21 ± 89.66 b1.04 ns
20211926.98 ± 161.44 a691.72 ± 99.35 b783.05 ± 37.62 a567.05 ± 34.77 b1355.02 ± 49.87 a1258.77 ± 59.33 b1.07 ns
20192091.95 ± 179.23 a896.74 ± 95.18 b922.18 ± 107.55 a708.62 ± 59.83 b1507.07 ± 166.90 a1605.37 ± 201.77 a1.22 *
wolfberry–stipas20201791.96 ± 169.81 a892.85 ± 103.66 b856.39 ± 55.47 a694.64 ± 77.19 b1324.18 ± 103.65 b1587.49 ± 78.55 a1.33 **
20211688.15 ± 188.92 a710.51 ± 45.29 b783.05 ± 65.42 a660.45 ± 45.80 b1235.60 ± 100.52 a1370.96 ± 19.67 a1.28 *
20193611.79 ± 100.01 a3123.62 ± 259.56 b862.18 ± 58.54 a858.83 ± 123.98 a2236.98 ± 19.67 a3982.45 ± 306.00 a1.84 ***
wolfberry–ryegrass20203786.48 ± 166.88 a3038.74 ± 281.32 b856.39 ± 37.99 a836.33 ± 98.59 a2321.43 ± 169.88 b3875.07 ± 207.42 a1.76 ***
20213740.65 ± 125.97 a3213.45 ± 89.07 b830.00 ± 51.09 a790.08 ± 99.45 a2285.32 ± 163.24 b4003.54 ± 188.56 a1.79 ***
201910,639.36 ± 800.30 a3158.61 ± 157.09 b902.18 ± 103.68 a772.83 ± 103.77 b5770.77 ± 374.89 a3931.44 ± 337.69 b1.15 *
wolfberry–sweet sorghum202010,242.39 ± 916.43 a3082.51 ± 140.21 b856.39 ± 99.67 a733.33 ± 81.43 b5549.39 ± 403.66 a3815.87 ± 288.15 b1.16 *
20219388.89 ± 567.00 a2713.80 ± 201.88 b783.05 ± 45.32 a703.69 ± 76.33 a5085.97 ± 261.90 a3417.49 ± 271.46 b1.19 *
W-GMean4186.85 ± 277.96 a2004.80 ± 122.22 b843.70 ± 48.79 a710.67 ± 66.37 b2515.28 ± 111.05 a2715.48 ± 201.01 a1.38 **
20193828.33 ± 104.76 a1390.33 ± 87.56 b902.18 ± 50.12 a694.64 ± 37.08 b2365.26 ± 127.34 a2084.97 ± 59.81 b1.05 ns
wolfberry–kudouzi20203516.87 ± 121.02 a808.90 ± 45.99 b856.39 ± 49.08 a660.45 ± 58.66 b2186.63 ± 87.91 a1469.35 ± 43.22 b0.95 ns
20213476.68 ± 89.16 a801.19 ± 77.54 b783.05 ± 33.56 a608.62 ± 56.22 b2129.87 ± 91.56 a1409.81 ± 36.37 b0.95 ns
20195907.25 ± 169.73 a5182.18 ± 150.19 b868.45 ± 67.44 a740.33 ± 38.96 b3387.85 ± 203.22 b5922.51 ± 269.88 a1.69 ***
wolfberry–alfalfa20205279.17 ± 125.10 a4311.06 ± 143.87 b866.54 ± 104.37 a700.69 ± 51.34 b3072.85 ± 179.60 b5011.75 ± 209.46 a1.59 ***
20215676.63 ± 69.77 a4625.43 ± 109.77 b834.19 ± 76.52 a698.62 ± 44.88 b3255.41 ± 153.22 b5324.05 ± 237.50 a1.62 ***
20193240.63 ± 169.16 a1383.73 ± 111.08 b808.64 ± 66.09 a810.13 ± 77.42 a2024.64 ± 80.99 a2193.86 ± 95.66 a1.37 **
wolfberry–white clover20202936.30 ± 99.16 a993.32 ± 67.33 b786.83 ± 57.86 a772.83 ± 107.09 a1861.56 ± 131.67 a1766.35 ± 101.74 a1.27 *
20212910.56 ± 116.55 a945.52 ± 69.45 b753.69 ± 44.92 a753.69 ± 76.53 a1832.12 ± 97.33 a1699.21 ± 43.87 b1.28 *
W-LMean4059.03 ± 133.26 a2220.20 ± 97.44 b828.88 ± 60.89 a715.56 ± 63.27 b2443.95 ± 127.61 b2935.75 ± 113.42 a1.31 **
201910,980.08 ± 466.70 a8416.92 ± 411.09 b923.59 ± 101.54 a872.83 ± 127.66 a5951.84 ± 307.03 b9289.75 ± 399.80 a1.75 ***
wolfberry–mangold20209739.57 ± 301.19 a8209.06 ± 204.00 b910.13 ± 144.21 a853.69 ± 49.67 a5324.85 ± 182.96 b9062.75 ± 277.46 a1.83 ***
20219332.63 ± 355.87 a7647.04 ± 368.99 b872.83 ± 89.66 a843.33 ± 88.58 a5102.72 ± 201.44 b8490.37 ± 301.20 b1.83 ***
W-CMean10,017.43 ± 367.92 a8091.04 ± 327.56 b902.18 ± 110.44 a856.62 ± 80.66 a5459.80 ± 233.54 b8947.65 ± 192.33 a1.80 ***
Note: Mean values (x ± SE) followed by the same letter were not significantly different using LSD (p < 0.05); ANOVA of square-root-transformed data (n = 3). W-G, W-L, and W-C denote wolfberry–gramineae, wolfberry–leguminous, and wolfberry–chenopodioideae, respectively. ns denotes LER had no significant difference when compared with 1, * denotes LER greater than one; ** and *** denotes LER significantly greater than one (p < 0.001). a and b explains the difference analysis of all the data between different years.
Table 7. Competitiveness evaluation of ten types of intercropping systems.
Cropping PatternAggressivityRelative Crowding Coefficient of ForageRelative Crowding Coefficient of WolfberryCompetitive RatioMonetary Advantage Index
AfwAfwKfKwKwCRfwCRfwMAIMAI
(Fruit Yield)(Total Biomass)(Forage Biomass)(Fruit Yield)(Total Biomass)(Fruit Yield)(Total Biomass)(Fruit Yield)(Total Biomass)
wolfberry–lvyuan 5−0.250.142.204.391.600.841.12429.75652.05
wolfberry–oats−0.530.001.395.581.400.691.00514.24437.53
wolfberry–wheatgrass−0.76−0.070.552.820.640.480.9173.42−590.43
wolfberry–stipas−0.67−0.560.894.143.000.580.63213.53523.63
wolfberry–ryegrass−0.31−0.434.5639.25−31.10.840.79827.632106.54
wolfberry–sweet sorghum−1.15−0.950.426.663.380.340.38449.24320.18
wolfberry–kudouzi−1.12−0.930.273.402.100.270.31−11.07−301.12
wolfberry–alfalfa−0.070.023.974.983.770.961.01994.181706.27
wolfberry–white clover−1.36−1.240.46186.7213.580.310.34195.86633.3
wolfberry–mangold−0.20−0.255.6918.8039.610.900.871918.573103.13
Disclaimer/Publisher’s Note: The statements, opinions and data contained in all publications are solely those of the individual author(s) and contributor(s) and not of MDPI and/or the editor(s). MDPI and/or the editor(s) disclaim responsibility for any injury to people or property resulting from any ideas, methods, instructions or products referred to in the content.

