
Economic and Environmental Assessment of the Wine Chain in Southeastern Spain


Abstract
:1. Introduction
2. Materials and Methods
2.1. The Winery Model
2.1.1. Common Production Processes of the Three Types of Wine
- Reception-controlled entry into the winery. Once the grapes have arrived at the winery, they are received and quality controlled, followed by the destemming–squeezing process using hoppers with feeders. The standard winery is dimensioned on the basis that it can handle two hoppers, each with a capacity of 20,000 kg h−1;
- Destemming–squeezing. Two independent machines with an average yield of 18,000 kg h−1, fed from reception hoppers. At the end of this stage, the scrapings are removed to a container by means of a crusher and a conveyor belt. The balance of the removed biomass is 6%; that is, the resulting mass in relation to the initial mass is 94%;
- Transferred to tanks. The paste is transferred by means of a booster pump to the refrigeration tanks (cold maceration), with an average net yield of 8000 kg h−1;
- Cold maceration. In the tanks, 2 days of cold maceration are considered, with grape entry at 28 °C and exit at 16 °C;
- Alcoholic fermentation. Controlled fermentation at 22–24 °C for 7–8 days. It is considered to occur in three fermentation batches and, therefore, the number of tanks is dimensioned in three separate fermentations. The tanks have a gross capacity of 70,000 and 50,000 dm3 and a useful capacity of 85%, and the possibility of overlapping two fermentation batches is established;
- Pump-overs. Six pump-overs are carried out per day in alcoholic fermentation with an average duration of 20 min and maximum flow 30,000 dm3 h−1;
- Devatting–pressing. The devatting is carried out with positive pressure and the support of transfer pumps to feed the press with an average yield of 14,000 kg h−1. The pressing occurs with a load capacity of 20,000 kg and a total working time of 2.75 h;
- Filling of tanks for malolactic fermentation. Transfer pumps are used, with a net average output of 18,000 dm3 h−1 in the liquid phase. Withdrawal of pomace (21% of the gross initial input) occurs with an average net yield of 8000 kg h−1;
- Malolactic fermentation. This occurs in tanks with parameters similar to those of the alcoholic fermentation batches but with controlled conditions appropriate for malolactic fermentation. A heat exchange by means of jacket water up to an average temperature of 23 °C, for about five days, is considered. For dimensioning, the following balance is established: a raw grape input of 100 kg yields 70 dm3 of malolactic acid;
- Clarification–stabilization. The liquid is bubbled with nitrogen, and pea protein is added to achieve clarification (200 mg per liter of wine). In this stage, the sludge and lees are removed, representing a balance of 3% of the gross input of grapes. Racking is performed by pumping to the stabilization–conservation tanks or to barrels, in the case of aging (semi-crianza or crianza wines); one step per filtrate is carried out by pressure plate filtration, with an average yield of 5000 dm3 h−1. The average net yield in the transfers is 18,000 dm3 h−1 of filtered liquid;
- Microfiltration–tartaric stabilization. Just before bottling, tangential filtration is applied to all wines, followed by microfiltration through plastic cartridges with a pore size of 0.45 µ. Tartrate removal and color stabilization are performed with potassium polyaspartate or carboxymethylcellulose;
- Bottling–corking. This includes feed pumping from a regulating reservoir. Bottling is performed with “cuatribloc” equipment (washing, sterilizing, filling, corking), with an average output of 2000 bottles h−1 in a programmable process. The use of hot water, produced by a DHW boiler with a diesel burner, in the bottling stage is assumed;
- Labeling. This comprises the use of a labeling machine with an average performance of 3000 bottles h−1, together with a box former and transporter (6 bottles per box);
- Internal transport–packing–dispatch. The transport and dispatching equipment is dimensioned: forklift and electric pallet trucks.
2.1.2. Specific Processes of the Semi-Crianza and Crianza Wines
- Aging in barrels. The wines are transferred to oak barrels after clarification and stabilization, just after passing through the filtering plates. The cellar is dimensioned with barrels with a capacity of 225 dm3 (220 useful dm3). The semi-crianza wine represents 40% and the crianza wine 20% (Table 1). The semi-crianza wine spends 4–6 months in the barrel and the crianza wine 9–12 months. The barrels are stacked four high. The barrels are comprised of 50% American oak and 50% French oak;
- Aging in bottles. Cages for bottle aging and the corresponding turners are used, as well as two-barrel sleepers.
2.2. Life Cycle Costing
- Fixed costs. The fixed costs were calculated as the annual amortization cost, applying the linear method or constant installments;
- Variable costs. These include the cost of the inputs, services, and activities involved in the course of one production cycle. They were calculated taking as a reference the cost of the inputs used and the activities carried out in the production process.
2.2.1. Initial Investment: Winery, Installation, and Equipment. Fixed Amortization Costs
2.2.2. Variable Costs
2.3. Life Cycle Assessment
2.3.1. Goal and Scope
- Supplies. Raw materials, transport and production of the products used in the different phases of winemaking (metabisulfite, sulfur dioxide, yeast, pea protein, and potassium polyaspartate), and water consumption;
- Energy. The electrical energy consumed in all processes: destemming and crushing, alcoholic fermentation, pressing, malolactic fermentation, stabilization, bottling and packaging, lighting, and others (Table A2); also, the diesel consumed by the boiler;
- Aging. Raw materials, transport and manufacture of 225 dm3 barrels for semi-crianza and crianza wines;
- Bottling. Raw materials, transport and manufacture of the 0.75 dm3 glass bottle (0.42 kg in weight), the transport pallet, and the plastic packaging;
- Packaging. This includes the label, cork stopper, capsule, and corrugated board box.
2.3.2. Life Cycle Inventory
2.3.3. Life Cycle Impact
2.4. Sensitivity Analysis
- The weight of the glass bottle. Although the trend seems to be to reduce the weight of the bottle, for both economic and environmental reasons, crianza wine continues to be bottled in heavy bottles (such as 0.65 kg);
- The origin of the grape, according to the type of vineyard. Currently, the options for wine grapes in the region of Murcia, as described by García Castellanos et al. [24], are:
- Conventional rain-fed vineyard with goblet formation (CR);
- Organic rain-fed vineyard with goblet formation (OR);
- Conventional irrigated vineyard with trellis formation (CI);
- Organic irrigated vineyard with formation (OI).
3. Results and Discussion
3.1. Life Cycle Costing
3.2. Life Cycle Assessment
3.3. Sensitivity Analysis
3.3.1. Life Cycle Costing
3.3.2. Life Cycle Assessment
4. Conclusions
Author Contributions
Funding
Data Availability Statement
Conflicts of Interest
Appendix A

| Category | Value (EUR) | Category Total (EUR) |
|---|---|---|
| Civil works | 1,234,725 | |
| Earth movements | 21,425 | |
| Foundation and screed | 294,670 | |
| Metallic structure | 261,100 | |
| Deck | 134,280 | |
| Enclosures, partitions, and false ceilings | 358,080 | |
| Pavements and flooring | 103,370 | |
| Exterior metallic carpentry | 37,300 | |
| Exterior urbanization | 38,500 | |
| Installations | 276,258 | |
| Water and sanitation | 67,140 | |
| Electrical installation and communications | 168,670 | |
| Fire protection | 20,888 | |
| Furniture, computing, and communications | 19,560 | |
| Equipment, machinery, and barrels | 3,592,526 | |
| Process equipment and machinery | 1,772,666 | |
| Barrels | 1,560,815 | |
| Auxiliary aging equipment | 230,305 | |
| Other general equipment | 28,740 | |
| Project, construction management, licenses | 229,658 | |
| TOTAL | 5,333,167 |
| Phase of Process | Power (kW) | Power (%) | Energy (kWh) | Energy (%) | Unit Energy (kW h hL−1) |
|---|---|---|---|---|---|
| Reception, destemming, squeezing | 61.30 | 14.1% | 5361 | 3.1% | 0.39 |
| Alcoholic fermentation | 166.80 | 38.3% | 74,840 | 43.6% | 5.43 |
| Pressing, malolactic fermentation | 30.85 | 7.1% | 17,760 | 10.3% | 1.29 |
| Stabilization | 12.00 | 2.8% | 1120 | 0.7% | 0.08 |
| Bottling, storage, dispatch | 50.14 | 11.5% | 38,871 | 22.6% | 2.82 |
| Lighting, other uses | 11.20 | 2.6% | 15,053 | 8.8% | 1.09 |
| Auxiliaries (air, recirculation, etc.) | 103.61 | 23.8% | 18,780 | 10.9% | 1.36 |
| TOTAL | 435.90 | 100.0% | 171,785 | 100.0% | 12.46 |
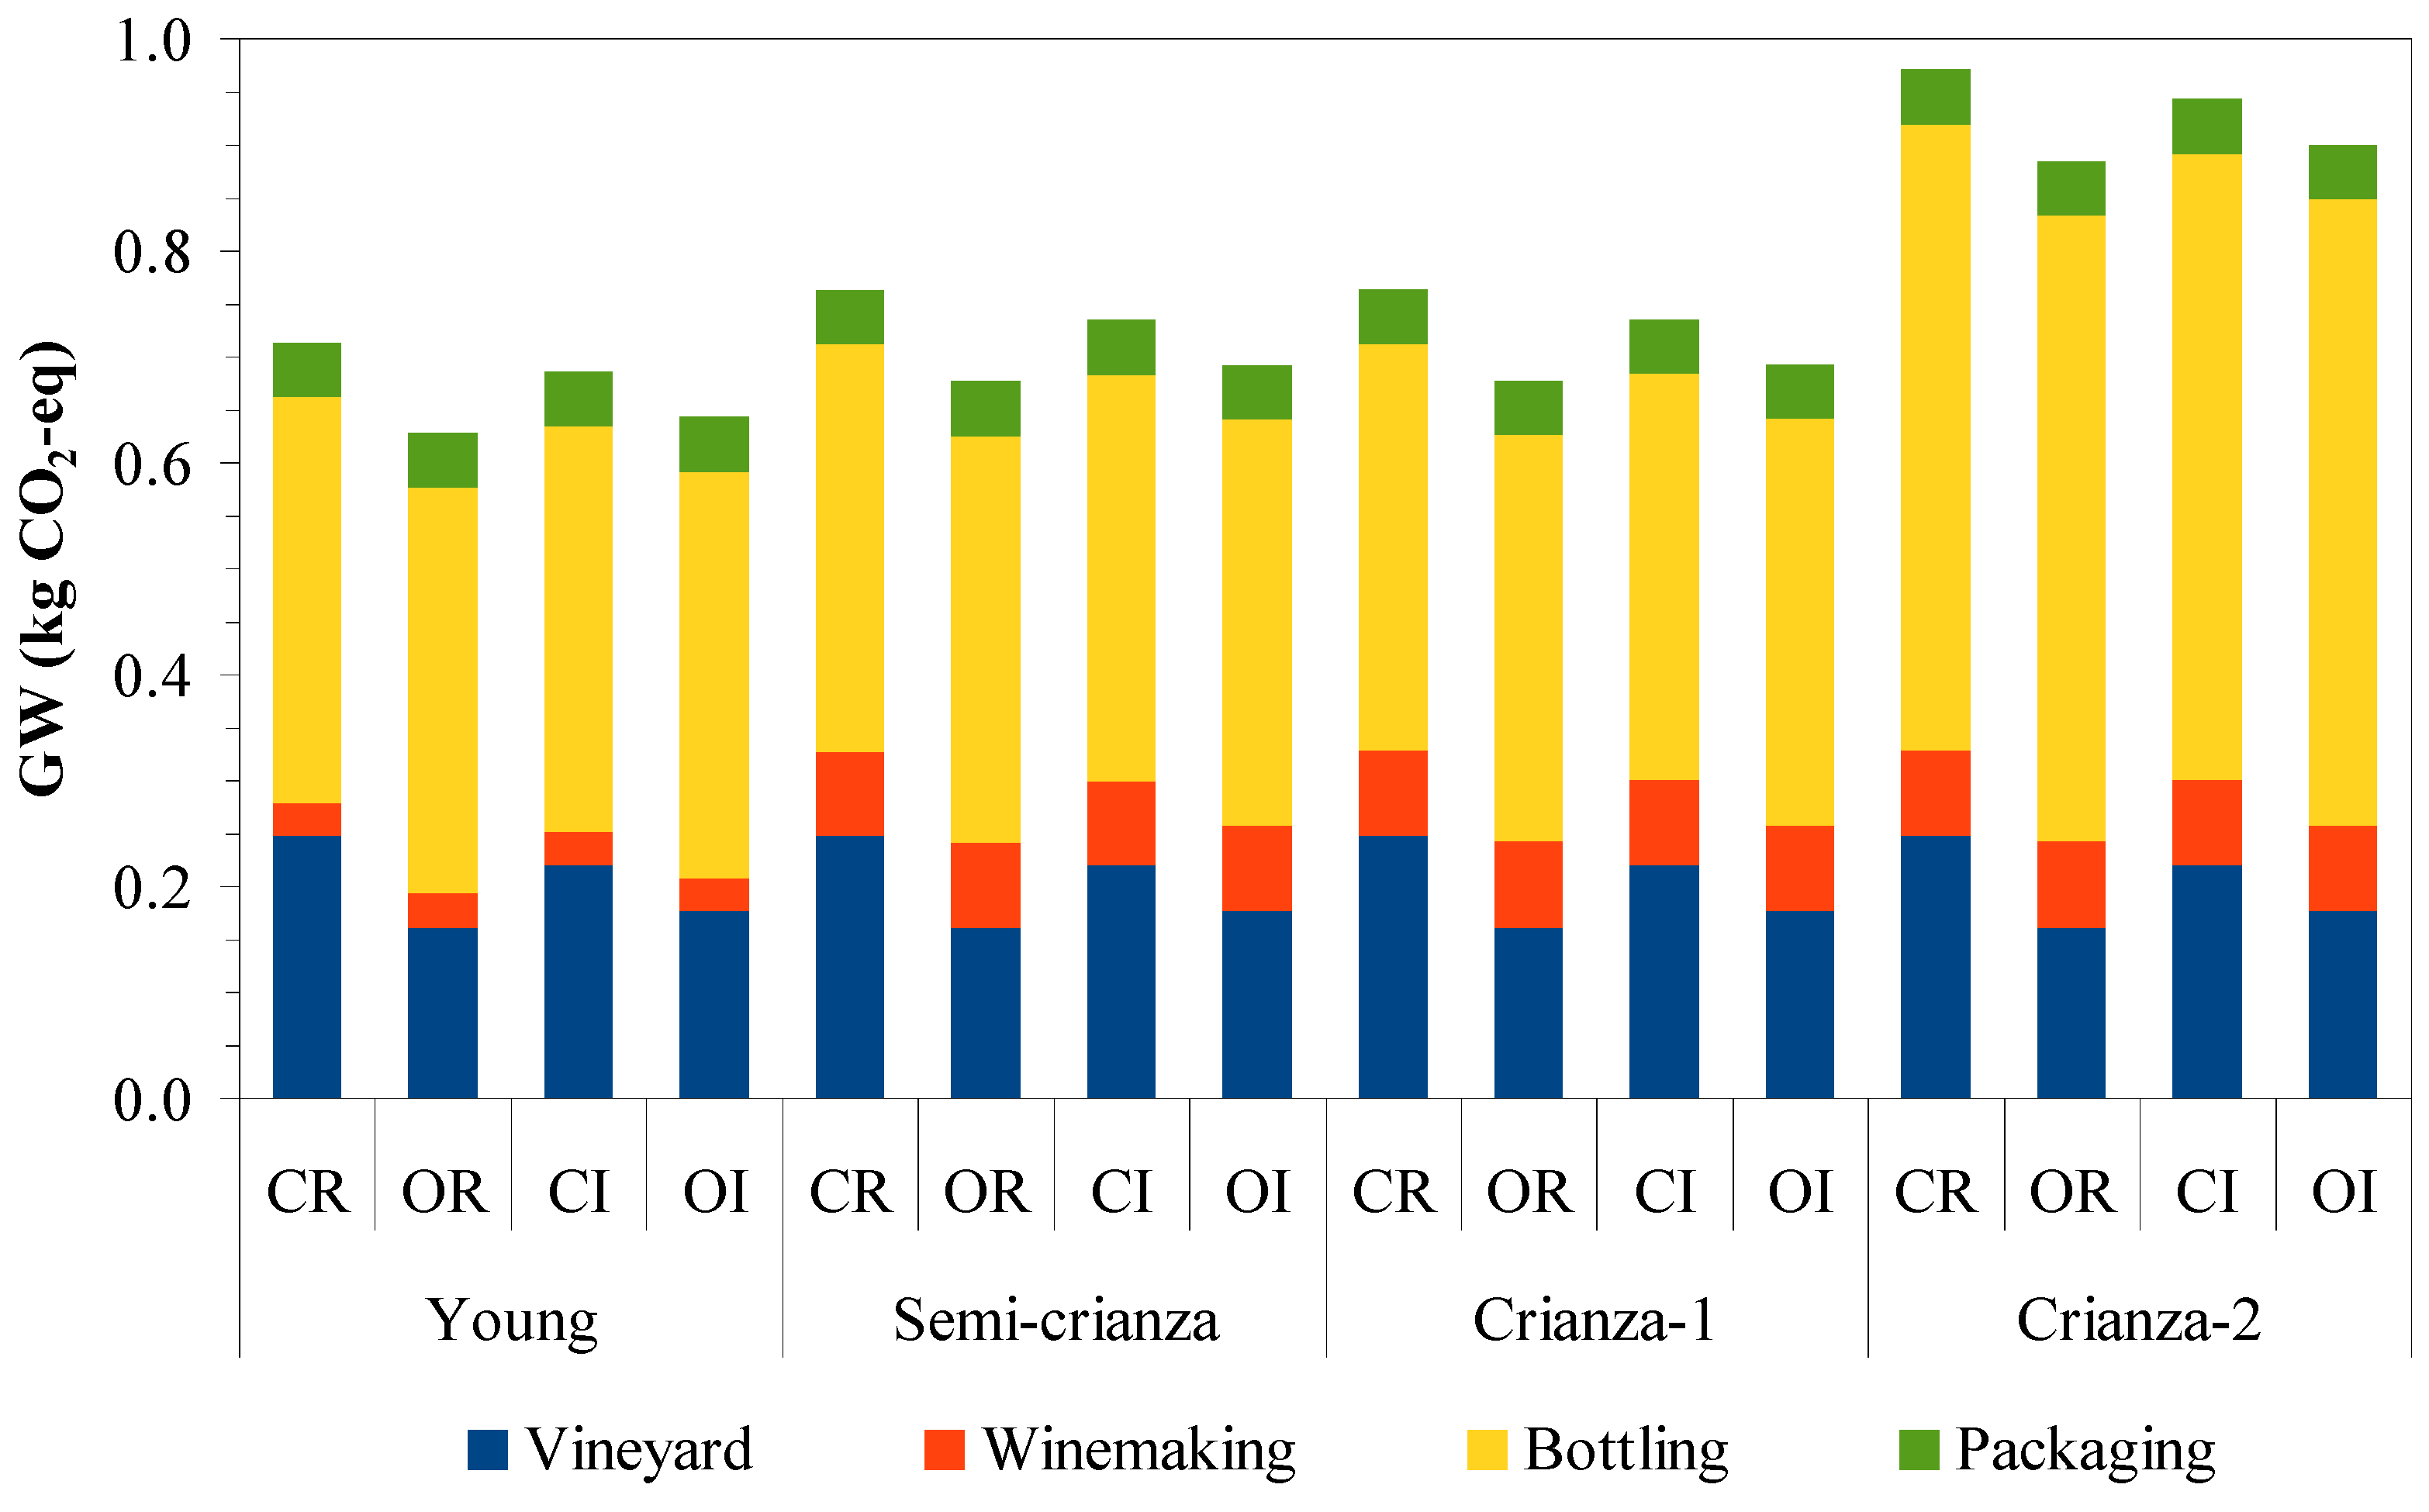
| Wine Type | Crop Type | GW (kg CO2-eq) | Vineyard | Winemaking | Bottling | Packaging |
|---|---|---|---|---|---|---|
| Contribution (%) | ||||||
| Young | CR | 0.714 | 34.74 | 4.42 | 53.70 | 7.14 |
| OR | 0.628 | 25.80 | 5.02 | 61.06 | 8.11 | |
| CI | 0.686 | 32.08 | 4.60 | 55.89 | 7.43 | |
| OI | 0.643 | 27.54 | 4.91 | 59.63 | 7.93 | |
| Semi-crianza | CR | 0.763 | 32.52 | 10.52 | 50.27 | 6.68 |
| OR | 0.677 | 23.95 | 11.86 | 56.66 | 7.53 | |
| CI | 0.735 | 29.95 | 10.93 | 52.19 | 6.94 | |
| OI | 0.692 | 25.60 | 11.60 | 55.43 | 7.37 | |
| Crianza-1 | CR | 0.764 | 32.48 | 10.64 | 50.20 | 6.67 |
| OR | 0.678 | 23.91 | 11.99 | 56.58 | 7.52 | |
| CI | 0.736 | 29.91 | 11.05 | 52.12 | 6.93 | |
| OI | 0.693 | 25.56 | 11.73 | 55.35 | 7.36 | |
| Crianza-2 | CR | 0.971 | 25.55 | 8.37 | 60.84 | 5.25 |
| OR | 0.885 | 18.31 | 9.18 | 66.75 | 5.76 | |
| CI | 0.943 | 23.34 | 8.62 | 62.64 | 5.40 | |
| OI | 0.900 | 19.67 | 9.03 | 65.64 | 5.66 | |
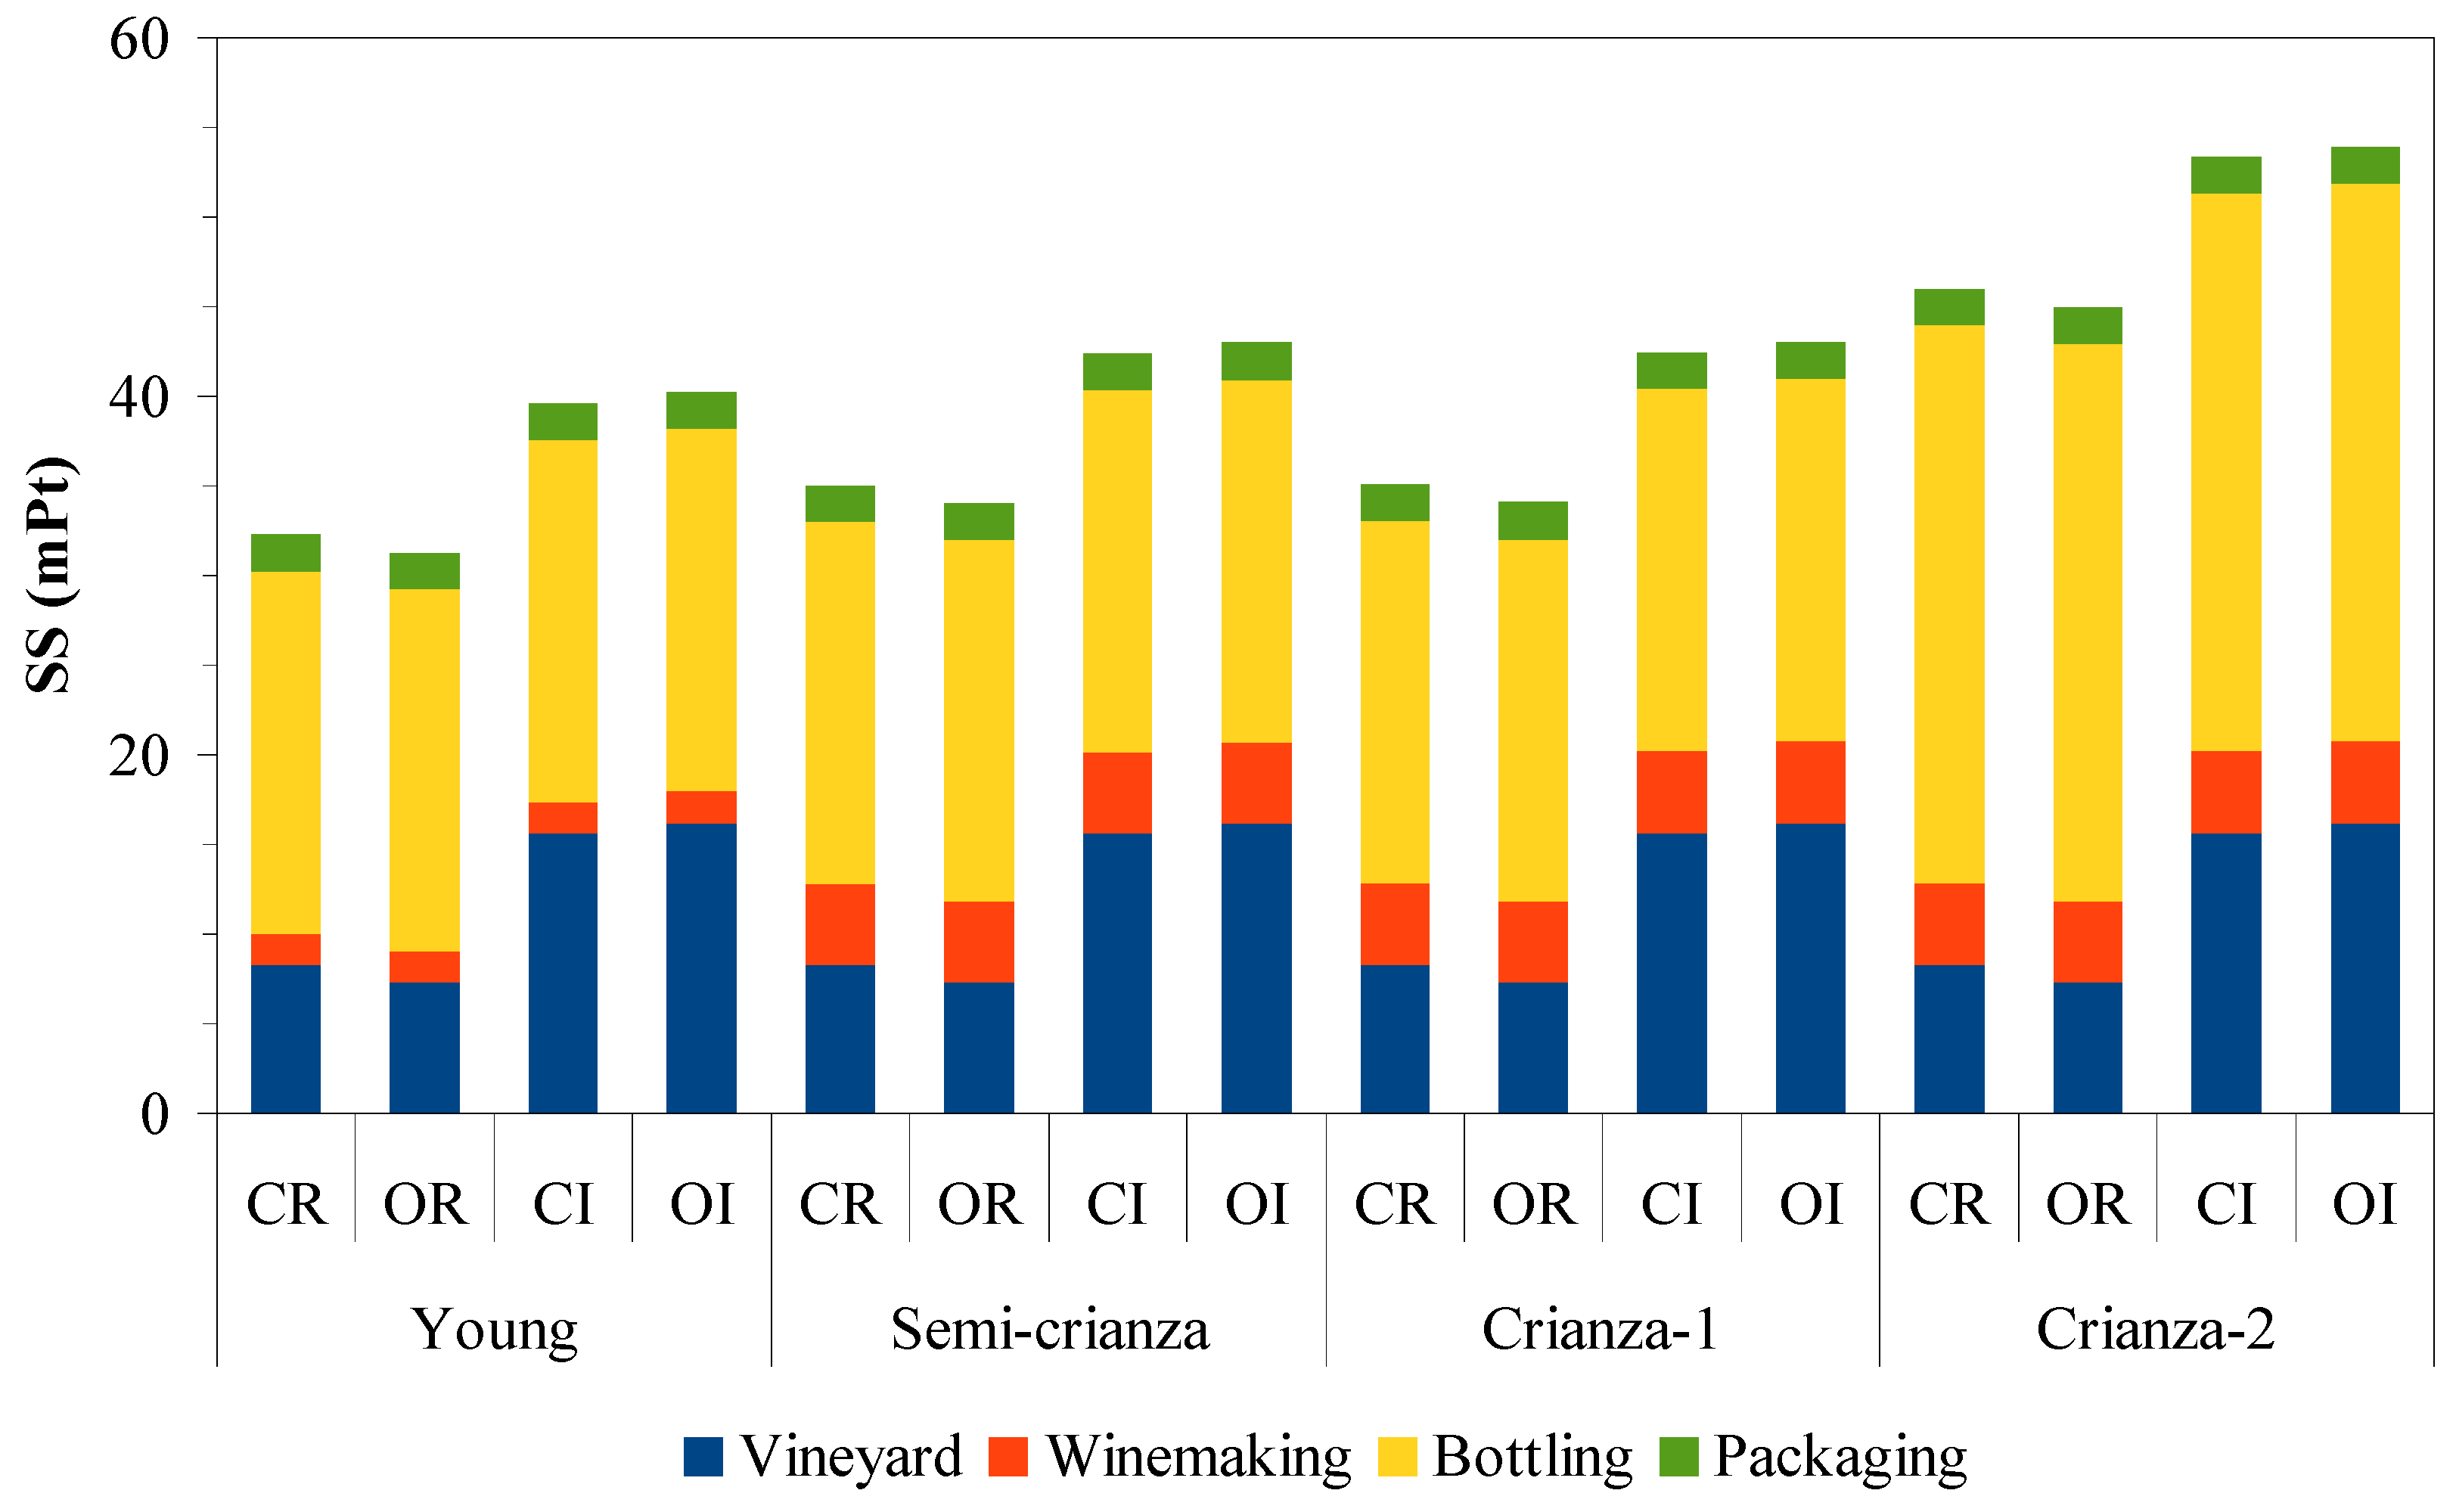
| Wine Type | Crop Type | SS (mPt) | Vineyard | Winemaking | Bottling | Packaging |
|---|---|---|---|---|---|---|
| Contribution (%) | ||||||
| Young | CR | 32.26 | 25.58 | 5.50 | 62.62 | 6.29 |
| OR | 31.27 | 23.22 | 5.68 | 64.61 | 6.49 | |
| CI | 39.62 | 39.41 | 4.48 | 50.99 | 5.12 | |
| OI | 40.22 | 40.31 | 4.41 | 50.23 | 5.05 | |
| Semi-crianza | CR | 35.00 | 23.58 | 12.90 | 57.73 | 5.79 |
| OR | 34.01 | 21.35 | 13.28 | 59.41 | 5.96 | |
| CI | 42.36 | 36.86 | 10.66 | 47.70 | 4.79 | |
| OI | 42.96 | 37.74 | 10.51 | 47.03 | 4.72 | |
| Crianza-1 | CR | 35.06 | 23.54 | 13.04 | 57.63 | 5.78 |
| OR | 34.07 | 21.31 | 13.42 | 59.31 | 5.95 | |
| CI | 42.42 | 36.81 | 10.78 | 47.63 | 4.78 | |
| OI | 43.02 | 37.69 | 10.63 | 46.97 | 4.71 | |
| Crianza-2 | CR | 45.95 | 17.96 | 9.96 | 67.68 | 4.41 |
| OR | 44.96 | 16.15 | 10.18 | 69.17 | 4.51 | |
| CI | 53.31 | 29.28 | 8.58 | 58.33 | 3.80 | |
| OI | 53.91 | 30.07 | 8.49 | 57.68 | 3.76 | |
References
- OIV. State of the World Vine and Wine Sector 2021; International Organisation of Vine and Wine: Paris, France, 2022. [Google Scholar]
- MAPA. Anuario de Estadística. Avance 2021; Ministerio de Agricultura, Pesca y Alimentación (MAPA): Madrid, Spain, 2021.
- AFI. Importancia Económica y Social del Sector Vitivinícola en España; Interprofesional del Vino de España: Madrid, Spain, 2020. [Google Scholar]
- Ferrer, J.R.; Abella-Garcés, S.; Maza-Rubio, M.T. Human Resource Practices and Performance in Small Spanish Wineries, and Their Evolution with Age and Size. Ciência Téc. Vitiv. 2020, 35, 107–119. [Google Scholar] [CrossRef]
- Arcas Lario, N.; Alcón Provencio, F. Contribución de Las Entidades de “Economía Social” a La Gestión Eficiente Del Agua Para Uso Agrícola: Situación En La Región de Murcia. Rev. De Estud. Coop. 2007, 91, 7–33. [Google Scholar]
- Soto García, M.; Martínez Álvarez, V.; Martín Górriz, B. El Regadío en la Región de Murcia. Caracterización y Análisis Mediante Indicadores de Gestión; Sindicato Central de Regantes del Acueducto Tajo-Segura: Murcia, Spain, 2014. [Google Scholar]
- Fraga, H.; García de Cortazar, I.; Malheiro, A.C.; Santos, J.A. Modelling Climate Change Impacts on Viticultural Yield, Phenology and Stress Conditions in Europe. Glob. Chang. Biol. 2016, 22, 3774–3788. [Google Scholar] [CrossRef] [PubMed]
- Resco, P.; Iglesias, A.; Bardají, I.; Sotés, V. Exploring Adaptation Choices for Grapevine Regions in Spain. Reg. Environ. Chang. 2016, 16, 979–993. [Google Scholar] [CrossRef]
- CARM. Estadística Agraria de Murcia 2019/20; Comunidad Autónoma de la Región de Murcia; Consejería de Agua, Agricultura, Ganadería, Pesca, Medio Ambiente y Emergencias: Murcia, Spain, 2021. [Google Scholar]
- García García, J.; Martínez-Cutillas, A.; Romero, P. Financial Analysis of Wine Grape Production Using Regulated Deficit Irrigation and Partial-Root Zone Drying Strategies. Irrig. Sci. 2012, 30, 179–188. [Google Scholar] [CrossRef]
- García, J.G. Actualización de la contabilidad de costes del cultivo de viña en la Región de Murcia. Enoviticultura 2016, 39, 2–9. [Google Scholar]
- García-Castellanos, B.; García-García, B.; García-García, J. Evaluación de la sostenibilidad de tres sistemas de cultivo de viña característicos de la Región de Murcia. ITA Inf. Tec. Econ. Agrar 2021, 118, 137–157. [Google Scholar] [CrossRef]
- Romero Azorín, P.; García García, J. The Productive, Economic, and Social Efficiency of Vineyards Using Combined Drought-Tolerant Rootstocks and Efficient Low Water Volume Deficit Irrigation Techniques under Mediterranean Semiarid Conditions. Sustainability 2020, 12, 1930. [Google Scholar] [CrossRef]
- OJEU. Regulation (EU) No 1151/2012 of the European Parliament and of the Council of 21 November 2012 on Quality Schemes for Agricultural Products and Foodstuffs. Off. J. Eur. Union 2012, 55, 1–29. [Google Scholar] [CrossRef]
- Beccali, M.; Cellura, M.; Iudicello, M.; Mistretta, M. Resource Consumption and Environmental Impacts of the Agrofood Sector: Life Cycle Assessment of Italian Citrus-Based Products. Environ. Manag. 2009, 43, 707–724. [Google Scholar] [CrossRef]
- EEA. Environmental Indicator Report 2012: Ecosystem Resilience and Resource Efficiency in a Green Economy in Europe; European Environment Agency: Copenhagen, Denmark, 2012. [Google Scholar]
- EEA. Annual European Union Greenhouse Gas Inventory 1990–2014 and Inventory Report 2016. Submission to the UNFCCC Secretariat; European Environment Agency: Copenhagen, Denmark, 2016. [Google Scholar]
- COM. The European Green Deal. Communication from the Commission to the European Parliament; European Commission: Brussels, Belgium, 2019. [Google Scholar]
- Kajikawa, Y.; Tacoa, F.; Yamaguchi, K. Sustainability Science: The Changing Landscape of Sustainability Research. Sustain. Sci. 2014, 9, 431–438. [Google Scholar] [CrossRef]
- Strano, A.; De Luca, A.I.; Falcone, G.; Iofrida, N.; Stillitano, T.; Gulisano, G. Economic and Environmental Sustainability Assessment of Wine Grape Production Scenarios in Southern Italy. Agric. Sci. 2013, 04, 12–20. [Google Scholar] [CrossRef]
- Falcone, G.; De Luca, A.I.; Stillitano, T.; Strano, A.; Romeo, G.; Gulisano, G. Assessment of Environmental and Economic Impacts of Vine-Growing Combining Life Cycle Assessment, Life Cycle Costing and Multicriterial Analysis. Sustainability 2016, 8, 793. [Google Scholar] [CrossRef]
- Zhang, C.; Rosentrater, K.A. Estimating Economic and Environmental Impacts of Red-Wine-Making Processes in the USA. Fermentation 2019, 5, 77. [Google Scholar] [CrossRef]
- García García, J.; García García, B. Sustainability Assessment of Greenhouse Pepper Production Scenarios in Southeastern Spain. Agronomy 2022, 12, 1254. [Google Scholar] [CrossRef]
- García Castellanos, B.; García García, B.; García García, J. Evaluation of the Sustainability of Vineyards in Semi-Arid Climates: The Case of Southeastern Spain. Agronomy 2022, 12, 3213. [Google Scholar] [CrossRef]
- Noguera-Muñoz, F.A.; García García, B.; Ponce-Palafox, J.T.; Wicab-Gutierrez, O.; Castillo-Vargasmachuca, S.G.; García García, J. Sustainability Assessment of White Shrimp (Penaeus vannamei) Production in Super-Intensive System in the Municipality of San Blas, Nayarit, Mexico. Water 2021, 13, 304. [Google Scholar] [CrossRef]
- Ferrara, C.; De Feo, G. Life Cycle Assessment Application to the Wine Sector: A Critical Review. Sustainability 2018, 10, 395. [Google Scholar] [CrossRef]
- Amienyo, D.; Camilleri, C.; Azapagic, A. Environmental Impacts of Consumption of Australian Red Wine in the UK. J. Clean. Prod. 2014, 72, 110–119. [Google Scholar] [CrossRef]
- Bosco, S.; Di Bene, C.; Galli, M.; Remorini, D.; Massai, R.; Bonari, E. Greenhouse Gas Emissions in the Agricultural Phase of Wine Production in the Maremma Rural District in Tuscany, Italy. Ital. J. Agron. 2011, 6, 15. [Google Scholar] [CrossRef]
- Vázquez-Rowe, I.; Villanueva-Rey, P.; Iribarren, D.; Moreira, M.T.; Feijoo, G. Joint Life Cycle Assessment and Data Envelopment Analysis of Grape Production for Vinification in the Rías Baixas Appellation (NW Spain). J. Clean. Prod. 2012, 27, 92–102. [Google Scholar] [CrossRef]
- Navarro, A.; Puig, R.; Kılıç, E.; Penavayre, S.; Fullana-i-Palmer, P. Eco-Innovation and Benchmarking of Carbon Footprint Data for Vineyards and Wineries in Spain and France. J. Clean. Prod. 2017, 142, 1661–1671. [Google Scholar] [CrossRef]
- Villanueva-Rey, P.; Vázquez-Rowe, I.; Moreira, M.T.; Feijoo, G. Comparative Life Cycle Assessment in the Wine Sector: Biodynamic vs Conventional Viticulture Activities in NW Spain. J. Clean. Prod. 2014, 65, 330–341. [Google Scholar] [CrossRef]
- Iannone, R.; Miranda, S.; Riemma, S.; De Marco, I. Life Cycle Assessment of Red and White Wines Production in Southern Italy. Chem. Eng. Trns. 2014, 39, 595–600. [Google Scholar] [CrossRef]
- ISO 14040:2006; Environmental Management—Life Cycle Assessment—Principles and Framework. International Organization for Standards (ISO): Geneva, Switzerland, 2006.
- Gazulla, C.; Raugei, M.; Fullana-i-Palmer, P. Taking a Life Cycle Look at Crianza Wine Production in Spain: Where Are the Bottlenecks? Int. J. Life Cycle Assess. 2010, 15, 330–337. [Google Scholar] [CrossRef]
- PRé. Introduction to LCA with SimaPro; PRé: Amersfoort, The Netherlands, 2016. [Google Scholar]
- Benedetto, G. The Environmental Impact of a Sardinian Wine by Partial Life Cycle Assessment. Wine Econ. Policy 2013, 2, 33–41. [Google Scholar] [CrossRef]
- Neto, B.; Dias, A.C.; Machado, M. Life Cycle Assessment of the Supply Chain of a Portuguese Wine: From Viticulture to Distribution. Int. J. Life Cycle Assess. 2013, 18, 590–602. [Google Scholar] [CrossRef]
- Meneses, M.; Torres, C.M.; Castells, F. Sensitivity Analysis in a Life Cycle Assessment of an Aged Red Wine Production from Catalonia, Spain. Sci. Total. Environ. 2016, 562, 571–579. [Google Scholar] [CrossRef]
- Trombly, A.J.; Fortier, M.-O.P. Carbon Footprint of Wines from the Finger Lakes Region in New York State. Sustainability 2019, 11, 2945. [Google Scholar] [CrossRef]
- Flor, F.J.; Leiva, F.J.; García, J.L.; Martínez, E.; Jiménez, E.; Blanco, J. Environmental Impact of Wine Aging Process in Oak Barrels in Wineries of La Rioja (Spain). Am. J. Enol. Vitic. 2018, 69, 302–306. [Google Scholar] [CrossRef]
- De Luca, A.I.; Falcone, G.; Iofrida, N.; Stillitano, T.; Strano, A.; Gulisano, G. Life Cycle Methodologies to Improve Agri-Food Systems Sustainability. Riv. Studi Sulla Sosteniblita 2015, 1, 135–150. [Google Scholar] [CrossRef]
- García García, B.; Rosique Jiménez, C.; Aguado-Giménez, F.; García García, J. Life Cycle Assessment of Gilthead Seabream (Sparus aurata) Production in Offshore Fish Farms. Sustainability 2016, 8, 1228. [Google Scholar] [CrossRef]
- García García, B.; Rosique Jiménez, C.; Aguado-Giménez, F.; García García, J. Life Cycle Assessment of Seabass (Dicentrarchus labrax) Produced in Offshore Fish Farms: Variability and Multiple Regression Analysis. Sustainability 2019, 11, 3523. [Google Scholar] [CrossRef]
- Huijbregts, M.A.J.; Steinmann, Z.J.N.; Elshout, P.M.F.; Stam, G.; Verones, F.; Vieira, M.; Zijp, M.; Hollander, A.; van Zelm, R. ReCiPe2016: A Harmonised Life Cycle Impact Assessment Method at Midpoint and Endpoint Level. Int. J. Life Cycle Assess. 2017, 22, 138–147. [Google Scholar] [CrossRef]
- Borregaard, N.; Medina, J.I.; Carretero, E.; Klemmer, G.; Bordeu, E. Eficiencia Energética y Cambio Climático En El Sector Vitivinicola: Procesos, Herramientas y Ejemplos de Buenas Prácticas; Innova Chile CORFO: Santiago, Chile, 2009. [Google Scholar]
- Pérez Guerra, M.E. Instalación Eléctrica de Una Bodega; Universitat Rovira i Vigili: Tarragona, Spain, 2009. [Google Scholar]
- Vela, R.; Ruiz Mazarrón, F.; Fuentes-Pila, J.; Baptista, F.; Silva, L.L.; García, J.L. Improved Energy Efficiency in Wineries Using Data from Audits. Ciência Téc. Vitiv. 2017, 32, 62–71. [Google Scholar] [CrossRef]
- García García, J.; García García, B.; García Castellanos, B. Manual de Buenas Prácticas Para el Cultivo de la Viña en la Región de Murcia; Grupo operativo QVALITAS: Murcia, Spain, 2021. [Google Scholar]
- Point, E.; Tyedmers, P.; Naugler, C. Life Cycle Environmental Impacts of Wine Production and Consumption in Nova Scotia, Canada. J. Clean. Prod. 2012, 27, 11–20. [Google Scholar] [CrossRef]
- Fusi, A.; Guidetti, R.; Benedetto, G. Delving into the Environmental Aspect of a Sardinian White Wine: From Partial to Total Life Cycle Assessment. Sci. Total. Environ. 2014, 472, 989–1000. [Google Scholar] [CrossRef]
- De Marco, I.; Iannone, R.; Miranda, S.; Riemma, S. Reduction of Carbon Dioxide Emissions during the Vinification Stages of a White Wine Produced in Italy. Chem. Eng. Trns. 2015, 43, 2173–2178. [Google Scholar] [CrossRef]
- Rinaldi, S.; Bonamente, E.; Scrucca, F.; Merico, M.C.; Asdrubali, F.; Cotana, F. Water and Carbon Footprint of Wine: Methodology Review and Application to a Case Study. Sustainability 2016, 8, 621. [Google Scholar] [CrossRef]
- Ferrara, C.; De Feo, G. Comparative Life Cycle Assessment of Alternative Systems for Wine Packaging in Italy. J. Clean. Prod. 2020, 259, 120888. [Google Scholar] [CrossRef]
- Meier, M.S.; Stoessel, F.; Jungbluth, N.; Juraske, R.; Schader, C.; Stolze, M. Environmental Impacts of Organic and Conventional Agricultural Products—Are the Differences Captured by Life Cycle Assessment? J. Environ. Manag. 2015, 149, 193–208. [Google Scholar] [CrossRef]
- Meisterling, K.; Samaras, C.; Schweizer, V. Decisions to Reduce Greenhouse Gases from Agriculture and Product Transport: LCA Case Study of Organic and Conventional Wheat. J. Clean. Prod. 2009, 17, 222–230. [Google Scholar] [CrossRef]
- Ribal, J.; Ramírez-Sanz, C.; Estruch, V.; Clemente, G.; Sanjuán, N. Organic versus Conventional Citrus. Impact Assessment and Variability Analysis in the Comunitat Valenciana (Spain). Int. J. Life Cycle Assess. 2017, 22, 571–586. [Google Scholar] [CrossRef]
- Chatzisymeon, E.; Foteinis, S.; Borthwick, A.G.L. Life Cycle Assessment of the Environmental Performance of Conventional and Organic Methods of Open Field Pepper Cultivation System. Int. J. Life Cycle Assess. 2017, 22, 896–908. [Google Scholar] [CrossRef]
- Petti, L.; Arzoumanidis, I.; Benedetto, G.; Bosco, S.; Cellura, M.; De Camillis, C.; Fantin, V.; Masotti, P.; Pattara, C.; Raggi, A.; et al. Life Cycle Assessment in the Wine Sector. In Life Cycle Assessment in the Agri-food Sector; Notarnicola, B., Salomone, R., Petti, L., Renzulli, P.A., Roma, R., Cerutti, A.K., Eds.; Springer: Cham, Switzerland, 2015; pp. 123–184. [Google Scholar]
- Keyes, S.; Tyedmers, P.; Beazley, K. Evaluating the Environmental Impacts of Conventional and Organic Apple Production in Nova Scotia, Canada, through Life Cycle Assessment. J. Clean. Prod. 2015, 104, 40–51. [Google Scholar] [CrossRef]
- Tuomisto, H.L.; Hodge, I.D.; Riordan, P.; Macdonald, D.W. Does Organic Farming Reduce Environmental Impacts?—A Meta-Analysis of European Research. J. Environ. Manag. 2012, 112, 309–320. [Google Scholar] [CrossRef] [PubMed]

| Category | Quantity |
|---|---|
| Total capacity for the entry of grapes (kg year−1) | 2,000,000 |
| Maximum daily capacity for the entry of grapes (kg day−1) | 125,000 |
| Gross production of wine (dm3) | 1,379,000 |
| Gross production of bottles (units) | 1,838,667 |
| Weight of the green glass bottle (kg) | 0.42 |
| Number of bottles of young wine (%) | 40 |
| Number of bottles of semi-crianza wine (%) | 40 |
| Number of bottles of crianza wine (%) | 20 |
| Time in barrel for semi-crianza wine (months) | 4–6 |
| Time in barrel for crianza wine (months) | 9–12 |
| General | Value | UL | Residual | Amortization | Total Cost (EUR) |
|---|---|---|---|---|---|
| Category 1. Civil works | 956,665 | 30 | 191,333 | 25,511 | 25,894 |
| Category 2. Installations | 214,045 | 30 | - | 7135 | 7,242 |
| Category 3. Process machinery/equipment | 1,801,406 | 15 | 180,141 | 108,084 | 109,706 |
| Category 4. Project, work management, licenses | 229,658 | 30 | - | 7655 | 7770 |
| 3,201,774 | 150,611 | ||||
| Crianza | Value | UL | Residual | Amortization | Total (EUR) |
| Category 1. Civil works | 278,060 | 30 | 55,612 | 7415 | 7526 |
| Category 2. Installations | 62,213 | 30 | 0 | 2074 | 2105 |
| Category 5. Barrels | 1,560,815 | 5 | 234,122 | 265,339 | 269,319 |
| Category 6. Auxiliary equipment for Crianza | 230,305 | 15 | 0 | 15,354 | 15,584 |
| 2,131,393 | 294,534 | ||||
| Total initial inversion/Total annual cost | 5,333,167 | 445,145 |
| Category | Amounts |
|---|---|
| Grape (kg) | 2,000,000 |
| Unit cost of the grape (EUR/kg−1) (1) | 0.43 |
| Winery personnel (no. of workers) (2) | 11.5 |
| Electrical energy (kwh) (3) | 158,759 |
| Diesel (boiler and vehicles) | 4078 |
| Mains water | 4200 |
| Metabisulfite (kg) | 70 |
| Sulfur dioxide gas (dm3) | 42 |
| Yeast (kg) | 280 |
| Pea protein (kg) | 280 |
| Potassium polyaspartate (dm3) | 1400 |
| Bottles: 0.75 dm3, 0.42 kg each (units) | 1,866,667 |
| Cap/capsule/label (units per item) | 1,866,667 |
| Corrugated board box for 6 bottles | 311.111 |
| Maintenance costs (EUR) (4) | 33,124 |
| Insurance and associated fixed taxes (EUR) (5) | 15,562 |
| Fixed taxes (EUR) | 15,562 |
| Payment for the back label CRDO (0.03 EUR/unit) (EUR) | 5600 |
| Unit | Amount | |
|---|---|---|
| Supplies | ||
| Potassium metabisulfite | g | 3.750 × 10⁻³ |
| Sulfur dioxide (liquefied SO2) | g | 2.250 × 10⁻³ |
| Yeast | g | 1.500 × 10⁻² |
| Pea protein | g | 1.500 × 10⁻² |
| Potassium polyaspartate | g | 7.500 × 10⁻⁵ |
| Energy | ||
| Electricity | kwh | 9.340 × 10⁻² |
| Diesel | g | 1.885 × 100 |
| Aging (Semi-crianza) | ||
| Barrel | kg | 2.323 × 10⁻¹ |
| Transportation | tkm | 1.162 × 10⁻¹ |
| Aging (Crianza) | ||
| Barrel | kg | 2.371 × 10⁻¹ |
| Transportation | tkm | 1.186 × 10⁻¹ |
| Bottling | ||
| Green glass bottle | kg | 4.200 × 10⁻¹ |
| Transportation | tkm | 1.680 × 10⁻¹ |
| Pallet | g | 3.079 × 101 |
| Packaging film (LDPE) | g | 9.200 × 10⁻¹ |
| Packaging | ||
| Cork | g | 4.500 × 100 |
| Capsule | g | 1.200 × 100 |
| Paper for label | g | 8.000 × 10⁻¹ |
| Corrugated board | g | 3.783 × 101 |
| Packaging film (LDPE) | g | 1.000 × 100 |
| Category | Absolute Cost (EUR) | Relative Cost (%) |
|---|---|---|
| Fixed asset costs | ||
| Civil works–urbanization | 33,420 | 1.02% |
| Installations, IT, and equipment | 9347 | 0.29% |
| Process machinery–auxiliary equipment | 109,706 | 3.36% |
| Equipment for wine aging | 284,903 | 8.72% |
| Project, construction management, licenses, legalization | 7770 | 0.24% |
| Total fixed costs | 445,145 | 13.63 |
| Working capital costs | ||
| Wine grapes | 881,020 | 26.97% |
| Staff | 343,765 | 10.52% |
| Electric power | 32,228 | 0.99% |
| Diesel oil | 2877 | 0.09% |
| Water | 5158 | 0.16% |
| Inputs (sulfur dioxide, yeasts, clarifiers, etc.) | 21,070 | 0.64% |
| Bottles | 738,920 | 22.62% |
| Packaging/dispatch (caps, labels, boxes, etc.) | 672,607 | 20.59% |
| Payments to C.R. | 56,840 | 1.74% |
| Maintenance of installations, equipment, and machinery | 33,621 | 1.03% |
| Insurance and fixed taxes | 33,621 | 1.03% |
| Total working capital | 2,821,726 | 86.37% |
| Total cost (EUR) | 3,266,871 | 100.00% |
| Cost for young wine (EUR/bottle−1) | 1.59 | |
| Cost for semi-crianza wine (EUR/bottle−1) | 1.79 | |
| Cost for crianza wine (EUR/bottle−1) | 1.99 | |
| Unit cost (EUR/bottle−1) | 1.75 |
| Values | Supplies (%) | Energy (%) | Aging (%) | Bottling (%) | Packaging (%) | Waste Treatment (%) | |
|---|---|---|---|---|---|---|---|
| Young | |||||||
| AD (Sb-eq) | 5.89 × 10⁻⁶ | 0.09 | 5.64 | 89.67 | 5.70 | −1.10 | |
| ADFF (MJ) | 5.43 × 100 | 0.18 | 7.83 | 80.90 | 12.04 | −0.95 | |
| GW (CO2-eq) | 4.64 × 10⁻¹ | 0.19 | 6.60 | 82.53 | 10.97 | −0.29 | |
| OLD (kg CFC-11-eq) | 5.02 × 10⁻⁸ | 0.13 | 5.21 | 89.89 | 7.90 | −3.13 | |
| HT (kg 1,4-DB-eq) | 1.11 × 100 | 0.06 | 2.06 | 95.43 | 2.51 | −0.06 | |
| FWAE (kg 1,4-DB-eq) | 4.81 × 10⁻¹ | 0.15 | 6.64 | 83.17 | 10.10 | −0.06 | |
| MAE (kg 1,4-DB-eq) | 1.32 × 10³ | 0.12 | 4.44 | 80.22 | 15.27 | −0.04 | |
| TE (kg 1,4-DB-eq) | 1.20 × 10⁻² | 0.09 | 2.69 | 95.64 | 1.58 | −0.01 | |
| PO (kg C2H4-eq) | 1.15 × 10⁻⁴ | 0.23 | 7.69 | 81.98 | 10.45 | −0.34 | |
| A (kg SO2-eq) | 2.09 × 10⁻³ | 0.22 | 11.34 | 79.94 | 8.71 | −0.20 | |
| E (kg PO4-eq) | 2.17 × 10⁻³ | 0.12 | 2.50 | 92.12 | 5.26 | −0.01 | |
| Overall contribution (%) | 0.14 | 5.69 | 86.50 | 8.23 | −0.56 | ||
| Semi-crianza | |||||||
| AD (Sb-eq) | 6.33 × 10⁻⁶ | 0.08 | 5.25 | 6.94 | 83.45 | 5.30 | −1.02 |
| ADFF (MJ) | 6.03 × 100 | 0.16 | 7.05 | 9.92 | 72.87 | 10.84 | −0.85 |
| GW (CO2-eq) | 5.13 × 10⁻¹ | 0.17 | 5.97 | 9.49 | 74.70 | 9.93 | −0.27 |
| OLD (kg CFC-11-eq) | 5.52 × 10⁻⁸ | 0.11 | 4.74 | 9.13 | 81.68 | 7.18 | −2.84 |
| HT (kg 1,4-DB-eq) | 1.15 × 100 | 0.06 | 1.99 | 3.40 | 92.19 | 2.42 | −0.06 |
| FWAE (kg 1,4-DB-eq) | 5.37 × 10⁻¹ | 0.13 | 5.96 | 10.30 | 74.60 | 9.06 | −0.05 |
| MAE (kg 1,4-DB-eq) | 1.39 × 10³ | 0.11 | 4.19 | 5.65 | 75.69 | 14.41 | −0.04 |
| TE (kg 1,4-DB-eq) | 1.23 × 10⁻² | 0.09 | 2.63 | 2.10 | 93.64 | 1.55 | −0.01 |
| PO (kg C2H4-eq) | 1.28 × 10⁻⁴ | 0.20 | 6.90 | 10.22 | 73.60 | 9.38 | −0.30 |
| A (kg SO2-eq) | 2.33 × 10⁻³ | 0.20 | 10.20 | 10.04 | 71.91 | 7.83 | −0.18 |
| E (kg PO4-eq) | 2.24 × 10⁻³ | 0.12 | 2.42 | 3.15 | 89.21 | 5.09 | −0.01 |
| Overall contribution (%) | 0.13 | 5.21 | 7.30 | 80.32 | 7.55 | −0.51 | |
| Crianza | |||||||
| AD (Sb-eq) | 6.34 × 10⁻⁶ | 0.08 | 5.24 | 7.07 | 83.33 | 5.30 | −1.02 |
| ADFF (MJ) | 6.04 × 100 | 0.16 | 7.04 | 10.11 | 72.72 | 10.82 | −0.85 |
| GW (CO2-eq) | 5.14 × 10⁻¹ | 0.17 | 5.96 | 9.67 | 74.55 | 9.91 | −0.26 |
| OLD (kg CFC-11-eq) | 5.53 × 10⁻⁸ | 0.11 | 4.73 | 9.30 | 81.53 | 7.17 | −2.84 |
| HT (kg 1,4-DB-eq) | 1.15 × 100 | 0.06 | 1.99 | 3.47 | 92.12 | 2.42 | −0.06 |
| FWAE (kg 1,4-DB-eq) | 5.38 × 10⁻¹ | 0.13 | 5.95 | 10.49 | 74.45 | 9.04 | −0.05 |
| MAE (kg 1,4-DB-eq) | 1.40 × 10³ | 0.11 | 4.18 | 5.76 | 75.60 | 14.40 | −0.04 |
| TE (kg 1,4-DB-eq) | 1.23 × 10⁻² | 0.09 | 2.63 | 2.14 | 93.60 | 1.55 | −0.01 |
| PO (kg C2H4-eq) | 1.28 × 10⁻⁴ | 0.20 | 6.89 | 10.41 | 73.44 | 9.36 | −0.30 |
| A (kg SO2-eq) | 2.33 × 10⁻³ | 0.20 | 10.18 | 10.23 | 71.76 | 7.82 | −0.18 |
| E (kg PO4-eq) | 2.24 × 10⁻³ | 0.12 | 2.42 | 3.22 | 89.16 | 5.09 | −0.01 |
| Overall contribution (%) | 0.13 | 5.20 | 7.44 | 80.21 | 7.53 | −0.51 | |
| RD1 Young vs. Semi-Crianza | RD2 Young vs. Crianza | RD3 Semi-Crianza vs. Crianza | |
|---|---|---|---|
| AD | 7.45 | 7.61 | 0.14 |
| ADFF | 11.02 | 11.25 | 0.21 |
| GW | 10.49 | 10.70 | 0.20 |
| OLD | 10.04 | 10.25 | 0.19 |
| HT | 3.52 | 3.59 | 0.07 |
| FWAE | 11.48 | 11.72 | 0.21 |
| MAE | 5.99 | 6.11 | 0.12 |
| TE | 2.14 | 2.19 | 0.04 |
| PO | 11.38 | 11.62 | 0.21 |
| A | 11.16 | 11.39 | 0.21 |
| E | 3.26 | 3.32 | 0.07 |
| Cultivation System | Grape Yield (kg ha−1) (1) | Cost of the Grape (EUR kg−1) (1) | Young (EUR/ud) | Semi- Crianza (EUR/ud) | Crianza-1 (EUR/ud) (2) | Crianza-2 (EUR/ud) (3) |
|---|---|---|---|---|---|---|
| Rain-fed conventional | 3500 | 0.416 | 1.59 | 1.79 | 1.99 | 2.20 |
| Rain-fed organic | 3250 | 0.422 | 1.60 | 1.80 | 2.00 | 2.21 |
| Irrigated conventional | 8000 | 0.450 | 1.63 | 1.83 | 2.03 | 2.24 |
| Irrigated organic | 7250 | 0.458 | 1.64 | 1.84 | 2.04 | 2.25 |
| Cultivation System | Area (ha) | Employment in Cultivation (AWUc) | Employment in the Winery (AWUw) | Total Employment (AWU) | AWUc/AWUw Ratio |
|---|---|---|---|---|---|
| Rain-fed conventional | 571 | 28.5 | 11.5 | 40 | 2.48 |
| Rain-fed organic | 615 | 30.7 | 11.5 | 42 | 2.67 |
| Irrigated conventional | 250 | 25.0 | 11.5 | 36.5 | 2.17 |
| Irrigated organic | 276 | 24.8 | 11.5 | 36 | 2.16 |
| Crianza-1 Bottle 0.42 kg | Crianza-2 Bottle 0.65 kg | RD (%) | |
|---|---|---|---|
| AD (kg Sb-eq) | 6.34 × 10⁻⁶ | 9.20 × 10⁻⁶ | 45.17 |
| ADFF (MJ) | 6.04 × 100 | 8.40 × 100 | 39.16 |
| GW (kg CO2-eq) | 5.14 × 10⁻¹ | 7.21 × 10⁻¹ | 40.31 |
| OLD (kg CFC-11-eq) | 5.53 × 10⁻⁸ | 7.98 × 10⁻⁸ | 44.15 |
| HT (kg 1,4-DB-eq) | 1.15 × 100 | 1.73 × 100 | 50.28 |
| FWAE (kg 1,4-DB-eq) | 5.38 × 10⁻¹ | 7.55 × 10⁻¹ | 40.47 |
| MAE (kg 1,4-DB-eq) | 1.40 × 10³ | 1.97 × 10³ | 41.17 |
| TE (kg 1,4-DB-eq) | 1.23 × 10⁻² | 1.86 × 10⁻² | 51.18 |
| PO (kg C2H4-eq) | 1.28 × 10⁻⁴ | 1.78 × 10⁻⁴ | 38.89 |
| A (kg SO2-eq) | 2.33 × 10⁻³ | 3.23 × 10⁻³ | 38.75 |
| E (kg PO4-eq) | 2.24 × 10⁻³ | 3.32 × 10⁻³ | 48.58 |
| Vineyard | Young | Semi-Crianza | Crianza-1 | Crianza-2 | |
|---|---|---|---|---|---|
| GW (kg CO2-eq) | |||||
| Rain-fed conventional | 0.248 | 0.714 | 0.763 | 0.764 | 0.971 |
| Rain-fed organic | 0.162 | 0.628 | 0.677 | 0.678 | 0.885 |
| Irrigated conventional | 0.220 | 0.686 | 0.735 | 0.736 | 0.943 |
| Irrigated organic | 0.177 | 0.643 | 0.692 | 0.693 | 0.900 |
| SS (mPt) | |||||
| Rain-fed conventional | 8.252 | 32.257 | 35.000 | 35.057 | 45.954 |
| Rain-fed organic | 7.260 | 31.266 | 34.009 | 34.065 | 44.963 |
| Irrigated conventional | 15.612 | 39.617 | 42.360 | 42.417 | 53.315 |
| Irrigated organic | 16.212 | 40.217 | 42.960 | 43.017 | 53.915 |
Disclaimer/Publisher’s Note: The statements, opinions and data contained in all publications are solely those of the individual author(s) and contributor(s) and not of MDPI and/or the editor(s). MDPI and/or the editor(s) disclaim responsibility for any injury to people or property resulting from any ideas, methods, instructions or products referred to in the content. |
© 2023 by the authors. Licensee MDPI, Basel, Switzerland. This article is an open access article distributed under the terms and conditions of the Creative Commons Attribution (CC BY) license (https://creativecommons.org/licenses/by/4.0/).
Share and Cite
García García, J.; García Castellanos, B.; García García, B. Economic and Environmental Assessment of the Wine Chain in Southeastern Spain. Agronomy 2023, 13, 1478. https://doi.org/10.3390/agronomy13061478
García García J, García Castellanos B, García García B. Economic and Environmental Assessment of the Wine Chain in Southeastern Spain. Agronomy. 2023; 13(6):1478. https://doi.org/10.3390/agronomy13061478
Chicago/Turabian StyleGarcía García, José, Begoña García Castellanos, and Benjamín García García. 2023. "Economic and Environmental Assessment of the Wine Chain in Southeastern Spain" Agronomy 13, no. 6: 1478. https://doi.org/10.3390/agronomy13061478