Abstract
Understanding the physicochemical properties of starch during grain development and the mechanism for resistant starch (RS) accumulation will provide useful information for improving the RS content of wheat. The grains from wheat mutant lines with high RS contents and their corresponding wild-type control were analyzed to characterize the structural and physicochemical properties of wheat starch. A transcriptomic analysis was used to analyze the differentially expressed genes (DEGs) involved in RS accumulation. The results showed that the RS content increased with grain development, along with the total starch content, but a larger increase was observed in the middle and later stages of grain filling. The X-ray diffraction peak intensity and relative crystallinity of starch exhibited the lowest and highest values at 10 days after anthesis, respectively. Regarding the thermal properties of starch, the peak temperature and conclusion temperature generally decreased with grain development; however, the enthalpy values showed no apparent regularity. Compared to control cultivar ZM22, the RS639 and RS683 lines with high RS contents showed high amylose contents and high relative crystallinity and a large proportion of 2.0~9.8 µm starch granules. Furthermore, the transcriptomics analysis revealed that the average relative expression of the glucan-branching enzyme (GBE) α-1,4 glucan phosphorylase (Pho) and starch synthase (SS) in ZM22 was 2.47-, 2.70-, and 2.56-fold higher than that in RS639, respectively; which indicates that the downregulation of the expression of genes encoding GBE, Pho, and SS in wheat grain promotes the accumulation of RS.
1. Introduction
Starch is the major constituent of wheat grains and the most important dietary source of carbohydrates for humans. According to its digestion rate, starch has been classified into three fractions: rapidly digestible starch (RDS), slowly digestible starch (SDS), and resistant starch (RS) [1]. RS refers to the starch and its degradation products that are not digested and absorbed by the small intestine of healthy individuals [2]. The undigested RS reaches the large intestine and is fermented into short-chain fatty acids by the microflora inhabiting that region of the gut [1]. RS has been classified into five types: physically inaccessible starch (RS1), native granule starch (RS2), retrograded starch (RS3), chemically modified starch (RS4), and the amylose–lipid complex (RS5) [3]. Of these five types, RS3, which is formed after gelatinization and retrogradation, is of particular interest because of its thermal stability allowing it to be used in a wide variety of conventional foods [4]. RS has a wide range of health benefits, including the prevention of several diseases, such as colon cancer, chronic kidney and liver disease, and type 2 diabetes [5,6]. Thus, improving the RS content in cereal crops would be a feasible approach to improving human health.
RS exists in many starchy foods. Previous studies have shown that the content of RS is significantly positively correlated with that of amylose [7,8]. However, some studies have revealed that cultivars with similar amylose contents have varied RS contents and digestive characteristics [9,10]. Starch is deposited as B-type granules (diameter < 9.9 μm) and as A-type granules (diameter > 9.9 μm) in mature wheat grains. Due to the differences in starch granule structures, gelatinization characteristics, the proportions of long chains, and susceptibility to enzymatic digestions, type A and type B starch granules make different contributions to the increase in RS content [11,12]. Chung et al. [13] found that the digestibility (RDS, SDS, and RS) of rice starch was significantly correlated with the amylose content, the proportion of chain length distribution (CLD) at degrees of polymerization (DP) 6–12 and DP 13–24, and relative crystallinity (p ≤ 0.05). The formation of RS is influenced not only by starch properties (e.g., granule structure, crystal structure, and amylose content) but also by the levels of non-starch components (e.g., lipids, proteins, and sugars) [3].
Wheat (Triticum aestivum L.) is widely cultivated worldwide, and it is the staple food of people in many countries. In recent years, RS has received increasing attention from researchers because of its potential health benefits. Moreover, genotypes, environment, and cultivation measures exert a significant influence on the RS content of wheat flour [8,14]. Pang et al. [15] reported that the inheritance of RS content fitted the additive–dominance model and that the degree of dominance was super dominance. Water deficit significantly reduces the RS content of wheat grain and the particle size distribution of RS prepared by dual autoclaving-retrogradation treatment, whereas high N fertilizer application significantly improves the RS content [14]. Starch is synthesized through a series of enzymatic reactions, and the genes encoding these enzymes play important roles in determining the starch content and characteristics [16]. Previous studies have found that mutations in the SBE or SS gene induce an increase in the amylose and RS content [17,18]. The grain-filling stage that involves changes in the kernel morphology, dry matter content, and content of various nutritional components is an important stage for grain development. However, little information is available regarding the structural and physiological properties of wheat starch varying in the RS content during grain development. In the present study, the grains from two mutant wheat lines with high RS contents screened from the EMS mutant library and their corresponding wild-type control were analyzed during the filling stage to characterize the structural and physiological properties of wheat starch. A transcriptomic analysis was used to analyze the differentially expressed genes (DEGs) involved in RS accumulation. The findings of this study will provide new insights into the formation of RS and its properties in different wheat cultivars.
2. Materials and Methods
2.1. Plant Materials and Experimental Design
Two winter wheat lines, namely “RS683” and “RS639” with high RS contents, which were screened from the wheat ethyl methane sulfonate (EMS) mutant library, and their corresponding wild-type wheat cultivar “ZM22” were used in this study. The wheat EMS mutant pool was constructed by treating seeds of ZM22 with the chemical agent EMS. The RS contents of the grains of the M7 and M8 generations with agronomic traits close to wild-type ZM22 were determined, and the lines with high RS contents were screened. The corresponding agronomic traits of the tested wheat cultivars (lines) in this study are listed in Table S1. Wheat seeds were sown during the 2019–2020 growing season at Henan Agricultural University Experimental Station, Zhengzhou, Henan Province, China (34°44′ N, 113°42′ E). The seeds were sown at a planting density of 225 seeds/m2 on 17 October 2019, and each plot consisted of 12 rows of 5 m in length and 3 m in width. The experiment was conducted as a randomized block design with three replicates. Field trials were managed according to local agronomic practices.
At the flowering stage, wheat spikes of the same size undergoing anthesis on the same day were tagged. The tagged wheat spikes were harvested at 10, 20, and 30 days after anthesis (DAA), representing the early, middle, and late stages of grain filling and maturity. For each sample, 1–2 grains at the base of the middle spikelet were harvested and divided into two parts: one part was immediately frozen in liquid nitrogen and stored in a −80 °C refrigerator for RNA-seq analysis, and the other part was dried by a forced convection drying oven. Wholegrain wheat flour samples were ground by a Cyclotec Sample Mill (Foss Tecator AB, Hӧganӓs, Switzerland) to pass through a 1.0 mm sieve.
2.2. Sampling and Trait Measurements
2.2.1. Measurements of Starch, Amylose, Amylopectin, and RS Contents
The total starch and amylose contents of the wholegrain flour were analyzed according to the method of He [19]. The content of amylopectin was calculated as the total starch content minus the amylose content. The RS contents of wholegrain flour were measured using the K-RSTAR assay kit (Megazyme, Wicklow, Ireland) according to the manufacturer’s recommended protocol. Briefly, the samples (100 mg) were weighted into a 15 mL tube. An aliquot (4.0 mL) of amylopsin (10 mg/mL) containing AMG (3 U/mL) was added and the contents mixed thoroughly with a vortex mixer for 5 s. Then, the tubes were placed in a water bath at 37 °C for 16 h. An aliquot (4.0 mL) of ethanol (99%) or IMS (99%, v/v) was added to each tube, and the tubes were centrifuged at 1500× g for 10 min. Then, the supernatant solutions were carefully decanted. The pellets were resuspended in 2 mL of 50% (v/v) ethanol or IMS and mixed with a vortex mixer. After centrifugation at 1500× g for 10 min, the supernatant solutions were decanted. The residues were resuspended in 2 mL of 2 M KOH in an ice bath for 20 min. After that, an aliquot (8 mL) of 1.2 M sodium acetate buffer (pH 3.8) was added to each tube. AMG (0.1 mL, 3300 U/mL) was immediately added, and the tubes were placed in a water bath at 50 °C for 30 min. After centrifugation at 1500× g for 15 min, an aliquot (0.1 mL) of the supernatant solution was transferred to another tube, 3 mL of GOPOD reagent was added to the mix, and the tube was incubated at 50 °C for 30 min. The glucose standards and reagent blank solution were also prepared. The absorbance of each solution was measured at 510 nm.
2.2.2. Starch Extraction and Size Distribution of Starch Granules
Starch was extracted from the wheat grains according to the method of Peng et al. [20], with some modifications. The wheat kernels (3 g) were steeped in 40 mL of 0.5 M NaCl at 4 °C for 16 h. The grains were then ground with a mortar and pestle until all the starch granules were released. The slurry was filtered through a 74-μm screen and centrifuged at 3500× g for 5 min to obtain a crude starch pellet. The crude starch was purified three times by washing each with 5 mL of 2 M NaCl, 2% SDS, and double-distilled water. Finally, the starch was washed once with acetone to remove the water, air-dried at room temperature, and stored at −20 °C. The starch particle size was determined using an LS 13 320 laser diffraction particle size analyzer (Beckman Coulter, Brea, CA, USA). The starch granule samples (0.1 g) were mixed with 10 mL of distilled water and put under 4 °C for 1 h with shaking every 10 min; then, the mixture was transferred to the dispersion box of the laser diffraction particle size analyzer to determine the distribution of the starch granules. The results were calculated using the software carried by the instrument itself according to the manufacturer’s method.
2.2.3. X-ray Diffraction (XRD)
The starch powders were scanned through the 2θ of 5–40° by using an X-ray diffractometer (MiniFlex 600, Rigaku, Tokyo, Japan). The testing conditions were as follows: power ≥ 600 W; rated pipe voltage: ≥40 kV; rated tube current: ≥15 mA, radiation > 0.5 Sv/h, and rotation mode: θ/2θ; and scanning speed: 1.2°/min, step size: 0.02°, and minimum readable step size: ≤0.001. The degree of crystallinity of the samples was estimated and analyzed following the method of Kuang et al. [21]. The relative crystallinity was evaluated from the ratio of the area of the peaks to the total area of the diffractogram (2θ) by using Jada 5.0 software.
2.2.4. Thermal Properties of Starch
The thermal properties of the starch were analyzed using a differential scanning calorimeter (Q10, TA Instruments, New Castle, DE, USA). The starch samples (2.5 mg) were mixed with a mass of water triple that of the sample and sealed in an aluminum pan at 4 °C overnight, then heated from 20 to 120 °C at the heating rate of 10 °C/min. An empty aluminum pan was used as a reference. The following parameters were measured: onset temperature, peak temperature, conclusion temperature, and gelatinization enthalpy.
2.2.5. Chain Length Distribution (CLD)
A starch sample (5 mg) was dispersed in 5 mL of double-distilled water. The mixture was boiled in boiling water for 60 min. Next, 2.5 mL of the gelatinized sample was taken, and 125 μL of sodium acetate, 5 μL of NaN3, and 5 µL of isoamylase were added to the sample; the mixture was then incubated at 38 °C for 24 h. Next, 600 μL of the mixture were placed in another tube and dried under nitrogen. Finally, the dried sample was dissolved into 600 μL for the mobile phase solution. After centrifugation for 5 min at 15,000× g, the supernatant was subjected to ion chromatography Thermo ICS5000+ (Thermo Fisher Scientific, Waltham, MA, USA) with the chromatographic column Dionex CarboPac PA10 (250 × 4.0 mm, 10 µm). Mobile phase A was 200 mm NaOH, and mobile phase B was 200 mm NaOH/200 mm NaAc.
2.2.6. Scanning Electron Microscopy (SEM)
The starch granules were examined by SEM. The samples were mounted on a double-sided carbon tape, coated with gold, and viewed under a D-3400 scanning electron microscope (Hitachi High-Tech Science Corporation, Tokyo, Japan) operating at 3 kV.
2.2.7. RNA-Seq Analysis
TRIzol reagent (Invitrogen, Carlsbad, CA, USA) was used to extract RNA from wheat grains of ZM22 and RS639 sampled at 20 and 30 DAA. Each RNA sample had three biological replicates. Magnetic beads containing Oligo (dT) were used to enrich the extracted mRNA. In total, 12 independent endosperm cDNA libraries were constructed according to Illumina’s TruSeq RNA sample preparation. The RNA-seq analysis was performed by LC Bio (Hangzhou, China). The raw sequence reads were aligned against the wheat genome (ftp://ftp.ensemblgenomes.org/pub/release-5/plants/fasta/Triticum_aestivum/dna (accessed on 1 November 2020)) by using HISAT, and the gene ontology (GO) and Kyoto Encyclopedia of Genes and Genomes (KEGG) enrichment analyses were performed according to the protocol of LC Bio (https://www.lc-bio.cn/ (accessed on 1 November 2020)). The expected number of fragments per kilobase of the transcript sequence per million base pairs sequenced (FPKM) was used to identify and normalize the expression levels of the identified genes. p-value ≤ 0.05 and |log2FC| ≥ 1 were defined as the thresholds to identify the DEGs between the different test groups.
2.2.8. Statistical Analysis
The statistical analyses were performed as three biological replicates by using SPSS 19.0 software (Statistical Program for Social Science), and the data were presented as the mean ± standard deviation. A one-way analysis of variance (ANOVA) and Turkey’s test were used to determine statistically significant differences in the means at p < 0.05.
3. Results and Discussion
3.1. Accumulation of Total Starch, Amylose, Amylopectin, and RS in Wheat Grains
The contents of total starch, amylose, and amylopectin in wheat grains showed an increasing tendency during kernel development (Table 1). A large increase in the starch content was observed from 10 DAA to 20 DAA, indicating that the starch content had faster growth during the stage of grain filling and a slower growth during the late stage. This starch accumulation pattern was mainly related to the different expression levels of enzyme activities related to starch biosynthesis [22]. RS showed a trend similar to that of the total starch and its component contents during grain development. The RS content increased with grain development, but a larger increase was observed in the middle and later stages of grain filling, which agreed with a previous report [23]. The increase in RS may result from the increase in amylose and the total starch content. Of course, the changes in the starch physiochemical properties could not be excluded. Wang et al. [24] also found that the RS content of a cultivar with a high RS content increased gradually with the development of grain filling but that of H189 (a low RS content cultivar) was relatively stable beyond 25 DAA.

Table 1.
Accumulation of the starch component and resistant starch during wheat grain development.
The comparison of different cultivars showed that RS639 had the highest total starch content, and RS683 had the lowest total starch content during kernel development. The amylose contents of RS683 and RS639 were higher than that of ZM22 during the growth stage (except for 30 DAA). At maturity, the amylose contents of RS683 and RS639 increased by 9.28% and 12.58%, respectively, as compared to that of ZM22. No significant difference in the RS content was observed among these tested cultivars at 10 DAA. However, RS683 and RS639 had significantly higher RS contents than ZM22 from 20 DAA to maturity. Compared to ZM22, the RS contents of RS683 and RS639 increased by 136.84% and 75.60% at maturity, respectively. The trend of the RS and amylose contents was consistent among the different varieties during grain development, indicating that the RS content is related to the amylose content. Similar results were reported by Wang et al. [8] and Xia et al. [14], wherein the RS content was significantly positively correlated with the amylose content. Hoebler et al. [25] reported that the addition of amylose in dough increased the RS content, and the RS fraction was mainly composed of crystalline amylose.
3.2. CLD of Starch during Kernel Development
The degree of polymerization showed a single peak curve, and the highest peak appeared at DP 9–11 (Figure 1). In the grain-filling stage, the highest peak value of the polymerization degree increased. The average highest peak values were 1.302, 1.441, and 1.986 nc*min at 20 DAA, 30 DAA, and the maturity stage, respectively. Based on the amylopectin cluster model, the CLD of amylopectin was divided into four fractions: A (DP 6–12), B1 (DP 13–24), B2 (DP 25–36), and B3 (DP > 36), of which the A and B1 chains accounted for more than 90% [26]. Here, the A and B1 chains were the major fractions, which accounted for 30.05~42.40% and 40.05~48.65%, respectively (Table 2). A comparison of the CLD among the different wheat cultivars revealed that ZM22 had a higher A chain (DP 6–12), while RS683 and RS639 had other higher chains at 20 DAA. However, RS683 and RS639 showed different CLD at 30 DAA and maturity. For example, RS639 had higher B1, B2, and B3 chains, and ZM22 had a higher A chain, whereas the CLD showed no significant difference between RS683 and ZM22. A previous study showed that, with the increase in the amylose content, the contents of fb2 (DP 25–36) and fb3 (DP ≥ 37) increased, which improved the starch stability [27]. It is also generally agreed that the medium and long chains of amylopectin are positively correlated with the RS content [28,29]. The inconsistency in CLD between RS683 and RS639 at the later grain-filling stage suggested that the influence of CLD on RS formation may be weaker than that of the other factors for the tested cultivars in this study.
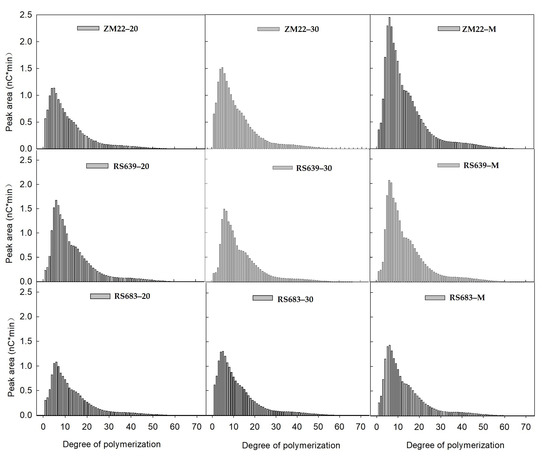
Figure 1.
Chain length distribution of starch during kernel development. ZM22–20, ZM22–30, and ZM22–M represent cultivar ZM22 at 20 days after anthesis (DAA), 30 DAA, and the maturity stage, respectively. RS639–20, RS639–30, and RS639–M represent RS639 at 20 DAA, 30 DAA, and the maturity stage, respectively. RS683–20, RS683–30, and RS683–M represent RS683 at 20 DAA, 30 DAA, and the maturity stage, respectively.
Table 2.
Chain length distribution of starch during grain development.
3.3. XRD of Starch during Kernel Development
According to the presence of a peak at a certain angle, there are three types of XRD patterns of plant starch crystals: A type, B type, and C type. The XRD profiles of wheat starch during kernel development are shown in Figure 2. There were five peaks of the wheat starch XRD profiles during the entire grain-filling process, with the diffraction peak at 2θ ≈ 15°, 17°, 18°, 20°, and 23°, which were in agreement with the findings of Li et al. [30]. The relative intensity of the peak at 2θ ≈ 23° was higher, while the relative intensity of the peak at 2θ ≈ 15° was lower; a strong doublet was observed around 2θ ≈ 17° and 18°. These results indicate that wheat kernel starch had the typical A-type crystal characteristic [30,31], and this characteristic existed from the grain formation stage (10 DAA) until kernel development. It also reported that the peak at 2θ ≈ 20° was the amorphous peak of amylose and the lipids. A higher peak intensity indicates a higher content of amylose and lipids in the starch [32]. In addition, the relative intensity of the peak showed the lowest value at 10 DAA and a higher value after 20 DAA; this finding suggests that the stability of starch crystals undergoes some changes during filling. A comparison of the relative intensity of different wheat cultivars revealed that ZM22 had the lowest relative intensity at 20 and 30 DAA and at maturity, which indicates that the crystal cell structure or microcrystalline arrangement of the starch crystal zone differs among the tested wheat lines.
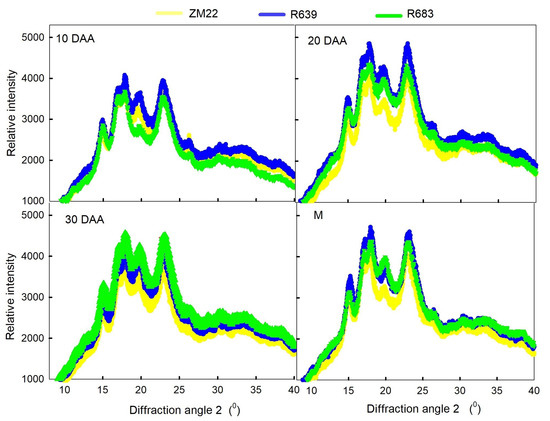
Figure 2.
X-ray diffraction profiled of wheat starch during grain development. DAA, days after anthesis; M, the maturity stage.
As shown in Table 3, RS639 and RS683 had a higher relative crystallinity than ZM22 during kernel development. At maturity, the relative crystallinity in RS639 and RS683 was 2.19-fold and 1.54-fold that of ZM22, respectively. The high relative crystallinity indicates that the starch in RS639 and RS683 has a more ordered crystal structure and stability; this finding suggests that a high relative crystallinity is a factor in a high RS content. The relative crystallinity of starch is positively correlated with the RS content according to previous studies [14,33].
Table 3.
Relative crystallinity of wheat starch during grain development (%).
3.4. Size Distribution of Starch Granules
The wheat endosperm starch granules are generally classified into three types according to the granule size: A type (>9.8 µm), B type (2.0~9.8 µm), and C type (<2.0 µm). As shown in Table 4, A-type starch granules had a higher distribution percentage at the early grain-filling stage. For example, the average volume distribution of A-type granules of the three cultivars was 64.61%, 69.87%, 64.41%, and 63.29% at 10 DAA, 20 DAA, 30 DAA, and maturity, respectively. The corresponding surface area distribution was 19.61%, 22.21%, 20.06%, and 19.37%, respectively, while the grain number distribution was 0.13%, 0.14%, 0.14%, and 0.12%, respectively. The distribution profiles were associated with the formation times of the different starch granules. A-type granules that were larger in size (>9.8 μm) initiated early during the grain-filling period, while B-type granules that were smaller in size (<9.8 μm) initiated at 12–14 DAA [20,34].
Table 4.
Starch granule distribution of wheat grain during grain development.
Regarding the starch granule distribution among the different wheat cultivars (lines), RS638 and RS639 had significantly higher surface area distributions and number distributions of B-type granules (2.0~9.8 μm) than that of ZM22 during the entire grain-filling stage. For the C-type granules, ZM22 had a significantly higher surface area distribution than that of RS639 and RS683, except at the maturity stage. Higher B-type granules might contribute to RS accumulation, as the proportion of B granules was positively correlated with RS and amylose [35]. Several studies have also reported that A granules make minor contributions to the increase in the RS content [12,35].
3.5. SEM of Starch Granules
Scanning electron micrographs of starch granules from RS639 and ZM22 at 10 DAA, 20 DAA, 30 DAA, and maturity are shown in Figure 3. A-type and B-type starch granules showed different morphologies, wherein A-type granules showed a disk-like shape with indentations on the surface of most granules, and B-type granules exhibited spherical, ellipsoidal, and angular and irregular shapes; these findings are in agreement with the report by Lu et al. [36]. No significant difference was observed in starch granule morphology between the two cultivars (lines). The results indicate that the morphologies of the starch granules might not be the reason for the differences in their RS contents but, rather, the sizes of the granules. Furthermore, the morphologies of the A-type and B-type granules at 10 DAA were the same as those at maturity, thus indicating that particle size distribution, not the morphologies, varies during the grain-filling process.
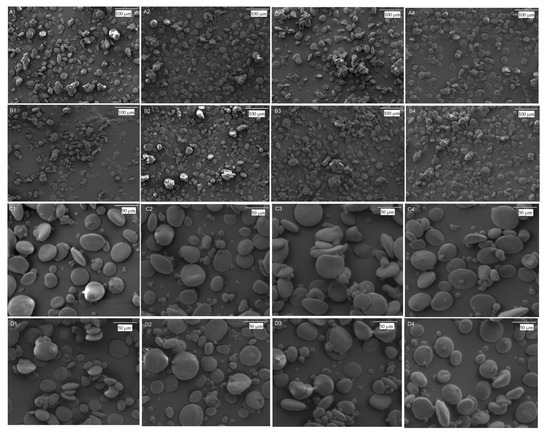
Figure 3.
Starch granule morphologies observed by scanning electron microscopy. (A1–A4) represent RS639 at 10 days after anthesis (DAA), 20 DAA, 30 DAA, and the maturity stage, respectively. (B1–B4) represent ZM22 at 10 DAA, 20 DAA, 30 DAA, and the maturity stage, respectively. (C1–C4) represent RS639 at 10 DAA, 20 DAA, 30 DAA, and the maturity stage, respectively. (D1–D4) represent ZM22 at 10 DAA, 20 DAA, 30 DAA, and the maturity stage, respectively.
3.6. Thermal Properties of Starch during Kernel Development
As shown in Table 5, the peak temperature (Tp) and the conclusion temperature (Tc) showed a decreasing tendency with the grain development, and the highest temperatures were 69.81 °C and 73.85 °C, respectively. The change in the thermal properties might be related to the starch ingredients, granule size distribution, and relative crystallinity during grain development, as the starch components and their properties significantly influenced the thermal properties of the starch [37,38]. Changing the compositions of the starch granules could affect the starch properties, and the effect of A-type granules on the thermal properties was higher than that of the addition of B-type and C-type granules [31]. A comparison among the different wheat cultivars (lines) showed that RS683 had the highest Tp at 10 and 30 DAA, while ZM22 had the highest value at 20 DAA and maturity. RS683 had the highest Tc during the grain-filling stage, while ZM22 had the lowest value (except at 10 DAA). At maturity, the Tc of RS683 and RS639 were 3.41- and 1.14-fold higher than that of ZM22, respectively, thus indicating that cultivars with high RS contents might have lower To and higher Tc values. According to Zhu et al. [39], the Tp and Tc values are positively correlated with the amylose content. Here, we found that RS683 and RS639 with higher amylose contents had higher Tc values. The gelatinization enthalpy value of ZM22 was significantly higher than that of RS639 and RS683 during the grain development stage, and the value was 3.16-fold and 2.25-fold higher than that of RS639 and RS683, respectively, at maturity. These results indicate that RS639 and RS683 may require low energy consumption for gelatinization. The results of Zi et al. [40] indicated that Tc with a range of 68.5–69.6 °C could be considered an index for desirable bread and noodle quality. Here, we found that the TC of only RS683 was close to 68.5 °C. However, previous results showed that improving the RS content could affect the noodles and bread-making quality [41,42]. The quality evaluation of noodles and steamed bread made from R683 needs to be further studied.
Table 5.
Thermal properties of starch during grain development.
3.7. DEGs Involved in RS Accumulation
The wheat grains of RS639 and ZM22 at 20 DAA and 30 DAA were sampled and subjected to an RNA-seq analysis. The valid reads ranged from 43,734,654 to 54,138,682, representing 94.00–98.77% of the total reads. The KEGG pathway enrichment analysis showed that the top 20 pathways included photosynthesis, DNA replication, starch and sucrose metabolisms, etc. (Figure 4). This study primarily focused on the transcripts involved in RS accumulation in wheat grains. Thus, the genes involved in starch and sucrose metabolism were primarily targeted, because the accumulation of RS is mainly involved in starch synthesis [3]. A total of 125 DEGs involved in starch and sucrose metabolisms were identified in RS639, including 81 genes downregulated as compared to those in ZM22 at 20 DAA (Supplementary Table S2). Of these 81 genes, 7 genes encoded the 1,4-α-glucan branching enzyme (GBE), 5 genes encoded α-1,4 glucan phosphorylase (Pho), 25 genes encoded glucanase, 7 genes encoded sucrose synthase, and 1 gene encoded starch synthase (SS). Additionally, 97 DEGs, including 43 downregulated genes, were identified in RS639 as compared to that in ZM22 at 30 DAA (Supplementary Table S3). Among these downregulated genes, two genes encoded GBE, two genes encoded Pho1, four genes encoded SS, and one gene encoded sucrose synthase. SS is mainly responsible for the extension of amylopectin chains in crops and has been reported to influence RS formation [43]. The downregulation of SS-I in a rice cultivar was found to increase the amylose content [44] and influence the distribution of amylopectin chains [45]; this finding suggests that SS-I affects RS formation, possibly by influencing the amylose content and the distribution of amylopectin chains. Here, one and four genes that encoded SS were significantly downregulated in RS639 at 20 and 30 DAA, respectively. These downregulated SS genes may affect RS accumulation by influencing the amylose content. GBE can cleave the α-1,4 glucosidic linkage of an existing glucan chain and transfer the cut end to the 6-position of a glucose residue to form an α-1,6 glucosidic linkage [46]. The GBE treatment of corn starch decreased the amylose content and the average chain length of amylopectin [47]. In the present study, the average relative expression of GBE in ZM22 was 2.56- and 2.38-fold higher than that in RS639 at 20 and 30 DAA, respectively. The downregulation of the GBE genes in RS639 may improve amylose accumulation, which will benefit the formation of RS. Additionally, the downregulation of the GBE genes also affected the starch physicochemical properties. For example, the relative crystallinity and the average chain length of starch in RS639 were 2.01- and 1.02-fold higher, respectively, than those of ZM22 at maturity. Similar results were also reported by Li et al. [47], where the relative crystallinity and the average chain length of the corn starch treated with GBE were decreased by 11.8% and 22.0%, respectively. Pho is involved in starch biosynthesis [16], and it is suggested that there is physical and catalytic synergy between PHO1 and BE; thus, the formation of a physical association between Pho1, BEI, and branched maltodextrin (MD) might play a crucial role in the synthesis of branched MDs, which can act as a primer for the biosynthesis of amylopectin molecules [48]. In the present study, the average relative expression of Pho in RS639 was 0.43- and 0.32-fold lower than that in ZM22 at 20 and 30 DAA, respectively. The downregulation of the Pho genes in RS639 might decrease the synthesis of amylopectin and correspondingly promote amylose accumulation and RS formation.
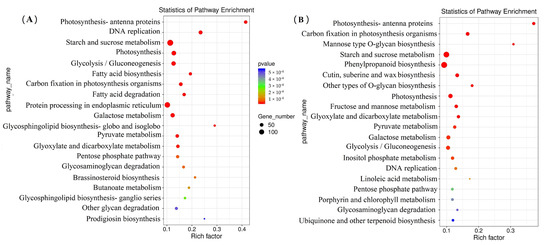
Figure 4.
KEGG annotation and enrichment results of the differentially expressed genes (DEGs) between RS639 and ZM22. (A), DEGs between RS639 and ZM22 at 20 days after anthesis (DAA). (B), DEGs between RS639 and ZM22 at 30 DAA.
The correlation analysis showed a significant positive correlation between the expression levels of the GBE, Pho, and SS genes (Figure 5). For example, TraesCS2A02G310300 encoding GBE was positively correlated with the expression levels of another GBE gene (TraesCS2B02G327300, r = 0.995) and a Pho gene (TraesCS5D02G404500, r = 0.997) (Figure 5A). At 30 DAA, TraesCS2B02G491700 encoding SS was positively correlated with a GBE gene (TraesCS2A02G293400, r = 0.996) and a Pho gene (TraesCS3A02G366400, r = 0.991). These results suggest that the synergistic expression of these genes promotes the synthesis of amylose, improves the physicochemical properties of starch, and is conducive to RS accumulation. It has been proven that RS formation is a complicated process incorporating a number of complexes and highly regulated reactions [3]. This study revealed that the downregulation of the expressions of genes encoding GBE, Pho, and SS in wheat grain promoted the accumulation of RS. The factors regulating the coordinated expressions of these genes and their mechanisms, as well as the genetic analysis of the high RS mutant, need to be realized in further studies.
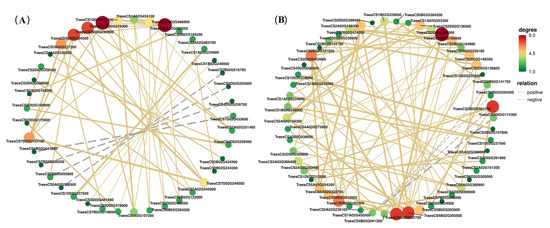
Figure 5.
Correlation analysis of differentially expressed genes (DEGs) of grains between RS639 and ZM22. (A), DEGs between RS639 and ZM22 at 20 days after anthesis (DAA); (B), DEGs between RS639 and ZM22 at 30 DAA. Notes stand for DEGs, and edges stand for relationships. Solid edges mean a positive correlation, and dash edges mean a negative correlation. The sizes and colors of nodes mean the number of related genes.
4. Conclusions
Wheat grain starch had a typical A-type crystal structure during the entire grain-filling process, but the peak intensity and relative crystallinity changed with the progression of the grain-filling stage. The Tp and Tc of starch generally showed a decreasing tendency with the grain development, whereas the enthalpy value exhibited no apparent regularity. Wheat lines R639 and R683 with higher RS contents also had higher amylose contents, relative crystallinity, and proportions of starch granules at 2.0~9.8 µm compared to the control cultivar (ZM22). The transcriptomic analysis suggested that the downregulation of the expressions of genes encoding GBE, Pho1, and SS in the grains of wheat lines with high RS contents promoted the accumulation of amylose, which was conducive to RS formation.
Supplementary Materials
The following supporting information can be downloaded at: https://www.mdpi.com/article/10.3390/agronomy13061482/s1, Table S1: Agronomic traits of the tested wheat cultivars (lines) in this study. Table S2: Differentially expressed genes between RS639 and ZM22 at 20 days after anthesis. Table S3: Differentially expressed genes between RS639 and ZM22 at 30 days after anthesis.
Author Contributions
S.L. and J.F.: investigation and data curation. C.D., Y.J. and Z.H.: data curation and formal analysis. C.W. and Y.X.: supervision and project administration. D.M.: conceptualization and writing and editing. All authors have read and agreed to the published version of the manuscript.
Funding
The work was funded by the National Key Research and Development Program of China with grant 2016YFD0300404.
Data Availability Statement
The data presented in this study are available on request from the author.
Conflicts of Interest
The authors declare that they have no competing interest.
References
- Englyst, H.N.; Kingman, S.M.; Cummings, J.H. Classification and measurement of nutritionally important starch fractions. Eur. J. Clin. Nutr. 1992, 46, 3–50. [Google Scholar]
- Asp, N.G.; Bjӧrck, I. Resistant starch. Trends Food Sci. Tech. 1992, 3, 111–114. [Google Scholar] [CrossRef]
- Shen, L.S.; Li, J.Y.; Li, Y.H. Resistant starch formation in rice: Genetic regulation and beyond. Plant Commun. 2022, 3, 100329. [Google Scholar] [CrossRef] [PubMed]
- Haralampu, S.G. Resistant starch—A review of the physical properties and biological impact of RS3. Carbohydr. Polym. 2000, 41, 285–292. [Google Scholar] [CrossRef]
- Koh, G.Y.; Rowling, M.J. Resistant starch as a novel dietary strategy to maintain kidney health in diabetes mellitus. Nutr. Rev. 2017, 75, 350–360. [Google Scholar] [CrossRef] [PubMed]
- Lockyer, S.; Nugent, A.P. Health effects of resistance starch. Nutr. Buttetin 2017, 42, 10–41. [Google Scholar]
- Regina, A.; Bird, A.; Topping, D.; Bowden, S.; Freeman, J.; Barsby, T.; Kosar-Hashemi, B.; Li, Z.; Rahman, S.; Morell, M. High-amylose wheat generated by RNA interference improves indices of large-bowel health in rats. Proc. Natl. Acad. Sci. USA 2006, 103, 3546–3551. [Google Scholar] [CrossRef]
- Wang, L.; Wang, G.Y.; Sui, C.H.; Li, W.H. Correlation analysis between resistant starch content and other quality-related traits in spring wheat. Mol. Plant. Breed. 2012, 10, 669. [Google Scholar]
- Panlasigui, L.N.; Thompson, L.U.; Juliano, B.O.; Perez, C.M.; Yiu, S.H.; Greenberg, G.R. Rice varieties with similar amylose content differ in starch digestibility and glycemic response in humans. Am. J. Clin. Nutr. 1991, 5, 871–877. [Google Scholar] [CrossRef]
- Frei, M.; Siddhuraju, P.; Becker, K. Studies on the in vitro starch digestibility and the glycemic index of six different indigenous rice cultivars from the Philippines. Food. Chem. 2003, 83, 395–402. [Google Scholar] [CrossRef]
- Singh, J.; Dartois, A.; Kaur, L. Starch digestibility in food matrix: A review. Trends Food. Sci. Tech. 2010, 21, 168–180. [Google Scholar] [CrossRef]
- Xia, J.; Zhu, D.; Wang, R.M.; Yan, Y.M. Crop resistant starch and genetic improvement: A review of recent advances. Appl. Genet. 2018, 131, 2495–2511. [Google Scholar] [CrossRef] [PubMed]
- Chung, H.J.; Liu, Q.; Lee, L.; Wei, D. Relationship between the structure, physicochemical properties and in vitro digestibility of rice starches with different amylose contents. Food Hydrocoll. 2011, 25, 968–975. [Google Scholar] [CrossRef]
- Xia, J.; Zhu, D.; Chang, H.M.; Yan, X.; Yan, Y.M. Effects of water-deficit and high-nitrogen treatments on wheat resistant starch crystalline structure and physicochemical properties. Carbohyd. Polym. 2020, 234, 115905. [Google Scholar] [CrossRef]
- Pang, H.; Li, W.H.; Zhang, H.B.; Wang, L.; Yin, Y.A.; Yuan, H.G.; Wang, Z.B. Inheritance analysis of resistant starch content in kernels of wheat. Genetics 2010, 32, 172–176. [Google Scholar] [CrossRef]
- Satoh, H.; Shibahara, K.; Tokunaga, T.; Nishi, A.; Tasaki, M.; Hwang, S.K.; Okita, T.W.; Kaneko, N.; Fujita, N.; Yoshida, M.; et al. Mutation of the plastidial α-glucan phosphorylase gene in rice affects the synthesis and structure of starch in the endosperm. Plant. Cell 2008, 20, 1833–1849. [Google Scholar] [CrossRef]
- Yamamori, M.; Kato, M.; Yui, M.; Kawasaki, M. Resistant starch and starch pasting properties of a starch synthase IIa-deficient wheat with apparent high amylose. Aust. J. Agr. Res. 2006, 57, 531–535. [Google Scholar] [CrossRef]
- Schoen, A.; Joshi, A.; Tiwari, V.; Gill, B.S.; Rawat, N. Triple null mutations in starch synthase SSIIa gene homoeologs lead to high amylose and resistant starch in hexaploid wheat. BMC Plant Biol. 2021, 21, 74. [Google Scholar] [CrossRef]
- He, Z.F. Grain and Oil Grain Quality and Its Analysis Technology; Agricultural Press: Beijing, China, 1985; p. 290. [Google Scholar]
- Peng, M.; Gao, M.; Abdel-Aal, E.S.M.; Hucl, P.; Chibbar, R.N. Separation and characterization of A- and B-type starch granules in wheat endosperm. Cereal Chem. 1999, 76, 375–379. [Google Scholar] [CrossRef]
- Kuang, N.; Zhou, W.; Zhang, X.; Zheng, H.B.; Tang, Q.Y. The research of ratoon rice on cooking and eating quality and the paste property and starch crystal structure. J. Chin. Cereals Oils Assoc. 2021, 36, 21–26. [Google Scholar]
- Kang, G.; Xu, W.; Liu, G.; Peng, X.; Guo, T. Comprehensive analysis of the transcription of starch synthesis genes and the transcription factor RSR1 in wheat (Triticum aestivum) endosperm. Genome 2013, 56, 115–122. [Google Scholar] [CrossRef] [PubMed]
- Liu, S.; Feng, J.; Jiang, X.; Yao, Y.; Gao, H.; Ma, D. Resistant starch accumulation characteristics and expression analysis of genes encoding starch synthesis–related enzymes in wheat grain. Plant. Physiol. J. 2021, 57, 112–120. [Google Scholar]
- Wang, H.P.; Cai, H.Y.; Zhu, J.H.; Wei, X.; Zhang, S.; Liu, G.; He, Y.G.; Li, B.; Xu, L.; Jiao, C.H.; et al. Dynamic resistant starch accumulation in contrasting wheat genotypes highlights the lipid metabolic pathway related to resistant starch synthesis. Agriculture 2022, 12, 308. [Google Scholar] [CrossRef]
- Hoebler, C.; Karinthi, A.; Chiron, H.; Champ, M.; Barry, J.L. Bioavailability of starch in bread rich in amylose: Metabolic responses in healthy subjects and starch structure. Eur. J. Clin. Nutr. 1999, 53, 360–366. [Google Scholar] [CrossRef]
- Jukanti, A.K.; Pautong, P.A.; Liu, Q.; Sreenivasulu, N. Low glycemic index rice—A desired trait in starchy staples. Trends Food. Sci. Tech. 2020, 106, 132–149. [Google Scholar] [CrossRef]
- Lv, X.; Hong, Y.; Zhou, Q.; Jiang, C. Structural features and digestibility of corn starch with different amylose content. Front. Nutr. 2021, 8, 692673. [Google Scholar] [CrossRef]
- Wu, C.; Zhou, X.; Wei, B.; Tian, Y.; Xu, X.; Jin, Z. Effects of α-maltotriohydrolase hydrolysis prior to debranching on the structure and digestibility of normal maize starch. Starch/Starke 2017, 69, 1600078. [Google Scholar] [CrossRef]
- Ramadoss, B.R.; Gangola, M.P.; Agasimani, S.; Jaiswal, S.; Venkatesan, T.; Sundaram, G.R.; Chibbar, R.N. Starch granule size and amylopectin chain length influence starch in vitro enzymatic digestibility in selected rice mutants with similar amylose concentration. J. Food. Sci. Tech. 2019, 56, 391–400. [Google Scholar] [CrossRef]
- Li, C.; Feng, C.; Wang, Y.; Zhang, R.; Guo, W.; Zhu, X.; Peng, Y. Differences and correlations of starch physicochemical properties among different wheat cultivars. Acta Agron. Sin. 2007, 33, 1129–1134. [Google Scholar]
- Kumar, R.; Kumar, A.; Sharma, N.K.; Kaur, N.; Chunduri, V.; Chawla, M.; Sharma, S.; Singh, K.; Garg, M. Soft and hard textured wheat differ in starch properties as indicated by trimodal distribution, morphology, thermal and crystalline properties. PLoS ONE 2016, 11, 0147622. [Google Scholar] [CrossRef]
- Man, J.; Cai, J.; Xu, B.; Zhang, F.; Liu, Q.; Wei, C. Spectrum analysis of crystalline structure of crop starches. Acta Agron. Sin. 2012, 38, 691–698. [Google Scholar] [CrossRef]
- Bao, W.; Li, Q.; Wu, Y.; Ouyang, J. Insights into the crystallinity and in vitro digestibility of chestnut starch during thermal processing. Food Chem. 2018, 269, 244–251. [Google Scholar] [CrossRef]
- Bechtel, D.B.; Zayas, I.; Laleikau, L.; Pomeranz, Y. Size-distribution of wheat starch granules during endosperm development. Cereal Chem. 1990, 67, 59–63. [Google Scholar]
- Ahmed, Z.; Tetlow, I.J.; Falk, D.E.; Liu, Q.; Emes, M.J. Resistant starch content is related to granule size in barley. Cereal Chem. 2016, 93, 618–630. [Google Scholar] [CrossRef]
- Lu, H.; Wang, C.; Guo, T.; Xie, Y.; Feng, W.; Li, S. Starch composition and its granules distribution in wheat grains in relation to post-anthesis high temperature and drought stress treatments. Starch/Starke 2014, 66, 419–428. [Google Scholar] [CrossRef]
- Zhou, T.; Zhou, Q.; Li, E.; Yuan, L.; Wang, W.; Zhang, H.; Liu, L.; Wang, Z.; Yang, J.; Gu, J. Effects of nitrogen fertilizer on structure and physicochemical properties of “super” rice starch. Carbohyd. Polym. 2020, 239, 116237. [Google Scholar] [CrossRef] [PubMed]
- Zhao, Y.; Henry, R.J.; Gilbert, R.G. Starch structure-property relations in Australian wild rices compared to domesticated rices. Carbohyd. Polym. 2021, 271, 118412. [Google Scholar] [CrossRef] [PubMed]
- Zhu, D.; Zhang, H.; Guo, B.; Xu, K.; Dai, Q.; Wei, C.; Zhou, G.; Huo, Z. Physicochemical properties of indica-japonica hybrid rice starch from Chinese varieties. Food Hydrocoll. 2017, 63, 356–363. [Google Scholar] [CrossRef]
- Zi, Y.; Shen, H.; Dai, S.; Ma, X.; Ju, W.; Wang, C.; Guo, J.; Liu, A.; Cheng, D.; Li, H.; et al. Comparison of starch physicochemical properties of wheat cultivars differing in bread- and noodle-making quality. Food Hydrocoll. 2019, 93, 78–86. [Google Scholar] [CrossRef]
- Li, P.H.; Wang, C.W.; Lu, W.C.; Chan, Y.J.; Wang, C.R. Effect of resistance starch sources on the physical properties of dough and on the eating quality and glycemic index of salted noodles. Foods 2022, 11, 814. [Google Scholar] [CrossRef] [PubMed]
- Schonhofen, A.; Zhang, X.; Dubcovsky, J. Combined mutations in five wheat STARCH BRANCHINE ENZYME II genes improve resistance starch but affect grain yield and bread-making quality. J. Cereal Sci. 2017, 75, 165–174. [Google Scholar] [CrossRef]
- Zhou, H.J.; Wang, L.J.; Liu, G.F.; Meng, X.B.; Jing, Y.H.; Shu, X.L.; Kong, X.; Sun, J.; Yu, H.; Smith, S.M.; et al. Critical roles of soluble starch synthase SSIIIa and granule-bound starch synthase Waxy in synthesizing resistant starch in rice. Proc. Natl. Acad. Sci. USA 2016, 113, 12844–12849. [Google Scholar] [CrossRef] [PubMed]
- Li, Q.; Liu, X.; Zhang, C.; Jiang, L.; Jiang, M.; Zhong, M.; Fan, X.; Gu, M.; Liu, Q. Rice soluble starch synthase I: Allelic variation, expression, function, and interaction with Waxy. Front. Plant. Sci. 2018, 9, 1591. [Google Scholar] [CrossRef] [PubMed]
- Zhao, Q.; Du, X.X.; Han, Z.Y.; Ye, Y.; Pan, G.; Asad, M.A.U.; Zhou, Q.; Cheng, F. Suppression of starch synthase I (SSI) by RNA interference alters starch biosynthesis and amylopectin chain distribution in rice plants subjected to high temperature. Crop. J. 2019, 7, 573–586. [Google Scholar] [CrossRef]
- Kajiura, H.; Takata, H.; Akiyama, T.; Kakutani, R.; Furuyashiki, T.; Kojima, I.; Harui, T.; Kuriki, T. In Vitro synthesis of glycogen: The structure, properties, and physiological function of enzymatically-synthesized glycogen. Biologia 2011, 66, 387–394. [Google Scholar] [CrossRef]
- Li, W.W.; Li, C.M.; Gu, Z.B.; Qiu, Y.J.; Cheng, L.; Hong, Y.; Li, Z. Relationship between structure and retrogradation properties of corn starch treated with 1,4-α-glucan branching enzyme. Food Hydrocoll. 2016, 52, 868–875. [Google Scholar] [CrossRef]
- Nakamura, Y.; Ono, M.; Utsumi, C.; Steup, M. Functional interaction between plastidial starch phosphorylase and starch branching enzymes from rice during the synthesis of branched maltodextrins. Plant. Cell. Physiol. 2012, 53, 869–878. [Google Scholar] [CrossRef]
Disclaimer/Publisher’s Note: The statements, opinions and data contained in all publications are solely those of the individual author(s) and contributor(s) and not of MDPI and/or the editor(s). MDPI and/or the editor(s) disclaim responsibility for any injury to people or property resulting from any ideas, methods, instructions or products referred to in the content. |
© 2023 by the authors. Licensee MDPI, Basel, Switzerland. This article is an open access article distributed under the terms and conditions of the Creative Commons Attribution (CC BY) license (https://creativecommons.org/licenses/by/4.0/).