Article

Acid Hydrothermal Amendment of Grape Wine Pomace: Enhancement of Phenol and Carbohydrate Co-Solubilization

by
Antonio Serrano
1,2,
Paola Díaz-Navarrete
3,
Roberto Mora
4,
Gustavo Ciudad
5,6,7,
Juan Carlos Ortega
8 and
Fernanda Pinto-Ibieta
9,*
1
Departamento de Microbiología, Facultad de Farmacia, Universidad de Granada, Campus de Cartuja s/n, 18071 Granada, Spain
2
Instituto de Investigación del Agua, Universidad de Granada, Calle Ramón y Cajal 4, 18071 Granada, Spain
3
Departamento de Ciencias Agropecuarias y Acuícolas, Facultad de Recursos Naturales, Universidad Católica de Temuco, Casilla 15-D, Temuco 4780000, Chile
4
Sciences Engineering with Specialization in Bioprocess, Universidad de La Frontera, Temuco 4780000, Chile
5
Departamento de Ingeniería Química, Facultad de Ingeniería y Ciencias, Universidad de La Frontera, Avenida Francisco Salazar #01145, Temuco 4780000, Chile
6
Instituto del Medio Ambiente (IMA), Universidad de La Frontera, Avenida Francisco Salazar #01145, Temuco 4780000, Chile
7
Scientific and Technological Bioresource Nucleus (BIOREN), Avenida Francisco Salazar #01145, Temuco 4780000, Chile
8
Centro de Gestión y Tecnologías del Agua, Avenida Francisco Salazar #01145, Temuco 4780000, Chile
9
Departamento de Procesos Industriales, Facultad de Ingeniería, Universidad Católica de Temuco, Casilla 15-D, Temuco 4780000, Chile
*
Author to whom correspondence should be addressed.
Agronomy 2023, 13(6), 1501; https://doi.org/10.3390/agronomy13061501
Submission received: 20 April 2023 / Revised: 15 May 2023 / Accepted: 17 May 2023 / Published: 30 May 2023

Abstract

:
Byproducts from the winery industry contain many bioactive compounds that are considered high-value-added compounds. White grape pomace (GP) is rich in carbohydrates; consequently, it can be used as a raw material for subsequent bioprocesses. In the present study, low-temperature hydrothermal treatments were carried out using different operational conditions regarding temperature (65–95 °C), time (120–240 min), and sulfuric acid addition at various concentrations (5–15% v/v). The results showed that by using a temperature of 65 °C, a period of 120 min, and 15% (v/v) of H2SO4, it was possible to obtain a liquid phase rich in phenols and carbohydrates, with total phenol compounds corresponding to 2113 ± 140 mg of gallic acid/kg GP and composed mainly of 3-hydroxytyrosol (1330 ± 22 mg/kg GP). In parallel, carbohydrate solubilization reached 245 g glucose/kg GP. These results demonstrate the promising potential of hydrothermally treated grape pomace as raw material for biorefinery processes.

1. Introduction

Grapes are among the most widely cultivated plant crops worldwide [1]. Most of the grapes produced globally are destined for wine production, amounting to a global crop yield of more than 27 million tons in 2019 [2]. This huge volume is of great economic importance, reaching an export value of more than USD 35 billion in 2019 [2]. Among the main grape-producing countries, Spain, France, and China have the largest areas of vineyards, followed by Italy, Turkey, and the USA [3].
The moderate consumption of grape wine has been traditionally associated with certain health benefits. Although its alcohol content makes it impossible to consider wine a healthy beverage, many bioactive compounds with antioxidant, antimicrobial, and/or anti-inflammatory properties have been identified in grape wine, such as phenolic acids, flavonoids, and proanthocyanins [4,5]. These high-added-value compounds in grapes are also retained in a byproduct generated during grape wine preparation called grape pomace (GP), which accounts for 17–25% of the initial grape mass [6]. GP is mainly composed of the retained grape seeds and skins, although it can also contain pulp remains and stem residues [7,8]. GP can contain a considerable concentration of polyphenols since most of the polyphenols in grapes are usually found in the seeds (60–70%) and skin (28–35%), whereas the pulp has a lower content percentage (10%) [8]. Likewise, white GP is an outstanding source of sugars, with a content between 55 and 78% of GP dry matter [9]. The high sugar content in white GP makes it a promising biomass for use as feedstock in various bioprocesses for value recovery, such as bioethanol production [10], anaerobic digestion [11], and polymer production [12,13]. However, the presence of bioactive compounds can limit the implementation of bioprocesses for GP valorization due to their inhibitory properties [11,14]; therefore, the recovery of these bioactive compounds from GP would carry a double benefit, i.e., the recovery of added-value compounds with a high degree of market interest and, at the same time, the detoxification of the remaining biomass, facilitating further value recovery through bioprocesses [8].
Many different methods have been evaluated with respect to their ability to remove or recover bioactive compounds, mainly phenolic acids, from GP and similar substrates. For example, Siles et al. [15] proposed a short ozonation pre-treatment (15 min), which produced a reduction of more than 50% in the initial concentration of phenols in vinasses from alcohol production. Other authors have proposed the extraction of phenolic compounds using different solvents, such as acetone [16], methanol/water [13,17], or ethanol acidified with HCl [18,19]. Several physical methods have also been proposed, such as the use of nanofiltration membranes or ultrasound- and microwave-assisted extraction [2,20]. The use of nanofiltration membranes enabled the recovery of up to 73% of the total phenolic content and 92% of proanthocyanidins from GP [2]. However, many authors have stated the need to implement optimized processes that maximize the extraction of bioactive compounds [2,6]. Most of the phenolic compounds in GP are concentrated in the seeds, which means that solubilization is the best method to achieve higher recovery of bioactive compounds [8,21]. Hydrothermal treatments have been widely proposed as a cost-effective option for the solubilization of lignocellulosic substrates [22,23]; however, the application of excessively severe conditions during hydrothermal treatment would entail the degradation of a fraction of the bioactive compounds and sugars in the substrate as well as the appearance of undesirable compounds such as furfural or hydroxymethylfurfural (HMF) [22,24]. These compounds have been reported to be biological inhibitors and thus would hinder the further valorization of the substrate after the recovery of bioactive compounds [25]. As an alternative, low-temperature hydrothermal treatments have been shown to promote protein solubilization, increase particulate carbohydrate removal, and increase soluble phenol and soluble sugar concentrations [25,26].
Therefore, the object of the present research was to optimize the solubilization of the bioactive compounds and carbohydrates in GP through low-temperature hydrothermal treatment. This paper is especially relevant given that it focuses on a widely generated substrate, i.e., GP; it proposes a valorization method intended to maximize the recovery of bioactive compounds and, at the same time, amend the treated substrate to render it a suitable feedstock for further bioprocesses by optimizing the soluble sugar content.

2. Materials and Methods

2.1. Substrate

White grape pomace (GP) was obtained from the “Viña Aynco” vineyard located in Galvarino, La Araucanía Region, Chile. Once collected, the GP was immediately stored at −20 °C to avoid uncontrolled fermentation of the substrate.

2.2. Hydrothermal Treatment

The experiments were carried out in 1 L glass reactors. A GP/acid solution ratio of 15/85 (w/w) was used in all tests, with 50 g of GP (wet base) added to 275 g of acid solution and stirred at a constant rate of 300 rpm. The reaction temperature was tested over a range from 65 to 95 °C, a reaction time between 120 and 240 min, and an acid concentration from 5 to 15% (v/v). The conditions imposed during the hydrothermal treatment were organized with surface response methodology using Design Expert 11 (software). A face-centered central composite design of three factors with six central points was applied, for which there were three replicates per experiment (Table 1). The responses studied were the solubilization of the total carbohydrates (considered as the sum of xylose, glucose, and arabinose) and phenolic compounds. ANOVA was performed for each response. In all cases, model significance and lack-of-fit tests were performed to check that the models used were relevant and fitted the experimental data. All statistical analyses were performed considering α = 0.05 (Supplementary Material, Tables S1 and S2).
After each hydrothermal treatment, the samples were centrifuged for 10 min at 10,000 rpm, and the solid phase was characterized according to its lignin, cellulose, and total phenolic compound concentrations and volatile and total solids. The liquid phase was passed through a 0.22 µm filter. Total sugars, xylose, arabinose, glucose, furfural, HMF, soluble chemical oxygen demand (sCOD), total phenolic compounds, and their characterization were measured in the filtered sample.

2.3. Chemical Analysis

The chemical compositions for untreated and treated grape pomace, including analysis of the liquid and solid phases obtained after hydrothermal treatment, were determined according to standard methods and procedures found in the literature on cellulose and hemicellulose content [27] and lignin (TAPPIT222 om-98) [28]. Total solids (TS), volatile solids (VS), and soluble chemical oxygen demand (sCOD) were measured using standard methods [29]. Acetic acid, furfural and hydroxymethylfurfural (HMF), and the individual carbohydrates xylose, glucose, and arabinose, obtained in the liquid phase after hydrothermal treatment, were quantified with a YL9100 high-performance liquid chromatograph (HPLC) equipped with a Bio-Rad Aminex HPX-87H 300 column [30]. For the determination of carbohydrates and organic acids, a refractive index detector (RID) was used, while furfural and HMF were detected using a diode array detector (DAD) [30]. Total phenol compounds in the untreated GP (UGP) and the liquid phase resulting from treatment were quantified via spectrophotometry with a gallic acid (GA) calibration curve using the Folin–Ciocalteu method. The results are expressed as mg of GA/Kg GP. To determine the total phenol content in UGP, previous extraction was carried out once again using 1 g of GP and 1 mL of methanol/water (80:20 v/v). The mixture was stirred for 1 min in a vortex apparatus and centrifuged at 1200× g for 10 min. The methanol layer was separated, and the extraction was repeated four times [31]. To determine the antioxidant capacity in the liquid phase, antiradical activity (2,2-diphenyl-1-picrylhydrazyl (DPPH)) was measured; the DPPH content was analyzed by measuring the variation in absorbance at 515 nm after 30 min of reaction with the radical DPPH using a Thermo Scientific (Waltham, MA, USA) UV-Vis Orion AquaMate 8000 spectrophotometer. The results were expressed in grams of Trolox equivalent per kilogram of grape pomace. Finally, the individual phenolic compounds were characterized as described in the study by Romero-Roman et al. [32] via high-performance liquid chromatography–diode array detection electrospray ionization/mass spectrometry (HPLC-DAD-ESI/MSn) using an Agilent Technologies 1220 Infinity Liquid Chromatograph equipped with an autoinjector (G1313, Agilent Technologies, Santa Clara, CA, USA) coupled with a diode array detector (1260, Agilent Technologies, Santa Clara, CA, USA) and a Luna 5 µm C18, 100-Å column (250–4.6 mm). The analytical procedure was based on calibration curves using the following standards: p-hydroxybenzoic acid, gallic acid hexoside, protocatechuic acid hexoside, vanillic acid, coutaric acid, caffeic acid, caftaric acid, p-coumaric acid, ferulic acid, chlorogenic acid, ellagic acid, 3,4-dihydroxyphenyl glycol, 3-hydroxytyrosol, p-tyrosol, vanillin, 4-methyl catechol, syringol, 3,4-dimethyl benzyl alcohol, catechin, epicatechin, quercetin-3-rutinoside, quercetin-3-glucoside, quercetin-3-glucuronide, myricetin, and quercetin. All standards are expressed in mg/Kg GP.

3. Results and Discussion

3.1. Solubilization of Organic Matter

Table 2 shows the characterization of the untreated grape pomace and the solid phases obtained from the GP after hydrolysis. As shown in Table 2, most of the solid phases obtained after the centrifugation of the hydrothermally treated GP presented total solid concentrations higher than 100 g/kg (Table 2). By contrast, treatments 1, 2, 6, and 11 resulted in solid phases with total solid concentrations between 60.9 and 82.2 g/kg; these were five of the six hydrothermal treatments with the lowest concentrations of added acid (Table 1). The higher total solid concentrations observed in the other treatments could have occurred due to the higher amounts of added acid, which would favor the separation of the solid and liquid phases during centrifugation. The enhanced separation with higher amounts of added acid might be related to the greater degradation of hemicellulose, whose solubilization favors acidic conditions [33].
The concentrations of lignin and holocellulose in the untreated GP and those obtained after each treatment are shown in Table 2. It is evident that for all the treatments applied, the lignin content was similar to that of the untreated grape pomace. The maximum level of lignin solubilization, i.e., a decrease in the lignin content in the total GP from 35.6 to 29.5% (w/w), which was determined after treatment 6, was only 16.1% (w/w) of the total lignin content. This low level of lignin removal was expected due to the hydrolysis conditions applied, for which, in all cases, the working temperature did not exceed 95 °C. Some authors have reported that the compact structure of lignin can require the use of temperatures above 180 °C or even the combination of high temperatures and fast decompression processes, as in those induced by steam explosion technology, to effectively break down lignin fibers [22,25]. By contrast, the holocellulose content was strongly impacted by the different treatments applied; in all cases, the level of holocellulose solubilization was greater than 62% (w/w). Treatment 8 showed the greatest decrease in holocellulose content, which was from 59.6 in the UGP to 4.7% (w/w); this was followed by treatments 12 and 7, for which the final concentrations were 9.9 and 9.5% (w/w), respectively (Table 2). These results were also corroborated by confocal laser-scanning microscopy analysis (Supplementary Material, Figure S1).
Table 3 shows the characterization of the liquid phase of UGP with the liquid phases of treated GP after different applying treatment conditions. We noted that the sCOD values in all treatments were higher than the value determined for UGP, i.e., an sCOD value of 594 mg/kg, reaching values even higher than 900 mg/kg with treatments 3, 4, 7, 8, and 12. These treatments corresponded to the highest sulfuric acid dose, i.e., 15% w/w of H2SO4, indicating that there is a positive relationship between acid addition and the solubilization of organic matter. On the other hand, secondary compounds generated during the hydrothermal treatments, such as furfural, hydroxymethylfurfural (HMF), and acetic acid, were also observed, which are reported in Table 3. Furfural and HMF were generated in low quantities, reaching maximum values of 0.4 ± 0.01 and 0.05 ± 0.005 mg/kg, respectively (Table 3). These values are markedly lower than the inhibition limit described for some bioprocesses such as anaerobic digestion, wherein concentrations of around 2.0 g/L of furfural and HMF are required for the full inhibition of microbial activity [34]. The low concentrations of furfural and HMF observed in the present research are expected since their generation is clearly related to the severity of the treatment applied and, especially, temperatures above 120 °C [24].

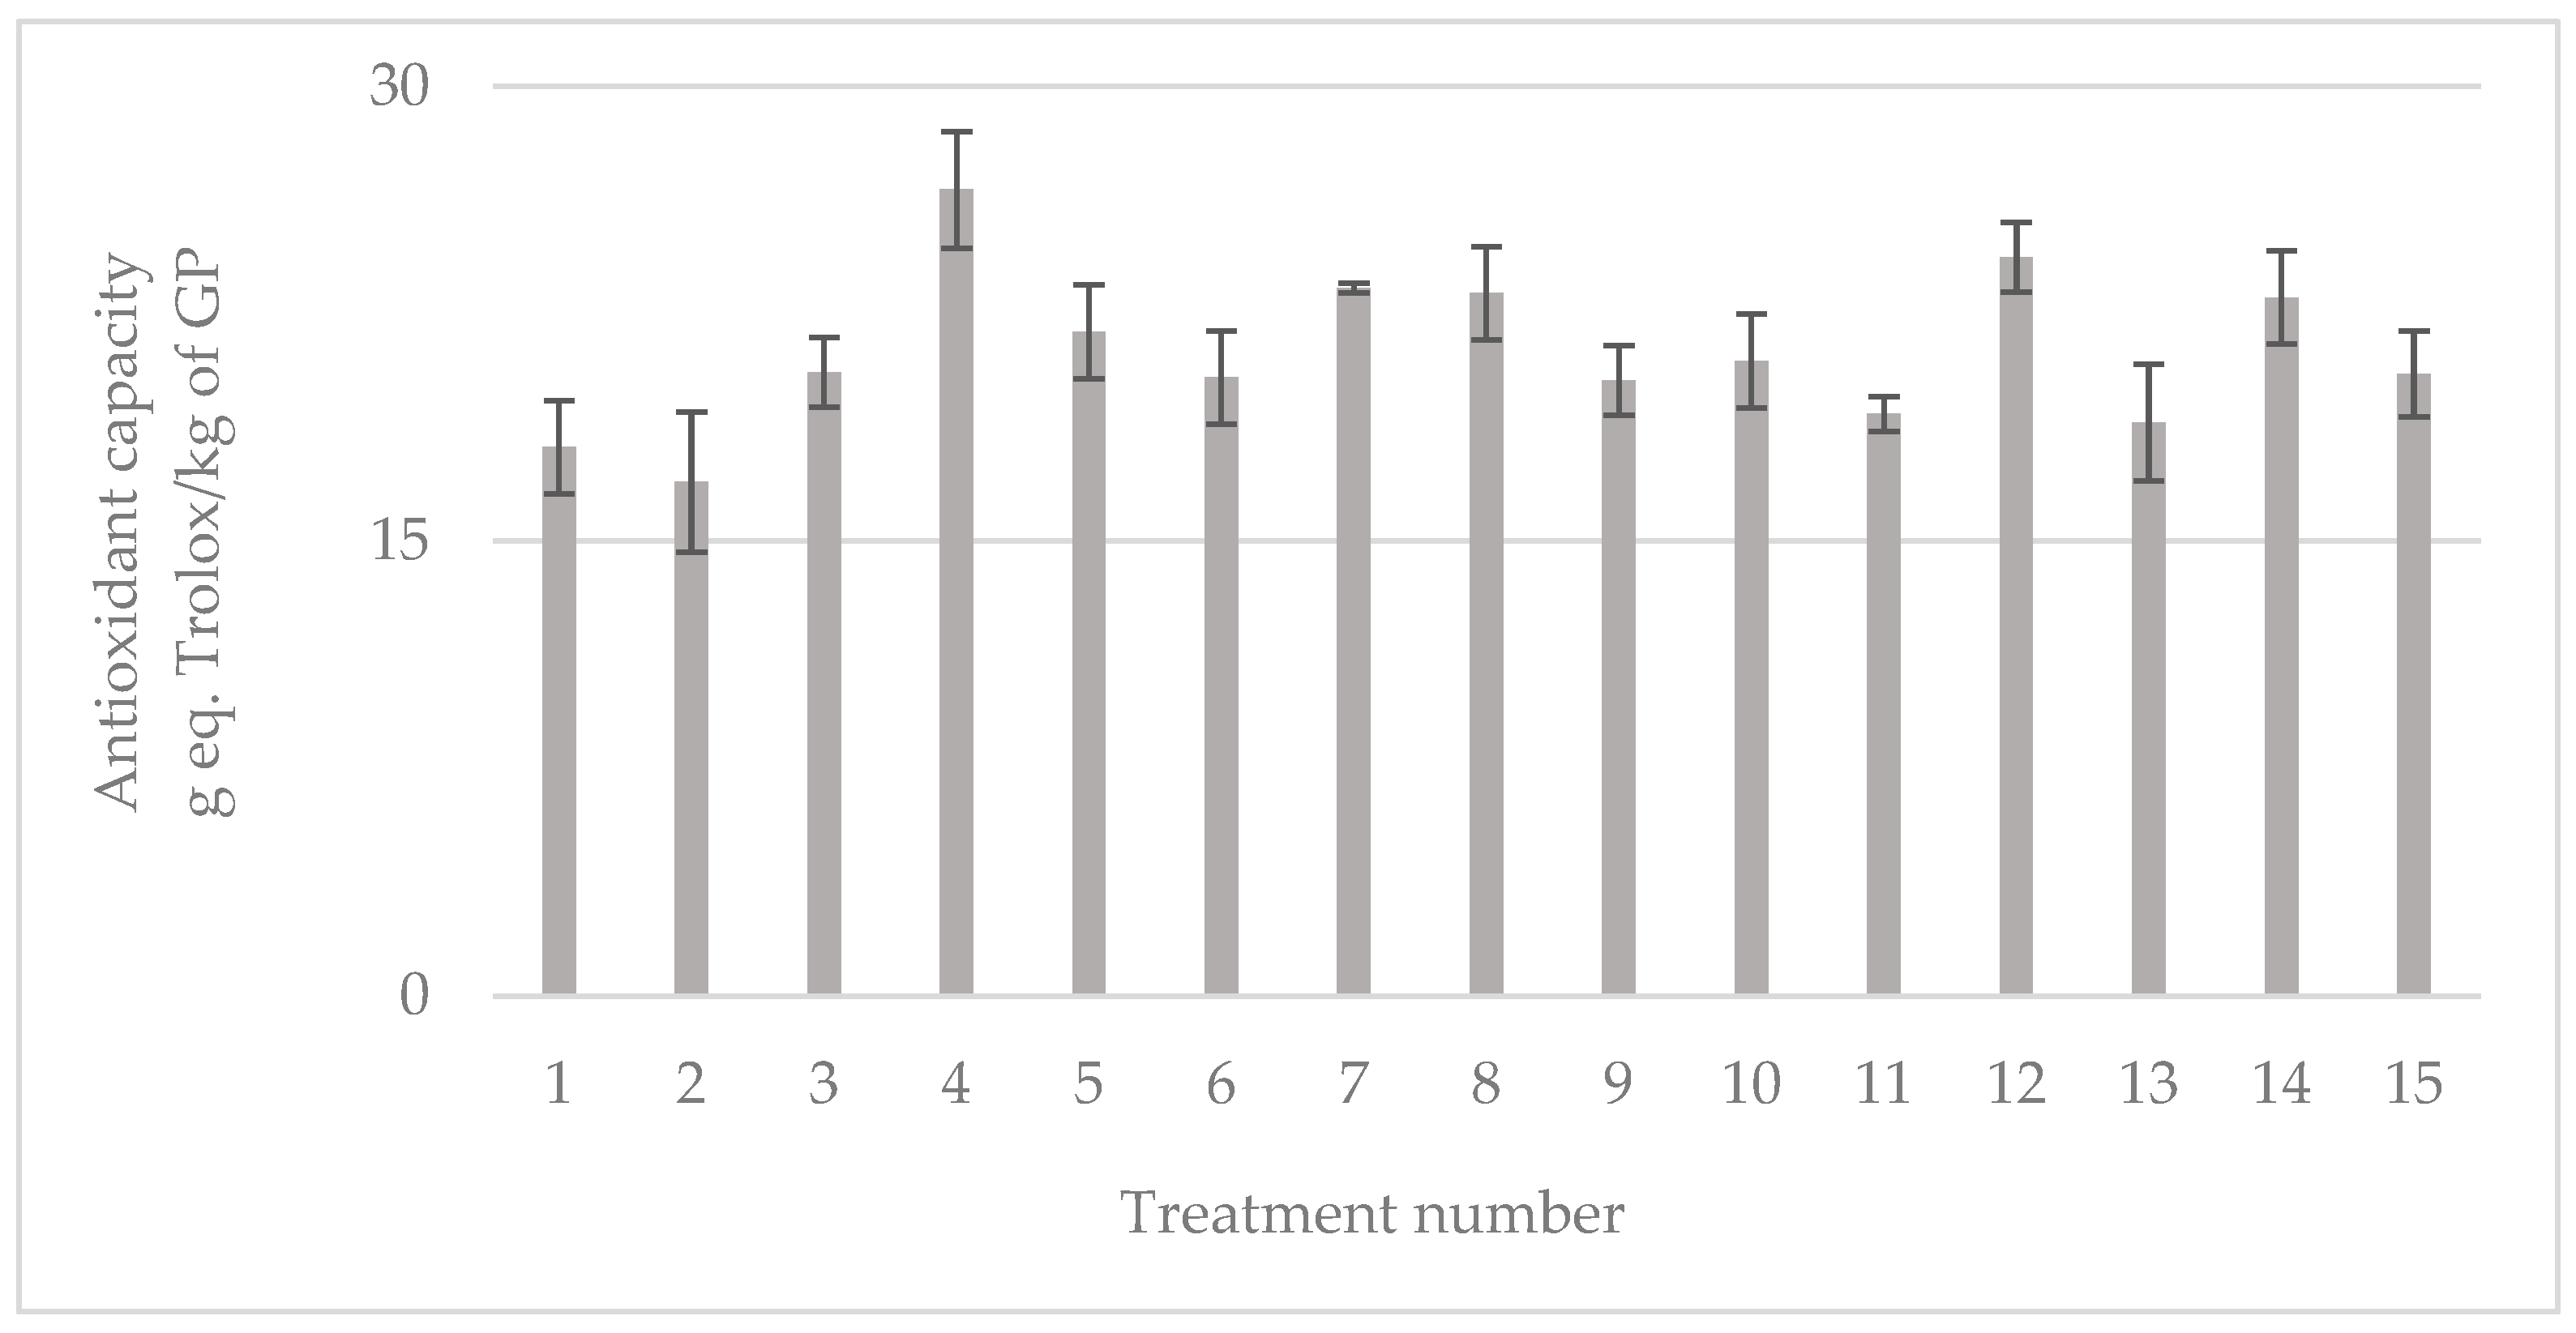
3.2. Bioactive Compound Characterization

Figure 1 shows the concentration of total soluble phenols in the UGP and the liquid fractions obtained after each hydrothermal treatment. The hydrothermal treatments resulted in an increase in the total soluble phenols under all the conditions tested compared to the UGP. The highest increase observed was that induced by hydrothermal treatment 4 (65 °C, 240 min, and 15% v/v H2SO4), for which the concentration of total soluble phenols reached a value of up to 2113 ± 140 mg GA/kg GP, which is around seven times higher than that in the UGP (292 ± 25 mg GA/kg GP) (Figure 1). This highest concentration was similar to that obtained in treatments 4, 7, and 12, with no significant differences between the three values (Supplementary Material, Table S2).
Figure 2 presents the effect of the factors studied (temperature, time, and acid addition) on the responses evaluated. When the temperature was maintained at 65 °C, increasing both the amount of acid added and the reaction time resulted in higher total soluble phenol concentrations (Figure 2a). In contrast, when the temperature was 95 °C, the treatment duration had a low impact on the solubilization of phenols (Figure 2b).
The model relating the total soluble phenols to the experimental factors was obtained using Equation (1), where A, B, and C denote time, sulfuric acid, and temperature, respectively (see Supplementary Material, Table S1):
Phenolic   compounds   mg   GAE kg   GP = 33.76 + 1.86 A + 4.20 B + 5.09 C + 2.00 A B 1.71 A C 2.17 B C 1.10 A 2 + 4.32 B 2 0.77 C 2 2.93 A B C
With an acid concentration of 15% (v/v), it was possible to solubilize similar concentrations of phenols by increasing the temperature from 65 to 95 °C, while the operational time could be reduced from 240 to 120 min (Figure 2c). The higher release of phenolic compounds due to the addition of acid is likely related to the enhancement of solubilization, as previously described for the degradation of the hemicelluloses [33]. Similarly, Rodríguez-Gutiérrez et al. [35] reported 100% enhancement via adding ethanol during the hydrothermal treatment of strawberry extrudate at 90 °C compared to the same hydrothermal treatment without acid addition. The operational temperature had a strong influence on the solubilization of phenols (Figure 2c,d).
Indeed, for a reaction time of 240 min and a sulfuric acid concentration of 15% (v/v), the temperature was not a relevant factor in the range assessed (Figure 2c). Conversely, for an acid concentration of 5% (v/v), the phenols increased from 554 ± 42 to 1621 ± 102 mg GA/kg GP when the operational temperature was increased from 65 to 95 °C. A similar behavior was described by Cubero-Cardoso et al. [24], who reported an increase of around 53% in the total phenols content in the liquid fraction obtained after the hydrothermal treatment of raspberry extrudate by increasing the operational temperature from 60 to 90 °C, which occurred due to the release of the phenolic compounds retained in the lignocellulosic structures.
The high concentration of total soluble phenols was directly related to the values of antioxidant power observed in each hydrothermal treatment. Although the variations in the values of the antioxidant power were lower than in the concentrations of total soluble phenols, a positive relation between the acid addition and the increase in antioxidant power was observed (Figure 3). In all treatments, the antioxidant power was higher than 17 ± 2 g eq. Trolox/kg (848 ± 1 mg eq. Trolox/L). The maximum antioxidant power was determined in run 4 (65 °C, 240 min, and 15% (v/v) H2SO4), namely, 27 ± 2 g eq. Trolox/kg (1330 ± 96 mg eq. Trolox/L). This highest antioxidant power did not present any statistical difference compared to those obtained for treatments 7, 8, 12, and 14 (Supplementary Material, Table S2), whose values were 18 ± 1 g eq. Trolox/kg of GP, 18 ± 2 1 g eq. Trolox/kg of GP, 189 ± 1 1 g eq. Trolox/kg of GP, and 18 ± 2 1 g eq. Trolox/kg of GP, respectively.
By way of comparison, the liquid fraction obtained after the hydrothermal treatment of GP in the present study achieved more than double the antioxidant power reported for raspberry extrudate after hydrothermal treatment at 90 °C for 180 min, i.e., 167 ± 1 mg eq. Trolox/L. High antioxidant power has been reported to be beneficial for the use of GP extract as a basis for the preparation of UV filters [3,36].

3.3. Characterization of Individual Bioactive Compounds

The concentration and composition of the individual phenol compounds in the liquid phases varied widely under different hydrothermal treatment conditions in comparison with the UGP (Table 4). The concentrations of several phenolic acids and phenolic derivatives increased, whereas the effect on the concentration of flavonols was more limited. In particular, the highest increases in phenolic acid levels were observed for gallic acid hexoside and p-hydroxybenzoic acid. The concentrations of these acids increased by more than one order of magnitude compared to the UGP (Table 4), reaching maximum concentrations of 138 ± 5 mg/kg (treatment 2, 240 min, 5% (v/v) H2SO4, 95 °C) for gallic acid hexoside and 90 ± 5 mg/kg (treatment 7, 120 min, 15% (v/v) H2SO4, 95 °C) for p-hydroxybenzoic acid. This increase in the concentrations of these compounds may be very attractive due to their properties; for example, gallic acid has been shown to exhibit antioxidant, antiviral, antibacterial, and antifungal properties and is a positive modulator of germination [37,38].
The phenolic derivative compounds that showed the highest increases compared to the UGP were 3-hydroxytyrosol (HT), p-tyrosol, and, to a lesser extent, 3,4-dihydroxyphenylglycol (DHPG) (Table 4). The high concentrations of HT and DHPG determined in this study are favored by the acid medium generated during the hydrothermal treatments [39]. The highest concentration of HT was 1330 mg/kg corresponding to treatment 4 (180 min, 15% (v/v) H2SO4, and 65 °C), while the highest concentration of DHPG was 264 ± 5, which was achieved using treatment 7 (240 min, 15% (v/v) H2SO4, and 95 °C). The high concentrations of HT and DHPG reported in the present study are important due to their pharmacological, anti-inflammatory, and antioxidant capacities [39,40]. These interesting properties have led to their wide use in industry, resulting in the high market price of 10% phenol extracts, which amounts to EUR 520/kg [41,42]. The concentrations of HT observed in the present study were markedly higher than the average concentrations reported for other well-known sources of HT such as olives, olive oil, and wine (629, 5, and 2 mg/kg, respectively) [40].

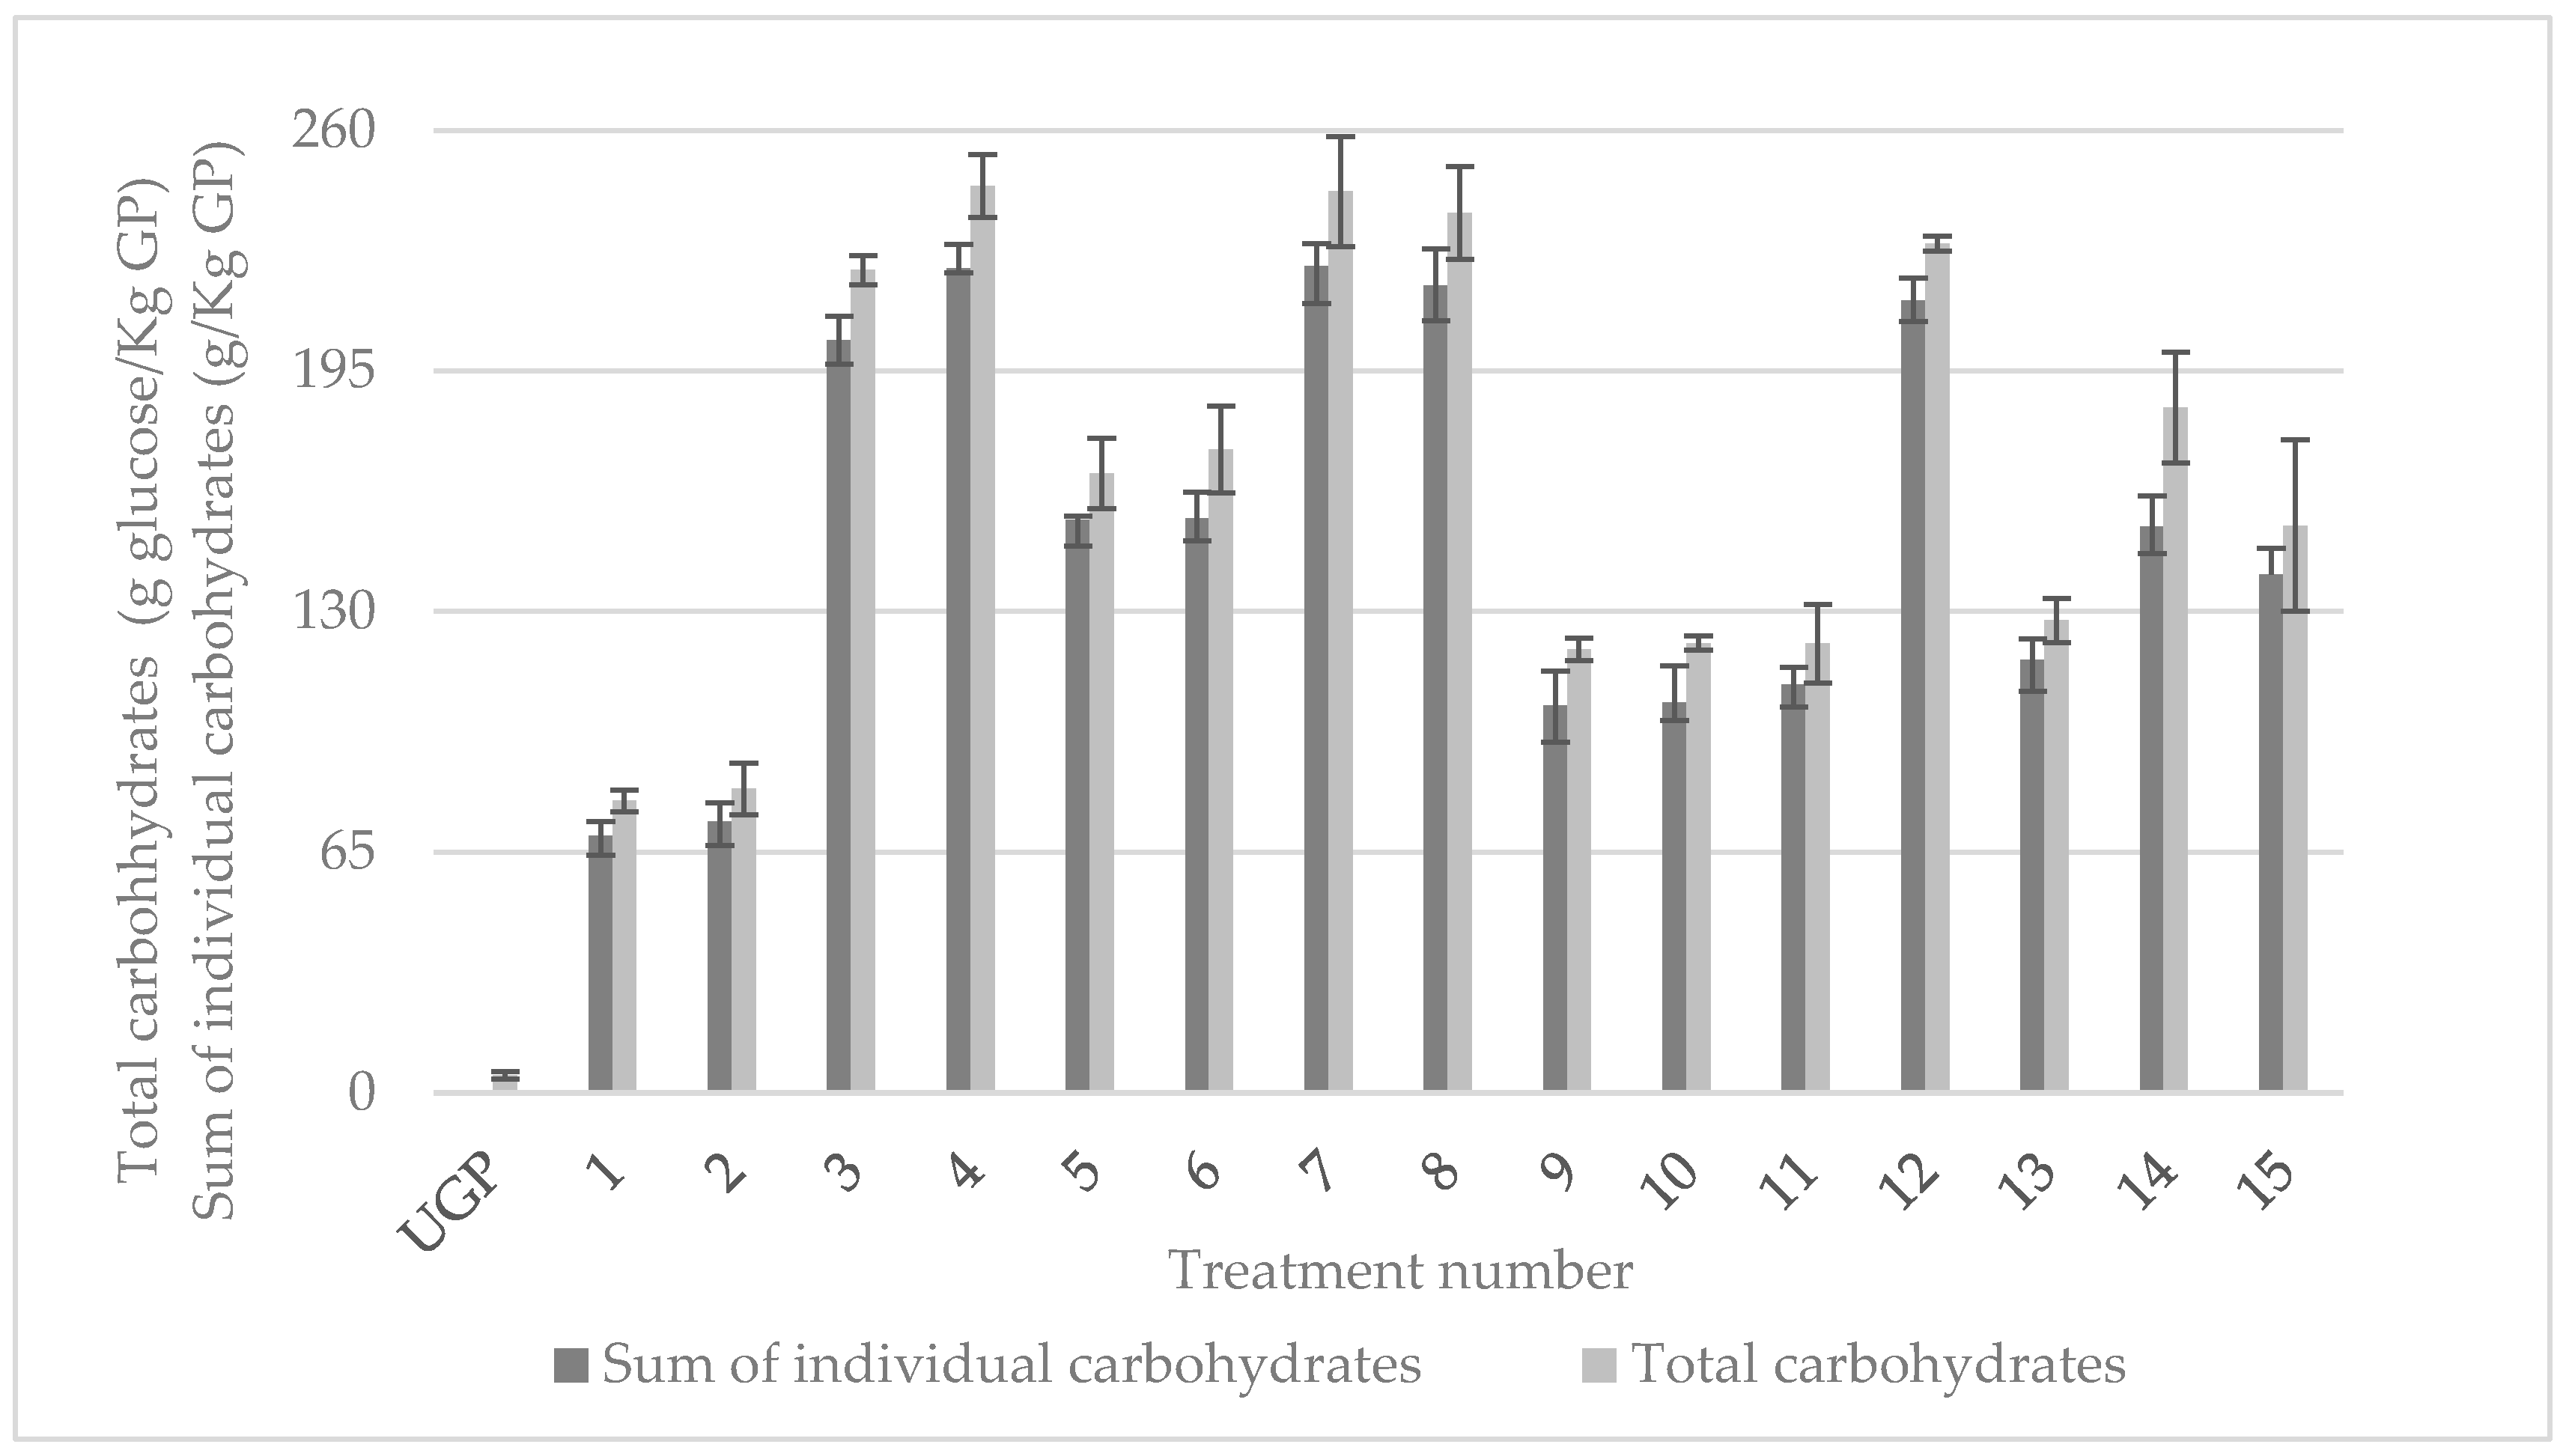
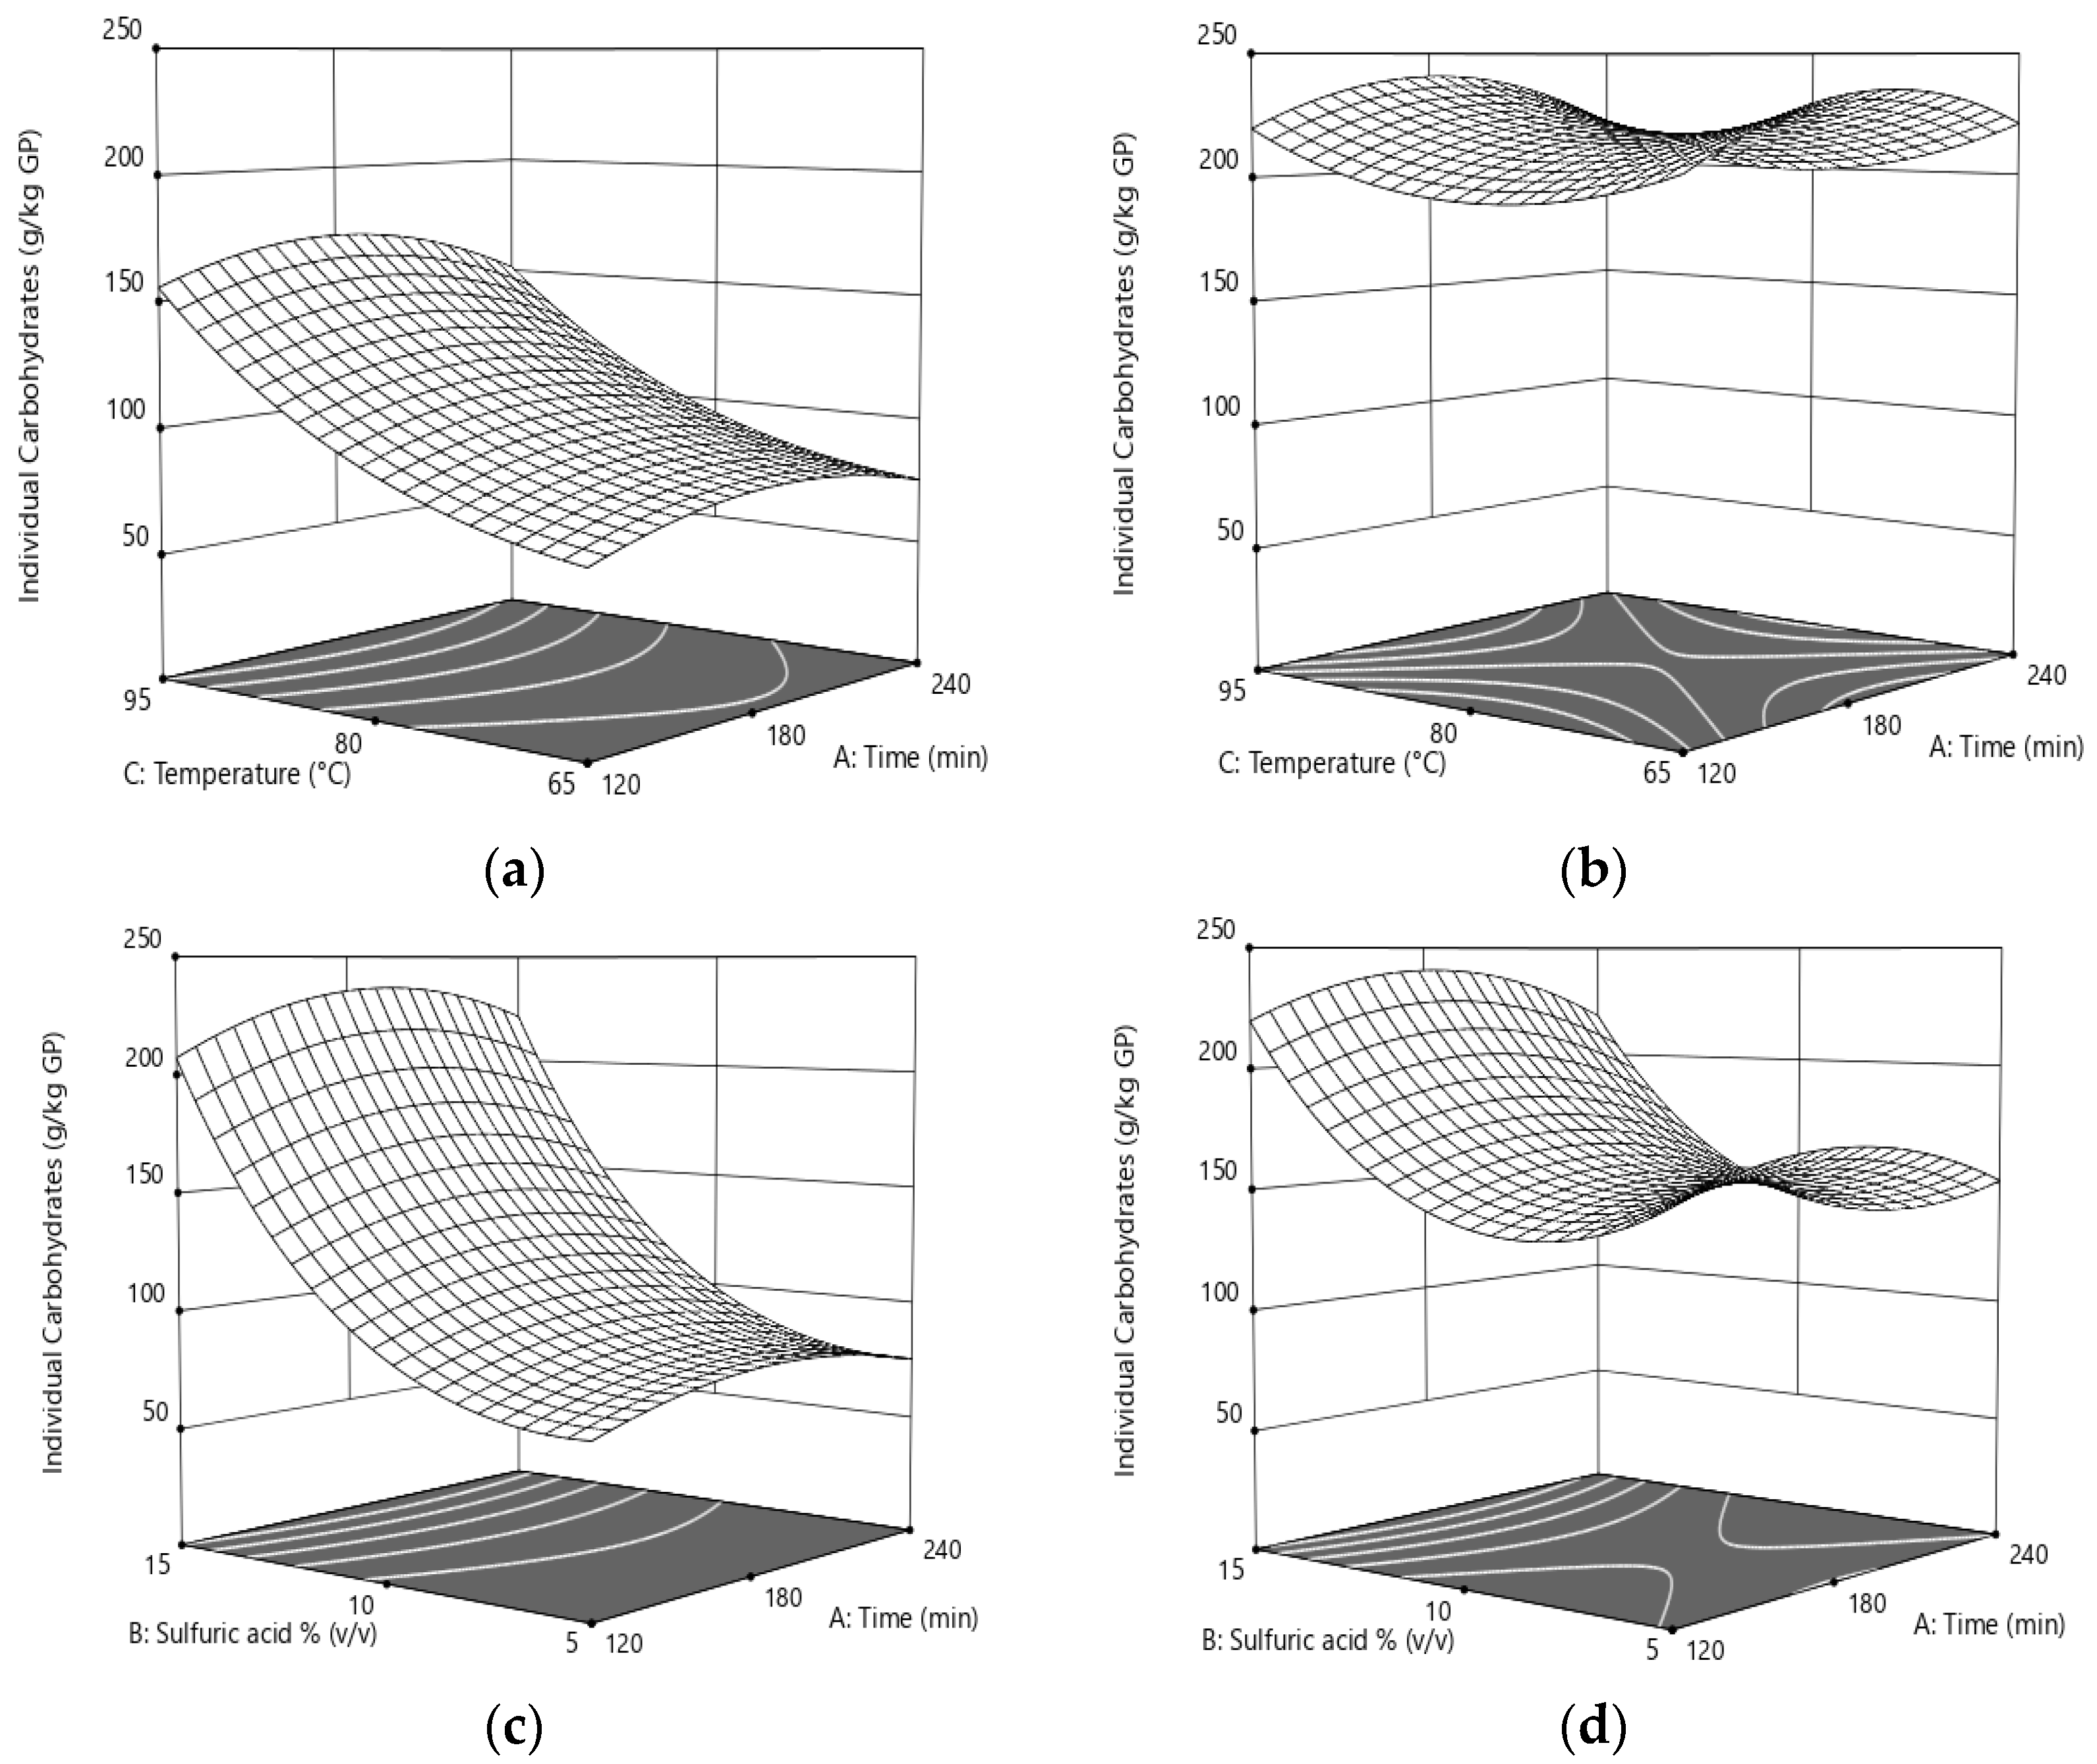
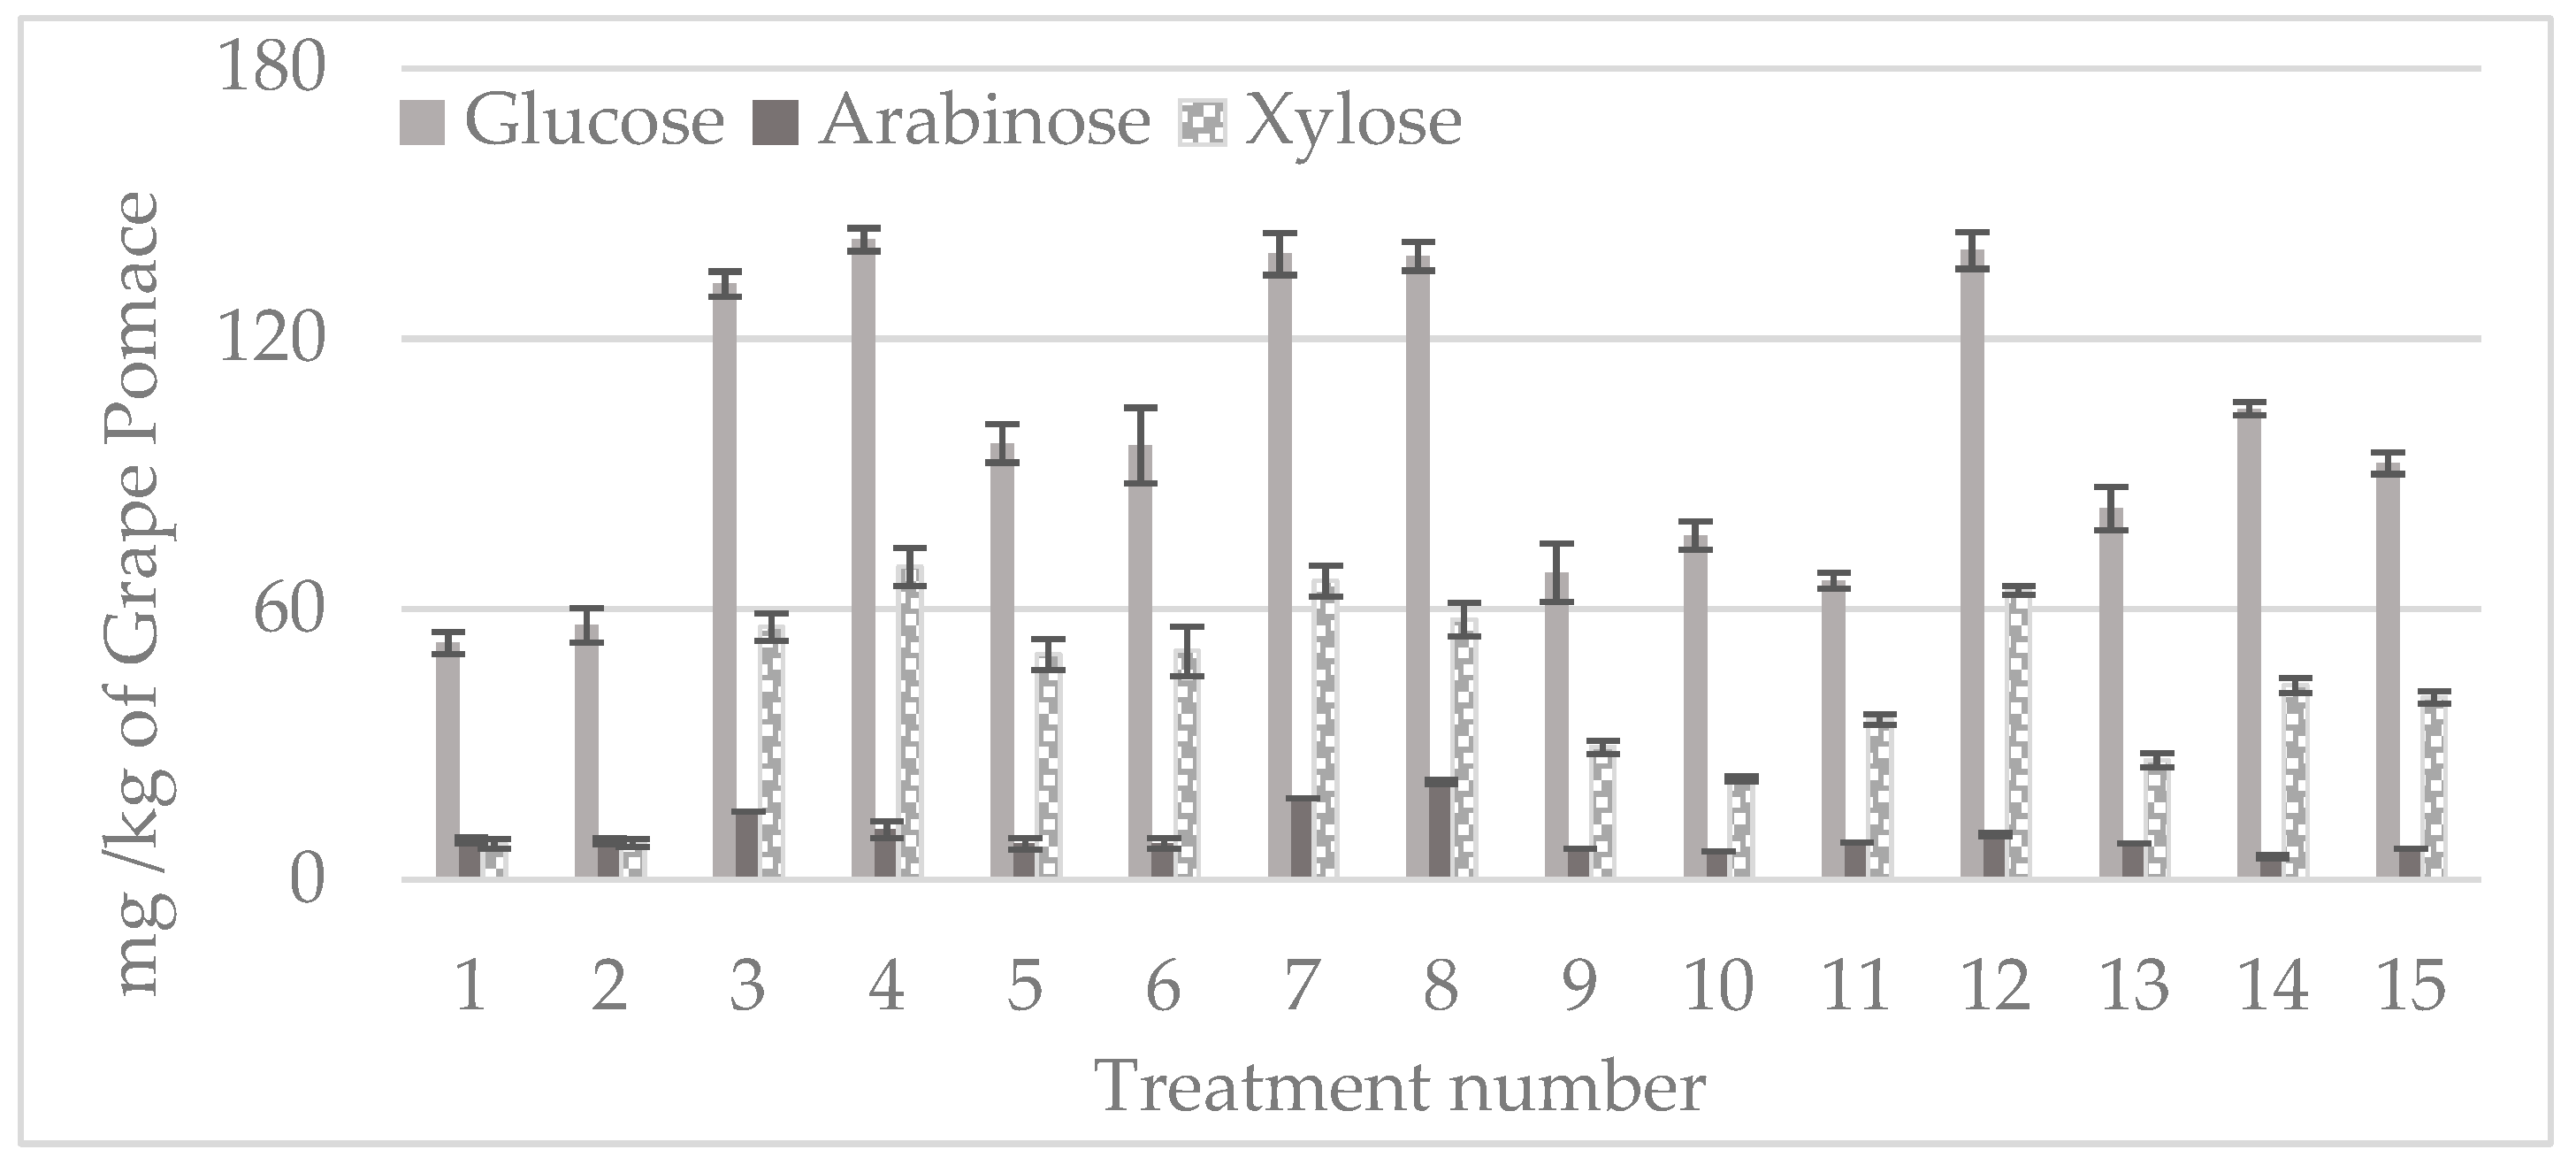
3.4. Carbohydrates’ Solubilization

The solubilization of carbohydrates was evaluated by measuring the total soluble carbohydrate concentration and the concentrations of the main individual carbohydrates, i.e., glucose, xylose, and arabinose. As shown in Figure 4, the total soluble carbohydrate concentration increased many times over compared to the UGP after each hydrothermal treatment regardless of the operational conditions. In all cases, most of the sugars were displaced to the liquid fraction by the hydrothermal treatments due to their high solubility, with values of more than 18 times the initial concentration in the UGP [42]. This increase was in line with the reduction in holocellulose observed in the solid phases obtained after the hydrothermal treatments (Table 2) since the degradation of these fibers releases simpler soluble carbohydrates [43].
The operational condition with the greatest impact on the total soluble carbohydrate concentrations was the addition of acid with highest values at 15% v/v of H2SO4, i.e., treatments 3, 4, 7, 8, and 12 (Figure 4). The mean values obtained with the addition of 5%, 10%, and 15% v/v H2SO4 were 173 ± 12, 185 ± 15, and 245 ± 9 g glucose/kg GP, respectively. To a lesser extent, the duration of the hydrothermal treatment was also positively related to an increase in the total soluble carbohydrates, with maximum concentrations at 240 min, i.e., treatments 4 and 8 (Figure 4). The analysis of variance shows that there are no statistical differences between treatments 4, 7, 8, and 12 but that there are such differences between 4 and 3 (Supplementary Material, Table S2).
In addition, as can be seen in Figure 4, the effect of the test conditions on the sum of the principal individual carbohydrates (glucose, xylose, and arabinose) presented a similar trend to that described for the total soluble carbohydrates.
Figure 5 shows the effect of the test conditions on individual carbohydrate solubilization, i.e., the sum of glucose, xylose, and arabinose. Specifically, Figure 5a shows that when the acid concentration was 5% (v/v) and the temperature increased from 65 to 95 °C, the solubilization of individual carbohydrates increased by more than 100%, regardless of the reaction time. However, when the reaction temperature was at its highest (95 °C), the increase in the acid concentration resulted in a 33% increase in solubilization (Figure 5d). Note that the acid effect can be influenced by the working temperature, whereas the reaction time produced a less significant effect (Supplementary Material, Table S1). The slight influence of the operational temperature on the individual carbohydrate compounds at lower acid concentrations may be related to the temperature range, whose values are, in every case, lower than that required for the effective solubilization of part of the fibers [22,42]. Indeed, some authors have reported that temperatures above 150 °C–180 °C would be necessary for the solubilization of hemicelluloses and, minimally, lignin [22,44]. The high efficiency observed by increasing the amount of acid added could be related to an enhancement in the degradation of hemicellulose, which can be effectively converted into soluble sugars via dilute acid hydrolysis [33]. This result is in line with the report by [35] on the hydrothermal treatment of strawberry extrudate. The cited authors reported an enhancement in the total carbohydrate concentration from 40 g/kg of fresh raw material to 65 g/kg of fresh raw material through the addition of 0.5% glacial acetic acid in a hydrothermal treatment at 90 °C and 90 min.
The model relating carbohydrate solubilization to the experimental factors was obtained using Equation (2), where A, B, and C denote time, sulfuric acid, and temperature, respectively (see Supplementary Material, Table S1):
Total   Carbohydrates   g kg   GP = 10.93 + 0.08 A + 2.13 B + 1.02 C + 0.03 A B 0.13 A C 0.94 B C 0.70 A 2 + 1.67 B 2 + 0.68 C 2
The influence of the operational conditions on the composition and concentration of the individual carbohydrate compounds was also observed (Figure 6). Thus, Figure 6 shows that the sum of the concentrations of glucose, xylose, and arabinose represented more than 89% of the total carbohydrate concentrations in all the hydrothermal treatments. Glucose was the most abundant carbohydrate of the three, representing between 55% and 74% of the total carbohydrates. Glucose has been previously defined as the principal carbohydrate in white grape pomace [45], making it very attractive as a feedstock for subsequent fermentation processes [45,46]. Moreover, Table 3 shows that microorganism inhibition is not an issue since the hydrolysate presents a low concentration of inhibitory compounds, such as furfural and HMF, that would reduce metabolic activity [34]. Therefore, the selected range of conditions for the hydrothermal treatment of GP would allow for the solubilization of carbohydrates without accumulating undesirable furans that limit the further valorization of the treated biomass.
The concentrations of xylose and arabinose increased when the severity of the treatment conditions was increased (Figure 6). For the hydrothermal treatments at 65 °C, the variation in the amount of H2SO4 added from 5 to 15% v/v resulted in average increases of around 669% and 45% for xylose and arabinose, respectively, for both hydrothermal treatment durations. Similarly, increasing the operational temperature of the treatment led to an increase in the xylose concentration, although this increase had little impact on the arabinose concentrations (Figure 6). The duration of hydrothermal treatment showed little correlation with variations in the concentrations of xylose and arabinose. The greater influence of the addition of H2SO4 on the solubilization of the sugar monomers xylose and arabinose is related to the capacity of dilute acid hydrolysis to degrade hemicellulose [33], as both xylose and arabinose are generated through this process [45,47]. These compounds are also very promising as substrates for biorefinery processes such as the acquisition of succinic acid [47]. The marked increase over UGP in the concentration of carbohydrates through the proposed acid-assisted hydrothermal treatments will enable the effective amendment of this substrate as a feedstock for different fermentation processes [48,49]. Moreover, the treatment conditions can be varied to adapt individual carbohydrate profiles to the requirements of the process.

4. Conclusions

The proposed treatments allowed for the co-solubilization of phenols and carbohydrates, achieving a solubilization level of around 90% of holocellulose. It was observed that the concentration of acid added had the strongest effect on the solubilization of both phenols and carbohydrates. Nevertheless, increasing the temperature led to reduced solubilization of phenols, while carbohydrate solubilization remained constant. Hydroxytyrosol, p-tyrosol, and DHPG were the main phenols solubilized. Glucose and xylose were the main carbohydrates, reaching up to 245 g glucose/kg GP. These results demonstrate grape pomace’s potential as a raw material for biorefinery processes after the application of a suitable amendment.

Supplementary Materials

The following supporting information can be downloaded at: https://www.mdpi.com/article/10.3390/agronomy13061501/s1: Table S1. Results of test of significance of factors and interaction for the model (⊍ = 0.05); Table S2. ANOVA for statistical analysis of data from Figure 1, Figure 3 and Figure 6; Figure S1. Confocal images for untreated grape pomace and treated grape pomace for treatments 1, 7, and 8. (a–d) lignin (green) and (e–h) cellulose (red).

Author Contributions

Conceptualization, A.S. and F.P.-I.; Funding acquisition, F.P.-I.; Resources, G.C. and F.P.-I.; Investigation, R.M. and F.P.-I.; Writing—Original Draft, A.S., F.P.-I. and G.C.; Writing—original draft, G.C. and F.P.-I.; Writing—review and editing, P.D.-N., R.M., F.P.-I., A.S., J.C.O. and G.C. All authors have read and agreed to the published version of the manuscript.

Funding

This research was funded by Fondecyt Postdoctorado No. 3210626, Agencia Nacional de Investigación y Desarrollo de Chile, ANID.

Data Availability Statement

Not applicable.

Acknowledgments

Fernanda Pinto-Ibieta wishes to acknowledge the financial support provided by ANID FONDECYT POSTDOCTORAL project No. 3210626. Antonio Serrano is grateful to the Economic Transformation, Industry, Knowledge, and Universities Department of the Andalucia Autonomous Government for providing his Emergia fellowship (EMERGIA20_00114).

Conflicts of Interest

The authors declare no conflict of interest. The funders had no role in the design of the study, in the collection, analyses, or interpretation of data, in the writing of the manuscript, or in the decision to publish the results.

References

  1. El Achkar, J.H.; Lendormi, T.; Salameh, D.; Louka, N.; Maroun, R.G.; Lanoisellé, J.-L.; Hobaika, Z. Influence of pretreatment conditions on lignocellulosic fractions and methane production from grape pomace. Bioresour. Technol. 2018, 247, 881–889. [Google Scholar] [CrossRef]
  2. Arboleda Mejia, J.A.; Ricci, A.; Figueiredo, A.S.; Versari, A.; Cassano, A.; Parpinello, G.P.; De Pinho, M.N. Recovery of Phenolic Compounds from Red Grape Pomace Extract through Nanofiltration Membranes. Foods 2020, 9, 1649. [Google Scholar] [CrossRef]
  3. Baroi, A.M.; Popitiu, M.; Fierascu, I.; Ionela-daniela, S.; Fierascu, R.C. Grapevine Wastes: A Rich Source of Antioxidants and Other Biologically Active Compounds. Antioxidants 2022, 11, 393. [Google Scholar] [CrossRef] [PubMed]
  4. Perra, M.; Bacchetta, G.; Muntoni, A.; De Gioannis, G.; Letizia, M.; Manconi, M. Biomedicine & Pharmacotherapy Extraction of the antioxidant phytocomplex from wine-making by-products and sustainable loading in phospholipid vesicles specifically tailored for skin protection. Biomed. Pharmacother. 2021, 142, 111959. [Google Scholar] [CrossRef] [PubMed]
  5. Peixoto, C.M.; Inês, M.; José, M.; Calhelha, R.C.; Barros, L.; Pinho, S.P.; Ferreira, I.C.F.R. Grape pomace as a source of phenolic compounds and diverse bioactive properties. Food Chem. 2018, 253, 132–138. [Google Scholar] [CrossRef] [PubMed] [Green Version]
  6. Arvanitoyannis, I.S.; Ladas, D.; Mavromatis, A. Review article Potential uses and applications of treated wine waste: A review. Int. J. Food Sci. Technol. 2006, 41, 475–487. [Google Scholar] [CrossRef]
  7. Gerardi, G.; Cavia-saiz, M.; Muñiz, P. From winery by-product to healthy product: Bioavailability, redox signaling and oxidative stress modulation by wine pomace product. Crit. Rev. Food Sci. Nutr. 2021, 62, 7427–7448. [Google Scholar] [CrossRef]
  8. Fermoso, F.G.; Serrano, A.; Alonso-farin, B.; Ferna, J.; Borja, R.; Rodr, G. Valuable Compound Extraction, Anaerobic Digestion, and Composting: A Leading Biore fi nery Approach for Agricultural Wastes. J. Agric. Food Chem. 2018, 66, 8451–8468. [Google Scholar] [CrossRef]
  9. Zhu, L.; Zhang, Y.; Deng, J.; Li, H.; Lu, J. Phenolic Concentrations and Antioxidant Properties of Wines Made from North American Grapes Grown in China. Molecules 2012, 17, 3304–3323. [Google Scholar] [CrossRef] [Green Version]
  10. Rodríguez, L.; Toro, M.; Vazquez, F.; Correa-daneri, M.; Gouiric, S.; Vallejo, M. Bioethanol production from grape and sugar beet pomaces by solid-state fermentation. Int. J. Hydrogen Energy 2010, 35, 5914–5917. [Google Scholar] [CrossRef]
  11. Hungría, J.; Siles, J.A.; Chica, A.F.; Gil, A.; Martín, M.A. Anaerobic co-digestion of winery waste: Comparative assessment of grape marc waste and lees derived from organic crops. Environ. Technol. 2020, 42, 3618–3626. [Google Scholar] [CrossRef]
  12. Follonier, S.; Riesen, R.; Zinn, M. Pilot-scale Production of Functionalized mcl-PHA from Grape Pomace Supplemented with Fatty Acids. Chem. Biochem. Eng. Q. 2015, 29, 113–121. [Google Scholar] [CrossRef]
  13. Kovalcik, A.; Pernicova, I.; Obruca, S.; Szotkowski, M.; Enev, V.; Kalina, M.; Marova, I. Food and Bioproducts Processing Grape winery waste as a promising feedstock for the production of polyhydroxyalkanoates and other value-added products. Food Bioprod. Process. 2019, 124, 1–10. [Google Scholar] [CrossRef]
  14. Arenas Sevillano, C.B.; Chiappero, M.; Gomez, X.; Fiore, S.; Martínez, J. Improving the Anaerobic Digestion of Wine-Industry Liquid Wastes: Treatment by Electro-Oxidation and Use of Biochar as an Additive. Energies 2020, 13, 5971. [Google Scholar] [CrossRef]
  15. Siles, J.A.; García-García, I.; Martín, A.; Martín, M.A. Integrated ozonation and biomethanization treatments of vinasse derived from ethanol manufacturing. J. Hazard. Mater. 2011, 188, 247–253. [Google Scholar] [CrossRef]
  16. Zhang, L.; Zhu, M.; Shi, T.; Gui, C.; Huang, Y.; Chen, Y.; Xie, M. Recovery of dietary fiber and polyphenols from grape juice pomace and evaluation of their functional properties and polyphenol composition. Food Funct. 2017, 8, 341–351. [Google Scholar] [CrossRef]
  17. De Sá, M.; Justino, V.; Spranger, M.I.; Zhao, Y.Q.; Han, L.; Sun, B.S. Extraction Yields and Anti-oxidant Activity of Proanthocyanidins from Different Parts of Grape Pomace: Effect of Mechanical Treatments. Phytochem. Anal. 2014, 25, 134–140. [Google Scholar] [CrossRef]
  18. Filippi, K.; Papapostolou, H.; Alexandri, M.; Vlysidis, A.; Myrtsi, E.D.; Ladakis, D.; Pateraki, C.; Haroutounian, S.A.; Koutinas, A. Integrated biorefinery development using winery waste streams for the production of bacterial cellulose, succinic acid and value-added fractions. Bioresour. Technol. 2022, 343, 125989. [Google Scholar] [CrossRef]
  19. Negro, C.; Tommasi, L.; Miceli, A. Phenolic compounds and antioxidant activity from red grape marc extracts. Bioresour. Technol. 2003, 87, 41–44. [Google Scholar] [CrossRef]
  20. Drevelegka, I.; Goula, A.M. Chemical Engineering & Processing: Process Intensi fi cation Recovery of grape pomace phenolic compounds through optimized extraction and adsorption processes. Chem. Eng. Process. Process Intensif. 2020, 149, 107845. [Google Scholar] [CrossRef]
  21. Mora-Garrido, A.B.; Cejudo-Bastante, M.J.; Heredia, F.J.; Escudero-Gilete, L.M. Revalorization of residues from the industrial exhaustion of grape. LWT Food Sci. Technol. 2022, 156, 113057. [Google Scholar] [CrossRef]
  22. Hendriks, A.T.W.M.; Zeeman, G. Pretreatments to enhance the digestibility of lignocellulosic biomass. Bioresour. Technol. 2009, 100, 10–18. [Google Scholar] [CrossRef] [PubMed]
  23. Serrano, A.; Fermoso, F.G.; Rodríguez-gutierrez, G.; Fernandez-bolaños, J.; Borja, R. Biomethanization of olive mill solid waste after phenols recovery through low-temperature thermal pre-treatment. Waste Manag. 2017, 61, 229–235. [Google Scholar] [CrossRef] [PubMed] [Green Version]
  24. Cubero-cardoso, J.; Trujillo-reyes, Á.; Marín-Ayllón, P.; Rodr, G.; Villa-gomez, D.; Serrano, A.; Borja, R.; Fermoso, F.G. Solubilization of Phenols and Sugars from Raspberry Extrudate by Hydrothermal Treatments. Processes 2020, 8, 842. [Google Scholar] [CrossRef]
  25. Serrano, A.; Fermoso, F.G.; Alonso-Fariñas, B.; Rodríguez-Gutierrez, G.; Fernandez-Bolaños, J.; Borja, R. Phenols recovery after steam explosion of Olive Mill Solid Waste and its influence on a subsequent biomethanization process. Bioresour. Technol. 2017, 243, 169–178. [Google Scholar] [CrossRef] [Green Version]
  26. Jain, S.; Jain, S.; Wolf, T.I.; Lee, J.; Tong, Y.W. A comprehensive review on operating parameters and different pretreatment methodologies for anaerobic digestion of municipal solid waste. Renew. Sustain. Energy Rev. 2015, 52, 142–154. [Google Scholar] [CrossRef]
  27. Rowell, R. The Chemistry of Solid Wood. Based on Short Course Andsymposium Sponsored by the Division of Cellulose, Paper and Textile Chemistry. In Proceedings of the 185th Meeting of the American Chemical Society, Seattle, Washington, DC, USA, 20–25 March 1983; pp. 70–72. [Google Scholar]
  28. Tappi Test Methodos Standard Methods for Pulp and Paper, Technical Association of the Pulp and Paper Industry; Tappi Press: Atlanta, GA, USA, 1997.
  29. APHA. Standard Methods for the Examination of Water and Wastewater, 21st ed.; American Public Health Association: Washington, DC, USA, 2005. [Google Scholar]
  30. Rocha, S.; Marzialetti, T.; Kopp, M.; Cea, M. Reaction Mechanism of the Microwave-Assisted Synthesis of 5-Hydroxymethylfurfural from Sucrose in Sugar Beet Molasses. Catalysts 2021, 11, 1458. [Google Scholar] [CrossRef]
  31. Benavides, V.; Pinto-Ibieta, F.; Serrano, A.; Rubilar, O.; Ciudad, G. Use of Anthracophyllum discolor and Stereum hirsutum as a Suitable Strategy for Delignification and Phenolic Removal of Olive Mill Solid Waste. Foods 2022, 11, 1587. [Google Scholar] [CrossRef]
  32. Romero-Román, M.E.; Schoebitz, M.; Fuentealba, J.; García-Viguera, C.; López Belchí, M.D.; Voilley, A.; Kurek, M. Phenolic Compounds in Calafate Berries Encapsulated by Spray Drying: Neuroprotection Potential into the Ingredient. Antioxidants 2021, 10, 1830. [Google Scholar] [CrossRef]
  33. Yang, B.; Wyman, C.E. Pretreatment: The key to unlocking low-cost cellulosic ethanol. Biofuels Bioprod. Biorefining 2008, 2, 26–40. [Google Scholar] [CrossRef]
  34. Ghasimi, D.S.M.; Aboudi, K.; De Kreuk, M.; Zandvoort, M.H.; Lier, J.B. Van Impact of lignocellulosic-waste intermediates on hydrolysis and methanogenesis under thermophilic and mesophilic conditions. Chem. Eng. J. 2016, 295, 181–191. [Google Scholar] [CrossRef]
  35. Rodríguez-gutiérrez, G.; Cardoso, J.C.; Rubio-senent, F.; Serrano, A.; Borja, R.; Fernández-bolaños, J.; Fermoso, F.G. Thermally-treated strawberry extrudate: A rich source of antioxidant phenols and sugars. Innov. Food Sci. Emerg. Technol. 2019, 51, 186–193. [Google Scholar] [CrossRef] [Green Version]
  36. Hübner, A.A.; Sarruf, F.D.; Oliveira, C.A.; Neto, A.V.; Fischer, D.C.H.; Kato, E.T.M.; Lourenço, F.R.; Baby, R.; Bacchi, E.M. Safety and Photoprotective E ffi cacy of a Sunscreen System Based on Grape Pomace (Vitis vinifera L.) Phenolics from Winemaking. Pharmaceutics 2020, 12, 1148. [Google Scholar] [CrossRef]
  37. Yao, Y.; Wu, M.; Huang, Y.; Li, C.; Pan, X.; Zhu, W.; Huang, Y. Appropriately raising fermentation temperature beneficial to the increase of antioxidant activity and gallic acid content in Eurotium cristatum-fermented loose tea. LWT Food Sci. Technol. 2017, 82, 248–254. [Google Scholar] [CrossRef]
  38. Nobre, D.; Macedo, W.; Silva, G.; Lopes, L.; Jaimes, E. Aplicación y efecto antioxidante del ácido gálico sobre la calidad de semillas de trigo—Application and effect antioxidant of gallic acid on the quality of wheat seeds. Rev. Ciencias Agrar. 2019, 42, 22–29. [Google Scholar] [CrossRef]
  39. Bermúdez-Oria, A.; Rodríguez-Gutiérrez, G.; Fernández-Prior, Á.; Vioque, B.; Fernández-Bolaños, J. Strawberry dietary fiber functionalized with phenolic antioxidants from olives. Interactions between polysaccharides and phenolic compounds. Food Chem. 2019, 280, 310–320. [Google Scholar] [CrossRef] [Green Version]
  40. Gallardo-Fernández, M.; Gonzalez-Ramirez, M.; Cerezo, A.B.; Troncoso, A.M.; Garcia-Parrilla, M.C. Hydroxytyrosol in Foods: Analysis, Food Sources, EU Dietary Intake, and Potential Uses. Foods 2022, 11, 2355. [Google Scholar] [CrossRef]
  41. Ciriminna, R.; Meneguzzo, F.; Fidalgo, A.; Ilharco, L.M.; Pagliaro, M. Review Article Extraction, bene fi ts and valorization of olive polyphenols. Eur. J. Lipid Sci. Technol. 2016, 118, 503–511. [Google Scholar] [CrossRef]
  42. Serrano, A.; Fermoso, F.G.; Alonso-Fariña, B.; Rodríguez-gutierrez, G.; Fernandez-bolaños, J.; Borja, R. Olive mill solid waste biorefinery: High-temperature thermal pre- treatment for phenol recovery and biomethanization. J. Clean. Prod. 2017, 148, 314–323. [Google Scholar] [CrossRef] [Green Version]
  43. Gómez Millán, G.; Hellsten, S.; Llorca, J.; Luque, R.; Sixta, H.; Balu, A.M. Recent Advances in the Catalytic Production of Platform Chemicals from Holocellulosic Biomass. ChemCatChem 2019, 11, 2022–2042. [Google Scholar] [CrossRef]
  44. Garrote, G.; Domínguez, H.; Parajó, J. Hydrothermal processing of lignocellulosic materials. Holz Roh Und Werkst. 1999, 57, 191–202. [Google Scholar] [CrossRef]
  45. Jin, Q.; Hair, J.O.; Stewart, A.C.; Keefe, S.F.O.; Neilson, A.P.; Kim, Y.; Mcguire, M.; Lee, A.; Huang, H. Compositional Characterization of Different Industrial White and Red Grape Pomaces in Virginia and the Potential Valorization of the Major Components. Foods 2019, 8, 667. [Google Scholar] [CrossRef] [Green Version]
  46. Corbin, K.R.; Hsieh, Y.S.Y.; Betts, N.S.; Byrt, C.S.; Stork, J.; Debolt, S.; Fincher, G.B.; Burton, R.A. Grape marc as a source of carbohydrates for bioethanol: Chemical composition, pre-treatment and saccharification. Bioresour. Technol. 2015, 193, 76–83. [Google Scholar] [CrossRef] [PubMed]
  47. Dussan, K.; Girisuta, B.; Lopes, M.; Leahy, J.J. Conversion of hemicellulose sugars catalyzed by formic acid: Kinetics of the dehydration of D-xylose, L-arabinose, and D-glucose. ChemSusChem 2015, 8, 1411–1428. [Google Scholar] [CrossRef] [PubMed]
  48. Pinto-Ibieta, F.; Serrano, A.; Cea, M.; Ciudad, G.; Fermoso, F.G. Beyond PHA: Stimulating intracellular accumulation of added-value compounds in mixed microbial cultures. Bioresour. Technol. 2021, 337, 125381. [Google Scholar] [CrossRef]
  49. Rodriguez-Perez, S.; Serrano, A.; Pantión, A.A.; Alonso-Fariñas, B. Challenges of scaling-up PHA production from waste streams. A review. J. Environ. Manag. 2018, 205, 215–230. [Google Scholar] [CrossRef] [Green Version]
Figure 1. Total soluble phenolic compounds for untreated grape pomace (UGP) and grape pomace treated under different conditions.
Agronomy 13 01501 g001
Figure 2. Total-soluble-phenols-related responses observed via surface response methodology. Factors tested: (a) sulfuric acid concentration versus reaction time at 65 °C; (b) sulfuric acid concentration versus reaction time at 95 °C; (c) temperature versus time using 15% v/v of H2SO4; (d) temperature versus sulfuric acid at 240 min of operational time.
Agronomy 13 01501 g002
Figure 3. Antioxidant power for untreated grape pomace (UGP) and treated grape pomace at different hydrothermal treatment conditions.
Agronomy 13 01501 g003
Figure 4. Total carbohydrates and sum of individual carbohydrates (glucose, xylose, and arabinose) for untreated grape pomace (UGP) and grape pomace after different hydrothermal treatments.
Agronomy 13 01501 g004
Figure 5. Three-dimensional surface plots of effect on individual carbohydrate solubilization regarding (a) temperature versus reaction time using 5% (v/v) of H2SO4; (b) temperature versus reaction time using 15% (v/v) of H2SO4; (c) sulfuric acid versus time at 65 °C; and (d) sulfuric acid versus time at 95 °C.
Agronomy 13 01501 g005
Figure 6. Individual soluble sugars (glucose, xylose, and arabinose) after treatment of grape pomace under different conditions.
Agronomy 13 01501 g006
Table 1. Three-factor central composite design with 6 central points.
Treatment NumberDuration
(min)
H2SO4
(v/v)
Temperature
(°C)
1120565
2240565
31201565
42401565
5120595
6240595
71201595
82401595
91201080
102401080
11180580
121801580
131801065
141801095
151801080
Table 2. Characterization of untreated grape pomace (UGP), and the solid phases obtained after hydrolysis of grape pomace (GP).
Treatment NumberLignin Residue
(%w/w)
Holocellulose Residue
(%w/w)
Lignin
Solubilization
(%w/w)
Holocellulose Solubilization (%w/w)Total
Solids
(g/kg)
Volatile Solids
(g/kg)
VS/TS
UGP35.2 ± 559.6 ± 5.7--10.0 ± 1.28.9 ± 2.10.90
132.1 ± 2.721.9 ± 0.78.963.260.9 ± 3.159.8 ± 4.30.98
230.0 ± 2.922.6 ± 3.214.862.063.3 ± 7.162.2 ± 7.30.98
330.6 ± 3.114.2 ± 2.113.076.1126.2 ± 7.6124.9 ± 10.30.99
430.8 ± 5.211.7 ± 1.612.580.3128.5 ± 5.2126.7 ± 7.40.99
530.8 ± 1.218.2 ± 0.612.669.4126.0 ± 8.1124.0 ± 8.30.98
629.5 ± 4.019.1 ± 0.816.168.082.2 ± 5.480.5 ± 6.10.98
731.5 ± 2.39.9 ± 1.610.583.4126.7 ± 3.2124.9 ± 6.20.99
833.0 ± 2.74.7 ± 0.66.392.1125.1 ± 5.1123.4 ± 9.30.99
932.3 ± 2.617.2 ± 1.68.171.2128.7 ± 4.2127.7 ± 8.20.98
1031.6 ± 2.716.9 ± 1.610.371.6102.9 ± 2.4101.3 ± 6.40.98
1130.6 ± 4.118.5 ± 0.913.068.962.8 ± 7.861.3 ± 3.40.97
1231.0 ± 2.49.5 ± 1.611.984.1129.4 ± 12.2127.5 ± 8.30.99
1331.8 ± 2.115.1 ± 1.69.574.7128.4 ± 6.2125.8 ± 9.20.99
1432.3 ± 3.117.2 ± 0.68.471.2107.5 ± 4.3105.4 ± 3.50.98
1533.4 ± 1.918.6 ± 2.85.068.8101.1 ± 4.699.4 ± 3.40.98
UGP: untreated grape pomace; w/w: weight/weight; VS: volatile solids; TS: total solids.
Table 3. Characterization of the liquid phase of untreated grape pomace (UGP) with the liquid phases obtained after hydrothermal treatments of grape pomace (GP).
Treatment
Number
sCOD
(mg/kg)
Furfural
(g/L)
HMF
(g/L)
Acetic Acid
(mg/kg)
UGP594 ± 5n.d.n.d.n.d.
1754 ± 18n.d.n.d.4.6 ± 0.3
2715 ± 21n.d.n.d.4.6 ± 0.4
3955 ± 12n.d.n.d.9.3 ± 0.8
4940 ± 50.43 ± 0.01<0.0059.4 ± 0.9
5850 ± 17n.d.<0.0058.6 ± 1.1
6740 ± 190.008 ± 0.01<0.0058.4 ± 0.1
7944 ± 8n.d.0.05 ± 0.0059.3 ± 1.1
8929 ± 290.29 ± 0.03<0.0059.1 ± 1.4
9748 ± 19n.d.<0.0058.6 ± 0.9
10753 ± 5n.d.<0.0058.3 ± 0.9
11748 ± 5n.d.n.d.7.7 ± 0.6
12959 ± 90.38 ± 0.02<0.0059.3 ± 0.9
13732 ± 5n.d.n.d.6.7 ± 1.1
14626 ± 560.36 ± 0.02<0.0054.8 ± 0.7
15753.3 ± 34n.d.<0.0058.2 ± 0.8
n.d.—Not detected; UGP—untreated grape pomace; sCOD—soluble chemical oxygen demand; HMF—Hydroxymethylfurfural.
Table 4. Concentrations of individual phenolic compounds and furans obtained in untreated grape pomace (UGP) and in the liquid fractions obtained after each hydrothermal treatment; data are expressed as mg/kg.
UGP123456789101112131415
Phenolic acid
P-hydroxybenzoic acid1 ± 143 ± 142 ± 261 ± 265 ± 470 ± 363 ± 490 ± 568 ± 356 ± 366 ± 262 ± 272 ± 661 ± 460 ± 455 ± 3
Gallic acid hexoside2 ± 1138 ± 3138 ± 5134 ± 352 ± 2116 ± 4102 ± 5128 ± 7123 ± 3111 ± 5108 ± 3110 ± 3111 ± 2114 ± 173 ± 2103 ± 2
Protocatechuic acid hexoside n.d.1 ± 122 ± 15 ± 12 ± 0.34 ± 17 ± 118 ± 15 ± 17 ± 110 ± 110 ± 120 ± 13 ± 120 ± 014 ± 0.4
Vanillic acid2 ± 126 ± 125 ± 164 ± 156 ± 158 ± 152 ± 154 ± 153 ± 146 ± 146 ± 142 ± 166 ± 337 ± 152 ± 255 ± 0.3
Coutaric acidn.d.1 ± 1<12 ± 13 ± 14 ± 0.12 ± 11 ± 12 ± 14 ± 14 ± 12 ± 12 ± 11 ± 14 ± 13 ± 0.2
Caffeic acidn.d.6 ± 16 ± 1n.d.5 ± 14 ± 0.3n.d.n.d.n.d.4 ± 1n.d.4 ± 15 ± 13 ± 13 ± 1n.d.
Caftaric acidn.d.n.d.n.d.4 ± 19 ± 1n.d.4 ± 15 ± 15 ± 14 ± 15 ± 1n.d.7 ± 1n.d.8 ± 15 ± 0.2
P-coumaric acidn.d.2 ± 12 ± 1n.d.n.d.n.d.n.d.n.d.n.d.n.d.n.d.n.d.n.d.n.d.n.d.n.d.
Ferulic acid<1n.d.n.d.n.d.n.d.n.d.n.d.n.d.n.d.n.d.n.d.n.d.n.d.n.d.n.d.n.d.
Chlorogenic acidn.d.n.d.n.d.n.d.n.d.n.d.n.d.n.d.n.d.n.d.n.d.n.d.n.d.n.d.n.d.n.d.
Ellagic acidn.d.n.d.n.d.n.d.n.d.n.d.n.d.n.d.n.d.n.d.n.d.n.d.n.d.n.d.n.d.n.d.
Phenolic Derivatives
3,4-dihydroxyphenylglycol49 ± 2144 ± 3138 ± 2159 ± 443 ± 3151 ± 4213 ± 5264 ± 5244 ± 4168 ± 7177 ± 8132 ± 874 ± 5160 ± 1260 ± 5168 ± 12
3-hydroxytyrosol<135 ± 136 ± 180 ± 21330 ± 22198 ± 2425 ± 5504 ± 7465 ± 12150 ± 3204 ± 8241 ± 2109 ± 2200 ± 10830 ± 16187 ± 11
p-tyrosoln.d.35 ± 113 ± 149 ± 1107 ± 2286 ± 351 ± 15 ± 0.153 ± 191 ± 278 ± 292 ± 21 ± 0.0129 ± 2102 ± 190 ± 0.1
Vanillin1 ± 16 ± 17 ± 18 ± 126 ± 115 ± 110 ± 110 ± 111 ± 110 ± 110 ± 113 ± 121 ± 18 ± 124 ± 110 ± 0.1
4-methyl catecholn.d. n.d.n.d.11 ± 180 ± 2n.d.n.d.84 ± 1n.d.n.d.n.d.n.d.n.d.n.d.n.d.n.d.
Syringoln.d. n.d.n.d.n.d.21 ± 1n.d.n.d.n.d.n.d.n.d.n.d.n.d.n.d.n.d.24 ± 1n.d.
3,4-dimethyl benzyl alcohol1 ± 1n.d.n.d.n.d.21 ± 1n.d.n.d.n.d.n.d.n.d.n.d.n.d.n.d.n.d.24 ± 1n.d.
Flavonols
Catechinn.d.n.d.n.d.19 ± 1n.d.n.d.n.d.4 ± 0.110 ± 1n.d.n.d.n.d.8 ± 1n.d.2 ± 1n.d.
Epicatechin1 ± 15 ± 14 ± 110 ± 14 ± 114 ± 18 ± 15 ± 19 ± 19 ± 110 ± 19 ± 116 ± 18 ± 112 ± 17 ± 0.2
Quercetin-3-rutinoside2 ± 15 ± 1n.d.5 ± 0.4n.d.n.d.n.d.n.d.n.d.n.d.n.d.n.d.n.d.n.d.n.d.n.d.
Quercetin-3-glucoside2 ± 1n.d.n.d.n.d.n.d.n.d.n.d.n.d.n.d.n.d.n.d.n.d.n.d.n.d.n.d.n.d.
Quercetin-3-glucuroniden.d.n.d.n.d.n.d.n.d.n.d.n.d.n.d.n.d.n.d.n.d.n.d.n.d.n.d.n.d.n.d.
Myricetinn.d.n.d.n.d.n.d.n.d.n.d.n.d.n.d.n.d.n.d.n.d.n.d.n.d.n.d.n.d.n.d.
Quercetinn.d.n.d.n.d.n.d.n.d.n.d.n.d.n.d.n.d.n.d.n.d.n.d.n.d.n.d.n.d.n.d.
Kaempferol-3-glucosiden.d.n.d.n.d.n.d.n.d.n.d.n.d.n.d.3 ± 1n.d.n.d.n.d.2 ± 1n.d.2 ± 1n.d.
Kaempferol-3-hexosiden.d.n.d.n.d.n.d.n.d.n.d.n.d.n.d.n.d.n.d.n.d.n.d.n.d.n.d.n.d.n.d.
UGP—Untreated Grape Pomace; n.d.—Not Detected.
Disclaimer/Publisher’s Note: The statements, opinions and data contained in all publications are solely those of the individual author(s) and contributor(s) and not of MDPI and/or the editor(s). MDPI and/or the editor(s) disclaim responsibility for any injury to people or property resulting from any ideas, methods, instructions or products referred to in the content.

