Article

Dairy Manure-Derived Biochar in Soil Enhances Nutrient Metabolism and Soil Fertility, Altering the Soil Prokaryote Community

1
Texas A&M AgriLife Research, 1229 North US Highway 281, Stephenville, TX 76401, USA
2
Texas A&M Institute for Genome Sciences and Society, 206 Olsen Blvd, 440 Reynolds Medical Building, College Station, TX 77843, USA
3
Department of Wildlife and Natural Resources, Tarleton State University, P.O. Box T-0050, Stephenville, TX 76402, USA
*
Author to whom correspondence should be addressed.
Agronomy 2023, 13(6), 1512; https://doi.org/10.3390/agronomy13061512
Submission received: 27 April 2023 / Revised: 22 May 2023 / Accepted: 26 May 2023 / Published: 30 May 2023
(This article belongs to the Section Soil and Plant Nutrition)

Abstract

:
Although various studies have investigated biochar (BC) soil amendments for improving soil microbial abundance, functions, and community structure, a comparison of dairy manure biochar (MBC) to wood biochar (WBC) is warranted given the large volume of manure produced in high-intensity dairy production. Additionally, the synergistic effects of different BC sources and loading percentages on microbial functions and community composition using massively parallel 16S DNA sequencing in BC-amended soils with different types of crops are limited. In this study, the synergistic effects of BC type, BC loading percentage, and crop types on soil fertility, prokaryote community diversity, and functions were investigated in a greenhouse study. The MBC and WBC were used to amend sandy loam soils at increasing BC loading percentages (0, 5, and 10%) to grow the cool-season forages crimson clover (Trifolium incarnatum; an annual legume) and Italian ryegrass (Lolium multiflorum Lam.; an annual forage grass) for 120 days. High nutrient concentrations in MBC shifted microbial communities towards r-strategists and alkaliphiles, potentially increasing the rate of nutrient bioremediation from high nitrogen- and phosphorus-containing soil amendments. This study enables emerging biochar agronomic use recommendations with different crops.

1. Introduction

Many dairies in Texas are in regions prone to drought with sandy loam soils that are low in organic matter. About 30 tons of dairy manure is produced per 400 cows per day and most of it is currently being land applied [1]. Current land application of dairy manure to soil and plants can cause negative impacts on the environment such as phosphorus (P) and nitrogen (N) pollution of groundwater, pathogen propagation and contamination, spread of antibiotic-resistant bacteria and genes, etc. [2,3]. One way to alleviate these negative effects is to convert dairy manure to biochar (BC) used as a slow-release fertilizer for crops.
BC is a porous carbon material produced by pyrolysis of various solid wastes under oxygen-limited conditions including animal manure, crop residues, grass, and forest waste [4]. It exhibits a wide range of physicochemical properties based on feedstock [5], and pyrolysis conditions [6]. BC has been applied in agricultural production because of several benefits it confers to the soil, crop, and environment, such as adsorption and removal of organic pollutants and enhanced crop fertility [2]. BC is a far more stable source of soil carbon than dairy manure on a scale of decades to centuries. Additionally, MBC from dairy production can contain high N and P content. These nutrients, when adsorbed to MBC, are released slowly and become available to plants and microbes over longer periods [7], valorizing the nutrients for agronomic use and decreasing loss to the environment. Moreover, several BC types, including those derived from hardwood, increase the water-holding capacity of soils with low organic matter [5,8,9] providing an additional agronomic benefit.
Soil as an ecosystem provides a wide range of important services such as nutrient cycling, plant nutrition, bioremediation of pollutants, pest control, and regulation of greenhouse gas emissions. Soil microorganisms play a vital role in soil ecosystem functions and services such as driving biogeochemical cycles, suppressing pathogens, and maintaining soil quality and health [10]. The effect of soil physicochemical properties on soil microbial communities is well acknowledged [11,12,13]. Application of BC to soils changes soil physicochemical properties such as density, porosity, aggregation, organic carbon, nutrients, water retention capacity, and pH, thus highly stimulating the activities of soil microorganisms that influence soil quality and plant performance. Modification of soil physicochemical conditions may positively or negatively affect soil microbial community structure and functions [10]. However, despite the importance of microbial community changes with BC amendment to soil, a detailed understanding of BC types and loading rates on soil microorganisms is less clear than its influence on soil physicochemical properties [10]. In addition, the effect of BC on soil microbial functions simultaneously tested on different crop types are also limited. BC’s effect on microbial communities can largely depend on BC feedstock and application rates, soil types [14], and BC’s ability to provide sufficient labile C or N substrates. Soil enzyme activity in BC-amended soils is dependent on the chemical composition of BC, BC application rate, type of soil, and the nature of soil enzymes [10,15]. The highly porous nature of BC and its high surface area are favorable habitats for soil biota [16,17]. The net effects of BC on soil enzyme activities can be indirect (e.g., microbial synthesis) and direct (e.g., surface adsorption) [2]. MBC application may affect microbial and enzymatic activities by increasing the availability of resources by adding labile C relative to WBC as well as by changing the soil environment [15]. BCs with a higher pH, lower C/N ratio, or produced at pyrolysis temperatures of 350–550 °C had greater effects on microbial biomass and enzymatic activities [15]. Even though the chemical and physical properties of BC have been well studied, BC’s effects on the biological functions of soil, particularly using massively parallel DNA sequencing, have not been extensively studied.
The effect of BC on soil microbial community structure, composition, and functions is inconclusive [10]. While most studies [1,18,19,20,21] have demonstrated positive effects of BC-soil application on soil microbial biomass with substantial changes in microbial community composition, some studies [13,22,23,24,25] have reported negative effects, while others [14,26] have reported negligible effects of BC application on the soil microbial community. This may be due to the varying soil types, experimental conditions, and properties of BC that vary based on feedstock, pyrolysis temperature and duration, and BC application rate. Hence, there is a need to investigate specific effects of available BCs on soil microbial community structure, composition, and functions when applied at specific sites. Moreover, the use of manure biochar (MBC) for horticulture and organic farming is not permitted when compared to wood BC (WBC) because of concerns for human pathogens and other contaminants such as heavy metals [27,28,29], hence the need to assess its potential use and importance for horticulture and general agricultural systems before providing management recommendations. Thus, in this study, we tested the effect of different BC types (manure-derived and wood-derived), loading rates (0, 5, and 10% (w/w)), and crop types (crimson clover or Italian ryegrass) on the soil prokaryote community structure, composition, and functions in a 3-month greenhouse experiment using 16S amplicon sequencing. This paper aligns with an agronomic evaluation of MBC and WBC impacts on crop production and soil physicochemical parameters [30]. We hypothesized that BC type and BC loading percentage would have significant effects on the microbial communities while crop type would also impact community structure.

2. Materials and Methods

2.1. Study Area and Experimental Design

A greenhouse pot study was conducted over a 120-day period at the Texas A&M AgriLife Research Center at Stephenville (32.245431° N, −98.197204° W). Each pot was considered an experimental unit and all treatment combinations were replicated four times. This was a three-factorial experiment: BC type (no BC, wood- (WBC) and manure-derived BCs (MBC)), BC loading rate (0, 5, and 10%), and crop type (crimson clover (Trifolium incarnatum L.) and Italian ryegrass (Lolium multiflorum Lam.)), and control pots with no plant; 72 greenhouse pots (2 biochar types (WBC, MBC) × 3 loading rates (0%, 5%, 10%) × 3 crop types (Italian ryegrass, crimson clover, no plant control) × 4 reps/treatment) were filled with 3 kg soil on a dry matter basis, and placed in the greenhouse in a randomized complete block design. Each of the 72 pots contained sandy loam soil collected from the top 20 cm of a Windthorst fine sandy loam (USDA, 2020) in Stephenville, TX, and each was homogenized. There were 2 types of BC in this experiment originating from manure (Ecochar, Evansville, IN, USA) and wood (Waste to Energy, Inc., South Slocomb, AL, USA). The wood biochar used in this study was a commercially sold biochar derived from hardwood. The physicochemical properties of the BCs and soil used in this study are presented in Table S1. Each BC was loaded into 48 pots on a dry matter weight percentage soil replacement. Of the 72 pots, 24 received 0% BC (0.00 kg), 24 pots received 5% BC (0.15 kg), and 24 pots received 10% BC (0.30 kg). After thoroughly homogenizing the soil and BC in each pot, crimson clover was seeded in 4 pots of each treatment combination, Italian ryegrass in 4 pots of each treatment combination, and the remaining 4 pots contained no plants. Once plants were fully established at 2 weeks, they were thinned down to 2 plants per pot. Pots were watered as needed at approximately 5–7 days and leachate was recycled back into the soil. The companion paper of the agronomic analysis from this study [30] also included biochar saturated with dairy lagoon effluent. Effects of effluent-saturated biochar on the microbiome were not statistically different from the effects of manure biochar. Here, we only report the effects of manure biochar.

2.2. Data Collection and Chemical Analysis

After 120 days, a sub-sample of soil was taken from each pot using a soil probe to minimize root loss and account for a complete cross-section of soil in each pot. The soil collected was allowed to air-dry under room temperature conditions for all chemical assays, while soil samples for microbial experiments were immediately frozen. Soil samples were assayed for pH, electrical conductivity (EC), and nutrients by Texas A&M AgriLife Extension Service—Soil, Water, and Forage Testing Laboratory using extractants described in study [31]. The analysis included pH, EC, P, K, Ca, and Na. Additionally, soil NO3-N data were tested using a Cd reduction [32,33].

2.3. Sequence Library Preparation and Sequencing

Undried bulk soil samples were collected from each pot and genomic DNA was extracted in triplicate using DNeasy PowerSoil Kits (Qiagen, Germantown, MD, USA) from 0.25 g of soil following the manufacturer’s instructions. The 16S rRNA V4 hypervariable region was PCR amplified using Illumina adaptor-ligated universal primers (Supplementary Table S2) from each triplet. The thermocycler conditions were 94 °C for 3 min, followed by 25 cycles of 94 °C for 30 s, 55 °C for 30 s, 72 °C for 30 s, and a final extension of 72 °C for 3 min. PCR products were size-selected (400–600 bp) on a Pippin prep instrument (Sage Science, Beverly, MA). Size-selected sequencing libraries were sent to the Texas A&M University Genomics and Bioinformatics Service, College Station, TX, USA, for sequencing on an Illumina MiSeq instrument (Illumina, San Diego, CA, USA) using a v3 600 cycle sequencing kit to produce 300 bp paired-end reads.

2.4. Bioinformatics Analysis

2.4.1. Creating Feature Tables and Assigning Taxonomy Using QIIME2

Feature table generation, taxonomy assignment, and function annotation analyses were performed using the Snakemake QIIME2 pipeline available at https://github.com/olabiyi/snakemake-workflow-qiime2 (accessed on 1 April 2023). Briefly, raw sequences were processed using QIIME2 (q2) version 2021.2 [34]. Sequences were imported and demultiplexed using the PairedEndFastqManifestPhred33 format of QIIME2. Primers and adaptors were trimmed using Cutadapt [35] through the q2-cutadapt plugin. Quality control, merging, chimera removal, denoising, and amplicon sequence variants (ASV) featuring table generation were performed using the q2-dada2 plugin [36]. The p-trunc-len-f and p-trunc-len-r dada2 parameters were set to 260 and 200, respectively. These parameters were set only after observing the sequence quality distribution by length plot. ASV taxonomic classifiers were generated using the Silva 138-nb 99% reference database [37]. The q2-feature-classifier plugin was used to assign taxonomy to the representative ASV sequences using Scikit-learn [38] with the generated classifiers. Singletons, rare ASVs, that is, ASVs with sequences <0.005% of the total number of sequences [39] were excluded from the analyses and non-target ASVs filtered out of the ASV table. Sequences classified as Unassigned, Chloroplast, Mitochondria, and Eukaryota were filtered out of the ASV table.

2.4.2. Diversity Analysis

The ASV table artifact was imported into R from QIIME2 using QIIME2R [40] and rarefied to even depth—3107 for alpha (within samples) and beta (between samples) diversity using Phyloseq [41]. To estimate alpha diversity, the total number of observed features, Chao1, Simpson, Shannon’s diversity index (H′), and rarefaction curves were generated. Indices of observed features and Chao1 represented the community richness while Simpson and Shannon represented the community diversity. For beta diversity—displaying the magnitude of dissimilarity between two or more communities—a Bray– Curtis distance matrix was generated using vegan [42].

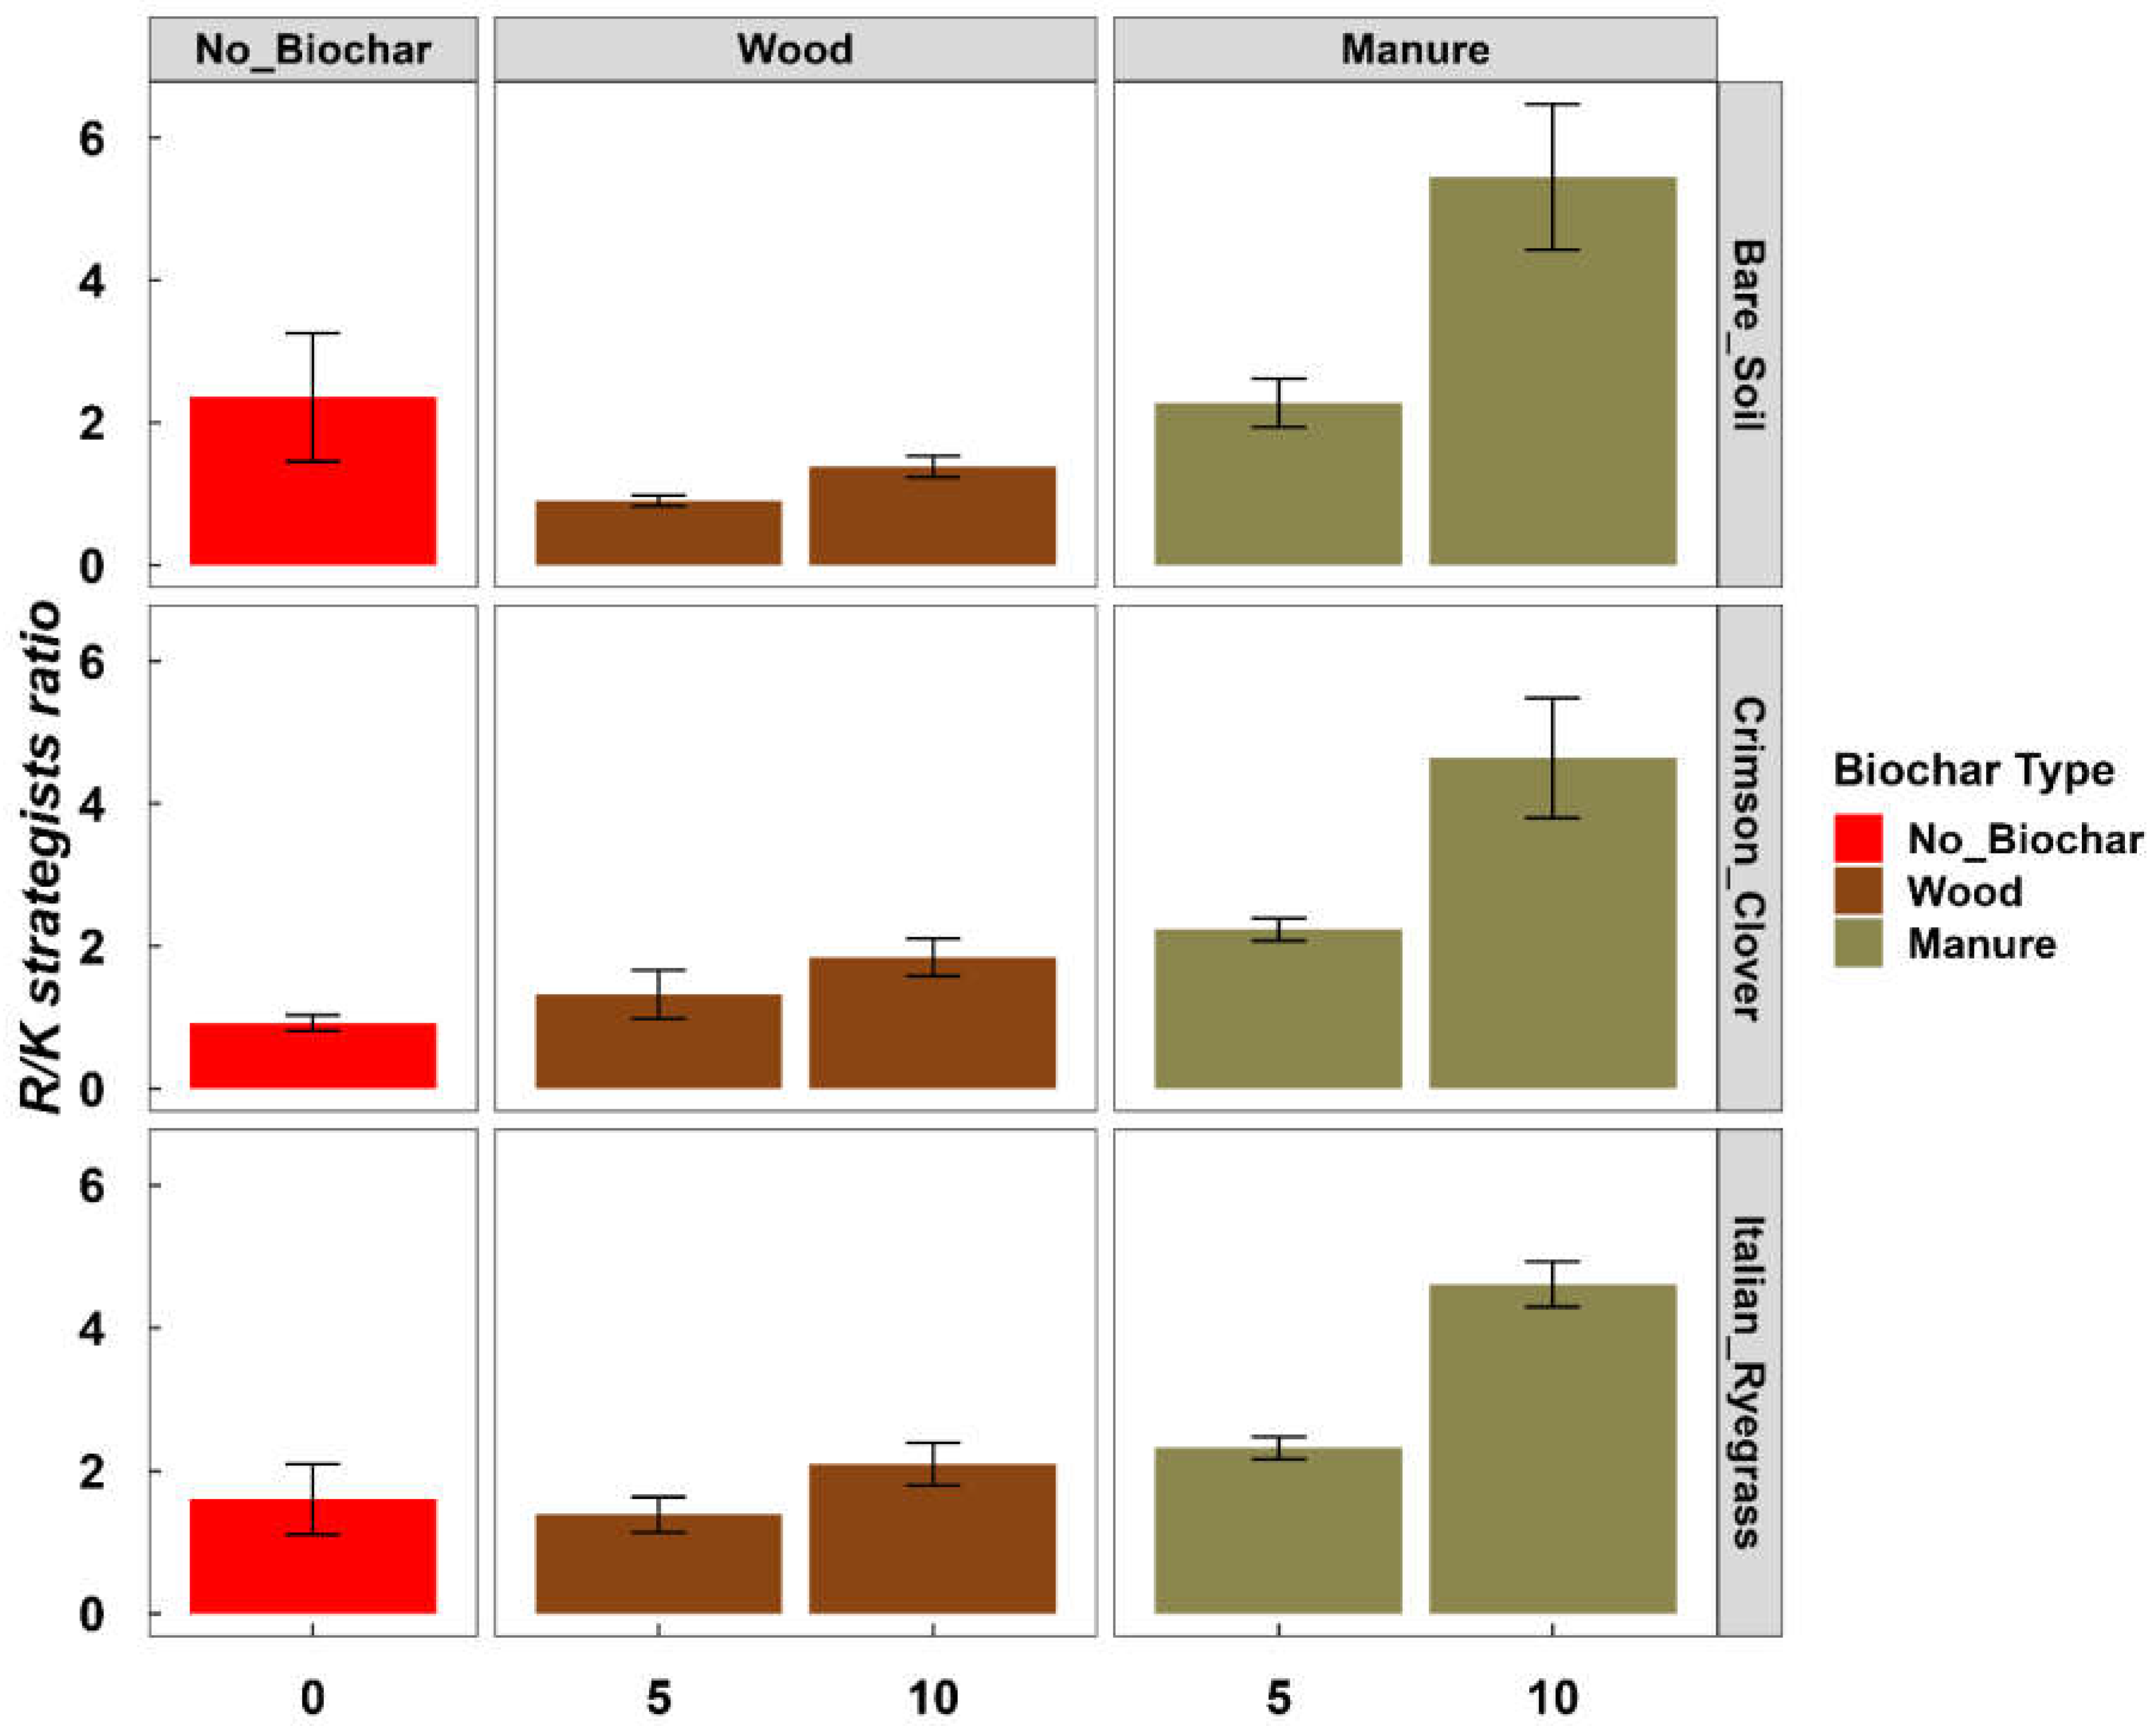
2.4.3. Estimating the Ratio between r- and K-Strategists

To estimate the ratio between r- and K-strategists, the relative abundance of the r-strategists (Proteobacteria, Bacteroidota, and Firmicutes) were summed and then divided by the sum of the relative abundance of the K-strategists (Acidobacteriota, Chloroflexi, Verrucomicrobiota, and Gemmatimonadota) [43].

2.4.4. Functional Profiling Using PICRUSt2

The functional potential of the prokaryote community based on the 16S rRNA gene sequences was predicted using PICRUSt2 v2.3.0-b [44] by running the picrust2_pipeline.py pipeline script on the unrarefied ASV abundance table and representative sequences using default settings. We analyzed the genes present in the KEGG pathway for carbon metabolism (map01200; https://www.genome.jp/pathway/map01200 (accessed on 1 April 2023); this includes carbohydrate metabolism (glycolysis, pyruvate oxidation, citrate cycle (TCA and Krebs cycle), pentose phosphate pathway, PRPP biosynthesis, photorespiration, glyoxylate cycle, etc.), energy metabolism (carbon fixation and methane metabolism) and amino acid metabolism, and nitrogen metabolism (map00910; https://www.genome.jp/pathway/map00910 (accessed on 1 April 2023), and includes nitrogen fixation, nitrate reduction, denitrification, nitrification, and complete nitrification), as well as methane metabolism (https://www.genome.jp/pathway/map00680 (accessed on 1 April 2023) to test the effect of the different BCs and their loading percentages on these biogeochemical cycles.

2.4.5. Statistical Analysis

Statistical analyses and graphical displays were conducted and generated using R v4.1 [45] and ggplots2 [46]. The raw ASV table and PCoA results generated by QIIME2 were imported into R using QIIME2R [40].
Alpha diversity: The ASV table imported from QIIME2 was used to determine alpha and beta diversity using Phyloseq [41]. Shapiro–Wilk’s normality test and Levene’s test were used for normality of residuals and homogeneity of group variance, respectively. If the assumptions were met, then the alpha diversity metric was compared between two or multiple groups of factors by using T-test or one-way ANOVA, otherwise, their non-parametric alternatives, Wilcoxon’s rank-sum or Kruskal–Wallis tests, were used. Significant differences for each alpha diversity metric between treatments were verified using Dunn’s test.
Additionally, ANOVA models for log-transformed (log x + 0.01) diversity metrics were built to test the interactions between the main effects (BC type, loading percentage, and crop type) since the assumptions of the model were met for log-transformed values but not for raw diversity values.
Beta diversity: Principal co-ordinate analysis (PCoA) was performed on Bray–Curtis distances between samples using the PCoA results that were imported from QIIME2. The principal coordinates were visualized as scatter plots using ggplot2. The non-parametric permutational multivariate analysis of variance (PERMANOVA) was used to determine the overall changes in microbial communities between samples and group clustering with 999 permutations based on Bray–Curtis distance matrices [47] using the adonis2 function in the vegan package [42].
Relationships between chemical variables (pH, EC, and nutrients) and microbial ASV composition were analyzed via distance- (Bray–Curtis distance) based redundancy analysis (dbRDA) using the dbrda function of the vegan package in R. The significance of the overall model, individual axis, and terms were determined through ANOVA-like permutation tests (with 999 permutations) available as the anova.cca function within the vegan R package.
Taxonomy profiling: Identification of microbes with differential abundance was carried out on all taxa using ANCOM v1.1-3 [48] at a significance threshold of 0.05. Pairwise comparison between treatments for each significant taxon was performed using Wilcoxon’s rank-sum test with FDR correction for multiple hypothesis testing on log-transformed (log x + 1) abundance values. Pairwise comparisons were considered significant if the FDR q value was less than or equal to 0.05.
Functional profiling: Statistical testing for differential abundance of potential genes (KOs) was carried out using DESeq2 [49]. The counts generated by PICRUST2 were rounded to integers before running DESeq. All contrasts between crop type, BC type, and loading percentage treatments were tested. Potential genes were considered differentially abundant in a certain contrast if they had FDR adjusted p-value < 0.05 and linear fold change >2 or <−2, where a minus sign denotes down-regulation (i.e., less abundant in group 1 than in group 2). Hierarchical clustering of the genes after z-scoring of their variance stabilized counts was carried out using pheatmap [50].
Physicochemical properties and r/K strategists ratio: The normality and homogeneity of variance assumptions of an ANOVA model were tested using Shapiro–Wilk’s normality test and Levene’s homogeneity of variance test, respectively. The assumptions were not met, hence, the non-parametric Kruskal–Wallis test was also used to test for differences between treatments, that is, a combination of the three factors (BC type + loading percentage + crop type). Significant pairwise differences for each parameter between treatments were verified using Dunn’s test.

3. Results

3.1. Outcome of Sequencing

A total of 1,658,639 sequences were left after quality filtering (denoising, primer, adaptor, chloroplast, mitochondria, and rare ASVs’ removal) generating 3187 ASVs. Supplementary Figure S1 shows the rarefaction curves for the samples and main factors (BC type, loading percentage, and crop type). All rarefaction curves tended to saturation meaning that the rarefaction depth chosen in this study was enough to capture the diversity of our samples and treatment groups.

3.2. Alpha Diversity

BC type and BC loading percentage had significant (p < 0.05; ANOVA) effects on the prokaryote microbial community (Table 1). Crop type on its own did not have a significant effect but its interaction with BC loading percentage was significant (Table 1).
Variance partitioning revealed that BC type, the interaction between crop type and loading percent, and BC loading percentage explained the highest variance in the dataset.
Table 1. ANOVA test for statistical significance of microbial alpha diversity in soil samples; n = 4. Significant p-values are highlighted in bold text.
TermsDFRichness Diversity
ObservedChao1ShannonInvSimpson
Crop type20.1830.1640.3790.227
Biochar Type20.0000.0000.0010.041
Loading percent10.0280.0330.0160.000
Crop type × Biochar type40.2260.1820.7560.710
Crop type × Loading percent20.0010.0010.050.011
Biochar type × Loading percent10.7850.8060.6150.100
Crop type × Biochar type × Loading percent10.6090.5650.9120.654
Hence, these factors were the most important predictors of prokaryote richness and diversity (Table 2). Richness and diversity significantly (p < 0.05; Kruskal–Wallis) differed between BC types and were highest in MBC (Figure 1 and Figure S1C and Supplementary Table S3). In contrast, they were similar between WBC and the control (Figure 1 and Figure S1C and Supplementary Table S3) and did not differ between crop types (Figure 1 and Figure S1A). Finally, they increased with BC application but did not significantly differ between 5 and 10% BC loading percentages, with an increase from 5 to 10% showing a trend of negative but insignificant impact of increasing BC loading percentages (Figure 1 and Figure S1B).

3.3. Microbial Community Structure

Figure 2 depicts the prokaryote community structure in soils growing both crimson clover and Italian ryegrass. Overall, prokaryote community structure was largely shaped by BC type (Pseudo-F2,57 = 5.358, p = 0.001; PERMANOVA) and BC loading percentage (Pseudo-F1,57 = 2.244, p = 0.001; PERMANOVA) (Figure 2), and they, along with their interactions (Pseudo-F1,57 = 2.101, p = 0.001; PERMANOVA), were the strongest predictors of the prokaryote communities (Table 2). Crop type and the interaction of all the factors did not significantly (p > 0.05; PERMANOVA) affect the prokaryote community (Figure 2 and Table 2).

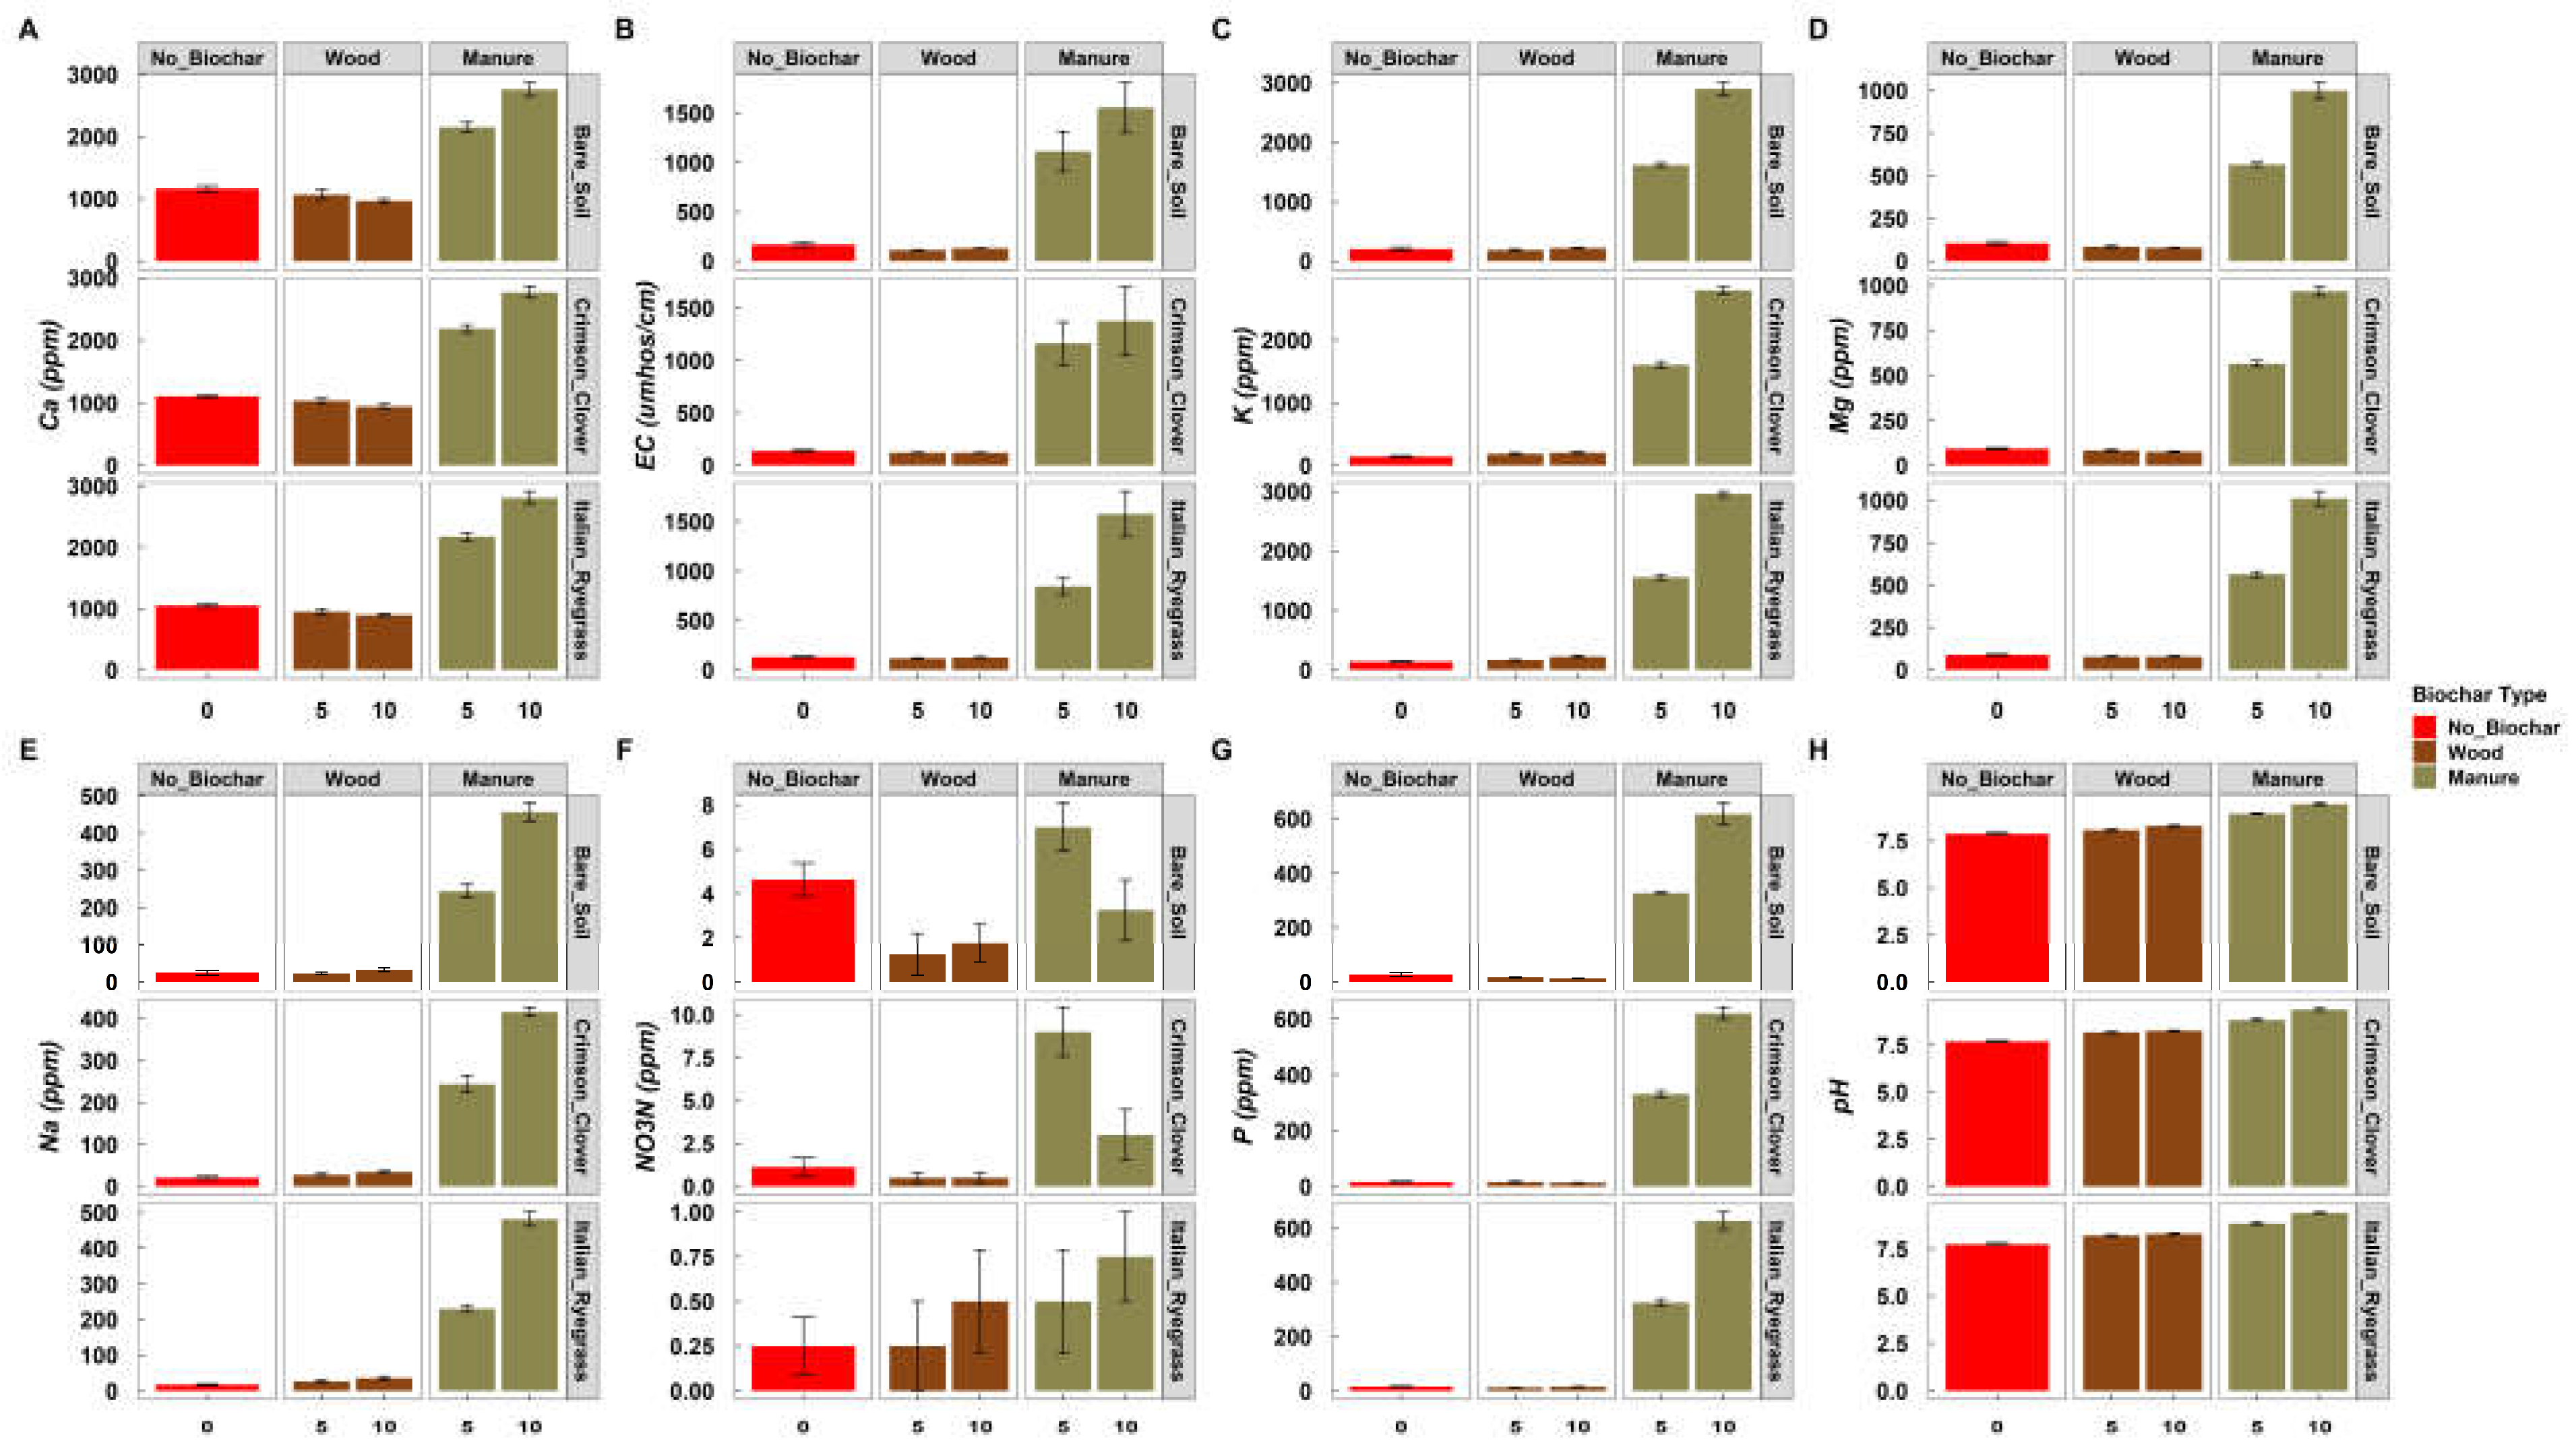
3.4. Soil Physicochemical Properties

Figure 3 depicts the physicochemical properties measured in soils growing crimson clover and Italian ryegrass. BC type, BC loading percentage, and their interaction explained the largest variance in the dataset. All soil chemical parameters increased with BC loading percentage, particularly between 0% and BC application (5 and 10%) in MBC (Figure 3 and Supplementary Table S4). In addition, WBC-amended soils had soil nutrients and pH comparable to no biochar controls and were not affected by increasing BC loading rate (Figure 3 and Supplementary Table S4).

3.5. Correlating Prokaryote Community Structure with Physicochemical Properties

We also attempted to correlate microbial community structure with soil physicochemical properties (Figure 4). The dbRDA models that included pH, EC, NO3-N, P, K, Ca, Mg, and Na were statistically significant (prokaryotes: F8,63 = 2.209, p = 0.001; permutation test) with the first three axes being statistically significant (dbRDA1: F1,63 = 9.8349, p = 0.002; dbRDA2: F1,63 = 2.197, p = 0.002; dbRDA3: F1,63 = 1.667, p = 0.006; permutation test). Prokaryote communities in the different soil amendments strongly correlated with the physicochemical properties. Overall, the analysis demonstrated that soil physicochemical properties play an important role in shaping the prokaryote community as samples separated based on pH, and on increasing nutrient concentration due to an increase in BC loading rate (Figure 4).
dbRDA revealed that pH (F1,63 = 8.637, p = 0.005; PERMANOVA), EC (F1,63 = 1.709, p = 0.010; PERMANOVA), P (F1,63 = 2.008, p = 0.005; PERMANOVA), and Ca (F1,63 = 1.547, p = 0.015; PERMANOVA) had significant (p < 0.05, PERMANOVA) effects on the soil prokaryote community, and that they were positively correlated with MBC samples at high loading percentages but negatively correlated with WBC and control samples. These chemical variables could explain 19.9% of the total community variance between treatments for the prokaryote community (Figure 4).

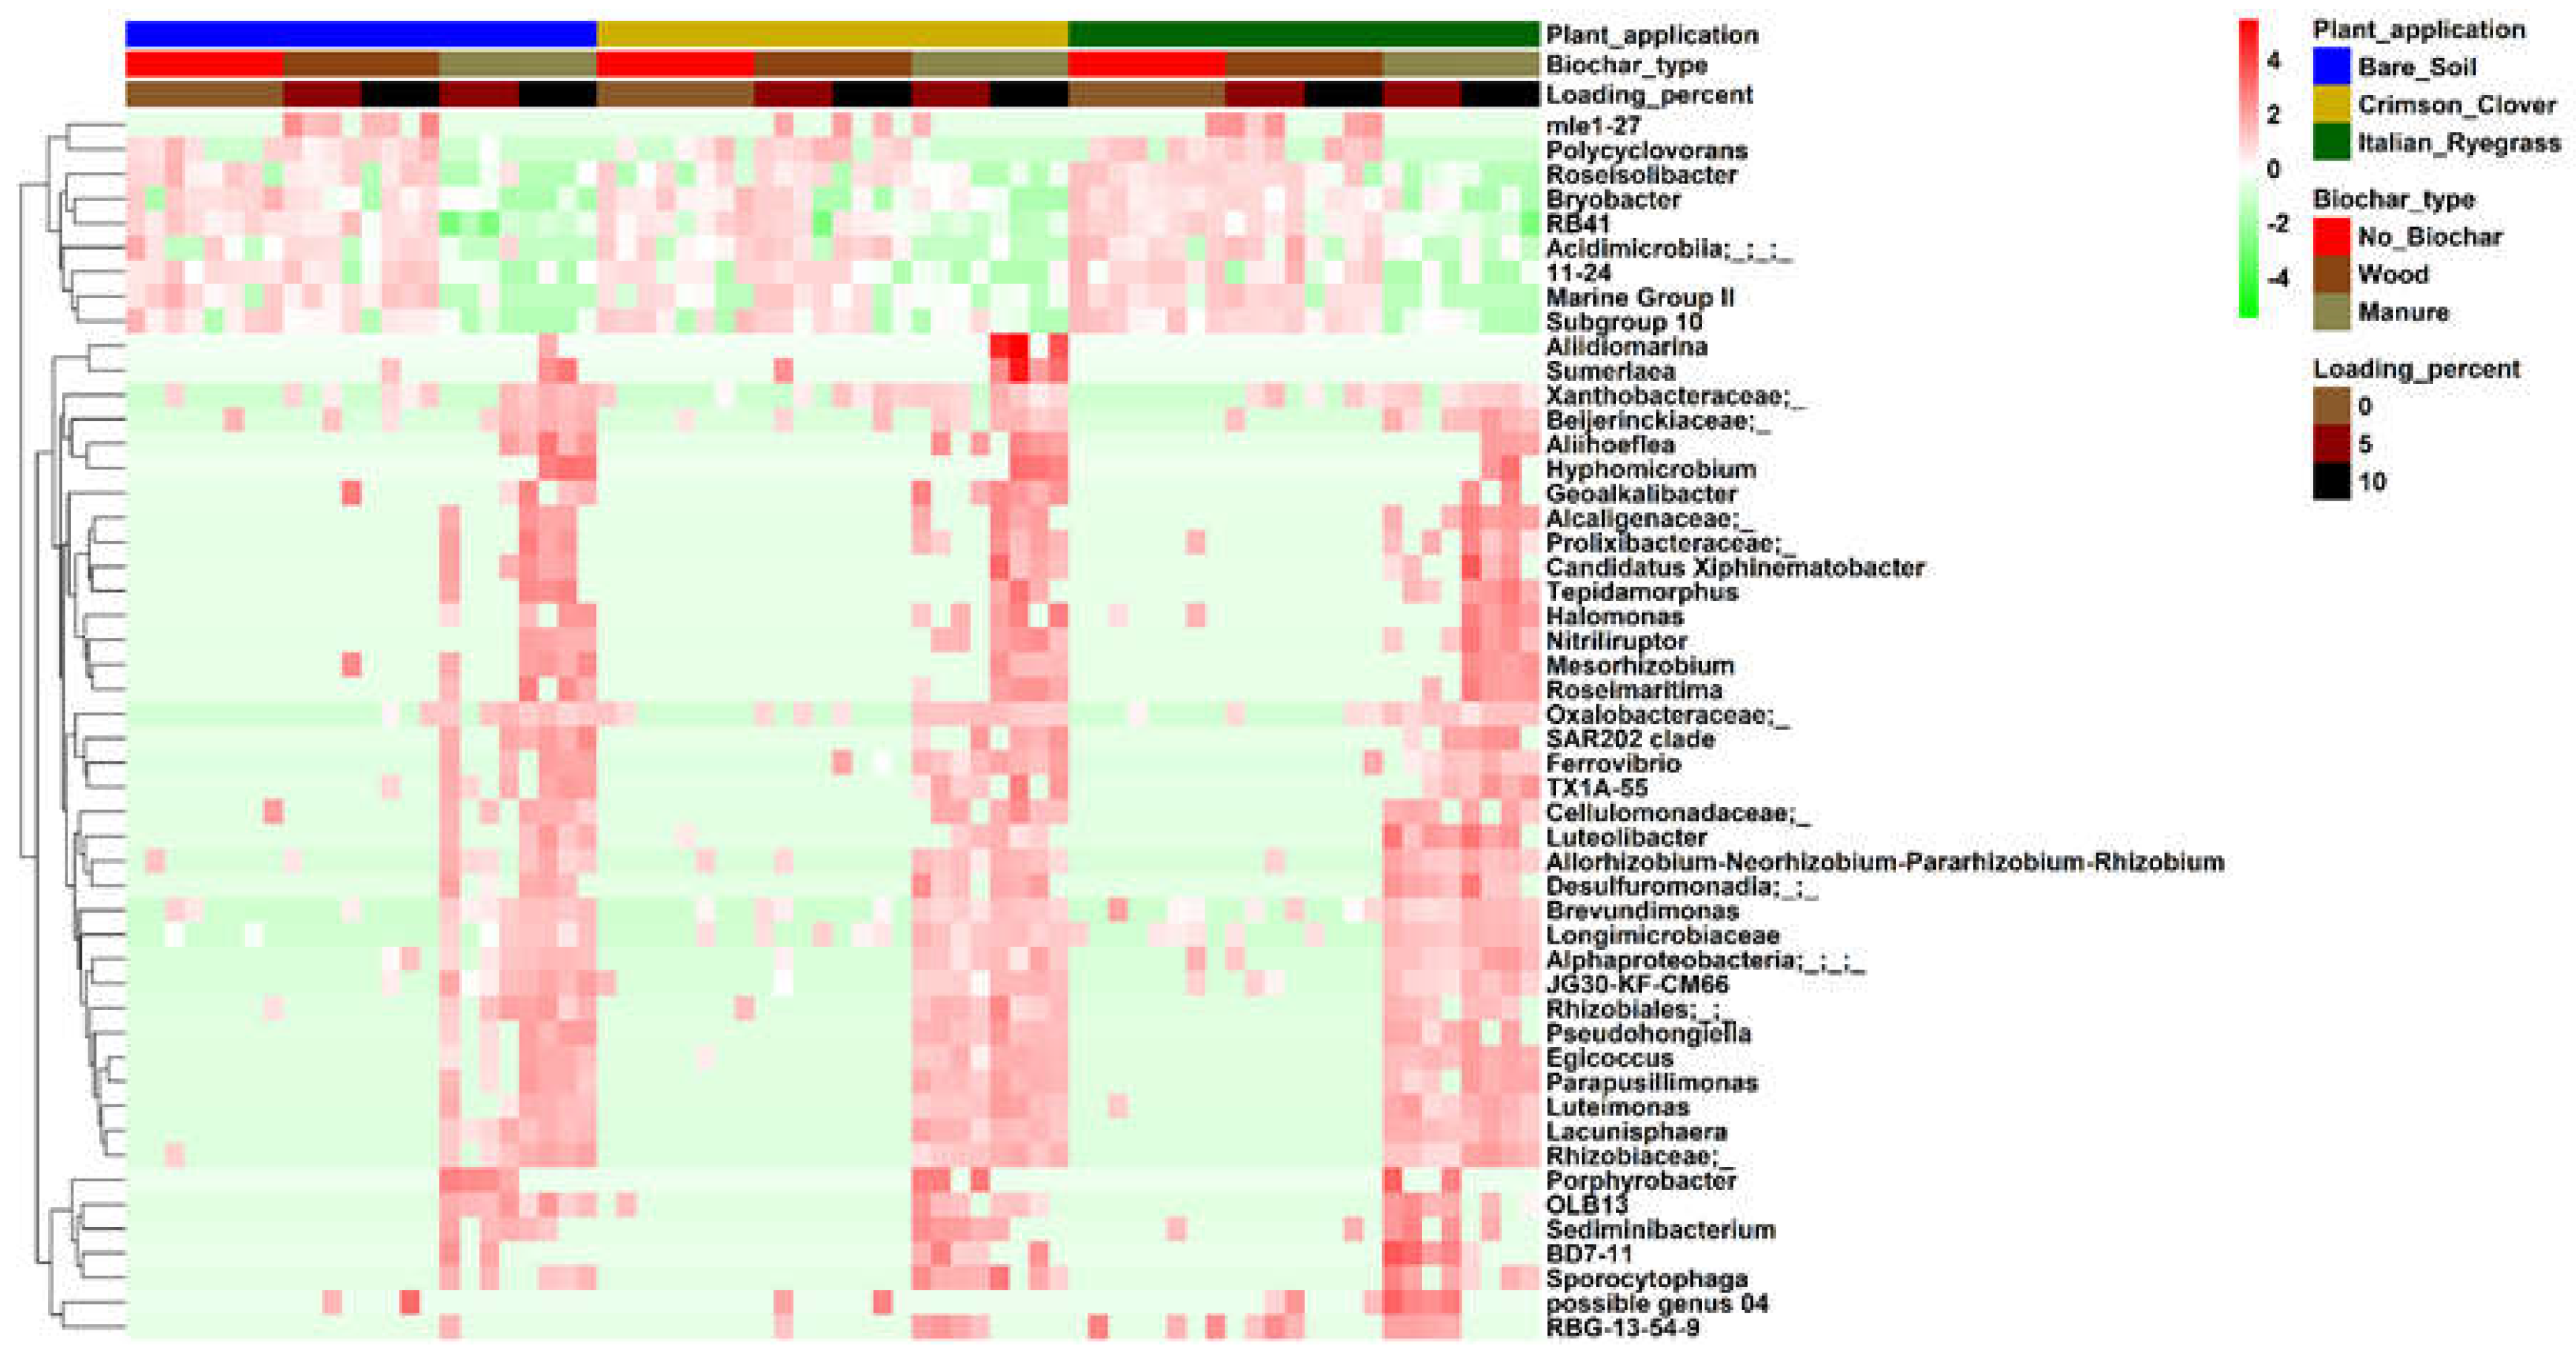
3.6. Microbial Community Composition

Overall, like diversity and structure above, the greatest differences in microbial composition were detected between BC types and BC loading percentages but less so between crop types (Figure 5 and Figure 6). All soil prokaryote communities were dominated by members of Proteobacteria, Bacteriodota, Acidobacteriota, Chloroflexi, Verrucomicrobiota, and Gemmatimonadota (Figure 5A) regardless of biochar treatment and crop type, a taxonomic profile typical of soils. The most dominant Archaea phyla were Creanarchaeota and Thermoplasmatota (Figure 5A). Phyla that comprise putative beneficial bacteria, including Nitrospirae, Actinobacteria, Chloroflexi, and Firmicutes were also dominant (Figure 5A).
The most abundant classes were Alphaproteobacteria, Gammaproteobacteria, Gemmatimonadetes, Bacteriodia, Vicinamibacteria, and Chloroflexi (Figure 5B). Acidobacteria (W = 71; ANCOM), Blastocatellia (W = 69; ANCOM), and Thremoplasmata (W = 74; ANCOM) were significantly (p < 0.05; ANCOM) higher in WBC than in MBC and showed a decreasing trend with increasing BC loading percentages irrespective of BC type (Supplementary Figure S2). On the contrary, Dehalococcoidia (W = 65; ANCOM), Desulfuromonadia (W = 61; ANCOM), JG30-KF-CM66 (W = 74; ANCOM), and Planctomycetes (W = 65; ANCOM) were significantly (p < 0.05; ANCOM) higher and increased with increasing BC loading percentages in MBC compared to WBC and bare soil samples.
Fifty genera significantly (p < 0.05; ANCOM) differed between the treatments (Figure 6). The ten most significantly different genera were Lacunisphaera, Egicoccus, an unknown Rhizobiaceae, Marine Group II, OLB13, Luteimonas, Parapusillimonas, Mesorhizobium, an unknown Oxalobacteraceae, and Polycyclovorans (Figure 6). These microbes were mostly more abundant in MBC-amended soils than in other BC types. Most of them are known to be r-strategists (copiotrophs) that are usually found in nutrient-rich environments. The increase in Egicoccus and Halomonas suggests a nutrient-rich (saline) and alkaline environment that is optimum for the growth of these microbes in MBC-amended soils. Polycyclovorans, Roseisolibacter, Bryobacter, RB41, an unknown Acidimicrobiia, 11–24, Marine Group II, and subgroup 10 were significantly (p < 0.05; ANCOM) higher in the control and WBC samples than in MBC samples (Figure 6). The ratio between r/K strategists was similar (p > 0.05; ANOVA) between WBC and the control, and highest in MBC at higher loading rates confirming our hypothesis that soils receiving higher BC rates were dominated by r-strategists, particularly in MBC-amended soils (Figure 7).

3.7. Function Prediction Based on 16S Sequences

The largest functional differences were detected between BC types, with WBC and the control functional profiles being similar but very different from MBC. In addition, significantly different profiles were detected between low and high loading percentages but little to no differences between crop types (Figure 8 and Figures S3–S5 ). Overall, BC increased potential nitrogen metabolism genes but had mixed effects on the potential carbon and methane metabolism genes regardless of crop type (Supplementary Figures S4 and S5). In addition, potential genes involved in isomerase activity, hydrolase activity, oxidoreductase activity, NADPH dehydrogenases, and racemases and epimerases acting on carbohydrate derivatives were highly enriched in soils amended with high (10%) BC loading rates compared to low (0%) loading rates.
3-oxacyl-reductase, acety-CoA C-acetyltransferase, gluthione S-tranferase, UDP-glucose 4-epimerase, phosphoribosylformylglycinamidine synthase, ABC and peptide transport system proteins, iron complex receptor protein, serine/threonine protein kinase, periplasmic protein, transcription regulators and RNA polymerases were among the most abundant potential genes in soils growing both crimson clover and Italian ryegrass indicative of active metabolic processes in the soil (Supplementary Figure S3). Oxidoreductase enzymes play an important role in both aerobic and anaerobic metabolism. They can be found in glycolysis, TCA cycle, oxidative phosphorylation, and in amino acid metabolism. In glycolysis, the enzyme glyceraldehyde-3-phosphate dehydrogenase catalyzes the reduction of NAD+ to NADH. The increase in abundance of dehydrogenases is indicative of active microbial metabolic processes in the soils.
In total, there were 682 significantly different genes between all treatments (Figure 8). There were 28, 2, and 9 significantly different genes for carbon, nitrogen, and methane metabolism, respectively (Supplementary Figures S4 and S5). For all potential genes tested (i.e., All, nitrogen, carbon, methane metabolism), the highest numbers of significant genes were detected between manure at 10% loading percentage versus WBC and no BC, while little to no difference was detected between lower percentages regardless of BC type.
Carbon metabolism: The ten most abundant carbon metabolism genes included malate dehydrogenase (mdh, mae), isocitrate dehydrogenase (IDH1, IDH2), glucose-6-phosphate-1-dehydrogenase (G6PD), D-3-phosphoglycerate dehydrogenase (serA), 3-hydroxybutyryl-CoA dehydrogenase (paaH), formate dehydrogenase major subunit (fdoG), glyceraldehyde-3-phosphate dehydrogenase (GAPDH), malonate-semialdehyde dehydrogenase (mmsA), and PDHA (pyruvate dehydrogenase) (Supplementary Figure S4. The effect of BC and its loading percentage on carbon metabolism-related genes was mixed as it simultaneously up- and down-regulated potential genes. BC type had the largest impact on gene content, while the loading percent had a smaller effect, and crop type had little to no effect (Supplementary Figure S4).
Nitrogen metabolism: The 10 most abundant nitrogen metabolism genes were glutamate dehydrogenase (gudB, rocG, GLUD1_2, gdhA), glutamate synthase (gltB, GLU), assimilatory nitrate reductase (nasB), nitrate reductase (nirA, nirB, nirD, nirK), and (NarG). Most of these genes are involved in the synthesis of amino acids, particularly glutamate metabolism and nitrate reduction (denitrification). Of the 66 genes involved in nitrogen metabolism, 45 were detected (not shown) but only 2 were differentially abundant between the treatments (Supplementary Figure S5A). The significant gene pattern was similar between crop types and between the bare soil and WBC but different between BC types and BC loading rates, particularly between MBC and WBC (Supplementary Figure S5A). Glutamate dehydrogenase (NADP+; gdhA) and nitric oxide reductase subunit B (norB) were the two differentially abundant genes.
Methane metabolism: Potential genes involved in methanogenesis were not differentially abundant between the treatments. Like carbon metabolism, the effect of BC type and BC loading percentage on the genes was mixed. BC type mostly influenced the genes but less so than the loading percentage while crop type had little to no effect. Overall, phosphate acetyl transferase (pta), phosphofructokinase 2 (pfkB) and 2-phosphosuphatase (comB) were higher in MBC than in other BC types. The reverse was the case for WBC and no BC soil genes involved in pyruvate synthesis (formate dehydrogenase (fdhA), fructose-1,6-biphosphate II (glpX), and pyruvate ferredoxin oxidoreductases (PorA, B, D and G)) (Supplementary Figure S5B).

4. Discussion

Soil microbial communities are greatly impacted by soil physicochemical properties. BC can considerably change soil physicochemical properties depending on feedstock, pyrolysis temperature, and agronomic conditions. Two biochars were employed in this study. The first was wood biochar (WBC), which is a common amendment in agronomic studies. The second was biochar created from dairy manure (MBC), a biochar feedstock for which there is less information on agronomic use. As the nutrient analysis in this study shows, MBC contains higher amounts of N, P, and several micronutrients relative to WBC. When dairy manure is applied as a green manure in agronomic settings, it can create environmental problems as water-soluble nutrients enter watersheds. Converting dairy manure into biochar and using it as a soil amendment is an emerging dairy nutrient management tactic for potentially recycling valuable N and P. As biochar adsorbs and holds the nutrients, plants and microbes may experience extended nutrient bioavailability. We hypothesized that the different BCs in this study would have varying effects on the soil prokaryote community that correlate with BC loading percent and BC type. Hence, we conducted a 3-month greenhouse experiment growing two cool-season crops (crimson clover, a dicot, and Italian ryegrass, a monocot) to test the effect of BC, BC loading percentage, and crop type on soil prokaryote community diversity, composition, structure, and function. We found that BC type and BC loading percentage had large impacts when compared with crop type. A companion paper discusses the agronomic impacts of BC treatments on forage biomass and soil nutrients [30]. That study found that BC impact on soil nutrients and forage varied greatly depending on type of BC, loading percentage, and crop type. At the highest loading percent, biochar had a negative impact on plant biomass in the dicot, but increased plant biomass in the monocot. The difference in response from the two plant species may have been due to crimson clover’s lower tolerance for high levels of P and Zn, combined with the ability of the fibrous root system of Italian ryegrass to occupy more soil volume and absorb more soil nutrients [30]. The study highlights the importance of aligning crop type, biochar type, and soil loading percent to achieve optimal agronomic goals including forage production and nutrient bioremediation.

4.1. Effect of BC on the Soil Physiochemical Properties

The MBC application increased soil nutrients and pH while the WBC did not increase nutrient concentrations (Figure 3). These findings agree with several studies [1,7,51] that have documented the effect of BC type and BC loading rate on soil physicochemical properties. One concern is biochar sequestration of N and P that may limit plant growth in forage production. To address that concern, biochar has been saturated with dairy lagoon effluent rich in N and P to mitigate potential short-term negative impacts on yield [30]. The nutrient-holding and releasing ability of BC can increase soil nutrient concentration. For instance, MBC had higher adsorption and release of ammonia, nitrate, and phosphate in water and soil than WBC [1,3,52,53]. This is not surprising, since dairy cattle are fed nutrient-rich diets to maintain high milk production and their manure contains significant amounts of excreted nutrients, particularly N and P [54,55]. Some transient metals and metal oxides (i.e., Ca, Mg, Fe) in MBC can adsorb high amounts of phosphate, then slowly release them to the soil. Various positively or negatively charged groups in MBC can attract nitrate and ammonium which are released at gradual rates. However, WBC often has a lack of functional groups for binding ammonium, nitrate, and phosphate resulting in low adsorption and release of nutrients to the soil.
The presence of negatively charged hydroxyl, carboxyl, and phenolic groups on the surface of BC makes them alkaline [56,57]. In addition, carbonates, bicarbonates, and silicates in BC can bind with hydrogen ions in soil–water. BC thus reduces H+ concentration and therefore increases the soil pH value. The alkalinity of BC is also positively correlated with the production temperature [58] and related to the feedstock type. Therefore, BC application usually increases soil pH which can neutralize acidic soil [59,60,61,62].

4.2. Effect of BC on Prokaryote Community Diversity and Structure

Microbial diversity increased with BC application simultaneously with the increase in nutrients and pH, and was lower in WBC than MBC (Figure 1, Figure 3 and Figure S1). In addition, distance-based redundancy analysis indicated that the microbial community structure shifts induced by the BC type and BC loading percentage were attributed to the changes in soil chemical properties such as pH and nutrients (Figure 4). A recent study [62] also reported that BC application rate positively correlated with bacterial diversity in BC-amended soils. The increase in microbial diversity with BC may be attributed to the higher nutrient, labile carbon, and water retention capacities. Soils with BC amendments have a higher surface area and a more porous structure than soils without BC. The surface area and porous structure of BC is generally higher than that of the corresponding feedstock materials and the soil [10,16]. Moreover, it has been demonstrated that higher surface area and porosity of BC can adsorb water, nutrients, and soluble carbon, which in turn facilitates microbial colonization, activity, and growth [61,63,64,65]. Jaafar et al., in an incubation study [16], suggested that the enhanced surface area and the high porosity of BC provided potential habitats for soil microorganisms. The lower microbial diversity of WBC than MBC may be partially due to the low nutrient concentration and water retention capacity, whereas the dairy manure feedstock for the MBC in this study was high in nutrients, particularly N, P, and Zn [30] (Figure 3).
In this study, soil microbial diversity or community composition did not seem to differ between crops (Italian ryegrass and crimson clover) despite the difference between BC types and BC loading rates (Figure 1 and Figure 2). These results agree with previous studies [66,67,68,69] that did not detect a significant difference in microbial diversity and composition between crops. It has been suggested that the effect of specific plant species on the composition of soil microbiome may be context dependent [70]. As previously noted, high phosphorus and/or Zn in MBC treatments negatively impacted crimson clover establishment, preventing comparisons of the monocot and dicot at high BC loading percentages [30]. We hypothesized potential crop impacts on soil microbes due to differences in rooting systems and root exudates between the plant species. A lack of differential microbial response due to plant type could be due to the failure of crimson clover to establish at higher MBC loading percentages (and hence lack of plant comparisons). We want to note that the plants did not become root-bound in this study. Consequently, the low root biomass compared to the total soil volume of each pot may have decreased plant-related impacts on the soil microbiome. Moreover, many soil bacteria may be cosmopolitan and able to associate with a wide range of plant taxa, meaning that the effect of above-ground vegetation on soil microbial communities may become evident on a timescale greater than 120 days [71].

4.3. Effect of BC on Microbial Community Composition

All soil samples were dominated by members of Proteobacteria, Bacteriodota, Acidobacteriota, Chloroflexi, Verrucomicrobiota, Gemmatimonadota, Creanarchaeota, and Thermoplasmatota, regardless of treatment and crop, a profile typical of agricultural soils [51,72,73,74] (Figure 5). In addition, phyla that comprise putative beneficial bacteria, including Nitrospirae, Actinobacteria, Chloroflexi, and Firmicutes were also dominant in BC-amended soils. Both Dehalococcoidia and JG30-KF-CM66 are affiliated to Chloroflexi, and they were both higher in manure than in WBC and the control. Dehalococcoidia contains the genes associated with the degradation of various organic matter such as fatty acids and aromatic compounds [75], while JG30-KF-CM66 contains genes related to nitrite oxidoreduction [76]. Furthermore, increasing BC loading percentages resulted in an increase in the abundance of microorganisms that are capable of degrading and utilizing organic matter and solubilizing phosphates such as Actinobacteria (Figure 5). Actinobacteria are generally associated with the degradation of recalcitrant carbon compounds and the turnover of soil organic matter [77]. Microorganisms which can degrade recalcitrant carbon compounds are likely to be predominant in BC-amended soils [78,79]. Effects of BC on bacteria might be caused by the high levels of mineral elements and the organic compounds in BC [77], and the increase in soil pH [80]. Furthermore, the sorption of organic carbon and organically bound nutrients on BC may hinder growth of some soil microbes [14].
BC application increased nutrients and pH (Figure 3) which led to an increase in Gram-negatives, alkaliphiles, and r-strategists (copiotrophs) relative to K-strategists (oligotrophs) and acidophiles (Figure 5, Figure 6 and Figure 7). Similar findings of an increase in Gram-negatives because of BC application have been reported [13,20,22,51,81]. The relative abundance of acidophilic Acidobacteria and Gemmatimonadetes decreased with increasing BC loading percentage while alkaliphilic genera such as Egicoccus, Luteimonas, Halomonas, Parapusillimonas, Mesorhizobium, Brevundimonas, JG30-KF-CM66, Ferrovibrio belonging the phylum Proteobacteria, Chloroflexi, and the class Alphaproteobacteria increased (Figure 5 and Figure 6). Proteobacteria has been described as an r-strategist group which prefers high nutrient conditions while the K-strategists such as Acidobacteria exhibit a high abundance in low-nutrient environments [82]. We interpret the increase in r-strategists as a positive outcome. Microbes that rapidly incorporate nutrients from MBC into biomolecules potentially prevent loss of those nutrients to waterways through runoff and leaching. Once incorporated into soil bacteria, those nutrients remain readily available to plants through the rhizophagy cycle [83]. The decrease in Acidobacteria is probably due to the increasing alkalinity with BC amendment as reflected by the increase in pH (Figure 3) while the decrease in Gemmatimonadetes may be due to the increased soil moisture content because of BC amendment that increased soil water holding capacity which does not favor microbes that thrive under dry conditions [84]. Zhang et al. [51] reported that BC mixed with nitrogen application significantly enhanced the relative abundance of Proteobacteria and decreased Acidobacteria. Yang et al. [85] reported that BC-based fertilizer addition increased Proteobacteria abundance, which is associated with soil-available nutrient content. Acidobacteria is widely distributed in agricultural soils with low resource availability and is usually related to soil organic carbon mineralization rate, which could be used as an indicator to evaluate poor soil environments [82]. Therefore, it was not surprising that BC addition, particularly MBC, enhanced Proteobacteria and decreased the Acidobacteria abundance in our study.

4.4. Effect of BC on the Prokaryote Functional Potential

Overall, potential enzymes/genes increased with increasing BC loading percentage, particularly for MBC-amended soils, regardless of crop type (Figure 8). In a previous study, BC increased microbial biomass carbon and urease, alkaline phosphatase, and dehydrogenase activity by 21.7%, 23.1%, 25.4%, and 19.8%, respectively [15]. Zhang et al. [51] showed that BC addition led to an increase of soil enzyme activities after 3.5 years. One possible mechanism for the increase in these enzymes by adding BCs is the stimulation of corresponding enzyme production due to an addition of organic nitrogen and phosphorus-rich BCs to the soil as micro-organisms can produce more enzymes to mobilize mineral nitrogen and phosphorus from the added organic matter [86]. This was supported by the increase in nutrients and pH observed, regardless of crop type (Figure 3).
The effect of BC loading percentage on carbon and methane metabolism genes was not always linear. BC increased certain enzymes at low loading percentages (0 and 5%) but decreased them at high loading percentage (10%) (Supplementary Figures S4 and S5B). Wang et al. [25] reported a similar finding that fluvo-aquic soil amended with BC increased the activity of some extracellular enzymes (such as ß-glucosidase, ß-D-cellobiosidase, ß-xylosidase, a-glucosidase, and sulfatase) involved in soil carbon and sulfur cycling. However, this effect seemed inconsistent and was dependent on the rate of BC addition. For example, a low rate of maize BC application (0.5% (w/w)) elevated the enzyme activity in the soil, whereas higher rates of maize BC application (1.0, 2.5, and 5.0% (w/w)) lowered the enzyme activity [25]. In their study, β-glucosidase activity was observed to be increased only in soil amended with bamboo BC at 0.5 and 1.0%. Moreover, urease activity was increased in soil amended with oak wood BC (0.5 and 2.0%) and bamboo BC (0.5%) at different application rates [87]. In another study, BC addition generally decreased soil carbon-cycling enzyme activity while increasing N- and P-cycling enzyme and oxidase activities [51]. Han et al. [88] found the presence of toxic substrates and organic carbon–mineral complexes after BC application decreased microbial activity and mineralization rate. Zang et al. [89] found that reduced carbon-cycling enzyme activities in BC-amended soils probably weakened the soil organic carbon mineralization rate. The lower abundance of Acidobacteria in high MBC loading percentages may suggest that the bioavailability of soil carbon after BC treatment was higher, which was supported by lower carbon-cycling enzyme activities and CO2 release rate. Wang et al. [90] also found evidence suggesting the association between enzyme activities and the abundance of Acidobacteria.
Dehydrogenases decreased with increasing BC application rate and were highest in WBC and the control (Supplementary Figures S3–S5). Dehydrogenases are critical for the metabolism of microorganisms [15]. Demisie et al. [87] found that dehydrogenase activity in a degraded red soil was elevated by the application of oak wood and bamboo BC at 0.5% (w/w). These results are in contrast with previous studies [91,92,93] that reported an increase in dehydrogenases with BC application. Increased dehydrogenase activities in BC-amended soils were observed with different types of BC under different soil conditions [91,92,93]. The enhanced dehydrogenase activities in BC-treated soils can be attributed to the addition of labile organic matter and the high content of volatile matter in BC [94].
BC application increased the activity and abundance of nitrogen metabolism enzymes (Supplementary Figure S5A). This finding agreed with a previous meta-analysis that BC addition could result in a 14% and 11% increase in nitrogen- and phosphorus- cycling enzyme activities, respectively [15,95]. The increase in carbon and nitrogen metabolism genes correlates well with the increase in members of Proteobacteria such as Rhizobiaceae which are well known to contain many nitrogen-cycling bacteria [82].
One goal of this research was to identify appropriate levels of BC amendment for forage production systems. An agronomic study identified negative effects on a cool-season forage legume when applied at 10% [30]. At a 10% loading rate, MBC increased nitric oxide reductase presence, and would potentially increase production of nitrous oxide. Therefore, lower loading rates may be warranted in sandy loam soils. Lehmann et al. [77] reported that biogeochemical processes were affected by alterations in microbial species residing in soil and their enzymatic activities. BC addition increased nitrogen-cycling enzyme production due to the high metabolism of microorganisms stimulated by increased pH [15], and high nutrient concentration as the loading percentage of BC increased. The oxidase activities (which decompose recalcitrant substrates such as lignin) increased with increasing BC rate due to its high recalcitrant carbon pools, oxygen availability, and pH [96]. The positive correlation between nutrients and pH, and higher BC loading percentages confirmed that the change in nutrient concentrations and pH induced by BC played a critical role in regulating the nitrogen-cycling enzymes and oxidase activities (Figure 3 and Figure 4).

5. Conclusions

The BCs used in this study produced a concentration-dependent increase in soil prokaryotic microbial richness that aligned with increased soil functional capacities, regardless of crop, in the order of increased richness with MBC > WBC. WBC showed a distinct diversity and composition when compared to MBC. BC type and BC loading percentage along with soil pH and nutrient concentrations were the most important predictors of soil microbial diversity, composition, structure, and functions. High nutrient concentrations in MBC were associated with changes in gene content related to carbon and nitrogen cycling capacities of treated soil. The shift to microbial communities enriched in r-strategists following MBC amendment may indicate enhanced mitigation of some negative environmental impacts of N, P, and micronutrients from dairy manure. Increased holding time by BC may valorize those nutrients, providing plants and microbes additional time to sequester them in biomolecules, which increased microbial diversity and agronomic production. Further studies are warranted to confirm these effects of BC on the soil microbial community structure, functions, and interactions under field conditions as soil-, crop-, and biochar-specific agronomic recommendations are developed.

Supplementary Materials

The following supporting information can be downloaded at: https://www.mdpi.com/article/10.3390/agronomy13061512/s1, Supplementary_figures.docx, Supplementary_tables.docx. Figure S1: Sample rarefaction curves depicting the richness (y-axis, as the number of unique ASVs recovered) determined at an equal sampling effort (x-axis, the number of individual sequences recovered in each sample) of prokaryotes in the soil. (A) Comparison of bare soil (no crop), crimson clover, and Italian ryegrass. (B) Comparison of different biochar loading percentages. (C) Comparison of different biochar types. (D) Comparison of individual samples. The rarefaction curves show that the rarefaction depth (3107) chosen in this study was enough to capture the prokaryote diversity of our soil samples; Figure S2: Differentially abundant soil prokaryote phyla detected using ANCOM. On the x-axis is the biochar loading rate and the Y-axis the natural log abundance of the differentially abundant prokaryote phylum; n = 4. Boxes represent 25–75% of the data, solid lines the median, the tips represent the minimum and maximum values excluding the outliers (1.5 times lesser or greater than the lower or upper quantiles) represented by dots outside of the boxes; Figure S3: Heatmap showing the difference in gene patterns observed between treatments for the fifty most significant genes (fifty lowest adjusted p-values). On the x-axis are samples and on the y-axis are hierarchically clustered significant genes. Gene abundances were transformed, scaled, and correlated. The heatmap shows that the gene patterns were different between biochar types and loading percent within biochar types; Figure S4: Heatmap showing the difference in carbon metabolism gene patterns observed between treatments. On the x-axis are samples and on the y-axis are hierarchically clustered significant genes. Gene abundances were transformed, scaled, and correlated. The heatmap shows that the gene patterns were different between biochar types and loading percent within biochar types regardless of crop type; Figure S5: Heatmap showing the pattern of significantly different (A) nitrogen and (B) methane metabolism genes observed between treatments. On the x-axis are samples and on the y-axis are hierarchically clustered significant genes. Gene abundances were transformed, scaled, and correlated. The heatmap shows that the gene patterns were different between biochar types and loading percent within biochar types irrespective of crop type; Table S1: Selected physicochemical characteristics of the soil and the biochars used in this study. WBC = wood-derived biochar; MBC = manure-derived biochar. All analyses were performed on a dry matter basis except for moisture, ash, fixed carbon, and volatile matter; Table S2: Primers used in this study; Table S3: Alpha diversity metrics of prokaryote communities in soil. Values are mean ± SE. Different letters represent significant differences at p < 0.05 between treatments using Dunn’s pairwise comparison test; Table S4: Physicochemical properties of the soil samples used in this study. Different letters represent significant differences at p < 0.05 between treatments using Dunn’s pairwise comparison test. EC = Electrical conductivity; Mg = magnesium; K = potassium concentration; Na = sodium concentration; Ca = Calcium; NO3 = Nitrate.

Author Contributions

Conceptualization, J.P.M., J.A.B. and E.K.; experimental methodology, C.B.T., S.Z., K.S., B.W., J.P.M., E.K. and J.A.B.; bioinformatics methodology, O.O. and J.A.B.; formal analysis, O.O.; investigation, O.O., E.K., J.P.M. and J.A.B.; resources, J.A.B., E.K. and J.P.M.; data curation, O.O. and J.A.B.; original draft preparation, O.O. and J.A.B.; writing—review and editing, O.O., J.A.B., J.P.M. and E.K.; supervision, J.P.M., J.A.B. and E.K.; funding acquisition, E.K., J.P.M. and J.A.B. All authors have read and agreed to the published version of the manuscript.

Funding

This research was funded by the National Institute of Food and Agriculture, grant number 2020-70001-31552.

Data Availability Statement

All sequence reads have been submitted to NCBI’s sequence read archive and are available under project number PRJNA806484.

Acknowledgments

Portions of this research were conducted with the advanced computing resources provided by Texas A&M High-Performance Research Computing.

Conflicts of Interest

The authors declare no conflict of interest. The funders had no role in the design of the study; in the collection, analyses, or interpretation of data; in the writing of the manuscript, or in the decision to publish the results.

References

  1. Niraula, S.; Choi, Y.K.; Payne, K.; Muir, J.P.; Kan, E.; Chang, W.S. Dairy Effluent-Saturated Biochar Alters Microbial Communities and Enhances Bermudagrass Growth and Soil Fertility. Agronomy 2021, 11, 1794. [Google Scholar] [CrossRef]
  2. Khan, N.; Chowdhary, P.; Gnansounou, E.; Chaturvedi, P. Biochar and Environmental Sustainability: Emerging Trends and Techno-Economic Perspectives. Bioresour. Technol. 2021, 332, 125102. [Google Scholar] [CrossRef]
  3. Zeng, S.; Kan, E. Adsorption and Regeneration on Iron-Activated Biochar for Removal of Microcystin-LR. Chemosphere 2021, 273, 129649. [Google Scholar] [CrossRef] [PubMed]
  4. Lehmann, J. Bio-Energy in the Black. Front. Ecol. Environ. 2007, 5, 381–387. [Google Scholar] [CrossRef]
  5. Batista, E.M.C.C.; Shultz, J.; Matos, T.T.S.; Fornari, M.R.; Ferreira, T.M.; Szpoganicz, B.; De Freitas, R.A.; Mangrich, A.S. Effect of Surface and Porosity of Biochar on Water Holding Capacity Aiming Indirectly at Preservation of the Amazon Biome. Sci. Rep. 2018, 8, 10677. [Google Scholar] [CrossRef]
  6. Steinbeiss, S.; Gleixner, G.; Antonietti, M. Effect of Biochar Amendment on Soil Carbon Balance and Soil Microbial Activity. Soil Biol. Biochem. 2009, 41, 1301–1310. [Google Scholar] [CrossRef]
  7. Schmidt, H.-P.; Kammann, C.; Hagemann, N.; Leifeld, J.; Bucheli, T.D.; Sánchez Monedero, M.A.; Cayuela, M.L. Biochar in Agriculture—A Systematic Review of 26 Global Meta-Analyses. GCB Bioenergy 2021, 13, 1708–1730. [Google Scholar] [CrossRef]
  8. Basso, A.S.; Miguez, F.E.; Laird, D.A.; Horton, R.; Westgate, M. Assessing Potential of Biochar for Increasing Water-Holding Capacity of Sandy Soils. GCB Bioenergy 2013, 5, 132–143. [Google Scholar] [CrossRef]
  9. Ghorbani, M.; Neugschwandtner, R.W.; Konvalina, P.; Asadi, H.; Kopecký, M.; Amirahmadi, E. Comparative Effects of Biochar and Compost Applications on Water Holding Capacity and Crop Yield of Rice under Evaporation Stress: A Two-Years Field Study. Paddy Water Environ. 2023, 21, 47–58. [Google Scholar] [CrossRef]
  10. Palansooriya, K.N.; Wong, J.T.F.; Hashimoto, Y.; Huang, L.; Rinklebe, J.; Chang, S.X.; Bolan, N.; Wang, H.; Ok, Y.S. Response of Microbial Communities to Biochar-Amended Soils: A Critical Review. Biochar 2019, 1, 3–22. [Google Scholar] [CrossRef]
  11. Gujre, N.; Soni, A.; Rangan, L.; Tsang, D.C.W.; Mitra, S. Sustainable Improvement of Soil Health Utilizing Biochar and Arbuscular Mycorrhizal Fungi: A Review. Environ. Pollut. 2021, 268, 115549. [Google Scholar] [CrossRef] [PubMed]
  12. He, M.; Xiong, X.; Wang, L.; Hou, D.; Bolan, N.S.; Ok, Y.S.; Rinklebe, J.; Tsang, D.C.W. A Critical Review on Performance Indicators for Evaluating Soil Biota and Soil Health of Biochar-Amended Soils. J. Hazard Mater. 2021, 414, 125378. [Google Scholar] [CrossRef] [PubMed]
  13. Li, Y.; Li, Y.; Chang, S.X.; Yang, Y.; Fu, S.; Jiang, P.; Luo, Y.; Yang, M.; Chen, Z.; Hu, S.; et al. Biochar Reduces Soil Heterotrophic Respiration in a Subtropical Plantation through Increasing Soil Organic Carbon Recalcitrancy and Decreasing Carbon-Degrading Microbial Activity. Soil Biol. Biochem. 2018, 122, 173–185. [Google Scholar] [CrossRef]
  14. Elzobair, K.A.; Stromberger, M.E.; Ippolito, J.A.; Lentz, R.D. Contrasting Effects of Biochar versus Manure on Soil Microbial Communities and Enzyme Activities in an Aridisol. Chemosphere 2016, 142, 145–152. [Google Scholar] [CrossRef] [PubMed]
  15. Pokharel, P.; Ma, Z.; Chang, S.X. Biochar Increases Soil Microbial Biomass with Changes in Extra- and Intracellular Enzyme Activities: A Global Meta-Analysis. Biochar 2020, 2, 65–79. [Google Scholar] [CrossRef]
  16. Jaafar, N.M.; Clode, P.L.; Abbott, L.K. Soil Microbial Responses to Biochars Varying in Particle Size, Surface and Pore Properties. Pedosphere 2015, 25, 770–780. [Google Scholar] [CrossRef]
  17. Ye, J.; Joseph, S.D.; Ji, M.; Nielsen, S.; Mitchell, D.R.; Donne, S.; Horvat, J.; Wang, J.; Munroe, P.; Thomas, T. Chemolithotrophic Processes in the Bacterial Communities on the Surface of Mineral-Enriched Biochars. ISME J. 2017, 11, 1087–1101. [Google Scholar] [CrossRef] [PubMed]
  18. Awad, Y.M.; Ok, Y.S.; Abrigata, J.; Beiyuan, J.; Beckers, F.; Tsang, D.C.W.; Rinklebe, J. Pine Sawdust Biomass and Biochars at Different Pyrolysis Temperatures Change Soil Redox Processes. Sci. Total Environ. 2018, 625, 147–154. [Google Scholar] [CrossRef]
  19. Paz-Ferreiro, J.; Fu, S.; Méndez, A.; Gascó, G. Interactive Effects of Biochar and the Earthworm Pontoscolex Corethrurus on Plant Productivity and Soil Enzyme Activities. J. Soils Sediments 2014, 14, 483–494. [Google Scholar] [CrossRef]
  20. Prayogo, C.; Jones, J.E.; Baeyens, J.; Bending, G.D. Impact of Biochar on Mineralisation of C and N from Soil and Willow Litter and Its Relationship with Microbial Community Biomass and Structure. Biol. Fertil. Soils 2014, 50, 695–702. [Google Scholar] [CrossRef]
  21. Ren, T.; Feng, H.; Xu, C.; Xu, Q.; Fu, B.; Azwar, E.; Wei, Y.; Lam, S.S.; Liu, G. Exogenous Application and Interaction of Biochar with Environmental Factors for Improving Functional Diversity of Rhizosphere’s Microbial Community and Health. Chemosphere 2022, 294, 133710. [Google Scholar] [CrossRef] [PubMed]
  22. Ameloot, N.; Sleutel, S.; Case, S.D.C.; Alberti, G.; McNamara, N.P.; Zavalloni, C.; Vervisch, B.; delle Vedove, G.; De Neve, S. C Mineralization and Microbial Activity in Four Biochar Field Experiments Several Years after Incorporation. Soil Biol. Biochem. 2014, 78, 195–203. [Google Scholar] [CrossRef]
  23. Gomez, J.D.; Denef, K.; Stewart, C.E.; Zheng, J.; Cotrufo, M.F. Biochar Addition Rate Influences Soil Microbial Abundance and Activity in Temperate Soils. Eur. J. Soil Sci. 2014, 65, 28–39. [Google Scholar] [CrossRef]
  24. Liu, S.J.; Liu, Y.G.; Tan, X.F.; Zeng, G.M.; Zhou, Y.H.; Liu, S.B.; Yin, Z.H.; Jiang, L.H.; Li, M.F.; Wen, J. The Effect of Several Activated Biochars on Cd Immobilization and Microbial Community Composition during In-Situ Remediation of Heavy Metal Contaminated Sediment. Chemosphere 2018, 208, 655–664. [Google Scholar] [CrossRef] [PubMed]
  25. Wang, X.; Song, D.; Liang, G.; Zhang, Q.; Ai, C.; Zhou, W. Maize Biochar Addition Rate Influences Soil Enzyme Activity and Microbial Community Composition in a Fluvo-Aquic Soil. Appl. Soil Ecol. 2015, 96, 265–272. [Google Scholar] [CrossRef]
  26. Calderon, R.B.; Jeong, C.; Ku, H.H.; Coghill, L.M.; Ju, Y.J.; Kim, N.; Ham, J.H. Changes in the Microbial Community in Soybean Plots Treated with Biochar and Poultry Litter. Agronomy 2021, 11, 1428. [Google Scholar] [CrossRef]
  27. Jang, H.M.; Kan, E. Enhanced Removal of Antibiotic Resistance Genes and Human Bacterial Pathogens during Anaerobic Digestion of Dairy Manure via Addition of Manure Biochar. Chemosphere 2022, 304, 135178. [Google Scholar] [CrossRef] [PubMed]
  28. Shen, X.; Zeng, J.; Zhang, D.; Wang, F.; Li, Y.; Yi, W. Effect of Pyrolysis Temperature on Characteristics, Chemical Speciation and Environmental Risk of Cr, Mn, Cu, and Zn in Biochars Derived from Pig Manure. Sci. Total Environ. 2020, 704, 135283. [Google Scholar] [CrossRef] [PubMed]
  29. Zhang, P.; Zhang, X.; Li, Y.; Han, L. Influence of Pyrolysis Temperature on Chemical Speciation, Leaching Ability, and Environmental Risk of Heavy Metals in Biochar Derived from Cow Manure. Bioresour. Technol. 2020, 302, 122850. [Google Scholar] [CrossRef] [PubMed]
  30. Taggart, C.B.; Muir, J.P.; Brady, J.A.; Kan, E.; Mitchell, A.B.; Obayomi, O. Impacts of Biochar on Trifolium Incarnatum and Lolium Multiflorum: Soil Nutrient Retention and Loss in Sandy Loam Amended with Dairy Manure. Agronomy 2023, 13, 26. [Google Scholar] [CrossRef]
  31. Mehlich, A. New Extractant for Soil Test Evaluation of Phosphorus, Potassium, Magnesium, Calcium, Sodium, Manganese and Zinc. Commun. Soil Sci. Plant Anal. 1978, 9, 477–492. [Google Scholar] [CrossRef]
  32. Kachurina, O.; Zhang, H.; Raun, W.; Krenzer, E. Simultaneous Determination of Soil Aluminum, Ammonium- and Nitrate-nitrogen Using 1 M Potassium Chloride Extraction. Commun. Soil Sci. Plant Anal. 2000, 31, 893–903. [Google Scholar] [CrossRef]
  33. Keeney, D.R.; Nelson, D.W. Nitrogen—Inorganic Forms. In Methods of Soil Analysis; John Wiley & Sons, Ltd.: Hoboken, NJ, USA, 1983; pp. 643–698. ISBN 9780891189770. [Google Scholar]
  34. Bolyen, E.; Rideout, J.R.; Dillon, M.R.; Bokulich, N.A.; Abnet, C.C.; Al-Ghalith, G.A.; Alexander, H.; Alm, E.J.; Arumugam, M.; Asnicar, F.; et al. Reproducible, Interactive, Scalable and Extensible Microbiome Data Science Using QIIME 2. Nat. Biotechnol. 2019, 37, 852–857. [Google Scholar] [CrossRef]
  35. Martin, M. Cutadapt Removes Adapter Sequences from High-Throughput Sequencing Reads. EMBnet J. 2011, 17, 10–12. [Google Scholar] [CrossRef]
  36. Callahan, B.J.; McMurdie, P.J.; Rosen, M.J.; Han, A.W.; Johnson, A.J.A.; Holmes, S.P. DADA2: High-Resolution Sample Inference from Illumina Amplicon Data. Nat. Methods 2016, 13, 581–583. [Google Scholar] [CrossRef] [PubMed]
  37. Quast, C.; Pruesse, E.; Yilmaz, P.; Gerken, J.; Schweer, T.; Yarza, P.; Peplies, J.; Glöckner, F.O. The SILVA Ribosomal RNA Gene Database Project: Improved Data Processing and Web-Based Tools. Nucleic Acids Res. 2013, 41, 590–596. [Google Scholar] [CrossRef] [PubMed]
  38. Bokulich, N.A.; Kaehler, B.D.; Rideout, J.R.; Dillon, M.; Bolyen, E.; Knight, R.; Huttley, G.A.; Gregory Caporaso, J. Optimizing Taxonomic Classification of Marker-Gene Amplicon Sequences with QIIME 2′s Q2-Feature-Classifier Plugin. Microbiome 2018, 6, 90. [Google Scholar] [CrossRef] [PubMed]
  39. Navas-Molina, J.A.; Peralta-Sanchez, J.M.; Gonzalez, A.; McMurdie, P.J.; Vazquez-Baeza, Y.; Xu, Z.; Ursell, L.K.; Lauber, C.; Zhou, H.; Song, S.J.; et al. Advancing Our Understanding of the Human Microbiome Using QIIME. Methods Enzymol. 2013, 531, 371–444. [Google Scholar] [CrossRef] [PubMed]
  40. Bisanz, J.E. Qiime2R: Importing QIIME2 Artifacts and Associated Data into R Sessions. 2018. Available online: https://rdrr.io/github/jbisanz/qiime2R/ (accessed on 1 April 2023).
  41. McMurdie, P.J.; Holmes, S. Phyloseq: An R Package for Reproducible Interactive Analysis and Graphics of Microbiome Census Data. PLoS ONE 2013, 8, e61217. [Google Scholar] [CrossRef]
  42. Oksanen, J.; Blanchet, F.G.; Friendly, M.; Kindt, R.; Legendre, P.; McGlinn, D.; Minchin, P.R.; O’Hara, R.B.; Simpson, G.L.; Solymos, P.; et al. Vegan: Community Ecology Package 2018. Available online: http://cran.nexr.com/web/packages/vegan/index.html (accessed on 1 April 2023).
  43. Chen, H.; Jing, Q.; Liu, X.; Zhou, X.; Fang, C.; Li, B.; Zhou, S.; Nie, M. Microbial Respiratory Thermal Adaptation Is Regulated by R-/K-Strategy Dominance. Ecol. Lett. 2022, 25, 2489–2499. [Google Scholar] [CrossRef] [PubMed]
  44. Douglas, G.M.; Maffei, V.J.; Zaneveld, J.R.; Yurgel, S.N.; Brown, J.R.; Taylor, C.M.; Huttenhower, C.; Langille, M.G.I. PICRUSt2 for Prediction of Metagenome Functions. Nat. Biotechnol. 2020, 38, 685–688. [Google Scholar] [CrossRef] [PubMed]
  45. R Core Team R. A Language and Environment for Statistical Computing; Austria R Foundation for Statistical Computing: Vienna, Austria, 2021. [Google Scholar]
  46. Wickham, H. Ggplot2: Elegant Graphics for Data Analysis; Springer: New York, NY, USA, 2009; ISBN 978-0-387-98140-6. [Google Scholar]
  47. McArdle, B.H.; Anderson, M.J. Fitting Multivariate Models to Community Data: A Comment on Distance-Based Redundancy Analysis. Ecology 2001, 82, 290–297. [Google Scholar] [CrossRef]
  48. Mandal, S.; Van Treuren, W.; White, R.A.; Eggesbø, M.; Knight, R.; Peddada, S.D. Analysis of Composition of Microbiomes: A Novel Method for Studying Microbial Composition. Microb. Ecol. Health Dis. 2015, 26, 27663. [Google Scholar] [CrossRef] [PubMed]
  49. Love, M.I.; Huber, W.; Anders, S. Moderated Estimation of Fold Change and Dispersion for RNA-Seq Data with DESeq2. Genome Biol. 2014, 15, 550. [Google Scholar] [CrossRef] [PubMed]
  50. Kolde, R. Pheatmap: Pretty Heatmaps 2019. Available online: https://rdrr.io/cran/pheatmap/ (accessed on 1 April 2023).
  51. Zhang, X.; Zhang, Q.; Zhan, L.; Xu, X.; Bi, R.; Xiong, Z. Biochar Addition Stabilized Soil Carbon Sequestration by Reducing Temperature Sensitivity of Mineralization and Altering the Microbial Community in a Greenhouse Vegetable Field. J. Environ. Manag. 2022, 313, 114972. [Google Scholar] [CrossRef] [PubMed]
  52. Choi, Y.K.; Jang, H.M.; Kan, E.; Wallace, A.R.; Sun, W. Adsorption of Phosphate in Water on a Novel Calcium Hydroxide-Coated Dairy Manure-Derived Biochar. Environ. Eng. Res. 2019, 24, 434–442. [Google Scholar] [CrossRef]
  53. Zeng, S.; Harris, R.; Kan, E. Effect of Alfalfa-Derived Biochar on Anaerobic Digestion of Dairy Manure. Agronomy 2022, 12, 911. [Google Scholar] [CrossRef]
  54. Algren, M.; Costello, C.; Landis, A.E. Phosphorus (P) in Animal Diets as a Driver of Embodied P in Animal Products and Net Anthropogenic P Inputs. J. Ind. Ecol. 2022, 26, 1123–1135. [Google Scholar] [CrossRef]
  55. Flachowsky, G.; Gruen, M.; Meyer, U. Feed-Efficient Ruminant Production: Opportunities and Challenges. J. Anim. Feed Sci. 2013, 22, 177–187. [Google Scholar] [CrossRef]
  56. Brewer, C.E.; Brown, R.C. Biochar. Compr. Renew. Energy 2012, 5, 357–384. [Google Scholar] [CrossRef]
  57. Chintala, R.; Mollinedo, J.; Schumacher, T.E.; Malo, D.D.; Julson, J.L. Effect of Biochar on Chemical Properties of Acidic Soil. Arch. Agron. Soil Sci. 2014, 60, 393–404. [Google Scholar] [CrossRef]
  58. Gul, S.; Whalen, J.K.; Thomas, B.W.; Sachdeva, V.; Deng, H. Physico-Chemical Properties and Microbial Responses in Biochar-Amended Soils: Mechanisms and Future Directions. Agric. Ecosyst. Environ. 2015, 206, 46–59. [Google Scholar] [CrossRef]
  59. Masto, R.E.; Kumar, S.; Rout, T.K.; Sarkar, P.; George, J.; Ram, L.C. Biochar from Water Hyacinth (Eichornia Crassipes) and Its Impact on Soil Biological Activity. Catena 2013, 111, 64–71. [Google Scholar] [CrossRef]
  60. Stewart, C.E.; Zheng, J.; Botte, J.; Cotrufo, M.F. Co-Generated Fast Pyrolysis Biochar Mitigates Green-House Gas Emissions and Increases Carbon Sequestration in Temperate Soils. GCB Bioenergy 2013, 5, 153–164. [Google Scholar] [CrossRef]
  61. Wong, F.; Chen, Z.; Chen, X.; Wang, C.; Ng, W.; Wong, M.H.; Luo, Y.; Po, T.; Kong, H. Soil-Water Retention Behavior of Compacted Biochar-Amended Clay: A Novel Landfill Final Cover Material. J. Soils Sediments 2017, 17, 590–598. [Google Scholar] [CrossRef]
  62. Xu, G.; Sun, J.N.; Shao, H.B.; Chang, S.X. Biochar Had Effects on Phosphorus Sorption and Desorption in Three Soils with Differing Acidity. Ecol. Eng. 2014, 62, 54–60. [Google Scholar] [CrossRef]
  63. Ahmad, M.; Rajapaksha, A.U.; Lim, J.E.; Zhang, M.; Bolan, N.; Mohan, D.; Vithanage, M.; Lee, S.S.; Ok, Y.S. Biochar as a Sorbent for Contaminant Management in Soil and Water: A Review. Chemosphere 2014, 99, 19–33. [Google Scholar] [CrossRef] [PubMed]
  64. Luo, S.; Wang, S.; Tian, L.; Li, S.; Li, X.; Shen, Y.; Tian, C. Long-Term Biochar Application Influences Soil Microbial Community and Its Potential Roles in Semiarid Farmland. Appl. Soil Ecol. 2017, 117–118, 10–15. [Google Scholar] [CrossRef]
  65. Mohamed, B.A.; Ellis, N.; Kim, C.S.; Bi, X.; Emam, A.E.R. Engineered Biochar from Microwave-Assisted Catalytic Pyrolysis of Switchgrass for Increasing Water-Holding Capacity and Fertility of Sandy Soil. Sci. Total Environ. 2016, 566–567, 387–397. [Google Scholar] [CrossRef] [PubMed]
  66. Lekberg, Y.; Waller, L.P. What Drives Differences in Arbuscular Mycorrhizal Fungal Communities among Plant Species? Fungal Ecol. 2016, 24, 135–138. [Google Scholar] [CrossRef]
  67. McNicol, J.W.; Singh, B.K.; Prosser, J.I.; Nunan, N.; Papert, A.; Daniell, T.J. Links between Plant and Rhizoplane Bacterial Communities in Grassland Soils, Characterized Using Molecular Techniques. Appl. Environ. Microbiol. 2005, 71, 6784–6792. [Google Scholar] [CrossRef]
  68. Obayomi, O.; Edelstein, M.; Safi, J.; Mihiret, M.; Ghazaryan, L.; Vonshak, A.; Bernstein, N.; Gillor, O. The Combined Effects of Treated Wastewater Irrigation and Plastic Mulch Cover on Soil and Crop Microbial Communities. Biol. Fertil. Soils 2020, 56, 729–742. [Google Scholar] [CrossRef]
  69. Singh, B.K.; Munro, S.; Potts, J.M.; Millard, P. Influence of Grass Species and Soil Type on Rhizosphere Microbial Community Structure in Grassland Soils. Appl. Soil Ecol. 2007, 36, 147–155. [Google Scholar] [CrossRef]
  70. Fierer, N. Embracing the Unknown: Disentangling the Complexities of the Soil Microbiome. Nat. Rev. Microbiol. 2017, 15, 579–590. [Google Scholar] [CrossRef]
  71. Crowther, T.W.; Maynard, D.S.; Leff, J.W.; Oldfield, E.E.; McCulley, R.L.; Fierer, N.; Bradford, M.A. Predicting the Responsiveness of Soil Biodiversity to Deforestation: A Cross-Biome Study. Glob. Chang. Biol. 2014, 20, 2983–2994. [Google Scholar] [CrossRef] [PubMed]
  72. Chen, J.; Sun, X.; Zheng, J.; Zhang, X.; Liu, X.; Bian, R.; Li, L.; Cheng, K.; Zheng, J.; Pan, G. Biochar Amendment Changes Temperature Sensitivity of Soil Respiration and Composition of Microbial Communities 3 Years after Incorporation in an Organic Carbon-Poor Dry Cropland Soil. Biol. Fertil. Soils 2018, 54, 175–188. [Google Scholar] [CrossRef]
  73. Li, S.; Wang, S.; Fan, M.; Wu, Y.; Shangguan, Z. Interactions between Biochar and Nitrogen Impact Soil Carbon Mineralization and the Microbial Community. Soil Tillage Res. 2020, 196, 104437. [Google Scholar] [CrossRef]
  74. Obayomi, O.; Seyoum, M.M.; Ghazaryan, L.; Tebbe, C.C.; Murase, J.; Bernstein, N.; Gillor, O. Soil Texture and Properties Rather than Irrigation Water Type Shape the Diversity and Composition of Soil Microbial Communities. Appl. Soil Ecol. 2021, 161, 103834. [Google Scholar] [CrossRef]
  75. Wasmund, K.; Schreiber, L.; Lloyd, K.G.; Petersen, D.G.; Schramm, A.; Stepanauskas, R.; Jørgensen, B.B.; Adrian, L. Genome Sequencing of a Single Cell of the Widely Distributed Marine Subsurface Dehalococcoidia, Phylum Chloroflexi. ISME J. 2014, 8, 383–397. [Google Scholar] [CrossRef] [PubMed]
  76. Mori, J.F.; Chen, L.-X.; Jessen, G.L.; Rudderham, S.B.; McBeth, J.M.; Lindsay, M.B.J.; Slater, G.F.; Banfield, J.F.; Warren, L.A. Putative Mixotrophic Nitrifying-Denitrifying Gammaproteobacteria Implicated in Nitrogen Cycling Within the Ammonia/Oxygen Transition Zone of an Oil Sands Pit Lake. Front. Microbiol. 2019, 10, 2435. [Google Scholar] [CrossRef] [PubMed]
  77. Lehmann, J.; Rillig, M.C.; Thies, J.; Masiello, C.A.; Hockaday, W.C.; Crowley, D. Biochar Effects on Soil Biota—A Review. Soil Biol. Biochem. 2011, 43, 1812–1836. [Google Scholar] [CrossRef]
  78. Kirby, R. Actinomycetes and Lignin Degradation. Adv. Appl. Microbiol. 2005, 58, 125–168. [Google Scholar] [CrossRef]
  79. O’Neill, B.; Grossman, J.; Tsai, M.T.; Gomes, J.E.; Lehmann, J.; Peterson, J.; Neves, E.; Thies, J.E. Bacterial Community Composition in Brazilian Anthrosols and Adjacent Soils Characterized Using Culturing and Molecular Identification. Microb. Ecol. 2009, 58, 23–35. [Google Scholar] [CrossRef] [PubMed]
  80. Chen, J.; Liu, X.; Zheng, J.; Zhang, B.; Lu, H.; Chi, Z.; Pan, G.; Li, L.; Zheng, J.; Zhang, X.; et al. Biochar Soil Amendment Increased Bacterial but Decreased Fungal Gene Abundance with Shifts in Community Structure in a Slightly Acid Rice Paddy from Southwest China. Appl. Soil Ecol. 2013, 71, 33–44. [Google Scholar] [CrossRef]
  81. Pan, F.; Li, Y.; Chapman, S.J.; Khan, S.; Yao, H. Microbial Utilization of Rice Straw and Its Derived Biochar in a Paddy Soil. Sci. Total Environ. 2016, 559, 15–23. [Google Scholar] [CrossRef] [PubMed]
  82. Dai, Z.; Su, W.; Chen, H.; Barberán, A.; Zhao, H.; Yu, M.; Yu, L.; Brookes, P.C.; Schadt, C.W.; Chang, S.X.; et al. Long-Term Nitrogen Fertilization Decreases Bacterial Diversity and Favors the Growth of Actinobacteria and Proteobacteria in Agro-Ecosystems across the Globe. Glob. Chang. Biol. 2018, 24, 3452–3461. [Google Scholar] [CrossRef] [PubMed]
  83. White, J.F.; Kingsley, K.L.; Verma, S.K.; Kowalski, K.P. Rhizophagy Cycle: An Oxidative Process in Plants for Nutrient Extraction from Symbiotic Microbes. Microorganisms 2018, 6, 95. [Google Scholar] [CrossRef] [PubMed]
  84. DeBruyn, J.M.; Nixon, L.T.; Fawaz, M.N.; Johnson, A.M.; Radosevich, M. Global Biogeography and Quantitative Seasonal Dynamics of Gemmatimonadetes in Soil. Appl. Environ. Microbiol. 2011, 77, 6295–6300. [Google Scholar] [CrossRef]
  85. Yang, W.; Li, C.; Wang, S.; Zhou, B.; Mao, Y.; Rensing, C.; Xing, S. Influence of Biochar and Biochar-Based Fertilizer on Yield, Quality of Tea and Microbial Community in an Acid Tea Orchard Soil. Appl. Soil Ecol. 2021, 166, 104005. [Google Scholar] [CrossRef]
  86. Allison, S.D.; Vitousek, P.M. Responses of Extracellular Enzymes to Simple and Complex Nutrient Inputs. Soil Biol. Biochem. 2005, 37, 937–944. [Google Scholar] [CrossRef]
  87. Demisie, W.; Liu, Z.; Zhang, M. Effect of Biochar on Carbon Fractions and Enzyme Activity of Red Soil. Catena 2014, 121, 214–221. [Google Scholar] [CrossRef]
  88. Han, L.; Sun, K.; Yang, Y.; Xia, X.; Li, F.; Yang, Z.; Xing, B. Biochar’s Stability and Effect on the Content, Composition and Turnover of Soil Organic Carbon. Geoderma 2020, 364, 114184. [Google Scholar] [CrossRef]
  89. Zhang, L.; Xiang, Y.; Jing, Y.; Zhang, R. Biochar Amendment Effects on the Activities of Soil Carbon, Nitrogen, and Phosphorus Hydrolytic Enzymes: A Meta-Analysis. Environ. Sci. Pollut. Res. 2019, 26, 22990–23001. [Google Scholar] [CrossRef]
  90. Wang, X.; Wu, X.; Zhang, B.; Li, Z.; Du, H.; Tie, B.; Lei, M. Bacterial Diversity Rather than Available Cd Is the Main Driver of Exoenzyme Activity and Stoichiometry after Soil Amendments in Mildly Contaminated Soil. J. Soils Sediments 2022, 22, 443–456. [Google Scholar] [CrossRef]
  91. Bhaduri, D.; Saha, A.; Desai, D.; Meena, H.N. Restoration of Carbon and Microbial Activity in Salt-Induced Soil by Application of Peanut Shell Biochar during Short-Term Incubation Study. Chemosphere 2016, 148, 86–98. [Google Scholar] [CrossRef] [PubMed]
  92. Irfan, M.; Hussain, Q.; Khan, K.S.; Akmal, M.; Ijaz, S.S.; Hayat, R.; Khalid, A.; Azeem, M.; Rashid, M. Response of Soil Microbial Biomass and Enzymatic Activity to Biochar Amendment in the Organic Carbon Deficient Arid Soil: A 2-Year Field Study. Arab. J. Geosci. 2019, 12, 95. [Google Scholar] [CrossRef]
  93. Mierzwa-Hersztek, M.; Gondek, K.; Baran, A. Effect of Poultry Litter Biochar on Soil Enzymatic Activity, Ecotoxicity and Plant Growth. Appl. Soil Ecol. 2016, 105, 144–150. [Google Scholar] [CrossRef]
  94. Gascó, G.; Paz-Ferreiro, J.; Cely, P.; Plaza, C.; Méndez, A. Influence of Pig Manure and Its Biochar on Soil CO2 Emissions and Soil Enzymes. Ecol. Eng. 2016, 95, 19–24. [Google Scholar] [CrossRef]
  95. Zhao, Y.; Wang, L.; Zhang, D.; Li, R.; Cheng, T.; Zhang, Y.; Liu, X.; Wong, G.; Tang, Y.; Wang, H.; et al. Comparative Transcriptome Analysis Reveals Relationship of Three Major Domesticated Varieties of Auricularia Auricula-Judae. Sci. Rep. 2019, 9, 78. [Google Scholar] [CrossRef] [PubMed]
  96. Chen, J.; Chen, D.; Xu, Q.; Fuhrmann, J.J.; Li, L.; Pan, G.; Li, Y.; Qin, H.; Liang, C.; Sun, X. Organic Carbon Quality, Composition of Main Microbial Groups, Enzyme Activities, and Temperature Sensitivity of Soil Respiration of an Acid Paddy Soil Treated with Biochar. Biol. Fertil. Soils 2019, 55, 185–197. [Google Scholar] [CrossRef]
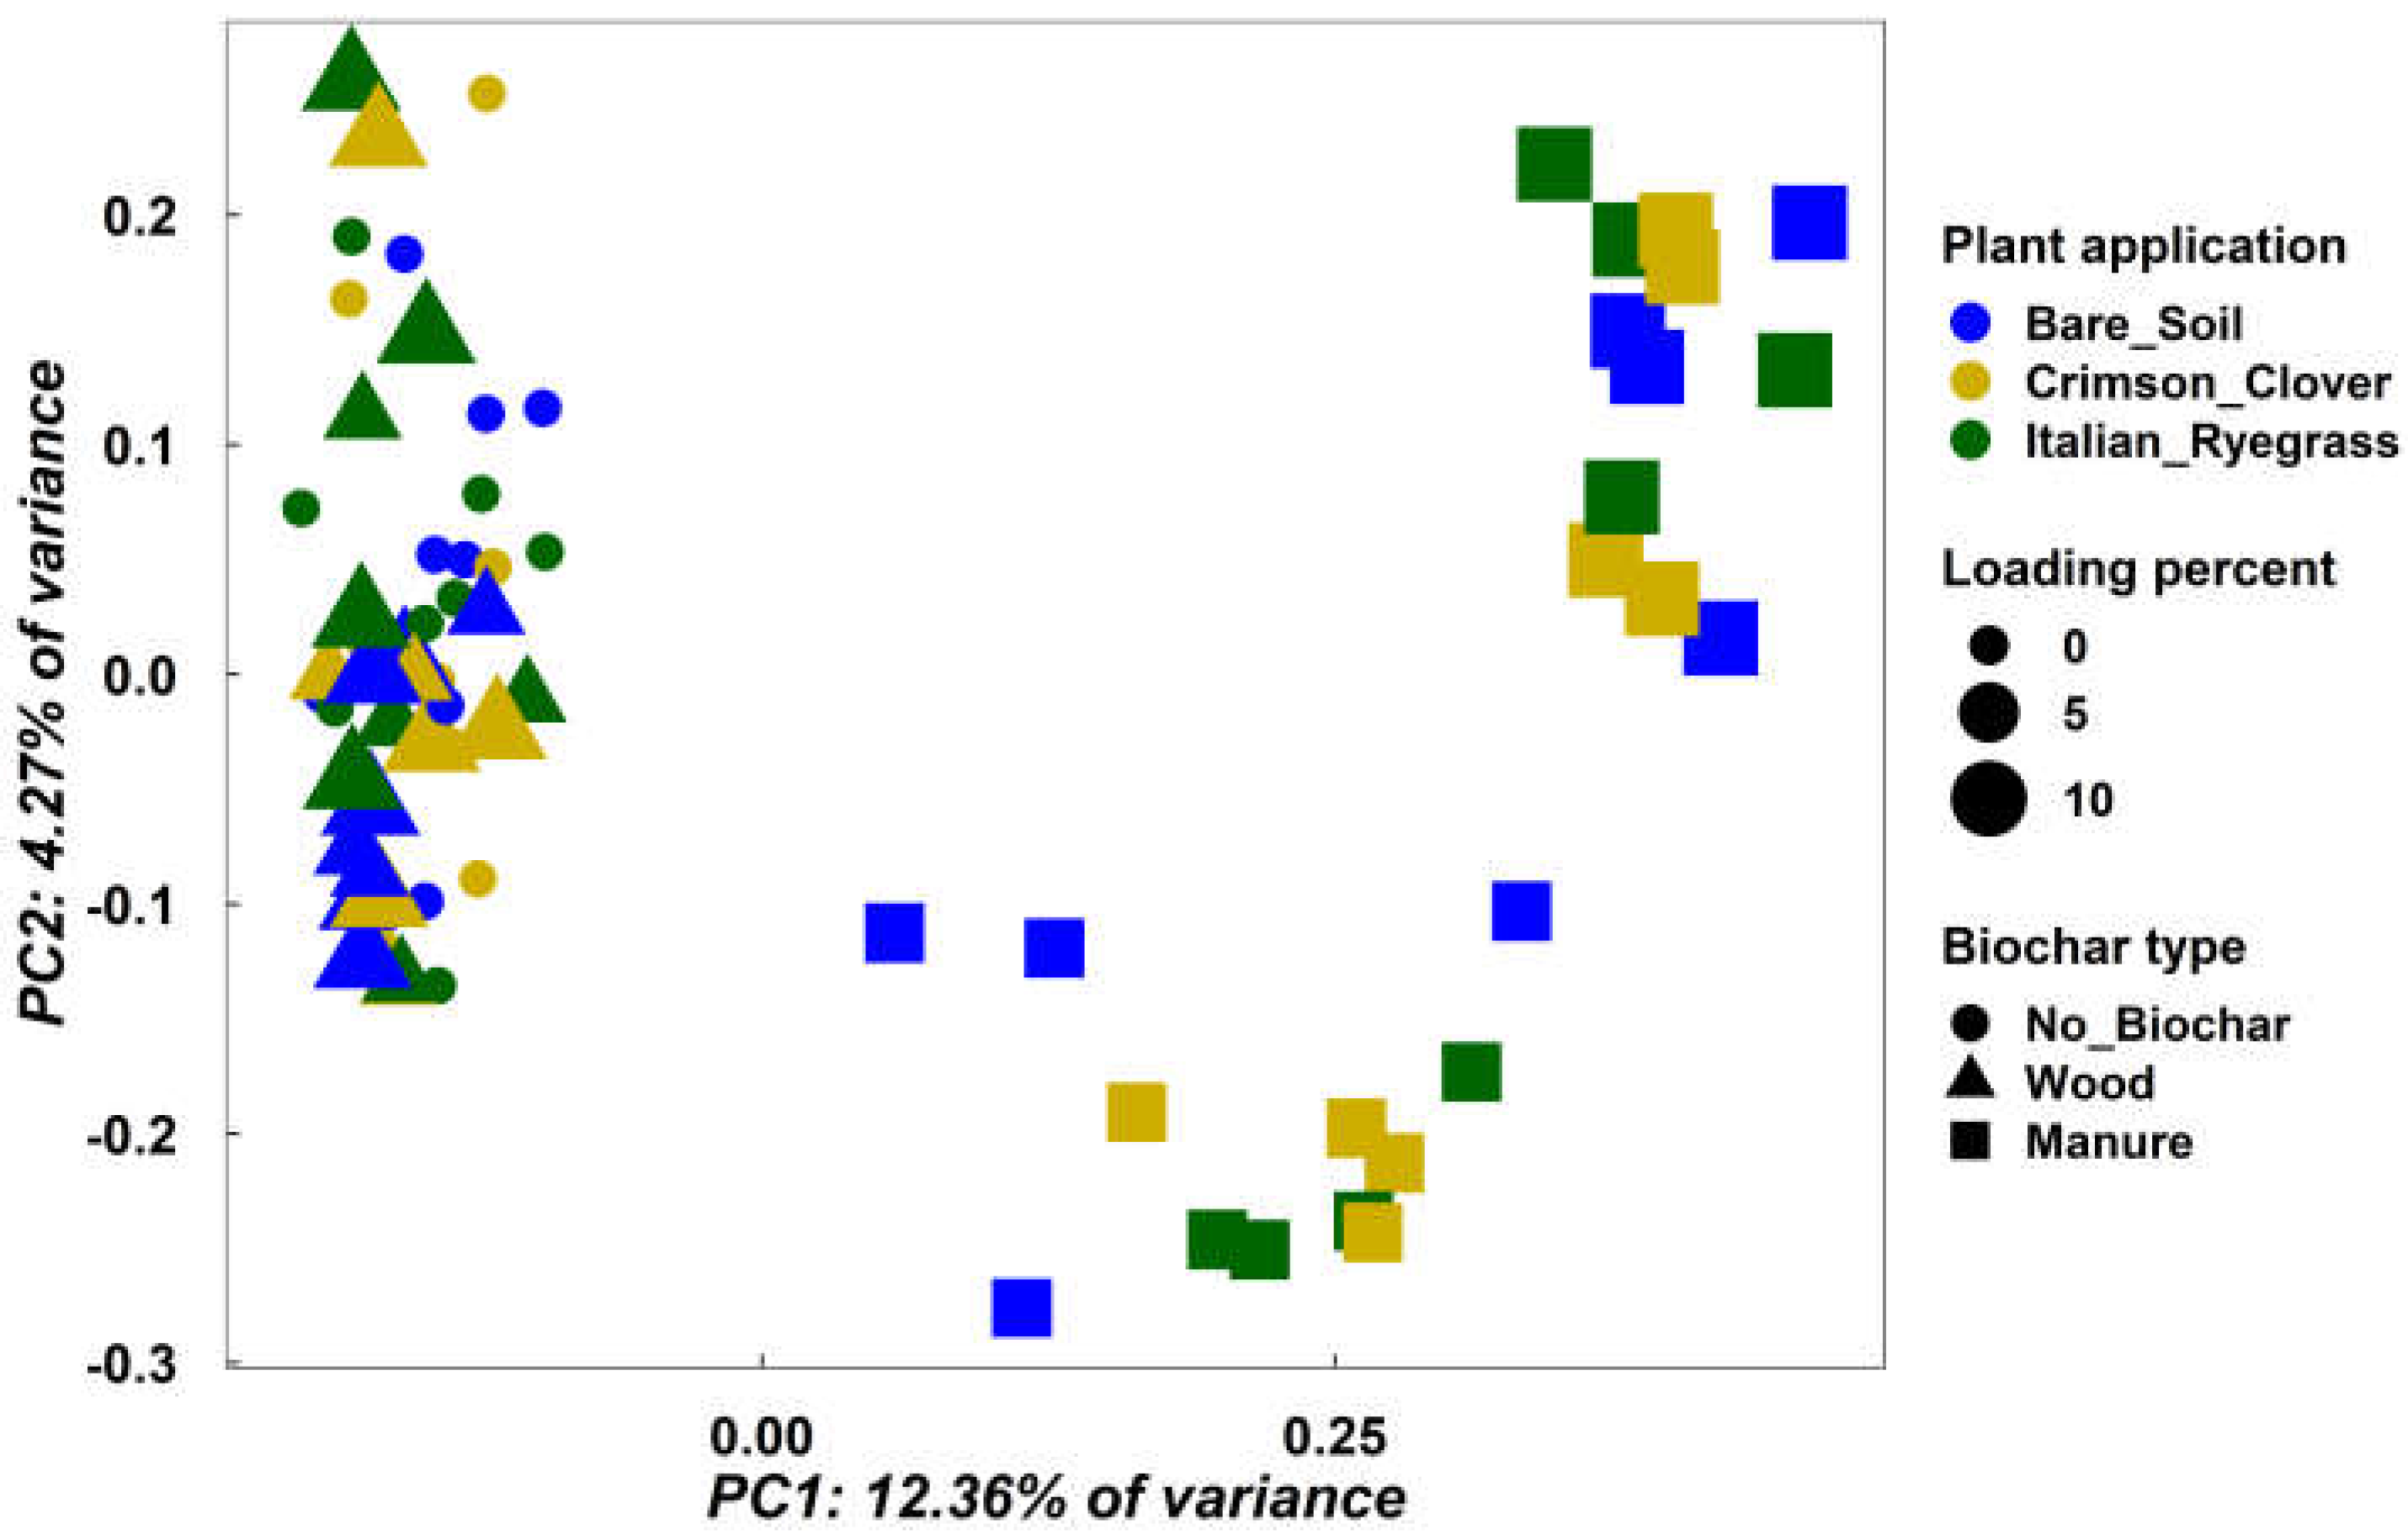
Figure 1. Prokaryote species richness (observed) and diversity (Shannon) of the soils; n = 4. The x-axis is the biochar loading rate; y-axis is the alpha diversity metric. Boxes represent 25–75% of the data, solid lines represent the median, and the tips represent the minimum and maximum values excluding the outliers (1.5 times lesser or greater than the lower or upper quantiles) represented by dots outside of the boxes.
Agronomy 13 01512 g001
Figure 2. Beta diversity of the soil prokaryote community. Principal coordinates analysis (PCoA) plot on Bray-Curtis distance matrix generated from rarefied ASV abundances and depicting patterns of beta diversity. Points that are closer together on the ordination have communities that are more similar. Permutational multivariate analysis of variance indicated significant (p < 0.05) differences between biochar types and biochar loading rates. A gradient effect of increasing biochar rate on the microbes can be seen on PC2.
Agronomy 13 01512 g002
Figure 3. Effect of biochar, its loading rate, and crop type on soil nutrients. The x-axis is the biochar loading rate; y-axis is the nutrient, EC, and pH concentrations. X- and y-faceting are biochar type and crop type, respectively. (A) Calcium; (B) Electrical conductivity; (C) Potassium; (D) Magnesium; (E) Sodium; (F) Nitrate; (G) Phosphate; (H) pH. Bars represent mean ± standard error, n = 4.
Agronomy 13 01512 g003
Figure 4. Distance-based redundancy analyses (dbRDA) using a Bray–Curtis distance matrix on the soil prokaryote community. Biplot of the relation between prokaryote community composition and the tested physicochemical variables. A most parsimonious model indicated significant (p < 0.05; adonis test) correlations were pH, EC, Ca, and P (colored in red; view of P obscured by other factors) while other factors were insignificant (colored in black) when all factors were considered together. The length of the arrows indicates the strength of the relationship, and the angles between arrows reveal the correlations between respective factors. Higher soil nutrient parameters positively correlate with higher biochar loading percentages, particularly in manure-amended biochar.
Agronomy 13 01512 g004
Figure 5. Relative abundance of the dominant prokaryote phyla and classes in soils growing crimson clover and Italian ryegrass. (A) Prokaryotic phyla; (B) Prokaryotic classes. Rare taxa are those with relative abundance values less than or equal to 5% and 7% at the phylum and class levels, respectively.
Agronomy 13 01512 g005
Figure 6. Heatmap showing the difference in patterns of the significant genera between treatments detected using ANCOM. On the x-axis are samples and on the y-axis are hierarchically clustered significant genera. Genera abundance values were transformed (log x + 1), scaled, and correlated. The heatmap shows that the patterns were different between biochar types and loading percentages within biochar types but less so between crop types.
Agronomy 13 01512 g006
Figure 7. Effect of biochar type, its loading rate, and crop type on the ratio between the relative abundance of r-strategists (Proteobacteria, Bacteroidota, Firmicutes) and K-strategists (Acidobacteriota, Chloroflexi, Verrucomicrobiota, and Gemmatimonadota) in the soil. The x-axis is the biochar loading rate while the y-axis is the ratio. X- and Y-faceting are biochar type and crop type, respectively. Bars represent mean ± standard error, n = 4.
Agronomy 13 01512 g007
Figure 8. Heatmap showing the difference in gene patterns observed between treatments. On the x-axis are samples and on the y-axis are hierarchically clustered significant genes. Gene abundances were transformed, scaled, and correlated. The heatmap shows that the gene patterns were different between biochar types and loading percentage rate within biochar types.
Agronomy 13 01512 g008
Table 2. PERMANOVA test for statistical significance of sample groupings in the soil. Statistical tests were performed on Bray–Curtis distance matrices (where PCoAs were generated from abundance-filtered ASV tables), using 999 permutations per test. Significant p-values are highlighted in bold text.
TermsDFR2Pseudo F-Valuep-Value
Crop type20.0271.0820.183
Biochar Type20.1325.3580.001
Loading percent10.0282.2440.001
Crop type × Biochar type40.0480.9700.571
Crop type × Loading percent20.0210.8460.949
Biochar type × Loading percent10.0262.1010.001
Crop type × Biochar type × Loading percent20.0190.7860.997
Residuals570.700
Disclaimer/Publisher’s Note: The statements, opinions and data contained in all publications are solely those of the individual author(s) and contributor(s) and not of MDPI and/or the editor(s). MDPI and/or the editor(s) disclaim responsibility for any injury to people or property resulting from any ideas, methods, instructions or products referred to in the content.

