Article

Effects of Annual Straw Incorporation Combined with Application of Nitrogen Fertilizer in Rice Season on Dry Matter and Nutrient Accumulation Characteristics of Subsequent Rapeseed

1
College of Agronomy, Guizhou University, Guiyang 550025, China
2
Laboratory of Plant Resource Conservation and Germplasm Innovation in Mountainous Region, Ministry of Education, Guizhou University, Guiyang 550025, China
*
Author to whom correspondence should be addressed.
Agronomy 2023, 13(6), 1514; https://doi.org/10.3390/agronomy13061514
Submission received: 10 May 2023 / Revised: 23 May 2023 / Accepted: 26 May 2023 / Published: 31 May 2023
(This article belongs to the Section Soil and Plant Nutrition)

Abstract

:
In the rice–rapeseed rotation system, straw incorporation plays an important role in achieving the rational utilization of resources and maintaining crop production. However, in the study of rice–rapeseed rotation, there was no study on the effect of straw and nitrogen (N) fertilizer in the rice season on the dry matter accumulation (DMA) and nutrient accumulation of subsequent rapeseed. So, this study relied on the localization experiment of rice–rapeseed rotation and annual straw incorporation (full straw returning to the field, SR; the control is full straw removal from the field, CK) with different N fertilizer application rates (N1: 0 kg ha−1, N2: 75 kg ha−1, N3: 150 kg ha−1, and N4: 225 kg ha−1) in the rice season. Based on the fourth year of experiment implementation, the effects of annual straw incorporation combined with the N fertilizer application rate in the rice season on the leaf area index (LAI), photosynthetic potential (PP), DMA and its distribution proportion and rate, and nutrient uptake and its allocation proportion in rapeseed were discussed. At the bolting stage (BS), initial flowering stage (IFS), terminal flowering stage (TFS), and mature stage (MS), the DMA of rapeseed in SR was significantly higher than that in CK by 69.90, 64.27, 62.90, and 41.27%, respectively. The accumulation of N, phosphorus (P), and potassium (K) in SR was significantly higher than that in CK at the BS, IFS, TFS, and MS. Straw treatment had a significant impact on the apparent surplus of N, P, and K in the rice, rapeseed, and annual seasons, while the application of N fertilizer in the rice season had a significant or extremely significant impact on the apparent surplus (AS) of N in the rice, rapeseed, and annual seasons, indicating that fertilization of previous crops had a certain aftereffect. Therefore, straw incorporation is a sustainable farmland management measure.

1. Introduction

Rapeseed is one of the most important oil crops in China, with its planting area and yield ranking among the highest in the world [1,2]. The rice–rapeseed rotation model is one of the most important rice field cultivation systems in southern China [3]. It is a typical manually operated ecosystem consisting of frequent rotation of paddy fields and uplands under anaerobic and aerobic conditions [4]. Under this farming system, the alternating environment of dry and wet soil directly affects the transformation of various nutrients [5]. Different crop rotation and management practices have a substantial impact on crop productivity and growth dynamics, mainly manifested in changes in biomass, leaf area index, and plant nutrient absorption [6].
Crop straw, that is, the harvesting residue of previous crops, still plays an important role in nutrient cycling [7]. After straw enters the soil, its soluble organic carbon, protein, cellulose, and other easily oxidizable organic substances can be quickly mineralized and can release nutrients from microorganisms [8]. Moreover, it can also serve as a rich source of nutrients, such as soil nitrogen (N), phosphorus (P), and potassium (K), thereby increasing the absorption and utilization of crop nutrients; therefore, it is an important agricultural resource [9]. Research has shown that returning straw from previous crops of rapeseed to the field can improve the leaf area index and dry matter accumulation at the bolting stage of rapeseed [10] and increase the accumulation of N and K nutrients at the initial flowering stage [11]; most importantly, it can also reduce the application of fertilizers [9].
Dry matter is the highest form of crop photosynthesis products, and its accumulation reflects the growth and development status of rapeseed vegetative bodies [12]. There is a significant correlation between dry matter accumulation and nutrient accumulation, which is mainly due to the accumulation of N, P, and K [13]. Meanwhile, the absorption and distribution of N, P, and K nutrients are also important prerequisites for regulating the dynamic transformation of biomass and its components [14]. At present, research on the impact of straw return to the field combined with chemical fertilizer application on subsequent crops under rotation systems is mostly focused on dry matter accumulation and yield benefits or dry land rotation systems. As shown by Xiang et al. [15], in the wheat–maize rotation system, the combination of returning wheat straw to the field and applying N fertilizer significantly increased the dry matter accumulation and yield of subsequent corn crops. Shi et al. [16] also reached a similar conclusion, stating that in the early rice–late rice and early rice–soybean cultivation systems, returning straw to the field increased the yield and biomass of subsequent crops. However, there are relatively few reports on the effects of N fertilizer application in the rice season under annual straw return in the rice–rapeseed rotation system on dry matter accumulation, N, P, and K nutrient accumulation, and the distribution ratio of subsequent rapeseed crops.
Bu et al. [17] analyzed the effects of nitrogen fertilizer application on crop yield, nitrogen uptake, and fertilizer utilization in a rice–rapeseed rotation system from the perspective of annual crop rotation and the aftereffect characteristics of nitrogen fertilizer applied in the rice season on the rapeseed season. Zhang et al. [18] studied the effects of straw return and N fertilizer on crop yield, N uptake, and N fertilizer bias productivity under different crop rotations. Zhang et al. [19] conducted a study on rapeseed as a preceding crop on the yield and soil fertility of subsequent rice. The above studies have focused on the effects of nitrogen application as a single factor or straw return in combination with nitrogen fertilizer on nitrogen uptake, nitrogen fertilizer bias productivity, soil characteristics, and crop yield. However, there are relatively few reports on the accumulation and distribution of dry matter and nutrient content in subsequent rapeseed crops involving annual full straw plowing and return to the field, as well as N fertilizer application in the rice season. Therefore, starting from the actual production of the rice–rapeseed rotation system, this study focused on investigating the response of dry matter and nutrient accumulation in the rapeseed season under rice–rapeseed rotation and annual straw return with N fertilizer application in the previous rice season, providing a basis for nutrient management and multifunctional utilization of rapeseed under straw return.

2. Materials and Methods

2.1. Experimental Site and Plant Materials

The localization experiment began in 2017 and was conducted in Changji Town, Sansui County, Guizhou Province, China (26°56′33.2″ N, 108°45′12.1″ E). From 2017 to 2019, the three-season rice cultivar was Nei 5 You 5399, from 2020 to 2021, the two-season rice cultivar was Yixiangyou 2115, and the oilseed rape cultivars were all Youyan 817. Our experiment samples were sampled and measured in the fourth and fifth years of the trial (from May 2020 to May 2021). The region belongs to a mild and humid monsoon climate zone in the northern subtropical region, with the characteristics of no severe cold in winter, no scorching heat in summer, and rainy and hot seasons. The annual average temperature is 14.9 °C, the maximum temperature is 38.4 °C, the minimum temperature is −7.6 °C, the annual frost-free period is 290~300 days, and the average precipitation is 1147 mm. The tested soil consisted of tidal sand mud. The main physicochemical properties of the soil at the start of the experiment in 2017 were pH 5.63, 12.19 g kg−1 organic matter, 1.63 g kg−1 total N, 131.91 mg kg−1 alkali hydrolyzable nitrogen (N), 0.85 g kg−1 total phosphorus (P), 45.99 mg kg−1 Olsen-p, 15.31 g kg−1 total K, and 63.73 mg kg−1 available potassium (K). The main physicochemical properties of the soil at the end of the rice harvest by 2020 were pH 5.68, 14.29 g kg−1 organic matter, 144.37 mg kg−1 alkali hydrolyzable nitrogen (N), 49.40 mg kg−1 Olsen-p, 112.66 mg kg−1 available potassium (K), 1.91 g kg−1 total N, 0.89 g kg−1 total phosphorus (P), and 19.91 g kg−1 total K.
The rice variety was Nei 5 You 5399, selected from Neijiang Hybrid Rice Science and Technology Development Center, Sichuan Province, China; it is a three-line hybrid indica rice cultivar with a moderate ripening period, medium yield, and excellent rice quality. It is suitable for planting in southwest China, in areas including Yunnan, Guizhou Province. Yixiangyou 2115, which was selected by Sichuan Agricultural University, Yibin Academy of Agricultural Sciences, and Sichuan Lvzhou Seed Industry Co., Ltd. (Yibin, China), a hybrid indica rice cultivar developed 10 years ago that exhibits a large number of spikelets per panicle (over 150 spikelets), was used as the experimental material. As a super rice cultivar that can achieve high yield and good quality under climatic conditions with little sunshine, this cultivar is widely grown in southwest China, in areas including Guizhou, Sichuan, and Yunnan Province. The rapeseed variety was Youyan 817, which was selected by the Rapeseed Research Institute of Guizhou Academy of Agricultural Sciences, China; it is a hybrid rapeseed cultivar with stable yield and is suitable for planting in Sichuan, Yunnan, Guizhou, and other major winter rapeseed producing areas in China.
Fertilizer use: The phosphorus fertilizer was CaP2H4O8 (containing P2O5 16%, Guiding County Agricultural Chemical Fertilizer Limited Liability Company, Guiding, China). The potassium fertilizer was KCl (containing 60% K2O, made in Russia, Sinochem Fertilizer Holdings Limited, Beijing, China). The nitrogen fertilizer was CON2H4 (containing N 46.4%, Guizhou Chitianhua Co., Ltd., Guiyang, China).

2.2. Experimental Design

We relied on a localization experiment of straw return with nitrogen fertilizer to conduct related research. The localization experiment, using a rice–rapeseed rotation model, was started in 2017 in Changji Township, Sansui County, Guizhou Province, China. In the 2017 rice season, no rapeseed straw was returned to the field. By mid-April 2021 when the rape was harvested, the rice straw was returned to the field four times, and the rape straw was returned to the field a total of three times. Rapeseed is transplanted in late October each year and harvested in late April of the following year. Rice seedlings are raised in late April, transplanted in early June, and harvested in early October each year. Straw is retrieved, crushed, and then manually turned and buried for return to the field. In the rice season, the experiment was conducted in a two-factor split-zone design, with the main plots consisting of the straw treatment (two types: SR and CK) and the subplots consisting of the N application rate (four N levels: N0, 0 kg ha−1; N1, 75 kg ha−1; N2, 150 kg ha−1; and N3, 225 kg ha−1). Each of the eight treatments was replicated three times. In the SR treatment, all of the straw was shredded and returned to the field. N in the form of urea was applied using the split application method, with 35%, 20%, 30%, and 15% of total N applied for basal, tillering, flowering promotion, and flower preservation fertilizers, respectively. P fertilizer (superphosphate) was applied as a base fertilizer at 96 kg P2O5 ha−1; and K fertilizer (potassium chloride) was applied as 50% of base fertilizer and 50% of panicle fertilizer, totaling 135 kg K2O ha−1. Rice was transplanted on 4 June 2020 with a row spacing of 30 cm × 20 cm, 1 seedling per hill, 16 rows per plot, 26 hills per row, and 416 hills in total. The plot size was 22.5 m2 at 5 m long and 4.5 m wide. A 30 cm high, 20 cm wide ridge wrap was made around the plot, and the wrap was pressed to a depth of 30 cm underground to prevent water and fertilizer infiltration, leaving a 70 cm walkway between repetitions for field operations and surveys.
For the rapeseed season, the experiment was conducted in a one-way design, with straw treatment as a factor. The straw treatment was the same as that of the rice season; that is, the rice straw was returned to the field in full in the plots of the straw incorporation, and all rice straw was removed from the field in the plots of the straw removal. The management of fertilization was consistent. Briefly, the N application rate was 210 kg ha−1, with 50, 25, and 25% of N applied during the basal, seedling (2 weeks after transplanting), and stem elongation periods, respectively. P fertilizer (superphosphate) and K fertilizer (potassium chloride) were applied as a base fertilizer at 90 kg P2O5 ha−1 and 120 kg K2O ha−1; boron fertilizer was applied as a base fertilizer at 24 kg ha−1. The fertilizer type was the same as in the rice season. The plot size was 22 m2, with open trench isolation between the plots. Rapeseed was transplanted via seedling transplantation with a plant row spacing of 40 cm × 50 cm and one seedling per hill. Each plot had a total of 10 rows of 22 plants each, for a total of 220 plants.

2.3. Measurement Items and Methods

2.3.1. Determination of Leaf Area

Four representative plant samples were collected during the bolting stage (BS) (7 February 2021), initial flowering stage (IFS) (21 February 2021), and terminal flowering stage (TFS) (19 March 2021) of rapeseed, and the leaf area was measured using a desktop leaf area meter (model LI-3100C). Ten consecutive hills with more consistent plant growth were selected in each plot using the fixed-point observation method, i.e., 10 hills in the same location at the time of shoot, bolting stage, initial flowering stage, terminal flowering stage, and mature stage; their plant height was measured, and the average was taken. Then, 4 plants were taken as representative plants according to the average plant height.

2.3.2. Determination of Dry Matter

During the rapeseed BS, IFS, and TFS, four representative plants were selected from each plot, and the plant samples were divided into two organs: leaves and stems. At the mature stage (MS) of rapeseed (19 April 2021), the plant samples were divided into three organs: stem, shell, and grain. Each sample was blanched in an oven at 105 °C for 30 min, then dried at 80 °C, and weighed.

2.3.3. Determination of N, P, and K Content

The N content was determined using the semi-automatic Kjeldahl method. The P content was determined using the molybdenum antimony colorimetric method, and the K content was measured using the flame photometer method.

2.4. Measurement Indicators

2.4.1. Nutrient Accumulation

Nutrient accumulation was calculated as follows: plant nutrient accumulation = plant dry matter weight × plant nutrient content. The nutrient accumulation from 4 plants was finally converted to kg ha−2.

2.4.2. Photosynthetic Potential

Photosynthetic potential (PP) = (L1 + L2) × (t2 − t1)/2, where L1 and L2 are the leaf areas measured before and after the two measurements, respectively, and t1 and t2 are the times of the previous and subsequent measurements, respectively [20]. The periods of this study were from BS to IFS and from IFS to TFS.

2.4.3. Apparent Balance

Apparent balance of N (P and K) = cumulative N (P and K) application amount ± cumulative plant N (P and K) absorption amount [21]. In plots where straw is returned to the field, the sources of nitrogen include applied nitrogen fertilizer and nitrogen contained in the straw, but the nitrogen carried by the rapeseed or rice seeds needs to be removed. In plots where straw is removed, the source of nitrogen consists only of the application of nitrogen fertilizer, and the nitrogen carried by the crop straw and seeds is removed. The same applies to phosphorus and potassium.

2.4.4. Dry Matter Allocation Rate of Each Organ

Distribution rate of dry matter (DRDM) in each organ = (dry matter weight of each organ in the following period − dry matter weight of each organ in the previous period)/(total dry matter weight of the following period − total dry matter weight of the previous period) × 100%. The DRDM of each organ in this study includes the flowering stage (FS) and the pods at the mature stage of pod development (MSPD), where the FS refers to the process from the IFS to the TFS, and the MSPD refers to the process from the TFS to the MS.

2.4.5. Data Analysis

The data were organized and analyzed using software such as SAS9.0 and Microsoft Excel 2010, comparing mean differences between three replicates using a two-factor split block design, and significance testing was conducted using the least significant difference (LSD) method. ** indicates a significant difference at 0.01 level, and * indicates a significant difference at 0.05 level.

3. Results

3.1. Leaf Area Index and Photosynthetic Potential

The leaf area index (LAI) of rapeseed treated with SR was 118.2, 75.8, and 73.0% higher than that of rapeseed treated with CK at the BS, IFS, and TFS, respectively, reaching extremely significant levels (Table 1). The effects of different N application treatments on LAI at different growth stages differed. At the BS, there was no significant difference between the N application treatments. However, there was a significant difference between the N application treatments at the IFS and TFS. Among them, the N4 treatment at the TFS had the highest LAI, reaching 1.2, which was significantly higher than the LAI of N1 and N2 but not significantly different from that of N3. Further analysis showed that, except for the N3 level at the IFS, the LAI of rapeseed treated with SR was significantly higher than that of CK at any N application rate at all growth stages. The analysis of variance results showed that straw treatment had a very significant impact on the LAI of rapeseed at various growth stages. The N application rate mainly affected the LAI at the TFS, while the interaction between straw treatment and the N application rate only had a significant impact on the LAI at the IFS.
At the BS-IFS and FS, the PP of SR was 94.50 and 82.10% higher than that of CK, respectively, all reaching highly significant levels. Each N application treatment had no significant effect on PP. Further analysis showed that at the BS–IFS, except for the N1 level, there were significant differences in the PP at all other N levels. However, at the FS, only at the N4 level did PP reach a significant difference. The analysis of variance results showed that straw treatment had a very significant impact on PP at each growth stage.

3.2. Dry Matter Accumulation and Its Distribution Proportion

3.2.1. Dry Matter Accumulation

The dry matter accumulation (DMA) of rapeseed treated with SR was 69.90, 64.27, 62.90, and 41.27% higher than that of CK at the BS, IFS, TFS, and MS, respectively, reaching extremely significant levels (p < 0.01) (Table 2). There was no significant difference in DMA between the N application treatments at the different growth stages. Further analysis showed that at any N application rate in all growth stages, except for the N1 treatment at the IFS and TFS and the N1 and N3 treatments at the MS, the DMA of SR was significantly higher than that of CK. The analysis of variance results showed that straw treatment had a very significant impact on the DMA of rapeseed at various growth stages.
At the FS and mature stage of pod development (MSPD), the DMA of SR was 60.71 and 20.81% higher than that of CK, respectively, but it only reached a significant level at the FS (Table 2). There was no significant difference between the different N application treatments, with the highest DMA at the N3 level at the FS compared to the other N levels, and the highest DMA was observed at the N2 level at the MSPD. Further analysis showed that, except for the N3 level at the MSPD, the DMA of SR-treated rapeseed was higher than that of CK at any N level at each growth stage, but it only reached a significant level at the N1 and N2 levels at the FS. The analysis of variance results showed that only the straw treatment had a significant impact on the DMA at the FS.

3.2.2. Distribution Proportion of Dry Matter

At the BS, IFS, and TFS, the distribution proportion of dry matter (DPDM) in the stems in SR was 19.79, 17.76, and 7.88% higher than that in CK, respectively, reaching significant levels, while the DPDM of leaves in CK was higher than SR (Table 3). Each N application treatment had no significant effect on DPDM in any organ during each growth period. Further analysis showed that, except for N1 at the IFS, N1 and N3 at the TFS, and all N levels at the MS, the DPDM of the stems in SR was significantly higher than that in CK at all N levels in all other stages, while the DPDM of the leaves in CK was higher than SR. The analysis of variance results showed that straw treatment had a significant impact on DPDM in various organs at the BS, IFS, and TFS.

3.3. Distribution Rate of Dry Matter

Straw treatment had a significant impact on the distribution rate of dry matter (DRDM) of stems and pods at the MSPD. The DRDM in SR was 14.66% higher than that in CK, reaching a significant level (Table 4). The N application rate only impacted the DRDM at the MSPD. At the FS, with the increase in the N application rate, the DRDM in the stem gradually decreased, and the DRDM in the leaf showed a trend of first decreasing and then increasing, but the differences between treatments were not significant. At the MSPD, the DRDM of the pods in the N3 treatment was the highest, being significantly higher than that of the pods in the N2 and N4 treatments, but there was no significant difference compared to that of the pods in the N1 treatment. Further analysis showed that the DRDM in the SR pods was significantly higher (67.60%) than that in CK pods at the N3 level at the MSPD, and there was no significant difference in the other treatments. Analysis of variance results showed that straw treatment had a significant impact on the DRDM of stems and pods at the MSPD.

3.4. Nutrient Accumulation

Figure 1a–d demonstrate that the N accumulation (NA) in SR was 77.47, 74.21, 73.33, and 70.22% higher than that in CK at the BS, IFS, TFS, and MS, respectively, reaching extremely significant levels. Different N treatments only had a significant impact on the NA during the TFS. Among them, the N3 treatment had the highest NA, reaching 102.04 kg ha−1, which was significantly higher than that in N1 and N2, but there was no significant difference compared to N4. Further analysis showed that at any N application level, the NA in rapeseed under SR was significantly higher than that under CK at all growth stages. The results of the variance analysis showed that straw treatment had a significant impact on NA in rapeseed at various growth stages, with N application mainly affecting NA at the TFS.
As shown in Figure 1e–h, P accumulation (PA) in rapeseed treated with SR was 75.77, 78.83, 52.61, and 84.69% higher than that of CK at the BS, IFS, TFS, and MS, respectively, reaching extremely significant levels. The effects of different N application treatments on PA varied at different growth stages. There were significant differences between N application treatments at the BS, IFS, and TFS, while there was no significant difference between N application treatments at the MS. Among them, the N3 treatment had the highest PA, reaching 8.63 kg ha−1 at the IFS, which was significantly higher than the PA in N1 and N2, but in PA there was no significant difference from N4. At the TFS, N4 treatment had the highest PA, reaching 9.51 kg ha−1, which was significantly higher than the PA in N1 and N3. Further analysis showed that the PA in SR-treated rapeseed was significantly higher than that in CK at any N application level during each growth period. Analysis of variance showed that straw treatment had a very significant impact on PA in rapeseed at various growth stages, and the N application rate mainly affected the PA at the BS, IFS, and TFS. The interaction between straw treatment and N application rate had a significant impact on the PA at the IFS and TFS.
Figure 1i–l show that K accumulation (KA) in rapeseed under SR was 124.74, 143.38, 110.89, and 143.07% higher than that under CK at the BS, IFS, TFS, and MS, respectively, reaching extremely significant levels. Different N application treatments had a certain impact on KA at different growth stages. For example, at the MS, the KA at the N4 level was as high as 150.76 kg ha−1, which was significantly higher than the KA in N1, N2, and N3. Further analysis showed that at any N application level during each growth period, SR significantly increased KA in rapeseed compared to CK. The analysis of variance results showed that straw treatment had a significant or extremely significant impact on KA in rapeseed at the BS, TFS, and MS. The N application rate had a significant or extremely significant impact on KA at the BS, IFS, and MS. The interaction between straw treatment and N application rate had a significant impact on KA at the IFS, TFS, and MS.

3.5. Nutrient Allocation Ratio

3.5.1. Distribution Proportion of Nitrogen Accumulation

In stems under SR, the distribution proportion of nitrogen accumulation (DPNA) was significantly higher than that under CK at all other stages, while the DPNA of the leaves in CK was higher than in SR (Table 5). The effects of different N application treatments on the DPNA in various organs at the BS, IFS, and TFS were not significant. However, at the MS, the DPNA of stems and pods was significantly different under different N application treatments. Among them, the N4 level of DPNA in stems was 48.92%, which was significantly higher than the DPNA in N1 and N2.
Further analysis showed that there were significant differences in DPNA among the different straw treatments at the N1 and N3 levels in the BS. At the IFS, significant differences in DPNA were observed only at the N4 level, while only the N2 and N4 treatments showed significant differences in DPNA at the TFS (Table 5). Analysis of variance showed that except for the MS, straw treatment at all other stages had a significant impact on the DPNA in each organ, while the N application level only had a significant impact on the DPNA in each organ at the MS.

3.5.2. Distribution Proportion of P Accumulation

The distribution proportion of P accumulation (DPPA) in stems at all growth stages was significantly higher in SR than in CK, while the DPPA of leaves in CK was higher than that in SR (Table 6). Different N application treatments only had a significant impact on the DPPA in stems and pods at the MS. Among them, the DPPA in stems improved with the increase in N application level, and the N4 level was 34.02% higher than the N1 level, reaching a significant difference. Further analysis showed that there were significant differences in DPPA among organs at N1 levels in the BS and IFS, as well as at N4 levels at the TFS and MS under different straw treatments. Analysis of variance showed that, except for MS, straw treatment had a significant impact on DPPA in various organs at different growth stages.

3.5.3. Distribution Proportion of K Accumulation

At the TFS, under SR, the distribution proportion of K accumulation (DPKA) in the stem was 6.44% higher than that in the stem under CK, reaching a significance level of 5% (Table 7). Different N application levels only had a significant impact on the DPKA in pods at the MS, with N1 being 31.68% higher than N4, reaching a significance level of 5%. Further analysis showed that at the N2 and N4 levels at the TFS and the N4 level at the MS, under SR, the DPKA in the stems was 8.18, 8.54, and 19.06% higher than that in the stems under CK, respectively, with significant differences. Analysis of variance showed that straw treatment only had a significant impact on the proportion of DPKA in various organs at the TFS.

3.6. Apparent Surplus of Nutrients

The apparent surplus (AS) of nutrients in SR was significantly higher than that in CK, regardless of whether it was tested in the rice season, rapeseed season, or annual season (Table 8). Among them, the annual AS of N, P, and K in SR was 132.64, 128.01, and 566.31% higher, respectively, than that in CK.
Different N application levels had a significant impact only on the AS of N and the AS of P in the rice season. The annual AS of N in N4 was 221.61 kg ha−1, which was significantly higher than that in N1 and N2. Further analysis showed that under any N application rate, the AS of N, P, and K in SR was higher than that in CK. Analysis of variance showed that straw treatment had a significant impact on the AS of N, P, and K in the rice, rapeseed, and annual seasons. However, the N application treatment had a significant or extremely significant impact on the AS of N in the rice, rapeseed, and annual seasons, while the interaction between straw treatment and N application levels only had a significant impact on the AS of N in the rapeseed season.

4. Discussion

LAI is closely related to the level of photosynthetic capacity. The larger the LAI, the stronger the photosynthesis, and thus, the more the synthesis of organic compounds [22]. PP is an important indicator of population photosynthesis, and the larger the PP, the more favorable it is for the later transformation and synthesis of dry matter [23]. This study showed that returning straw to the field significantly improved the LAI and PP of subsequent rapeseed at various growth stages. This is inconsistent with the research results of Huang [10], who showed that in the rice–rapeseed rotation system, straw treatment only had a significant impact on the LAI during the MS but had no effect on the LAI at the IFS and MS, which may be due to differences in the age limit of straw return to the field.
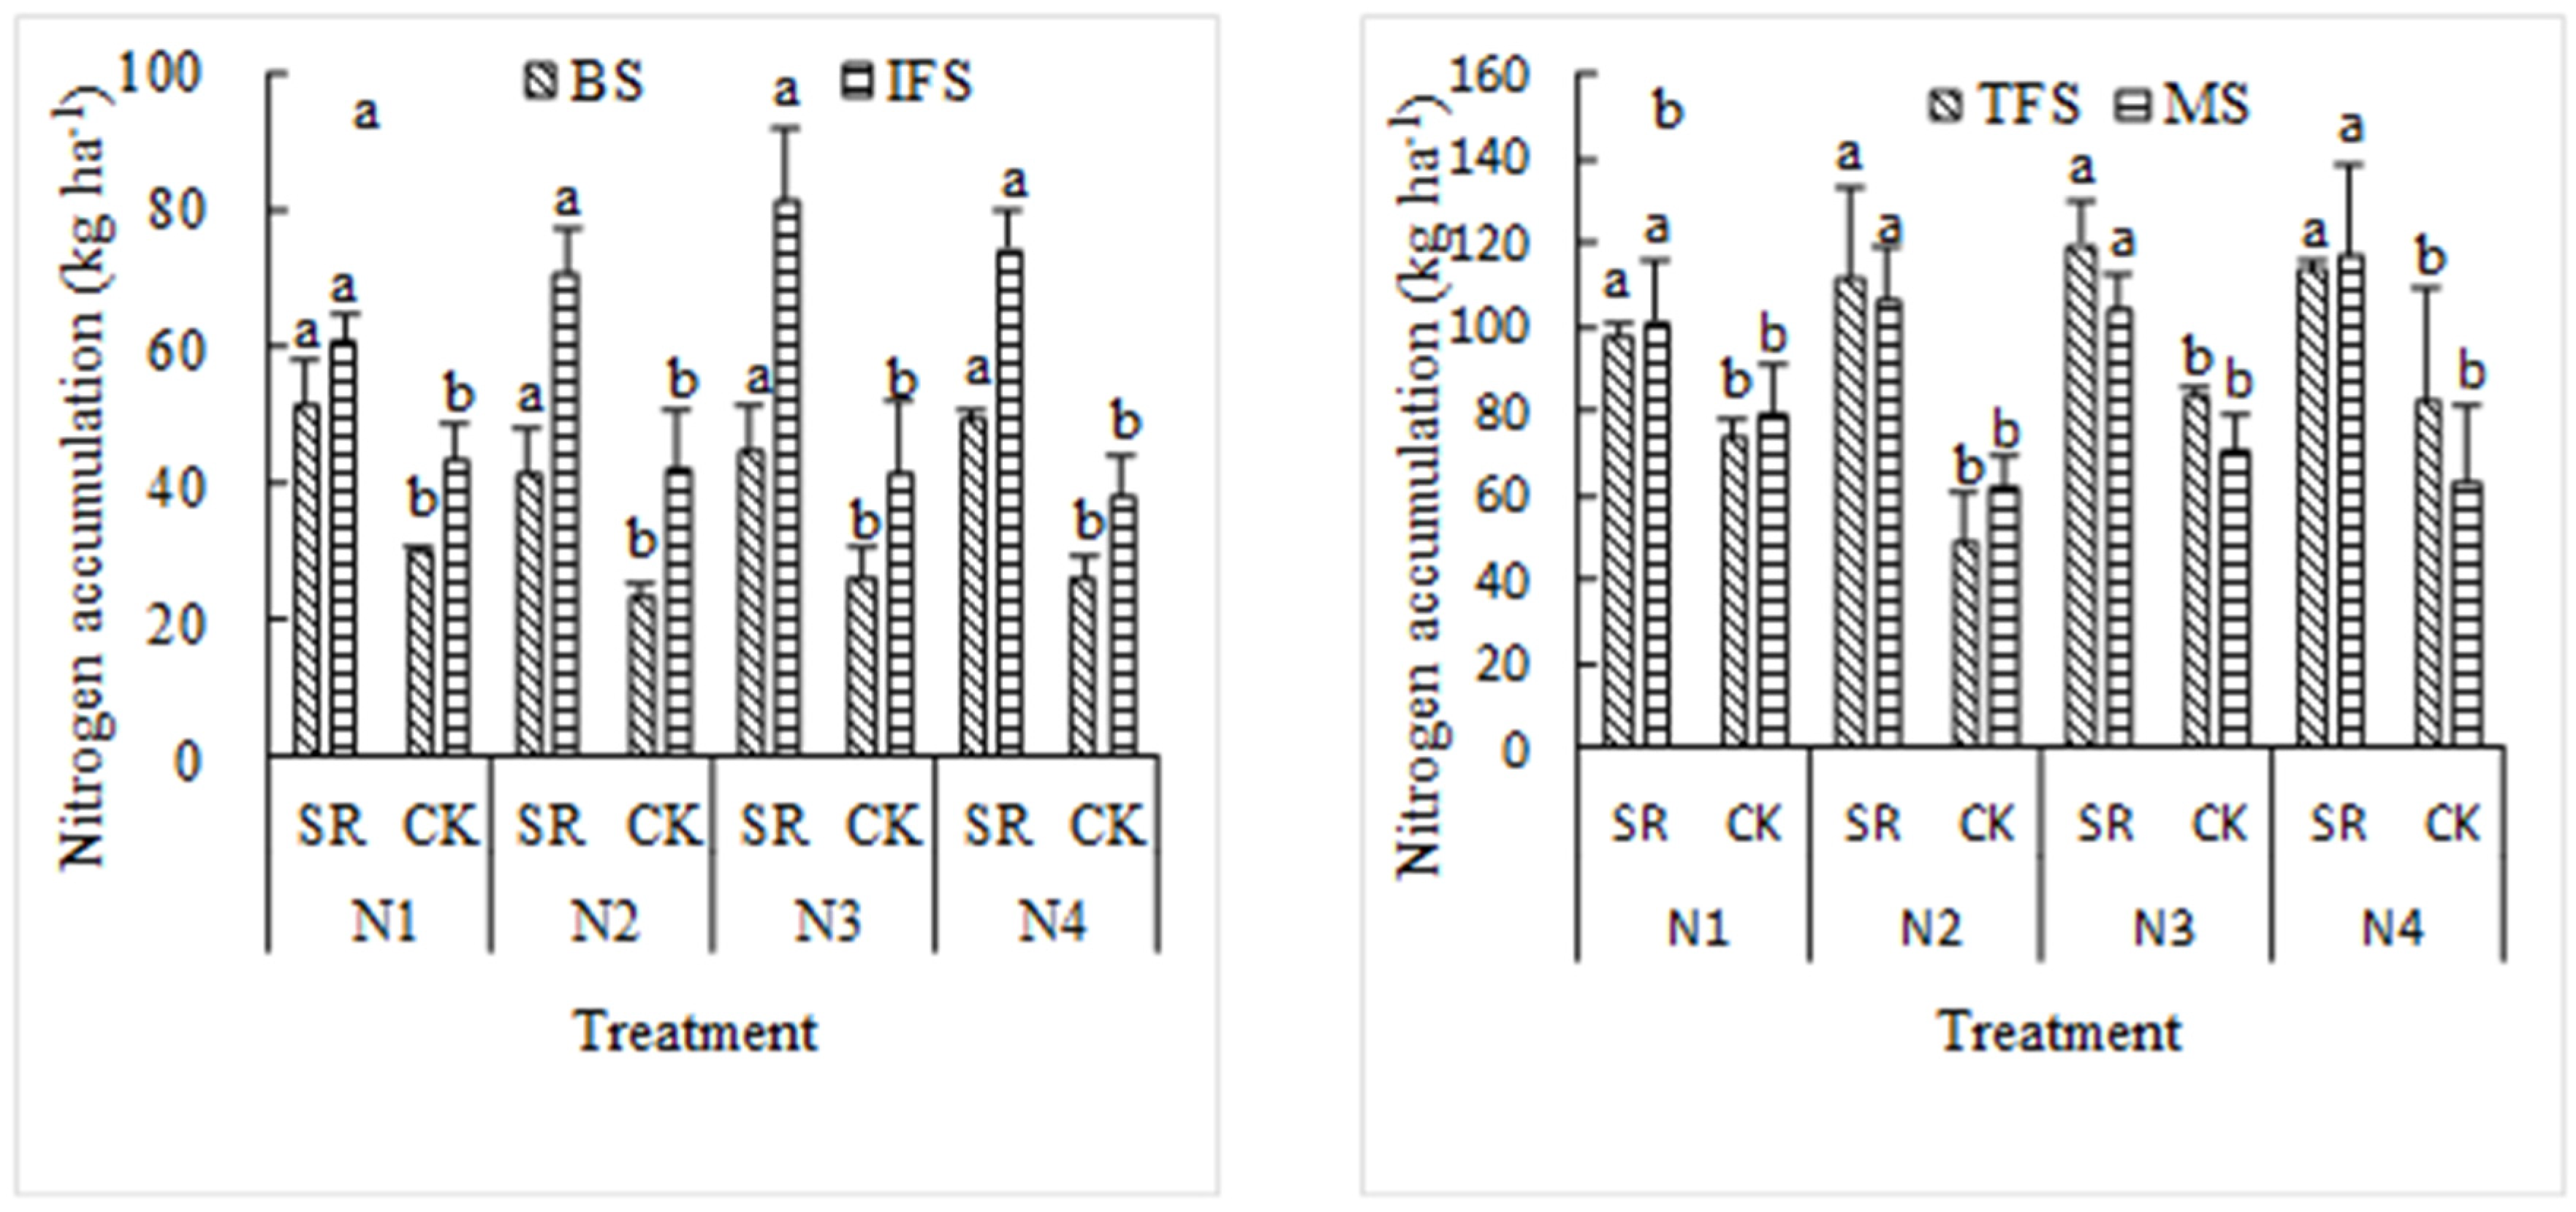
This study indicated that the DMA of rapeseed under SR was significantly increased by 69.90, 64.27, 62.90, and 41.27% compared to CK at the BS, IFS, TFS, and MS, respectively, which is consistent with the research results of Su [24]. Returning straw to the field is beneficial for the accumulation of dry matter in rapeseed, which may be due to a decrease in soil ammonia volatilization and an increase in inorganic N storage under SR conditions, resulting in more vigorous growth of individual plants in rapeseed [24]. It may also be that straw incorporation and nitrogen application treatments improve soil water and heat characteristics and promote soil microbial activity, thus contributing to improving soil health and productivity [25]. However, Morris et al. [26] showed that in the wheat–rapeseed rotation system, returning wheat straw to the field significantly inhibited dry matter accumulation in rapeseed. This may be due to the difference between drought rotation and dry land rotation.
The regulation of the plant biomass allocation proportion is a key process in plant growth, and it is influenced by various resource supply stressors [27]. The dry matter allocation rate refers to the percentage of dry matter mass allocation in various organs of rapeseed leaves, stems, and pods at a certain time to the total dry matter accumulation; the larger the percentage, the more substances are transferred to it [28]. Few scholars have conducted research on the impact of straw return to the field or straw return combined with N fertilizer application on the dry matter distribution ratio and distribution proportion of subsequent rapeseed. The results of this study indicated that the proportion of stem dry matter distribution under the straw return treatment was significantly higher than that under the straw leaving treatment, while the distribution proportion of dry matter of leaves of CK was higher than that of SR. Straw treatment only significantly affected the dry matter allocation rate of stems and pods during the mature stage of pod development.
N, P, and K are essential nutrients for crop growth and development. Due to the high C/N ratio of rice straw, the N released during the initial stage of decomposition needs to be biologically fixed. Therefore, it is necessary to add an appropriate amount of N fertilizer to adjust the carbon N ratio of the returned materials, promote rice straw decomposition, and allow the nutrients to be fully utilized by subsequent crops [7]. The results of this study indicate that straw treatment significantly affects the accumulation of N, P, and K nutrients in rapeseed at various growth stages, and N application during the rice season had a significant or extremely significant impact on phosphorus accumulation and potassium accumulation at the BS and IFS, nitrogen accumulation at the TFS, and potassium accumulation at the MS in rapeseed. This is similar to the research results of Xiang et al. [16] which showed that under the wheat–maize rotation system, the combination of wheat straw return to the field with N fertilizer application significantly affects the accumulation of N, P, and K nutrients in the above-ground parts of subsequent corn crops, which improves with the increase in the N application rate. This indicates that, in current production, to ensure food security and pursue higher economic benefits, large amounts of chemical fertilizers are often applied to previous crops, which will have a positive impact on the nutrient accumulation of subsequent crops [29]. However, Fan indicated that the application of N fertilizer in paddy fields had little effect on the absorption of N, P, and K nutrients in the next crop season in farmland soils with different utilization methods [30]. The reason for these differences may be due to differences in the experimental subjects and conditions.
Crop straw contains a considerable amount of plant nutrients, which can supplement soil nutrients after degradation [31]. The results of this study indicate that straw treatment has a significant impact on the apparent N, P, and K surplus in the rice and rapeseed seasons, while the N fertilizer applied in combination with straw return in the rice season had a significant or extremely significant impact on the AS of N and the annual AS of N in the rice and rapeseed seasons, indicating that fertilization of previous crops still had a positive effect on the N nutrition of subsequent crops [8]. This study showed that the N, P, and K elements in SR showed a surplus in rice, rapeseed, and annual seasons; however, the N and K elements in CK showed a deficit, while P showed a surplus in the rice season. This is similar to the research results of Bu et al. [29], who showed a surplus of P in the current peanut–rapeseed rotation system and that P fertilizer applied to the soil could remain in the soil for up to 25 years [32]. This study revealed that in the annual season, the N, P, and K of SR showed surpluses, while only the K of CK showed deficits, which is consistent with the research results of Liu et al. [33] and Chai et al. [34]. Furthermore, this indicates that crops in the drought rotation area can take away a considerable amount of K each year, resulting in a severe K deficiency in the drought rotation area. However, if all straw is returned to the field in the current production season, it can increase the K surplus.

5. Conclusions

Straw incorporation had a significant impact on the LAI, DMA, and N, P, and K nutrient accumulation in the subsequent rapeseed. The application of N fertilizer in the rice season had a significant or extremely significant impact on the apparent surplus of N in the rice, rapeseed, and annual seasons, indicating that N fertilizer application for the previous crop had an aftereffect. Under straw removal from the field, K deficiency was observed in the rice and annual seasons, indicating that SR supplemented K. Therefore, straw incorporation is a sustainable production method. We only investigated the dry matter accumulation and nutrient accumulation in the above-ground parts of subsequent rapeseed as a result of straw and nitrogen fertilizer. Future work will be conducted on soil physicochemical properties, soil microorganisms, and soil enzyme activity after the application of straw and the relationship between soil microorganisms, soil enzyme activity, and above-ground parts. Not only rapeseed but also rice should be investigated, along with the crop root system and soil respiration. Eventually, the underground and above-ground parts will be linked to form a complete rice–rapeseed rotation ecosystem.

Author Contributions

Conceptualization, Z.S. and Y.F.; methodology, Y.F.; software, Z.S.; validation, Z.S., J.L. (Jie Li) and J.L. (Jiali Luo); formal analysis, Z.S.; investigation, G.X., X.W., Y.G., X.Y. and H.R.; resources, Y.F.; data curation, Z.S.; writing—original draft preparation, Z.S.; writing—review and editing, Y.F.; visualization, Z.S.; supervision, Y.F.; project administration, Y.F.; funding acquisition, Y.F. All authors have read and agreed to the published version of the manuscript.

Funding

This work was supported by the National Key Research and Development Plan Project Sub Topic of China (2022YFD1901500/2022YFD1901505-07), the National Natural Science Foundation of China (32260531), and the Talents Program of High Level and Innovative in Guizhou Province (Grant no. Qiankehe Platform Talents [2018]5632, 5632-2).

Data Availability Statement

Data will be made available on reasonable request.

Conflicts of Interest

The authors declare no conflict of interest.

References

  1. Anwar, S.; Lei, H.; Kuai, J.; Khan, S.; Fahad, S.; Zhou, G. Soaking seeds of winter rapeseed with Quizalofop-P-Ethyl alters plant growth and improves yield in a rice-rapeseed cropping system. Field Crops Res. 2017, 208, 11–17. [Google Scholar] [CrossRef]
  2. Carré, P.; Pouzet, A. Rapeseed market, worldwide and in Europe. OCL 2014, 21, D102. [Google Scholar] [CrossRef]
  3. Li, X.; Li, Z.; Xie, Y.; Wang, B.; Kuai, J.; Zhou, G. An improvement in oilseed rape (Brassica napus L.) productivity through optimization of rice-straw quantity and plant density. Field Crops Res. 2021, 273, 108290. [Google Scholar] [CrossRef]
  4. Zhou, P.; Sheng, H.; Li, Y.; Tong, C.; Ge, T.; Wu, J. Lower C sequestration and N use efficiency by straw incorporation than manure amendment on paddy soils. Agr. Ecosyst. Environ. 2016, 219, 93–100. [Google Scholar] [CrossRef]
  5. Shen, J.; Tao, Q.; Dong, Q.; Luo, Y.; Luo, J.; He, Y.; Li, B.; Li, Q.; Xu, Q.; Li, M.; et al. Long-term conversion from rice-wheat to rice-vegetable rotations drives variation in soil microbial communities and shifts in nitrogen-cycling through soil profiles. Geoderma 2021, 404, 115299. [Google Scholar] [CrossRef]
  6. Chai, Q.; Qin, A.; Gan, Y.; Yu, A. Higher yield and lower carbon emission by intercropping maize with rape, pea, and wheat in arid irrigation areas. Agron. Sustain. Dev. 2014, 34, 535–543. [Google Scholar] [CrossRef]
  7. Singh, Y. Crop residue management for nutrient cycling and improving soil productivity in rice-based cropping systems in the tropics. Adv. Agron. 2005, 85, 269. [Google Scholar]
  8. Geng, S.; Li, L.; Miao, Y.; Tan, J.; Wang, Y. Research progress on the influence of soybean and corn on nitrogen supply in subsequent crops. Plant Nutr. Fert. Sci. 2022, 28, 919–932. (In Chinese) [Google Scholar]
  9. Fan, H.; Jia, S.; Yu, M.; Chen, X.; Shen, A.; Su, Y. Long-term straw return increases biological nitrogen fixation by increasing soil organic carbon and decreasing available nitrogen in rice–rape rotation. Plant Soil 2022, 479, 267–279. [Google Scholar] [CrossRef]
  10. Huang, Y. The Effects of Tillage Methods and Straw Return on Crop Growth and Soil Characteristics under the Rice Oil Dual Cropping System. Master’s Thesis, Guizhou University, Guiyang, China, 2018. [Google Scholar]
  11. Su, W. The Effects of Straw Return and Nitrogen Fertilizer Application on Soil Physicochemical Properties, Crop Growth, and Yield in the Rice Oil Double Cropping System. Master’s Thesis, Guizhou University, Guiyang, China, 2020. [Google Scholar]
  12. Zhu, M.; Wu, J.; Ma, L.; Guo, S.; Cui, X.; Zeg, X.; Liu, L.; Pu, Y.; Li, X.; Sun, W. Grey correlation analysis of nutrient accumulation characteristics and yield traits in northern winter rapeseed. Chin. J. Oil Crop Sci. 2023, 45, 72. (In Chinese) [Google Scholar]
  13. Zhang, J.; Yang, Y.; Qi, Z.; Du, G.; Niu, Y.; Han, X. A study on the distribution of dry matter and nutrient absorption of bitter gourd. North Hortic. 2021, 1, 7–14. (In Chinese) [Google Scholar]
  14. Bai, F.; Bai, G.; Wang, C.; Li, Z.; Gong, D.; Huang, W.; Cheng, Y.; Wang, B.; Wang, J.; Xu, Z.; et al. The effect of tillage depth on the root growth and nutrient absorption and utilization of shaded rapeseed. Sci. Agric. Sin. 2022, 55, 2726–2739. (In Chinese) [Google Scholar]
  15. Xiang, X.; Chen, S.; Gao, R.; Wu, D.; Chen, Y.; Yang, H.; Fan, G. The effect of maize straw return and nitrogen application in wheat jade rotation on the yield and nutrient absorption of subsequent corn crops. Acta Agric. Boreali Sin. 2021, 36, 169–176. (In Chinese) [Google Scholar]
  16. Shi, Z.; Li, J. Research progress on nutrient management in water drought rotation system. J. Zhejiang Agric. Sci. 2015, 56, 1819–1821, 1824. (In Chinese) [Google Scholar]
  17. Bu, R.; Ren, T.; Lu, J.; Li, X.; Li, Y.; Wang, Y.; Lu, J. Nitrogen fertilizer effect and its aftereffect under rice-rapeseed rotation conditions. Sci. Agric. Sin. 2012, 45, 5049–5056. (In Chinese) [Google Scholar]
  18. Zhang, W.; Dai, Z.; Ren, T.; Zhou, X.; Wang, Z.; Li, X.; Cong, R. The effects of straw returning to the field and nitrogen fertilizer management on crop yield and nutrient absorption and utilization indifferent water drought rotation systems. Sci. Agric. Sin. 2016, 49, 1254–1266. (In Chinese) [Google Scholar]
  19. Zhang, S.; Lu, J.; Zhu, Y.; Fang, Y.; Cong, R.; Li, X.; Ren, T. Rapeseed as a previous crop reduces rice N fertilizer input by improving soil fertility. Field Crops Res. 2022, 281, 108487. [Google Scholar] [CrossRef]
  20. Ma, P.; Yang, Z.; Li, N.; Li, Y.; Lǚ, X.; Sun, Y.; Ma, J. The effects of nitrogen fertilizer input in the rapeseed rice rotation mode and nitrogen fertilizer operation in the rice season on the photosynthetic productivity and yield of hybrid indica rice. J. South China Agric. Univ. (Nat. Sci.) 2020, 41, 23–30. (In Chinese) [Google Scholar]
  21. Shen, R.; Ding, W.; Gao, Q.; He, P.; Chou, S. A study on the optimal nitrogen fertilizer dosage for northern potatoes based on nutrient expert system recommendation fertilization. Plant Nutr. Fert. Sci. 2022, 28, 880–893. (In Chinese) [Google Scholar]
  22. Zhang, L.; Luan, T.; Xu, C.; Yan, W.; Yu, J.; Sun, N.; Tan, G.; Zhao, H.; Li, F.; Meng, X.; et al. The effects of straw returning and tillage techniques on soil moisture, photosynthetic characteristics, and yield of maize in semi humid areas. J. Maize Sci. 2022, 30, 100–107. (In Chinese) [Google Scholar]
  23. Xu, Y.; Wang, J.; Liu, Y.; Wang, Y.; Gao, P.; Yang, H.; Qian, C.; Ge, X.; Fan, J. The effect of straw returning methods on the growth characteristics, yield, and water use efficiency of spring maize in semi-arid regions. Jiangsu Agric. Sci. 2019, 47, 128–132. (In Chinese) [Google Scholar]
  24. Su, W. Study on the Comprehensive Effect and Mechanism of Straw Returning on Rape Growth and Soil Fertility. Master’s Thesis, Huazhong Agricultural University, Wuhan, China, 2014. [Google Scholar]
  25. Akhtar, K.; Wang, W.; Ren, G.; Khan, A.; Feng, Y.; Yang, G.; Wang, H. Integrated use of straw mulch with nitrogen fertilizer improves soil functionality and soybean production. Environ. Int. 2019, 132, 105092. [Google Scholar] [CrossRef] [PubMed]
  26. Morris, N.L.; Miller, P.C.H.; Orson, J.H.; Froud-Williams, R.J. The effect of wheat straw residue on the emergence and early growth of sugar beet (Beta vulgaris) and oilseed rape (Brassica napus). Eur. J. Agron. 2009, 30, 151–162. [Google Scholar] [CrossRef]
  27. Zhang, H.; Ma, H.; Zhu, D.; Huang, H.; Ning, Y.; Zhang, Y. The effects of different fertilization treatments on biomass accumulation, distribution, and nutrient absorption in rapeseed. Jiangsu Agric. Sci. 2012, 28, 1042–1048. (In Chinese) [Google Scholar]
  28. Tian, X.; Li, Z.; Liu, Y. The effects of nitrogen application rate and sowing density on the dry matter quality and yield of rapeseed at different maturity stages. Acta Agric. Nucl. Sin. 2019, 33, 798–807. (In Chinese) [Google Scholar]
  29. Bu, R.; Ren, T.; Lu, J.; Li, X.; Cong, R.; Li, C.; Wang, Y.; Lu, J. A study on the effect of phosphorus fertilizer under rice-rapeseed rotation conditions. Sci. Agric. Sin. 2014, 47, 1227–1234. (In Chinese) [Google Scholar]
  30. Fan, M. Research on Integrated Management of Nutrient Resources in Water Drought Rotation System. Ph.D. Thesis, China Agricultural University, Beijing, China, 2005. [Google Scholar]
  31. Li, W.; Qiao, Y.; Chen, H.; Cao, C.; Du, S.; Zhao, Z. The effect of corn straw returning to the field with nitrogen fertilizer application on the apparent nitrogen profit and loss and yield of winter wheat soil. Plant Nutr. Fert. Sci. 2015, 21, 561–570. (In Chinese) [Google Scholar]
  32. Aulakh, M.S.; Kabba, B.S.; Baddesha, H.S.; Bahl, G.S.; Gill, M.P.S. Crop yields and phosphorus fertilizer transformations after 25 years of applications to a subtropical soil under groundnut-based cropping systems. Field Crops Res. 2003, 83, 283–296. [Google Scholar] [CrossRef]
  33. Liu, S.; Li, D.; Huang, J.; Liu, L.; Wu, D.; Li, Z.; Wu, Y.; Zhang, H. The effects of rice straw returning to the field and potassium fertilizer on soil aggregates and potassium distribution under rice-rapeseed rotation. Sci. Agric. Sin. 2022, 55, 4651–4663. (In Chinese) [Google Scholar]
  34. Chai, R.; Huang, J.; Liu, K.; Zhang, H.; Luo, L.; Zhang, C. The distribution of rice straw potassium resources in China and the importance of returning it to the field for soil potassium balance. Plant Nutr. Fert. Sci. 2022, 28, 1745–1754. (In Chinese) [Google Scholar]
Figure 1. The effects of annual straw return combined with application of nitrogen fertilizer in rice season on nutrient accumulation in subsequent rape (kg ha−1). SR represents straw returning to the field, and CK represents straw leaving the field. BS: bolting stage; IFS: initial flowering stage; TFS: terminal flowering stage; MS: mature stage. Different lowercase letters indicate significant differences at the 5% level between different straw treatments or between same straw treatments under the same nitrogen application. (a,b) represent the amount of nitrogen accumulated over each period of BS, IFS, TFS, and MS, respectively. (c) shows the difference in nitrogen accumulation at different period under straw treatment. (d) shows the difference in nitrogen accumulation under different nitrogen application treatments at different period. (e,f) represent the amount of phosphorus accumulated over each period of BS, IFS, TFS, and MS, respectively. (g) shows the difference in phosphorus accumulation at different period under straw treatment. (h) shows the difference in phosphorus accumulation under different nitrogen application treatments at different period. (i,j) represent the amount of potassium accumulated over each period of BS, IFS, TFS, and MS, respectively. (k) shows the difference in potassium accumulation at different period under straw treatment. (l) shows the difference in potassium accumulation under different nitrogen application treatments at different period.
Agronomy 13 01514 g001aAgronomy 13 01514 g001bAgronomy 13 01514 g001c
Table 1. Effects of annual straw return combined with application of nitrogen fertilizer in rice season on the leaf area index and photosynthetic potential of subsequent rapeseed crop.
TreatmentLeaf Area IndexPhotosynthetic Potential (m2 day ha−2) × 104
BSIFSTFSBS-IFSFS
N1SR1.49 a1.62 a1.09 a20.65 a33.17 b
CK0.73 b0.96 b0.62 b13.46 a23.55 b
N2SR1.34 a2.21 a1.25 a23.27 a42.02 b
CK0.54 b0.84 b0.69 b8.50 b17.57 b
N3SR1.35 a1.66 a1.35 a21.11 a38.78 b
CK0.66 b1.37 a0.68 b12.54 a23.56 b
N4SR1.39 a1.48 a1.44 a21.27 a40.23 b
CK0.65 b0.81 b0.96 b9.84 b19.9 b
SR 1.44 a1.74 a1.28 a21.57 a38.55 a
CK 0.66 b0.99 b0.74 b11.09 b21.17 b
N1 1.13 a1.29 ab0.86 b17.05 a28.36 a
N2 1.04 a1.53 a0.97 b15.88 a29.79 a
N3 1.01 a1.51 a1.02 ab16.82 a31.17 a
N4 1.02 a1.14 b1.2 a15.56 a30.10 a
S 167.77 **51.87 **67.89 **64.47 **29.84 **
N 0.893.184.63 *0.310.13
S × N 1.404.62 *0.471.651.01
Note: SR represents straw returning to the field, and CK represents straw leaving the field. Different lowercase letters indicate significant differences at the 5% level between different straw treatments or between same straw treatments under the same nitrogen application. ** indicates significant difference at 0.01 level and * indicates significant difference at 0.05 level. BS: bolting stage; IFS: initial flowering stage; TFS: terminal flowering stage; FS: flowering stage. The same as below.
Table 2. Effect of annual straw return combined with application of nitrogen fertilizer in rice season on dry matter accumulation of subsequent rapeseed at main growth stages and various growth stages (kg ha−1).
TreatmentGrowth StageGrowth Stage
BSIFSTFSMSFSMSPD
N1SR1326.08 a1646.04 a2654.79 a5223.29 a1008.75 a2568.50 a
CK779.54 b1216.58 a1827.04 a4045.17 a610.46 b2218.13 a
N2SR1193.54 a1872.58 a3045.96 a5930.67 a1173.38 a2884.71 a
CK629.58 b1068.71 b1406.24 b3521.54 b337.50 b2115.33 a
N3SR1275.5 a1983.92 a3370.08 a5017.13 a1386.17 a1647.04 a
CK757.75 b1321.13 b2178.54 b4192.54 a857.42 a2014.00 a
N4SR1224.79 a2089.50 a3178.83 a5687.67 a1089.33 a2508.83 a
CK787.71 b1015.25 b2108.00 b3714.29 b1092.75 a1606.29 a
SR 1254.98 a1898.01 a3062.42 a5464.69 a1164.41 a2402.27 a
CK 738.65 b1155.42 b1879.95 b3868.39 b724.53 b1988.44 a
N1 1052.81 a1431.31 a2240.92 a4634.23 a809.60 a2393.31 a
N2 911.56 a1470.65 a2226.08 a4726.10 a755.44 a2500.02 a
N3 1016.63 a1652.52 a2774.31 a4604.83 a1121.79 a1830.52 a
N4 1006.25 a1552.38 a2643.42 a4700.98 a1091.04 a2057.56 a
S 31.93 **35.11 **33.69 **15.50 **4.72 *0.64
N 0.430.611.880.020.870.35
S × N 0.091.160.70.80.740.3
Note: Different lowercase letters indicate significant differences at the 5% level between different straw treatments or between same straw treatments under the same nitrogen application. ** indicates significant difference at 0.01 level and * indicates significant difference at 0.05 level. MSPD represents mature stage of pod development.
Table 3. Effects of annual straw return combined with application of nitrogen fertilizer in rice season on the distribution proportion of dry matter accumulation of subsequent rapeseed at different growth stages (%).
TreatmentBSIFSTFSMS
StemLeafStemLeafStemLeafStemPod
N1SR47.08 a52.92 b56.60 a43.40 a80.75 a19.25 a56.01 a43.99 a
CK40.07 b59.93 a51.20 a48.80 a76.11 a23.89 a64.19 a35.81 a
N2SR46.89 a53.11 b57.13 a42.87 b79.83 a20.17 b62.33 a37.67 a
CK37.79 b62.21 a49.13 b50.87 a72.71 b27.29 a61.43 a38.57 a
N3SR47.70 a52.30 b62.95 a37.05 b81.74 a18.26 a59.07 a40.93 a
CK41.45 b58.55 a50.73 b49.27 a77.65 a22.35 a62.96 a37.04 a
N4SR49.32 a50.68 b61.54 a38.46 b81.79 a18.21 b71.72 a28.28 a
CK40.13 b59.87 a51.23 b48.77 a73.98 b26.02 a63.48 a36.52 a
SR 47.75 a52.25 b59.55 a40.45 b81.03 a18.97 b62.28 a37.72 a
CK 39.86 b60.14 a50.57 b49.43 a75.11 b24.89 a63.01 a36.99 a
N1 43.57 a56.43 a53.90 a46.10 a78.43 a21.57 a60.10 a39.90 a
N2 42.34 a57.66 a53.13 a46.87 a76.27 a23.73 a61.88 a38.12 a
N3 44.58 a55.42 a56.84 a43.16 a79.70 a20.32 a61.02 a38.98 a
N4 44.73 a55.27 a56.39 a46.61 a77.89 a22.11 a67.60 a32.40 a
S 58.27 **58.27 **29.12 **29.12 **17.20 **17.20 **0.080.08
N 1.141.141.211.210.990.991.731.73
S × N 0.520.520.790.790.410.411.881.88
Note: Different lowercase letters indicate significant differences at the 5% level between different straw treatments or between same straw treatments under the same nitrogen application. ** indicates significant difference at 0.01 level.
Table 4. Effects of annual straw return combined with application of nitrogen fertilizer in rice season on the dry matter allocation rate of subsequent rapeseed crops (%).
TreatmentFSMSPD
StemLeafStemLeafPod
N1SR120.35 a−20.35 a25.30 a−24.12 a79.69 a
CK179.19 a−7.71 a53.65 a−21.41 a67.76 a
N2SR125.54 a−25.54 a38.08 a−22.00 a65.00 a
CK119.89 a−19.89 a54.14 a−20.69 a66.55 a
N3SR109.43 a−9.43 a26.22 a−41.77 a106.29 a
CK130.23 a−30.23 a43.49 a−27.76 a63.42 b
N4SR125.90 a−25.90 a42.02 a−68.55 a56.29 a
CK102.24 a−2.24 a53.53 a−23.77 a70.24 a
SR 120.31 a−20.31 a32.91 b−39.11 a76.81 a
CK 132.89 a−15.02 a51.20 a−23.41 a66.99 b
N1 149.77 a−14.03 a39.47 a−22.77 a73.73 ab
N2 122.71 a−22.71 a46.11 a−21.34 a65.77 b
N3 119.83 a−19.83 a34.86 a−34.77 a84.85 a
N4 114.07 a−14.07 a47.78 a−46.16 a63.26 b
S 0.460.485.47 *0.336.45 *
N 0.720.320.592.896.31 **
S × N 0.921.520.210.289.98 **
Note: Different lowercase letters indicate significant differences at the 5% level between different straw treatments or between same straw treatments under the same nitrogen application. ** indicates significant difference at 0.01 level and * indicates significant difference at 0.05 level.
Table 5. Effects of annual straw return combined with application of nitrogen fertilizer in rice season on the distribution proportion of nitrogen accumulation of subsequent rapeseed (%).
TreatmentBSIFSTFSMS
StemLeafStemLeafStemLeafStemPod
N1SR43.39 a56.61 b50.84 a49.16 a81.61 a18.39 a30.42 a69.58 a
CK35.06 b64.94 a46.10 a53.90 a78.18 a21.82 a40.15 a59.85 a
N2SR43.30 a56.70 a48.72 a51.28 a81.17 a18.83 b34.17 a65.83 a
CK37.67 a62.33 a48.98 a51.02 a75.12 b24.88 a41.15 a58.85 a
N3SR44.91 a55.09 b54.90 a45.10 a83.26 a16.74 a39.69 a60.31 a
CK37.58 b62.42 a47.00 a53.00 a80.08 a19.92 a39.42 a60.58 a
N4SR43.47 a56.53 a57.34 a42.66 a82.97 a17.03 b55.41 a44.59 a
CK42.18 a57.82 a47.46 b52.54 b76.44 b23.56 a42.43 a57.57 a
SR 43.77 a56.23 b52.95 a47.05 b82.25 a17.75 b39.92 a60.08 a
CK 38.12 b61.88 a47.39 b52.61 a77.46 b22.54 a40.79 a59.21 a
N1 39.22 a60.78 a48.47 a51.53 a79.90 a20.10 a35.28 b64.72 a
N2 40.49 a59.51 a48.85 a51.15 a78.14 a21.86 a37.66 b62.34 a
N3 41.25 a58.75 a50.95 a49.05 a81.67 a18.33 a39.55 ab60.45 ab
N4 42.83 a57.17 a52.40 a47.60 a79.90 a20.30 a48.92 a51.08 b
S 14.94 **14.94 **7.92 *7.92 *12.21 **12.21 **0.070.07
N 1.061.060.870.871.111.113.47 *3.47 *
S × N 1.131.131.251.250.400.402.502.50
Note: Different lowercase letters indicate significant differences at the 5% level between different straw treatments or between same straw treatments under the same nitrogen application. ** indicates significant difference at 0.01 level and * indicates significant difference at 0.05 level.
Table 6. Effects of annual straw return combined with application of nitrogen fertilizer in rice season on the distribution proportion of phosphorus accumulation in subsequent rapeseed (%).
TreatmentBSIFSTFSMS
StemLeafStemLeafStemLeafStemPod
N1SR52.97 a47.03 b75.91 a24.09 b88.24 a11.76 a29.36 a70.64 a
CK44.81 b55.19 a59.90 b40.10 a78.62 a21.38 a33.84 a66.16 a
N2SR49.00 a51.00 a71.21 a28.79 a80.15 a19.85 a32.83 a67.17 a
CK43.77 a56.23 a63.75 a36.25 a75.82 a24.18 a34.88 a65.12 a
N3SR50.32 a49.68 a73.40 a26.60 a81.65 a18.37 a36.93 a63.07 a
CK47.57 a52.43 a63.42 a36.58 a75.90 a24.10 a33.27 a66.73 a
N4SR50.48 a49.25 a71.28 a28.72 a90.02 a8.98 b51.99 a48.01 b
CK47.01 a52.99 a61.98 a38.02 a70.07 b29.93 a32.71 b67.29 a
SR 50.69 a49.31 b72.95 a27.05 b85.26 a14.74 b37.78 a62.22 a
CK 45.79 b54.21 a62.26 b37.74 a75.10 b24.90 a33.68 a66.32 a
N1 48.89 a51.11 a67.91 a32..09 a83.43 a16.57 a31.60 b68.40 a
N2 46.39 a53.61 a67.48 a32.52 a77.98 a22.02 a33.86 ab66.14 ab
N3 48.94 a51.06 a68.41 a31.59 a78.77 a21.23 a35.10 ab64.90 ab
N4 48.74 a51.26 a66.63 a33.37 a80.55 a19.45 a42.35 a57.65 b
S 11.50 **11.50 **8.98 **8.98 **14.25 **14.25 **1.411.41
N 0.730.730.040.040.810.811.811.81
S × N 0.690.690.270.271.961.962.382.38
Note: Different lowercase letters indicate significant differences at the 5% level between different straw treatments or between same straw treatments under the same nitrogen application. ** indicates significant difference at 0.01 level.
Table 7. Effect of annual straw return combined with application of nitrogen fertilizer in rice season on the distribution proportion of potassium accumulation in subsequent rapeseed (%).
TreatmentBSIFSTFSMS
StemLeafStemLeafStemLeafStemPod
N1SR64.29 a35.71 a71.51 a28.49 a81.46 a18.54 a69.69 a30.31 a
CK61.14 a38.86 a66.17 a33.83 a77.58 a22.42 a73.46 a26.54 a
N2SR61.51 a38.49 a72.04 a27.96 a81.06 a18.94 b74.38 a25.62 a
CK60.06 a39.94 a73.85 a26.15 a74.93 b25.07 a71.18 a28.82 a
N3SR61.91 a38.09 a74.84 a25.16 a83.25 a16.75 a74.39 a25.61 a
CK61.90 a38.10 a69.14 a30.86 a79.92 a20.08 a68.81 a31.19 a
N4SR61.87 a38.13 a76.62 a23.38 a82.83 a17.17 b85.26 a14.74 b
CK64.41 a35.59 a71.46 a28.54 a76.31 b23.69 a71.56 b28.44 a
SR 62.39 a37.61 a73.76 a26.24 a82.15 a17.85 b75.93 a24.07 a
CK 61.88 a38.12 a70.15 a29.85 a77.18 b22.82 a71.25 a28.75 a
N1 62.72 a37.28 a68.84 a31.16 a79.52 a20.48 a71.57 a28.43 a
N2 60.78 a39.22 a72.95 a27.05 a78.00 a22.00 a72.78 a27.22 ab
N3 61.91 a38.09 a71.99 a28.01 a81.59 a18.41 a71.60 a28.40 a
N4 63.14 a36.86 a74.04 a25.96 a79.57 a20.43 a78.41 a21.59 b
S 0.10.12.072.0713.25 **13.25 **4.594.59
N 0.410.410.80.81.161.162.232.23
S × N 0.550.550.520.520.340.342.732.73
Note: Different lowercase letters indicate significant differences at the 5% level between different straw treatments or between same straw treatments under the same nitrogen application. ** indicates significant difference at 0.01 level.
Table 8. Effect of annual straw return combined with application of nitrogen fertilizer in rice season on annual apparent surplus (kg ha−1).
TreatmentRice SeasonRapeseed SeasonAnnual
NPKNPKNPK
N1SR−18.75 a31.72 a168.79 a150.66 a31.47 a158.24 a131.91 a63.19 a327.03 a
CK−90.06 b11.12 b−66.82 b136.56 a25.69 a8.86 b46.50 b36.81 b−57.96 b
N2SR46.32 a32.19 a225.68 a162.97 a36.01 a148.74 a209.29 a68.20 a374.42 a
CK−49.72 b4.48 b−87.16 b147.96 a27.98 b24.96 b98.24 b32.46 b−62.20 b
N3SR62.41 a22.25 a164.12 a213.59 a42.94 a195.15 a276.00 a65.19 a359.27 a
CK−36.58 b−2.21 b−131.03 b139.62 b26.07 b12.80 b103.04 b23.66 b−118.23 b
N4SR94.18 a21.82 a126.59 a203.54 a41.43 a132.53 a297.72 a63.26 a259.12 a
CK10.02 b−6.00 b−68.61 b135.47 b27.04 b23.97 b145.49 b21.04 b−44.64 b
SR 46.04 a27.10 a171.29 a182.69 a37.96 a158.66 a228.73 a64.96 a329.96 a
CK −41.58 b1.80 b−88.41 b139.90 b26.69 b17.65 b98.32 b28.49 b−70.76 b
N1 −54.40 c21.42 a50.98 a143.61 b28.58 a83.55 a89.20 c50.00 a134.53 a
N2 −1.70 b18.34 ab69.26 a155.46 ab32.00 a86.85 a153.76 b50.33 a156.11 a
N3 12.92 b9.92 ab16.54 a176.60 a34.50 a103.98 a189.52 ab44.42 a120.52 a
N4 52.10 a7.91 b28.99 a169.51 a34.23 a78.25 a221.61 a42.15 a107.24 a
S 46.41 **41.32 **73.90 **29.05 **37.58 **205.97 **61.90 **68.34 **146.50 **
N 11.73 **2.750.603.43 *2.221.2811.73 **0.860.40
S × N 0.240.190.814.24 *2.022.701.420.691.28
Note: Different lowercase letters indicate significant differences at the 5% level between different straw treatments or between same straw treatments under the same nitrogen application. ** indicates significant difference at 0.01 level and * indicates significant difference at 0.05 level.
Disclaimer/Publisher’s Note: The statements, opinions and data contained in all publications are solely those of the individual author(s) and contributor(s) and not of MDPI and/or the editor(s). MDPI and/or the editor(s) disclaim responsibility for any injury to people or property resulting from any ideas, methods, instructions or products referred to in the content.

