Article

Increasing Nitrogen Fertilizer Application Is a Feasible Strategy to Mitigate Rice Yield Reduction in Wet Year

1
State Key Laboratory of Water Resources and Hydropower Engineering Science, Wuhan University, Wuhan 430072, China
2
Department of Soil & Environmental Sciences, University of Agriculture Faisalabad, Faisalabad 38040, Pakistan
3
Key Laboratory of Arable Land Conservation (Middle and Lower Reaches of Yangtze River) of the Ministry of Agriculture, College of Resources and Environment, Huazhong Agricultural University, Wuhan 430070, China
4
Hubei Institute of Water Resources Survey and Design, Wuhan 430070, China
*
Author to whom correspondence should be addressed.
Agronomy 2023, 13(6), 1536; https://doi.org/10.3390/agronomy13061536
Submission received: 23 April 2023 / Revised: 25 May 2023 / Accepted: 29 May 2023 / Published: 31 May 2023
(This article belongs to the Special Issue In Memory of Professor Longping Yuan, the Father of Hybrid Rice)

Abstract

:
Rice production is intimately related to water and nitrogen management, whereas rice yield inevitably decreases with extreme rainfall. Optimization of water and nitrogen management may mitigate the degree of rice yield reduction. Hence, we conducted a field experiment in a normal and wet year to investigate suitable water and nitrogen management that could reduce the risk of rice yield reduction. The field experiment comprised six water and nitrogen management methods, which included two irrigation methods (CF: continuous flooding; AWD: alternating wet and dry) and three nitrogen fertilizer levels (N0, N90, and N180: 0, 90, and 180 kg N ha−1, respectively). The results showed an average yield reduction of 23.5% in the wet year compared to normal year. The nitrogen rate of N0, N90, and N180 resulted in a 36.9%, 24.8%, and 11.0% of yield reduction in the wet year, which presented a decrease in yield reduction with the increase in nitrogen rate. Panicle contributed over almost 60% and 75% on average to biomass and total nitrogen uptake, but both the total amount and proportion of nitrogen uptake in panicle showed a decrease in the wet year. In addition, the rice yield showed a significant positive correlation with nitrogen uptake both in the normal and wet year. Therefore, in the wet year, the decrease in nitrogen uptake in panicle results in a yield reduction. With the increase in nitrogen rate, the nitrogen internal use efficiency (IEN) was significantly decreased in the normal year, while it increased in the wet year, and the nitrogen recovery use efficiency (REN) and nitrogen harvest index (HIN) were not affected by nitrogen rate. Therefore, these results suggested that increased nitrogen rate in a wet year could improve rice nitrogen uptake to reduce the risk of yield reduction and maintain the nitrogen use efficiency (NUE).

1. Introduction

Rice, as the major staple food, provides over 20% of daily calories for about half of the world’s population [1]. In China, rice cultivation accounts for 27% of the arable land while producing more than 200 million tons and feeding over 60% of the population [2,3,4]. Food demand will rise further with the increase in the world’s population; therefore, maintaining and improving yield is still the essential objective in future rice production. However, global climate change will result in the frequency of extreme rainfall in the future [5], which has a strong impact on agricultural production [6,7,8,9]. Although rice requires a submergence field soil environment for growth, extreme rainfall results in an excessive water input in the paddy, which is not beneficial to rice growth and high yield; previous research reported that rice yield showed a reduction trend with the increase in rainfall or in a wet season [10,11,12].
Water and nitrogen management are field-scale practices that can be artificially controlled and are the significant factors that limit rice yield; conventional rice cultivation thus consumes large amounts of water and nitrogen resources to achieve high yields [13]. However, these conventional practices are extremely wasteful of water and nitrogen resources, and the excessive water and nitrogen easily cause a series of environmental problems such as water pollution surrounding the paddy [14,15]. Carrijo et al. (2017) [16] suggested that alternating wet and dry (AWD) irrigation could save more than 20% of water resources and maintain rice yield. When AWD irrigation is applied, the field water level is allowed to drop below the field surface for a short time, which improves the potential of the paddy to use the precipitation and reduces the risk of water and nitrogen loss by runoff (drainage) and leachate [17]. Meanwhile, the water-level drop process also promotes the ammonium nitrogen move to the rhizosphere, which contributes to nitrogen uptake by rice. Furthermore, the growth and activity of rice roots were improved by AWD irrigation, which ensures that the nitrogen nutrition uptake and photosynthesis could conduct well even if a slight water deficit occurs [18,19]. Compared to traditional flooding (FI) irrigation, alternating wet and dry (AWD) irrigation showed a positive effect on water saving and nitrogen loss reduction without yield compromise.
Optimizing nitrogen application is also another essential measurement to improve rice production. The continuous increase in rice yield in past decades is inextricably related to the growing input of nitrogen fertilizer annually [20]. An adequate nitrogen supply contributes to high yield; for example, the rice uptakes more nitrogen resulting in higher chlorophyll content in the leaf and increased photosynthesis production [21]. However, it was reported that more than 60% of nitrogen fertilizer was not used by the rice, and only 30% (on average) of nitrogen fertilizer can be recovered in crop biomass [13,20]. Many previous research studies devoted to improving nitrogen use efficiency (NUE), but increasing nitrogen rate application, is absolutely an ineffective approach. This is because the excess nitrogen fertilizer will increase the risk of rice lodging and disease, which may result in a yield reduction [22]. In China, the suitable amount of N application in rice season is about 180 kg N ha−1; it is still 75% higher than the world average level [23]. Soil moisture fluctuates with AWD irrigation and alters the nitrogen cycle; there may exist an interaction between the nitrogen rate and irrigation method that will further promote the nitrogen uptake by rice and improve the NUE and contribute to high rice yields. Previous research reported that AWD irrigation improved NUE at the nitrogen rate of 180 kg N ha−1 [24].
Overall, extreme rainfall seasons will inevitably cause a reduction in rice production, but optimizing water and nitrogen management may be able to mitigate the degree of this reduction. Hence, this research analyzed the difference in rice production, nitrogen uptake, and NUE with different water and nitrogen management methods between normal and wet years, to investigate the appropriate ways to mitigate rice yield reduction in a wet year.

2. Materials and Methods

2.1. Experimental Site and Experimental Field

The field experiments were conducted in a rice field in Tuanlin Town (30°87′ N, 112°20′ E), Jingmen City, Hubei Province, China. The experimental field is in a hilly rice region with an average elevation of about 90 m. The region is in the middle and lower reaches of the Yangtze River, which is characterized by a warm and humid subtropical monsoon climate, with a mean annual temperature of approximately 16 °C and a mean annual precipitation of approximately 945.6 mm. The mean annual evaporation capacity is between 1345 mm and 1538 mm.
During the experimental period, daily meteorological data (air temperature, evaporation, and rainfall) was determined by an automatic weather station at Hubei Irrigation Experimentation Centre Station (30°87′ N, 112°18′ E). Field soil samples at two depths (0~20 cm and 20~40 cm) were collected from three random spots of the experimental field to determine the soil physicochemical property before the experiment. The soil bulk density, organic matter, total porosity, and saturated hydraulic conductivity are 1.38 g cm−1, 27.15 g kg−1, 47.9%, and 1.80 cm h−1 in 0~20 cm and 1.52 g cm−1, 11.02 g kg−1, 42.64%, and 0.50 cm h−1 in 20~40 cm; the soil texture is classified as silt loam.

2.2. Experimental Design and Field Management

The field experiment was conducted from 30 May to 16 September and from 22 May to 7 September in 2015 and 2016, respectively. The experiment was designed as two irrigation methods (alternate wetting and drying irrigation, AWD; continuous flooding irrigation, CF) and three nitrogen rates (N0, N90, and N180 represent 0, 90, and 180 kg N ha−1, respectively). These six water and nitrogen combinations were tested in a split-plot design with three replications of each field. In the CF irrigation, the field water level was maintained between 5 and 35 mm before mid-season drainage, and between 5 and 50 mm water after mid-season drainage until yellow maturity. AWD adopted the same irrigation regime with CF before mid-season drainage, but the lower and upper irrigation limit were field capacity (−30 kPa) and 25 mm field water level, respectively, after mid-season drainage. A TDR (Mini Trase) was used to measure the soil moisture in the soil layer of 0~20 cm in AWD irrigation when the field water level dropped below the field surface.
Nitrogen fertilizer (75% of total N, NH4HCO3, comprising 17% N), phosphate fertilizer (40 kg P2O5 ha–1, calcium superphosphate), and potassium fertilizer (70 kg K2O ha–1, muriate of potash) were applied 1 day before transplanting as base fertilizer, and the left 25% of total N (urea, comprising 46% N) was applied 20 days after transplanting as top-dressing. Seedlings were transplanted with 30 cm × 25 cm hill spacing on 3 June and 27 May and harvested on 16 September and 7 September in 2015 and 2016, respectively. The hybrid rice variety was “Zhunliangyou 893”. The other field management methods were kept the same as the local farmers’ customs.

2.3. Sampling and Analysis

Three rice plants were randomly collected in every experimental plot for rice plant height, tillering number, and aboveground biomass at harvest. The rice plant was separated into stem, leaf, and spikes, then we measured the weight for biomass after oven drying (60 °C for 12 h), and the nitrogen content of stem, leaf, and spikes were determined by the semi-micro Kjeldahl method [25] after grinding. Meanwhile, rice was harvested from a 6 m2 (2 m × 3 m) random area in every experimental field, and the rice yield was measured after threshing grains and drying them up to 8% water moisture.

2.4. Calculations and Data Analysis

2.4.1. Hydrological Years

The rainfall empirical frequency was calculated by P-III curve according to the rainfall data of the experimental station from 1990 to 2014 (Table S1). The rainfall of dry, normal, and wet (year or season) were classified by p < 25%, 25% < p < 75%, and 75% < p [26,27].

2.4.2. Nitrogen Uptake and NUE

The total nitrogen uptake was calculated by the following formula [25]:
Total   nitrogen   uptake ,   TN   ( kg   ha 1 ) = B i × C i
where Bi is the biomass weight of stem, leaf, or panicle (kg ha−1); Ci is the nitrogen content of stem, leaf, or panicle (g kg−1).
NUE was evaluated by nitrogen internal use efficiency (IEN), nitrogen recovery efficiency (REN), and nitrogen harvest index (HIN), which were determined by the following formulas [21,25]:
Nitrogen internal use efficiency, IEN (kg kg−1) = Y÷TN
Nitrogen recovery efficiency, REN (kg kg−1) = (TN+N − TNck) ÷ NF
Nitrogen harvest index, HIN (%) = TNP ÷ TN
where Y is the rice yield (kg ha−1); TN+N and TNck are the total nitrogen uptake (kg ha−1) with and without N fertilizer, respectively; NF is the amount of N fertilizer applied (kg ha−1); TNp is the total nitrogen uptake in panicle (kg ha−1).

2.4.3. Statistical Analysis

Rice yield, agronomic parameters, nitrogen uptake, and NUE (IEN, REN, and HIN) were analyzed statistically by ANOVA using SPSS 27 software (SPSS Inc., Chicago, IL, USA). The least significant difference (LSD) test was used to compare significant differences; the level of significance was set at 5%. Tables and figures were prepared with Excel 2019 (Microsoft Corp., Redmond, WA, USA) and Origin 2021 (Origin Lab Corp., Northampton, MA, USA), respectively.

3. Results

3.1. Meteorological Conditions and Rainfall Patterns

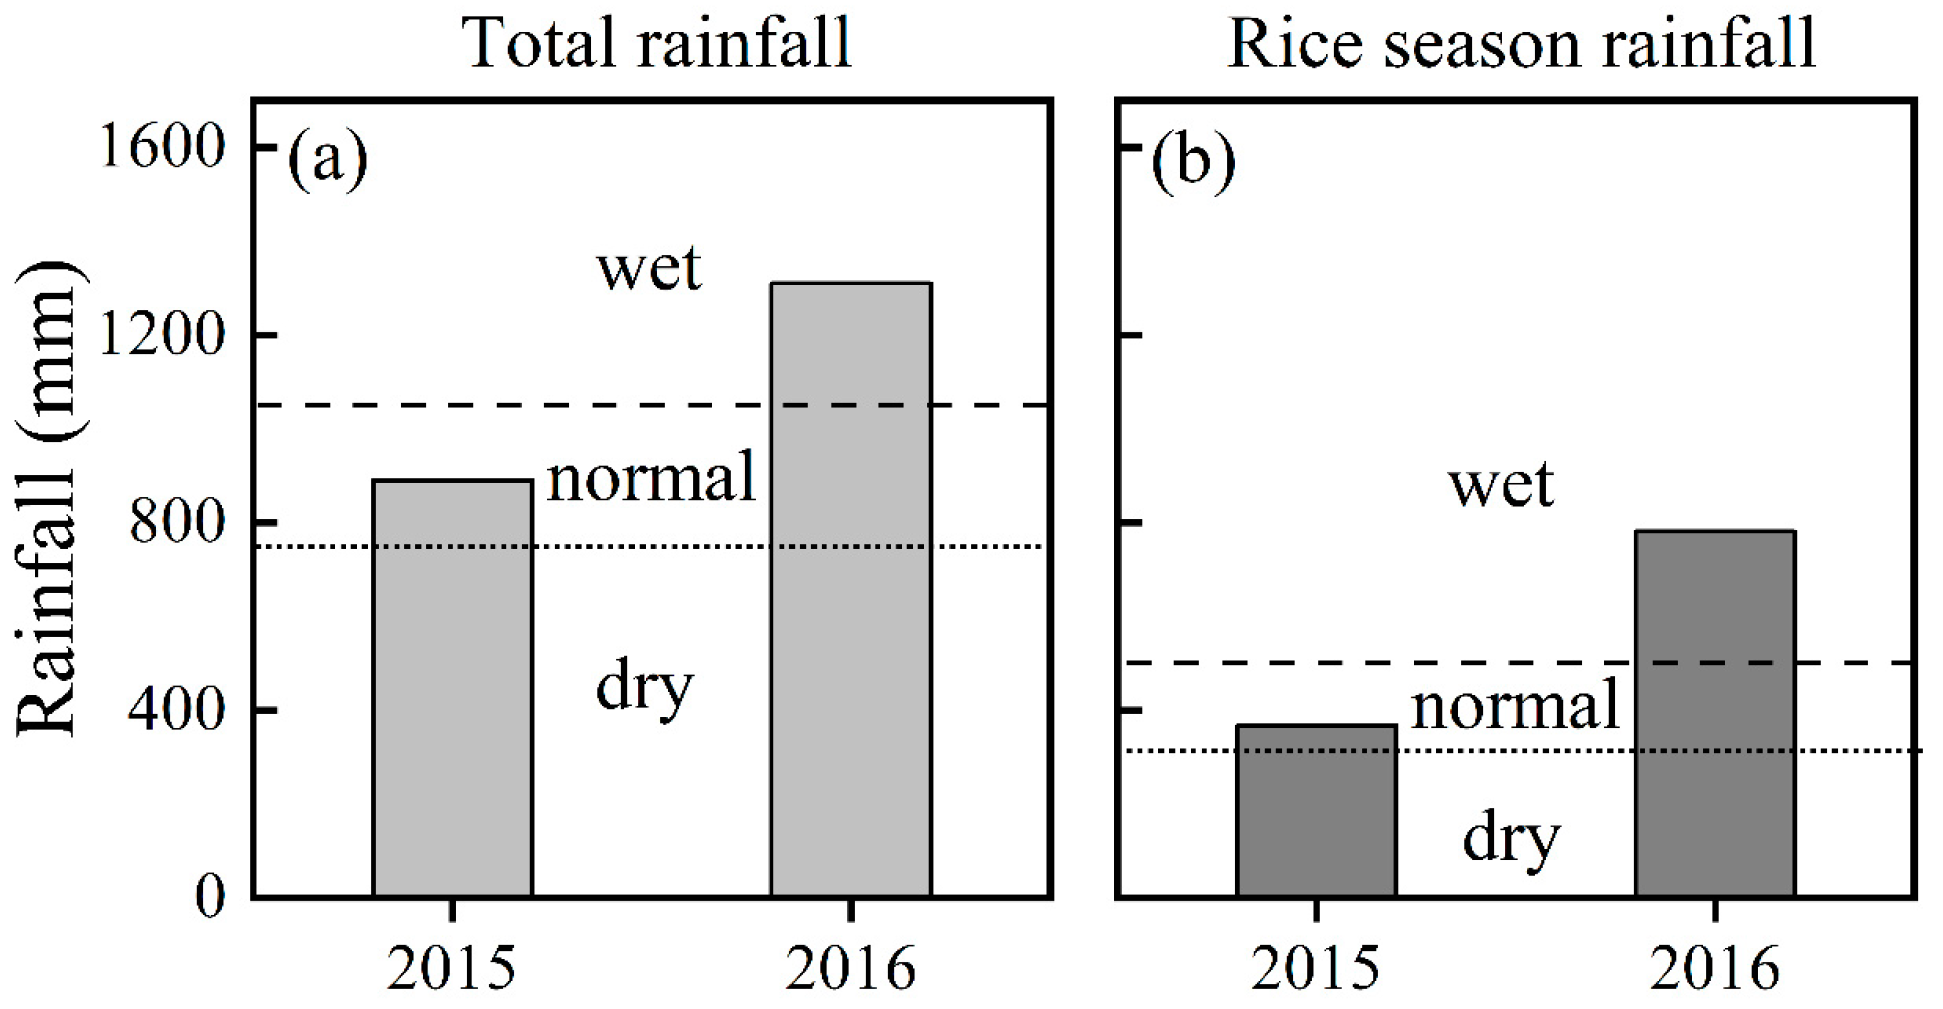
The weather conditions during the experimental period in 2015 and 2016 are shown in Figure 1. The rainfalls of the rice seasons were 367.5 mm and 780.6 mm in 2015 and 2016, respectively. According to the rainfall data of the past 25 years, the threshold rainfalls between dry, normal, and wet for annual total rainfall were 754.9 mm (p = 75%) and 1053.6 mm (p = 25%) and for the rice season were 317.4 mm (p = 75%) and 502.6 mm (p = 25%). It was indicated that 2016 was a wet year both according to the total rainfall annually and of the rice season, and 2015 was a normal year (Figure 2). The average temperatures were 26.2 °C and 27.1 °C in the normal and wet year, respectively. The total evaporation amounts were 525.7 mm and 499.7 mm in the normal and wet year, respectively.

3.2. Rice Yield and Growth

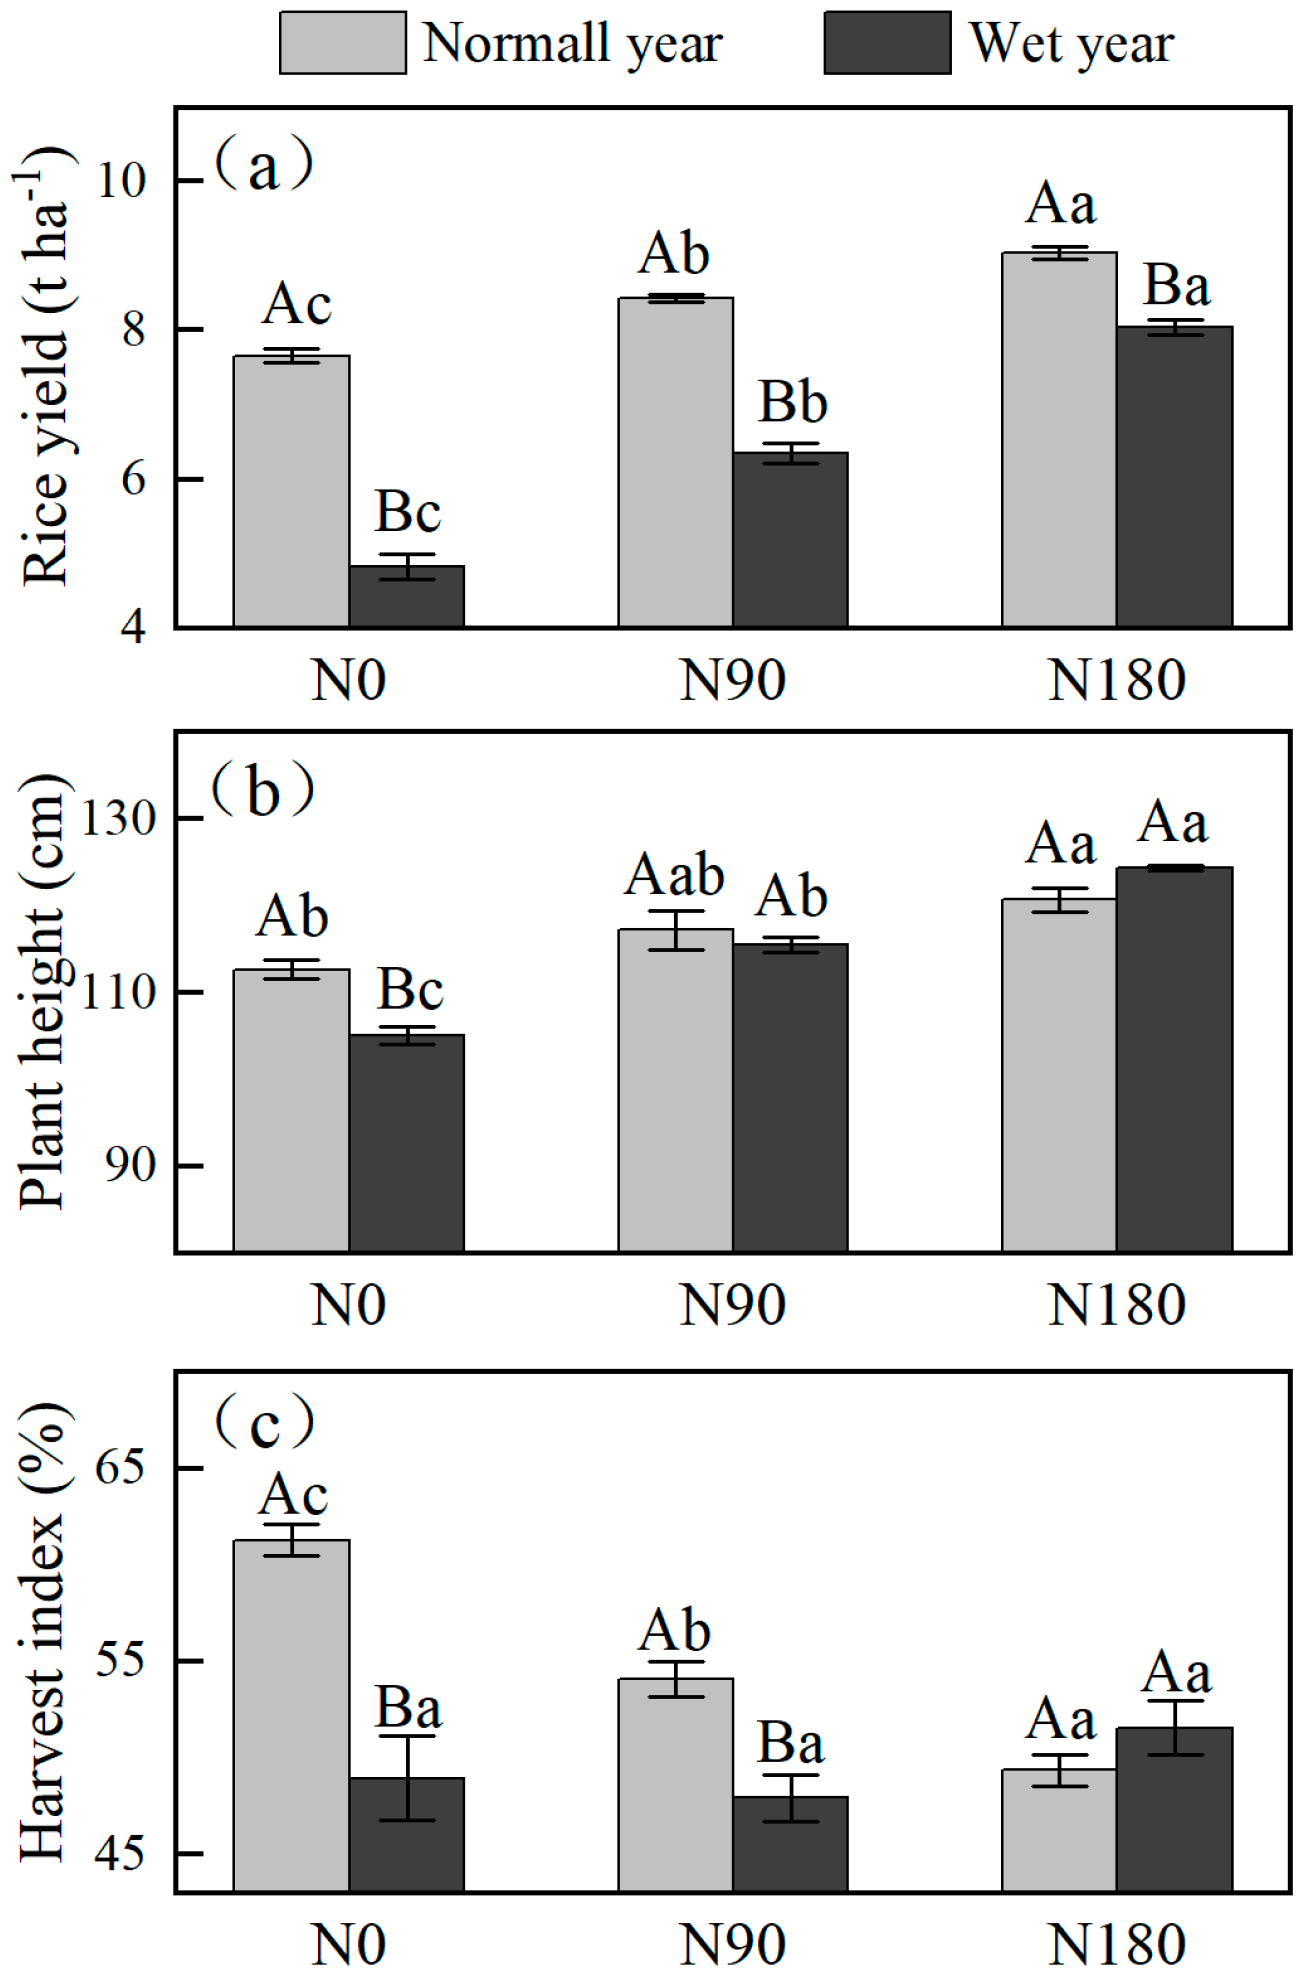
The rice yield and agronomic parameters were significantly affected by rainfall year and nitrogen rate while not influenced by irrigation method (Table 1). Rice yield, tillering number, aboveground biomass, and harvest index were significantly reduced 23.5%, 12.7%, 16.8%, and 9.8% on average in the wet year, respectively. The high nitrogen rate also showed significantly increased effects on rice yield and agronomic parameters. The rice yield, plant height, and harvest index were also affected by the interaction between rainfall year and nitrogen rate (Table 1). For example, the rice yield with N0 and N90 nitrogen rate were reduced 36.9% and 24.8% in the wet year, respectively, while with N180, the nitrogen rate was only reduced 11.0% (Figure 3). This decreased trend in the wet year was also observed in plant height and harvest index. The variations of stem and panicle biomass showed the same response to rainfall year and nitrogen rate with aboveground biomass, but the leaf biomass was barely affected by rainfall year (Table 2).

3.3. Nitrogen Uptake and Components

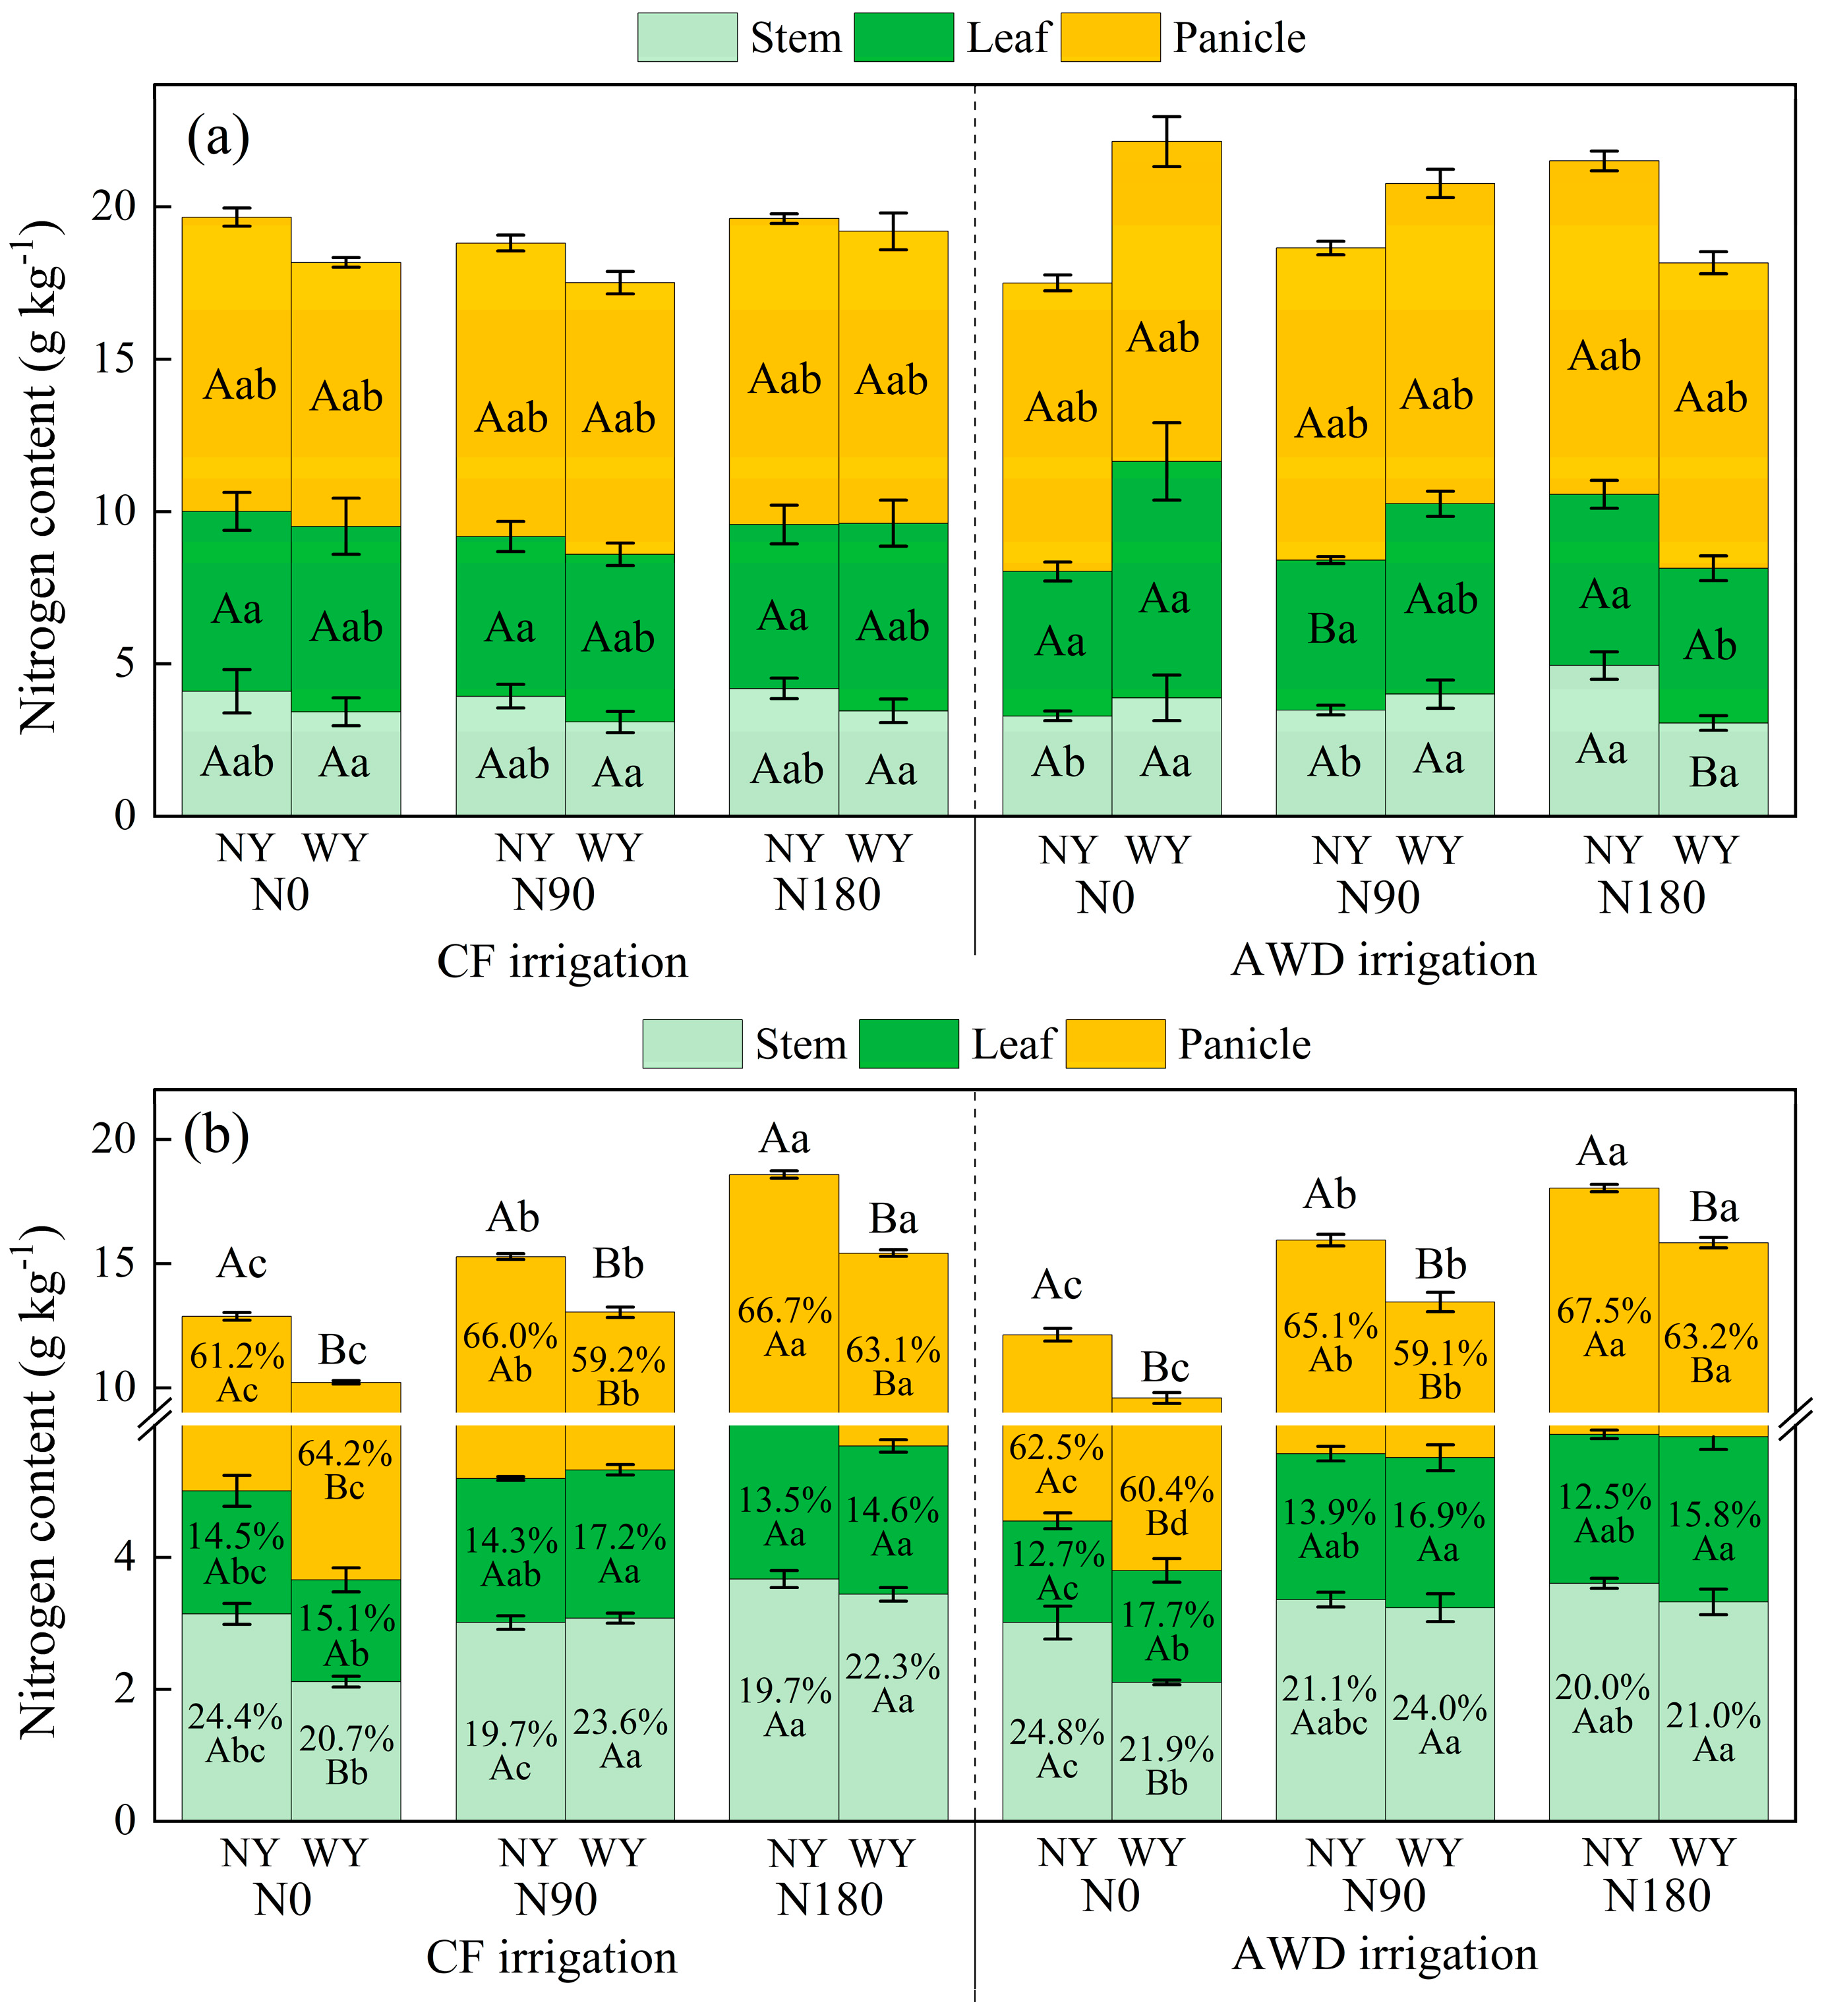
The nitrogen content in stem, leaf, and panicle ranged from 3.06~4.95 g kg−1, 4.74~7.76 g kg−1, and 8.66~10.94 g kg−1 (Figure 4a). The nitrogen rate had no significant effects on nitrogen content in stem, leaf, and panicle, but rainfall year and irrigation method significantly influenced nitrogen content in leaf and panicle, respectively (Table 2). The biomass of stem, leaf, and panicle ranged from 2.10~3.67 t ha−1, 1.54~2.51 t ha−1, and 5.79~12.41 t ha−1 (Figure 4b). Compared to the normal year, the panicle biomass was significantly reduced in all water and nitrogen management methods in the wet year, while the leaf biomass was not reduced, and stem biomass was only reduced with N0 nitrogen rate. Total nitrogen uptake was significantly reduced in the wet year while increased with the increase in nitrogen rate (Table 2). In different water and nitrogen management methods, the total nitrogen uptake ranged from 73.8~163.8 kg ha−1, with the proportion of nitrogen uptake in the panicle all over 75% (Figure 4c). In the wet year, however, this proportion was decreased in most water and nitrogen management methods.

3.4. Nitrogen Use Efficiency (NUE)

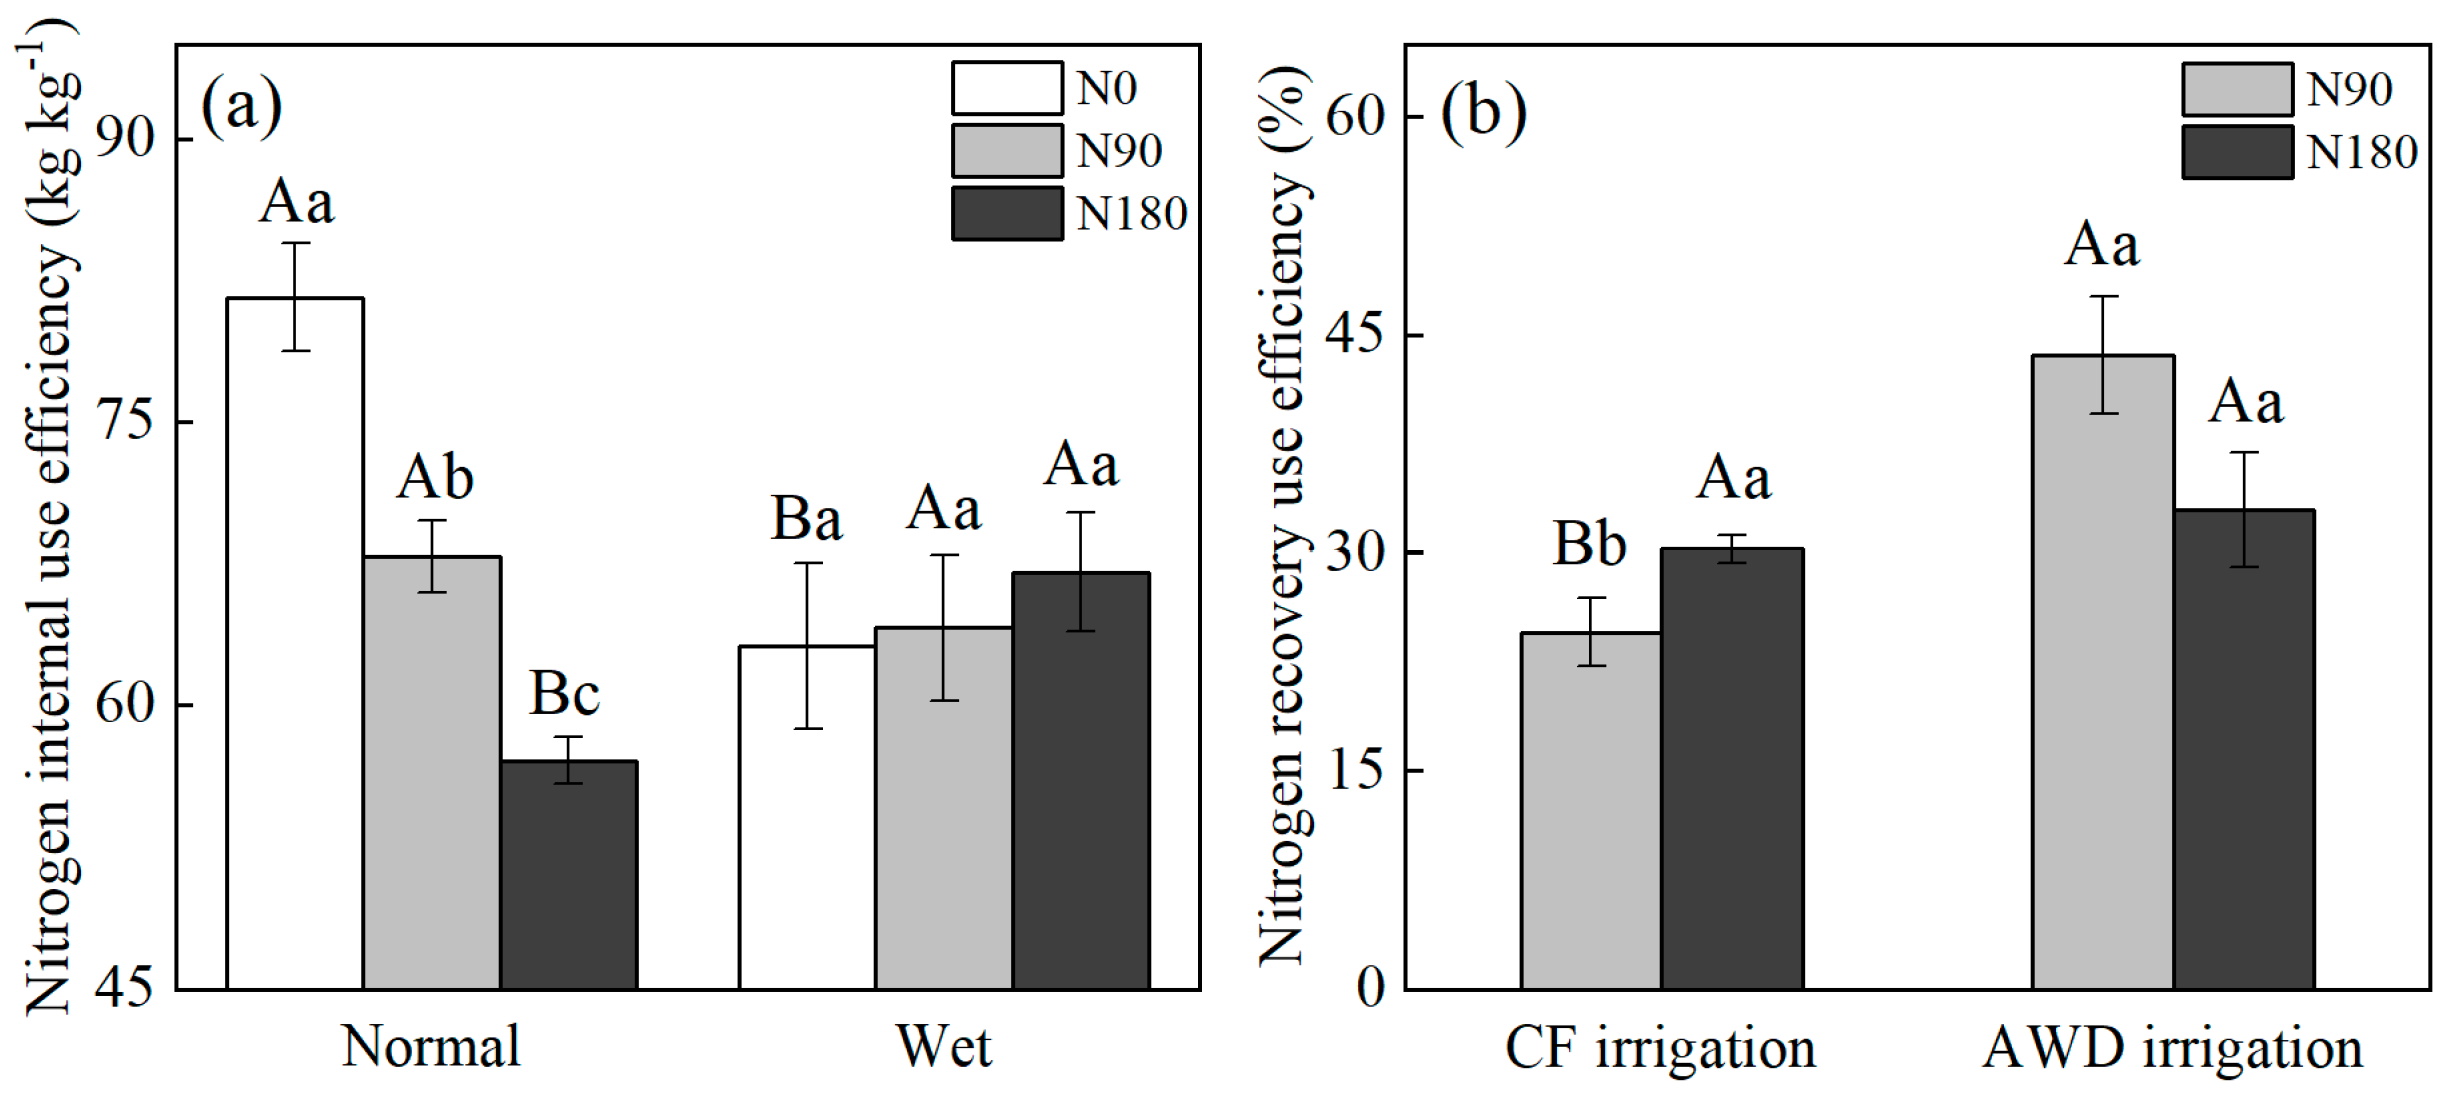
IEN, REN, and HIN showed different responses to rainfall year, irrigation method, and nitrogen rate (Table 3). There also showed an interaction effect of rainfall year and nitrogen rate on IEN and irrigation method and nitrogen rate on REN. The interaction effects showed that the IEN was only significantly decreased with the increase in nitrogen rate in the normal year, while there was no difference among different nitrogen rates in the wet year (Figure 5a). Compared to CF irrigation, the REN was significantly increased with N90, while it has no difference with N180 (Figure 5b).

3.5. Correlation Analysis for Rice Yield and Nitrogen Uptake

Rice yield showed a significant positive correlation to aboveground biomass and nitrogen uptake, but only a significant negative correlation to harvest index in the normal year (Figure 6). Total nitrogen uptake showed a significant positive correlation to aboveground biomass and only a significant negative correlation to harvest index and IEN in the normal year (Figure 7).

4. Discussion

Global climate change will inevitably affect agricultural production, especially crop yields [28,29]. Our study region is in the middle reaches of the Yangtze River, a major rice production area in southern China, and the meteorological data in the past 27 years (1990~2016) indicate that about 30% of the rice season is wet season (Table S1). The uneven spatial and temporal distribution of future rainfall will increase the frequency of extreme rainfall in the future at a regional scale, and [30] suggested the rainfall will increase in the Yangtze River basin in the future.
In our research, the reduction of rice yield was also observed in a wet year, with an average yield reduction of over 20% compared to that in a normal year (Table 1). Although the two years experiment showed a limited representation for the result of a normal and wet year, the previous research studies have reported that the crop yield showed a reducing trend during an extreme rainfall period [31,32]. In the wet year, the tillering number, stem biomass, and panicle biomass were significantly reduced (Table 1 and Table 2), which indicates that the rice growth was inhibited at tillering stage. The plum rainy season in southern China is from May to July, and the early stage of middle rice in Yangtze River basin is also during this period [33]. Excessive rainfall causes nutrient loss and stunts rice growth in paddy fields. In the wet year, the rainfall was focused from late June to late July, and the several torrential rains caused the field water level even to exceed the ridge (Figure 1). This must extremely increase nitrogen loss by runoff or drainage, especially after the application of tiller fertilizer. These huge water and nitrogen losses must result in an insufficient nutrient supply for rice and limit the increase in tiller number in the tillering stage [14,34]. On the other hand, the long-term waterlogged environment in the paddy makes it more difficult for oxygen exchange in the water and soil and hinders root respiration and growth, while it induces the closure of leaf stomata, which reduces chlorophyll content and photosynthetic rates [35,36]. Rice yield and agronomic properties were not affected by irrigation method, and irrigation method showed few interaction effects with rainfall year or nitrogen rate (Table 1), indicating that there is no need to optimize water management for rice production only in wet years. The field water level drop was less frequent when AWD irrigation was applied in the wet year, and the submergence duration was much longer than that in the normal year, but AWD may still have water saving potential [16]. The high nitrogen rate significantly improved rice yield and agronomic properties and showed an interaction effect on rice yield, plant height, and harvest index with rainfall year (Table 1). In addition, the rice yield reduction was decreased with the increase in nitrogen rate (Figure 3), which reflects the necessity of optimizing nitrogen management in wet years.
Rice yield was positively correlated to nitrogen uptake both in the normal and wet year (Figure 6), which is consistent with previous research [37,38]. Nitrogen is essential for rice yield because it will accumulate in the panicle during the reproduction stage of rice to produce photosynthetic products; therefore, the nitrogen in the stem and leaf will also redistribute and translocate to the panicle [39,40]. Huge amounts of nitrogen are enriched in the panicle after flowering, of which over 60% is transported from the leaves [41]. At the harvest, the difference of the total nitrogen uptake almost depended on the nitrogen uptake of the panicle; this also presented in our research because of the higher nitrogen content and biomass proportion in the panicle (Figure 4). However, we noticed that even though the total nitrogen uptake was decreased in the wet year, the proportion of nitrogen uptake in the panicle in the wet year was still decreased. This indicated that when there was not enough nitrogen storage in vegetable organs (stem and leaf) in the wet year, it results in an insufficient nitrogen translocation for reproductive organs (panicle), which may demonstrate an inadequate nitrogen supply in the filling stage or in the vegetative stage [41]. Therefore, it is necessary to apply additional nitrogen fertilizer in wet years to compensate for the lack of nitrogen supply.
Since the rice’s ability to only recover 30% nitrogen on average from nitrogen fertilizer results in large nitrogen loss, it should be considered to maintain an efficient NUE even though the high nitrogen rate can improve nitrogen uptake [42]. The REN significantly decreased in the wet year mainly due to the fact that the excess rainfall caused more fertilizer nitrogen loss out of the paddy, while applied AWD irrigation could effectively improve REN, which was in agreement with previous research (Table 3) [43]. The decrease in REN and HIN in the wet year further presented the evidence of a lack in nitrogen uptake and nitrogen translocation to the panicle, which was essential for rice reduction (Table 3). In addition, especially in the normal year, although the high nitrogen rate could increase nitrogen uptake, which was positively correlated to rice yield, the harvest index and IEN were decreased with the increase in nitrogen uptake, which indicated that more nitrogen was not directly contributing to yield production at a high nitrogen rate but stored in vegetable organs (stem and leaf) (Figure 5 and Figure 6). This is not economical for nitrogen fertilizer application. In past decades, the nitrogen rate varied from150 to 250 kg N ha−1 in rice cultivation in China, and the appropriate rate was 180 kg N ha−1 based on the field experiment [44,45], while the rice yield was not significantly increased and even had a reduction risk when the nitrogen rate was over 225 kg N ha−1 [40,46]. Nevertheless, in the wet year, we suggested that there is a potential for improved nitrogen uptake of rice and therefore recommended the nitrogen rate over 180 kg N ha−1, which may increase nitrogen uptake and thus improve rice yield (Figure 5). In summary, we suggested that the AWD irrigation could be adopted in both wet and normal years to improve NUE, while in the wet year, there should be applied an additional nitrogen fertilizer at the tiller stage or after anthesis to mitigate risk of reduction.

5. Conclusions

In our research, rice yield and agronomic parameters presented a significant reduction in a wet year, and rice yield was significantly affected by nitrogen rate without a difference between different irrigation methods. Compared to the normal year, the rice yield in the wet year was reduced by 36.9%, 24.8%, and 11.0% with N0, N90, and N180 nitrogen rates, respectively, which showed a decreasing reduction with the increase in nitrogen rate. Rice yield was positively correlated to total nitrogen uptake, which contributed an average over 75% by the panicle, but both the total amount and proportion of nitrogen uptake in the panicle showed a decrease in the wet year. Furthermore, the decrease in tillering number, stem biomass, and panicle biomass in the wet year indicated an insufficient nitrogen supply in the tillering and filling stage. We suggested that an insufficient nitrogen accumulation in the panicle in the wet year results in yield reduction. Moreover, the IEN was decreased with the increase in nitrogen rate in the normal year, while it increased in the wet year, and the high nitrogen rate (N180) even results in a higher IEN in the wet year than in the normal year. Overall, an additional nitrogen fertilizer application in a wet year could improve nitrogen uptake to increase rice yield and maintain NUE.

Supplementary Materials

The following supporting information can be downloaded at: https://www.mdpi.com/article/10.3390/agronomy13061536/s1, Table S1: The annual rainfall and rice season rainfall in the experimental region from 1990 to 2016.

Author Contributions

Conceptualization, G.L. and Y.C.; methodology, O.A.; software, Y.L.; validation, Y.H., formal analysis, O.A. and X.Y.; investigation, O.A. and X.Y.; resources, Q.Y. and Y.L.; data curation, Q.Y.; writing—original draft preparation, B.L.; writing—review and editing, Y.H.; Y.C.; visualization, B.L.; supervision, Y.L.; project administration, Y.H.; funding acquisition, G.L. All authors have read and agreed to the published version of the manuscript.

Funding

This research was funded by NSFC-MWR-CTGC Joint Yangtze River Water Science Research Project, grant number U2040213, and Fundamental Research Funds for the Central Universities, grant number 2042021kf0054.

Data Availability Statement

Data are available on request.

Conflicts of Interest

The authors declare no conflict of interest.

References

  1. Liu, Y.; Ma, C.; Li, G.; Jiang, Y.; Hou, P.; Xue, L.; Yang, L.; Ding, Y. Lower dose of controlled/slow release fertilizer with higher rice yield and N utilization in paddies: Evidence from a meta-analysis. Field Crops Res. 2023, 294, 108879. [Google Scholar] [CrossRef]
  2. Zhang, Y.; Wang, Y.; Niu, H. Spatio-temporal variations in the areas suitable for the cultivation of rice and maize in China under future climate scenarios. Sci. Total Environ. 2017, 601, 518–531. [Google Scholar] [CrossRef] [PubMed]
  3. Liao, B.; Wu, X.; Yu, Y.; Luo, S.; Hu, R.; Lu, G. Effects of mild alternate wetting and drying irrigation and mid-season drainage on CH4 and N2O emissions in rice cultivation. Sci. Total Environ. 2020, 698, 134212. [Google Scholar] [CrossRef]
  4. Zhang, Z.; Li, Y.; Chen, X.; Wang, Y.; Niu, B.; Liu, D.; He, J.; Pulatov, B.; Hassan, I.; Meng, Q. Impact of climate change and planting date shifts on growth and yields of double cropping rice in southeastern China in future. Agric. Syst. 2023, 205, 103581. [Google Scholar] [CrossRef]
  5. Westra, S.; Fowler, H.; Evans, J.; Alexander, L.; Berg, P.; Johnson, F.; Kendon, E.; Lenderink, G.; Roberts, N. Future changes to the intensity and frequency of short-duration extreme rainfall. Rev. Geophys. 2014, 52, 522–555. [Google Scholar] [CrossRef]
  6. Subash, N.; Singh, S.; Priya, N. Extreme rainfall indices and its impact on rice productivity—A case study over sub-humid climatic environment. Agric. Water Manag. 2011, 98, 1373–1387. [Google Scholar] [CrossRef]
  7. Boonwichai, S.; Shrestha, S.; Babel, M.; Weesakul, S.; Datta, A. Climate change impacts on irrigation water requirement, crop water productivity and rice yield in the Songkhram River Basin, Thailand. J. Clean. Prod. 2018, 198, 1157–1164. [Google Scholar] [CrossRef]
  8. Chen, X.; Wang, L.; Niu, Z.; Zhang, M.; Li, J. The effects of projected climate change and extreme climate on maize and rice in the Yangtze River Basin, China. Agric. For. Meteorol. 2020, 282, 107867. [Google Scholar] [CrossRef]
  9. Schneider, P.; Asch, F. Rice production and food security in Asian Mega deltas—A review on characteristics, vulnerabilities and agricultural adaptation options to cope with climate change. J. Agron. Crop Sci. 2020, 206, 491–503. [Google Scholar] [CrossRef]
  10. Auffhammer, M.; Ramanathan, V.; Vincent, J. Climate change, the monsoon, and rice yield in India. Clim. Chang. 2012, 111, 411–424. [Google Scholar] [CrossRef]
  11. Rahman, M.A.; Kang, S.; Nagabhatla, N.; Macnee, R. Impacts of temperature and rainfall variation on rice productivity in major ecosystems of Bangladesh. Agric. Food Secur. 2017, 6, 1–11. [Google Scholar] [CrossRef]
  12. Abbas, S.; Mayo, Z. Impact of temperature and rainfall on rice production in Punjab, Pakistan. Environ. Dev. Sustain. 2021, 23, 1706–1728. [Google Scholar] [CrossRef]
  13. Gu, J.; Yang, J. Nitrogen (N) transformation in paddy rice field: Its effect on N uptake and relation to improved N management. Crop Environ. 2022, 1, 7–14. [Google Scholar] [CrossRef]
  14. Li, J.; Wan, Y.; Wang, B.; Waqas, M.; Cai, W.; Guo, C.; Zhou, S.; Su, R.; Qin, X.; Gao, Q.; et al. Combination of modified nitrogen fertilizers and water saving irrigation can reduce greenhouse gas emissions and increase rice yield. Geoderma 2018, 315, 1–10. [Google Scholar] [CrossRef]
  15. Jiao, J.; Shi, K.; Li, P.; Sun, Z.; Chang, D.; Shen, X.; We, D.; Song, X.; Liu, M.; Li, H.; et al. Assessing of an irrigation and fertilization practice for improving rice production in the Taihu Lake region (China). Agric. Water Manag. 2018, 201, 91–98. [Google Scholar] [CrossRef]
  16. Carrijo, D.; Lundy, M.; Linquist, B. Rice yields and water use under alternate wetting and drying irrigation: A meta-analysis. Field Crops Res. 2017, 203, 173–180. [Google Scholar]
  17. Qi, D.; Zhu, J.; Wang, X. Nitrogen loss via runoff and leaching from paddy fields with the proportion of controlled-release urea and conventional urea rates under alternate wetting and drying irrigation. Environ. Sci. Pollut. Res. 2023, 30, 61741–61752. [Google Scholar] [CrossRef] [PubMed]
  18. Thakur, A.; Rath, S.; Patil, D.; Kumar, A. Effects on rice plant morphology and physiology of water and associated management practices of the system of rice intensification and their implications for crop performance. Paddy Water Environ. 2011, 9, 13–24. [Google Scholar] [CrossRef]
  19. Ishfaq, M.; Farooq, M.; Zulfiqar, U.; Hussain, S.; Akbar, N.; Nawaz, A.; Anjum, S. Alternate wetting and drying: A water-saving and ecofriendly rice production system. Agric. Water Manag. 2020, 241, 106363. [Google Scholar] [CrossRef]
  20. Wang, Z.; Zhang, W.; Beebout, S.S.; Zhang, H.; Liu, L.; Yang, J.; Zhang, J. Grain yield, water and nitrogen use efficiencies of rice as influenced by irrigation regimes and their interaction with nitrogen rates. Field Crops Res. 2016, 193, 54–69. [Google Scholar] [CrossRef]
  21. Qun, Z.; Rui, Y.; Zhang, W.; Gu, J.; Liu, L.; Zhang, H.; Wang, Z.; Yang, J. Grain yield, nitrogen use efficiency and physiological performance of indica/japonica hybrid rice in response to various nitrogen rates. J. Integr. Agric. 2023, 22, 63–79. [Google Scholar]
  22. Xu, G.; Lu, D.; Wang, H.; Li, Y. Morphological and physiological traits of rice roots and their relationships to yield and nitrogen utilization as influenced by irrigation regime and nitrogen rate. Agric. Water Manag. 2018, 203, 385–394. [Google Scholar] [CrossRef]
  23. Zhang, W.; Yu, J.; Xu, Y.; Wang, Z.; Liu, L.; Zhang, H.; Gu, J.; Zhang, J.; Yang, J. Alternate wetting and drying irrigation combined with the proportion of polymer-coated urea and conventional urea rates increases grain yield, water and nitrogen use efficiencies in rice. Field Crops Res. 2021, 268, 108165. [Google Scholar] [CrossRef]
  24. Pan, G.; Cao, G.; Cai, M.; Wang, J.; Wang, R.; Yuan, B.; Zhai, J. Effects of nitrogen application on nitrogen use efficiency, grain yield and quality of rice under different water regimes. Plant Nutr. Fertil. Sci. 2009, 15, 283–289. [Google Scholar]
  25. Su, W.; Lu, J.; Wang, W.; Li, X.; Ren, T.; Cong, R. Influence of rice straw mulching on seed yield and nitrogen use efficiency of winter oilseed rape (Brassica napus L.) in intensive rice–oilseed rape cropping system. Field Crops Res. 2014, 159, 53–61. [Google Scholar] [CrossRef]
  26. Li, F.; Zhang, M.; Zhao, Y.; Jiang, R. Multi-target planting structure adjustment under different hydrologic years using AquaCrop model. Theor. Appl. Climatol. 2020, 142, 1343–1357. [Google Scholar] [CrossRef]
  27. Geng, M.; Wang, K.; Yang, N.; Qian, Z.; Li, F.; Zou, Y.; Chen, X.; Deng, Z.; Xie, Y. Is water quality better in wet years or dry years in river-connected lakes? A case study from Dongting Lake, China. Environ. Pollut. 2021, 290, 118115. [Google Scholar] [CrossRef]
  28. Rosenzweig, C.; Elliott, J.; Deryng, D.; Ruane, A.; Müller, C.; Arneth, A.; Boote, K.; Folberth, C.; Glotter, M.; Khabarov, N.; et al. Assessing agricultural risks of climate change in the 21st century in a global gridded crop model intercomparison. Proc. Natl. Acad. Sci. USA 2014, 111, 3268–3273. [Google Scholar] [CrossRef]
  29. Sui, Y.; Lang, X.; Jiang, D. Projected signals in climate extremes over China associated with a 2 C global warming under two RCP scenarios. Int. J. Climatol. 2018, 38, e678–e697. [Google Scholar] [CrossRef]
  30. He, L.; Cleverly, J.; Wang, B.; Jin, N.; Mi, C.; Liu, D.L.; Yu, Q. Multi-model ensemble projections of future extreme heat stress on rice across southern China. Theor. Appl. Climatol. 2018, 133, 1107–1118. [Google Scholar] [CrossRef]
  31. Xu, X.; Liu, J.; Cao, M. Impact of recent climate fluctuation and LUCC process on potential productivity for crops in Northeast China. Sci. Geogr. Sin. 2007, 27, 318. [Google Scholar]
  32. Wang, T.; Lü, C.; Yu, B. Assessing the potential productivity of winter wheat using WOFOST in the Beijing-Tianjin-Hebei region. J. Nat. Resour. 2010, 25, 475–487. [Google Scholar]
  33. Chen, X.; Zhu, P.; Zhang, Y.; Li, L. Plum rain enhances porewater greenhouse gas fluxes and weakens the acidification buffering potential in saltmarshes. J. Hydrol. 2023, 616, 128686. [Google Scholar]
  34. Wang, Y.; Lu, J.; Ren, T.; Hussain, S.; Guo, C.; Wang, S.; Cong, R.; Li, X. Effects of nitrogen and tiller type on grain yield and physiological responses in rice. AoB Plants 2017, 9, plx012. [Google Scholar] [CrossRef] [PubMed]
  35. Zhen, B.; Guo, X.; Zhou, X.; Lu, H.; Wang, Z. Effect of the alternating stresses of drought and waterlogging on the growth, chlorophyll content, and yield of rice (Oryza sativa L.). J. Irrig. Drain. Eng. 2019, 145, 04019004. [Google Scholar] [CrossRef]
  36. Pan, J.; Sharif, R.; Xu, X.; Chen, X. Mechanisms of waterlogging tolerance in plants: Research progress and prospects. Front. Plant Sci. 2021, 11, 627331. [Google Scholar] [CrossRef]
  37. Linquist, B.; Liu, L.; Van Kessel, C.; Van Groenigen, K. Enhanced efficiency nitrogen fertilizers for rice systems: Meta-analysis of yield and nitrogen uptake. Field Crops Res. 2013, 154, 246–254. [Google Scholar] [CrossRef]
  38. Hou, W.; Xue, X.; Li, X.; Khan, M.R.; Yan, J.; Ren, T.; Cong, R.; Lu, J. Interactive effects of nitrogen and potassium on: Grain yield, nitrogen uptake and nitrogen use efficiency of rice in low potassium fertility soil in China. Field Crops Res. 2019, 236, 14–23. [Google Scholar]
  39. Ntanos, D.A.; Koutroubas, S. Dry matter and N accumulation and translocation for Indica and Japonica rice under Mediterranean conditions. Field Crops Res. 2002, 74, 93–101. [Google Scholar] [CrossRef]
  40. Zhang, J.; Liu, J.; Zhang, J.; Zhao, F.; Cheng, Y.; Wang, W. Effects of nitrogen application rates on translocation of dry matter and nitrogen utilization in rice and wheat. Acta Agron. Sin. 2010, 36, 1736–1742. [Google Scholar] [CrossRef]
  41. Zhang, Y.; Fan, J.; Zhang, Y.; Wang, D.; Wang, Q.; Shen, Q. N accumulation and translocation in four japonica rice cultivars at different N rates. Pedosphere 2007, 17, 792–800. [Google Scholar] [CrossRef]
  42. Yao, Y.; Zhang, M.; Tian, Y.; Zhao, M.; Zhang, B.; Zeng, K.; Zhao, M.; Yin, B. Urea deep placement in combination with Azolla for reducing nitrogen loss and improving fertilizer nitrogen recovery in rice field. Field Crops Res. 2018, 218, 141–149. [Google Scholar] [CrossRef]
  43. Ye, Y.; Liang, X.; Chen, Y.; Liu, J.; Gu, J.; Guo, R.; Li, L. Alternate wetting and drying irrigation and controlled-release nitrogen fertilizer in late-season rice. Effects on dry matter accumulation, yield, water and nitrogen use. Field Crops Res. 2013, 144, 212–224. [Google Scholar] [CrossRef]
  44. Peng, S.; Buresh, R.; Huang, J.; Yang, J.; Zou, Y.; Zhong, X.; Wang, G.; Zhang, F. Strategies for overcoming low agronomic nitrogen use efficiency in irrigated rice systems in China. Field Crops Res. 2006, 96, 37–47. [Google Scholar] [CrossRef]
  45. Cao, X.; Wu, L.; Lu, R.; Zhu, L.; Zhang, J.; Jin, Q. Irrigation and fertilization management to optimize rice yield, water productivity and nitrogen recovery efficiency. Irrig. Sci. 2021, 39, 235–249. [Google Scholar] [CrossRef]
  46. Qiao, J.; Yang, L.; Yan, T.; Xue, F.; Zhao, D. Nitrogen fertilizer reduction in rice production for two consecutive years in the Taihu Lake area. Agric. Ecosyst. Environ. 2012, 146, 103–112. [Google Scholar] [CrossRef]
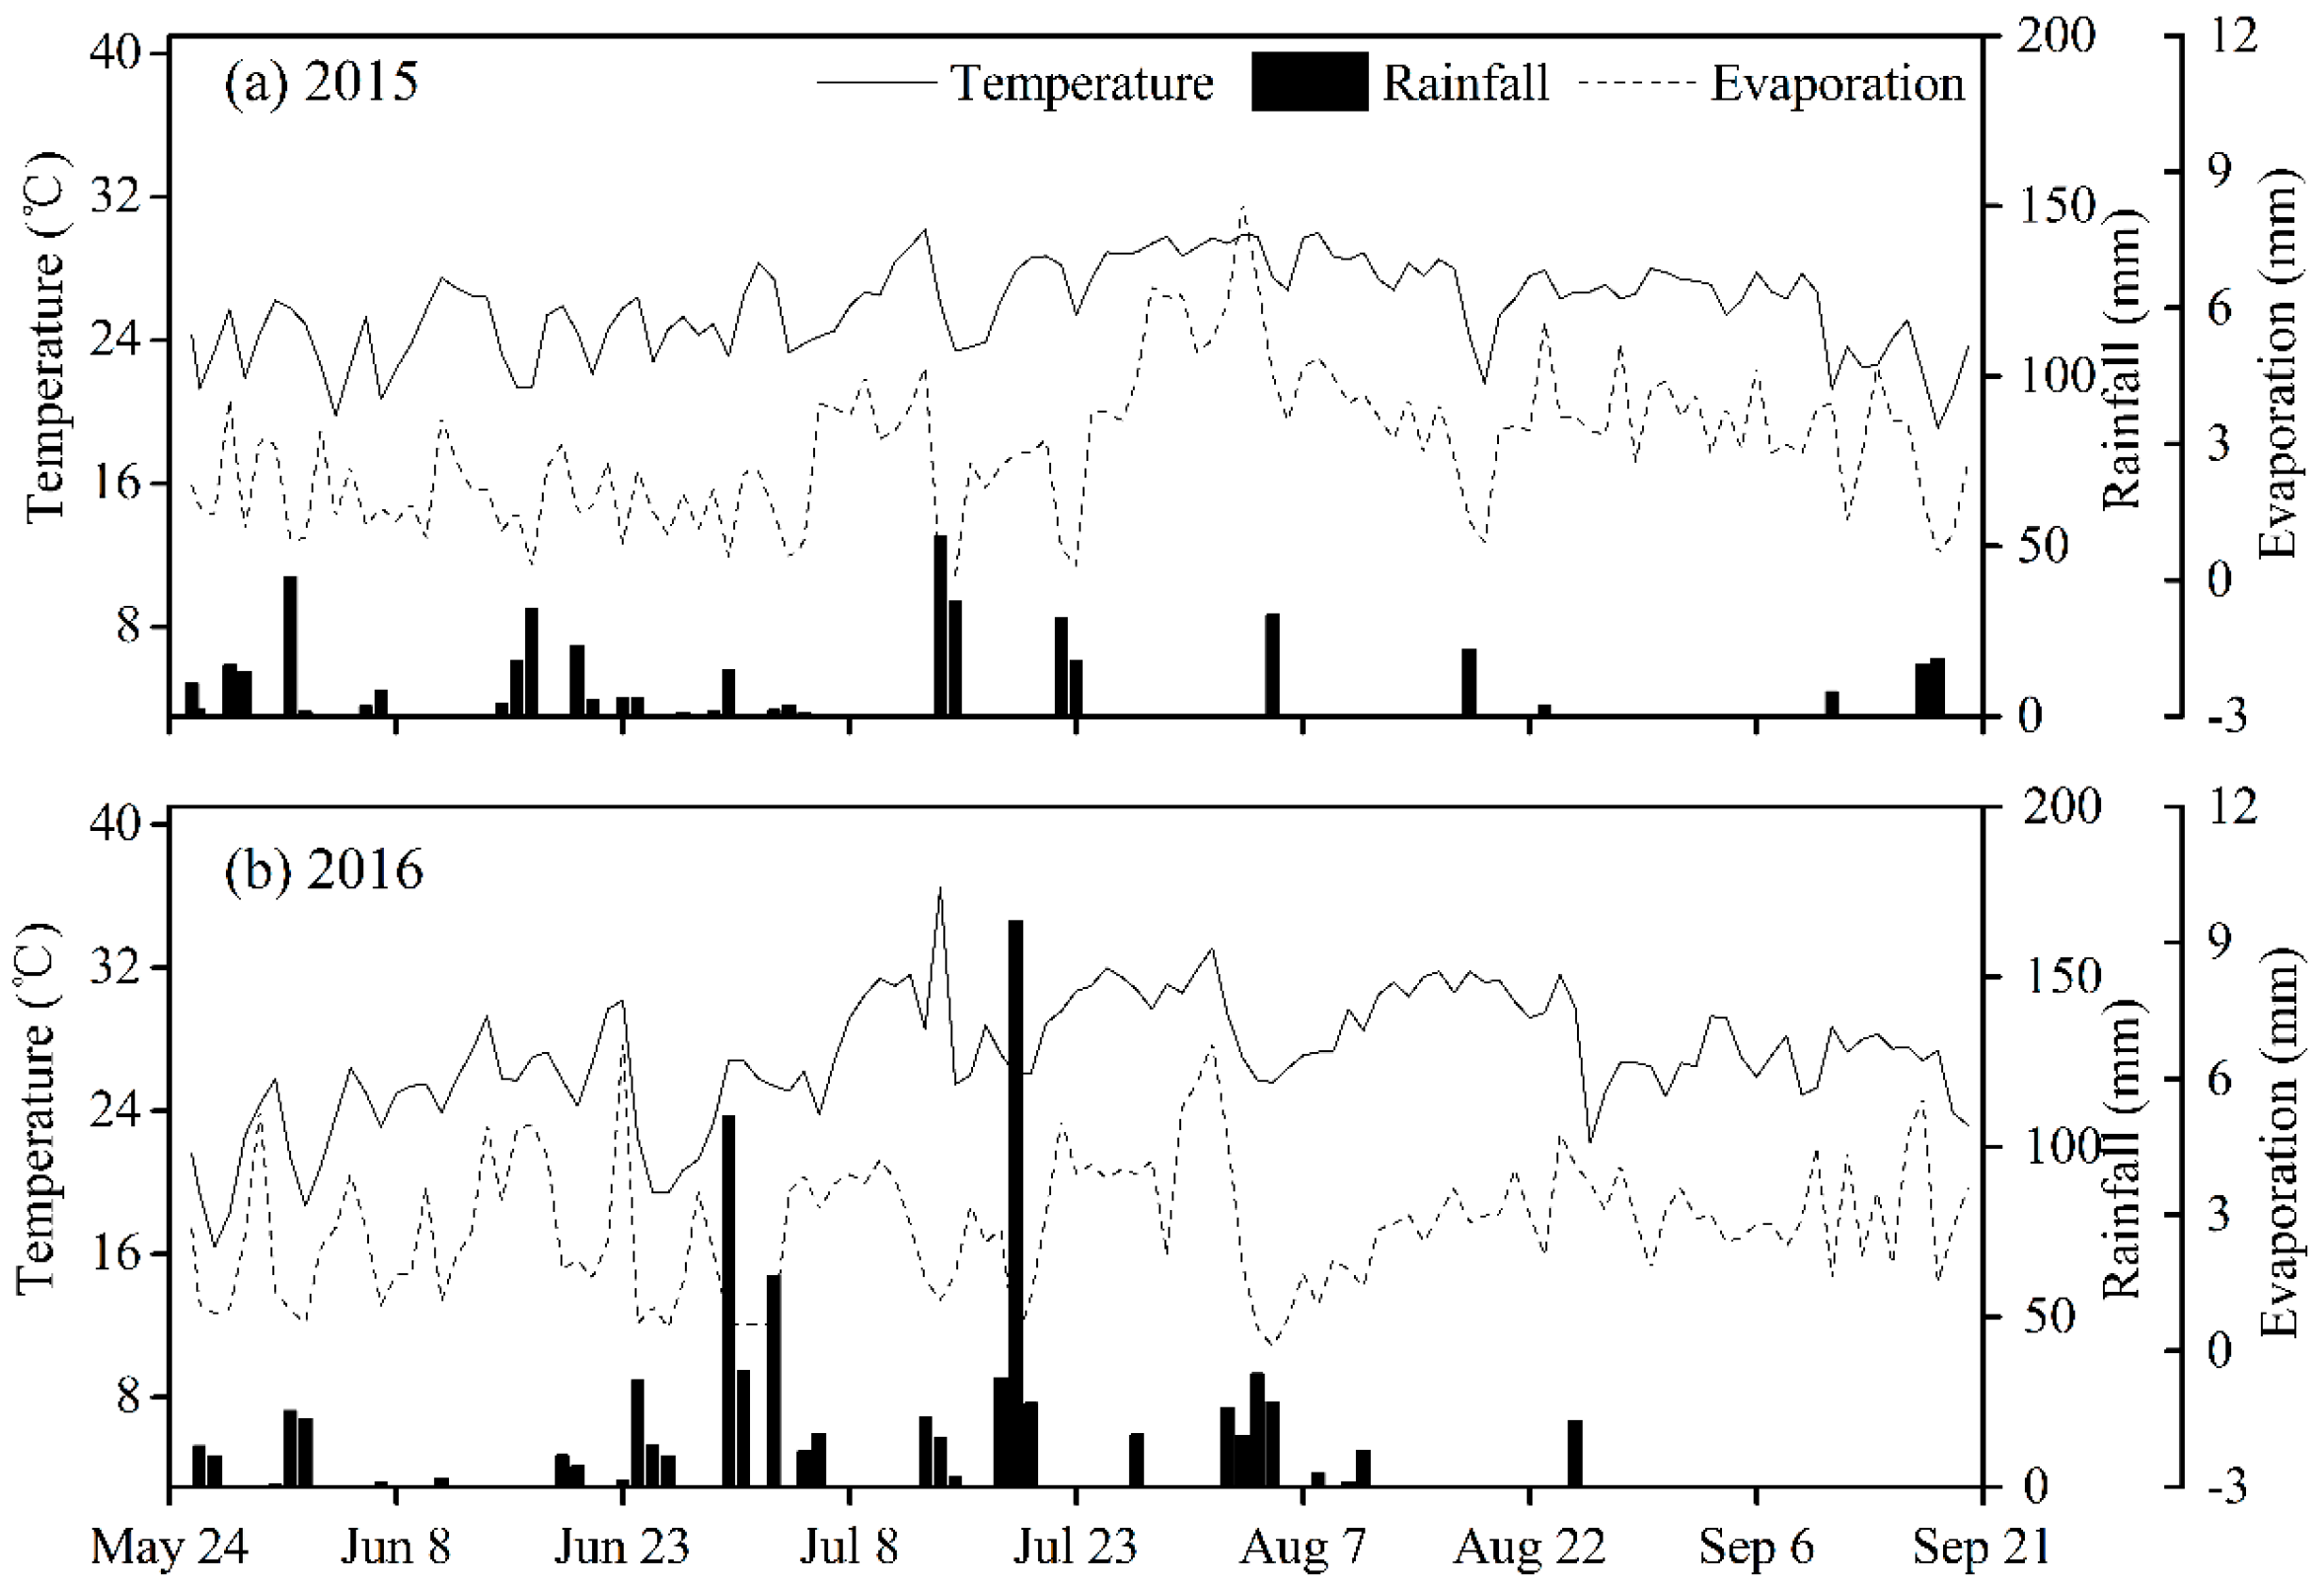
Figure 1. The weather conditions of experimental station during rice season in 2015 and 2016.
Agronomy 13 01536 g001
Figure 2. The total rainfall in annual (a) and rice season (b) in 2015 and 2016. The above line indicates the threshold rainfall (p = 25%) between wet and normal; the below line indicates the threshold rainfall (p = 75%) between normal and dry.
Agronomy 13 01536 g002
Figure 3. The average rice yield (a), plant height (b), and harvest index (c) of normal and wet year with different nitrogen rate (N0, N90, and N180). Different upper letters indicate a significant difference (p < 0.05) between different year, and the lower letters indicate a significant (p < 0.05) among the same year.
Agronomy 13 01536 g003
Figure 4. The nitrogen content (a), aboveground biomass (b), and nitrogen uptake (c) of stem, leaf, and panicle under different water and nitrogen management methods in the normal year (NY) and wet year (WY). The different upper letters indicate the significant difference (p < 0.05) between different year with the same water and nitrogen management methods, and the lower letters indicate the significant difference (p < 0.05) among the same year.
Agronomy 13 01536 g004aAgronomy 13 01536 g004b
Figure 5. The nitrogen internal use efficiency (a) and nitrogen recovery use efficiency (b) with different nitrogen rates (N0, N90, and N180) in response to rainfall years (normal and wet year) and irrigation methods (CF and AWD irrigation). The different uppercase letters indicate significant differences (p < 0.05) between different rainfall years or irrigation methods, the different lowercase letters indicate significant differences (p < 0.05) between different nitrogen rate.
Agronomy 13 01536 g005
Figure 6. The relationship between the rice yield and aboveground biomass (a), nitrogen uptake (b), and harvest index (c). The white symbols and dashed line present the results of the normal year, and the black symbols and solid line present the results of the wet year.
Agronomy 13 01536 g006
Figure 7. The relationship between the total nitrogen uptake and aboveground biomass (a), harvest index (b), and IEN (c). The white symbols and dashed line present the results of the normal year, and the black symbols and solid line present the results of the wet year.
Agronomy 13 01536 g007
Table 1. Rice yield and agronomic properties (tillering number, plant height, aboveground biomass, and harvest index) at harvest in response to rainfall year (normal and wet year), irrigation method (CF and AWD irrigation), and nitrogen rate (N0, N90, and N180).
Rice
Yield
Tillering
Number
Plant
Height
Aboveground
Biomass
Harvest
Index
t ha−1m−2cmt ha−1%
Year (Y) a
Normal 8.38 a189 a116.9 a15.5 a54.9 a
Wet6.41 b165 b115.0 a12.9 b49.5 b
Irrigation method (I) b
CF7.35 a177 a116.4 a14.3 a51.6 a
AWD7.43 a177 a115.4 a14.2 a52.8 a
Nitrogen regime (N) c
N06.24 c140 c108.9 c11.2 c55.1 a
N907.39 b175 b116.4 b14.4 b51.0 b
N1808.54 a216 a122.5 a17.0 a50.5 b
F-values
Y452.8 ***12.2 **3.3 214.2 ***28.0 ***
I0.7 0.0 0.8 0.2 1.3
N205.3 ***42.7 ***56.2 ***367.4 ***8.2 **
Y × I2.7 0.0 4.4 *0.6 0.7
Y × N33.2 ***1.0 9.5 **0.3 16.9 ***
I × N0.0 0.7 0.2 4.1 *2.3
Y × I × N0.7 0.8 0.3 1.1 1.1
Values followed by a different lower letter in the same main category indicate significantly different at the 5% probability level. The *, **, and *** indicate a significant level of p < 0.05, p < 0.01, and p < 0.001. a values were averaged across irrigation methods and nitrogen rate. b values were averaged across nitrogen rate and rainfall years. c values were averaged across rainfall years and irrigation methods.
Table 2. The biomass and nitrogen content of rice stem, leaf, and panicle, and the total nitrogen uptake at harvest in response to rainfall year (normal and wet year), irrigation method (CF and AWD irrigation), and nitrogen rate (N0, N90, and N180).
Biomass (t ha−1)Nitrogen Content (g kg−1)Total Nitrogen
Uptake (kg ha−1)
StemLeafPanicleStemLeafPanicle
Year (Y) a
Normal 3.30 a2.10 a10.09 a3.99 a5.30 b10.0 a126.0 a
Wet2.88 b2.09 a7.96 b3.49 a6.14 a9.70 a100.0 b
Irrigation method (I) b
CF3.08 a2.10 a9.07 a3.71 a5.71 a9.41 b109.7 a
AWD3.11 a2.08 a8.98 a3.49 a5.73 a10.28 a116.3 a
Nitrogen regime (N) c
N02.59 c1.66 b6.95 c3.68 a6.12 a9.57 a86.3 c
N903.17 b2.23 a9.04 b3.63 a5.48 a9.83 a112.8 b
N1803.51 a2.38 a11.09 a3.92 a5.56 a10.15 a139.9 a
F-values
Y26.1 ***0.0 321.6 ***3.9 5.2 *1.6 54.7 ***
I0.1 0.0 0.5 0.1 0.0 13.9 **3.6
N43.0 ***24.3 ***394.9 ***0.5 1.2 2.1 77.5 ***
Y × I0.1 3.4 0.0 0.9 1.4 3.3 1.3
Y × N12.0 ***0.2 5.6 *2.5 1.3 0.8 3.0
I × N1.8 0.1 3.8 *0.3 0.3 0.3 1.6
Y × I × N0.3 0.9 1.4 2.6 2.7 2.4 1.2
Values followed by a different lower letter in the same main category indicate significantly different at the 5% probability level. The *, **, and *** indicate a significant level of p < 0.05, p < 0.01, and p < 0.001. a values were averaged across irrigation methods and nitrogen rate. b values were averaged across nitrogen rate and rainfall years. c values were averaged across rainfall years and irrigation methods.
Table 3. Nitrogen internal use efficiency (IEN), nitrogen recovery use efficiency in (REN), and nitrogen harvest index (HIN) in response to rainfall year (normal and wet year), irrigation method (CF and AWD), and nitrogen rate (N0, N90, and N180).
IENRENHIN
kg kg−1%%
Year (Y) a
Normal 68.9 a35.9 a80.8 a
Wet64.8 a29.8 b76.3 b
Irrigation method (I) b
CF68.1 a27.4 b78.0 a
AWD65.5 a38.3 a79.1 a
Nitrogen regime (N) c
N072.4 a 78.5 a
N9066.0 ab34.1 a77.6 a
N18062.1 b31.6 a79.5 a
F-values
Y2.5 5.4 *9.2 **
I1.0 17.1 **0.6
N5.4 *0.9 0.5
Y × I0.7 1.3 0.0
Y × N10.2 **1.9 1.3
I × N1.3 9.6 **1.0
Y × I × N0.3 2.5 1.8
Values followed by a different lower letter in the same main category indicate significantly different at the 5% probability level. The * and ** indicate a significant level of p < 0.05 and p < 0.01. a values were averaged across irrigation methods and nitrogen rate. b values were averaged across nitrogen rate and rainfall years. c values were averaged across rainfall years and irrigation methods.
Disclaimer/Publisher’s Note: The statements, opinions and data contained in all publications are solely those of the individual author(s) and contributor(s) and not of MDPI and/or the editor(s). MDPI and/or the editor(s) disclaim responsibility for any injury to people or property resulting from any ideas, methods, instructions or products referred to in the content.