Article

Comprehensive Evaluation and Physiological Response of Quinoa Genotypes to Low Nitrogen

1
State Key Laboratory of Sustainable Dryland Agriculture, Agricultural College, Shanxi Agricultural University, Taiyuan 030031, China
2
Department of Botany, Government College Women University Faisalabad, Faisalabad 38000, Pakistan
*
Authors to whom correspondence should be addressed.
Agronomy 2023, 13(6), 1597; https://doi.org/10.3390/agronomy13061597
Submission received: 15 May 2023 / Revised: 6 June 2023 / Accepted: 9 June 2023 / Published: 13 June 2023
(This article belongs to the Section Plant-Crop Biology and Biochemistry)

Abstract

:
The utilization of low-N tolerant and N-efficifent varieties offers significant benefits in terms of reducing the need for excessive N fertilizer input. Quinoa, a resilient crop for agroecological transition, possesses a wide genetic diversity, making it suitable for selecting genotypes that require less N fertilizer. In this study, the growth and physiological characteristics of nine quinoa genotypes were assessed to determine their low-N tolerance using the fuzzy membership function. Based on comprehensive evaluation indices, three genotypes were identified: low-N tolerant (BL22), intermediately tolerant (A29), and sensitive (G68). These genotypes were exposed to varying N concentrations, including normal (4 mM), low (0.8 mM), and deficient N (no N) conditions. The results indicate that low-N conditions altered root phenotype, with reduced biomass, total protein, and chlorophyll content; increased soluble sugar levels; and inhibited N-metabolizing enzymes (nitrate reductase, glutamine synthetase, glutamate synthase) and N uptake. Under low-N conditions, the tolerant genotype exhibited higher maximal efficiency of photosystem II (Fv/Fm), root vitality, and N content compared to the sensitive genotype. Interestingly, the sensitive genotype displayed elongated and thinner shoots and roots in response to low-N, suggesting that plant height and root length are unreliable indicators of low-N tolerance in quinoa. In contrast, shoot and root dry biomass, Fv/Fm, chlorophyll content, N-metabolizing enzymes, and N content proved to be reliable indicators of low-N tolerance during the early growth stage of quinoa. Overall, these findings highlight the potential of utilizing specific growth and physiological parameters as indicators for screening low-N tolerant quinoa genotypes, thereby reducing dependence on N fertilizers.

1. Introduction

Nitrogen (N), as a vital nutrient, plays a crucial role in the growth and development of plants, making it a key factor in enhancing crop productivity. However, the current reliance on environmentally harmful synthetic fertilizers to achieve global grain yields highlights the necessity for increased nitrogen use efficiency in order to ensure future agricultural sustainability [1]. Consequently, the identification and utilization of crop genotypes that exhibit high nitrogen efficiency or tolerance are of paramount importance. In nitrogen-tolerant plants, even under mild nitrogen deficiency, there is an observed enhancement in root growth and a greater allocation of resources to the roots, resulting in increased carbon concentration in the soil. This phenomenon underscores the significance of adaptive phenotypic traits and metabolic activities in different genotypes [2].
The efficiency of nitrogen uptake and utilization for grain production relies on the proper functioning of various mechanisms involved in nitrogen absorption, translocation, assimilation, and redistribution within plants. Plants acquire nitrogen from the soil in the form of nitrate and ammonium through different membrane transporters. Nitrate is taken up by both low- and high-affinity nitrate transporters, whereas ammonium is acquired through low-affinity channels (such as cation channels or aquaporins) and high-affinity ammonium transporters. Upon uptake of nitrate, it undergoes reduction by the enzyme nitrate reductase to form nitrite. This conversion step is considered rate-limiting and has a significant impact on nitrogen metabolism and assimilation [3]. Additionally, the enzymes glutamine synthetase (GS) and glutamate synthase (GOGAT) collaborate to assimilate ammonium, derived from direct absorption or nitrate reduction, into amino acids [4].
Different genotypes exhibit varied responses to nitrogen limitation due to the complex morphological and physiological variations in their roots and shoots [5,6,7]. Consequently, it is becoming increasingly crucial to identify plants that can withstand nitrogen limitation or explore nitrogen-efficient genotypes that effectively utilize nitrogen. Moreover, precise screening methods are essential to establish a clear understanding of the phenotype–genotype relationship, which is necessary for successful breeding of low-N tolerant crops [7,8].
Previous studies have identified tolerant and sensitive genotypes in various crops such as maize [6,8,9], broomcorn millet [1], rice [10,11], barley [4,12], cotton [13], wheat [7], and sesame [14]. However, it is important to note that suitable criteria for screening low-N genotypes may vary among different plant species. Although the physiological traits of quinoa genotypes have been studied in relation to yield and nitrogen use efficiency under varying nitrogen conditions [15], the impact of genetic diversity on the ability of quinoa genotypes to tolerate low nitrogen or nitrogen deficiency has not been investigated.
Determining nitrogen uptake and use efficiency through yield analysis under low nitrogen conditions is a laborious and time-consuming process. Moreover, it is important to note that low-N tolerance does not always correlate with high productivity [16]. Tyagi et al. [7] suggested that stress susceptibility and tolerance indices could be used to predict yield and screen for low-N tolerant genotypes. Low-N tolerance in plants is a complex trait, and numerous physiological and phenotypic indices are influenced by nitrogen deficiency, which can be utilized to assess low-N tolerance. Therefore, it is essential to explore the combined use of multiple low-N tolerance indices, including phenotypic, molecular, and physiological assessments [1]. Another approach to identify low-N tolerance is the utilization of comprehensive evaluation indices [6].
The chlorophyll meter, a non-destructive analytical tool that measures the absorption of red and near-infrared light by leaves, can be employed to estimate chlorophyll content, which directly correlates with leaf nitrogen content [17]. The low-N sensitive genotype may exhibit a greater reduction in chlorophyll content than the tolerant genotype under low nitrogen conditions [16]. The addition of nitrogen has been found to affect photosynthesis and the dissipation of photochemical energy [15]. Enzyme activities such as nitrate reductase (NR), glutamine synthetase (GS), and glutamate synthase (GOGAT) are commonly studied and known to be influenced by different nitrogen levels. Low nitrogen conditions can induce the synthesis of NR [3], while higher activities of these enzymes indicate a greater assimilation capacity in plants.
Quinoa (Chenopodium quinoa Willd.) is a resilient and high-yielding pseudo-crop that produces grains with a superior protein content and a well-balanced amino acid composition compared to other cereals [18,19]. Its exceptional nutrient profile, adaptability, and resistance to harsh conditions make quinoa highly desirable for future cultivation [18,20]. While proper fertilization can enhance the nutritional quality of quinoa seeds [21,22], genotypic variation in quinoa under low-nitrogen conditions remains unexplored.
The objective of this research is to investigate the phenotypic, physiological, and nitrogen use efficiency factors that contribute to the tolerance or sensitivity of quinoa genotypes towards low nitrogen availability. By studying how quinoa genotypes perceive, absorb, and respond to low nitrogen conditions, this study aims to shed light on potential physiological adaptation processes that enable the plant to withstand nitrogen stress. The findings of this research can have practical applications in increasing sustainable agricultural productivity.

2. Materials and Methods

2.1. Comprehensive Screening of Quinoa Genotypes using Low Nitrogen

2.1.1. Genotypes and Treatments

The experiment was conducted at the College of Agriculture, Shanxi Agricultural University, between April and July 2021. The study utilized nine quinoa genotypes (HL58, G68, A29, G36, BL23, A86, HL93, BL77, BL22) obtained from Shanxi Huaqing Quinoa Product Development Co., Ltd. Xian, China (Supplementary Table S1). To ensure sterility, the seeds underwent a sterilization process involving a 10% sodium hypochlorite solution for 10 min, followed by multiple rinses with distilled water. Subsequently, the seeds were placed on filter paper in petri dishes, which were kept moist and incubated at a temperature of 25 °C until germination occurred.
Once germination was achieved, the resulting seedlings were transplanted into pots filled with sand. The pots were then placed in an incubation chamber set at a temperature of 22 °C, following a light–dark cycle of 16 h light and 8 h dark. Seedlings displaying uniform growth and possessing 6–8 leaves were selected for further experimentation.
The selected seedlings were subjected to varying nitrogen concentrations by treating them with Hoagland nutrient solution for a period of 20 days. For normal nitrogen supply, the Hoagland full-nutrient solution contained 4 mmol N/L. In order to induce low nitrogen stress (0.5% of normal nitrogen), a concentration of 0.02 mmol N/L was used. Each treatment was repeated three times and applied in a completely randomized design, ensuring the random allocation of treatments across the seedlings.

2.1.2. Observations

Following a treatment period of 20 days, various growth characteristics were measured for each quinoa genotype, including plant height, stem diameter, taproot length, root volume, surface area, average root diameter, shoot dry weight, root dry weight, and root-to-shoot ratio. Additionally, chlorophyll content and chlorophyll fluorescence parameters were assessed, along with several physiological characteristics such as root activity, nitrate reductase activity, glutamate synthase activity, glutamine synthetase activity, superoxide dismutase activity, peroxidase activity, malondialdehyde content, soluble sugar content, soluble protein content, and proline content. Furthermore, nitrogen-related indicators, including plant total nitrogen content, nitrogen accumulation, and nitrogen use efficiency, were measured under both normal-nitrogen and low-nitrogen stress conditions.
To comprehensively evaluate the low-nitrogen tolerance of each quinoa genotype, principal component analysis and cluster analysis were performed. The fuzzy membership function method was employed to calculate the low-nitrogen tolerance index for each indicator. Based on the results, three quinoa genotypes with distinct levels of tolerance to low nitrogen were identified. The low-nitrogen-tolerant genotype (BL22), intermediately tolerant genotype (A29), and low-nitrogen-sensitive genotype (G68) were selected as candidates for the subsequent experiment.

2.2. Application of Three Nitrogen Levels to Selected Quinoa Genotypes

In the second experiment, three quinoa genotypes, namely low-nitrogen-tolerant (BL22), intermediate (A29), and low-nitrogen-sensitive (G68), were cultivated in pots within a controlled laboratory environment. The temperature was maintained at 20–25 °C, and the area was equipped with front and rear ventilation to ensure proper airflow. Natural light was provided as the source of illumination, and regular irrigation was carried out to maintain optimal moisture levels.
Upon reaching the 6- to 8-leaf stage, the quinoa seedlings were subjected to varying levels of nitrogen supply. The first treatment, representing normal nitrogen levels (N1), involved the application of a full-strength Hoagland solution containing 4 mmol/L N. The second treatment, representing low nitrogen levels (N2), utilized a Hoagland solution with 0.8 mmol/L N, which accounted for approximately 20% of the normal nitrogen level. For the nitrogen deficiency treatment (N3), the Hoagland nutrient solution was modified by replacing Ca(NO3)2 and KNO3 with 0.5 M CaCl2 and 0.5 M KCl, respectively. The experiment followed a completely randomized design, with each treatment being replicated three times to ensure statistical strength.

2.3. Measurement of Morphological Indices

The dry weight of above-ground parts and dry weight of roots was taken by weighing after drying. The root-to-shoot ratio was measured by dividing the dry weight of plant roots by the dry weight of aboveground parts. Root activity was measured by the triphenyl tetrazolium chloride (TTC) colorimetric method.
The growth and physiological indicators were assessed at the end of a 20-day period for each treatment. Plant height was measured using a ruler to determine the vertical length. Stem thickness was measured utilizing a vernier caliper to assess the diameter of the stem. To obtain measurements for taproot length, root volume, surface area, and average root diameter, the roots were carefully extracted from the soil, thoroughly washed, and then scanned using an Epson Scan root system scanning device. Subsequently, the WinRHIZO root system analysis software was employed to analyze the scanned root images.
The dry weight of above-ground plant parts and roots was determined by weighing the samples after they had been dried. The root-to-shoot ratio was calculated by dividing the dry weight of the plant roots by the dry weight of the above-ground parts. The assessment of root activity was performed using the triphenyl tetrazolium chloride (TTC) colorimetric method, which provided a quantitative measurement.

2.4. Measurement of Root Vitality

Root vitality was assessed by employing 2,3,5-triphenyl-2H-tetrazolium chloride (TTC) staining [23]. Root segments measuring 1 cm were immersed in a TTC solution (0.6% concentration prepared with 0.1 mol/L phosphate buffer) totaling 20 mL. Subsequently, the roots were removed from the solution and rinsed three times with distilled water. They were then submerged in 20 mL of 95% ethanol. To extract triphenyl methyl hydrazone (TTF), the roots were heated in a water bath at 85 °C for 10 min. The resulting extract’s absorbance was measured at 485 nm, and root vitality was expressed as µg g−1 h−1.

2.5. Measurement of Physiological Traits

Chlorophyll content was assessed using a SPAD chlorophyll tester. Chlorophyll fluorescence parameters were measured using the Handy PEA chlorophyll fluorescence instrument. The measurements were conducted between 9:00 and 11:00 a.m. to minimize potential errors arising from diurnal variations in chlorophyll fluorescence. Prior to the measurements, a dark adaptation period of 15–20 min was implemented, and the saturation pulse was set at 432 μmol/m2/s.
The soluble sugar content was determined via anthrone colorimetry [24]. The protein was quantified using Coomassie brilliant blue G-250 staining via Bradford assay. This assay was carried out by determining the absorbance shift of the stain [25].

2.6. Activities of Nitrogen Metabolizing Enzymes

The nitrate reductase (NR) activity was determined by the in vitro method of p-aminobenzene sulfonic acid colorimetry. Glutamate synthase (GOGAT) was assayed spectrophotometrically [26]. The enzyme extract was prepared by taking 1 g of the plant material with 5 mL of 100 mM phosphate buffer (pH 7.5) containing 1 mM disodium EDTA, 1 mM dithioerythritol, and 1% polyvinyl pyrrolidone (PVP) and centrifuging at 10,000× g for 30 min at 4 °C. The supernatant was collected and 0.2 mL was mixed with reaction mixture (1 mL of glutamine (5 mM), 1 mL of 2-oxoglutarate (5 mM), 1 mL of NADPH (0.25 mM), and 1.8 mL of buffer). Incubation was carried out at 37 °C for 20 min and change in absorbance was measured at 340 nm following the addition of enzyme extract.

2.7. Antioxidant Enzyme Activities and Measurement of Lipid Peroxidation

Superoxide dismutase (SOD) activity was measured via the nitrogen blue tetrazolium photoreduction method. Peroxidase (POD) activity was measured via the guaiacol colorimetric method [27].
Lipid peroxidation was measured as malonaldehyde (MDA) content via the thiobarbituric acid method [28]. Leaf samples (500 mg) were homogenized in 5% (w/v) trichloroacetic acid (TCA). The homogenate was centrifuged at 3000 r/min for 10 min at 4 °C. The supernatant (2 mL) was mixed with 2 mL of 0.67% (w/v) thiobarbituric acid (TBA). The mixture was heated at 100 °C for 30 min and then cooled in an ice bath. The supernatant absorbance was measured at 450 nm, 532 nm, and 600 nm.

2.8. Nitrogen Use Efficiency

Plant nitrogen content was determined using the Kjeldahl method [29]. Total plant nitrogen accumulation and nitrogen use efficiency were calculated following the methodology described by Siddiqi and Glass [30] using the following equations:
Nitrogen accumulation = Plant dry weight (g) × Nitrogen content (mg g−1)
Nitrogen-utilization efficiency = Plant dry weight (g)/Plant nitrogen accumulation (mg)

2.9. Relative Value of Indices and Comprehensive Value of Genotypes

The relative value of each character (Rx) was measured by dividing the values at low nitrogen stress by that at normal nitrogen [31].
Rx = Measured value of low nitrogen stress/Measured value of normal nitrogen supply
The membership function values were normalized using the fuzzy membership function method to standardize the score value of each index trait on the extracted principal component.
Membership function value = U(Xj) = (Xj − Xmin)/(Xmax − Xmin)
Xj represents the jth comprehensive index, j = 1, 2,.., n; Xmax and Xmin represent the maximum and minimum values of the scores of each trait index on each principal component, respectively.
Weight = W j = R j / j = 1 n R j
Wj represents the weight of the extracted jth principal component, and Rj represents the contribution rate of the jth principal component.
The comprehensive value (D) of the low-nitrogen tolerance of each quinoa genotype was calculated using the equation:
Comprehensive   evaluation   value = D = j = 1 n [ U   ( X j ) × W j ]

2.10. Statistical Analysis

The data were subjected to statistical analysis using Statistix (version 8) software, employing a two-factor factorial analysis of variance. To determine significant differences among treatments, a Tukey HSD test was conducted at a significance level of p ≤ 0.05. For visualization of the data clustering, principal component analysis was performed using the ggfortify package in RStudio (version 2023.03.0-daily+82.pro2), and a cluster ggplot was generated.

3. Results

3.1. Comprehensive Evaluation of Low-N Tolerance of Quinoa Genotypes

The principal component analysis (PCA) conducted on the 26 measured indicators revealed that the first 4 integrated indicators accounted for variance contributions of 47.46%, 18.44%, 10.06%, and 7.98% (Table 1). The cumulative contribution rates of the first and second factors together amounted to 65.9%, while the cumulative contribution rates of the first four factors reached 84%. Consequently, the first four factors effectively captured the information encompassed by the original variables. Therefore, we utilized these factors to replace the original information derived from the 26 indicators measured across the nine quinoa lines.
The comprehensive value (D) for assessing the low-nitrogen tolerance of each quinoa genotype was calculated, and subsequent sorting was performed (Table 2). Among the genotypes, BL22 demonstrated the highest level of tolerance to low nitrogen stress, while genotype A29 displayed intermediate tolerance. On the other hand, genotype G68 exhibited the greatest sensitivity to low nitrogen stress and was therefore selected for further experimentation.

3.2. Morphological Indices of Quinoa Genotypes

The morphological data of three quinoa genotypes with varying low-N tolerance were observed after a 20-day period under low-N, normal N, and N-deficient conditions (Table 3). In general, plants grown under normal N exhibited greater plant height, stem diameter, aboveground dry weight, root diameter, root surface area, and root volume, while those grown under N-deficient conditions displayed the lowest values for these parameters. Conversely, root dry weight and root length were higher under N-deficient conditions compared to normal N levels. Among the three genotypes, the low-N sensitive genotype exhibited the highest plant height and longest root length but had the lowest stem diameter, root diameter, and root dry weight.
The plant height of low-N tolerant (BL22) and low-N sensitive genotypes (G68) was higher than that of the intermediate genotype (A29) (Table 3). Aboveground dry biomass was the minimum for the intermediate genotype under all N conditions. The tolerant genotype has the highest aboveground dry biomass, root dry weight, stem diameter, root diameter, and root surface area under low N and N deficient conditions. The sensitive genotype had the lowest values of stem diameter, root dry weight, and root diameter under low N and deficient N. Tolerant genotypes had maximum root length under normal N and minimum length under N deficient conditions. The sensitive genotype has the highest value of maximum root length under low N and N deficient conditions.
The ratio of the root-to-shoot dry weight of quinoa genotypes was higher under low N and N deficiency conditions compared to normal N (Table 3). Under normal N, the root–shoot ratio of the sensitive genotype was less than that of the tolerant and intermediate genotypes, while under N deficiency, the root–shoot ratios of the intermediate and sensitive genotypes were higher than that of the tolerant genotype.

3.3. Root Vitality

The root vitality of the tolerant genotype remained significantly similar under normal N, low N, and N deficiency (Figure 1), while the root vitality of the intermediate and sensitive genotypes was significantly reduced by the low N and N deficient conditions compared to normal N.

3.4. Metabolites

The chlorophyll (SPAD) contents of the intermediate and sensitive genotypes were highest under normal N and reduced under low N and N deficiency (Figure 2a). The tolerant genotypes showed a 2.7% reduction in chlorophyll content under N deficiency compared to under normal N levels. The intermediate genotype showed a 6.6 and 9.9% reduction, and the sensitive genotype showed a 7.1 and 12% reduction in chlorophyll content under low N and N deficiency compared to normal N.
Under normal N, the intermediate and sensitive genotypes showed higher proline content than the tolerant genotype (Figure 2b). The intermediate genotype showed a 4.6 and 10.5% increase under low N and N deficiency and the sensitive genotype showed an 8.2 increase in proline content under low N and 8.9% increase under N deficiency compared to normal N.
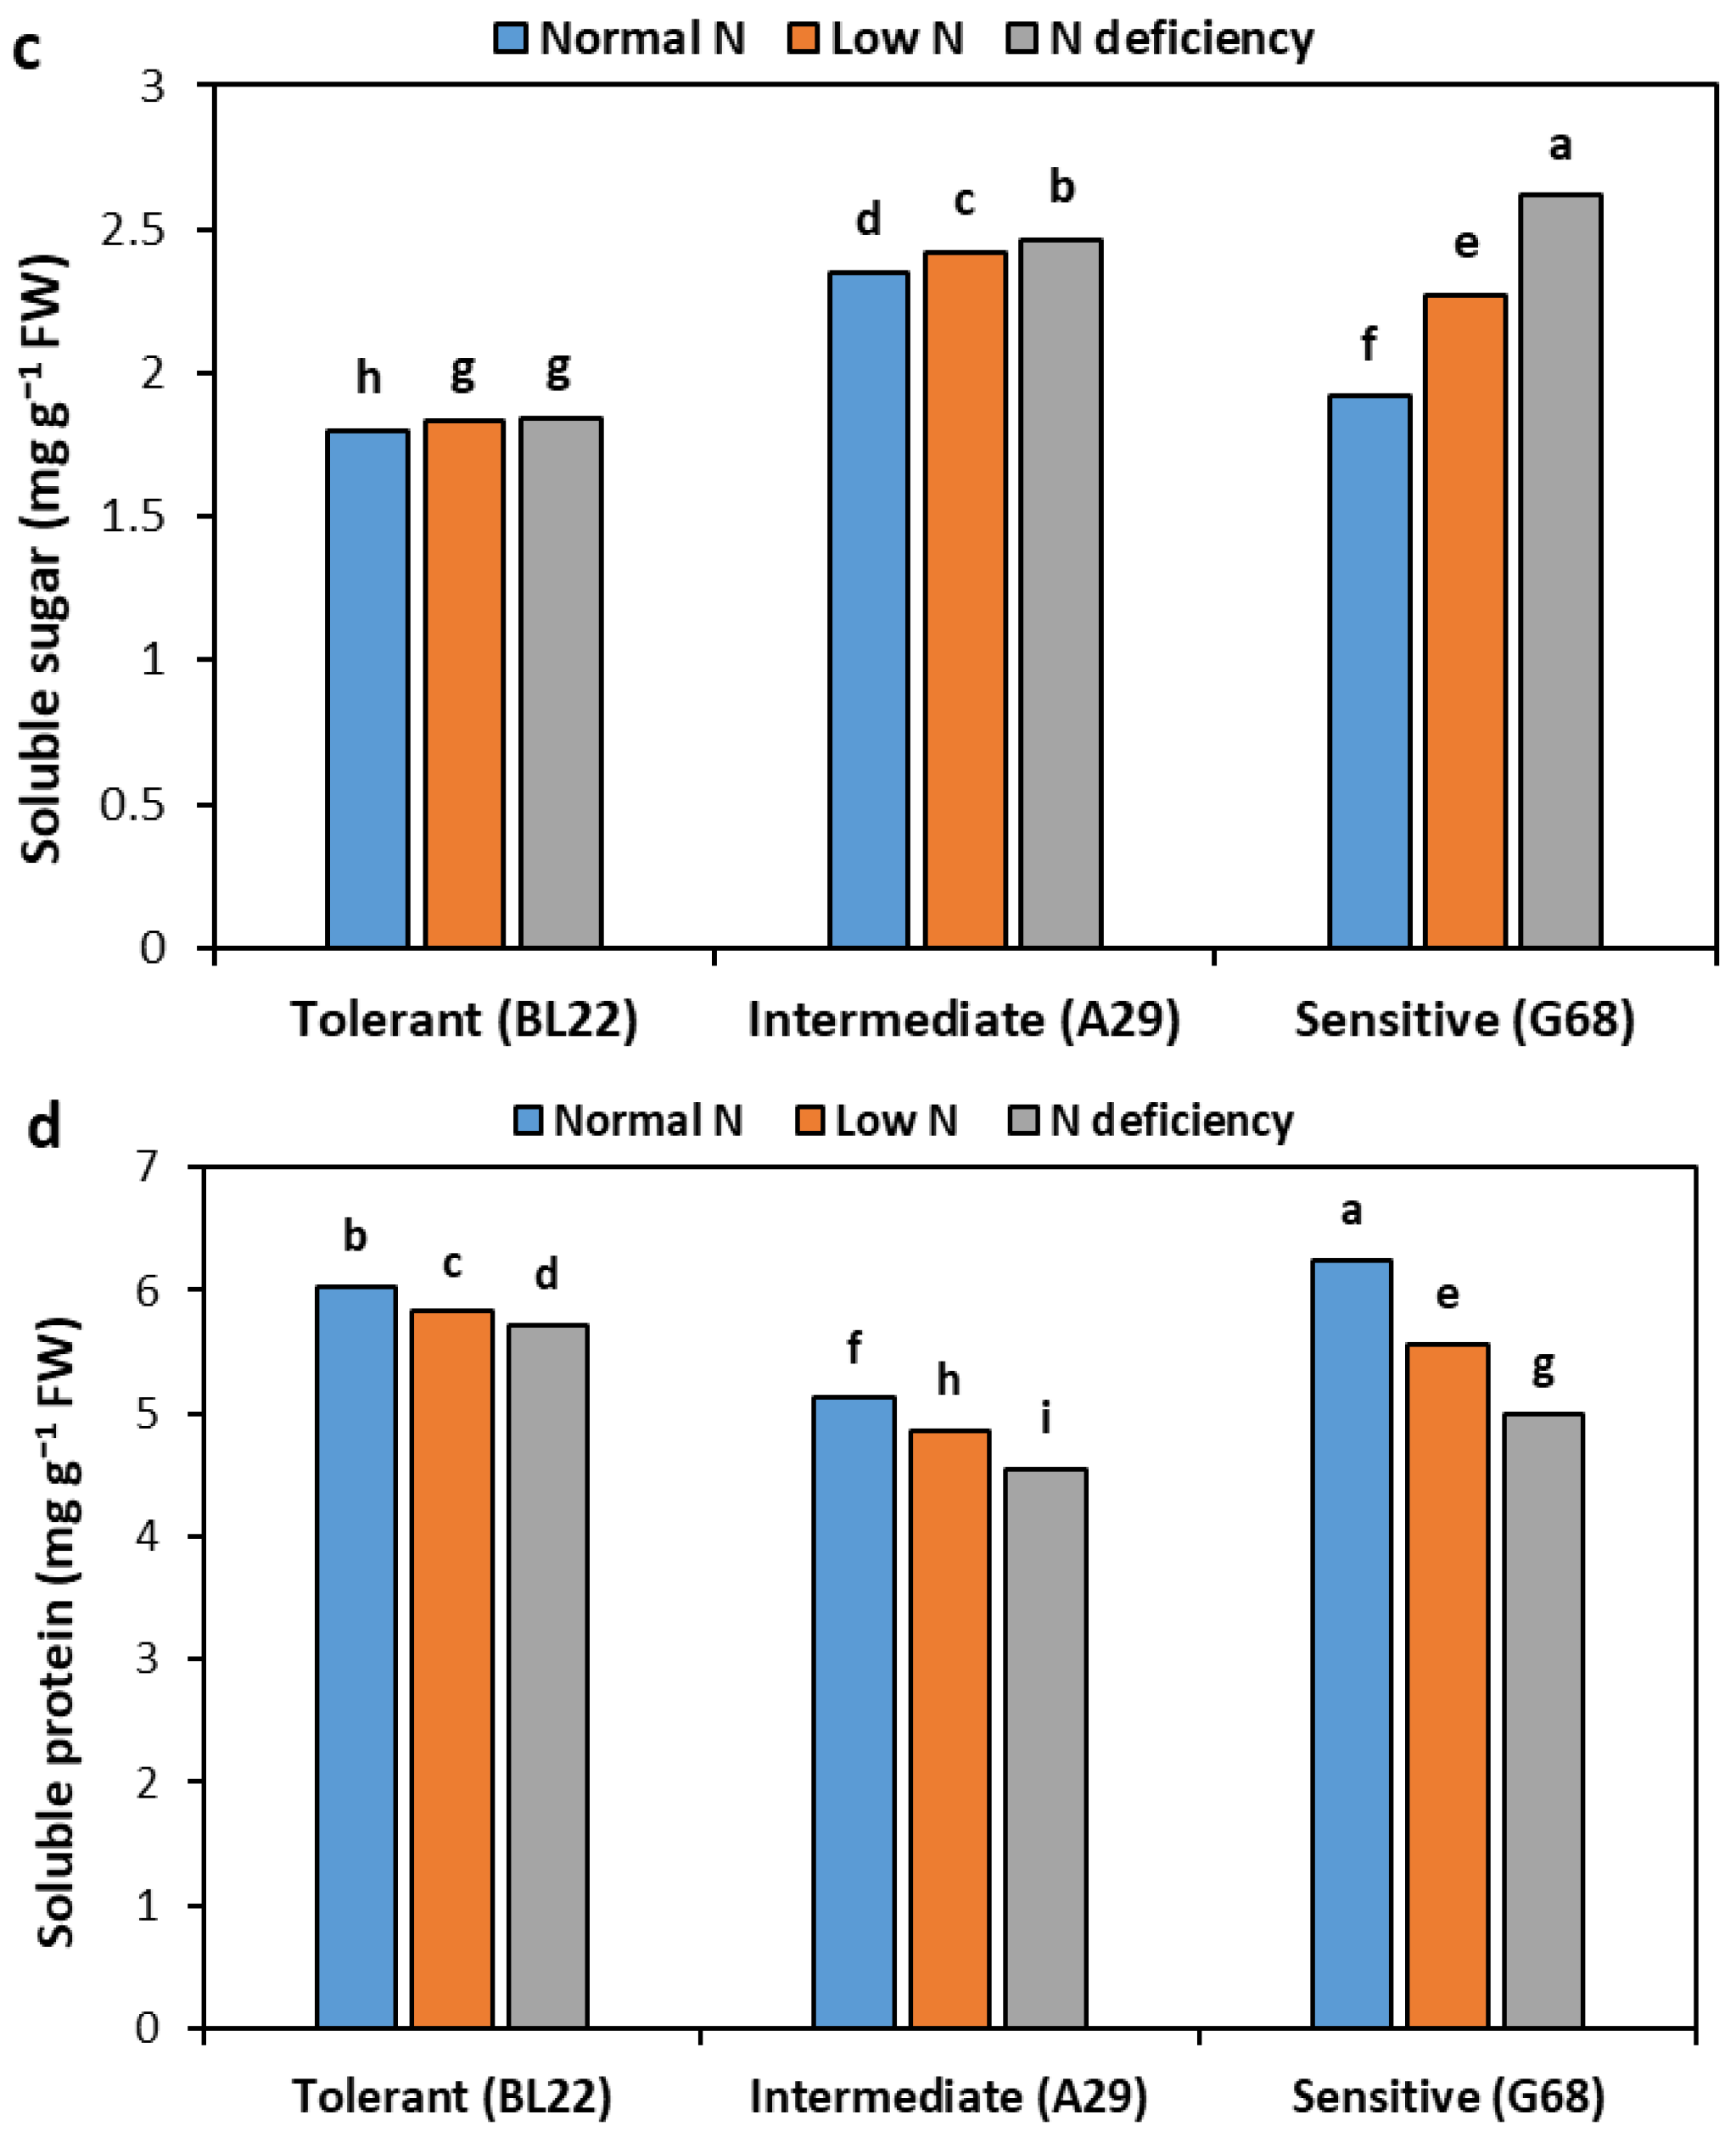
The intermediate and sensitive genotypes showed more soluble sugar content than the tolerant genotype (Figure 2c). The intermediate genotype showed 3 and 4.7% increases in soluble sugar content and the sensitive genotype showed 18 and 36% increases in soluble sugar under low N and N deficiency, respectively, compared to normal N. The soluble protein contents under low N and N deficiency were less than under normal N.
The soluble protein content of the tolerant genotype was reduced by 3 and 5% under low N and N deficiency compared to normal N (Figure 2d). The intermediate genotype showed 5 and 11% decreases in soluble sugar content and the sensitive genotype showed 11 and 20% decreases in soluble sugar under low N and N deficiency, respectively, compared to normal N.

3.5. Antioxidant Enzyme Activities and Lipid Peroxidation

The peroxidase (POD) activity of the sensitive genotype was significantly higher than that of the tolerant genotype (Figure 3a). The tolerant genotype showed a 3% increase in POD activity under low N and a 3.6% increase under N deficiency compared to normal N. The sensitive genotype showed a 1.5% increase under low N and a 16% decrease under N deficiency. Superoxide dismutase (SOD) activity was increased with N deficiency (Figure 3b). The SOD activity of the tolerant genotype showed a 4% increase under N deficiency. The intermediate genotype showed 7.5 and 9.9% increases in SOD activity and the sensitive genotype showed 6.5 and 7% increases in SOD activity under low N and N deficiency, respectively, compared to normal N.
The malondialdehyde (MDA) content of the tolerant genotype was not affected by different N conditions (Figure 3c). The MDA content of the intermediate and sensitive genotypes increased with N deficiency. The intermediate genotype showed 5.9 and 16% increases in SOD activity and the sensitive genotype showed 12.9 and 61% increases in SOD activity under low N and N deficiency, respectively, compared to normal N.

3.6. Nitrogen-Metabolizing Enzymes

Nitrate reductase (NR) activity under normal N was higher than under low N and was least under N deficient conditions (Figure 4a). The tolerant genotype showed 3 and 7% decreases, the intermediate genotype showed 11 and 20% decreases, and the sensitive genotype showed 19 and 40% decreases in NR activity under low N and N deficiency, respectively, compared to normal N.
Glutamine synthetase (GS) and glutamate synthase (GOGAT) activities were lesser at low N and N deficient conditions compared to normal N (Figure 4b,c). The tolerant genotype showed 2 and 4% decreases, the intermediate genotype showed 5 and 11% decreases, and the sensitive genotype showed 8.5 and 15% decreases in GS activity under low N and N deficiency, respectively, compared to normal N. Similarly, the GOGAT activity of the tolerant genotype was reduced by 3.9 and 4.7% under low N and N deficiency, respectively, compared to normal N. The intermediate genotype showed 6.9 and 16% decreases in GOGAT activity under low N and N deficiency, respectively, compared to normal N. The sensitive genotype showed 14.9 and 24% decreases in GOGAT activity under low N and N deficiency, respectively, compared to normal N.

3.7. Chlorophyll Fluorescence

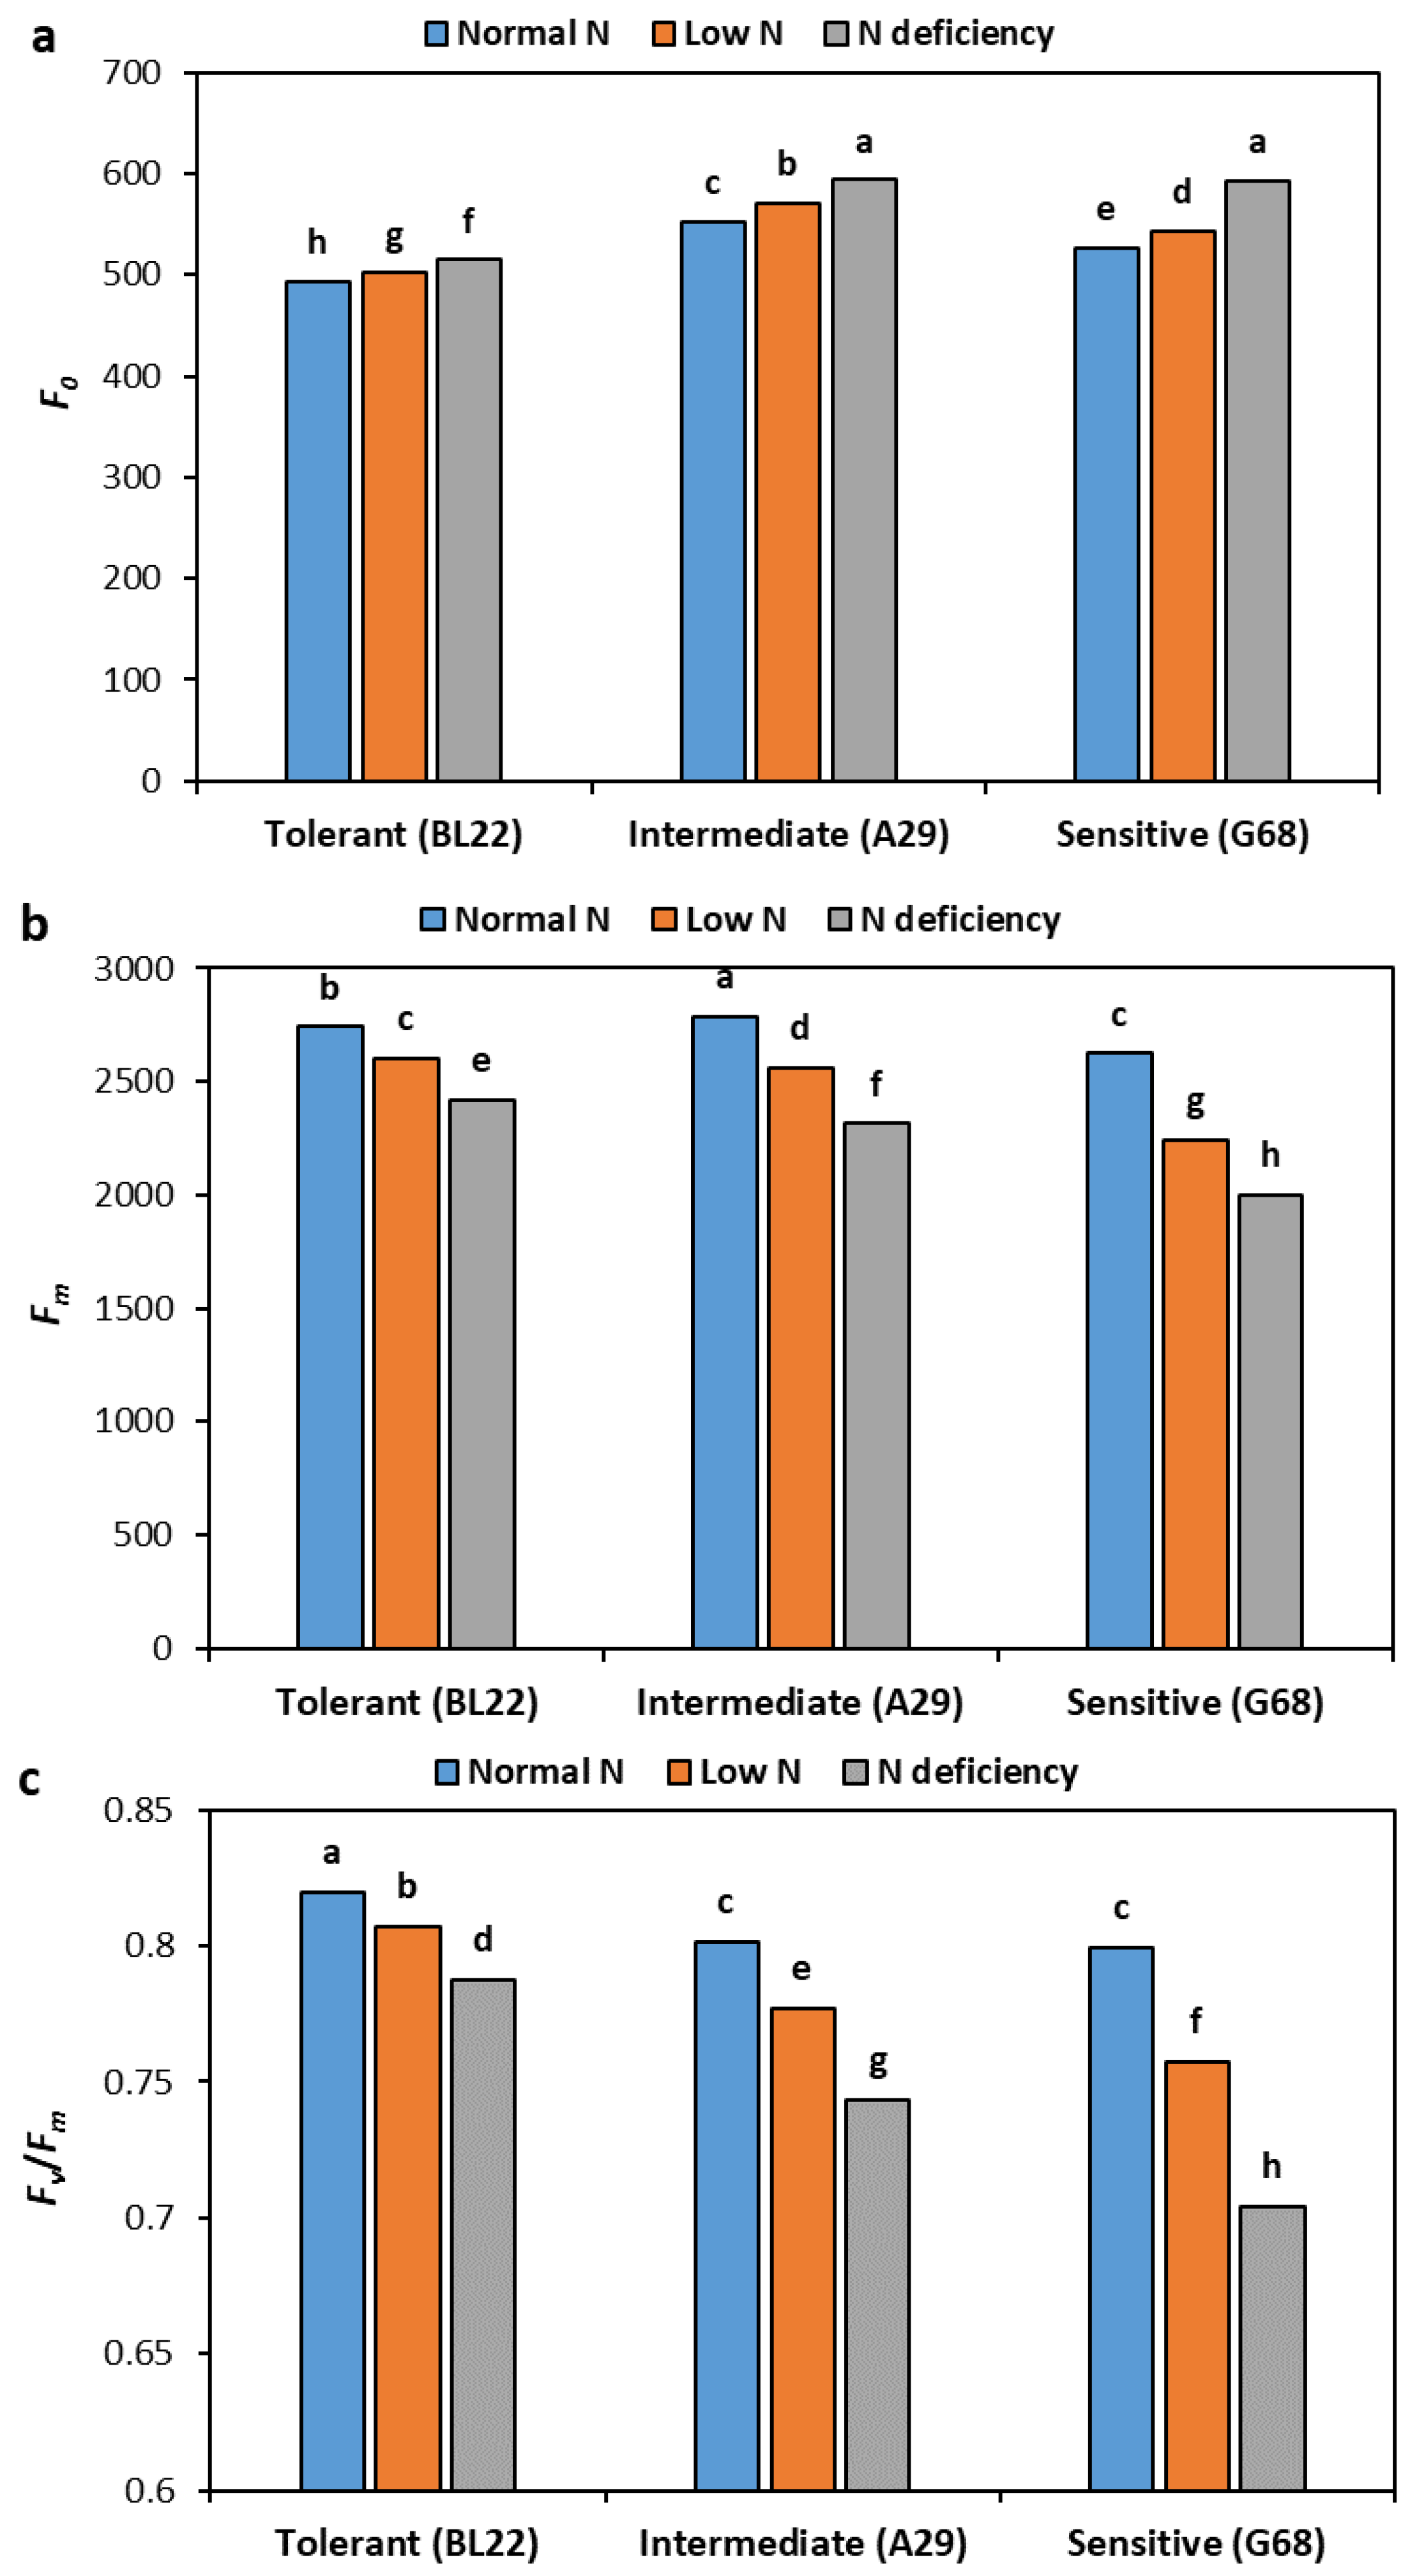
The minimum fluorescence (F0) was increased while maximum fluorescence (Fm) and maximum efficiency of photosystem II (Fv/Fm) were decreased under low N and N deficiency compared to normal N (Figure 5). The F0 values of the sensitive and intermediate genotypes were higher than that of the tolerant genotype. The reduction in Fm and Fv/Fm under low N and N deficient conditions was greater in sensitive and intermediate genotypes than in tolerant genotypes. The Fv/Fm of the tolerant genotype was reduced by 1.6 and 4% under low N and N deficiency, respectively, compared to normal N. The intermediate genotype showed 3 and 7.3% reduction and the sensitive genotype showed 5 and 12% reduction in Fv/Fm under low N and N deficiency, respectively, compared to normal N.

3.8. Nitrogen Accumulation, Nitrogen Content, and Use Efficiency

The nitrogen accumulation and N content of the tolerant and sensitive genotypes were greater than in the intermediate genotype (Figure 6a,b). Moreover, N accumulation and N contents were reduced under low N and N deficiency and more reduction was observed in the sensitive genotype, followed by the intermediate genotype, and lastly the tolerant genotype. The reduction in N content was 4.3 and 4.6% in the tolerant genotype, 9.7 and 11.5% in the intermediate genotype, and 18 and 29% in the sensitive genotype under low N and N deficiency, respectively, compared to normal N. Under normal N, N utilization efficiency was highest for the intermediate genotype and lowest for the sensitive genotype (Figure 6c). Under low N and N deficiency, the intermediate and sensitive genotypes had higher N utilization efficiency than the tolerant genotype. The N utilization efficiency of the sensitive genotype was increased by decreasing N concentration, from normal N to low N and N deficiency.

3.9. Principal Component Analysis

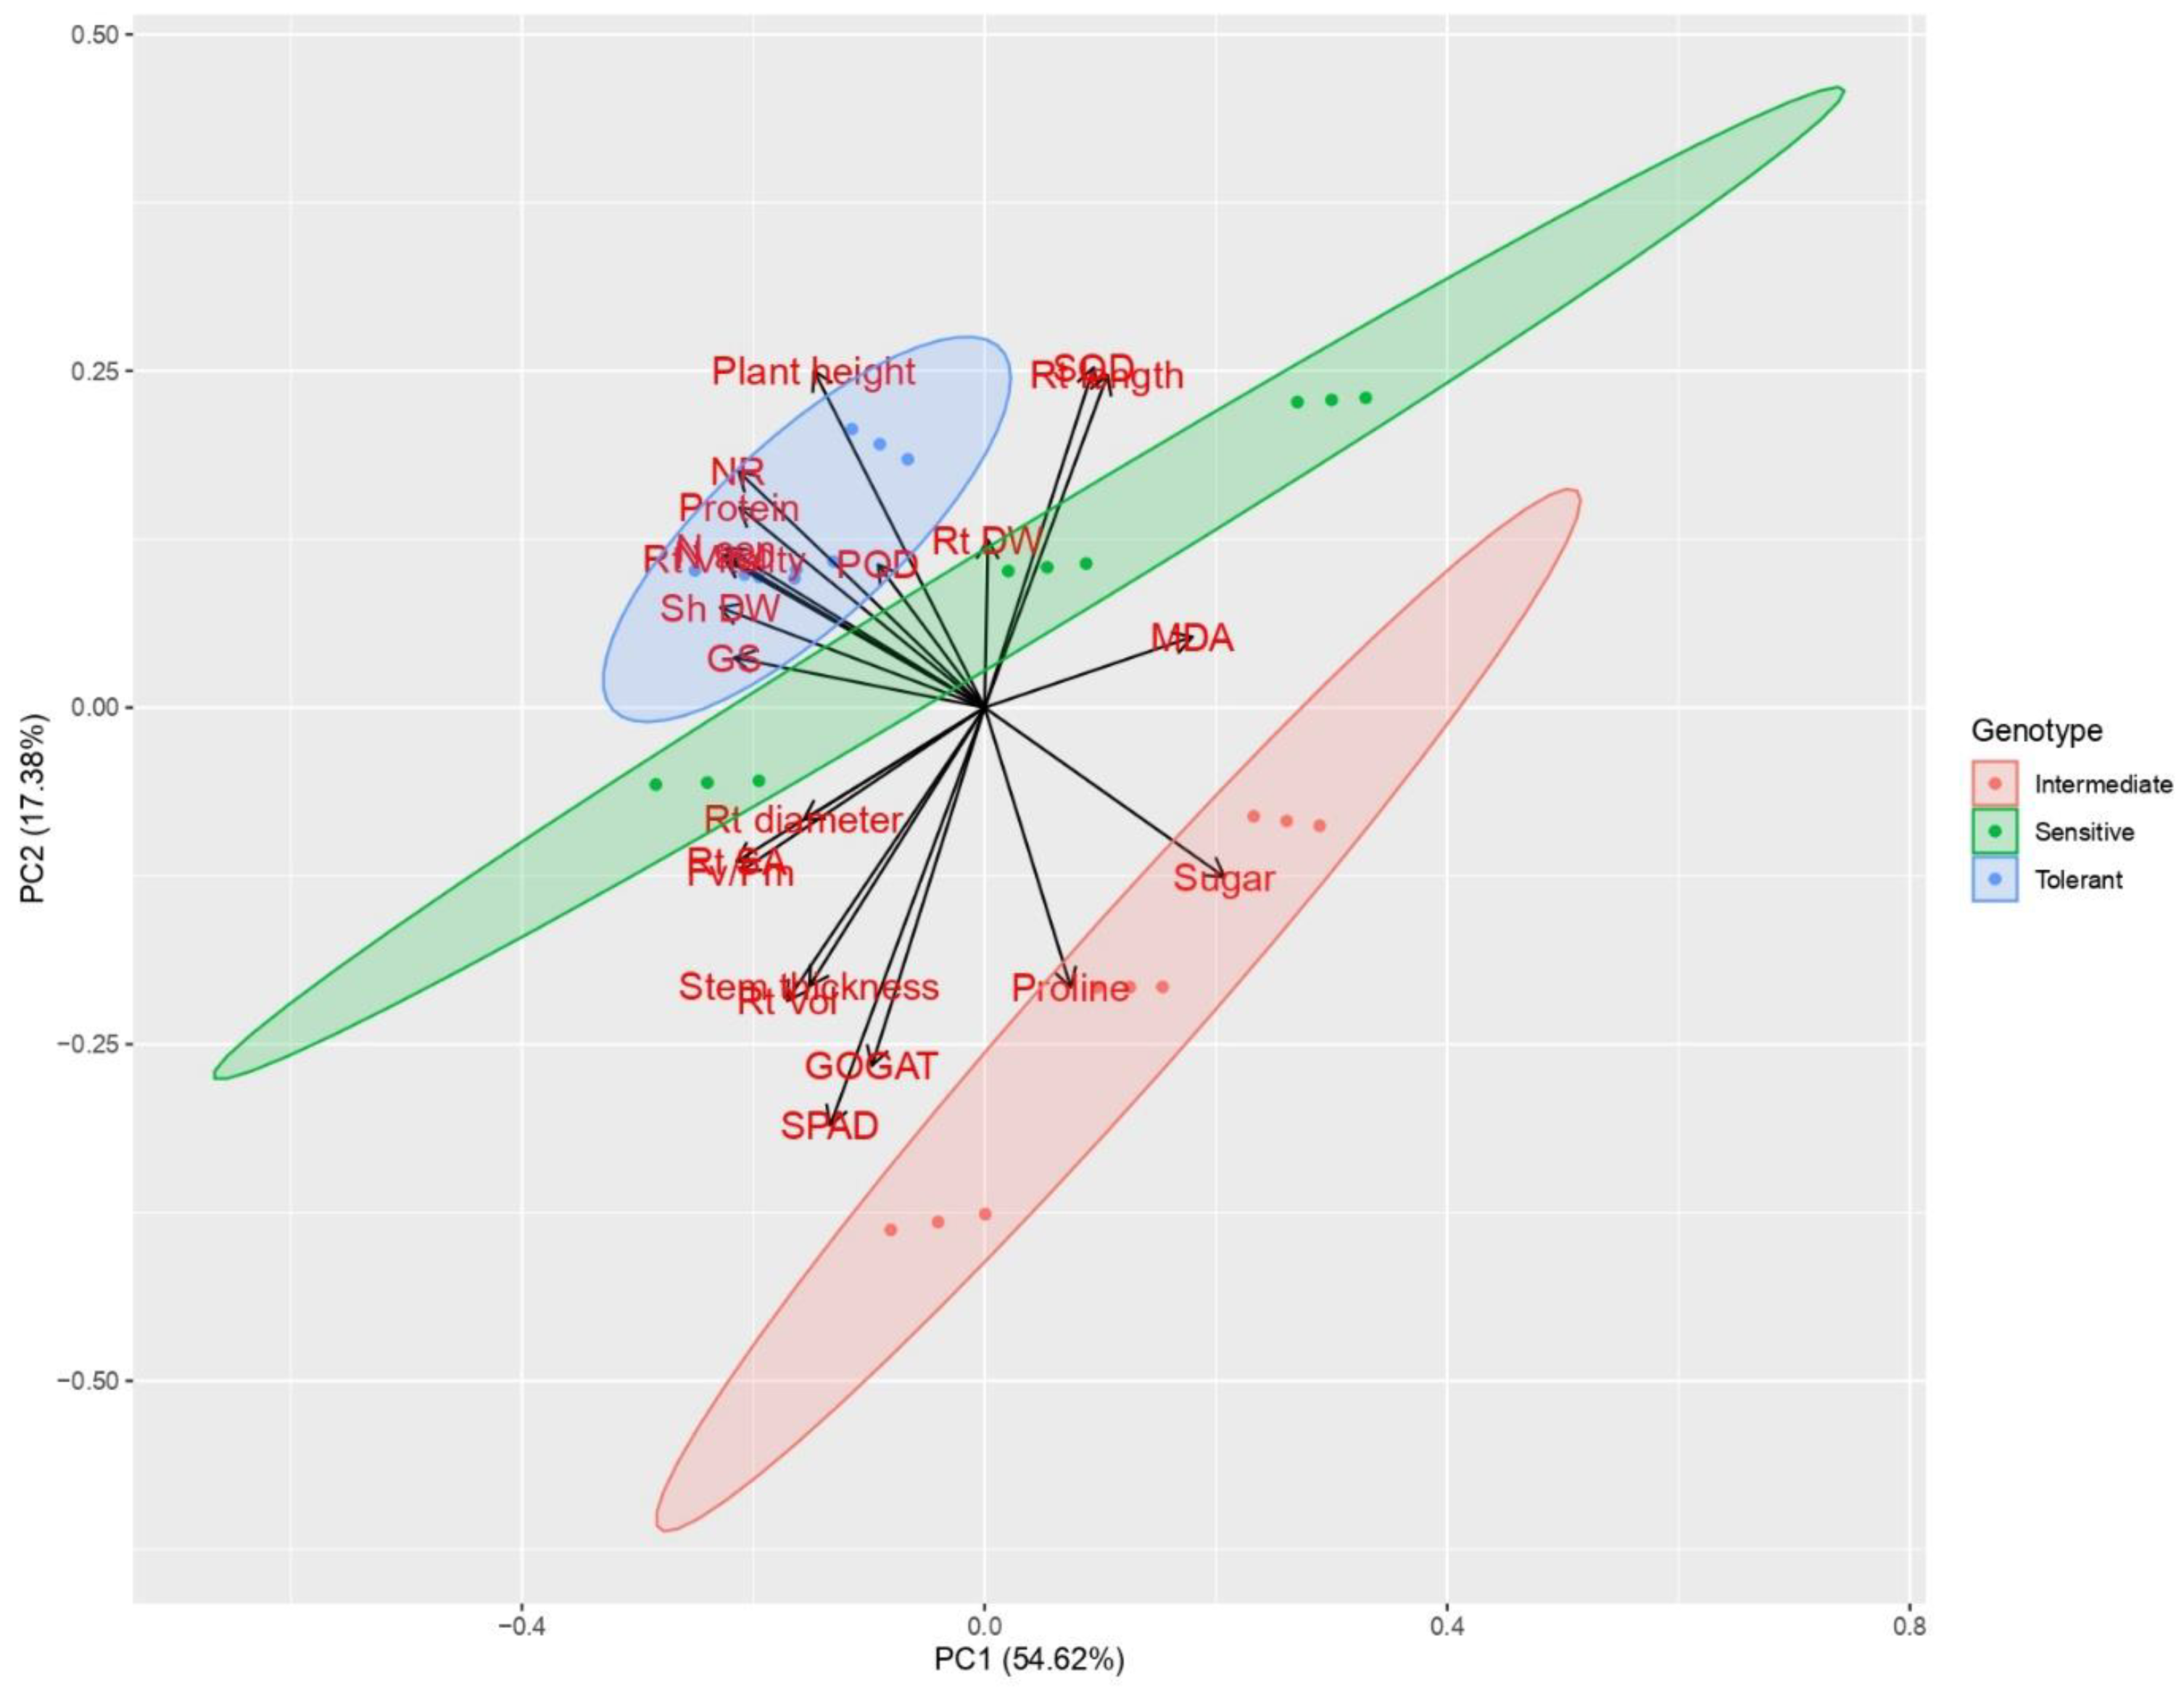
PC1 accounts for 54.6% of the total variance, while PC2 explains 17.4% of the variance (Figure 7). Therefore, these two components combined explain 72% of the variance in the variables. Interestingly, plant height exhibited an inverse relationship with sugar and proline levels. On the other hand, root length showed a positive correlation with SOD activity but displayed negative associations with SPAD, root volume, stem thickness, and GOGAT. Protein content, NR activity, root vitality, and shoot dry biomass were closely interconnected and exhibited negative correlations with sugar content. Additionally, root diameter, root surface area, and Fv/Fm showed negative associations with MDA levels.

4. Discussion

Quinoa has garnered significant attention in recent years due to its remarkable defenses against various environmental stresses such as salt, alkali, drought, and barren soil. However, limited studies have focused on investigating the differential responses of quinoa genotypes to low nitrogen (N) stress. Different crop species employ specific low-N tolerance markers, and markers for low-N tolerance have been identified in millet [1], rice [10,11], barley [4], and wheat [7]. Nonetheless, only a few studies have reported on the response of different quinoa genotypes to low-N stress [15]. Therefore, there is a need to explore efficient evaluation methods for morphological and physiological indicators in various quinoa genotypes.
The cumulative contribution rate of the 26 measured quinoa indices for the four load factors accounts for 84% of the overall variation. The first factor primarily reflects the activity of nitrate reductase (NR), total N content, N accumulation, soluble protein content, peroxidase (POD) activity, root vitality, and Fv/Fm, indicating that low-N tolerant genotypes possess higher N accumulation capacity, protected enzyme activity, and reduced photoinhibition. The comprehensive value (D) for low-N tolerance exhibited significant variation among genotypes, ranging from 0.204 to 0.835, suggesting that the selected concentration of N for the low-N treatment effectively detected low-N tolerance. Higher D values indicate greater resistance of the genotype to low-N stress, while lower D values indicate increased sensitivity [1]. Based on the D values, we identified genotype BL22 as the most tolerant, genotype A29 as intermediately tolerant, and genotype G68 as the most sensitive to low-N stress.
In all the studied genotypes, nitrogen deficiency resulted in reduced plant height but increased root length. This indicates that, under limited nitrogen conditions, plants allocate more resources towards root development rather than aboveground growth [4]. Interestingly, the sensitive genotype exhibited greater plant height than the tolerant genotype under low nitrogen conditions, despite having lower aboveground dry biomass (shoot + leaves) compared to the tolerant genotype. Previous research by Jiang et al. [32] also highlighted that dry biomass exhibits significant variation among different barley genotypes under low nitrogen, making it a more reliable parameter for assessing low nitrogen tolerance, whereas plant height does not show substantial variation in response to low nitrogen.
Under low nitrogen and nitrogen-deficient conditions, the tolerant genotype maintained the highest aboveground dry biomass and stem diameter, whereas the sensitive genotype displayed the lowest stem diameter. The higher biomass observed in low-nitrogen-tolerant genotypes may be attributed to their ability to maintain photosynthesis at low nitrogen levels, while the sensitive genotype experiences a reduction in photosynthesis rate [33]. Genotypes that naturally grow in low-nitrogen environments and poor soil conditions tend to exhibit greater resistance to changes in nitrogen levels in the soil [15,33].
Root length was found to be longest under nitrogen-deficient conditions and shortest under normal nitrogen levels. This indicates that nitrogen deficiency promotes root elongation. Root architectural traits play a vital role in nutrient absorption, and nitrogen limitation induces root elongation [34]. The low-N sensitive genotype exhibited a greater increase in root length but had the lowest values of root dry weight and root diameter under N deficient conditions. This indicates that the diameter and surface area of the roots in the sensitive genotype did not increase proportionally to the increase in root length. In contrast, the low-N tolerant genotype displayed a smaller increase in root length but showed maximum values of root dry weight, root diameter, and root surface area. This could be attributed to the low-N tolerant genotype’s ability to develop more lateral roots and root thickening. Under N deficiency, the cells in the meristematic regions of the roots become denser, while the cells in the elongation zone become larger and less dense compared to normal N [35].
The presence of longer and thinner roots in sensitive plants under low-N conditions indicates that these plants are likely experiencing stress, potentially due to the limited absorption and assimilation capacity of their root systems [36,37]. Our data on N content reveal that the sensitive genotype has significantly lower N content and N accumulation per plant compared to the tolerant genotype. The higher N content observed in the low-N tolerant genotype may be attributed to its greater N acquisition capacity, likely resulting from a larger root surface area [6,38]. Additionally, under low-N conditions, the activities of NR, GS, and GOGAT enzymes were reduced, with the sensitive genotype displaying a more pronounced decrease compared to the tolerant genotype. The elevated activities of these enzymes in the low-N tolerant genotype indicate its higher capacity for N assimilation [6,37]. Liu et al. [1] also reported higher NR activities in low-N tolerant broomcorn genotypes, while Shah et al. [12] observed higher activities of NR and GS in low-N tolerant barley genotypes. The reduction in enzyme activities in sensitive genotypes may be attributed to the down-regulation of GS and GOGAT genes [9].
Root vitality serves as an indicator of root functionality and can be used to assess the root’s capacity for absorption, synthesis, oxidation, and reduction processes. In this study, both nitrogen deficiency and low nitrogen levels were found to significantly decrease root vitality. This reduced root vitality indicates a decline in root respiration and oxygen consumption rates under nitrogen-deficient conditions [23].
Nitrogen plays a crucial role in the synthesis of macromolecules within cells, including amino acids, proteins, nucleotides, chlorophyll, and enzymes. Our findings reveal a greater reduction in biomass, both aboveground and in terms of root dry weight, in the sensitive genotypes. This could be attributed to lower chlorophyll content, as supported by our results. Shah et al. [12] reported that plants exposed to low nitrogen concentrations (0.2 mmol L–1) exhibited structural disturbances in chloroplasts and other organelles, including swelling and destruction of the thylakoid system, particularly in low-nitrogen-tolerant barley genotypes. A decrease in chlorophyll levels ultimately leads to a reduction in photosynthetic rates. Liu et al. [1] also reported that low nitrogen levels negatively impact photosynthesis by affecting non-stomatal factors, such as reduced CO2 assimilation capacity, disrupted chloroplast structure, and decreased chlorophyll content.
The metrics of chlorophyll fluorescence photochemistry provide early indications of stress. Fv/Fm, a valuable indicator that measures the maximal quantum efficiency of photosystem II (PSII), reveals the impact of low N levels on photoinhibition and chlorophyll damage. Our results demonstrate that low N caused a reduction in Fv/Fm, with the tolerant genotype showing a 1.6% decrease and the sensitive genotype exhibiting a 5% decrease compared to normal N levels. The variation in Fv/Fm among genotypes under low N conditions highlights its effectiveness as a screening tool for assessing low-N tolerance. Genotypes with higher Fv/Fm ratios under stress tended to maintain photosynthetic rates, chlorophyll content, and greater biomass [39].
To understand energy utilization and dissipation in quinoa genotypes, the maximum quantum efficiency was evaluated. N supply significantly influenced maximum fluorescence (Fm) and the maximum efficiency of photosystem II (Fv/Fm), with the sensitive genotype experiencing a greater reduction in Fv/Fm compared to the tolerant genotype.
Antioxidant enzyme activities, soluble sugar, and soluble protein content are important physiological indices in response to stress. Under low-N and N deficiency conditions, soluble protein content decreased, particularly in the low-N sensitive genotype. Similar findings were reported by Bascuñán-Godoy et al. [15], who observed that the tolerant genotype (Faro) of quinoa maintained protein levels comparable to those under high N, while the sensitive genotypes (BO78 and UdeC9) exhibited reduced protein content under low N conditions. Bascuñán-Godoy et al. [15] also reported that N-efficient genotypes could sustain total protein content under low N. Soluble sugar content in the tolerant genotype did not significantly vary under normal N, low N, and N deficiency conditions. POD and SOD activities increased under low-N and N deficiency, likely due to the stress induced by N deficiency. However, the tolerant genotype exhibited a lesser increase in POD and SOD activity compared to the sensitive genotype.

5. Conclusions

Significant genetic differences were observed in the morphological and physiological traits of nine quinoa genotypes when exposed to normal and low N levels, as indicated by the comprehensive evaluation indices. Subsequently, three genotypes, namely the low-N tolerant BL22, intermediately tolerant A29, and low-N sensitive G68, were selected for further investigation under normal-N, low-N, and N deficiency conditions. The collected data revealed noteworthy variations in root and shoot dry biomass, N metabolizing enzymes (NR, GS, and GOGAT activities), chlorophyll content, soluble sugar, soluble protein, Fv/Fm, and nitrogen content between the low-N tolerant and sensitive genotypes. The tolerant genotype exhibited a lesser reduction in dry biomass, root vitality, chlorophyll content, soluble protein, Fv/Fm, NR activity, GS activity, GOGAT activity, N accumulation, and nitrogen content when compared to the low-N sensitive genotype. Conversely, the increase in soluble sugar content and POD activity was comparatively lower in the tolerant genotype than in the sensitive genotype. Based on these findings, it can be concluded that root and shoot dry biomass, N metabolizing enzymes (NR, GS, and GOGAT activities), chlorophyll content, soluble sugar, soluble protein, Fv/Fm, and nitrogen content can serve as reliable indicators for screening low-N tolerance in quinoa genotypes during the early growth stage.

Supplementary Materials

The following supporting information can be downloaded at: https://www.mdpi.com/article/10.3390/agronomy13061597/s1, Table S1: Information of 9 quinoa genotypes.

Author Contributions

Y.D., X.S., Q.Z. and C.W. contributed to the conception and design of the study. Y.D., J.L. and H.G. organized the database. Y.D. performed the statistical analysis. S.A. wrote the first draft of the manuscript. Y.D., L.Q., L.Z. and C.W. wrote sections of the manuscript. All authors have read and agreed to the published version of the manuscript.

Funding

This study was supported by the Research Program Sponsored by the State Key Laboratory of Sustainable Dryland Agriculture (in preparation), Shanxi Agricultural University (202105D121008-3-5), Key Projects of Key R&D plan Shanxi Province (202102140601007), the Science and Technology Innovation Program of Shanxi Universities (2021L174), The central government guides the local science and technology development fund project (YDZJSX2022A045); National Major Talent Engineering Expert Workstation Project; and Academician workstation project support.

Data Availability Statement

The authors agree to share the data files and relevant material.

Conflicts of Interest

The authors declare no conflict of interest.

References

  1. Liu, C.; Gong, X.; Wang, H.; Dang, K.; Deng, X.; Feng, B. Low-nitrogen tolerance comprehensive evaluation and physiological response to nitrogen stress in broomcorn millet (Panicum miliaceum L.) seedling. Plant Physiol. Biochem. 2020, 151, 233–242. [Google Scholar] [CrossRef] [PubMed]
  2. Xin, W.; Zhang, L.; Gao, J.; Zhang, W.; Yi, J.; Zhen, X.; Bi, C.; He, D.; Liu, S.; Zhao, X. Adaptation mechanism of roots to low and high nitrogen revealed by proteomic analysis. Rice 2021, 14, 5. [Google Scholar] [CrossRef] [PubMed]
  3. Broadley, M.; Brown, P.; Cakmak, I.; Rengel, Z.; Zhao, F. Function of Nutrients: Micronutrients. In Marschner's Mineral Nutrition of Higher Plants; Academic Press: Cambridge, MA, USA, 2012; pp. 191–248. [Google Scholar]
  4. Decouard, B.; Bailly, M.; Rigault, M.; Marmagne, A.; Arkoun, M.; Soulay, F.; Caïus, J.; Paysant-Le Roux, C.; Louahlia, S.; Jacquard, C.; et al. Genotypic variation of nitrogen use efficiency and amino acid metabolism in barley. Front. Plant Sci. 2022, 12, 807798. [Google Scholar] [CrossRef] [PubMed]
  5. Giehl, R.F.H.; Gruber, B.D.; von Wirén, N. It’s time to make changes: Modulation of root system architecture by nutrient signals. J. Exp. Bot. 2014, 65, 769–778. [Google Scholar] [CrossRef] [PubMed]
  6. Miao, J.; Shi, F.; Li, W.; Zhong, M.; Li, C.; Chen, S. Comprehensive screening of low nitrogen tolerant maize based on multiple traits at the seedling stage. PeerJ 2022, 10, e14218. [Google Scholar] [CrossRef]
  7. Tyagi, B.S.; Foulkes, J.; Singh, G.; Sareen, S.; Kumar, P.; Broadley, M.; Gupta, V.; Krishnappa, G.; Ojha, A.; Khokhar, J.; et al. Identification of wheat cultivars for low nitrogen tolerance using multivariable screening approaches. Agronomy 2020, 10, 417. [Google Scholar] [CrossRef] [Green Version]
  8. Zaman-Allah, M.; Das, B.; Cairns, J.E.; Vinayan, M.T.; Tarekegne, A.T.; Magorokosho, C.; Zaidi, P.H.; Seetharam, K. Phenotyping for Abiotic Stress Tolerance in Maize Low Nitrogen Stress: A Field Manual; CIMMYT: Harare, Zimbabwe, 2018. [Google Scholar]
  9. Du, Q.G.; Juan, Y.A.N.G.; Sadiq, S.S.M.; Yang, R.X.; Yu, J.J.; Li, W.X. Comparative transcriptome analysis of different nitrogen responses in low-nitrogen sensitive and tolerant maize genotypes. J. Integ. Agric. 2021, 20, 2043–2055. [Google Scholar] [CrossRef]
  10. Sharma, N.; Sinha, V.B.; Gupta, N.; Rajpal, S.; Kuchi, S.; Sitaramam, V.; Parsad, R.; Raghuram, N. Phenotyping for nitrogen use efficiency: Rice genotypes differ in N-responsive germination, oxygen consumption, seed urease activities, root growth, crop duration, and yield at low N. Front. Plant Sci. 2018, 9, 1452. [Google Scholar] [CrossRef]
  11. Ajmera, I.; Henry, A.; Radanielson, A.M.; Klein, S.P.; Ianevski, A.; Bennett, M.J.; Band, L.R.; Lynch, J.P. Integrated root phenotypes for improved rice performance under low nitrogen availability. Plant Cell Environ. 2022, 45, 805–822. [Google Scholar] [CrossRef]
  12. Shah, J.M.; Asgher, Z.; Zeng, J.; Quan, X.; Ali, E.; Shamsi, I.H.; Zhang, G. Growth and physiological characterization of low nitrogen responses in Tibetan wild barley (Hordeum spontaneum) and cultivated barley (Hordeum vulgare). J. Plant Nutr. 2017, 40, 861–868. [Google Scholar] [CrossRef]
  13. Zhang, H.; FU, X.; Wang, X.; Gui, H.; Dong, Q.; Pang, N.; Wang, Z.; Zhang, X.; Song, M. Identification and screening of nitrogen-efficient cotton genotypes under low and normal nitrogen environments at the seedling stage. J. Cotton Res. 2018, 1, 6. [Google Scholar] [CrossRef] [Green Version]
  14. Saudy, H.S.; El–Samad, G.A.A.; El–Temsah, M.E.; El–Gabry, Y.A.E.G. Effect of Iron, Zinc, and Manganese Nano-Form Mixture on the Micronutrient Recovery Efficiency and Seed Yield Response Index of Sesame Genotypes. J. Soil Sci. Plant Nutr. 2022, 22, 732–742. [Google Scholar] [CrossRef]
  15. Bascuñán-Godoy, L.; Sanhueza, C.; Pinto, K.; Cifuentes, L.; Reguera, M.; Briones, V.; Zurita-Silva, A.; Álvarez, R.; Morales, A.; Silva, H. Nitrogen physiology of contrasting genotypes of Chenopodium quinoa Willd. (Amaranthaceae). Sci. Rep. 2018, 8, 17524. [Google Scholar] [CrossRef] [Green Version]
  16. Buchaillot, M.L.; Gracia-Romero, A.; Vergara-Diaz, O.; Zaman-Allah, M.A.; Tarekegne, A.; Cairns, J.E.; Prasanna, B.M.; Araus, J.L.; Kefauver, S.C. Evaluating maize genotype performance under low nitrogen conditions using RGB UAV phenotyping techniques. Sensors 2019, 19, 1815. [Google Scholar] [CrossRef] [PubMed] [Green Version]
  17. Debaeke, P.; Route, P.; Justes, E. Relationship between the normalize SPAD index and the nitrogen nutrition index: Application to durum wheat. J. Plant Nutr. 2006, 29, 75–92. [Google Scholar] [CrossRef]
  18. Choukr-Allah, R.; Rao, N.K.; Hirich, A.; Shahid, M.; Alshankiti, A.; Toderich, K.; Gill, S.; Butt, K.U.R. Quinoa for marginal environments: Toward future food and nutritional security in MENA and Central Asia regions. Front. Plant Sci. 2016, 7, 346. [Google Scholar] [CrossRef] [PubMed] [Green Version]
  19. Yan, D.; Juan-Ling, W.; Anwar, S.; Chuang-Yun, W.; Li, Z.; Li-Guang, Z.; Hong-Xia, G.; Li-Xia, Q.; Hua, L.; Mei-Xia, W. Phenology, lodging and yield traits of Chenopodium quinoa under the effect of planting density and row spacings. Fresenius Environ. Bull. 2021, 30, 11757–11767. [Google Scholar]
  20. Alvar-Beltrán, J.; Verdi, L.; Dalla Marta, A.; Dao, A.; Vivoli, R.; Sanou, J.; Orlandini, S. The effect of heat stress on quinoa (cv. Titicaca) under controlled climatic conditions. J. Agric. Sci. 2020, 158, 255–261. [Google Scholar] [CrossRef]
  21. Geren, H. Effects of different nitrogen levels on the grain yield and some yield components of quinoa (Chenopodium quinoa Willd.) under Mediterranean climatic conditions. Turk. J. Field Crops 2015, 20, 59–64. [Google Scholar] [CrossRef] [Green Version]
  22. Deng, Y.; Zhao, L.; Anwar, S.; Zhang, L.G.; Shafiq, F.; Guo, H.X.; Qin, L.X.; Wang, M.X.; Wang, C.Y. Phosphorus fertigation conferred lodging tolerance and improved grain quality in Chenopodium quinoa via enhanced root proliferation and stalk strength. J. Soil Sci. Plant Nutr. 2022, 22, 5099–5110. [Google Scholar] [CrossRef]
  23. Li, L.; Li, Q.; Davis, K.E.; Patterson, C.; Oo, S.; Liu, W.; Liu, J.; Wang, G.; Fontana, J.E.; Thornburg, T.E.; et al. Response of root growth and development to nitrogen and potassium deficiency as well as microRNA-mediated mechanism in peanut (Arachis hypogaea L.). Front. Plant Sci. 2021, 12, 695234. [Google Scholar] [CrossRef] [PubMed]
  24. Yemm, E.W.; Willis, A. The estimation of carbohydrates in plant extracts by anthrone. Biochem. J. 1954, 57, 508. [Google Scholar] [CrossRef] [PubMed] [Green Version]
  25. Ku, H.K.; Lim, H.M.; Oh, K.H.; Yang, H.J.; Jeong, J.S.; Kim, S.K. Interpretation of protein quantitation using the Bradford assay: Comparison with two calculation models. Anal. Biochem. 2013, 434, 178–180. [Google Scholar] [CrossRef] [PubMed]
  26. Rajan, K. Analytical Techniques in Biochemistry and Molecular Biology; (No. PA572. 0724 R16.); Springer: Berlin/Heidelberg, Germany, 2011; p. 180. [Google Scholar]
  27. Gillikin, J.W.; Graham, J.S. Purification and developmental analysis of the major anionic peroxidase from the seed coat of Glycine max. Plant Physiol. 1991, 96, 214–220. [Google Scholar] [CrossRef] [Green Version]
  28. Buege, J.A.; Aust, S.D. Microsomal Lipid Peroxidation. Methods Enzymol. 1978, 52, 302–310. [Google Scholar] [CrossRef]
  29. Bremner, J.M.; Edwards, A.P. Determination and isotope-ratio analysis of different forms of nitrogen in soils: I. Apparatus and procedure for distillation and determination of ammonium. Soil Sci. Soc. Am. J. 1965, 29, 504–507. [Google Scholar] [CrossRef]
  30. Siddiqi, M.Y.; Glass, A.D.M. Utilization index: A modified approach to the estimation and comparison of nutrient utilization efficiency in plants. J. Plant Nutr. 1981, 4, 289–302. [Google Scholar] [CrossRef]
  31. Dong, G.; Chen, C.; Wu, G. A Method of Determining Membership Function in Fuzzy Comprehensive Evaluation. In Emerging Trends in Intelligent and Interactive Systems and Applications, Proceedings of the 5th International Conference on Intelligent, Interactive Systems and Applications (IISA2020), Shanghai, China, 25–27 September 2020; Springer International Publishing: Berlin/Heidelberg, Germany, 2021; pp. 39–46. [Google Scholar]
  32. Jiang, Q.; Chen, Z.; Liu, C.; He, T.; Guo, G.; Gao, R.; Xu, H.; Li, Y.; Lu, R.; Huang, J. Screening and identification indices of low-nitrogen tolerance for barley landraces at seedling stage. Acta Agric. Boreali Sin. 2019, 34, 148–155. [Google Scholar]
  33. Berti, M.; Wilckens, R.; Hevia, F.; Serri, H.; Vidal, I.; Mendez, C. Nitrogen fertilization in quinoa (Chenopodium quinoa Willd). Fertilizacion nitrogenada en quinoa (Chenopodium quinoa Willd). Cien. Investig. Agrar. 2000, 27, 81–90. [Google Scholar] [CrossRef]
  34. Sinclair, T.R.; Vadez, V. Physiological traits for crop yield improvement in low N and P environments. Plant Soil 2002, 245, 1–15. [Google Scholar] [CrossRef]
  35. Jia, Z.; von Wirén, N. Signaling pathways underlying nitrogen-dependent changes in root system architecture: From model to crop species. J. Exp. Bot. 2020, 71, 4393–4404. [Google Scholar] [CrossRef] [PubMed]
  36. Saudy, H.S.; Mohamed El–Metwally, I. Effect of Irrigation, Nitrogen Sources, and Metribuzin on Performance of Maize and Its Weeds. Commun Soil. Sci. Plant Anal. 2023, 54, 22–35. [Google Scholar] [CrossRef]
  37. Lutze, J.L.; Gifford, R.M. Acquisition and allocation of carbon and nitrogen by Danthonia richardsonii in response to restricted nitrogen supply and CO2 enrichment. Plant Cell Environ. 1998, 21, 1133–1141. [Google Scholar] [CrossRef]
  38. Ye, X.; Hong, J.; Shi, L.; Xu, F. Adaptability mechanism of nitrogen-efficient germplasm of natural variation to low nitrogen stress in Brassica napus. J. Plant Nutr. 2010, 33, 2028–2040. [Google Scholar] [CrossRef]
  39. Sharma, D.K.; Andersen, S.B.; Ottosen, C.O.; Rosenqvist, E. Wheat cultivars selected for high Fv/Fm under heat stress maintain high photosynthesis, total chlorophyll, stomatal conductance, transpiration and dry matter. Physiol. Plant 2015, 153, 284–298. [Google Scholar] [CrossRef]
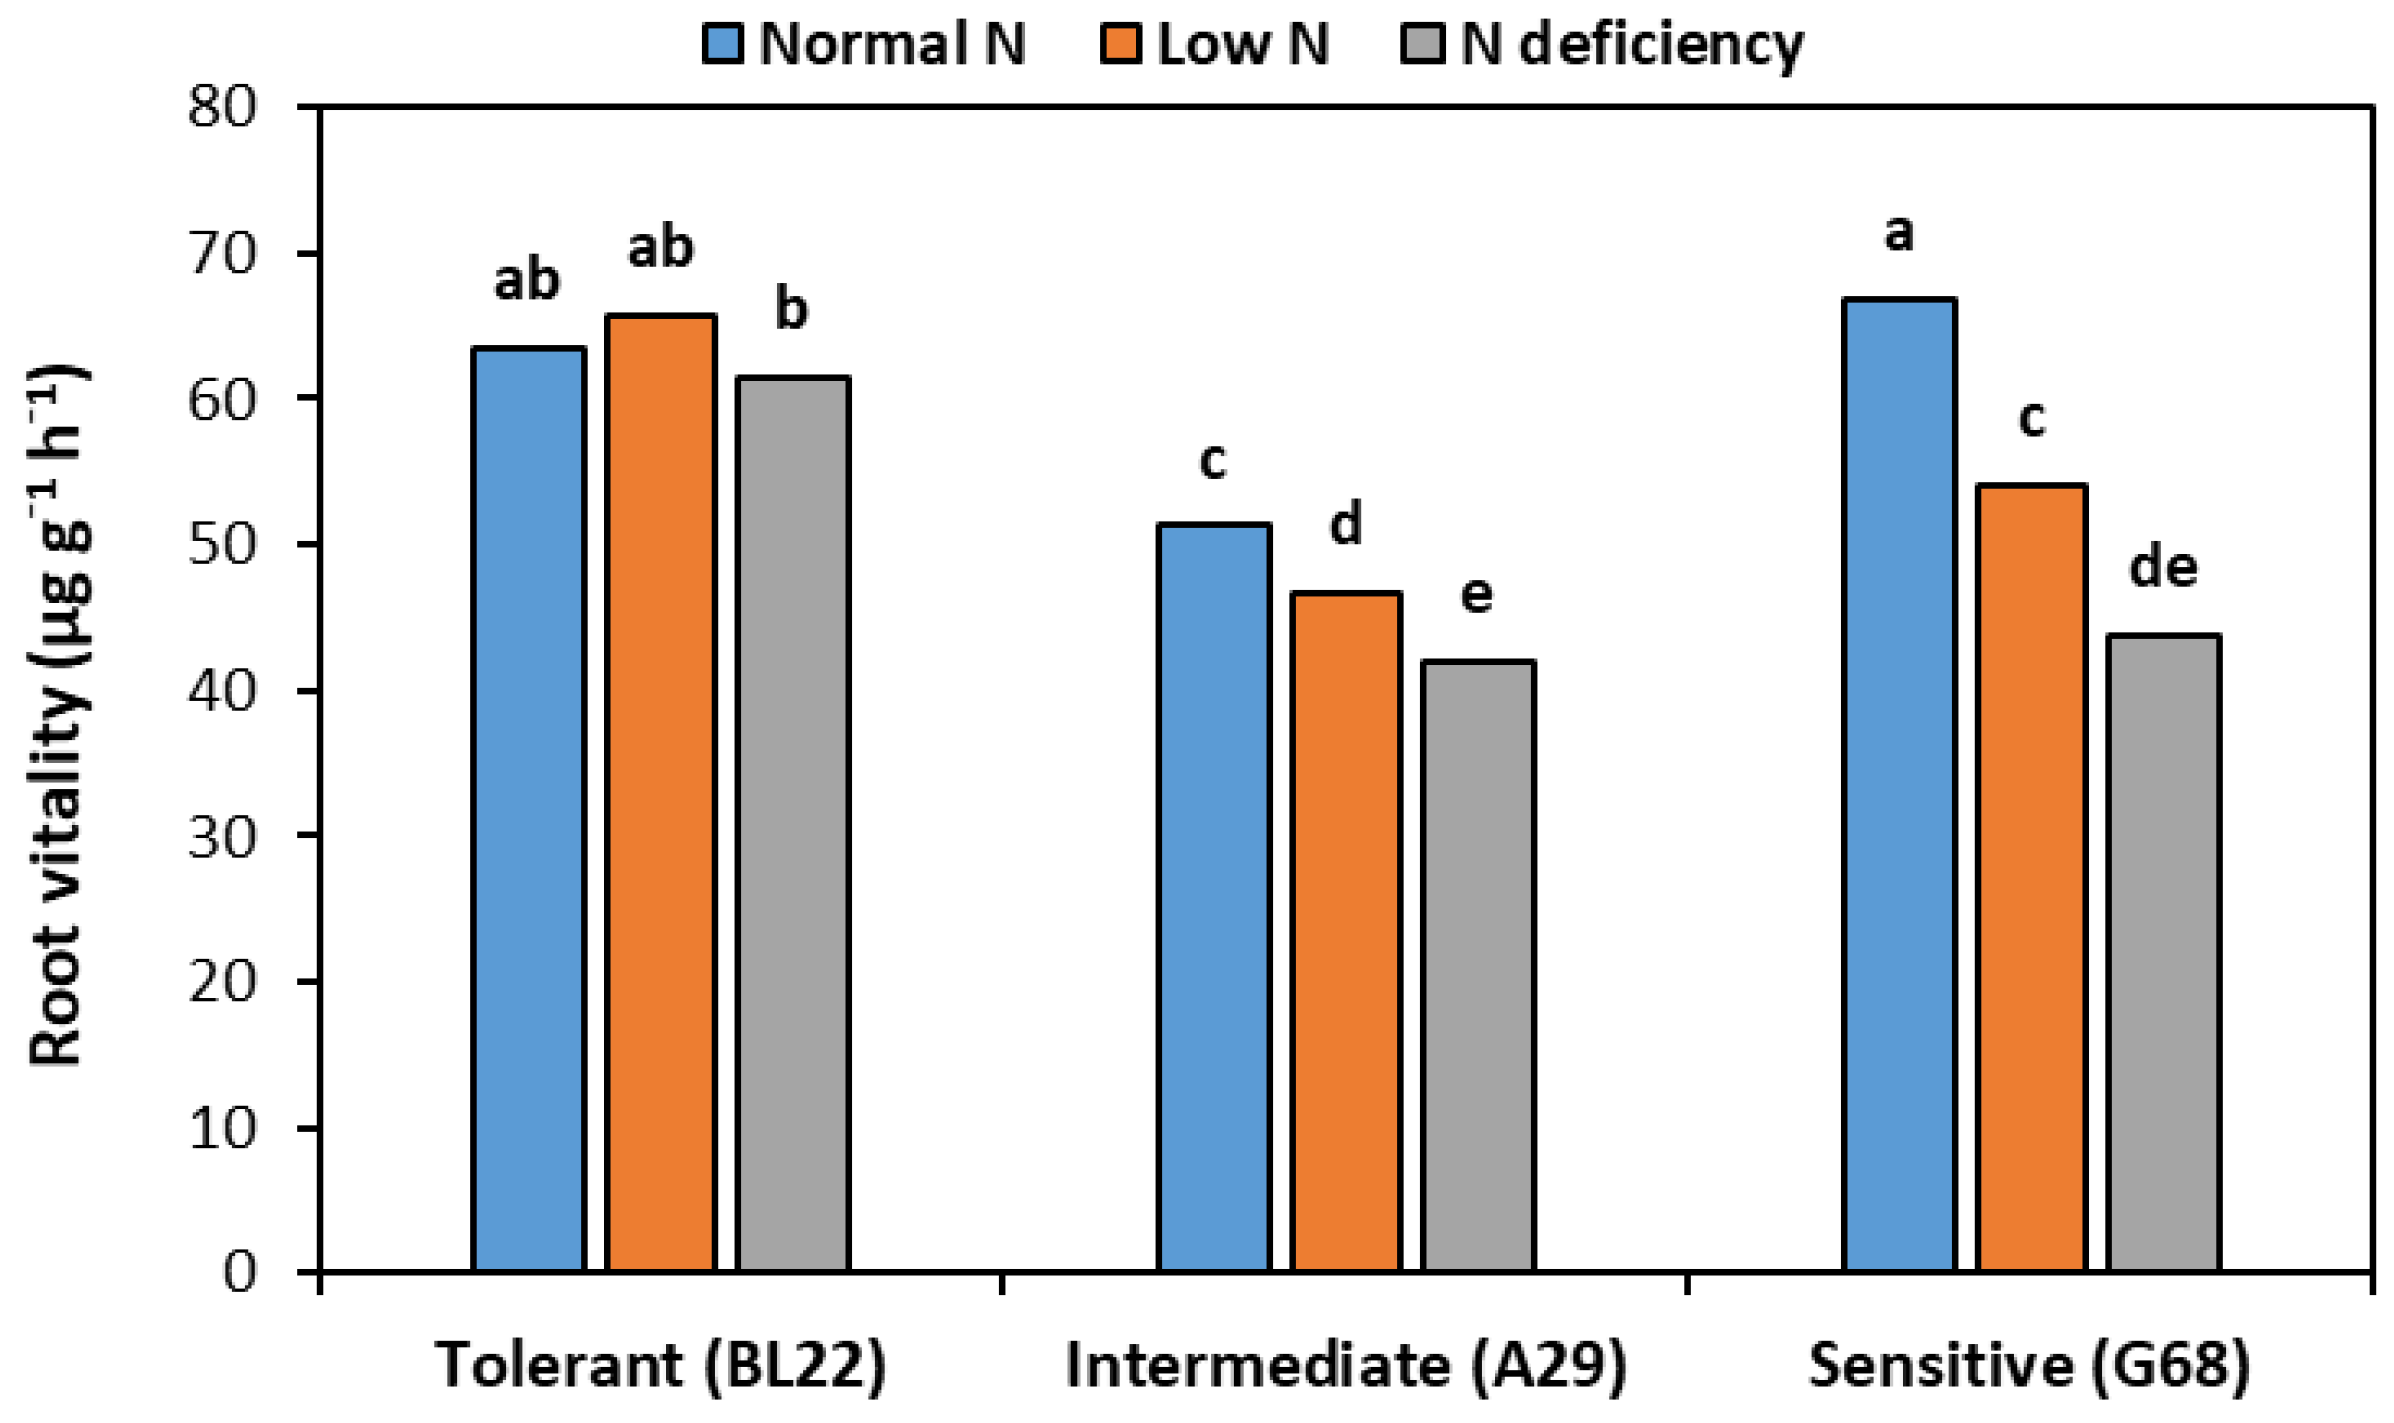
Figure 1. Root and shoot dry weight ratio and root vitality of three quinoa genotypes. Different letters on bars (mean, n = 3) indicate statistical differences between treatments (p  ≤  0.05).
Agronomy 13 01597 g001
Figure 2. The chlorophyll (SPAD value) (a), proline (b), soluble sugar (c), and soluble protein contents (d) of the tolerant, intermediate, and sensitive genotypes under normal N, low N, and N deficiency. Bars are means (n = 3). Different letters indicate statistical differences between treatments (p  ≤  0.05).
Agronomy 13 01597 g002aAgronomy 13 01597 g002b
Figure 3. The peroxidase activity (a), superoxide dismutase activity (b), and malondialdehyde content (c) of the tolerant, intermediate, and sensitive genotypes under normal N, low N, and N deficiency. Bars are means (n = 3). Different letters indicate statistical differences between treatments (p  ≤  0.05).
Agronomy 13 01597 g003
Figure 4. Nitrate reductase (NR) (a), glutamine synthetase (GS) (b), and glutamate synthase (GOGAT) (c) of the tolerant, intermediate, and sensitive genotypes under normal N, low N, and N deficiency. Bars are means (n = 3). Different letters indicate statistical differences between treatments (p  ≤  0.05).
Agronomy 13 01597 g004
Figure 5. Minimum fluorescence (F0) (a), maximum fluorescence (Fm) (b), and maximum efficiency of photosystem II (Fv/Fm) (c) of the tolerant, intermediate, and sensitive genotypes under normal N, low N, and N deficiency. Bars are means (n = 3). Different letters indicate statistical differences between treatments (p  ≤  0.05).
Agronomy 13 01597 g005
Figure 6. Nitrogen content (a), N accumulation (b), and N utilization efficiency (c) of the tolerant, intermediate, and sensitive genotypes under normal N, low N, and N deficiency. Bars are means (n = 3). Different letters indicate statistical differences between treatments (p  ≤  0.05).
Agronomy 13 01597 g006
Figure 7. Principal component analysis of morphological and physiological traits of three quinoa genotypes. MDA: malondialdehyde; Sh DW: shoot dry weight; Rt: root; NR: nitrate reductase; POD: peroxidase; SOD: superoxide dismutase; GS: glutamine synthetase; GOGAT: glutamate synthase; Rt Vit: root vitality.
Agronomy 13 01597 g007
Table 1. The loading factor and cumulative contribution rate of each comprehensive index.
IndexFactor 1Factor 2Factor 3Factor 4
Soluble protein content0.711−0.2880.243−0.382
Soluble sugar content−0.837−0.133−0.2960.393
MDA content−0.8690.4190.1140.16
NR activity0.930−0.095−0.157−0.176
Proline content0.7170.412−0.3470.01
POD activity0.8030.476−0.325−0.03
SOD activity0.4030.826−0.260.19
Root vitality0.757−0.167−0.548−0.207
GS activity0.6180.3260.395−0.285
GOGT activity0.085−0.8530.2960.315
Plant height0.507−0.1260.5980.531
Stem thickness0.4940.4680.5790.239
SPAD0.523−0.0760.7480.188
F0−0.839−0.185−0.151−0.425
Fm0.3040.3430.489−0.698
Fv/Fm0.8150.4060.3620.029
Maximum root length−0.850.0790.0210.359
Average root diameter−0.274−0.9270.169−0.073
Root surface area0.3660.37−0.4250.567
Root volume0.578−0.388−0.2770.145
Root dry weight−0.9030.219−0.078−0.253
Stem and leaf dry weight0.244−0.196−0.3−0.415
Root-to-shoot ratio−0.8560.2890.1110.042
Total nitrogen content0.886−0.285−0.1490.176
Nitrogen accumulation0.910−0.312−0.2040.085
Nitrogen use efficiency−0.8780.2910.196−0.188
Cumulative contribution rate47.46365.9175.97683.959
MDA: malondialdehyde; NR: nitrate reductase; POD: peroxidase; SOD: superoxide dismutase; GS: glutamine synthetase; GOGAT: glutamate synthase; F0: minimum fluorescence; Fm: maximum fluorescence; Fv/Fm: maximum efficiency of photosystem II.
Table 2. Comprehensive index value weight, D-value, and sorting of quinoa genotypes.
Quinoa GenotypesFAC1FAC2FAC3FAC4D-ValueSorting
HL580.043−0.166−2.285−1.0870.4137
G68−1.492−1.8380.2580.5640.2049
A290.0270.316−0.0390.9440.6155
G360.0921.3610.548−0.7170.6554
BL230.5−0.638−0.065−0.4340.5926
A86−1.6550.9950.747−0.6380.3248
HL930.914−0.4460.751−0.9140.6992
BL770.1910.901−0.7571.8690.6823
BL221.38−0.4830.8420.4130.8351
Weights0.5580.1940.140.108
Table 3. Morphological traits of three quinoa varieties under normal N, low N, and deficient N conditions.
N LevelsLow N Tolerance (Varieties)Plant Height (cm)Stem Diameter (mm)Aboveground (Stem + Leaves) DW (g)Root DW (g)Maximum Root Length (cm)Root Diameter (mm)Root Surface AreaRoot Volume
Normal N-24.83 a5.61 a1.44 a0.197 c11.02 c0.250 a46.93 a0.548 a
Low N-20.65 b5.43 b1.37 b0.201 b11.27 b0.237 b44.74 b0.523 b
N deficiency-19.74 c5.26 c1.28 c0.211 a11.56 a0.228 c42.54 c0.506 c
-Tolerant (BL22)22.85 b5.60 a1.48 a0.217 a11.25 b0.263 a45.72 a0.525 ab
-Intermediate (A29)15.93 c5.55 b1.27 c0.203 b11.15 c0.241 b44.09 b0.528 a
-Sensitive (G68)24.09 a5.14 c1.34 b0.188 c11.44 a0.212 c44.40 b0.524 b
Interaction
Normal NTolerant (BL22)23.49 b5.68 b1.50 a0.218 a11.24 d0.270 a46.33 b0.537 c
Intermediate (A29)17.12 f5.75 a1.35 d0.197 d10.82 g0.256 c46.76 b0.549 b
Sensitive (G68)26.84 a5.40 d1.47 b0.175 f10.99 f0.225 e47.69 a0.559 a
Low NTolerant (BL22)22.79 c5.61 b1.49 ab0.212 b11.12 de0.260 b46.33 b0.522 de
Intermediate (A29)15.51 g5.52 c1.29 e0.202 c11.10 ef0.239 d43.97 c0.523 d
Sensitive (G68)23.66 b5.16 e1.34 d0.188 e11.59 b0.212 f43.91 c0.523 d
N deficiencyTolerant (BL22)22.27 d5.52 c1.45 c0.221 a11.39 c0.258 bc44.49 c0.515 ef
Intermediate (A29)15.17 g5.39 d1.18 g0.211 b11.54 b0.228 e41.54 d0.513 f
Sensitive (G68)21.78 e4.87 f1.21 f0.201 c11.73 a0.199 g41.59 d0.489 g
ANOVAVarieties4318.2 ***358.1 ***828.2 ***815.0 ***32.9 ***1481.7 ***59.9 ***3.72 *
(F-value)N levels437.0 ***176.0 ***489.1 ***204.2 ***115.0 ***279.2 ***387.3 ***262.0 ***
Var × N levels79.7 ***17.0 ***67.0 ***52.3 ***23.6 ***16.14 ***40.3 ***28.6 ***
DW: dry weight; * and *** indicate significant differences at 0.01 and 0.001 probability levels, respectively. Different alphabets after mean value indicate significant differences among means at p ≤ 0.05 from Tukey HSD test.
Disclaimer/Publisher’s Note: The statements, opinions and data contained in all publications are solely those of the individual author(s) and contributor(s) and not of MDPI and/or the editor(s). MDPI and/or the editor(s) disclaim responsibility for any injury to people or property resulting from any ideas, methods, instructions or products referred to in the content.