Article

Arbuscular Mycorrhizal Fungi and Diazotrophic Diversity and Community Composition Responses to Soybean Genotypes from Different Maturity Groups

1
College of Grassland Agriculture, Northwest A&F University, Yangling 712100, China
2
Baoji Academy of Agricultural Sciences Miscellaneous Grain Institute, Baoji 721000, China
*
Author to whom correspondence should be addressed.
Agronomy 2023, 13(7), 1713; https://doi.org/10.3390/agronomy13071713
Submission received: 19 May 2023 / Revised: 8 June 2023 / Accepted: 24 June 2023 / Published: 26 June 2023
(This article belongs to the Special Issue Advances in Stress Biology of Forage and Turfgrass)

Abstract

:
Soybeans can simultaneously form tripartite symbiotic associations with arbuscular mycorrhizal fungi (AMF) and diazotrophs. However, no studies have explored whether soybean genotypes differing in their maturity groups (MGs) may have implications for the recruitment of rhizosphere soil AMF and diazotrophs. We investigated the diversity and community compositions of AMF and diazotrophs in three soybean genotypes differing in their maturity groups (MG) using high-throughput sequencing. The soybean MGs were MG1.4, MG2.2, and MG3.8, representing early, standard, and late maturity, respectively, for the study region. Soil chemical properties and yield-related traits were determined, and co-occurrence network patterns and drivers were also analyzed. The results obtained demonstrated that AMF richness and diversity were relatively stable in the three soybean genotypes, but noticeable differences were observed in diazotrophs, with late maturity being significantly higher than early maturity. However, there were differences in AMF and diazotrophic composition among different MG genotypes, and the changes in the proportion of dominant species in the community were necessarily related to MG genotypes. Co-occurrence network analysis showed that the positive correlation between AMF and diazotrophs gradually decreased in earlier MG genotypes than in the other later MG genotypes. The results of the structural equation model analysis showed that soil organic carbon, AMF, diversity of soil nutrients, and extracellular enzyme activities were important factors driving soybean yield change, with organic carbon accounting for more than 80% of the pathways analyzed. These results suggest that soybean genotype selection based on MG plays an important role in recruiting both AMF and diazotrophic communities, and in comparison to AMF, diazotrophs are more responsive to the different MG genotypes.

1. Introduction

Soybean (Glycine max L.) is an annual dicotyledonous crop belonging to the Fabaceae family, and it is economically cultivated throughout the world and is an important oilseed and protein crop due to its high productivity, profitability, and significant role in crop rotations and the soil nitrogen (N) cycle [1,2,3]. Among the soil microbes, arbuscular mycorrhizal fungi (AMF) and diazotrophs are important functional microbes for transporting P and water to their host by external hyphal networks [4,5] and sustaining soil quality through N2 fixation [6], respectively.
The majority of legumes, such as soybean, can simultaneously form a tripartite symbiosis with AMF and diazotrophs, which play a key role in complementary resource efficiency, rhizospheric soil processes, and productivity in the context of more sustainable, low-input agricultural cropping systems [4,7,8]. The accumulated experimental and observational evidence shows that the interaction of these three entities can have synergistic effects on the growth and development of soybean. For example, coinoculation with Glomus and Bradyrhizobium significantly increased soybean yield and growth under the limitation of multiple nutrients [7] or under drought stress conditions [9] by increasing the uptake of N and P and diminishing the inhibitory effect of drought stress on cell development.
Soybean yield is jointly determined by various production factors, including the selection of genotypes, the planting date, and soil and weather conditions [10]. Soybean genotypes are typically classified by their relative maturity group (MG) (i.e., length of the period from planting to physiological maturity) based on photoperiod and temperature requirements [11,12,13]. Consequently, agronomic decisions such as the manipulation of optimum soybean maturity have been recognized as specific strategies for maintaining yield advantage in relay-cropping systems and rotations by increasing agricultural land use productivity and potential soil nitrogen (N) sources [13].
Although soybean forms tripartite interactions with AMF and diazotrophs and both symbionts can synergistically act to sustain growth, the successful establishment of tripartite mutualism is complicated, and any synergistic effects are highly context [14]. However, there is still a limited understanding of AMF and diazotrophic diversity and community composition responses to soybean genotypes from different MGs. Moreover, how the interaction between two microbial symbionts involves different MG genotypes is also unclear.
The diversity and composition of AMF and diazotrophic communities are increasingly recognized as important factors in the regulation of community stability and ecosystem functioning [8,15]. Nitrogenase is composed of two multisubunit metalloproteins encoded by three genes, nifD, nifK, and nifH, of which nifH is highly conserved across the bacterial and archaeal domains [6]; consequently, the functional gene nifH is the prevailing marker gene used to determine how the rhizosphere diazotrophic community responds to contrasting soybean genotypes [1,16]. Simultaneously, high-throughput sequencing of the 16S rRNA gene fragment represents a common approach for reliably enhancing the exploratory analysis of the AMF community structure and diversity in soybean [14,15]. Unfortunately, few field studies have been carried out to comprehensively assess the response of AMF and diazotrophic communities to different MG genotypes under natural field conditions. A better understanding of the AMF and diazotrophic communities in the soybean rhizosphere and the factors that influence them will provide important information about a process for introducing them into agricultural systems to improve soil fertility [9].
Both AMF and diazotrophic symbionts are entirely dependent on the supply of carbohydrates from aboveground plants; estimates indicate that up to 20% of the C fixed during plant photosynthesis is released into arbuscular mycorrhizal (AM) symbionts [17] and up to 30% the host photosynthates are released into rhizobia [18], implying that C acts as an important trigger for symbiotic functioning [19,20]. In addition to specific habitat host requirements [21] and environmental factors [22], the coexisting networks of AMF and diazotrophs are also strongly affected by microbe-microbe linkages and interactions [21,23,24], which might indicate competition for C resources [21]. There is emerging evidence that the potential composition of microbial communities or the interaction between microorganisms and host plants can be identified and visualized through co-occurrence network analysis [25]. Therefore, a deeper and more comprehensive understanding of the cooccurrence networks of AMF and diazotrophic communities has been applied to better understand microbial interactions and their responses to environmental changes, as well as to identify key species [22,23]. However, knowledge is lacking in terms of how AMF and diazotrophic interactions respond to different MG genotypes and to what extent these complex interkingdom interactions affect microbiome dynamics and the soil nutrient cycle.
In this study, AMF and diazotrophs were selected as two groups of key functional microbes in soybean rhizosphere soil to investigate the changes in diversity and community structure in three soybean genotypes differing in MGs that represented early, standard, and late maturity for the study region. We hypothesized that (1) AMF and diazotrophs would exhibit generally similar relationships in the three soybean genotypes differing in MGs and (2) the co-occurrence patterns of AMF and diazotrophs and key species would distinctly vary among the three soybean genotypes differing in MGs. The novelty of this study is that direct sampling was conducted at the same time to determine the best scenario for focusing on the impact of maturity on symbionts by preventing the confounding influence of environmental factors. These findings therefore provide new insights into plant–microbe interactions and linkages of AMF and diazotrophs for application in rhizosphere microbiome engineering to improve primary productivity in agroecosystems.

2. Materials and Methods

2.1. Site Description and Sample Collection

The sampling site for this experiment was located at the Liujia Plateau Experimental Base, Qishan County, Baoji Institute of Agricultural Science, Shaanxi Province (34°27′ N, 107°39′ E), with an elevation of 669.6 m, an average annual temperature of 12 °C, an average annual precipitation of 628.8 mm, a soil pH of approximately 8.2, and a clay loam soil type. The seeds of 17 soybean genotypes belonging to different MGs were mechanically sown on 18 June 2021, at a sowing density of 0.40 m between rows and 0.133 m between plants, with 30 plants per square metre, three plots per cultivar, and 15 m2 per plot. A ternary compound fertilizer (N:P:K= 1:1:1) was applied at 0.56 kg per plot on 15 June. Artificial tillage were carried out once on 2 July, and the weeds in the field were manually pulled on 30 July. On 6 August, the whole spraying irrigation was performed once. Furthermore, cyhalothrin and thiamethoxam were sprayed for insect control every half a month, which was on 24 July, 1 August, and 16 August.
The three soybean genotypes (representing three soybean MGs) selected were Yundou 202, Shengdou 24, and Luodou 6, representing early (MG1.4), standard (MG2.2), and late (MG3.8) maturing groups, respectively, for the HuangHuaiHai valley region. Each genotype belongs to only one MG, and genotypes are nested within MGs and become a factor [26]. In this study, soybean was harvested on October 1, when MG1.4 had reached physiological maturity and gradually wilted. MG2.2 was in the physiological maturation stage, while MG3.8 was not yet reached. Soybean plant height, node and pod numbers, number of main stem segments, number of grains per plant and hundred-grain weight for each plant were recorded from six plants per plot taken from the middle two rows in the field. The aboveground parts of the soybeans were dried and mechanically threshed for yield calculation. All soybean seed samples were dried in a forced air oven at 80 °C to constant weight before weighing for yield and quality determination.
Soybeans were excavated from each plot for microbiological analysis and further soil sample processing. Nine intact soybean plants were randomly and gently removed from each plot by digging around the group to keep the root system as intact as possible. The loosely adhered soils were removed by vigorous shaking, and then the soils adhering to the root were collected with a brush. Three soil samples were collected from each plot and combined to form a composite sample. Each sample was immediately sieved through a 4 mm mesh and stored at 4 °C until returned to the laboratory. The soil samples were divided into two parts: one part was stored at −80 °C for DNA extraction and microbiological analysis, and the other part was stored at 4 °C for soil physical and chemical analysis.

2.2. Soil Physical and Chemical Analysis

Fresh soil samples were air dried at room temperature in unsealed plastic storage bags until the soil reached a constant weight. The organic C content of the soil was determined using the K2CrO7-H2SO4 oxidation method. The total N content of the soil was determined using H2SO4 for air-dried soils, and the total phosphorus content was determined using a continuous flow analyzer (AA3, SEAL, Germany) using H2SO4 and HClO4 after decoction. Microbial C (MBC), microbial N (MBN), and microbial P (MBP) contents in the soil were determined by the chloroform fumigation leaching method. Sucrase (SC) activity in the soil was determined with the involvement of 3,5-dinitrosalicylic acid, urease (UA) activity was measured by the colorimetric method, and alkaline phosphatase activity was determined by the colorimetric method with disodium phenyl phosphate. All chemical property measurements were performed according to the method recorded by Bao [27].

2.3. DNA Extraction, Library Preparation, and Sequencing Data Processing

After nucleic acid extraction of the collected soil samples using the OMEGA Soil DNA Kit (D5625-01) (Omega Bio-Tek, Norcross, GA, USA), the quality and quantity of DNA were determined using a spectrophotometer (NanoDrop ND-2000, NanoDrop Technologies, Wilmington, DE, USA). Then, the DNA was purified by 2% agarose gel electrophoresis. The primers AMV4.5NF (5′-AAGCTCGTAGTTGAATTTCG-3′) and AMDGR (5′-CCCAACTATCCCTATTAATCAT-3′) [28] were used to amplify 16S rRNA from the DNA samples. The PCR-amplified components included 0.25 μL Q5 high-fidelity DNA polymerase, 5 μL 5* rReaction Bbuffer, 5 μL 5* Hhigh GC bBuffer, 2 μL dNsoil total P (10 mM), 2 μL template DNA, 1 μL forward primer, 1 μL reverse primer, and 8.75 μL water. PCR amplicons were purified with Vazyme VAHTSTM DNA Clean Beads (Vazyme, Nanjing, China) and quantified using a Quant-iT PicoGreen dsDNA Detection Kit (Invitrogen, Carlsbad, CA, USA). The obtained products were sent to Shanghai Paisano Biotechnology Co., Ltd., (Shanghai, China) for paired-end sequencing using the Illumina MiSeq (2 × 250 bp) platform.
The demultiplexing of raw sequence data was performed in QIIME2 2019.4 [29] using the Demux plugin, followed by primer cleavage using the CutAdapt plugin [30]. The sequences were then quality filtered, denoised, and merged, and chimeras were removed using the DADA2 plugin [31]. Nonsingleton amplicon sequence variants (ASVs) were aligned with MAFFT [32]. The Classify-Sklearn Naève Bayes Taxonomy classifier in the Feature-Classifier Plugin [33] was used according to the Unite Release 8.0 (Fungal) database [34] to assign taxonomy to ASVs.
The nifH functional gene was sequenced in the same way as the AMF above using the primers PolyF (5′-TGCGAYCCSAARGCBGACTC-3′) and PolyR (5′-ATSGCCATCATYTCRCCGGA-3′) [35]. Sequence analysis was performed with QIIME2 2019.4 [29] using the Demux plug-in for the demultiplexing of raw sequence data, followed by primer cleavage using the CutAdapt plug-in [30]. Sequences were then merged, quality filtered, and deserialized using VSearch Plugen. Chimeras were removed at a 98% unique sequence ratio, and 97% of the remaining nonchimeric sequences were reassembled to obtain OTU representation sequences and OTU tables. Nonunique amplicon sequence variants (OTUs) were aligned with MAFFT [32].
Sequence analysis was mainly performed by the R package in QIIME2. The Chao 1 richness estimator, observed species, Shannon diversity index, and Simpson index were calculated and presented in box plots using the amplicon sequence variant/operational taxonomic unit (ASV/OTU) tables in QIIME2. Beta diversity was calculated using Jaccard Metrics [36], Bray–Curtis Metrics [37], and UNIFRAC distance mMetrics [38,39,40] for β-diversity analysis and visualized by principal coordinate analysis (PCoA). Venn diagrams were generated using the R package “VennDiagram” to visualize shared and unique ASVs between samples or groups based on the occurrence of ASVs in the samples/groups regardless of their relative abundance [40].

2.4. Data Analysis

Data on environmental variables are presented as the means and standard errors (SEs). The analysis was performed using IBM SPSS Statistics 25 software with one-way ANOVA. Significance analysis was performed with Duncan’s post hoc multiple comparisons (p < 0.05). Graphs for this section were constructed using Origin 2021b with Microsoft Excel 2019. The Mantel test was used to determine the correlation between AMF and nifH and environmental variable factors. The data were analyzed and plotted using the “dplyr” package in R3.6.2.
The ASV/OTU abundance table obtained in the previous analysis was processed using a sparse (rarefaction) approach, in which a certain number of sequences were randomly and separately selected from each sample to reach a uniform depth to predict the ASVs/OTUs and their relative abundance that could be observed for individual samples at that sequencing depth [41,42]. Only 95% of the ASVs/OTUs were retained for subsequent analysis in this process. The species correlation matrix was generated using the “psych” package in R and imported into Gephi 0.9.4 for visualization.
Because of the small sample size used in this experiment, PLS-PM was used to reveal the interaction between explicit and latent variables to analyze the range of impacts of biological and environmental variables on yield [43]. After constructing an initial PLS-PM structural equation using the “plspm” package in R [44] to remove variables with loadings <0.7, the final PLS-PM structural equation with the remaining variables was run [45].

3. Results

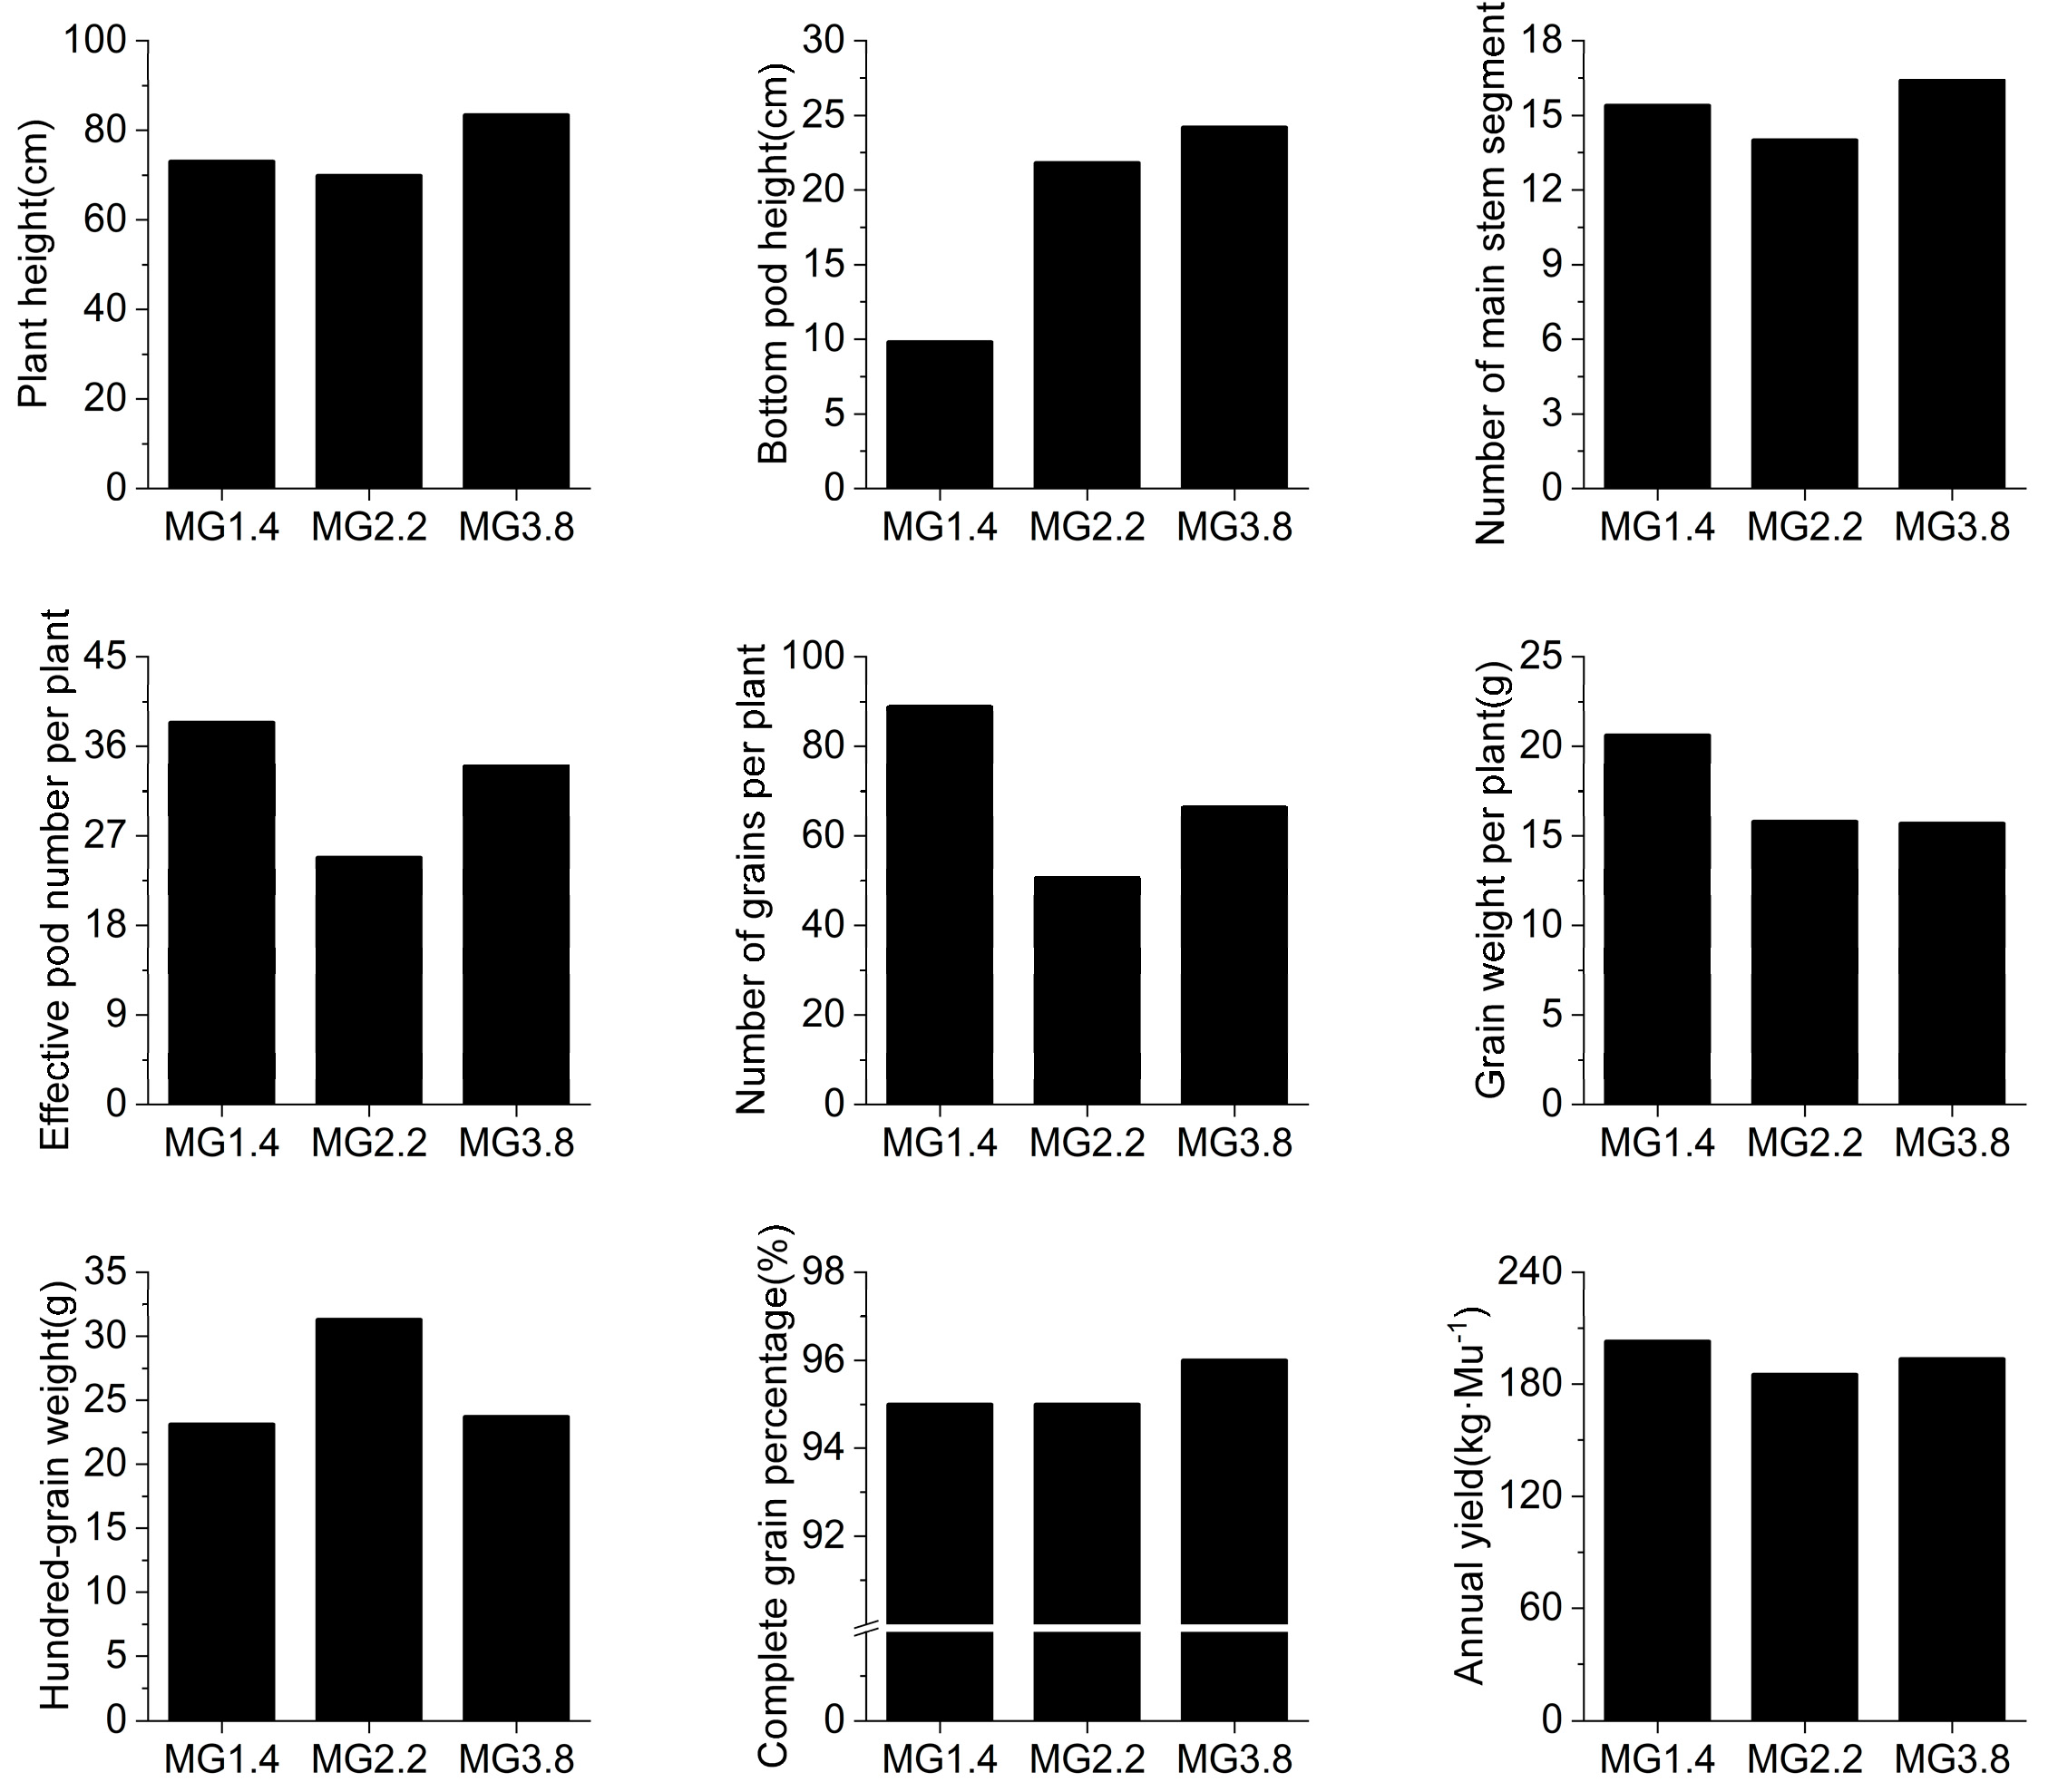
3.1. Physiological and Soil Chemical Indexes of Soybean

Differences in the nutrient content and enzyme activities of the rhizosphere soil among the different MG genotypes were found. The SOC content in the MG1.4 genotype was significantly higher than that in the other two genotypes (Table 1). The soil total N content reached its highest value in the MG1.4 genotype, and the minimum value occurred in the MG3.8 genotype; there was no significant difference in the total P content of the rhizosphere soil among the different MG genotypes (Table 1). In this experiment, no significant differences were found in MBC, MBN, and MBP. Sucrase activity was significantly lower (p < 0.05) in MG1.4 than in the other two genotypes and reached its maximum value in MG3.8 soybean; the MG2.2 and MG3.8 genotypes had the highest and lowest values of urease activity, respectively (Table 1). There was no significant difference in the alkaline phosphatase activities among the different MG genotypes (Table 1). The abovementioned results suggested that genotype selection based on MG may have an effect on the nutrient content as well as the enzyme activities of rhizosphere soil. MG3.8 had the highest plant height and the largest grain weight per plant. The bottom pod height was MG1.4 < MG2.2 < MG3.8, and the complete grain rate was the opposite. The number of major stem segments and yield were similar among the three MG genotypes. The effective pod number and grain weight per plant were the highest in MG1.4 and the lowest in MG2.2. MG2.2 had the highest hundred grain weight (Figure A1).

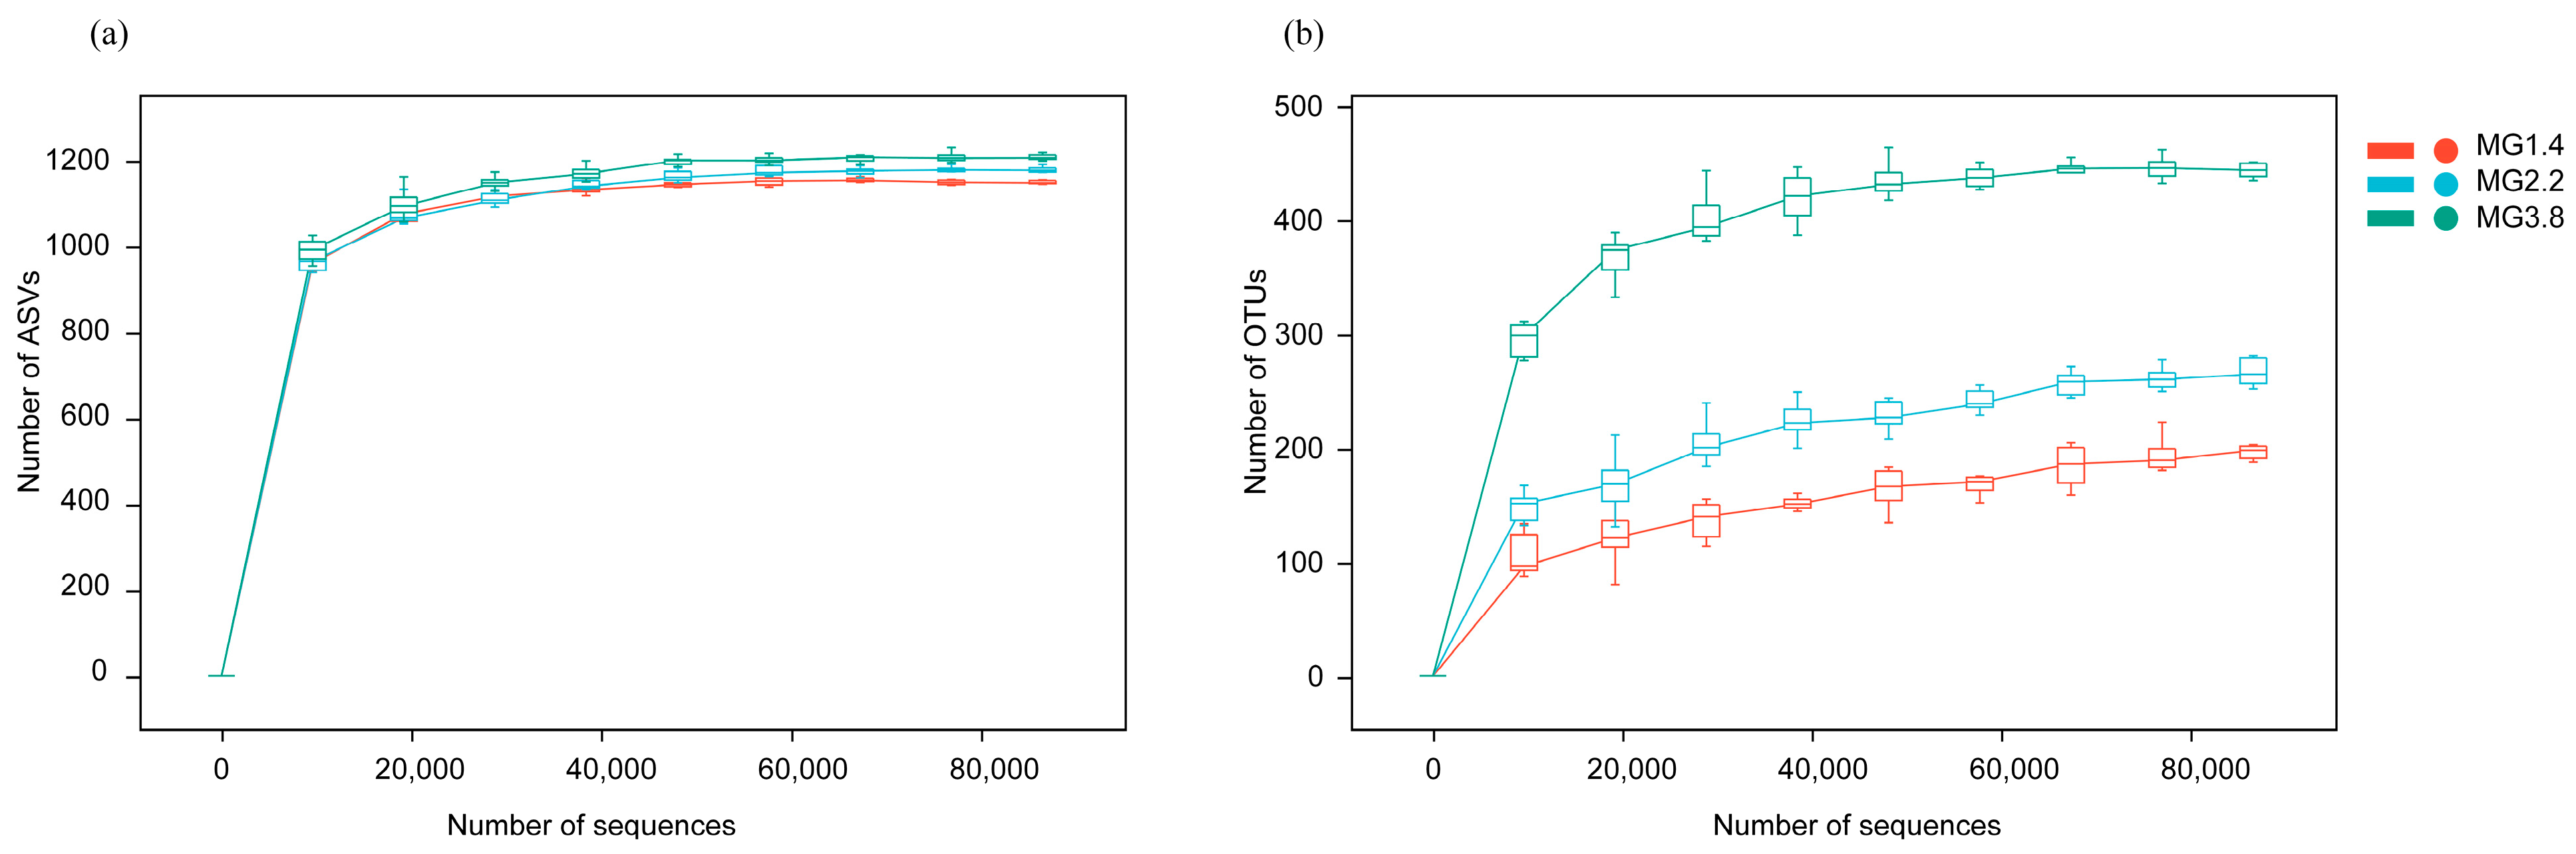
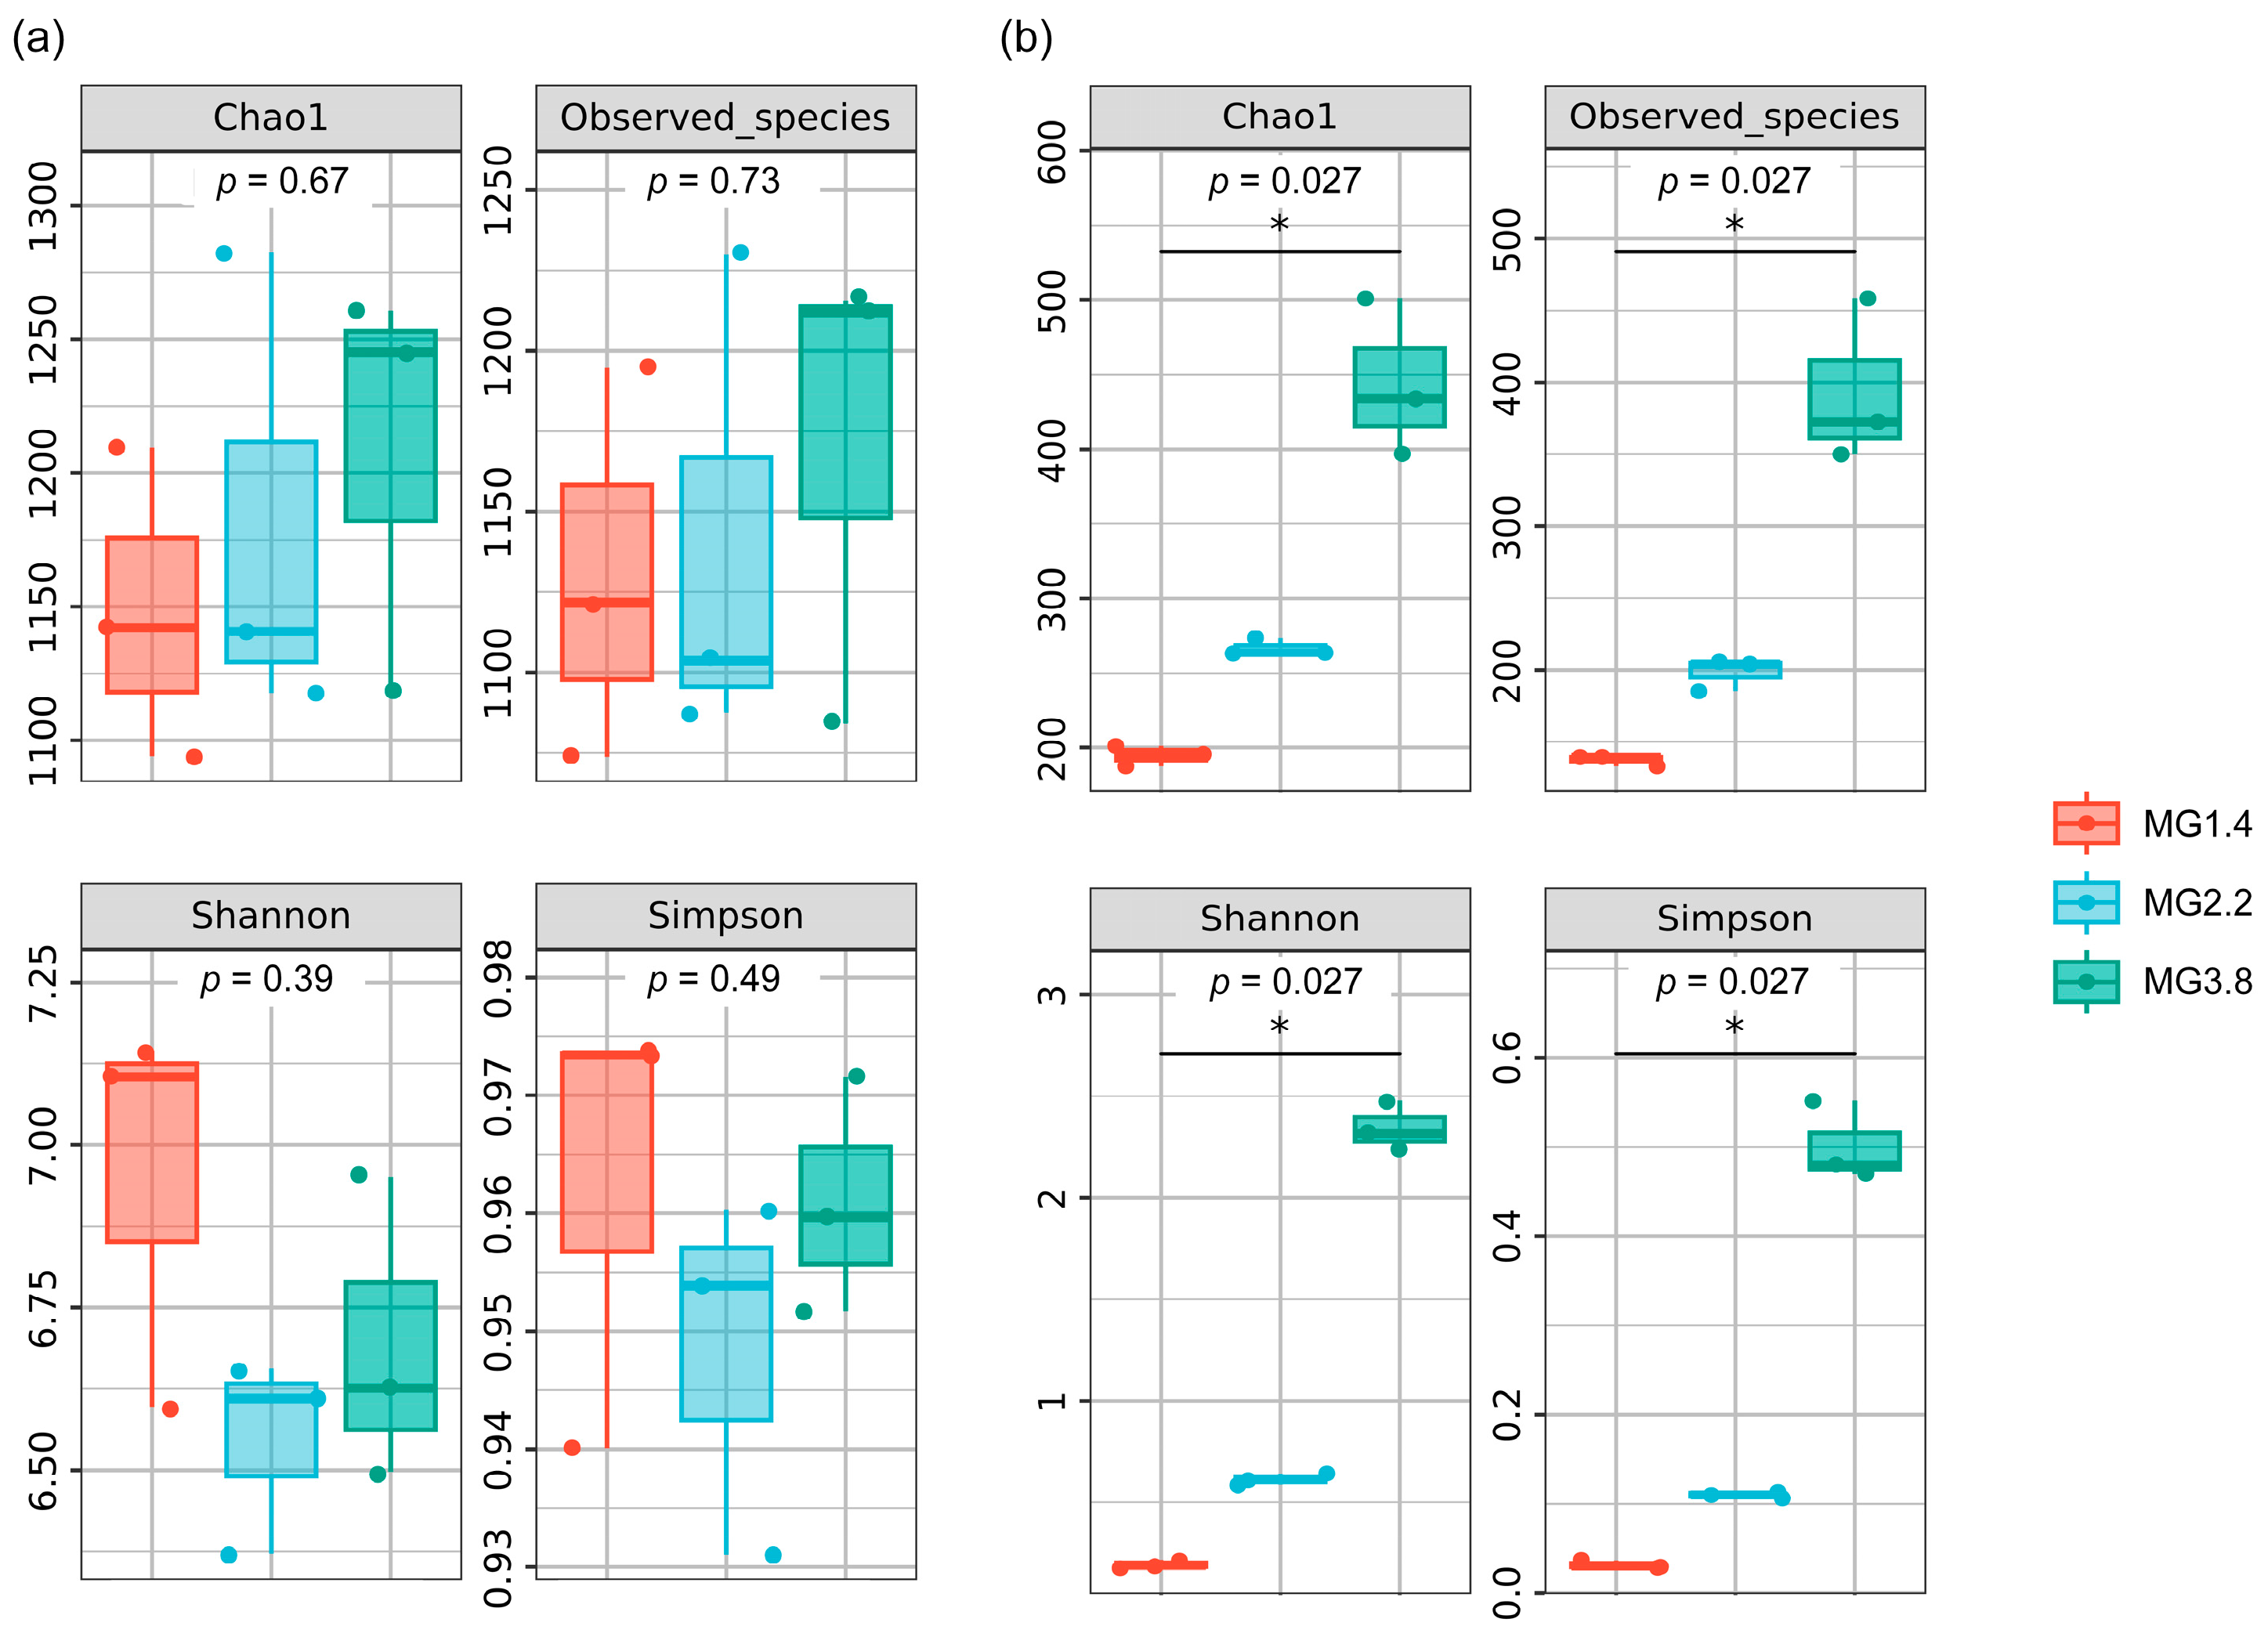
3.2. Diversity of AMF and Diazotrophs

The distribution curves of all samples were close to saturation, implying sufficient sequencing depth and coverage to identify the AMF and nifH tested (Figure A2).
A total of 4314 AMF-associated soil ASVs were obtained from the nine soil samples collected. The results of the alpha diversity analysis showed no significant differences in the AMF populations in the rhizosphere soils among the different MG genotypes (Figure 1a). There were 829 nifH-related OTUs in nine soil samples. The results showed that there were significant differences in the nifH diversity indices among the different MG genotypes; for example, the Simpson indices were ordered as MG1.4 > MG2.2 > MG3.8 (Figure 1b). There was generally an increasing trend toward four indicators of nifH, revealing that genotype selection based on MG had a significant effect on the diversity of diazotrophic taxa in soybean rhizosphere soils.

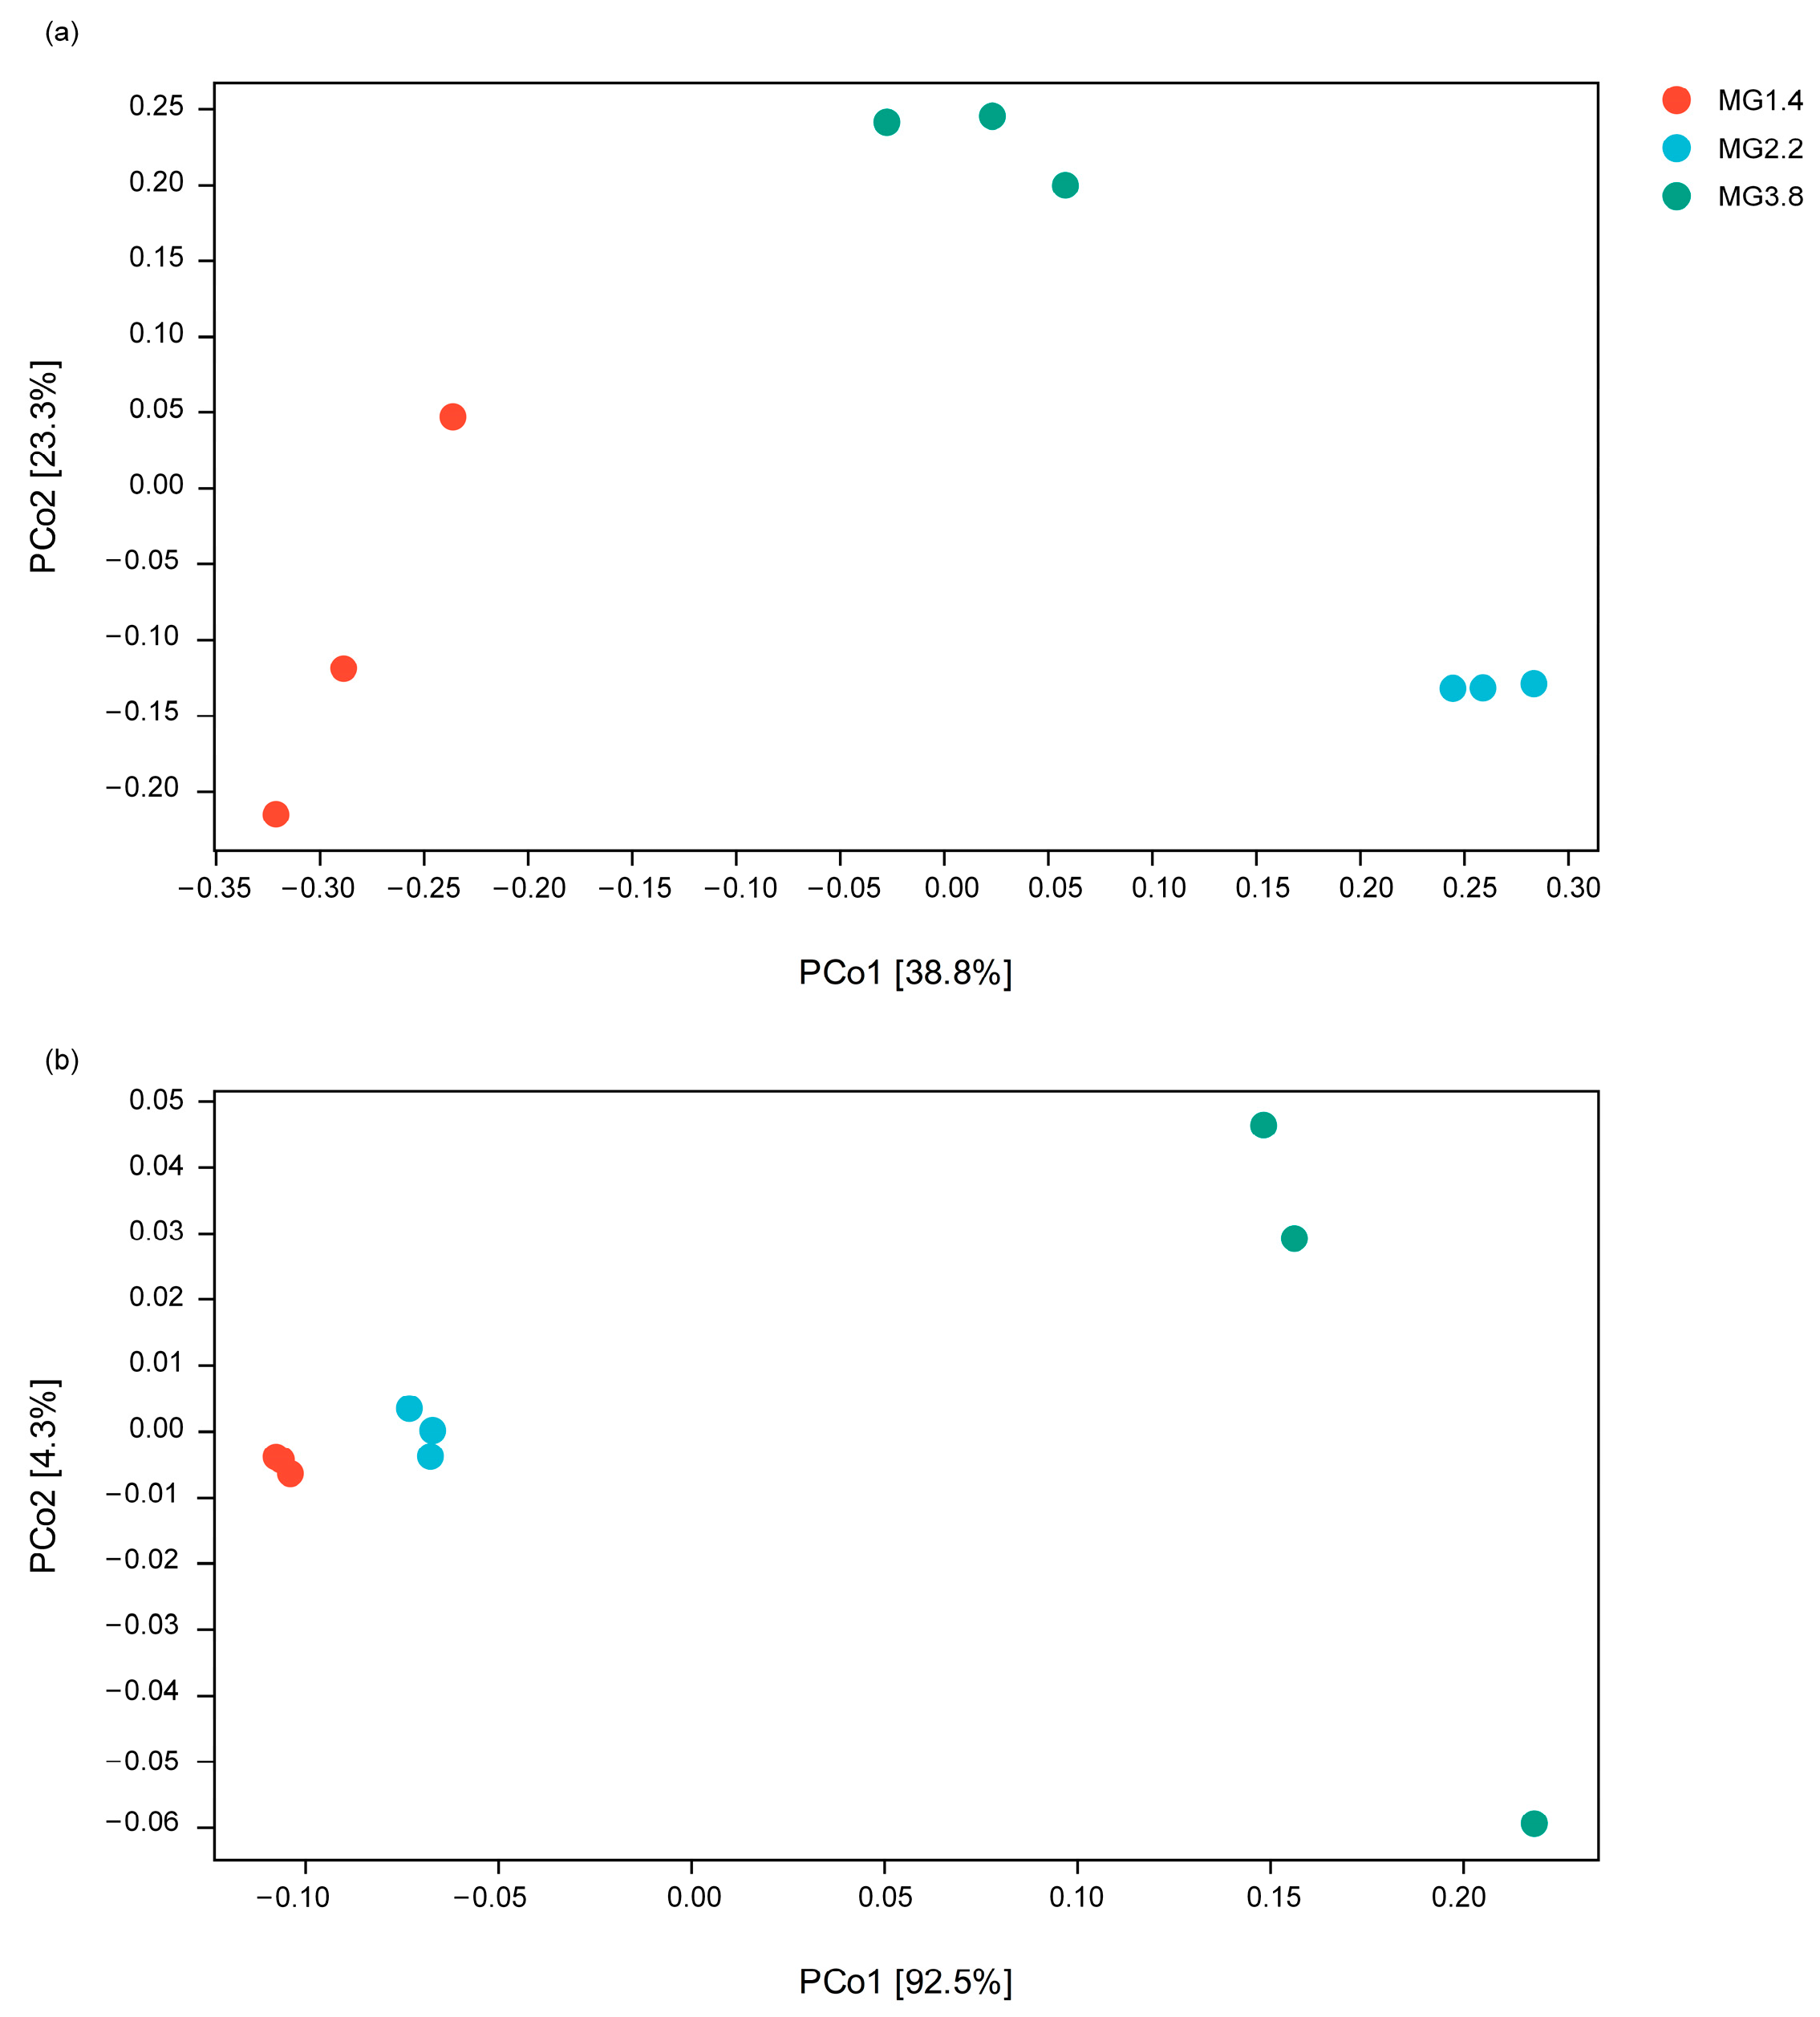
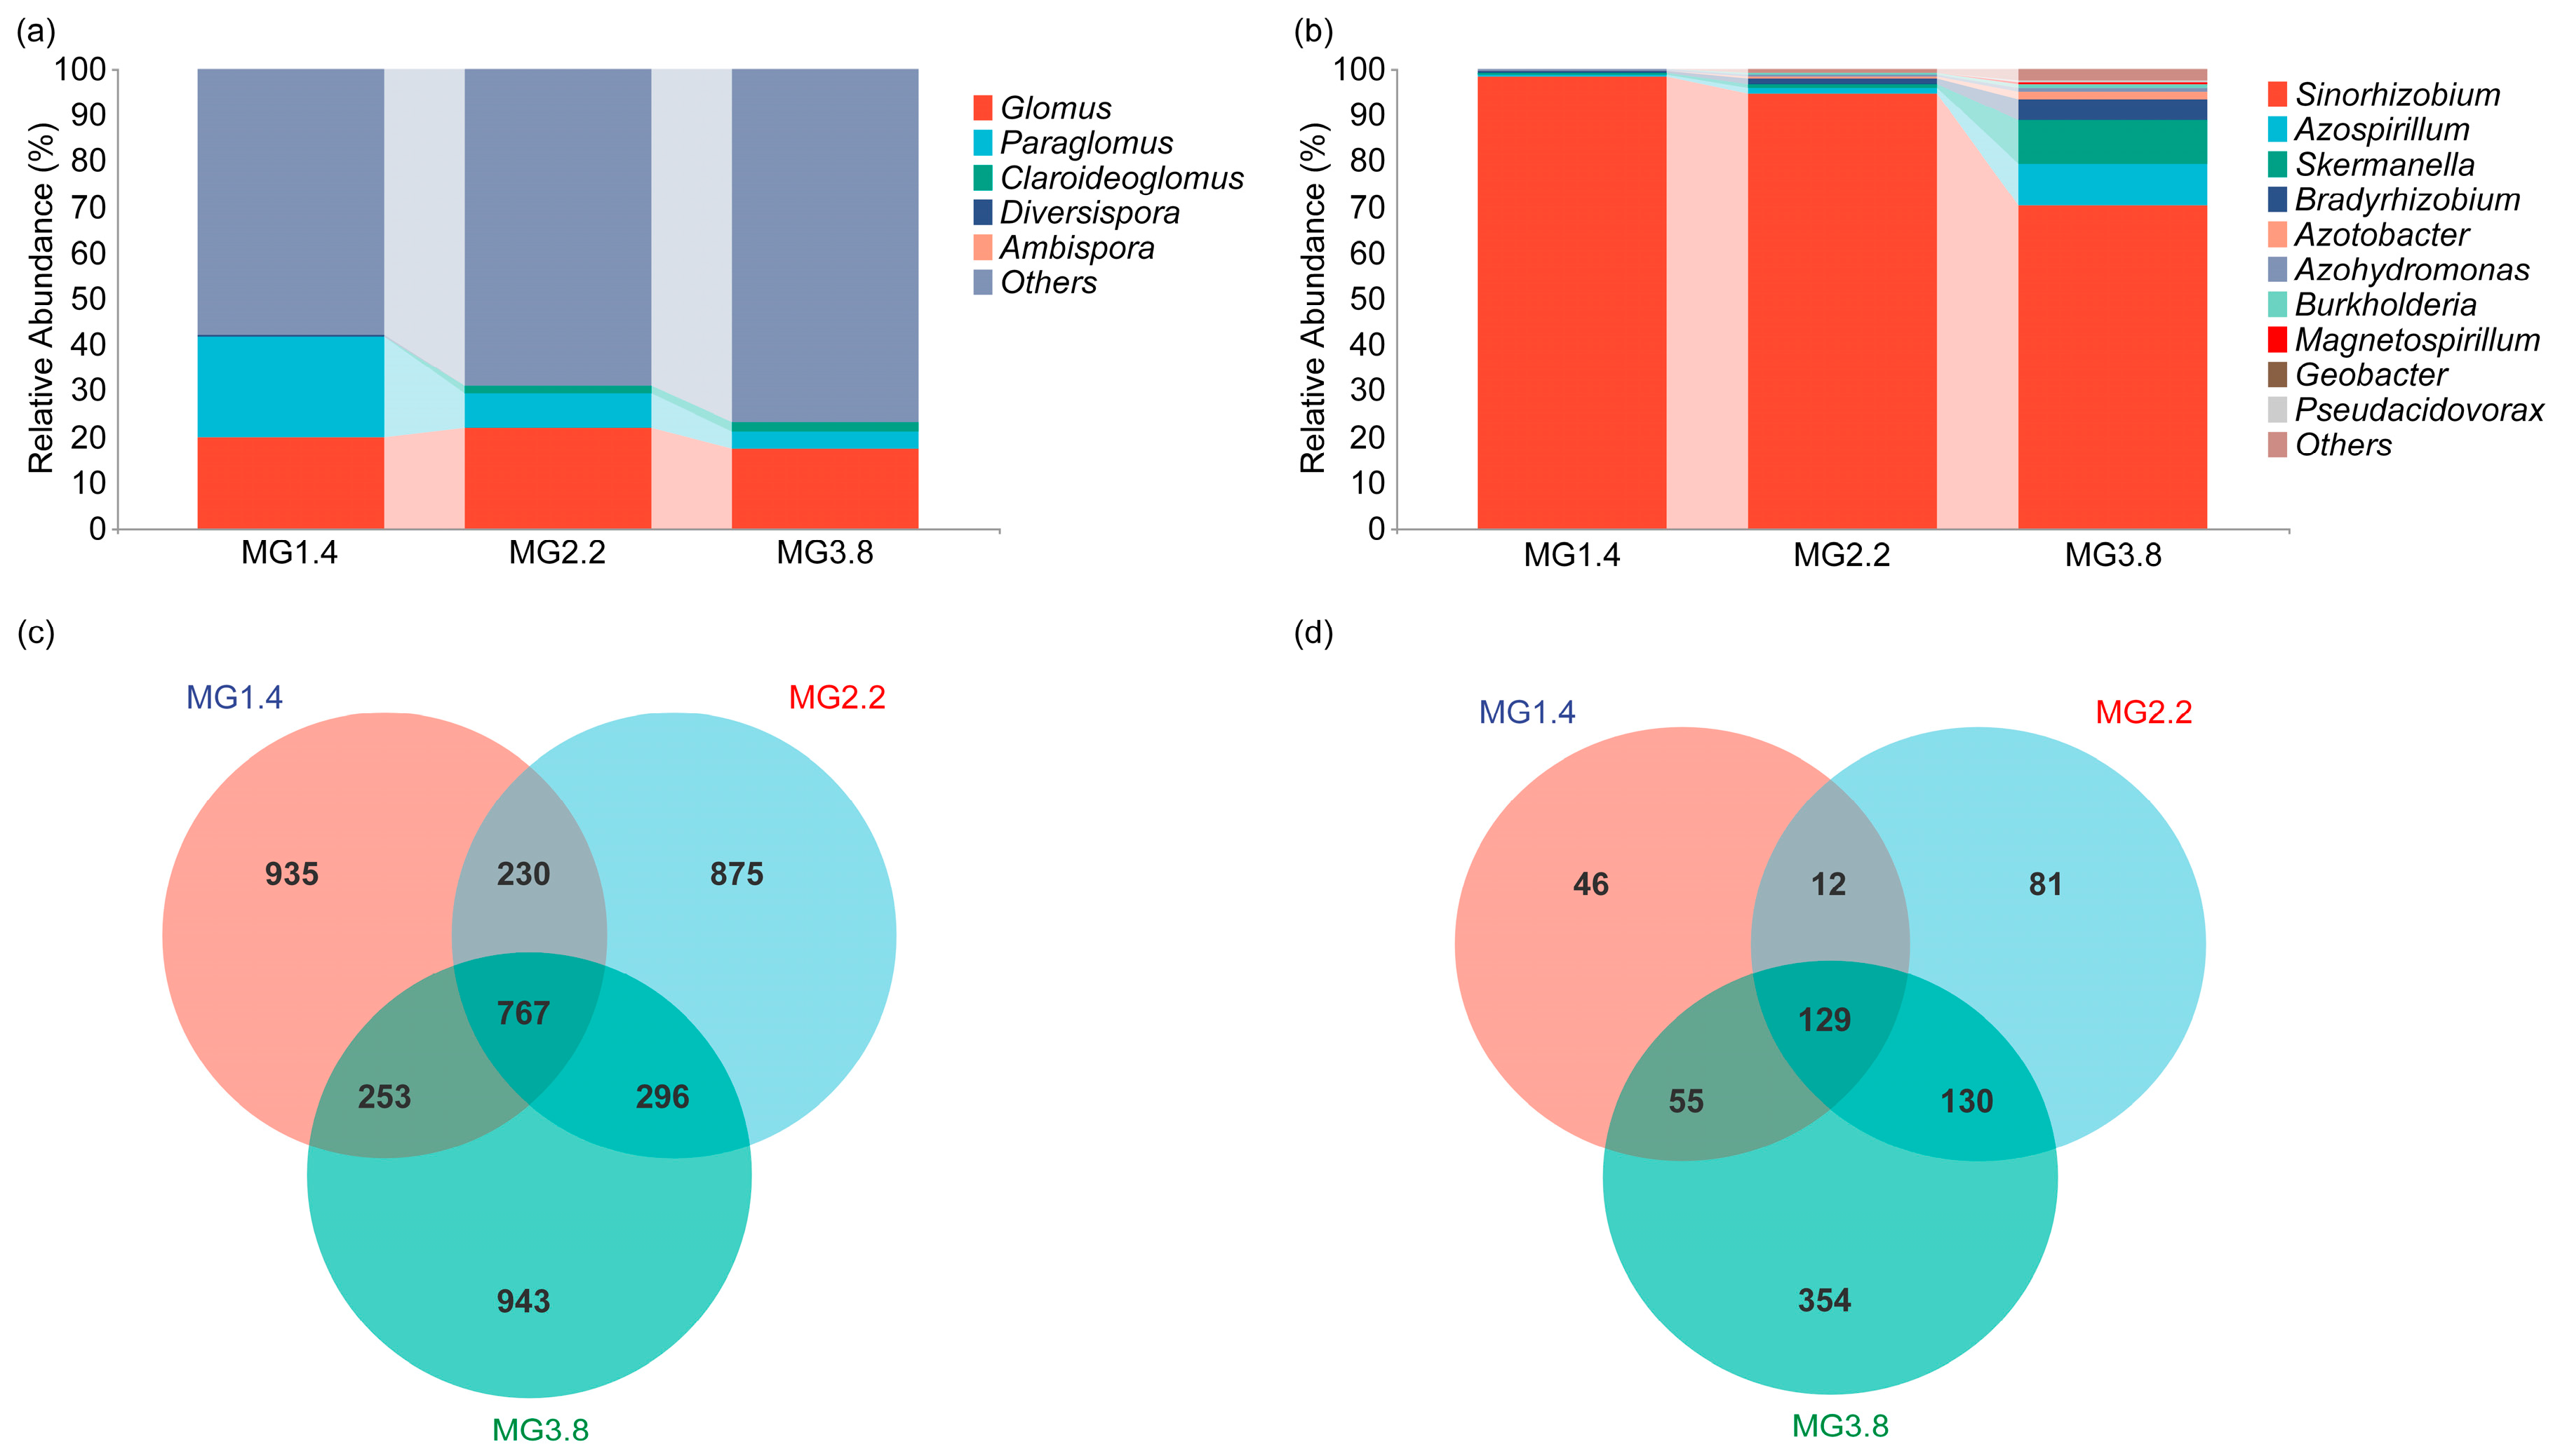
3.3. Composition and Structure of AMF and Diazotrophs

The compositions of AMF and diazotrophs had different compositional characteristics among the different MG genotypes. Glomus (17.3–22.1%), Paraglomus (4.0–22.1%), and Claroideoglomus (0.1–1.7%) were the three main AMF genera measured (Figure 2a). The major genera of the diazotrophs in the different MG genotypes were Sinorhizobium (70.3–98.5%), Azospirillum (0.4–9.2%), Skermanella (0.3–9.3%), Bradyrhizobium (0.4–4.4%), and Azotobacter (0–1.6%); the other five genera with low frequencies were Azohydromonas, Burkholderia, Magnetospirillum, Geobacter, and Pseudacidovorax (Figure 2b). The relative abundance of Glomus was generally stable among the different MG genotypes, with Paraglomus having a higher relative abundance in MG1.4 than in the other two genotypes, while Claroideoglomus showed a lower relative abundance in MG1.4 than in the other two genotypes (Figure 2a). Among the different MG genotypes, Sinorhizobium had the highest relative abundance and was much higher in MG1.4 and MG2.2 than in MG3.8 (Figure 2b), with the lowest relative abundance still exceeding 70%, making it the dominant genus. However, the relative abundances of Azospirillum, Skermanella, Bradyrhizobium, and Azotobacter showed opposite trends to that of Sinorhizobium, with MG3.8 > MG2.2 > MG1.4. These results indicate that the later MG genotypes had a low abundance of Sinorhizobium but an increased abundance of other diazotrophs in the rhizosphere soil.
In addition, the number of ASVs/OTUs shared by the different MG genotypes was limited, and the number of independent fractions showed different distributions in the three soybean genotypes. AMF had 767 shared ASVs, but each MG genotype had more unique ASVs. nifH shared 129 OTUs, with the highest number of OTUs in MG3.8, and MG1.4 had the smallest number of unique OTUs (Figure 2c,d). Our results indicated that different responses of AMF and diazotrophic communities were found among the different MG genotypes.
PCoA results based on Bray-Curtis distances showed that both AMF and diazotrophs were aggregated in the rhizosphere soil depending on soybean MG, and samples were separated between different MG genotypes (Figure A3).

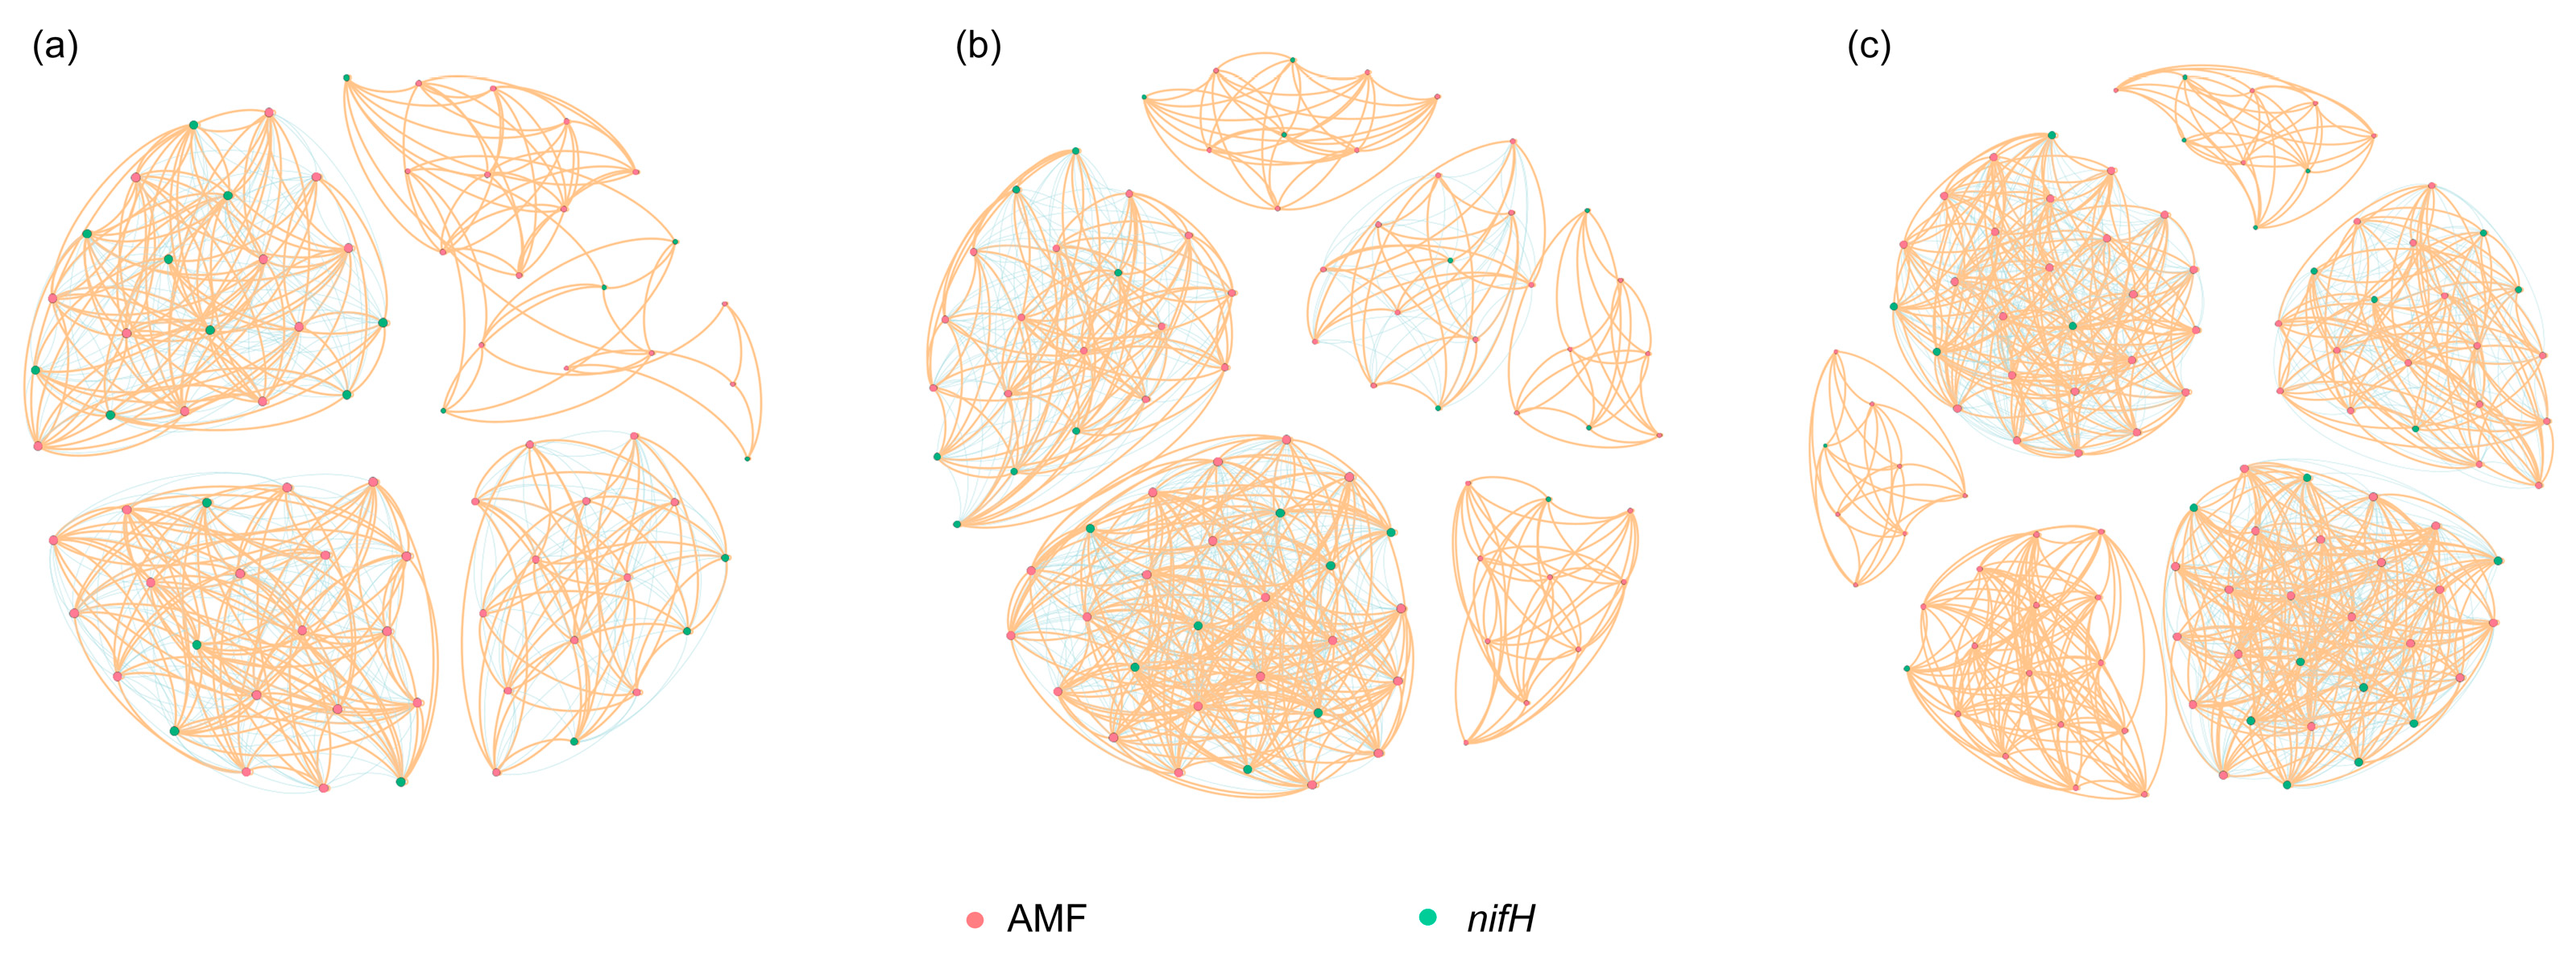
3.4. Co-Occurrence Patterns between AMF and the Diazotrophs

A co-occurrence network of AMF and diazotrophs was established in the analysis as a way to explore the topology of interspecific interactions (Figure 3). Multiple topological properties of the AMF and diazotrophic co-occurrence patterns were pronouncedly varied among the different MG genotypes (Table 2). These results showed that the number of nodes and links, average degree, and average clustering coefficient were higher in MG3.8 than in the other two genotypes, indicating that connected and complicated AMF-diazotroph networks varied among the different MG genotypes (Figure 3 and Table 2). We also found that the positive correlation of potential interactions between AMF and diazotrophs was lowest in MG2.2 and MG3.8, which also had the highest centrality (Figure 3).

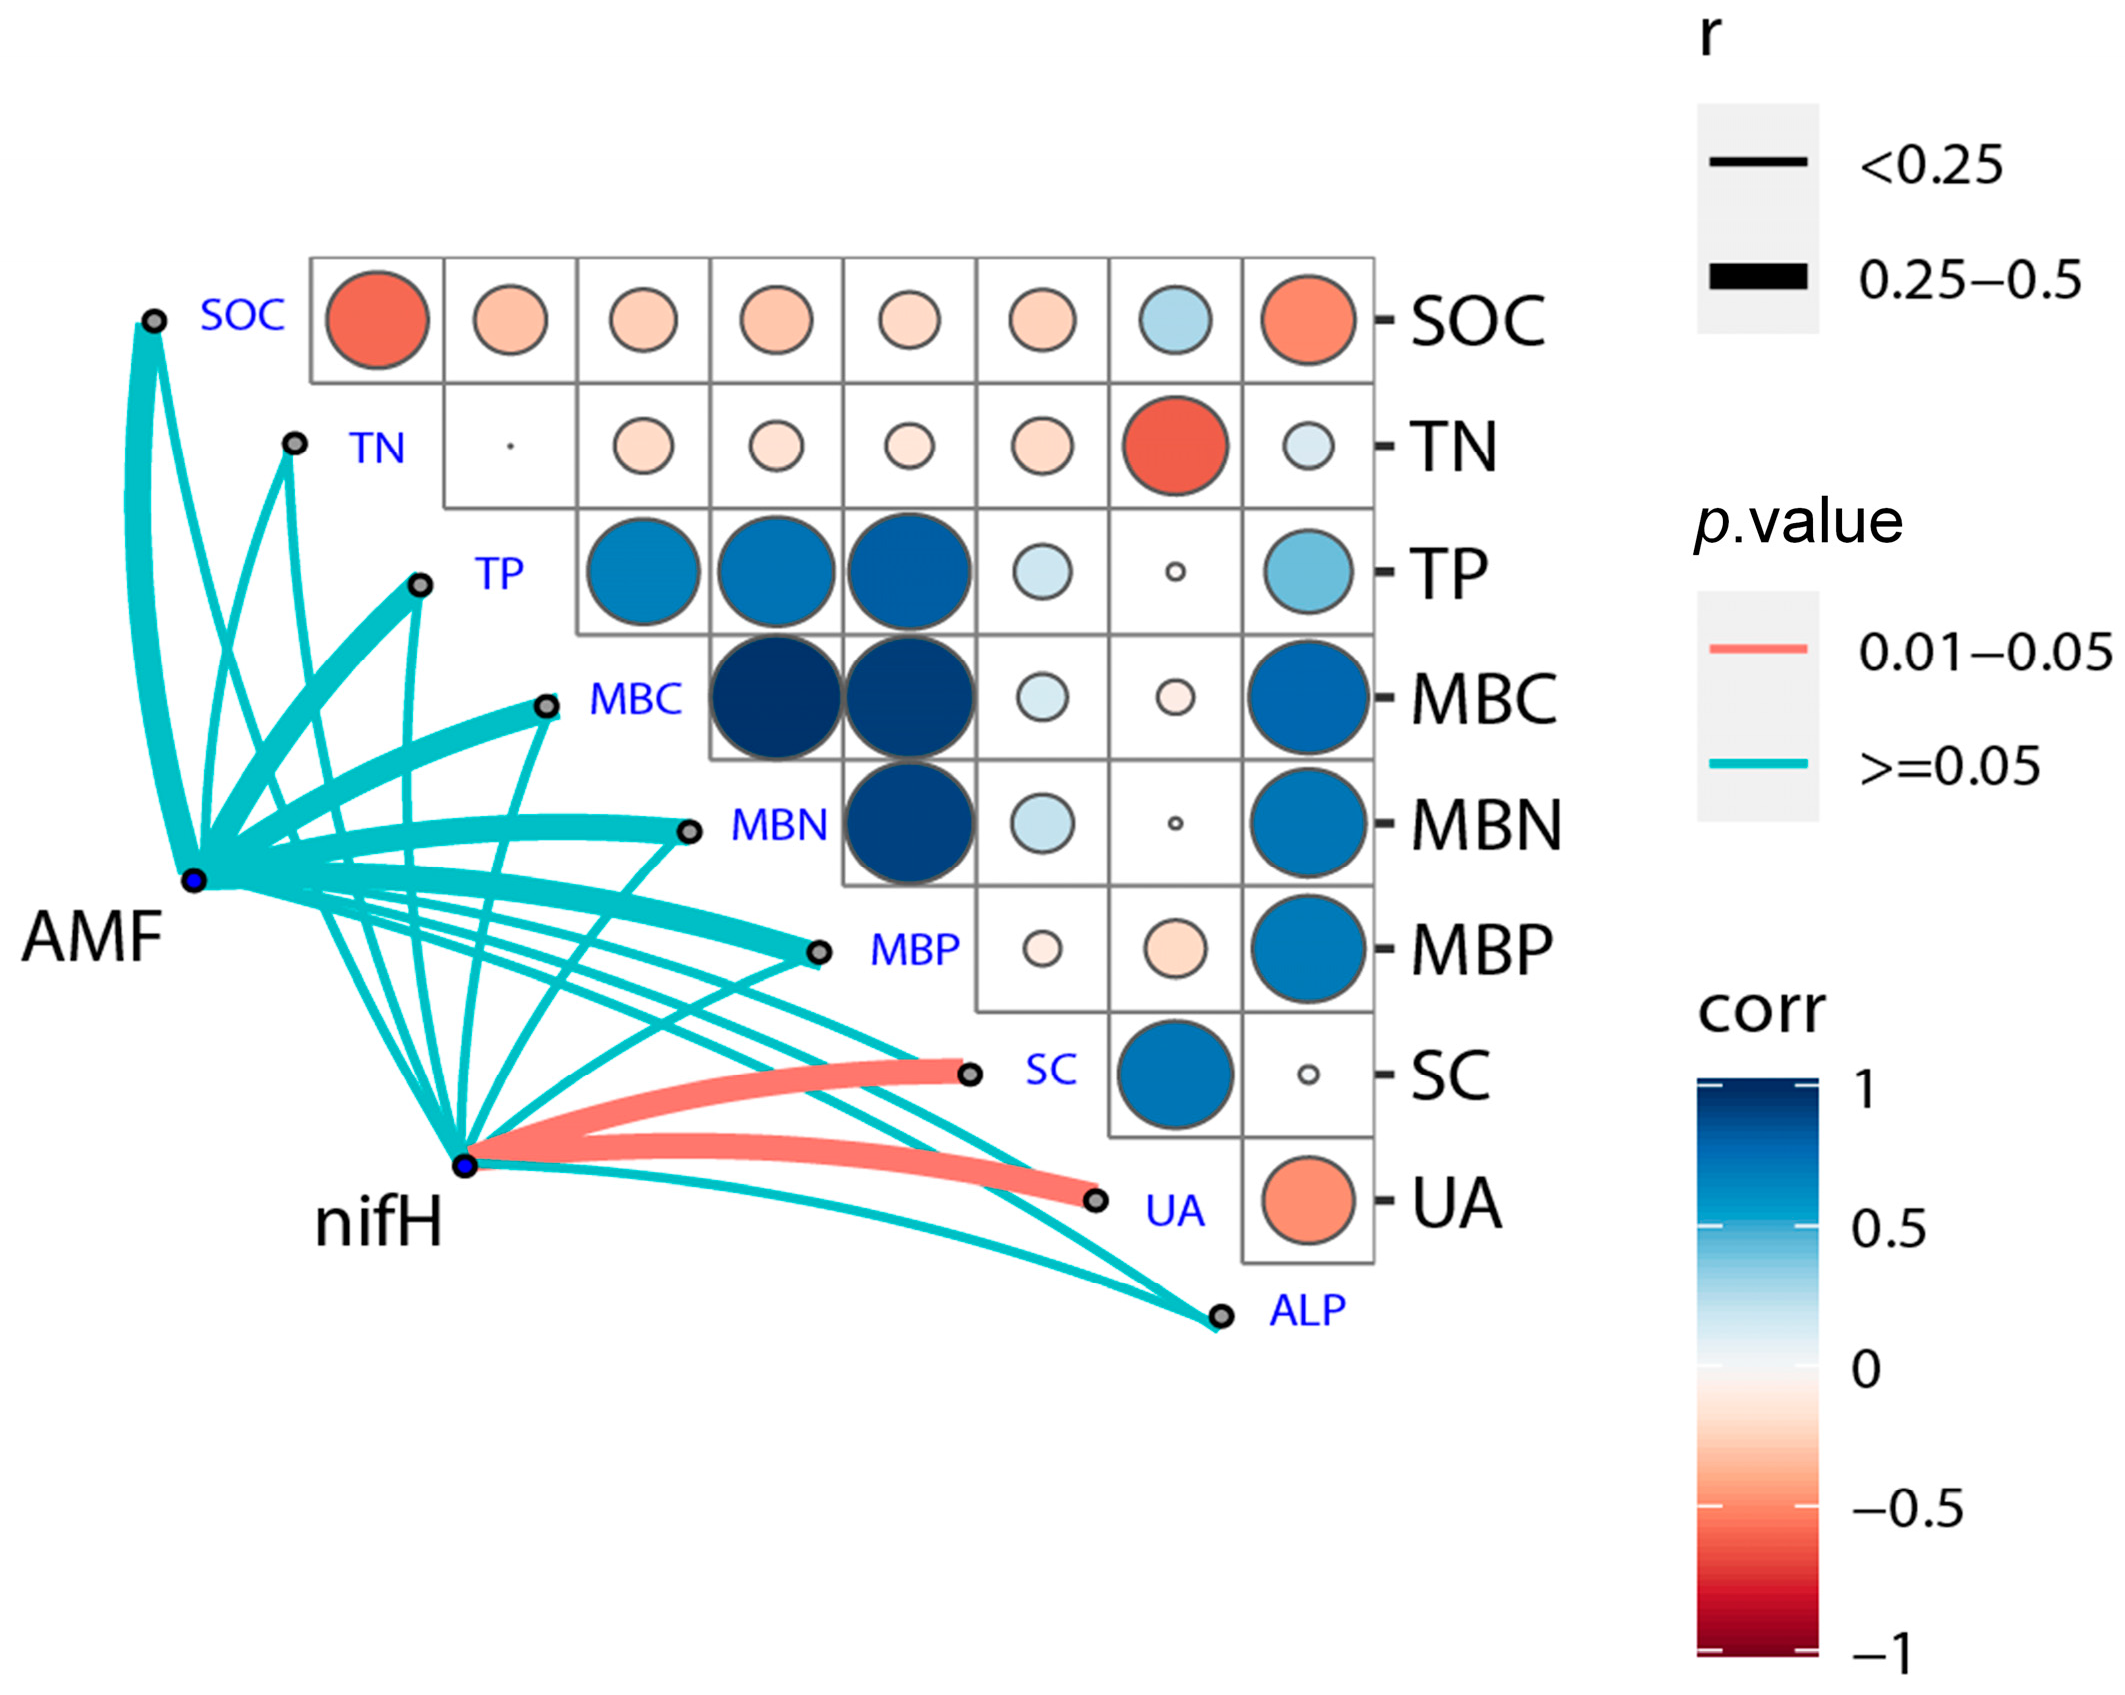
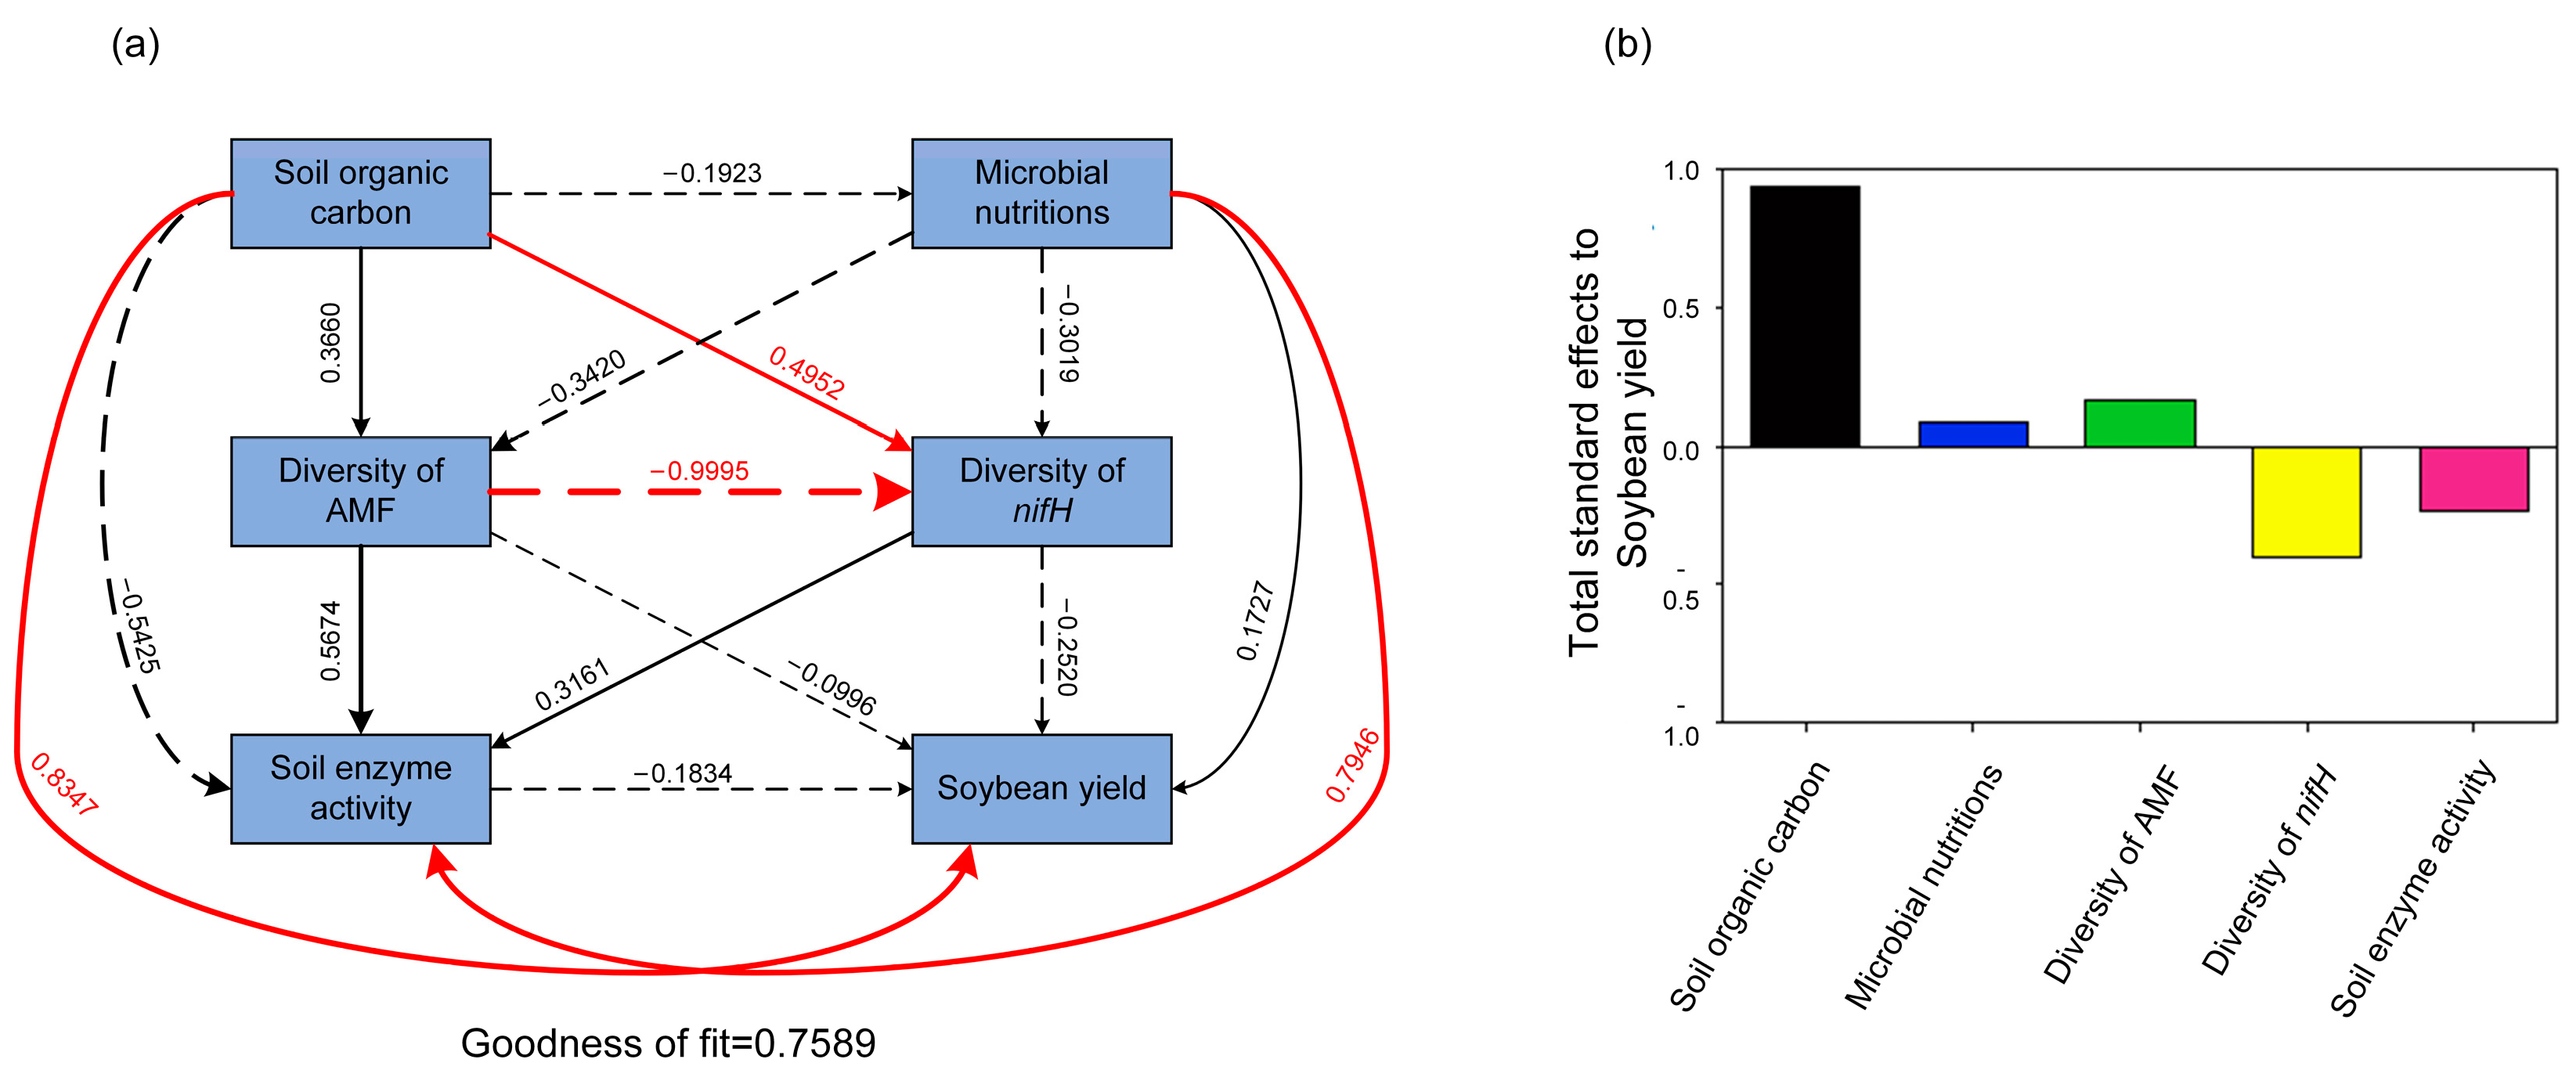
3.5. Correlation of Soil Physical-Chemical Properties and Microbial Communities

There was a significant correlation (p < 0.05) between the diazotrophs and the activities of sucrase and urease, while AMF did not show a significant correlation with the measured indices. In addition, SOC was positively correlated with urease activity and negatively correlated with all other measured indices. Soil TN was positively correlated with alkaline phosphatase activity; soil TP was positively correlated with alkaline phosphatase and sucrase activity, as well as MBC, MBN, and MBP; MBN was negatively correlated with urease activity; MBP was negatively correlated with urease and sucrase activity; sucrase was positively correlated with urease activity; and urease activity was negatively correlated with alkaline phosphatase activity (Figure 4).
The results of the PLS-PM revealed the direct effects of soil chemical properties on microbial communities and soybean yield. SOC had a significant positive effect on the diversity of diazotrophs and soybean yield, and AMF diversity showed a significant negative effect on the diversity of diazotrophs; in addition, microbial nutrition exerted a distinctly positive effect on soil enzyme activity (Figure 5a). Moreover, both negative effects of SOC on soil enzyme activities and positive effects of AMF on soil enzyme activities were observed (Figure 5a). Based on Figure 5b, the SOC content was the main factor influencing the diversity of diazotrophs and soybean yield.

4. Discussion

In our study, microbial biomass did not differ among the different MG genotypes, but the resulting differences in SOC were found to be significantly and positively correlated diazotrophs and yield (Figure 5). It could only be that the uniformity of soil quality and the stability of the physical and chemical properties of soil occurred at the site with the same type of vegetation [46]. Another possible explanation is that microbial biomass is more sensitive to the effects of crop rotation and other agricultural management practices [47]. The higher SOC found in the MG1.4 soybean than in the MG2.2 and MG3.8 soybeans (Table 1) can be explained by a higher investment of rhizodeposition C input, since earlier MG genotypes would be conducive to greater competition for water, nutrients [48] (Table 1), and light resources than the other genotypes [49], implying the greatest potential for increasing C sequestration. Furthermore, our data suggest that soybean yield is associated with SOC changes, and it is tempting to speculate that higher yielding MG1.4 is assumed to result in increased C deposition in the soil due to high detrital inputs, root exudates, and amounts of N returned [50] (Table 1 and Figure 5). In addition, we speculate that the lower SOC of the MG2.2 and MG3.8 soybeans might be related to a more readily decomposable source of C from the root structure owing to lower root C:N ratios and higher root N contents, which influence net C deposition [51,52]. However, more work is needed to investigate nutrient flow in the different MG genotypes following leaf photosynthesis using C and N stable isotope analysis techniques to further advance our understanding of net in situ N transfer and net C and N deposition.
Soil enzymes play an important role in catalyzing reactions associated with organic matter decomposition and nutrient cycling, which are indicators of organic matter quality and transformation [53]. Since SC and UA are associated with the cycling of major biological C and N nutrients, the activities of these enzymes can provide a potential tool for assessing changes in organic C and mineralization pools [54] (Table 1). In this case, the highest SC and UA activities in the rhizosphere soil of the later MG genotype soybean were primarily ascribed to fresh photosynthetic organics continuously released from younger leaves to the rhizosphere soil as a relatively stable substrate for enzyme degradation according to the plant physiological standpoint [55]. These findings suggest that genotype selection based on MG was positively correlated with SOC and physical properties, which are important for improving agroecosystem functions and maintaining soil ecological balance (Table 1 and Figure 5). Further studies are needed to explore how changes in soil aggregates among the different MG genotypes, potentially as drivers, influence soil physical and chemical properties that ultimately lead to these discrepancies in C and N cycling processes.
In this study, there was no significant difference in the richness or diversity of AMF communities among the three MG genotypes, but the diversity of diazotrophs in the MG1.4 soybean was significantly lower than that in the MG3.8 soybean (Figure 1). These contrasting results imply that diazotrophic community diversity was more dependent on host plants, which are susceptible to different MG genotypes. This result indicates that AMF has a better evolutionary adaptation to continuous environmental change than diazotrophs, and the fluctuation of deterministic contribution in diazotrophs is larger than that in AMF communities [5,24]. Moreover, we postulate that the significant variation in the dependencies of the two functional groups on hypo- and rhizodeposition C is mainly attributed to an increase in diazotrophic richness and phylogenetic diversity induced by soybean genotype selection based on MG [56]. Another alternative explanation is that bacterial mCUE values and nifH phylogenetic diversity tend to significantly increase with nutrient availability [6,57]. These results could be useful for understanding the optimization of plant–microbe feedbacks and may help improve the mechanistic understanding of the tripartite interaction and the different MG genotype-driven modulation of target bacterial communities.
In an earlier study, the most dominant AMF species uniformly occurred at all phenological growth stages of soybean [14]. However, the current study found that the dominant species and most frequent species of AMF and diazotrophic communities noticeably changed and were very distinct among the three MG genotypes (Figure 2), which may indicate that the host plant may facilitate host fitness and plant–microbiome balance and modify its interactions by deterministic host selection [58,59]. This scenario might indicate that the plant microbiome composition is a reflection of the nutrient requirements of the host plant and represents the result of minor adjustments in the microbial recruitment strategy. In the present study, the MG1.4 soybean had completed its physiological maturity and gradually wilted, which may have been associated with the decrease in the abundance of Bradyrhizobium [9] (Figure 2). Future studies could examine the differences between plants at different growth stages by varying the time of soil sampling. In addition, Paraglomus forms smaller spores and can use scarce C resources more efficiently than other genera under environmental stress at a lower energetic cost [60,61], which could explain the higher relative abundance exhibited in the later MG genotypes of soybean. Few previous studies have considered the MG as a variable [62] (Table 1 and Figure 2). This study considerably expands our knowledge of the complex interactions among host plants, microbes and the environment and provides essential information for the future development of tools to manipulate crop microbiomes under tripartite symbiosis.
Several studies have confirmed that AMF and diazotrophs have a complex interaction relationship [5,24,63] (Figure 3), as the abundant extraradical hyphae of AMF serve as bridges between diazotrophs and plants, and nodule formation requires a high P demand, which is facilitated by AMF [4]. This study shows that the interspecific relationship between AMF and diazotrophs is more cooperative than competitive (Figure 3 and Table 2), which has also been confirmed in mangrove ecosystems [23]. However, Zhang [22] indicated that both microbes and plants were self-sufficient, and few interactions occurred in suitable and appropriate interaction environments. These contradictory results suggest that the diverse associations between AMF and diazotrophs are known to be regulated by resource availability [17], tolerant or sensitive plant cultivars [64], and the physiological status of host plants [65]. In this study, co-occurrence network analysis revealed a higher positive correlation between AMF and diazotrophs in MG3.8 soybean than in the other earlier MG genotypes, and the correlation included a lower number of nodes and edges and average connectivity (Figure 3 and Table 2), indicating that the different MG genotypes profoundly influenced the facilitative interaction between AMF and diazotrophs. We speculate that different and sufficient C from plant roots [45] and the amounts of root exudates [61] in plant physiology among the three MG genotypes were responsible for the differences. Further studies are necessary to monitor long-term changes in field conditions for a better understanding of the complex interactions between AMF and diazotrophs.

5. Conclusions

Diazotrophs are more sensitive than AMF and respond differently to different MG genotypes. The key species and the co-occurrence patterns of AMF and diazotrophs exhibited different assembly mechanisms among the three MG genotypes. The SOC, TN and soil extracellular enzyme activities dramatically varied among the different MG genotypes and correlated with different microbial communities. Our results suggest that soybean genotype selection based on MG is one of the main driving factors in the recruitment of AMF and diazotrophs, highlighting the complexity of multipartite symbioses and the biological processes underlying mutualisms.

Author Contributions

All authors contributed to the research ideas and experiments. Conceptualization, S.H.; Data curation, M.W. and S.L.; Formal analysis, M.W. and J.B.; Funding acquisition, S.H.; Investigation, M.W. and M.L.; Methodology, M.W., M.L. and S.H.; Project administration, P.Y. and S.H.; Resources, K.W., Y.Q. and S.H.; Software, M.W. and J.B.; Supervision, T.H.; Validation, M.W.; Visualization, M.W., S.L. and P.Y.; Writing—original draft, M.W. and S.H.; Writing—review and editing, M.W., S.L. and S.H. All authors have read and agreed to the published version of the manuscript.

Funding

This research was funded by National Key Research and Development Program, grant number 2022YFD1300803; the National Natural Science Foundation of China, grant number 32071878; the Key Research and Development Projects of Shaanxi Province, grant number 2019ZDLNY05-03.

Data Availability Statement

The 16S rRNA and ITS gene sequences of bacteria and fungi used in this manuscript were submitted to the NCBI SRA database (https://www.ncbi.nlm.nih.gov/, accessed on 11 July 2022), and the accession numbers are PRJNA857558 and PRJNA857546.

Acknowledgments

We thank Yannong Cui for his helpful suggestions and manuscript revisions.

Conflicts of Interest

The authors declare no conflict of interest.

Appendix A

Figure A1. Important physiological evaluation index of soybean. Mu: The unit of land measurement in China is generally 666.7 square meters.
Agronomy 13 01713 g0a1
Figure A2. Sparsity curves of AMF (a) and nifH (b) in the rhizosphere soil among the different MG genotypes. The horizontal coordinate is the pumping depth, and the vertical coordinate is the median value of the alpha diversity index calculated 10 times. Values are the average (±SE) of three field replicates.
Agronomy 13 01713 g0a2
Figure A3. Community composition and distribution characteristics of AMF and diazotrophs among the different MG genotypes. Community composition of the dominant phyla of AMF (a) and nifH (b).
Agronomy 13 01713 g0a3

References

  1. Li, Y.; Yang, T.; Zhang, P.; Zou, A.; Peng, X.; Wang, L.; Yang, R.; Qi, J.; Yang, Y. Differential responses of the diazotrophic community to aluminum-tolerant and aluminum-sensitive soybean genotypes in acidic soil. Eur. J. Soil Biol. 2012, 53, 76–85. [Google Scholar] [CrossRef]
  2. Kafle, A.; Garcia, K.; Wang, X.; Pfeffer, P.E.; Strahan, G.D.; Bücking, H. Nutrient demand and fungal access to resources control the carbon allocation to the symbiotic partners in tripartite interactions of Medicago truncatula. Plant. Cell Environ. 2019, 42, 270–284. [Google Scholar] [CrossRef] [Green Version]
  3. Lotfabadi, Z.E.; Weisany, W.; Tahir, N.A.; Torkashvand, A.M. Arbuscular mycorrhizal fungi species improve the fatty acids profile and nutrients status of soybean cultivars grown under drought stress. J. Appl. Microbiol. 2021, 132, 2177–2188. [Google Scholar] [CrossRef]
  4. Meena, R.S.; Vijayakumar, V.; Yadav, G.S.; Mitran, T. Response and interaction of Bradyrhizobium japonicum and arbuscular mycorrhizal fungi in the soybean rhizosphere. Plant. Growth Regul. 2018, 84, 207–223. [Google Scholar] [CrossRef]
  5. Zhang, F.; Zhou, Z.; Xiao, Y. Distinct community assembly and co-existence of arbuscular mycorrhizal fungi and diazotrophs across large-scale soil fertility to improve functions in alfalfa cultivation systems. Environ. Microbiol. 2022, 24, 5277–5291. [Google Scholar] [CrossRef]
  6. Zhu, C.; Tian, G.; Luo, G.; Kong, Y.; Guo, J.; Wang, M.; Guo, J.; Wang, M.; Guo, S.; Ling, N.; et al. N-fertilizer-driven association between the arbuscular mycorrhizal fungal community and diazotrophic community impacts wheat yield. Agric. Ecosyst. Environ. 2018, 254, 191–201. [Google Scholar] [CrossRef]
  7. Wang, X.; Pan, Q.; Chen, F.; Yan, X.; Liao, H. Effects of co-inoculation with arbuscular mycorrhizal fungi and rhizobia on soybean growth as related to root architecture and availability of N and P. Mycorrhiza 2011, 21, 173–181. [Google Scholar] [CrossRef]
  8. Primieri, S.; Santos, J.C.P.; Antunes, P.M. Nodule-associated bacteria alter the mutualism between arbuscular mycorrhizal fungi and N2 fixing bacteria. Soil Biol. Biochem. 2021, 154, 108–149. [Google Scholar] [CrossRef]
  9. Sheteiwy, M.S.; Ali, D.F.I.; Xiong, Y.C.; Brestic, M.S.; Skalicky, M.; Hamoud, Y.A.; Ulhassan, Z.; Shaghaleh, H.; AbdElgawad, H.; Farooq, M.; et al. Physiological and biochemical responses of soybean plants inoculated with Arbuscular mycorrhizal fungi and Bradyrhizobium under drought stress. BMC Plant. Biol. 2021, 21, 195. [Google Scholar] [CrossRef]
  10. Van Versendaal, E.; Carcedo, A.J.; Adee, E.; Sassenrath, G.; Dooley, S.; Lingenfelser, J.; Ciampitti, I.A. Integrating Field Data and a Modeling Approach to Inform Optimum Planting Date × Maturity Group for Soybeans under Current and Future Weather Conditions in Kansas. Sustainability 2023, 15, 1081. [Google Scholar] [CrossRef]
  11. Cober, E.R.; Stewart, D.W.; Voldeng, H.D. Photoperiod and temperature responses in earlymaturing, near-isogenic soybean lines. Crop Sci. 2001, 41, 721–727. [Google Scholar] [CrossRef]
  12. Mourtzinis, S.; Gaska, J.M.; Conley, S.P. Delineating optimal soybean maturity groups across the United States. Environments 2015, 1, 3–4. [Google Scholar] [CrossRef] [Green Version]
  13. Mohammed, Y.A.; Gesch, R.W.; Matthees, H.L.; Wells, S.S. Maturity selection but not sowing date enhances soybean productivity and land use in a winter camelina–soybean relay system. Food Energy Secur. 2022, 11, e346. [Google Scholar] [CrossRef]
  14. Buade, R.; Chourasiya, D.; Prakash, A.; Sharma, M.P. Changes in arbuscular mycorrhizal fungal community structure in soybean rhizosphere soil assessed at different growth stages of soybean. Agric. Res. 2020, 10, 32–43. [Google Scholar] [CrossRef]
  15. Faggioli, V.; Covacevich, F.; Grilli, G.; Lorenzón, C.; Aimetta, B.; Sagadin, M.; Langarica-Fuentes, A.; Cabello, M.N. Environmental response of arbuscular mycorrhizal fungi under soybean cultivation at a regional scale. Mycorrhiza 2022, 32, 425–438. [Google Scholar] [CrossRef]
  16. Dubey, A.; Malla, M.A.; Kumar, A. Taxonomical and functional bacterial community profiling in disease-resistant and disease-susceptible soybean cultivars. Braz. J. Microbiol. 2022, 53, 1355–1370. [Google Scholar] [CrossRef]
  17. Jakobsen, I.; Rosendahl, L. Carbon flow into soil and external hyphae from roots of mycorrhizal cucumber plants. New. Phytol. 1990, 115, 77–83. [Google Scholar] [CrossRef]
  18. Provorov, N.A.; Tikhonovich, I.A. Genetic resources for improving nitrogen fixation in legume-rhizobia symbiosis. Genet. Resour. Crop. Evol. 2003, 50, 89–99. [Google Scholar] [CrossRef]
  19. Fellbaum, C.R.; Gachomo, E.W.; Beesetty, Y.; Choudhari, S.; Strahan, G.D.; Pfeffer, P.E.; Kiers, E.T.; Bücking, H. Carbon availability triggers fungal nitrogen uptake and transport in arbuscular mycorrhizal symbiosis. Proc. Natl. Acad. Sci. USA 2012, 109, 2666–2671. [Google Scholar] [CrossRef] [Green Version]
  20. Kleinert, A.; Venter, M.; Kossmann, J.; Valentine, A. The reallocation of carbon in P deficient lupins affects biological nitrogen fixation. J. Plant. Physiol. 2014, 171, 1619–1624. [Google Scholar] [CrossRef]
  21. Xiao, D.; Chen, Y.; He, X.; Xu, Z.; Bai, S.H.; Zhang, W.; Cheng, M.; Hu, P.; Wang, K. Temperature and precipitation significantly influence the interactions between arbuscular mycorrhizal fungi and diazotrophs in karst ecosystems. For. Ecol. Manag. 2021, 497, 119464. [Google Scholar] [CrossRef]
  22. Zhang, F.G.; Zhou, Z.B.; Xiao, Y. Abundant and rare bacteria possess different diversity and function in crop monoculture and rotation systems across regional farmland. Soil Biol. Biochem. 2022, 171, 108742. [Google Scholar] [CrossRef]
  23. Yu, H.; Liu, X.; Yang, C.; Peng, Y.; Yu, X.; Gu, H.; Zheng, X.; Wang, C.; Xiao, F.; Shu, L.; et al. Co-symbiosis of arbuscular mycorrhizal fungi AMF and diazotrophs promote biological nitrogen fixation in mangrove ecosystems. Soil Biol. Biochem. 2021, 161, 108382. [Google Scholar] [CrossRef]
  24. Wang, Q.; Sheng, J.; Wang, Y.; Chen, K.; Lambers, H.; Wang, X. The relative contribution of indigenous and introduced arbuscular mycorrhizal fungi and rhizobia to plant nutrient acquisition in soybean/maize intercropping in unsterilized soils. Appl. Soil Ecol. 2021, 168, 104–124. [Google Scholar] [CrossRef]
  25. Han, Q.; Ma, Q.; Chen, Y.; Tian, B.; Xu, L.; Bai, Y.; Chen, W.; Li, X. Variation in rhizosphere microbial communities and its association with the symbiotic efficiency of rhizobia in soybean. ISME J. 2020, 14, 1915–1928. [Google Scholar] [CrossRef] [Green Version]
  26. Salmeron, M.; Gbur, E.E.; Bourland, F.M.; Buehring, N.W.; Earnest, L.; Fritschi, F.B.; Golden, B.R.; Hathcoat, D.; Lofton, J.; Miller, T.D.; et al. Soybean maturity group choices for early and late plantings in the Midsouth. Agron. J. 2014, 106, 1893–1901. [Google Scholar] [CrossRef]
  27. Bao, S.D. Soil Agro-Chemistrical Analysis, 3rd ed.; China Agriculture Press: Beijing, China, 2008; pp. 16–27. [Google Scholar]
  28. Sato, K.; Suyama, Y.; Saito, M.; Sugawara, K. A new primer for discrimination of arbuscular mycorrhizal fungi with polymerase chain reaction-denature gradient gel electrophoresis. Grassl. Sci. 2005, 51, 179–181. [Google Scholar] [CrossRef]
  29. Bolyen, E.; Rideout, J.R.; Dillon, M.R.; Bokulich, N.A.; Abnet, C.C.; Al-Ghalith, G.A.; Alexander, H.; Alm, E.J.; Arumugam, M.; Asnicar, F.; et al. QIIME 2: Reproducible interactive scalable and extensible microbiome data science. PeerJ Prepr. 2018, 6, e27295v2. [Google Scholar] [CrossRef]
  30. Martin, M. Cutadapt removes adapter sequences from high-throughput sequencing reads. EMBnet J. 2011, 17, 10–12. [Google Scholar] [CrossRef]
  31. Callahan, B.J.; Mcmurdie, P.J.; Rosen, M.J.; Han, A.W.; Johnson, A.J.; Holmes, S.P. DADA2: High-resolution sample inference from Illumina amplicon data. Nat. Methods 2016, 13, 581–583. [Google Scholar] [CrossRef] [Green Version]
  32. Katoh, K.; Misawa, K.; Kuma, K.I.; Miyata, T. MAFFT: A novel method for rapid multiple sequence alignment based on fast Fourier transform. Nucleic Acids Res. 2002, 30, 3059–3066. [Google Scholar] [CrossRef] [Green Version]
  33. Bokulich, N.A.; Kaehler, B.D.; Rideout, J.R.; Dillon, M.; Bolyen, E.; Knight, R.; Huttley, G.A.; Gregory Caporaso, J. Optimizing taxonomic classification of marker-gene amplicon sequences with qiime 2’s q2-feature-classifier plugin. Microbiome 2018, 6, 90. [Google Scholar] [CrossRef]
  34. Kõljalg, U.; Nilsson, R.H.; Abarenkov, K.; Tedersoo, L.; Taylor, A.F.S.; Bahram, M.; Bates, S.T.; Bruns, T.D.; Bengtsson-Palme, J.; Callaghan, T.M.; et al. Towards a unified paradigm for sequence-based identification of fungi. Mol. Ecol. 2013, 22, 5271–5277. [Google Scholar] [CrossRef] [Green Version]
  35. Poly, F.; Monrozier, L.J.; Bally, R. Improvement in the RFLP procedure for studying the diversity of nifH genes in communities of nitrogen fixers in soil. Res. Microbiol. 2001, 152, 95–103. [Google Scholar] [CrossRef]
  36. Jaccard, P. Nouvelles recherches sur la distribution florale. Bul. Soc. Vaud. Sci. Nat. 1908, 44, 223–270. [Google Scholar] [CrossRef]
  37. Bray, J.R.; Curtis, J.T. An ordination of the upland forest communities of southern Wisconsin. Ecol. Monogr. 1957, 27, 325–349. [Google Scholar] [CrossRef]
  38. Lozupone, C.; Knight, R. UniFrac: A new phylogenetic method for comparing microbial communities. Appl. Environ. Microbiol. 2005, 71, 8228–8235. [Google Scholar] [CrossRef] [Green Version]
  39. Lozupone, C.A.; Hamady, M.; Kelley, S.T.; Knight, R. Quantitative and qualitative beta diversity measures lead to different insights into factors that structure microbial communities. Appl. Environ. Microbiol. 2007, 73, 1576–1585. [Google Scholar] [CrossRef] [Green Version]
  40. Zaura, E.; Keijser, B.J.; Huse, S.M.; Crielaard, W. Defining the healthy “core microbiome” of oral microbial communities. BMC Microbiol. 2009, 9, 259. [Google Scholar] [CrossRef] [Green Version]
  41. Heck, K.L., Jr.; van Belle, G.; Simberloff, D. Explicit calculation of the rarefaction diversity measurement and the determination of sufficient sample size. Ecology 1975, 56, 1459–1461. [Google Scholar] [CrossRef]
  42. Kemp, P.F.; Aller, J.Y. Bacterial diversity in aquatic and other environments: What 16S rDNA libraries can tell us. Fems Microbiol. Ecol. 2004, 47, 161–177. [Google Scholar] [CrossRef]
  43. Barberán, A.; Ramirez, K.S.; Leff, J.W.; Bradford, M.A.; Wall, D.H.; Fierer, N. Why are some microbes more ubiquitous than others? Predicting the habitat breadth of soil bacteria. Ecol. Lett. 2014, 17, 794–802. [Google Scholar] [CrossRef]
  44. Sanchez, G. PLS Path Modeling with R. 2013. Available online: https://www.gastonsanchez.com/PLS_Path_Modeling_with_R.pdf (accessed on 18 September 2021).
  45. Wang, J.; Pan, F.; Soininen, J.; Heino, J.; Shen, J. Nutrient enrichment modifies temperature-biodiversity relationships in large-scalefield experiments. Nat. Commun. 2016, 7, 13960. [Google Scholar] [CrossRef] [Green Version]
  46. Li, P.; Shi, K.; Wang, Y.; Kong, D.; Liu, T.; Jiao, J.; Liu, M.; Li, H.; Hu, F. Soil quality assessment of wheat-maize cropping system with different productivities in China: Establishing a minimum data set. Soil Tillage Res. 2019, 190, 31–40. [Google Scholar] [CrossRef]
  47. Benintende, S.M.; Benintende, M.C.; Sterren, M.A.; De Battista, J.J. Soil microbiological indicators of soil quality in four rice rotations systems. Ecol. Indic. 2008, 8, 704–708. [Google Scholar] [CrossRef]
  48. Wang, D.; Shannon, M.C. Emergence and seedling growth of soybean cultivars and maturity groups under salinity. Plant Soil 1999, 214, 117–124. [Google Scholar] [CrossRef]
  49. Wu, Y.; Gong, W.; Yang, F.; Wang, X.; Yong, T.; Liu, J.; Pu, T.; Yan, Y.; Yang, W. Dynamic of recovery growth of intercropped soybean after maize harvest in maize–soybean relay strip intercropping system. Food Energy Secur. 2022, 11, e350. [Google Scholar] [CrossRef]
  50. Ortel, C.C.; Roberts, L.T.; Hoegenauer, A.K.; Purcell, L.C.; Slaton, N.A.; Gbur, E.E. Soybean maturity group and planting date influence grain yield and nitrogen dynamics. Agrosystems Geosci. Environ. 2020, 3, e20077. [Google Scholar] [CrossRef]
  51. Fornara, D.A.; Tilman, D.; Hobbie, S. Linkages between plant functional composition, fine root processes and potential soil N mineralization rates. J. Ecol. 2009, 97, 48–56. [Google Scholar] [CrossRef]
  52. Hazra, K.K.; Nath, C.P.; Singh, U.; Praharaj, C.S.; Kumar, N.; Singh, S.S.; Singh, N.P. Diversification of maize-wheat cropping system with legumes and integrated nutrient management increases soil aggregation and carbon sequestration. Geoderma 2019, 353, 308–319. [Google Scholar] [CrossRef]
  53. Stemmer, M.; Gerzabek, M.H.; Kandeler, E. Organic matter and enzyme activity in particle-size fractions of soils obtained after low-energy sonication. Soil Biol. Biochem. 1998, 30, 9–17. [Google Scholar] [CrossRef]
  54. Jin, K.; Sleutel, S.; Buchan, D.; Neve, S.D.; Cai, D.X.; Gabriels, D.; Jin, J. Changes of soil enzyme activities under different tillage practices in the Chinese Loess Plateau. Soil Tillage Res. 2009, 104, 115–120. [Google Scholar] [CrossRef]
  55. Kumagai, E.; Sameshima, R. Genotypic differences in soybean yield responses to increasing temperature in a cool climate are related to maturity group. Agric. For. Meteorol. 2014, 198, 265–272. [Google Scholar] [CrossRef]
  56. Veresoglou, S.D.; Chen, B.; Rilling, M.C. Arbuscular mycorrhiza and soil nitrogen cycling. Soil Biol. Biochem. 2012, 46, 53–62. [Google Scholar] [CrossRef]
  57. Zhong, Y.; Yan, W.; Shangguan, Z. Impact of long-term N additions upon coupling between soil microbial community structure and activity.; and nutrient-use efficiencies. Soil Biol. Biochem. 2015, 91, 151–159. [Google Scholar] [CrossRef]
  58. Xiong, C.; Zhu, Y.G.; Wang, J.T.; Singh, B.K.; Han, L.L.; Shen, J.; Li, P.; Wang, G.; Wu, C.; Ge, A.; et al. Host selection shapes crop microbiome assembly and network complexity. New. Phytol. 2021, 229, 1091–1104. [Google Scholar] [CrossRef]
  59. Ajilogba, C.F.; Olanrewaju, O.S.; Babalola, O.O. Plant growth stage drives the temporal and spatial dynamics of the bacterial microbiome in the rhizosphere of vgna subterranea. Front. Microbiol. 2022, 13, 825377. [Google Scholar] [CrossRef]
  60. Gosling, P.; Proctor, M.; Jones, J.; Bending, G.D. Distribution and diversity of ParaGlomus spp. in tilled agricultural soils. Mycorrhiza 2014, 24, 1–11. [Google Scholar] [CrossRef]
  61. Aguilar-Trigueros, C.A.; Hempel, S.; Powell, J.R.; Cornwell, W.K.; Rillig, M.C. Bridging reproductive and microbial ecology: A case study in arbuscular mycorrhizal fungi. ISME 2018, 13, 873–884. [Google Scholar] [CrossRef] [Green Version]
  62. Ray, J.D.; Dhanapal, A.P.; Singh, S.K.; Hoyos-Villegas, V.; Smith, J.R.; Purcell, L.C.; King, C.A.; Boykin, D.; Cregan, P.B.; Song, Q.; et al. Genome-wide association study of ureide concentration in diverse maturity group IV soybean [Glycine max (L.) Merr.] accessions. G3 Genes Genomes Genet. 2015, 5, 2391–2403. [Google Scholar] [CrossRef] [Green Version]
  63. Jugea, C.; Prévost, D.; Bertrand, A.; Bipfubusa, M.; Chalifour, F.P. Growth and biochemical responses of soybean to double and triple microbial associations with Bradyrhizobium.; Azospirillum and arbuscular mycorrhizae. Appl. Soil Ecol. 2012, 61, 147–157. [Google Scholar] [CrossRef]
  64. Wang, C.; Zheng, M.M.; Hu, A.Y.; Zhu, C.Q.; Shen, R.F. Diazotroph abundance and community composition in an acidic soil in response to aluminum-tolerant and aluminum-sensitive maize Zea mays L. cultivars under two nitrogen fertilizer forms. Plant Soil 2018, 424, 463–478. [Google Scholar] [CrossRef]
  65. Hinsinger, P.; Bengough, A.G.; Vetterlein, D.; Young, I.M. Rhizosphere: Biophysics.; biogeochemistry and ecological relevance. Plant Soil 2009, 321, 117–152. [Google Scholar] [CrossRef]
Figure 1. Alpha diversity of AMF (a) and nifH (b) in the rhizospheres of three soybean genotypes differing in MGs. All the data are presented based on the box line plots of Chao1, Observed_species, Shannon, and Simpson of OTU/ASV. In each panel, the horizontal coordinate is the group label, the vertical coordinate is the value of the corresponding alpha diversity index, and the number under the diversity index label is the p value of the Kruskal–Wallis test, where the black horizontal solid line with “*” indicates that the difference between different MG genotypes being connected is significant.
Agronomy 13 01713 g001
Figure 2. Community composition and distribution characteristics of AMF and diazotrophs among the different MG genotypes. Community composition of the dominant phyla of AMF (a) and nifH (b). Venn diagrams showing the percentage of shared and unique OTUs among the different MG genotypes in AMF (c) and nifH (d).
Agronomy 13 01713 g002
Figure 3. The co-occurrence network patterns of AMF and diazotrophs in MG1.4 (a), MG2.2 (b), and MG3.8 (c). Connections indicate strong (Spearman’s |r|> 0.8) and significant (p < 0.01) correlations. The orange line indicates a positive interaction between two separate nodes and the blue line denotes a negative interaction. The node size represents the degree of OTUs.
Agronomy 13 01713 g003
Figure 4. AMF and nifH were correlated with the physical and chemical indexes, respectively, and the correlations within the physical and chemical indexes. Pairwise Spearman’s correlation matrix of the soil factors is shown with pie charts, and microbial communities are related to each soil factor by Mantel tests. The edge width represents Mantel’s statistic, and the edge color represents statistical significance. The red circles indicate a negative correlation, while the blue circles indicate a positive correlation. Furthermore, SC is sucrase activity, UA is urease activity, and ALP is alkaline phosphatase activity.
Agronomy 13 01713 g004
Figure 5. Structural equation model of the relationship between the diversity of AMF and nifH and physicochemical properties. Direct effects of soil chemical properties on microbial communities and soybean yield (a). Solid lines represent positive effects for direct path coefficients > 0, and dashed lines represent negative effects < 0; direct path coefficients are normalized by taking absolute values to determine the thickness of the linkage lines and the number of labels. The red line represents the significant paths (p < 0.01). The black color of the lines indicates a non-significant relationship. Standardized indirect and total (direct plus indirect) effects derived from the structural equation model (b).
Agronomy 13 01713 g005
Table 1. Variations of soil chemical properties and enzyme activities among the different MG genotypes.
VariablesDifferent MG Genotypes
MG1.4MG2.2MG3.8
SOC (g kg−1)16.48 ± 0.40 a13.57 ± 0.28 c15.51 ± 0.25 b
TN (g kg−1)0.68 ± 0.45 b0.82 ± 0.31 a0.60 ± 0.39 b
TP (g kg−1)0.75 ± 0.67 a0.79 ± 0.01 a0.79 ± 0.61 a
MBC (mg kg−1)241.78 ± 2.14 a242.64 ± 1.08 a242.90 ± 0.84 a
MBN (mg kg−1)51.39 ± 2.35 a52.27 ± 0.63 a52.28 ± 0.81 a
MBP (mg kg−1)3.14 ± 0.16 a3.16 ± 0.75 a3.15 ± 0.08 a
SC Activity (g mg−1/24 h)22.81 ± 4.50 b31.57 ± 4.89 a40.28 ± 2.59 a
UA Activity (g mg−1/24 h)131.80 ± 1.61 ab126.47 ± 9.16 b149.33 ± 3.14 a
ALP Activity (g mg−1/24 h)0.46 ± 0.02 a0.49 ± 0.20 a0.47 ± 0.13 a
MG1.4, MG2.2, and MG3.8 are soybean maturity groups represented by three soybean genotypes. All data are presented as the mean ± SD (n = 3). Superscripts shown in a, b, and c are used to express significant differences between treatment groups. Different lowercase letters in the same line indicate statistically significant differences among the different MG genotypes (p < 0.05). SOC represents soil organic carbon, TN represents soil total nitrogen, TP represents soil total phosphorus, MBC represents microbial carbon, MBN represents microbial nitrogen, and MBP represents microbial phosphorus.
Table 2. Topological properties of the co-occurrence networks.
Network PropertiesDifferent MG Genotypes
MG1.4MG2.2MG3.8
Number of nodes7586107
Number of links6378221184
Number of positive links382495725
Percentage of positive links (%)60.060.061.2
Average degree16.9919.1222.13
Average clustering coefficient0.980.990.99
Disclaimer/Publisher’s Note: The statements, opinions and data contained in all publications are solely those of the individual author(s) and contributor(s) and not of MDPI and/or the editor(s). MDPI and/or the editor(s) disclaim responsibility for any injury to people or property resulting from any ideas, methods, instructions or products referred to in the content.

