Article

Different Concentrations of Chemical Topping Agents Affect Cotton Yield and Quality by Regulating Plant Architecture

1
Key Laboratory of Oasis Eco-Agriculture, Xinjiang Production and Construction Corps/College of Agronomy, Shihezi University, Shihezi 832003, China
2
College of Agronomy and Biotechnology, China Agricultural University, Beijing 100193, China
*
Author to whom correspondence should be addressed.
These authors contributed equally to this work.
Agronomy 2023, 13(7), 1741; https://doi.org/10.3390/agronomy13071741
Submission received: 31 May 2023 / Revised: 19 June 2023 / Accepted: 20 June 2023 / Published: 28 June 2023
(This article belongs to the Section Agroecology Innovation: Achieving System Resilience)

Abstract

:
Manual removal of the main stem tips of cotton (Gossypium hirsutum L.) is a traditional topping approach in China. However, chemical topping has become an inevitable trend. Therefore, it is of great significance to study the effect and appropriate concentration of agents for advancement of cotton whole process mechanization management technology. A two-year field experiment was conducted to evaluate the effects of different methods of topping on cotton yield and plant architecture in Shihezi, Xinjiang, China. Plant topping included manual topping, non-topping as the control, and chemical topping (high, medium, and low concentrations of topping agent) to determine a suitable topping method and topping agent concentration for machine-picked cotton. Chemical topping was performed using fortified mepiquat chloride (DPC+). Chemical topping and manual topping increased seed cotton yield compared with non-topping. Compared with non-topping, high, medium, and low concentrations of topping agent significantly increased the yield by 19.5–27.9%, 24.1–29.4%, and 24.3–28.4%, respectively. Topping treatment mainly regulated yield and total boll number per unit area by affecting the boll number per plant and had a certain positive effect on fiber strength but no significant effect on boll weight. Chemical topping affected both vertical and horizontal plant architecture characteristics of cotton; the plant height of low-, medium-, and high-concentration treatments increased by 7.2–11.4 cm, 4.0–5.7 cm, and 2.3–4.4 cm, respectively, compared with manual topping and decreased by 5.1–7.8 cm, 8.3–13.5 cm, and 9.4–16.9 cm, respectively, compared with non-topping. The number of main stem internodes was significantly different between high- and low-concentration treatments, which showed that the higher the concentration, the lower the number of the main stem internodes. Chemical topping controlled the increase in the length of the upper branches, the higher the concentration, the lower the increase in the length of the upper fruit branch. Compared with non-topping, the medium concentration of topping agent controlled the number of fruit branches, similar to manual topping. The role of upper internode length of cotton cannot be ignored under chemical topping. The peak leaf area index (LAI) of medium- and high-concentration treatments was delayed for 1 week in the late growth period (after topping for 28 d) compared with manual topping. The LAI values were high, and the duration of high values was prolonged. The optimal chemical topping agent was the medium concentration.

1. Introduction

Cotton has an indeterminate growth habit, and the apical dominance phenomenon plays an important role in the formation of plant architecture during plant growth and development, affecting the absorption of light energy, nutrient distribution, and yield formation. To increase the distribution rate of assimilates to reproductive organs and increase the flower or boll ratio and lint yield [1], apical dominance generally must be broken by manual topping in cotton production. With the development of cotton planting technology, three methods of cotton topping have been developed: manual topping, mechanical topping, and chemical topping. Xinjiang is a suitable cotton production area in China where sunlight and heat resources are abundant. In 2022, the cotton planting area was about 2.50 million hm2, and the yield was 5.39 million tons. Manual topping is still dominant, and it has been achieved by the introduction of mechanization for tillage, planting, irrigation, fertilization, and harvesting in cotton field management. Due to the shortage of manual labor and the decline in quality, manual topping has been unable to meet production demands. However, mechanical topping has not been popularized on a large scale because of excessive damage to cotton plants and bolls. Therefore, it is necessary to explore highly effective, low-cost, and mechanized operation topping technology. Chemical topping is a technique that uses plant growth regulators to delay or inhibit the growth tips of terminal cotton buds and branches [2,3], can regulate vegetative growth and reproductive growth, and possesses the following characteristics: convenient operation, time saving, labor saving, and easy-to-realize mechanized operation [4]. Problems such as missed hitting by manual topping and physical damage caused by mechanical topping should be avoided to the maximum extent [5].
Cotton has strong plasticity, and a relatively stable yield can be maintained by regulating material accumulation and distribution in different environments [6]. Regarding the effect of chemical topping on cotton yield, three different conclusions were made in previous studies: no effect on cotton yield [7,8,9], an increase in production [10,11,12], and a decrease in production [13]. The boll number of upper fruit branches after chemical topping is higher than that after manual topping [5]; however, the distribution rate of photosynthetic matter to the upper bolls of cotton plants decreases, thus reducing the boll weight in the upper part of the plant. Other studies have shown that chemical topping has no effect on cotton boll weight but has a significant effect on other yield components [14]. Chemical topping has no significant effect on lint percentage [9], but other studies have shown that chemical topping reduces [15] or significantly increases cotton lint percentage [14]. This may be due to factors such as different row spacing planting patterns [2,16,17], different concentrations of chemical topping agents [11], different control groups (manual topping or non-topping), different varieties, and different management models, such as irrigation or the combination of irrigation and rainfall.
Plant architecture is one of the most important factors determining crop yield. Apical dominance and branch number determine crop plant architecture to a great extent [18] and affect nutrient distribution, plant height, and yield [19,20]. Moreover, plant height, branching angle, and other factors also affect the plant architecture of crops [18]. There is generally a negative correlation between the number of branches and plant height [21], which manifests as the strengthening or weakening of apical dominance. Different crops utilize apical dominance differently. Rice increases its yield by weakening apical dominance and increasing the number of branches [22]. However, maize increases its yield by strengthening apical dominance and reducing the number of branches [23,24]. Crop domestication often involves changes in plant architecture and apical dominance, reducing or increasing the number of branches by selectively inhibiting or promoting bud formation, thus changing crop plant architecture and apical dominance [23]. Plant architecture is an important characteristic of cotton variety. There are significant differences among different plant architectures in yield, quality, and stress resistance. Regulating cotton plant architecture by technical means is also an important part of cotton cultivation. Shaping a good architecture is a strong guarantee of the coordinated improvement of yield and quality [25,26,27]. Spraying chemical topping agents has been shown to affect cotton plant architecture characteristics [14]; for example, cotton plant height [10,28] and width were reduced, upper fruit branch length was shortened [29], the number of main stem nodes and internode length were reduced [30,31], chlorophyll content in leaves increased, leaf blades were erect, plant architecture was compact [29], canopy light transmittance and photosynthetic matter accumulation increased [12], and light energy utilization efficiency was improved [32]. Therefore, it is of great significance to use chemical topping to inhibit the top growth of cotton and to shape plant architecture, which is beneficial to the formation of yield and quality.
Therefore, we hypothesized that the effects of chemical topping might be affected by the chemical concentration. Two years of field experiments were carried out to study the effects of chemical concentrations on cotton topping in the Xinjiang cotton area. The objectives of this investigation were to determine (a) the effects of topping methods and chemical agent concentrations on seed cotton yield and its components and (b) the effect of the topping method and chemical agent concentration on the plant architecture index of cotton. The results provide a theoretical basis for the further utilization of plant growth regulators to regulate cotton growth and promote simplified cultivation.

2. Materials and Methods

2.1. Overview of the Study Site

Two years of field experiments were conducted at Wulanwusu Agrometeorology Experimental Station (44°17′ N, 85°49′ E) in Xinjiang and No.1 Company of Shihezi University Teaching Test site (44°20′ N, 85°58′ E) during the growing seasons of 2019 and 2020, respectively. The soil texture was loam and clay in 2019 and 2020, respectively. The tested varieties were Xinluzao61 and Xinluzao72 in 2019 and Xinluzao67 in 2020. The plots were irrigated 8 times and 9 times, and the irrigation quantity was 4015 and 4200 m3·hm−2 throughout the whole growth period in 2019 and 2020, respectively. Fertilization was carried out with 195.9 and 223.2 kg·hm−2 N (urea), 169.0 and 165.6 kg·hm−2 P2O5, and 154.8 and 123.1 kg·hm−2 K2O in 2019 and 2020, respectively. Cotton was sown on 20 April, and it emerged on 30 April in both years. Other field management procedures were the same as used in local large-field cotton plantings.

2.2. Experimental Design

In this experiment, fortified DPC (DPC+, mepiquat chloride + additives) was selected as the chemical topping agent, and it was provided by Hebei Guoxin ahadzi-nonon Biological Technology Co., Ltd. (Hejian, China). Chemical topping was conducted via foliar application of DPC+ in three different amounts: a low concentration (90 g·hm−2 + 60 mL·hm−2), a medium concentration (180 g·hm−2 + 120 mL·hm−2), and a high concentration (270 g·hm−2 + 180 mL·hm−2). The experiment was compared with non-topping (CK1) and manual topping (CK2). A randomized block design was adopted, and the plot area was 28 m2, with three replications. Local manual topping was carried out on 13 July and 15 in 2019 and 2020, using the traditional topping method to remove the tips with one leaf and one heart. The chemical topping agent was artificially sprayed in the field with a knapsack sprayer on the same day.

2.3. Sampling and Determination

2.3.1. Yield Components and Cotton Fiber Quality

Three plots of 6.67 m2 were randomly selected at boll opening. Thirty open bolls from the upper (7–9 fruit branches), medium (4–6 fruit branches), and lower (1–3 fruit branches) fruit branches were randomly selected in each plot and dried to determine the single boll weight. All bolls were harvested in each plot and weighed to determine the total seed cotton yield.
A 20 g lint sample of each part was selected and numbered to determine the cotton fiber quality. A quality index was determined following the guidelines provided by the Cotton Quality Supervision, Inspection and Testing Center of the Ministry of Agriculture and Village (Anyang, China).

2.3.2. Plant Architecture Characteristics

For each treatment, ten consecutive cotton plants with consistent growth were selected for fixed-point planting, and the plant height, number of main stem internodes, number of fruit branches, length of main stem internodes, and length of upper fruit branches were measured regularly.

2.3.3. Leaf Area Index

After spraying the chemical topping agent, the leaf area index (LAI) was measured using an LI-2100C canopy analyzer (LI-Cor, Lincoln, NE, USA) every 7 days and 5 times during the growth period following Malone et al. [33].

2.3.4. Net Photosynthetic Rate of a Single Leaf

Twenty plants with consistent growth were selected in each treatment before topping, with 10 plants in the middle row and side row. Twenty leaves on the second fruit branch of the main stem were marked, and the photosynthetic rate (Pn) of the marked leaves was measured regularly using an LI-6400 portable photosynthesis system (LI-6400; LI-COR, Lincoln, NE, USA).

2.4. Data Processing

The grey system, proposed by Julong Deng, is suitable for solving problems with complicated interrelationships between multiple factors and variables [34,35]. The grey-based Taguchi method follows the optimization method developed by Dr. Genichi Taguchi. The grey system, which is used to combine all considered performance characteristics in optimization problems, requires less data and can analyze many factors, overcoming the disadvantages of statistical methods.
According to the grey system theory, cotton yield, plant architecture traits, plant height and other plant architecture traits were considered as a system. Each trait is a factor of the system. The degree of correlation between factors is judged according to the similarity of the geometric shape of the factor series. The closer the curve is, the closer the corresponding sequence is; conversely, more distant curves show that they are estranged from each other.
The yield is set as the reference series, and the plant height, the number of fruit branches, the internode length and the upper fruit branch length are compared. The plant height is set as the reference series, and the fruit branch number, internode length and upper fruit branch length are compared.
Because the dimensions of each character are different, the original data need to be dimensionless according to the grey system theory of Deng et al. [34,35]. According to the formula xi(k)′ = [xi(k) − x i ¯ ]/s, where xi(k)′ is the normalized value after dimensionless processing, xi(k), which is the average value of the same character for different varieties, is the performance value of each character. s is the standard deviation of the same character. Different reference series and comparison series were set. The gray correlation degree analysis was carried out with a resolution coefficient of 0.5, and the calculation was carried out using DPS data processing system v19.05 [36].

3. Results

3.1. Seed Cotton Yield and Yield Components

There were extremely significant differences in cotton yield and yield components between plant topping methods and in boll weight and boll number per plant among varieties (p < 0.001), but there was no interaction between varieties and plant topping on the yield and yield components (Table 1). There were significant differences in seed cotton yield between non-topping and manual topping, non-topping and chemical topping. There was no significant difference in yield between manual topping and chemical topping, also between different agent concentrations. The boll number per plant and the total boll number (boll number per unit area) of Xinluzao61 were significantly different between manual topping and chemical topping methods. Compared with non-topping, the low, medium, and high concentrations of topping agent significantly increased the seed cotton yield by 19.5–27.9%, 24.1–29.4%, and 24.3–28.4%, respectively, the boll number per plant by 20.0–21.1%, 19.7–22.2%, and 21.2–23.9%, respectively, and the total boll number by 21.6–28.6%, 22.5–31.2%, and 23.5–27.5%, respectively.
Compared with manual topping, chemical topping had a certain negative effect on upper boll weight, and in Xinluzao72, the upper boll weight decreased slightly, but in the other two varieties, it decreased significantly by 13.0–17.2%. Compared with non-topping, the upper boll weight of Xinluzao67 after chemical topping significantly increased by 8.7–10.6%, while that of the other two varieties slightly increased. The boll weight in the middle part of Xinluzao72 under medium concentration significantly increased by 18.4%, but it slightly increased in the other treatments compared with non-topping. There was no significant difference in cotton lint percentage or boll number in the middle or lower parts of cotton plants among different plant topping methods. Although the upper boll number per plant after chemical topping was numerically higher than that after manual topping and non-topping, there were no significant differences of upper boll number per plant between some treatments. However, the upper boll number of Xinluzao67, was significantly higher than manual topping under high-concentration treatment, and was significantly higher than non-topping under low- and medium-concentration treatments. This was mainly due to the increase in boll number in the upper part of the cotton plant (Table 2).
There were no significant differences in upper half mean length, uniformity index, micronaire value, and elongation of cotton fiber among different plant topping methods (Table 3). Plant topping treatments had a significant effect on fiber strength. The fiber strength of Xinluzao72 and Xinluzao61 with high-concentration topping was significantly higher than that with non-topping and showed an increasing trend compared to that with manual topping. The fiber strength of Xinluzao61 with medium-concentration topping was significantly higher than that with manual topping and non-topping.

3.2. Plant Architecture Characteristics

The plant height, which continued to increase after applying different concentrations of chemical topping agents but significantly decreased compared with non-topping, was significantly affected by different plant topping treatments. There were significant differences between plant topping treatments in plant height 14–35 d after topping, especially at 35 d. The plant height increased by 7.2–11.4 cm, 4.0–5.7 cm, and 2.3–4.4 cm for low-, medium-, and high-concentration treatments, respectively, compared with manual topping, but it decreased by 5.1–7.8 cm, 8.3–13.5 cm, and 9.4–16.9 cm for low-, medium-, and high-concentration treatments, respectively, compared with non-topping (Table 4).
There was an extremely significant difference in the number of main stem internodes among varieties after chemical topping. At 14 d after topping, the number of main stem internodes tended to be stable, and were significantly affected by varieties and plant topping, but there was no interaction between varieties and plant topping. At 35 d after topping, the number of main stem internodes increased by 2.00–2.13, 1.47–1.90, and 1.00–1.40 for low-, medium-, and high-concentration treatments, respectively, compared with manual topping, but decreased by 0.87–1.33, 1.53–1.73, and 1.80–2.00, respectively, compared with non-topping (Table 5).
The length of main stem internodes continued to increase after chemical topping. The upper internode length after chemical topping was significantly lower than that after manual topping and non-topping (Table 6) and was reduced by 0.64–0.95 cm, 0.86–1.15 cm, and 0.90–0.95 cm for low-, medium-, and high-concentration treatments, respectively, compared with manual topping, and by 0.32–0.76 cm, 0.54–0.96 cm, and 0.58–1.91 cm, respectively, compared with non-topping. There was no significant difference in the remaining internode length between different concentrations for chemical topping, non-topping, and manual topping methods. Compared with non-topping and manual topping, the whole internode length of Xinluzao67 under chemical topping was significantly decreased, while that of the other two varieties no significant decrease.
The number of fruit branches was significantly different after chemical topping in different varieties; there was no significant difference in the number of fruit branches at 7 d after topping, but extremely significant differences in the number of fruit branches were observed 14 d after topping (p < 0.001), with no interaction between varieties and plant topping. There was a significant difference in the number of fruit branches between low and medium or high concentration treatments, but no significant difference in the number of fruit branches between medium and high concentration treatments (Table 7). At 35 d after topping, the number of fruit branches increased by 1.70–2.13, 1.40–1.60, and 0.97–1.30 in low-, medium-, and high-concentration treatments, respectively, compared with manual topping but reduced by 0.47–2.10, 1.13–2.20, and 1.40–2.50, respectively, compared with non-topping.
The length of the upper fruit branch after chemical topping was significantly lower than that after manual topping and non-topping (Table 8), and it decreased by 1.21–17.63%, 11.64–41.78%, 27.95–57.86%, and 49.12–66.97% in the fourth, third, second, and first branches, respectively, compared with manual topping. The length of the upper fruit branches for different concentrations of topping agent showed the following pattern: low concentration > medium concentration > high concentration. After topping, there were very significant differences in the length of the upper fruit branches among varieties (p < 0.01), extremely significant differences in third, second, and first fruit branches among treatments (p < 0.001), and significant differences in fourth fruit branches (p < 0.05). Varieties and plant topping methods had interactive effects on the second and first fruit branches.
Using the yield characteristics as the reference series and other plant architecture traits as the comparative series, the correlation degree between cotton yield and plant architecture-related traits was as follows: plant height, whole internode length, remaining internode length, number of fruit branches, number of main stem internodes, upper internode length, fourth branch length, second branch length, third branch length, and first branch length (Table 9). According to the principle of correlation analysis, the sequence with a large degree of correlation was closely related to the reference series, and the sequence with a small degree of correlation was alienated from the reference series. Therefore, the effect sizes of plant architecture traits on cotton yield were plant height and whole internode length, followed by remaining internode length, number of fruit branches, number of main stem internodes, and upper internode length. The lengths of the fourth, second, third, and first branches had little effect on yield.

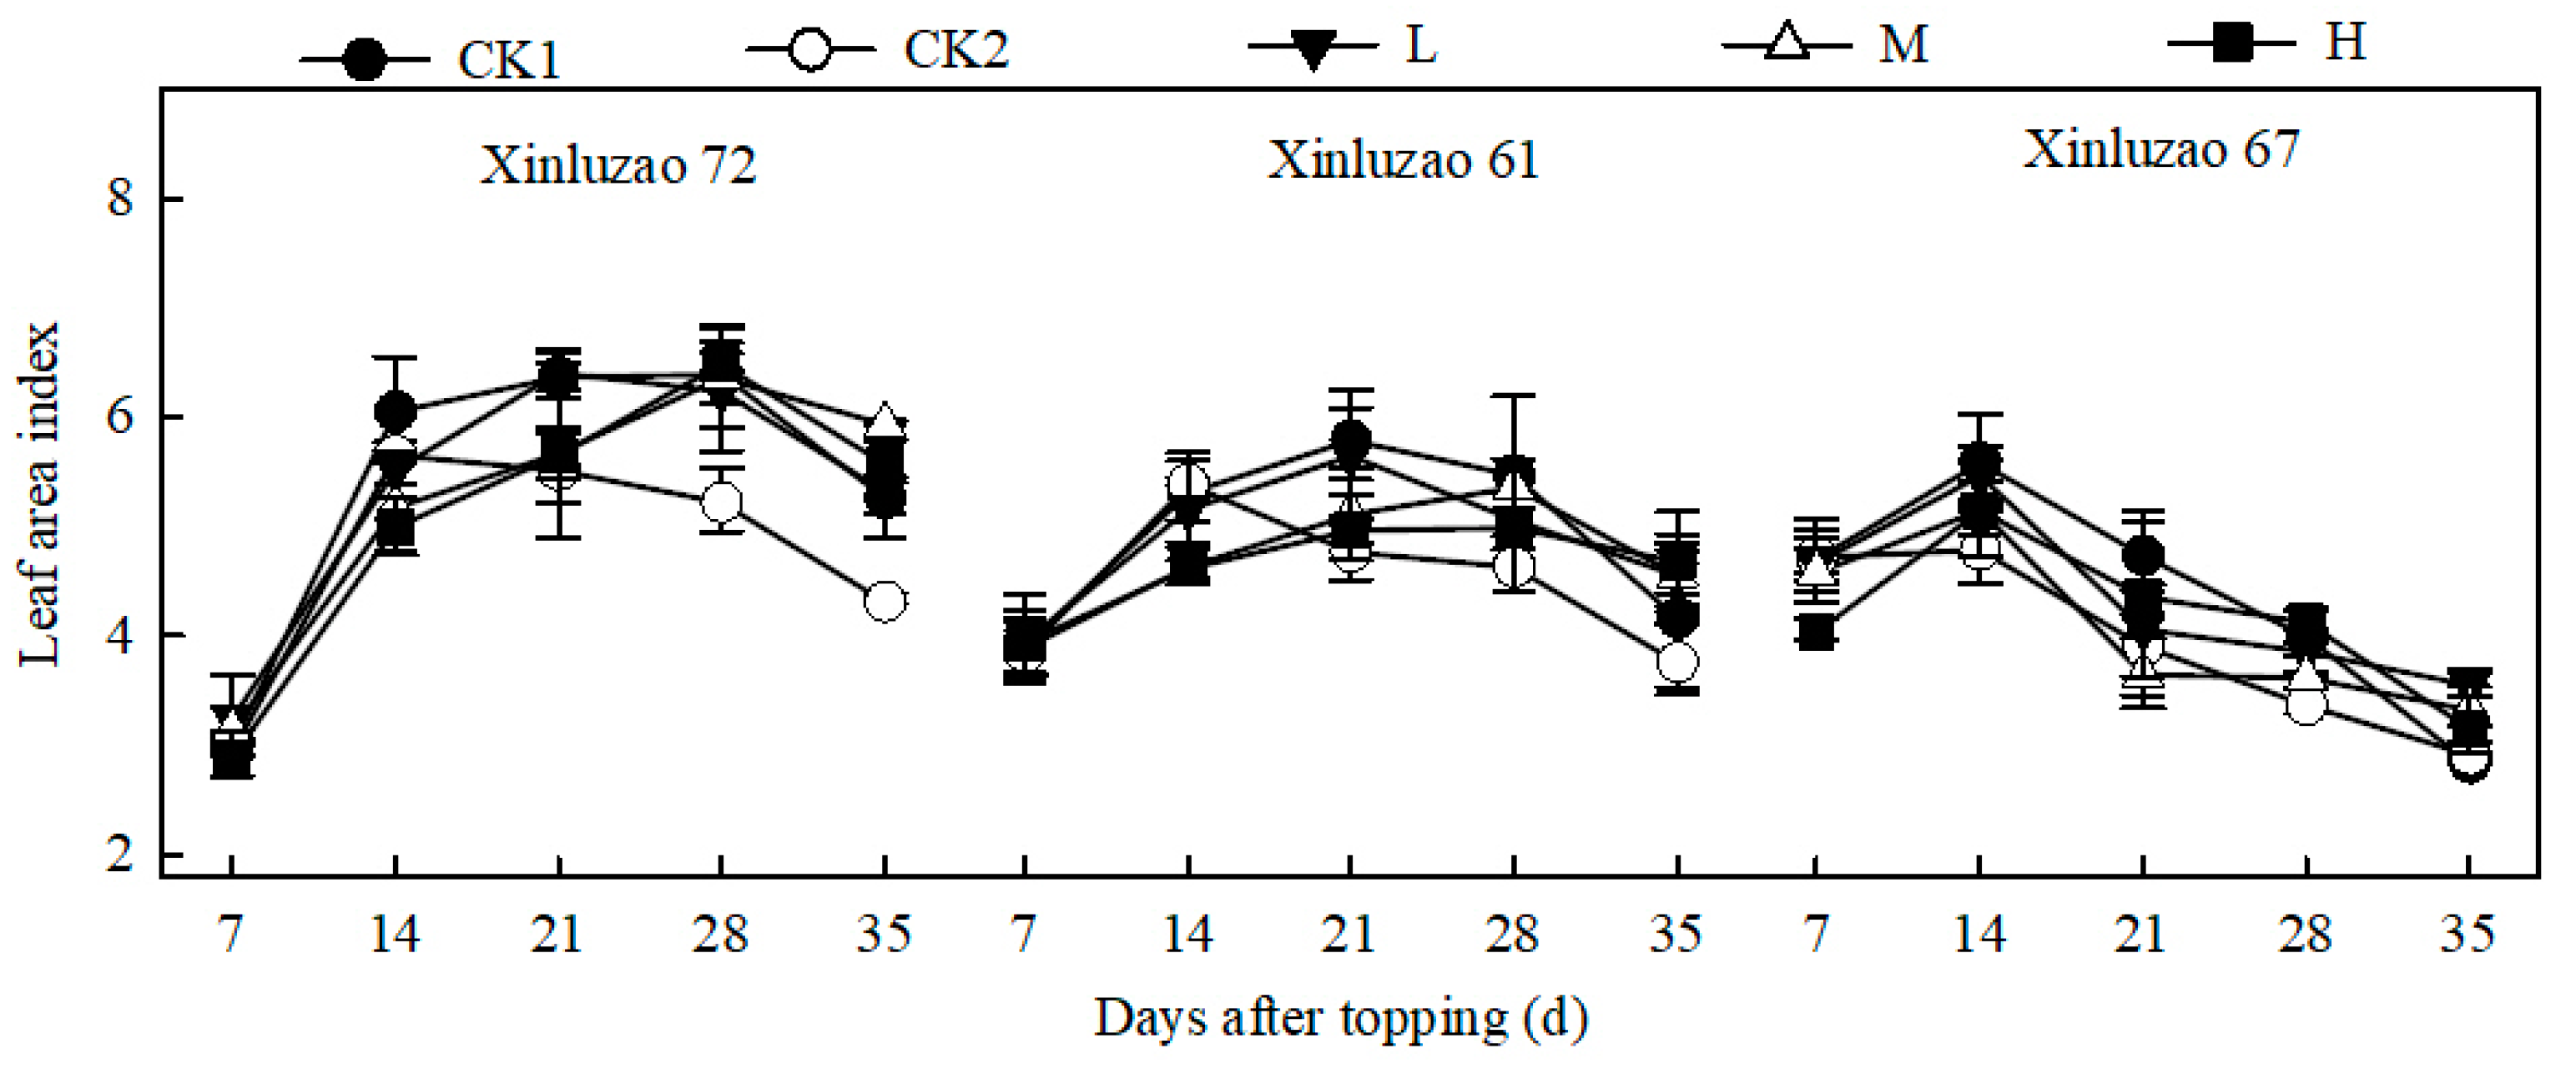
3.3. Dynamics of LAI

There were extremely significant differences in LAI among cotton varieties (p < 0.001) and very significant differences among plant topping methods (p < 0.01) 14 d after topping. Varieties and plant topping had interactive effects on LAI (Table 10). The LAI first increased and then decreased with the advance of the cotton growth period (Figure 1, Table 10), and the value of LAI was higher and the duration of a high LAI value was longer for chemical topping compared with manual topping.
The peak LAI was 4.80–5.68, 5.61–6.41, 5.49–5.68, 5.17–6.38, and 5.17–6.38 after manual topping, non-topping, and low-, medium-, and high-concentration treatments, respectively. In 2009, compared with the peak LAI, the decrease in LAI after manual topping and after low concentration treatment occurred 21 d after topping (emergence 86 d). The peak occurred 14 d after non-topping, but for medium and high concentrations of chemical topping, it occurred at 28 d. At 35 d after topping, the decreased peak LAI was 17.54% and 27.95% using manual topping, 23.57% and 30.04% using non-topping, 16.82% and 19.29% using a low concentration of chemical topping, 6.63% and 14.86% using a medium concentration of chemical topping, and 6.19% and 13.95% using a high concentration of chemical topping in Xinluzao72 and Xinluzao61, respectively (Figure 1, Table 10).

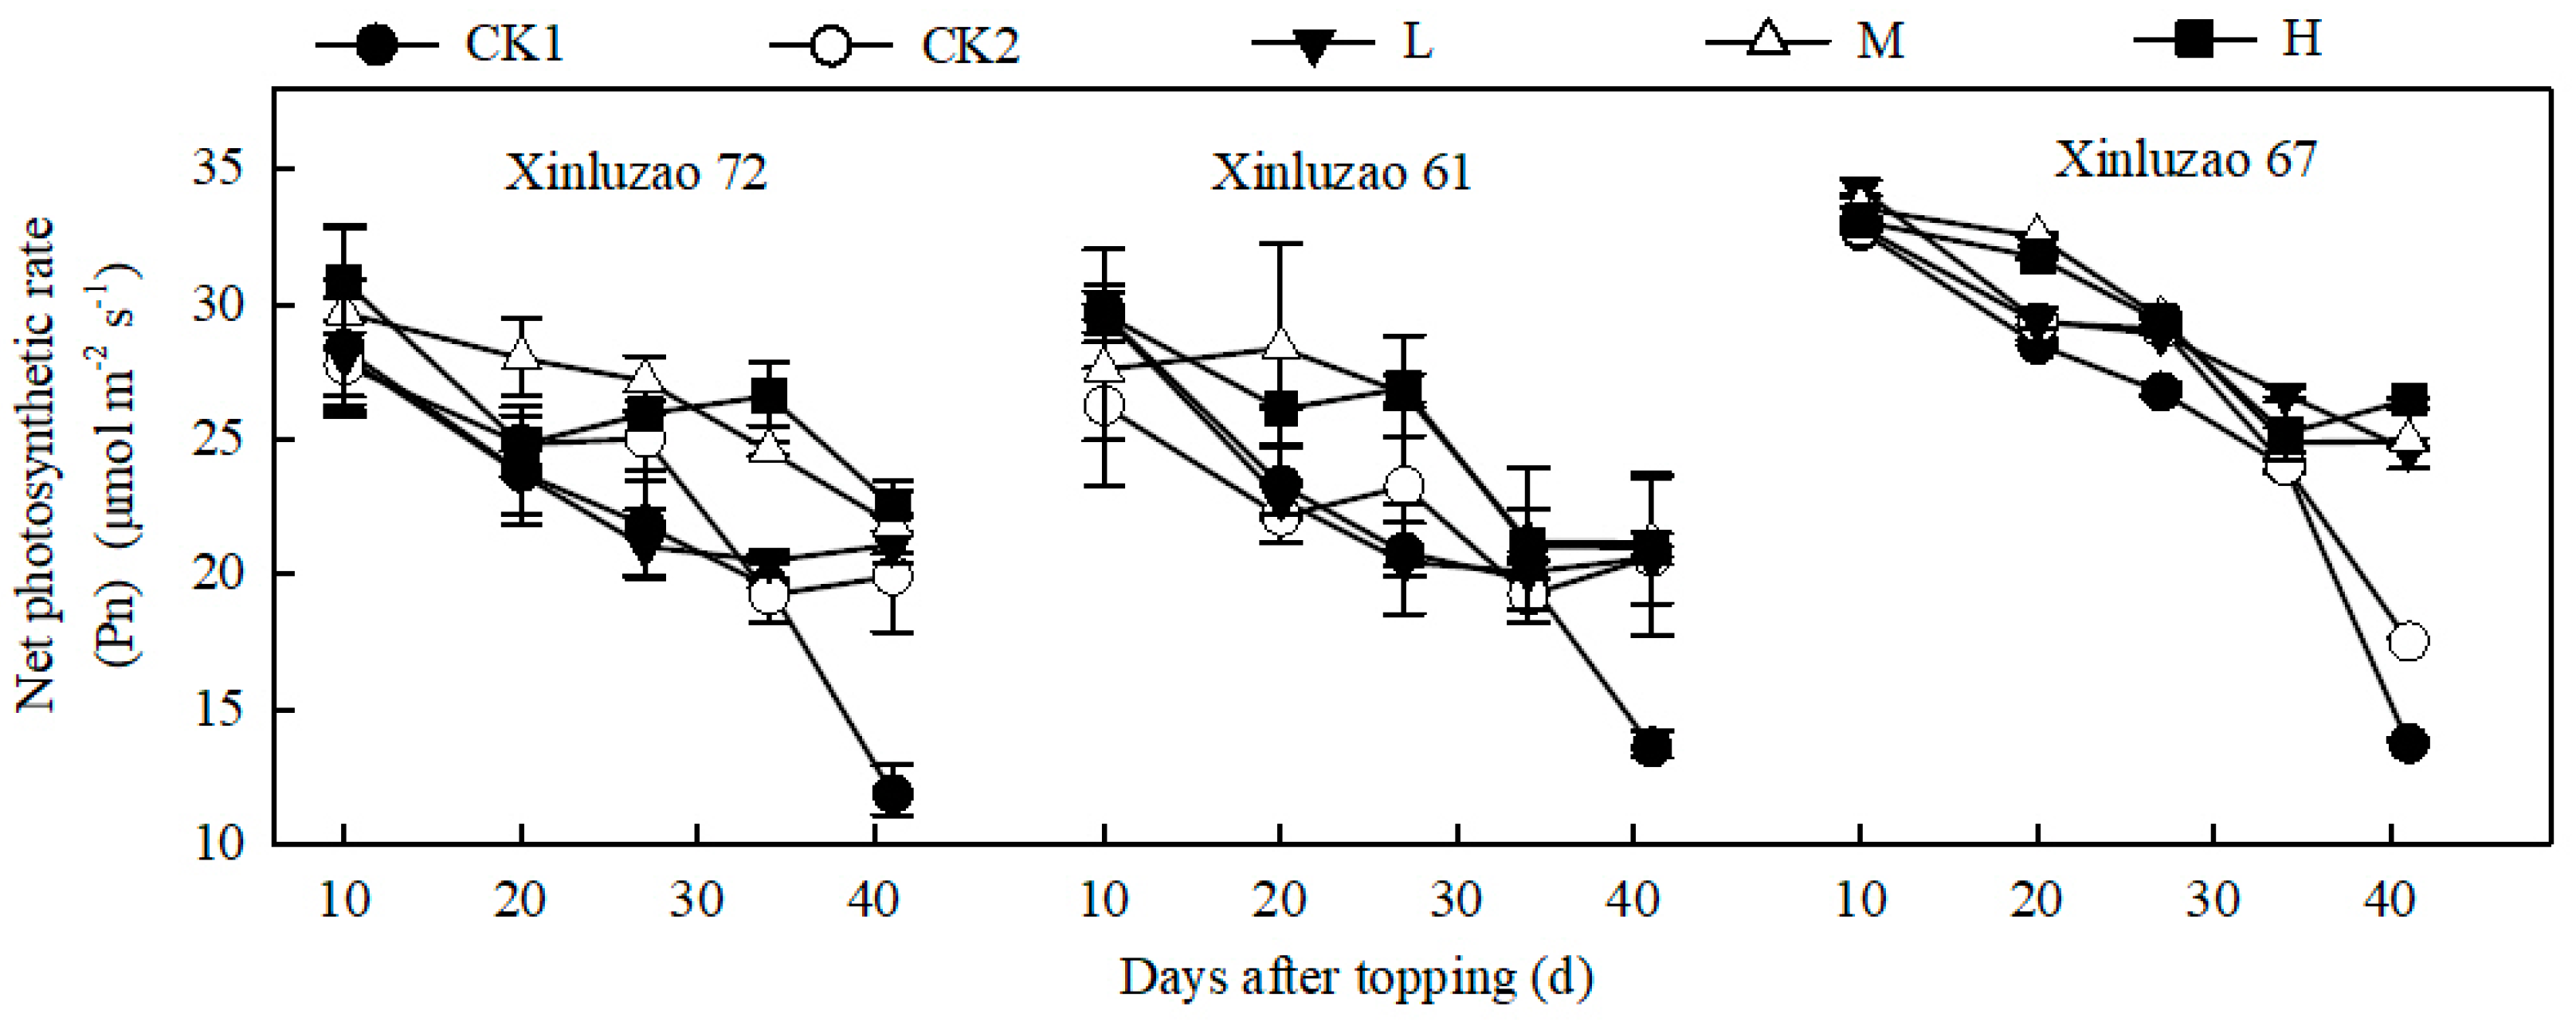
3.4. Net Photosynthetic Rate of Leaves

The net photosynthetic rate of the marked leaves of cotton (Pn) decreased with the advance of the growth process. However, the extent of the decrease was different in each treatment. At 41 d after topping (emergence 100 d), Pn decreased by 53.85–57.82%, 21.22–46.52%, 24.75–30.15%, 23.22–26.25%, and 19.88–28.98% in non-topping, manual topping, and low-, medium-, and high-concentration treatments, respectively. The Pn of non-topping was the lowest, and the amount of decrease was the greatest. The chemical topping decreased the Pn more than manual topping, and the extent of decline was in the following order: low concentration > medium concentration > high concentration (Figure 2, Table 11).

4. Discussion

4.1. Chemical Topping Has a Positive Regulatory Effect on Cotton Yield and Yield Components

Previous studies have suggested that chemical topping has an increasing [9,11,12], decreasing [13], or no effect on yield [7,8,37]. This study showed that chemical topping had a significant yield-increasing effect compared with non-topping, and it had a slight yield-increasing effect compared with manual topping but not significantly. Plant topping has no significant effect on lint percentage but has a significant effect on the upper boll weight. The effect of topping on the development of the upper boll may be mainly reflected in its influence on the development of cottonseed. However, the effect of topping on the degree of development and physiological and biochemical mechanisms of cottonseed is not clear and needs to be further studied. The boll weight of different varieties was mainly affected by their own genetic characteristics and was relatively stable; thus, the effect of chemical regulation on cotton yield was mainly achieved by regulating the number of bolls per plant and the total bolls per unit area and by maintaining the relative stability of cotton yield.
Different plant topping treatments have a significant effect on fiber strength. The fiber strength of Xinluzao61 using medium and high concentrations of chemical topping and that of Xinluzao72 using a high concentration of chemical topping were significantly higher than that using non-topping, and that of Xinluzao61 using a medium concentration of chemical topping was also significantly higher than that when using manual topping. This may be related to the bolls of the new upper part not being mature enough when using non-topping. Therefore, chemical topping has a certain positive effect on fiber strength.

4.2. Chemical Topping Creates a Compact Plant Architecture by Affecting Plant-Related Traits

In field crop production, close planting and chemical regulations are adopted to shape the ideal plant architecture, which can achieve a breakthrough in crop yield level. Plant architecture is one of the key factors affecting crop yield [18,19], and good plant architecture can ensure the coordinated improvement of crop yield and quality [25,26,27]. Apical dominance is an important physiological phenomenon in the process of crop aboveground growth, and it has a significant influence on the formation of crop plant architecture. Mepiquat chloride can effectively break apical dominance in cotton and produce an effect similar to manual topping [38]. It is generally believed that the plant height suitable for mechanical harvesting of cotton should be 75–85 cm [39]. In this study, the plant height after spraying different concentration of topping agent in the harvest period was within the range suitable for mechanical harvesting. DPC+ topping could not immediately inhibit the growth of the main stem, and the plant height and the number of main stem internodes increased to a certain extent compared with manual topping. Generally, the plant height of cotton stopped increasing at 15–20 d after chemical topping [40]. Transcriptome profiling previously showed that the most significant gene changes occurred after 6 d of DPC spraying [41]. In this study, the growth rate of cotton plant height decreased significantly, especially when using a high concentration of topping agent, and the number of main stem internodes was still increasing 7 d after topping. At 14 d after topping, the plant height when using high, medium, and low concentration treatments significantly differed, while the number of main stem internodes significantly differed only between high and low concentration treatments. The higher the concentration, the lower the plant height and the lower the number of internodes. A high concentration of DPC+ can control the plant height well 7 d after topping, which may be related to the fact that the auxiliaries in DPC+ can cause slight damage to the apical bud of cotton plants [5,7]. As a result, the degree of oxidative stress in cotton apical buds was higher and longer, and this may also be related to changes in gene expression [42] and hormone levels in cotton apical buds.
The coordination of the cotton source–sink relationship is not only a material relationship, but plant hormones may also be an important information regulation system [43]. The mechanism of DPC inhibiting the apical dominance of cotton is that it acts as an inhibitor of gibberellin (GA) and inhibits fruit branch elongation and plant height growth by reducing its own GA3 content in cotton tissue [44]. Specifically, it retards vegetative growth by inhibiting the activity of gibberellin involved in cell elongation, which inhibits the signaling pathways and disturbs GA homeostasis by upregulating site-specific genes that ultimately result in keeping the plant stature shorter [45]. Previous studies have suggested that the sensitive genes of DPC are mainly related to the synthesis and metabolism of GA and IAA (auxin) [46]. The contents of endogenous hormones GA1, GA3, GA4, and IAA in cotton seedlings decrease significantly after 6 d of DPC treatment [47,48], and transcriptome sequencing showed that GA catabolism genes (GA2ox1, CYP714A1), GA biosynthesis genes (KAO1), and GA signal transduction genes (RGA2, GAI, GID1) are downregulated [47]. The expression of the auxin negative regulatory gene (AUX/IAA) is upregulated, and the gene driving auxin synthesis (ARF) and the auxin downstream gene (GH3) are downregulated [48]. Transcriptome analysis showed that DPC not only inhibited GA biosynthesis, it also affected many pathways [41]. However, the molecular mechanism of its inhibition of plant growth is still unclear. Cytokinin (CK) is the integrator of many exogenous and endogenous signals in apical dominance, which provides plasticity for the plant branching process [49]; CK synthesis is induced by IAA [50,51]. The most important mechanism of IAA regulating CK is the inhibition of IPT genes, which are adenosine phosphate-iso-pentenyl-transferase, the key enzymes of CK biosynthesis. In diverse species, IAA downregulates the stem expression of IPT genes [52,53,54] and decreases CK levels in stem tissues, as well as in the xylem and phloem saps [55]. The expression of IPT genes in the absence of auxin requires light [54] or the presence of sugars [52]; however, sucrose does not interfere with auxin in regulating CK levels [56]. The molecular mechanism of regulation by IAA and the sugars of IPT enzymes for CK synthesis is still unclear [49]. The cotton plant tip was removed by manual topping, and the restriction of IAA on IPT gene expression was relieved. Under sufficient light and photosynthate conditions in the upper part, the plant synthesizes more CK, thus promoting the elongation and growth of the upper fruit branch, while the growth of the lower fruit branch is inhibited due to the limitation of light or sugar supply. However, the chemical topping method inhibited the growth of the terminal bud, which not only inhibited GA3 synthesis from the plant but also reduced the supply of auxin from the terminal bud to the lateral branch, increased the supply of nutrients to the lateral branch, reduced the shedding rate of new bolls, improved the growth status of the upper bolls, and increased the boll formation rate of the upper part. Moreover, chemical topping increased the light transmittance in the middle and lower parts of the cotton canopy [12], which was conducive to the development and maturation of buds and bolls in the middle and lower parts, maintaining the relative stability of yield and quality.

4.3. Chemical Topping Maintains the Relative Stability of Yield by Regulating Horizontal and Vertical Growth

Previous studies have shown that the vertical growth of cotton is most severely restricted by manual topping, whereas its horizontal growth is most severely restricted by chemical topping [8]. In this study, chemical topping had a significant influence on both the vertical and horizontal growth of cotton. It not only significantly inhibited plant height, the number of main stem internodes, and the length of main stem internode, it also inhibited the increase in the upper fruit branch length. The higher the chemical concentration, the less increased the upper fruit branch length, which increased significantly after manual topping. The number of fruit branches continued to increase in chemical topping and gradually became stable 14 d after topping. The number of fruit branches was significantly higher than with medium concentrations, high concentrations, and manual topping under low concentration, but there was no significant difference between medium- and high-concentration treatments. This shows that the medium-concentration treatment can regulate the number of fruit branches, similar to manual topping. Gray correlation analysis was carried out on cotton yield and plant architecture-related characteristics, such as plant height. Plant height and whole internode length had the greatest influence on yield, while upper internode length and whole internode length had the greatest influence on plant height. The fruit branches in different parts of the same treatment changed from the first branch to the fourth branch, and the difference between the two fruit branches of adjacent height was about 2 cm using chemical topping. The tower structure is more obvious, and the plant architecture is more compact after chemical topping. Therefore, in actual production, it is of great significance to regulate the internode length of cotton plants, especially the upper internode length. The responses of plant architecture characteristics and yield components of varieties that are sensitive to different concentrations of topping agents need to be further studied.
The assimilates produced in the main stem were mostly distributed to corresponding fruit branches and bolls, while the others were distributed for the growth of the lower fruit branches and the main stem point [57]. Previous studies have shown that chemical topping results in a greater inner boll fraction at the middle nodes [8]. Chemical topping retains the growth point of the main stem that supplies the assimilates of the main stem leaves, correspondingly reducing the supply of fruit branches for lateral growth, which may be one of the reasons why chemical topping has a significant effect on the horizontal growth of cotton. However, the assimilates that flow to the main stem and leaves corresponding to fruit branches and bolls mainly supply the bud and bolls of the first fruit node [57]. Therefore, the inner boll of chemical topping has a greater contribution to the yield. Previous studies have shown that manual topping reduces the number of fruit branches but promotes the formation of upper bolls [58,59]. Chemical topping can increase the number of inner bolls [7,60]. This may be one of the reasons why the chemical topping yield remains relatively stable.

4.4. Chemical Topping Can Regulate Plant Architecture and Increase the Photosynthetic Area and Photosynthetic Function Period

Cotton varieties with long maturity, thick and small leaves, and high photosynthetic rates have greater potential to increase yield [45]. Increasing leaf area and the distribution rate of assimilates to reproductive organs are beneficial in increasing cotton yield. For individuals, the chlorophyll content of cotton leaves increased after chemical topping [29] and improved the light energy utilization rate [37]. Compared with manual topping, chemical topping can increase the LAI and duration, which is consistent with the results of Liu et al. [32] and Yang et al. [12]. Reasonable growth regulators can improve the photosynthetic capacity and increase the accumulation of photosynthetic assimilates [61]. Chemical topping shortens the length of the upper fruit branch and increases light transmittance in the middle and low parts of the canopy, which is beneficial to the absorption and utilization of light energy. In this study, the time when the peak LAI appeared to differ among treatments; the peak value of LAI in medium- and high-concentration treatments was delayed by 1 week compared with manual topping and by 2 weeks compared with non-topping in 2019. The long duration of a high LAI value in the late growth stage of chemical topping may be related to the delay in the occurrence of the LAI peak. This may also be due to the increase in the number of new fruit branches at the top of chemically topping, the number of main stem internodes, the number of main stem leaves, and the number of leaves on the new fruit branches, thus increasing the LAI. The peak value of LAI was earlier after non-topping and decreased more rapidly at the later stage, and the net photosynthetic rate of the leaves in the early boll stage was the lowest, and the decrease was the largest. This may be related to the fact that it is easy to close the cotton canopy after non-topping, and the ventilation and light transmittance of the middle and lower parts are poor. Furthermore, the light environment of the leaves becomes inferior, and the receiving light quality and light intensity are poor, resulting in premature senescence and shedding of the lower leaves. Compared with non-topping, chemical topping causes the cotton plant architecture to be more compact, improves the light absorption rate of the leaves in the middle and lower parts of the canopy, and prolongs leaf life to a certain extent, which may be one of the reasons why the LAI of the cotton field decreases slowly in the later stage. The relative contribution rates of photosynthesis in the stem and fruit (boll shell and bract) to the whole cotton plant at the late growth stage were 12.7% and 23.7%, respectively; the relative contribution rates of cotton bolls and stems to boll weight were 24.1% and 9%, respectively. Therefore, the contribution of photosynthesis of non-leaf green organs to the yield formation of cotton in the later growth stage should not be ignored [62,63]. The contribution rate of non-leaf organs to yield needs to be further studied using chemical topping.

5. Conclusions

Chemical topping and manual topping increased seed cotton yield compared with non-topping. In addition, compared with non-topping, the low-, medium-, and high-concentration treatments significantly increased the yield by 19.5–27.9%, 24.1–29.4%, and 24.3–28.4%, respectively. There was no significant difference in the yield components among the different concentrations of topping agents. The response of yield components in different varieties to the topping agent differed. the effect of chemical regulation on cotton yield was mainly achieved by regulating the boll number per plant and the total boll number by maintaining the relative stability of cotton yield. Plant height was significantly affected by chemical concentration, and the number of main stem internodes was significantly different only between high and low concentration treatments. Plant height and whole internode length had the greatest influence on yield, while upper internode length and whole internode length had the greatest influence on plant height. Length of the fruit branch in different parts under the same treatment changed from the first branch to the fourth branch, and the difference between the two fruit branches of adjacent height was about 2 cm after chemical topping. Compared with non-topping and manual topping, the tower structure was more obvious, and the plant architecture was more compact after chemical topping. In the process of chemical topping, the role of upper internode length cannot be ignored. Considering the stability of yield and economic benefits, a medium concentration of DPC+ was the best topping dose.

Author Contributions

Y.W.: Formal analysis, Visualization, Writing—original draft, Writing—review and editing. J.T. (Jiyuan Tang): Investigation, Formal analysis, Data curation. J.T. (Jingshan Tian): Methodology, Investigation, Formal analysis. M.D.: Conceptualization, Resources. L.G.: Supervision. Y.Z.: Supervision, Writing—review and editing. W.Z.: Conceptualization, Resources, Writing—review and editing, Supervision, Funding acquisition. All authors have read and agreed to the published version of the manuscript.

Funding

This work was financially support by the National Key Research and Development Plan, project no. 2020YFD1001001, Key Research and Development Plan of Eighth Division of Xinjiang Production and Construction Corps region, project no.2020ZD01.

Informed Consent Statement

Not applicable.

Data Availability Statement

Not applicable.

Acknowledgments

We are thankful for the financial support by the National Key Research and Development Plan (2020YFD1001001), Key Research and Development Plan of Eighth Division of Xinjiang Production and Construction Corps region (2020ZD01). We would also like to thank Jinyu An for assistance in the field.

Conflicts of Interest

The authors declare no conflict of interests.

References

  1. Dai, J.L.; Li, W.J.; Zhang, D.M.; Tang, W.; Li, Z.H.; Lu, H.Q.; Kong, X.Q.; Luo, Z.; Xu, S.Z.; Xin, C.S.; et al. Competitive yield and economic benefits of cotton achieved through a combination of extensive pruning and a reduced nitrogen rate at high plant density. Field Crops Res. 2017, 209, 65–72. [Google Scholar] [CrossRef]
  2. Siebert, J.D.; Stewart, A.M. Influence of plant density on cotton response to mepiquat chloride application. Agron. J. 2006, 98, 1634–1639. [Google Scholar] [CrossRef]
  3. Rosolem, C.A.; Oosterhuis, D.M.; Souzade, S.F. Cotton response to mepiquat chloride and temperature. Sci. Agric. 2013, 70, 82–87. [Google Scholar] [CrossRef] [Green Version]
  4. Xu, S.Z.; Zuo, W.Q.; Chen, M.Z.; Sui, L.L.; Dong, H.Y.; Jiu, X.L.; Zhang, W.F. Effect of Drip Irrigation Amount on the Agronomic Traits and Yield of Cotton Grown with a Chemical Topping in Northern Xinjiang, China. Cotton Sci. 2017, 29, 345–355. [Google Scholar]
  5. Zhao, Q.; Zhou, C.J.; Zhang, J.S.; Li, S.L.; Yun, Y.L.; Tian, X.L. Effect of Chemical Detopping on the Canopy and Yield of Cotton (Gossypium hirsutum) in South Xinjiang. Cotton Sci. 2011, 23, 329–333. [Google Scholar]
  6. McLean, E.H.; Ludwig, M.; Rierson, P.F. Root hydraulic conductance and aquaporin abundance respond rapidly to partial root-zone drying events in a riparian Melaleuca species. New Phytol. 2011, 192, 664–675. [Google Scholar] [CrossRef]
  7. Li, F.; Wang, X.; Wang, X.R.; Du, M.W.; Zhou, C.J.; Yin, X.F.; Xu, D.Y.; Lu, H.Y.; Tian, X.L.; Li, Z.H. Cotton chemical topping with mepiquat chloride application in the north of Yellow River valley of China. Sci. Agric. Sin. 2016, 49, 2497–2510. [Google Scholar]
  8. Zhang, J.; Han, Y.C.; Li, Y.B.; Li, X.F.; Wang, G.P.; Wang, Z.B.; Du, W.L.; Feng, L. Inhibition of apical dominance affects boll spatial distribution, yield and fiber quality of field-grown cotton. Ind. Crops Prod. 2021, 173, 114098. [Google Scholar] [CrossRef]
  9. Dai, J.L.; Tian, L.W.; Zhang, Y.J.; Zhang, D.M.; Xu, S.Z.; Cui, Z.P.; Li, Z.H.; Li, W.J.; Zhan, L.J.; Li, C.D. Plant topping effects on growth, yield, and earliness of field-grown cotton as mediated by plant density and ecological conditions. Field Crops Res. 2022, 275, 108337. [Google Scholar] [CrossRef]
  10. Gwathmey, C.O.; Clement, J.D. Alteration of cotton source-sink relations with plant population density and mepiquat chloride. Field Crops Res. 2010, 116, 101–107. [Google Scholar] [CrossRef]
  11. Mao, L.L.; Li, Z.Z.; Sun, X.Z.; Wopke, V.D.W.; Evers, J.B.; Zhao, X.H.; Zhang, S.P.; Song, X.L.; Li, Z.H. Use of the beta growth function to quantitatively characterize the effects of plant density and a growth regulator on growth and biomass partitioning in cotton. Field Crops Res. 2018, 224, 28–36. [Google Scholar] [CrossRef]
  12. Yang, C.X.; Zhang, W.F.; Xu, S.Z.; Sui, L.L.; Liang, F.B.; Dong, H.Y. Effects of Spraying Chemical Topping Agents on Canopy Structure and Canopy Photosynthetic Production in Cotton. Sci. Agric. Sin. 2016, 49, 1672–1684. [Google Scholar]
  13. Tung, S.A.; Huang, Y.; Hafeez, A.; Ali, S.; Khan, A.; Souliyanonh, B.; Song, X.; Liu, A.; Yang, G. Mepiquat chloride effects on cotton yield and biomass accumulation under late sowing and high density. Field Crops Res. 2018, 215, 59–65. [Google Scholar] [CrossRef]
  14. Zhu, L.X.; Liu, L.T.; Zhang, Y.J.; Sun, H.C.; Zhang, K.; Bai, Z.Y.; Dong, H.Z.; Li, C.D. The regulation and evaluation indexes screening of chemical topping on cotton’s plant architecture. Sci. Agric. Sin. 2020, 53, 4152–4163. [Google Scholar]
  15. Liu, Y. Effects of Mepiquat Chloride and Pruning with Topping on Cotton Crop; Huazhong Agricultural University: Wuhan, China, 2013. [Google Scholar]
  16. Gwathmey, C.O.; Craig, C.C. Managing earliness in cotton with mepiquat-type growth regulators. Crop Manag. 2003, 2, 1–8. [Google Scholar] [CrossRef]
  17. Wilson, D.G.; York, A.C.; Edmisten, K.L. Narrow-row cotton response to mepiquat chloride. J. Cotton Sci. 2007, 11, 177–185. [Google Scholar]
  18. Zhou, M.D.; Li, M.Y.; Wu, L.N.; Guo, L.J.; Wang, Q.; Ma, M. Studies on Regulation of Plant Architecture by TaKLU Gene in Wheat. J. Triticeae Crops 2022, 42, 399–406. [Google Scholar]
  19. Wei, X.Y.; Yang, J.; Lei, D.; Feng, H.; Yang, Z.; Wen, G.; He, Z.; Zeng, W.; Zou, J. The SlTCP26 promoting lateral branches development in tomato. Plant Cell Rep. 2021, 40, 1115–1126. [Google Scholar] [CrossRef]
  20. Mathan, J.; Bhattacharya, J.; Ranjan, A. Enhancing crop yield by optimizing plant developmental features. Development 2016, 143, 3283–3294. [Google Scholar] [CrossRef] [Green Version]
  21. Xing, Y.Z.; Zhang, Q.F. Genetic and molecular bases of rice yield. Annu. Rev. Plant Biol. 2010, 61, 421–442. [Google Scholar] [CrossRef] [PubMed]
  22. Doust, A. Architectural evolution and its implications for domestication in grasses. Ann. Bot. 2007, 100, 941–950. [Google Scholar] [CrossRef] [Green Version]
  23. Doebley, J.; Stec, A.; Hubbard, L. The evolution of apical dominance in maize. Nature 1997, 386, 485–488. [Google Scholar] [CrossRef]
  24. Wang, R.L.; Stec, A.; Hey, J.; Lukens, L.; Doebley, J. The limits of selection during maize domestication. Nature 1999, 398, 236–239. [Google Scholar] [CrossRef] [PubMed]
  25. Kaggwa, A.R.; Andrade, S.P.; Wang, G.Y. Plant architecture influences growth and yield response of upland cotton to population density. Field Crops Res. 2013, 145, 52–59. [Google Scholar] [CrossRef]
  26. Chen, M.Z.; Yang, Y.L.; Wang, Y.X.; Tian, J.S.; Xu, S.Z.; Liu, N.N.; Dang, K.; Zhang, W.F. Plant Type Characteristics and Evolution of Main Economic Characters in Early Maturing Upland Cotton Cultivar Replacement in Xinjiang. Sci. Agric. Sin. 2019, 52, 3279–3290. [Google Scholar]
  27. Wang, F.Y.; Han, H.Y.; Lin, H.; Chen, B.; Kong, X.H.; Ning, X.Z.; Wang, X.W.; Yu, Y.; Liu, J.D. Effects of planting patterns on yield, quality, and defoliation in machine-harvested cotton. J. Integr. Agric. 2019, 18, 2019–2028. [Google Scholar] [CrossRef]
  28. Osman, C.; Demirel, U.; Karakus, M. Effects of several plant growth regulators on the yield and fiber quality of cotton (Gossypium hirsutum L.). Not. Bot. Horti Agrobot. Cluj Napoca 2010, 38, 104–110. [Google Scholar]
  29. Yang, C.X. Effects of Chemical Topping on Plant Morphological, Canopy Structure, and Canopy Photosynthetic Production of Cotton; Shihezi University: Shihezi, China, 2016. [Google Scholar]
  30. Nichols, S.P.; Snipes, C.E.; Jones, M.A. Evaluation of row spacing and mepiquat chloride in cotton. J. Cotton Sci. 2003, 7, 148–155. [Google Scholar]
  31. Bogiani, J.C.; Rosolem, C.A. Sensibility of cotton cultivars to mepiquat chloride. Pesqui. Agropecuária Bras. 2009, 44, 1246–1253. [Google Scholar] [CrossRef]
  32. Liu, C.; Zhang, J.S.; Wei, X.; Xu, X.X. Effects of Mepiquat Chloride on Physiological Indicators of Leaf Function and Characteristics of Yield of Hybrid Cotton in South Xinjiang. Cotton Sci. 2014, 26, 122–129. [Google Scholar]
  33. Malone, S.; Herbert, D.A.; Holshouser, D.L. Evaluation of the LAI-2000 plant canopy analyzer to estimate leaf area in manually defoliated soybean. Agron. J. 2002, 94, 1012–1019. [Google Scholar] [CrossRef]
  34. Deng, J. Introduction to grey system. J. Grey Syst. 1989, 1, 1–24. [Google Scholar]
  35. Ng, D.K.W.; Deng, J. Contrasting grey system theory to probability and fuzzy. ACM Sigice Bull. 1995, 20, 3–9. [Google Scholar] [CrossRef]
  36. Tang, Q.Y.; Zhang, C.X. Data processing system (DPS) software with experimental design, statistical analysis and data mining developed for use in entomological research. Insect Sci. 2013, 20, 254–260. [Google Scholar] [CrossRef] [PubMed]
  37. Zhang, L.J.; Chen, J.Y.; Qin, Y.K.; Wang, Y.P.; Cheng, H.H.; Xia, S.N. Effects of chemical capping agent on direct cotton after rape. Hubei Agric. Sci. 2021, 60, 36–40. [Google Scholar]
  38. Li, X.; Zhu, C.H.; Xia, K.; Gan, L.J. Effects of Methyl Octanoate Methyl Decanoate and6-BA on Topping in Cotton. Cotton Sci. 2009, 21, 70–72. [Google Scholar]
  39. Li, J.F.; Wang, C.; Liang, F.B.; Chen, H.C.; Tian, J.S.; Kang, P.; Zhang, W.F. Row Spacing and Planting Density Affect Canopy Structure and Yield in Machine-Picked Cotton in Xinjiang. Cotton Sci. 2017, 29, 157–165. [Google Scholar]
  40. Yi, Z.B.; Cheng, Z.L.; Liu, H.Y. Study on the Application Effect of Chemical Topping and Pruning Agent on Cotton. China Agric. Technol. Ext. 2013, 29, 32–33. [Google Scholar]
  41. Chen, R.F.; Fan, Y.G.; Zhou, H.W.; Mo, S.P.; Zhou, Z.F.; Yan, H.F.; Luo, T.; Huang, X.; Weng, M.L.; Lakshmanan, P.; et al. Global transcriptome changes of elongating internode of sugarcane in response to mepiquat chloride. BMC Genom. 2021, 22, 79. [Google Scholar] [CrossRef] [PubMed]
  42. An, J.; Li, F.; Zhou, C.J.; Tian, X.-L.; Li, Z.-H. Morpho-physiological Responses of Cotton Shoot Apex to the Chemical Topping with Fortified Mepiquat Chloride. Crop J. 2018, 44, 1837–1843. [Google Scholar]
  43. Song, C.; Guan, Y.; Zhang, D.; Tang, X.; Chang, Y. Integrated mRNA and miRNA Transcriptome Analysis Suggests a Regulatory Network for UV-B-Controlled Terpenoid Synthesis in Fragrant Woodfern (Dryopteris fragrans). Int. J. Mol. Sci. 2022, 23, 5708. [Google Scholar] [CrossRef]
  44. Wang, L.; Yin, Y.; Jing, X.; Wang, M.; Zhao, M.; Yu, J.; Qiu, Z.; Li, Y.F. Profiling of MicroRNAs Involved in Mepiquat Chloride-Mediated Inhibition of Internode Elongation in Cotton (Gossypium hirsutum L.) Seedlings. Front. Plant Sci. 2021, 12, 643213. [Google Scholar] [CrossRef]
  45. Gérardeaux, E.; Loison, R.; Palaï, O.; Sultan, B. Adaptation strategies to climate change using cotton (Gossypium hirsutum L.) ideotypes in rainfed tropical cropping systems in Sub-Saharan Africa. A modeling approach. Field Crops Res. 2018, 226, 38–47. [Google Scholar] [CrossRef]
  46. Wang, Z.J. Identification and Function Analysis of the Mepiquat Chloride Sensitive Genes of Cotton by RNA-Seq and BSA-Seq; Shihezi University: Shihezi, China, 2022. [Google Scholar]
  47. Wang, L.; Yin, Y.; Wang, L.F.; Wang, M.; Zhao, M.; Tian, Y.; Li, Y.F. Transcriptome Profiling of the Elongating Internode of Cotton (Gossypium hirsutum L.) Seedlings in Response to Mepiquat Chloride. Front. Plant Sci. 2020, 10, 1751. [Google Scholar] [CrossRef]
  48. Wang, Z.J.; Li, Y.J.; Zhu, Q.H.; Tian, L.W.; Liu, F.; Zhang, X.Y.; Sun, J. Transcriptome Profiling Provides New Insights into the Molecular Mechanism Underlying the Sensitivity of Cotton Varieties to Mepiquat Chloride. Int. J. Mol. Sci. 2022, 23, 5043. [Google Scholar] [CrossRef]
  49. Kotov, A.A.; Kotova, L.M.; Romanov, G.A. Signaling network regulating plant branching: Recent advances and new challenges. Plant Sci. 2021, 307, 110880. [Google Scholar] [CrossRef] [PubMed]
  50. Muller, D.; Leyser, O. Auxin, cytokinin and the control of shoot branching. Ann. Bot. 2011, 107, 1203–1212. [Google Scholar] [CrossRef] [PubMed] [Green Version]
  51. Ongaro, V.; Leyser, O. Hormonal control of shoot branching. J. Exp. Bot. 2008, 59, 67–74. [Google Scholar] [CrossRef] [PubMed] [Green Version]
  52. Barbier, F.; Péron, T.; Lecerf, M.; Perez-Garcia, M.D.; Barrière, Q.; Rolčík, J.; Boutet-Mercey, S.; Citerne, S.; Lemoine, R.; Porcheron, B.; et al. Sucrose is an early modulator of the key hormonal mechanisms controlling bud outgrowth in Rosa hybrida. J. Exp. Bot. 2015, 66, 2569–2582. [Google Scholar] [CrossRef] [Green Version]
  53. Barbier, F.F.; Dun, E.A.; Kerr, S.C.; Chabikwa, T.G.; Beveridge, C.A. An Update on the Signals Controlling Shoot Branching. Trends Plant Sci. 2019, 24, 220–236. [Google Scholar] [CrossRef]
  54. Roman, H.; Girault, T.; Barbier, F.; Péron, T.; Brouard, N.; Pěnčík, A.; Novák, O.; Vian, A.; Sakr, S.; Lothier, J.; et al. Cytokinins Are Initial Targets of Light in the Control of Bud Outgrowth. Plant Physiol. 2016, 172, 489–509. [Google Scholar] [CrossRef] [Green Version]
  55. Kotov, A.A.; Kotova, L.M. Auxin-cytokinin interactions in the regulation of correlative inhibition in two-branched pea seedlings. J. Exp. Bot. 2018, 69, 2967–2978. [Google Scholar] [CrossRef] [Green Version]
  56. Bertheloot, J.; Barbier, F.; Boudon, F.; Perez-Garcia, M.D.; Péron, T.; Citerne, S.; Dun, E.; Beveridge, C.; Godin, C.; Sakr, S. Sugar availability suppresses the auxin-induced strigolactone pathway to promote bud outgrowth. New Phytol. 2020, 225, 866–879. [Google Scholar] [CrossRef] [Green Version]
  57. Chen, W.X.; Li, C.D.; Sun, H.C.; Zhang, H.N.; Jia, L. Distribution of 14C-assimilates in boll-leaf system at full- blooming stage of three cotton genotypes with different boll weight. Plant Nutr. Fertil. Sci. 2007, 13, 714–718. [Google Scholar]
  58. Ren, X.M.; Zhang, L.L.; Du, M.W.; Evers, J.B.; Werf, W.V.; Tian, X.L.; Li, Z.H. Managing mepiquat chloride and plant density for optimal yield and quality of cotton. Field Crops Res. 2013, 149, 1–10. [Google Scholar] [CrossRef]
  59. Han, H.Y.; Wang, F.Y.; Chen, B.; Zhang, W.F.; Li, B.C.; Tian, X.L.; Li, Z.H. Effects of drip irrigation water amount on the regulation of cotton growth and yield by fortified 1,1-dimethyl-piperidinium chloride in northern Xinjiang. Cotton Sci. 2017, 29, 70–78. [Google Scholar]
  60. Nie, J.J.; Li, Z.H.; Zhang, Y.J.; Zhang, D.M.; Xu, S.Z.; He, N.; Zhan, Z.H.; Dai, J.L.; Li, C.D.; Li, W.J.; et al. Plant pruning affects photosynthesis and photoassimilate partitioning in relation to the yield formation of field-grown cotton. Ind. Crops Prod. 2021, 173, 114087. [Google Scholar] [CrossRef]
  61. Feng, G.Y.; Yao, Y.D.; Du, M.W.; Tian, J.S.; Luo, H.H.; Zhang, Y.L.; Zhang, W.F. Dimethyl Piperidinium Chloride (DPC) Regulation of Canopy Architecture and Photosynthesis in a Cotton Hybrid in an Arid Region. Cotton Sci. 2012, 24, 44–51. [Google Scholar]
  62. Hu, Y.Y.; Zhang, Y.L.; Luo, H.H.; Li, W.; Oguchi, R.; Fan, D.Y.; Chow, W.S.; Zhang, W.F. Important photosynthetic contribution from the non-foliar green organs in cotton at the late growth stage. Planta 2012, 235, 325–336. [Google Scholar] [CrossRef] [PubMed] [Green Version]
  63. Tung, S.A.; Huang, Y.; Hafeez, A.; Ali, S.; Liu, A.D.; Chattha, M.S.; Ahmad, S.; Yang, G.Z. Morpho-physiological Effects and Molecular Mode of Action of Mepiquat Chloride Application in Cotton: A Review. J. Soil Sci. Plant Nutr. 2020, 20, 2073–2086. [Google Scholar] [CrossRef]
Figure 1. Effect of different concentrations of chemical topping agents on the leaf area index of cotton.
Agronomy 13 01741 g001
Figure 2. Effect of different concentrations of chemical topping agents on net photosynthetic rate of cotton leaves.
Agronomy 13 01741 g002
Table 1. Yield and yield components affected by different concentrations of chemical topping agents.
VarietiesFactorsPlant No. (104·hm−2) Boll No. per Plant (No.)Total Boll No. (104·hm−2)Boll Weight (g)Seed Cotton Yield (kg·hm−2)
Xinluzao72CK120.18 ± 0.96 a6.93 ± 1.22 b110.38 ± 4.02 c5.14 ± 0.40 b5515 ± 131 c
CK221.35 ± 0.72 a7.80 ± 1.01 a136.40 ± 5.40 b5.70 ± 0.56 a6632 ± 151 b
L20.61 ± 0.92 a8.33 ± 0.62 a141.84 ± 6.29 ab5.56 ± 0.41 ab7055 ± 104 a
M20.61 ± 1.07 a8.47 ± 0.52 a144.74 ± 4.23 a5.66 ± 0.56 a7134 ± 126 a
H20.18 ± 1.11 a8.40 ± 0.83 a140.64 ± 4.92 ab5.60 ± 0.44 ab6877 ± 253 ab
Xinluzao61CK120.76 ± 1.20 a7.00 ± 1.13 b114.91 ± 5.08 c4.82 ± 0.42 b5433 ± 141 b
CK221.20 ± 1.03 a7.53 ± 1.19 b129.68 ± 6.78 b5.31 ± 0.37 a6475 ± 270 a
L20.03 ± 0.66 a8.40 ± 0.83 a139.77 ± 5.57 a5.08 ± 0.44 ab6877 ± 429 a
M20.18 ± 0.78 a8.47 ± 0.64 a140.79 ± 4.95 a4.96 ± 0.41 ab6745 ± 372 a
H20.03 ± 1.03 a8.60 ± 0.63 a141.96 ± 2.38 a5.02 ± 0.29 ab7120 ± 128 a
Xinluzao67CK119.74 ± 0.76 a7.1 ± 0.57 b112.57 ± 3.65 b4.79 ± 0.56 b5427 ± 241 b
CK219.88 ± 0.67 a8.2 ± 1.03 a133.48 ± 3.08 ab5.25 ± 0.37 a6657 ± 56 a
L19.59 ± 0.51 a8.6 ± 0.84 a138.89 ± 3.29 ab5.04 ± 0.34 ab6484 ± 304 a
M19.74 ± 0.88 a8.5 ± 0.85 a138.3 ± 4.85 ab5.02 ± 0.27 ab6747 ± 200 a
H19.88 ± 0.67 a8.8 ± 1.40 a142.84 ± 4.65 a5.12 ± 0.39 ab6743 ± 167 a
Variety (V)nsns<0.0001<0.0001ns
Source of variancePlant topping (PT)ns0.0001<0.00010.0008<0.0001
V × PTnsnsnsnsns
Note: CK1, non-topping; CK2, manual topping; L, low concentration; M, medium concentration; H, high concentration. Different letters in the same column indicate significant differences at p < 0.05; ns means no significant difference.
Table 2. Boll weight, lint, and boll spatial distribution in different parts as affected by different concentrations of chemical topping agents.
VarietiesPlant ToppingBoll Weight (g) Lint Percentage (%)Boll Spatial Distribution (Number)
UpperMiddleLowerUpperMiddleLowerUpperMiddleLower
Xinluzao72CK14.81 b5.27 b5.35 a39.93 a40.55 a39.08 a1.47 b2.8 a2.67 a
CK26.09 a6.03 ab4.99 a41.38 a41.08 a39.55 a2.20 a3.13 a2.47 a
L5.53 ab5.85 ab5.31 a41.33 a40.95 a39.18 a2.47 a3.07 a2.8 a
M5.47 ab6.24 a5.28 a41.26 a40.91 a37.78 a2.53 a3.07 a2.87 a
H5.56 ab6.00 b5.24 a40.48 a37.44 a43.56 a2.60 a2.87 a2.93 a
Xinluzao61CK14.41 b5.28 a4.77 a40.08 a40.96 a40.92 a1.60 b2.87 a2.53 a
CK25.65 a5.39 a4.88 a41.23 a41.41 a41.74 a2.13 ab2.93 a2.47 a
L4.68 b5.43 a5.13 a40.40 a39.79 a40.48 a2.60 a3.00 a2.80 a
M4.76 b5.34 a4.79 a40.80 a41.26 a41.03 a2.47 a3.07 a2.93 a
H4.78 b5.33 a4.94 a40.51 a40.91 a40.91 a2.53 a3.00 a3.07 a
Xinluzao67CK14.35 c5.38 a4.65 a44.9 a49.7 a48.44 a1.30 c3.00 a2.80 a
CK25.53 a5.39 a4.82 a45.04 a49.88 a48.98 a2.30 bc3.10 a2.80 a
L4.74 b5.39 a4.98 a44.6 a49.67 a48.05 a2.70 ab3.00 a2.90 a
M4.81 b5.33 a4.92 a45.36 a50.8 a48.61 a2.60 ab3.00 a2.90 a
H4.73 b5.39 a5.24 a45.9 a49.43 a48.03 a2.90 a3.00 a2.90 a
Note: CK1, non-topping; CK2, manual topping; L, low concentration; M, medium concentration; H, high concentration. Different letters in the same column indicate significant differences at p < 0.05.
Table 3. Fiber quality as affected by different concentrations of chemical topping agents.
VarietiesPlant ToppingUpper Half Mean Length (mm)Uniformity Index (%)Fiber Strength (cN/tex)Micronaire Elongation
(%)
Xinluzao 72CK131.37 ± 0.85 a86.59 ± 0.54 a31.13 ± 0.83 b3.39 ± 0.32 a6.62 ± 0.58 a
CK231.39 ± 1.34 a86.46 ± 1.21 a32.09 ± 0.73 a3.57 ± 0.32 a6.51 ± 0.79 a
L31.69 ± 1.16 a86.76 ± 1.08 a31.63 ± 0.91 ab3.52 ± 0.4 a6.54 ± 0.42 a
M31.86 ± 0.74 a86.78 ± 0.88 a31.57 ± 1.14 ab3.73 ± 0.53 a6.43 ± 0.45 a
H32.00 ± 1.05 a86.67 ± 1.12 a32.23 ± 0.7 a3.58 ± 0.47 a6.54 ± 0.36 a
Xinluzao 61CK130.58 ± 1.24 a85.57 ± 1.56 a28.74 ± 1.14 c3.36 ± 0.56 b6.71 ± 0.58 a
CK230.64 ± 0.79 a85.86 ± 1.11 a29.69 ± 1.09 bc3.81 ± 0.36 a6.58 ± 0.63 a
L30.93 ± 1.03 a85.74 ± 1.19 a29.99 ± 1.18 ab3.56 ± 0.42 ab6.62 ± 0.51 a
M30.87 ± 0.66 a85.97 ± 1.22 a31.11 ± 1.67 a3.74 ± 0.4 ab6.84 ± 0.52 a
H30.82 ± 0.66 a86.16 ± 0.64 a30.6 ± 0.96 ab3.56 ± 0.21 ab6.69 ± 0.4 a
Xinluzao 67CK128.71 ± 0.68 a84.13 ± 1.05 a28.09 ± 1.26 a4.92 ± 0.23 a6.42 ± 0.97 a
CK228.25 ± 1.24 a83.66 ± 1.37 a26.94 ± 2.42 a4.94 ± 0.28 a6.19 ± 0.86 a
L28.51 ± 0.87 a84.44 ± 1.6 a28.07 ± 1.27 a4.91 ± 0.3 a6.47 ± 0.88 a
M28.52 ± 0.63 a84.01 ± 0.92 a27.78 ± 1.42 a5.08 ± 0.19 a6.36 ± 0.81 a
H28.72 ± 0.9 a84.32 ± 1.42 a28.12 ± 1.54 a4.98 ± 0.28 a6.29 ± 1.02 a
Note: CK1, non-topping; CK2, manual topping; L, low concentration; M, medium concentration; H, high concentration. Different letters in the same column indicate significant differences at p < 0.05.
Table 4. Plant height as affected by different concentrations of chemical topping agents.
Days after Topping (d)714212835
CK1 71.18 ± 4.77 a83.53 ± 7.97 a87.63 ± 7.98 a89.00 ± 7.69 a89.33 ± 7.35 a
CK2 70.55 ± 5.12 ab71.90 ± 5.49 e71.8 ± 5.02 e73.25 ± 4.83 e73.53 ± 4.79 e
L 70.30 ± 4.74 bc 79.03 ± 5.89 b80.37 ± 6.61 b81.73 ± 6.15 b82.70 ± 6.69 b
M 70.80 ± 4.37 bc76.92 ± 5.61 c78.38 ± 5.90 c78.23 ± 5.89 c78.40 ± 5.36 c
H 70.17 ± 4.80 c 75.63 ± 4.85 d76.45 ± 4.51 d76.20 ± 4.59 d76.78 ± 4.27 d
Varieties (V)0.00010.00010.00010.00010.0001
Plant topping (PT)0.46430.00010.00010.00010.0001
V × PT0.00020.00010.00010.00010.0001
Note: CK1, non-topping; CK2, manual topping; L, low concentration; M, medium concentration; H, high concentration. , the values are the means of both years and three varieties ± SE. Different letters in the same column indicate significant differences at p < 0.05.
Table 5. Number of main stem internodes affected by different concentrations of chemical topping agents.
Days after Topping (d)714212835
CK1 13.60 ± 1.52 a15.97 ± 1.27 a16.73 ± 1.51 a16.73 ± 1.62 a17.07 ± 1.76 a
CK2 13.43 ± 1.43 a13.33 ± 1.39 d13.33 ± 1.40 d13.67 ± 1.06 d13.60 ± 1.13 d
L 13.37 ± 1.69 a15.00 ± 1.29 b15.40 ± 1.48 b15.70 ± 1.47 b15.87 ± 1.43 b
M 13.30 ± 1.39 a14.77 ± 1.17 bc15.13 ± 1.33 bc15.37 ± 1.43 b15.23 ± 1.55 c
H 13.57 ± 1.36 a14.43 ± 1.07 c14.77 ± 1.33 c14.93 ± 1.48 c15.20 ± 1.61 c
Varieties (V)0.00010.00010.00010.00010.0001
Plant topping (PT)0.75030.00010.00010.00010.0001
V × PT0.77510.86360.48740.31220.4989
Note: CK1, non-topping; CK2, manual topping; L, low concentration; M, medium concentration; H, high concentration. , the values are the means of both years and three varieties ± SE. Different letters in the same column indicate significant differences at p < 0.05.
Table 6. Length of main stem internode as affected by different concentrations of chemical topping agents.
VarietiesPlant ToppingWhole Internode Length (cm) Upper Internode Length (cm) Remaining Internode Length (cm)
Xinluzao72CK16.45 ± 0.54 a6.58 ± 0.17 b6.45 ± 0.89 a
CK26.44 ± 0.58 a6.77 ± 0.38 a6.30 ± 0.86 a
L6.29 ± 0.48 a5.82 ± 0.13 c6.55 ± 0.98 a
M6.16 ± 0.41 a5.62 ± 0.16 d6.39 ± 0.72 a
H6.14 ± 0.50 a5.39 ± 0.10 e6.43 ± 0.79 a
Xinluzao61CK15.18 ± 0.42 a5.42 ± 0.08 b5.09 ± 0.56 a
CK25.27 ± 0.34 a5.74 ± 0.22 a5.20 ± 0.43 a
L5.11 ± 0.25 a5.10 ± 0.17 c5.13 ± 0.35 a
M5.02 ± 0.33 a4.88 ± 0.17 d5.08 ± 0.44 a
H5.04 ± 0.27 a4.84 ± 0.19 d5.17 ± 0.67 a
Xinluzao67CK14.63 ± 0.17 b4.99 ± 0.52 a4.39 ± 0.24 a
CK24.88 ± 0.26 a5.04 ± 0.22 a4.56 ± 0.35 a
L4.48 ± 0.08 c4.15 ± 0.24 b4.52 ± 0.26 a
M4.46 ± 0.06 c4.17 ± 0.21 b4.48 ± 0.36 a
H4.35 ± 0.10 c4.13 ± 0.34 b4.54 ± 0.31 a
Note: CK1, non-topping; CK2, manual topping; L, low concentration; M, medium concentration; H, high concentration. Different letters in the same column indicate significant differences at p < 0.05. The internode number was counted from the top of the plant, the upper internode length was the average length from first internode to fourth internode, the remaining internode length was the average internode length below the fourth internode.
Table 7. Number of fruit branches affected by different concentrations of chemical topping agents.
Days after Topping (d)714212835
CK1 8.77 ± 1.10 a12.22 ± 3.62 a13.10 ± 3.87 a13.60 ± 3.70 a13.63 ± 3.67 a
CK2 8.73 ± 1.01 a10.37 ± 3.06 d10.33 ± 3.24 d10.67 ± 3.04 d10.60 ± 3.06 d
L 8.53 ± 1.28 a 11.53 ± 5.56 b12.33 ± 3.52 b12.70 ± 3.43 b12.90 ± 3.35 b
M 8.53 ± 1.14 a10.83 ± 3.65 c11.80 ± 3.62 c12.23 ± 3.46 c12.13 ± 3.54 c
H 8.73 ± 1.01 a10.90 ± 3.66 c11.63 ± 3.42 c11.93 ± 3.36 c12.13 ± 3.44 c
Varieties (V)0.00010.00010.00010.00010.0001
Plant topping (PT)0.77180.00080.00010.00010.0001
V × PT0.87720.24930.25350.13430.0423
Note: CK1, non-topping; CK2, manual topping; L, low concentration; M, medium concentration; H, high concentration. , the values are the means of both years and three varieties ± SE. Different letters in the same column indicate significant differences at p < 0.05.
Table 8. Length of the upper fruit branch in cotton as affected by different concentrations of chemical topping agents.
Varieties Factors Fourth Branch (cm)Third Branch (cm)Second Branch (cm)First Branch (cm)
Xinluzao72CK110.57 ± 1.25 ab9.87 ± 1.55 a8.77 ± 0.96 b8.03 ± 1.22 b
CK211.50 + 1.10 a10.57 ± 0.86 a10.13 ± 1.11 a10.20 ± 1.60 a
L9.97 ± 1.59 b8.93 ± 1.08 b7.83 ± 0.99 c4.93 ± 0.92 c
M9.7 ± 1.52 b7.67 ± 0.88 c6.43 ± 1.15 d4.10 ± 1.43 cd
H9.77 ± 1.22 b7.30 ± 1.24 c5.33 ± 1.26 e3.53 ± 1.01 d
Xinluzao61CK19.43 ± 1.37 a8.97 ± 0.90 a7.67 ± 1.21 b5.43 ± 1.18 b
CK29.47 ± 1.38 a9.67 ± 1.37 a9.80 ± 1.33 a8.87 ± 0.93 a
L8.27 ± 1.61 b6.53 ± 1.19 b5.53 ± 0.83 c3.47 ± 1.17 c
M8.20 ± 1.53 b5.97 ± 1.32 bc4.87 ± 1.26 cd3.03 ± 1.14 c
H7.80 ± 1.49 b5.63 ± 1.03 c4.13 ± 2.00 d2.93 ± 1.02 c
Xinluzao67CK117.40 ± 2.51 a16.40 ± 1.41 a12.30 ± 1.55 a11.40 ± 2.50 a
CK216.50 ± 2.13 a15.90 ± 1.68 a12.00 ± 2.87 a11.00 ± 2.06 a
L16.70 ± 1.09 a14.05 ± 1.62 b9.65 ± 1.81 b5.80 ± 1.40 b
M16.85 ± 2.80 a13.65 ± 1.86 b9.35 ± 1.55 b5.15 ± 1.42 b
H16.30 ± 1.74 a13.40 ± 1.88 b9.00 ± 1.65 b4.75 ± 2.20 b
Source of varianceVarieties (V)<0.0001<0.0001<0.00010.0027
Plant topping (PT)0.0266<0.00010.00040.0001
V × PTnsns0.02430.0002
Note: The branch number was counted from the top of the plant. CK1, non-topping; CK2, manual topping; L, low concentration; M, medium concentration; H, high concentration. Different letters in the same column indicate significant differences at p < 0.05; ns means no significant difference.
Table 9. Gray correlation and rank of cotton between yield or plant height and plant architecture parameters.
Correlation Degree between Cotton Yield and
Plant Architecture
Correlation between Cotton Plant Height and
Other Plant Architecture Parameters
TraitCorrelation degree γRankTraitCorrelation degree γRank
Plant height0.8261Upper internode length0.86751
Whole internode length0.80582Whole internode length0.85392
Remaining internode length0.79883Remaining internode length0.84143
Number of fruit branches0.79614Number of fruit branches 0.83144
Number of main stem internodes 0.79295Number of main stem internodes0.80295
Upper internode length0.78946Second branch length0.61746
Fourth branch length0.66427Fourth branch length0.61447
Second branch length 0.668Third branch length0.60198
Third branch length0.65679First branch length0.58539
First branch length0.571510
Table 10. Leaf area index affected by different concentrations of chemical topping agents.
Days after Topping (d)714212835
CK1 3.90 ± 0.76 ab5.38 ± 0.66 a5.63 ± 0.77 a5.50 ± 0.88 a4.51 ± 0.68 b
CK2 4.15 ± 1.18 a5.30 ± 0.42 a5.27 ± 0.44 b5.02 ± 0.34 b4.43 ± 0.66 b
L 4.00 ± 0.69 a4.88 ± 0.81 b5.39 ± 1.08 b5.00 ± 1.17 b4.77 ± 0.65 a
M 3.70 ± 0.43 b4.42 ± 0.84 c4.90 ± 0.91 c5.13 ± 1.22 b4.90 ± 0.82 a
H 3.25 ± 0.58 c4.20 ± 0.97 d4.75 ± 0.95 c4.95 ± 1.35 b4.49 ± 1.09 b
Varieties (V)0.02190.00010.00010.00310.0621
Plant topping (PT)0.44920.00310.00450.81820.8882
V × PT0.00010.00010.32020.00010.0001
Note: CK1, non-topping; CK2, manual topping; L, low concentration; M, medium concentration; H, high concentration. , the values are the means of both years and three varieties ± SE. Different letters in the same column indicate significant differences at p < 0.05.
Table 11. Net photosynthetic rate of leaves affected by different concentrations of chemical topping agents.
Days after Topping (d)1020273441
CK1 25.47 ± 2.60 c23.21 ± 2.95 c21.21 ± 2.18 c13.17 ± 1.03 d9.01 ± 1.08 d
CK2 25.71 ± 3.15 c25.88 ± 3.09 b21.45 ± 2.27 c19.63 ± 1.95 c18.38 ± 2.23 a
L 25.35 ± 3.25 c23.55 ± 4.24 c22.51 ± 3.18 b22.19 ± 1.89 b12.74 ± 3.43 c
M 29.140 ± 2.84 a27.87 ± 1.36 a23.64 ± 2.23 a22.73 ± 2.29 ab15.21 ± 3.46 b
H 27.65 ± 3.16 b27.48 ± 1.78 a24.37 ± 2.70 a23.43 ± 2.45 a15.07 ± 3.88 b
Varieties (V)0.00010.00080.00660.22730.2265
Plant topping (PT)0.00280.00910.17640.00100.0546
V × PT0.04070.00570.00010.00010.0001
Note: CK1, non-topping; CK2, manual topping; L, low concentration; M, medium concentration; H, high concentration. , the values are the means of both years and three varieties ± SE. Different letters in the same column indicate significant differences at p < 0.05.
Disclaimer/Publisher’s Note: The statements, opinions and data contained in all publications are solely those of the individual author(s) and contributor(s) and not of MDPI and/or the editor(s). MDPI and/or the editor(s) disclaim responsibility for any injury to people or property resulting from any ideas, methods, instructions or products referred to in the content.

