Article

Microbial Mechanisms of the Priming Effect over 12 Years of Different Amounts of Nitrogen Management

1
College of Agriculture, South China Agricultural University, Guangzhou 510642, China
2
Key Laboratory of Agro-Environments in Tropics, Ministry of Agriculture and Rural Affairs, South China Agriculture University, Guangzhou 510642, China
3
College of Natural Resources and Environment, South China Agricultural University, Guangzhou 510642, China
4
Guangzhou Fruit Science Research Institute, Guangzhou 510405, China
5
College of Resources and Environment, Jilin Agricultural University, Changchun 130118, China
*
Author to whom correspondence should be addressed.
Agronomy 2023, 13(7), 1783; https://doi.org/10.3390/agronomy13071783
Submission received: 9 May 2023 / Revised: 27 June 2023 / Accepted: 29 June 2023 / Published: 30 June 2023
(This article belongs to the Section Agroecology Innovation: Achieving System Resilience)

Abstract

:
The return of crop residues and application of chemical nitrogen (N) can influence the soil organic carbon (SOC) turnover. However, the changes in the response of the priming effect (PE) to N management in real farming systems are not fully understood. In this research, we launched a 270-day in situ experiment in three N management plots (N0, no N; N1, 300 kg hm−2; and N2, 360 kg hm−2) on a long-term maize farm in order to examine the microbial mechanisms that trigger the PE in the presence of 13C-labeled maize residues. We found that N1 decreased SOC mineralization and the positive PE, but increased the residual C mineralization and microbial C use efficiency in comparison with N0 and N2, respectively. The positive PE can be explained by the microbial nutrient mining theory for N0 and by the microbial stoichiometry decomposition theory for N1 and N2, as reflected by the increased abundance of oligotrophic phyla in N0 and the increased abundance of copiotrophic phyla in N1 and N2. The microbial biomass C (MBC), residue-derived MBC, and the communities’ complexity were decreased in N2 due to the acidification of the soil environment, but N1 enhanced the MBC, residue-derived MBC, and bacterial communities’ complexity. The keystone bacterial taxa of Vicinamibacteraceae and Gemmatimonas preferred the recalcitrant C of SOC in N0 and N2, respectively. However, Acidibacter favored the labile residual C in N1. The keystone fungal taxa of Penicillium, Sarocladium, and Cladophialophora exhibited wide substrate-use abilities in N0, N1, and N2, respectively. Our research depicts the mechanisms of how microbial communities’ structures are reshaped through N management and emphasizes the functions of the keystone microbial taxa in C turnover and the PE in farming systems.

1. Introduction

Soil organic carbon (SOC) is necessary for ecosystem processes and is critical for C cycling in farmlands [1,2]. The return of crop residues can offset SOC and nutrient loss, and it is critical for maintaining crop productivity and quality [3,4,5]. However, the input of crop residues on arable lands was reported to either increase or decrease SOC mineralization, which is known as the priming effect (PE) [6,7,8,9]. Based on previous in situ and laboratory experiments, scientists have reported that the PE can be positive or negative depending on biotic or abiotic factors [10,11]. Among these influences, some studies have proven that nutrient availability is crucial for regulating the PE in arable soils [8,12]. Nitrogen (N) is one of the most important elements for crop growth in agroecosystems [13]. Many studies have shown that N addition can directly influence soil microbes [14,15,16]. Normally, it enhances the relative abundance of R strategists (which are mainly copiotrophs that prefer nutrient-rich environments and are likely to use labile C) but decreased the abundance of K strategists (which are mainly oligotrophs that prefer nutrient-limited conditions and are likely to consume refractory C in soil) [8,13,17].
Numerous researchers have studied the microbial mechanisms triggering the PE under N management [13,18,19,20]. There are two different microbe-derived theories that illustrate that the PE is induced by the combination of N with an extra organic matter input. (1) In microbial nutrient mining, if N is limited during the process of residue degradation, hungry microbes will consume the native SOM for N [8]. (2) During microbial stoichiometric decomposition, the decomposition of the native SOC can be increased in higher-N environments because the combined inputs of the residues and N can facilitate the development and activities of diverse microbial communities. Extracellular enzymes can simultaneously facilitate SOM mineralization [9,10]. Furthermore, “microbial nutrient mining” and “microbial stoichiometric decomposition” are mainly performed by K strategists and R strategists, respectively [8,11]. These results mainly focused on the short-term effects of the combined inputs of N fertilizer and crop residues on the PE. However, the knowledge concerning how different long-term N management strategies influence the PE and related microbial mechanisms is not fully understood. This is essential in order for us to understand the processes of the PE in agroecosystems that receive ever-increasing N inputs.
The 13C labeling technique is a safe, stable method that can precisely quantify how much C is transferred from residues to microbes. Microbes absorb residual C and use it to acquire energy, composite microbial biomass, proliferate, and to maintain their metabolism. The ratio of residual C used for microbial growth is defined as the microbial C use efficiency (CUE) [11]. Higher CUE corresponds to the high-efficiency growth of microbes and relatively low emissions of C from the substrate into the atmosphere [12,13]. Soil N availability is a dominant factor driving microbial CUE. For example, Marie et al. [11] suggested that soil amended with N benefited from both an increase in the residual C absorbed by the microbes and a reduction in the SOC loss triggered by the PE when compared with soil under conditions of limited N. Additionally, a significant negative relationship between CUE and the PE under low-N treatment conditions was recently reported [14,15]. N fertilizer can increase the CUE by decreasing the stoichiometric C-to-N imbalance [13,14,15,16]. Many researchers have noted that CUE not only represents residual C utilization, but it also is associated with SOC accumulation and long-term C stabilization [9,17], because a positive relationship between SOC sequestration and CUE has been found [13,18]. Thus, the relationship between CUE and the PE is important for detecting the microbial mechanisms of the PE under various N treatment conditions, especially in long-term experiments.
Nowadays, analyses of co-occurrence networks and keystone taxa are used to identify critical species that are sensitive to disturbances [19,20,21,22,23,24] and to better comprehend the underlying ecological interactions among microbial species [25,26], respectively. For example, these tools were utilized to identify microbes that were sensitive to different agricultural practices, and it was possible to visualize the response patterns of these specific microorganisms to disturbing environments [27,28,29,30]. Previous studies proved that soil bacterial and fungal communities’ structures and co-occurrence networks during the period of crop residue mineralization can be reshaped by using various N application levels [31,32,33,34]. Meanwhile, the keystone species among treatments can be detected by determining the mutual relationships and topological structures among the species’ abundance levels when analyzing co-occurrence networks [35,36]. However, it is still unknown which microbes are members of the keystone clusters under in-field conditions with various N application levels, as well as their potential functions in regulating C turnover.
Sweet maize (Zea mays L. saccharata) is an important crop that is cultivated in southern China. However, farmers consistently use excessive inputs of chemical N for maize production (usually more than 360 kg N hm−2) during their sweet maize cultivation procedures, which influences the microbial communities’ composition, activities, and SOC turnover [12]. In this research, we performed a 270-day incubation experiment at an experimental farm that consecutively received different N fertilizer levels for nine years. We assumed the following with different levels of N application: (i) long-term N management can alter the responses of the keystone taxa to the addition of residues by influencing their communities’ structures and co-occurrence models; and (ii) residual C and SOC mineralization concerning PE is closely linked to the keystone taxa in long-term N management scenarios. By using isotopic techniques and network analyses, this study was able to detect the relationship between the PE and dynamic changes in soil microbial activities and communities in a long-term N experiment.

2. Materials and Methods

2.1. Study Site and N Application

An in situ experiment was carried out on a farm located in Guangzhou, Guangdong, China (23°08′ N, 113°15′ E, sub-tropical marine climate), where long-term N fertilizer experiments have been conducted since 2009. The average annual rainfall in the area is 1348–2278 mm. The soil texture of the farmland is latosolic red soil. The basic soil properties (pH, SOC, total nitrogen (TN), total phosphorus (TP), total kalium (TK), and available N (AN), P (AP), and K (AK)) before starting the in situ experiment are shown in Table 1. Sweet maize was cultivated on this site (two cultivation seasons per year: spring maize, March–July; and autumn maize, August–October). In each cultivation season, we applied three levels of N: no N (N0), reduced N (N1: 300 kg hm−2), and conventional N (N2: 360 kg hm−2). All treatments were performed with three replications, and the areas were supplied with P2O5 at 150 kg hm−2 and K2O at 300 kg hm−2. The area of each test plot was 20 m2 (5 m × 4 m). The crop density was 54,054 plants hm−2 (16 plants per row× 6 rows in each plot).

2.2. Maize Residue Preparation, Return, and Sampling

The 13C-labeled maize (Zea mays L. saccharate sturt cv. Huazhen) residues were acquired from a 13CO2 pulse-labeling (99.0 atom% 13C) pot experiment [37]. Briefly, maize plants were planted in pots and then covered with a glass chamber when labeling was conducted. The 13CO2 labeling was started on the 45th day after maize germination and was conducted every day for 1 week. Then, the above- and belowground parts were collected after 15 days and dried at 85 °C until a constant weight was achieved. The maize residues were ground and passed through a 0.15 mm sieve for analyses of the chemical properties and for the subsequent experiment. The properties and δ13C values of the residues are listed in Table S1.
The in situ experiment was conducted after spring maize was harvested in July 2021. We set three residue return spots and one spot with no residue (CK) in each plot. A polyvinyl chloride (PVC) tube with a diameter of 15 cm and a height of 30 cm was inserted 20 cm deep in each spot. Then, we dug out all of the soil from each PVC tube (including that of CK) and passed the soil through a 2 mm sieve. The maize residues were carefully and uniformly mixed at a concentration of 7 g kg−1 dry soil, corresponding to 4.17 t hm−2. Then, the soil–residue mixture was placed in the tube (including that of CK). In order to capture the CO2 emissions from the different treatments, 30 mL of 3 mol L−1 NaOH in a 100 mL plastic beaker was placed in each PVC tube. To measure the extra space taken by CO2, a triplicate blank tube containing only the CO2 trap was also simultaneously incubated. The NaOH was collected and changed on the 3rd, 10th, 30th, 60th, 90th, 120th, and 270th days for the total CO2-C and δ13C analyses. The δ13C analysis of CO2 captured in NaOH was performed by using a stable isotope ratio mass spectrometer (Mat 253, IMS, Thermo Fisher, America) [13]. Soil samples were also collected on the 10th, 30th, 120th, and 270th days for microbial biomass C (MBC) analyses and on the 10th, 120th, and 270th days for gene abundance analyses.

2.3. Total CO2-C Mineralization, Native SOC Mineralization, Residue-Derived C Mineralization, and Priming Effect (PE) Analyses

The total CO2-C mineralization was calculated via the acid–base titration approach [37].
The proportion of CO2-C emitted from soil ( P s ) supplemented with maize residues in this research was calculated as follows:
P s = δ r 13 c t δ m 13 c t δ c 13 c t δ m 13 c t
where, δ r 13 c t and δ c 13 c t indicate the value of δ13C (‰) of the total CO2-C emitted from the soil–residue mixture and corresponding CK soil over time, respectively. The δ m 13 c t was the δ13C (‰) value of the maize residues, which was acquired by incubating the residues in a non-woven bag in the sand with soil microbes, and the value of δ13C in the maize residues was analyzed on the 3rd, 10th, 30th, 60th, 90th 120th, and 270th days [13].
The SOC mineralization ( M S O C ) in the residue-incorporating soil was calculated as follows:
M S O C = M T O C ×   P s
where, M T O C is the total CO2-C emitted from the residue-incorporating soil.
The daily rates of SOC mineralization were obtained by dividing the amounts of M S O C during a given sampling period by the number of days. The cumulative SOC mineralization was calculated by summing the values of M S O C over the experimental period.
Residual C mineralization ( M R ) was determined by subtracting M S O C from M T O C . The daily rates of residual C mineralization were obtained by dividing the amounts of M R during a given sampling period by the number of days. The cumulative residual C mineralization ( C R ) was calculated by summing the values of M R over the experimental period.
The PE caused by the input of maize residues was calculated as,
P E = C s r C s c
where, C s r is the amount of CO2-C emitted from the soil (mg C kg−1 of soil) supplemented with maize residues, and C s c is the quantity of CO2-C emitted from the corresponding CK soil.

2.4. Microbial Biomass Carbon (MBC) and Microbial Carbon Use Efficiency (CUE)

The soil samples were analyzed for their MBC content using the fumigation–extraction method [38,39]. The δ 13 C value of the MBC ( δ 13 M B C ) was first calculated as follows [13]:
δ 13 M B C = ( δ F 13 C × C T δ N 13 C × C N ) ( C T C N ) × 100 %
where, δ F 13 C and δ N 13 C indicate the δ13C (‰) values of the extractions from the fumigated and non-fumigated samples, respectively, and CT and CN are the contents of dissolved organic C (DOC). The changes in DOC were calculated by subtracting the values of the non-fumigated samples from those of the fumigated samples.
The fraction of MBC derived from maize residual C that accounted for the total MBC (Px) was calculated as,
P x = δ r 13 M B C δ c 13 M B C δ m 13 c t δ c 13 M B C × 100 %
where, δ r 13 M B C and δ c 13 M B C are the δ13C (‰) values of the MBC from the soil supplemented with residues and the corresponding CK soil, respectively, over time.
The content of residue-derived MBC ( C 13 M B C ) was calculated as follows [1]:
C 13 M B C = C M B C   ×   P x
where CMBC is the content of MBC in the soil–residue mixture.
The CUE was calculated using the following equation [11]:
C U E = C 13 M B C C 13 M B C + C R × 100 %

2.5. High-Throughput Sequencing

Soil DNA was extracted from 0.4 g of soil by using an E.Z.N.A.® Soil DNA Kit (Omega Bio-Tek, Norcross, GA, USA) in accordance with the instructions. In order to detect the quantity and quality of DNA, we used a NanoDrop2000 (Thermo Scientific, Wilmington, NC, USA) and 1% agarose gel electrophoresis, respectively. The sequences of the prokaryotic 16 small subunit (16S) rRNA V3–V4 hypervariable region with the primer set 338F/806R (338F, 5′-ACT CCT ACG GGA GGC AGC AG-3′ and 806R, 5′-GGA CTA CHV GGG TWT CTA AT-3′) [5] and the fungal internal transcribed spacer 1 region (ITS1R) with the primer set ITS1F/ITS2R (ITS1F, 5′-CTT GGT CAT TTAGAG GAA GTA A-3′, ITS2R, 5′-GCT GCG TTC TTC ATC GAT GC-3′) [5] were amplified via polymerase chain reaction (PCR). The PCR program used the following steps: 3 min at 95 °C for initial denaturation, followed by 27 cycles of 30 s at 95 °C for denaturing; annealing at 55 °C for 30 s, at 72 °C for 45 s for extension, and for 10 min at 72 °C for single extension, ending at 4 °C. The bacterial PCR mixtures included 4 μL of 5 × TransStart FastPfu buffer, 2 μL of 2.5 mM deoxynucleotide triphosphates (dNTPs), 0.8 μL of forward primer, 0.8 μL of 5 μM reverse primer, 0.4 μL of TransStart FastPfu DNA Polymerase, 10 ng of template DNA, and 20 μL of deionized (dd) H2O. PCR reactions were performed in triplicate. The fungal PCR mixtures included 10 × 2 μL of the buffer, 2 μL of 2.5 mM dNTPs, 0.8 μL of 5 μM forward primer, 0.8 μL of 5 μM reverse primer, 2 μL of rTaq polymerase, 2 μL of bovine serum albumin (BSA), 10 ng of template DNA, and 20 μL of dd H2O. The PCR product was extracted from 2% agarose gel and purified using an AxyPrep DNA Gel Extraction Kit (Axygen Biosciences, Union City, CA, USA) according to the manufacturer’s instructions and was quantified using a Quantus™ Fluorometer (Promega, Madison, WI, USA).
The paired-end Illumina reads were processed using the following steps: (1) assembling paired-end reads and renaming sequencing; (2) discarding bar codes, primers, and low-quality reads; and (3) selecting non-redundant reads. The unique reads with 97% similarity were gathered into the same operational taxonomic units (OTUs). UPARSE version 7.1 was used to select representative sequences, and Usearch was used to create the OTU table. The Ribosomal Database Project (RDP) Classifier version 2.2 database [40] and the UNITE database [41] were selected to identify the taxonomy of each bacterium and fungus, respectively. A total of 1,393,615 ITS and 687,147 16S rRNA paired-end selected sequences were acquired from the 27 soil samples. Then, we even all of the reads and acquired the lowest read number.

2.6. Statistical Analysis

One-way analysis of variance (ANOVA) with Tukey’s test was used to detect significant differences (p < 0.05) in all statistical analyses using SPSS 26.0 (IBM Corp., Armonk, NY, USA). The obtained sequences were analyzed and merged using Fast version 0.20.0 and FLASH version 1.2.7, respectively [42,43]. The network analysis was visualized with Networkx v1.11.

3. Results

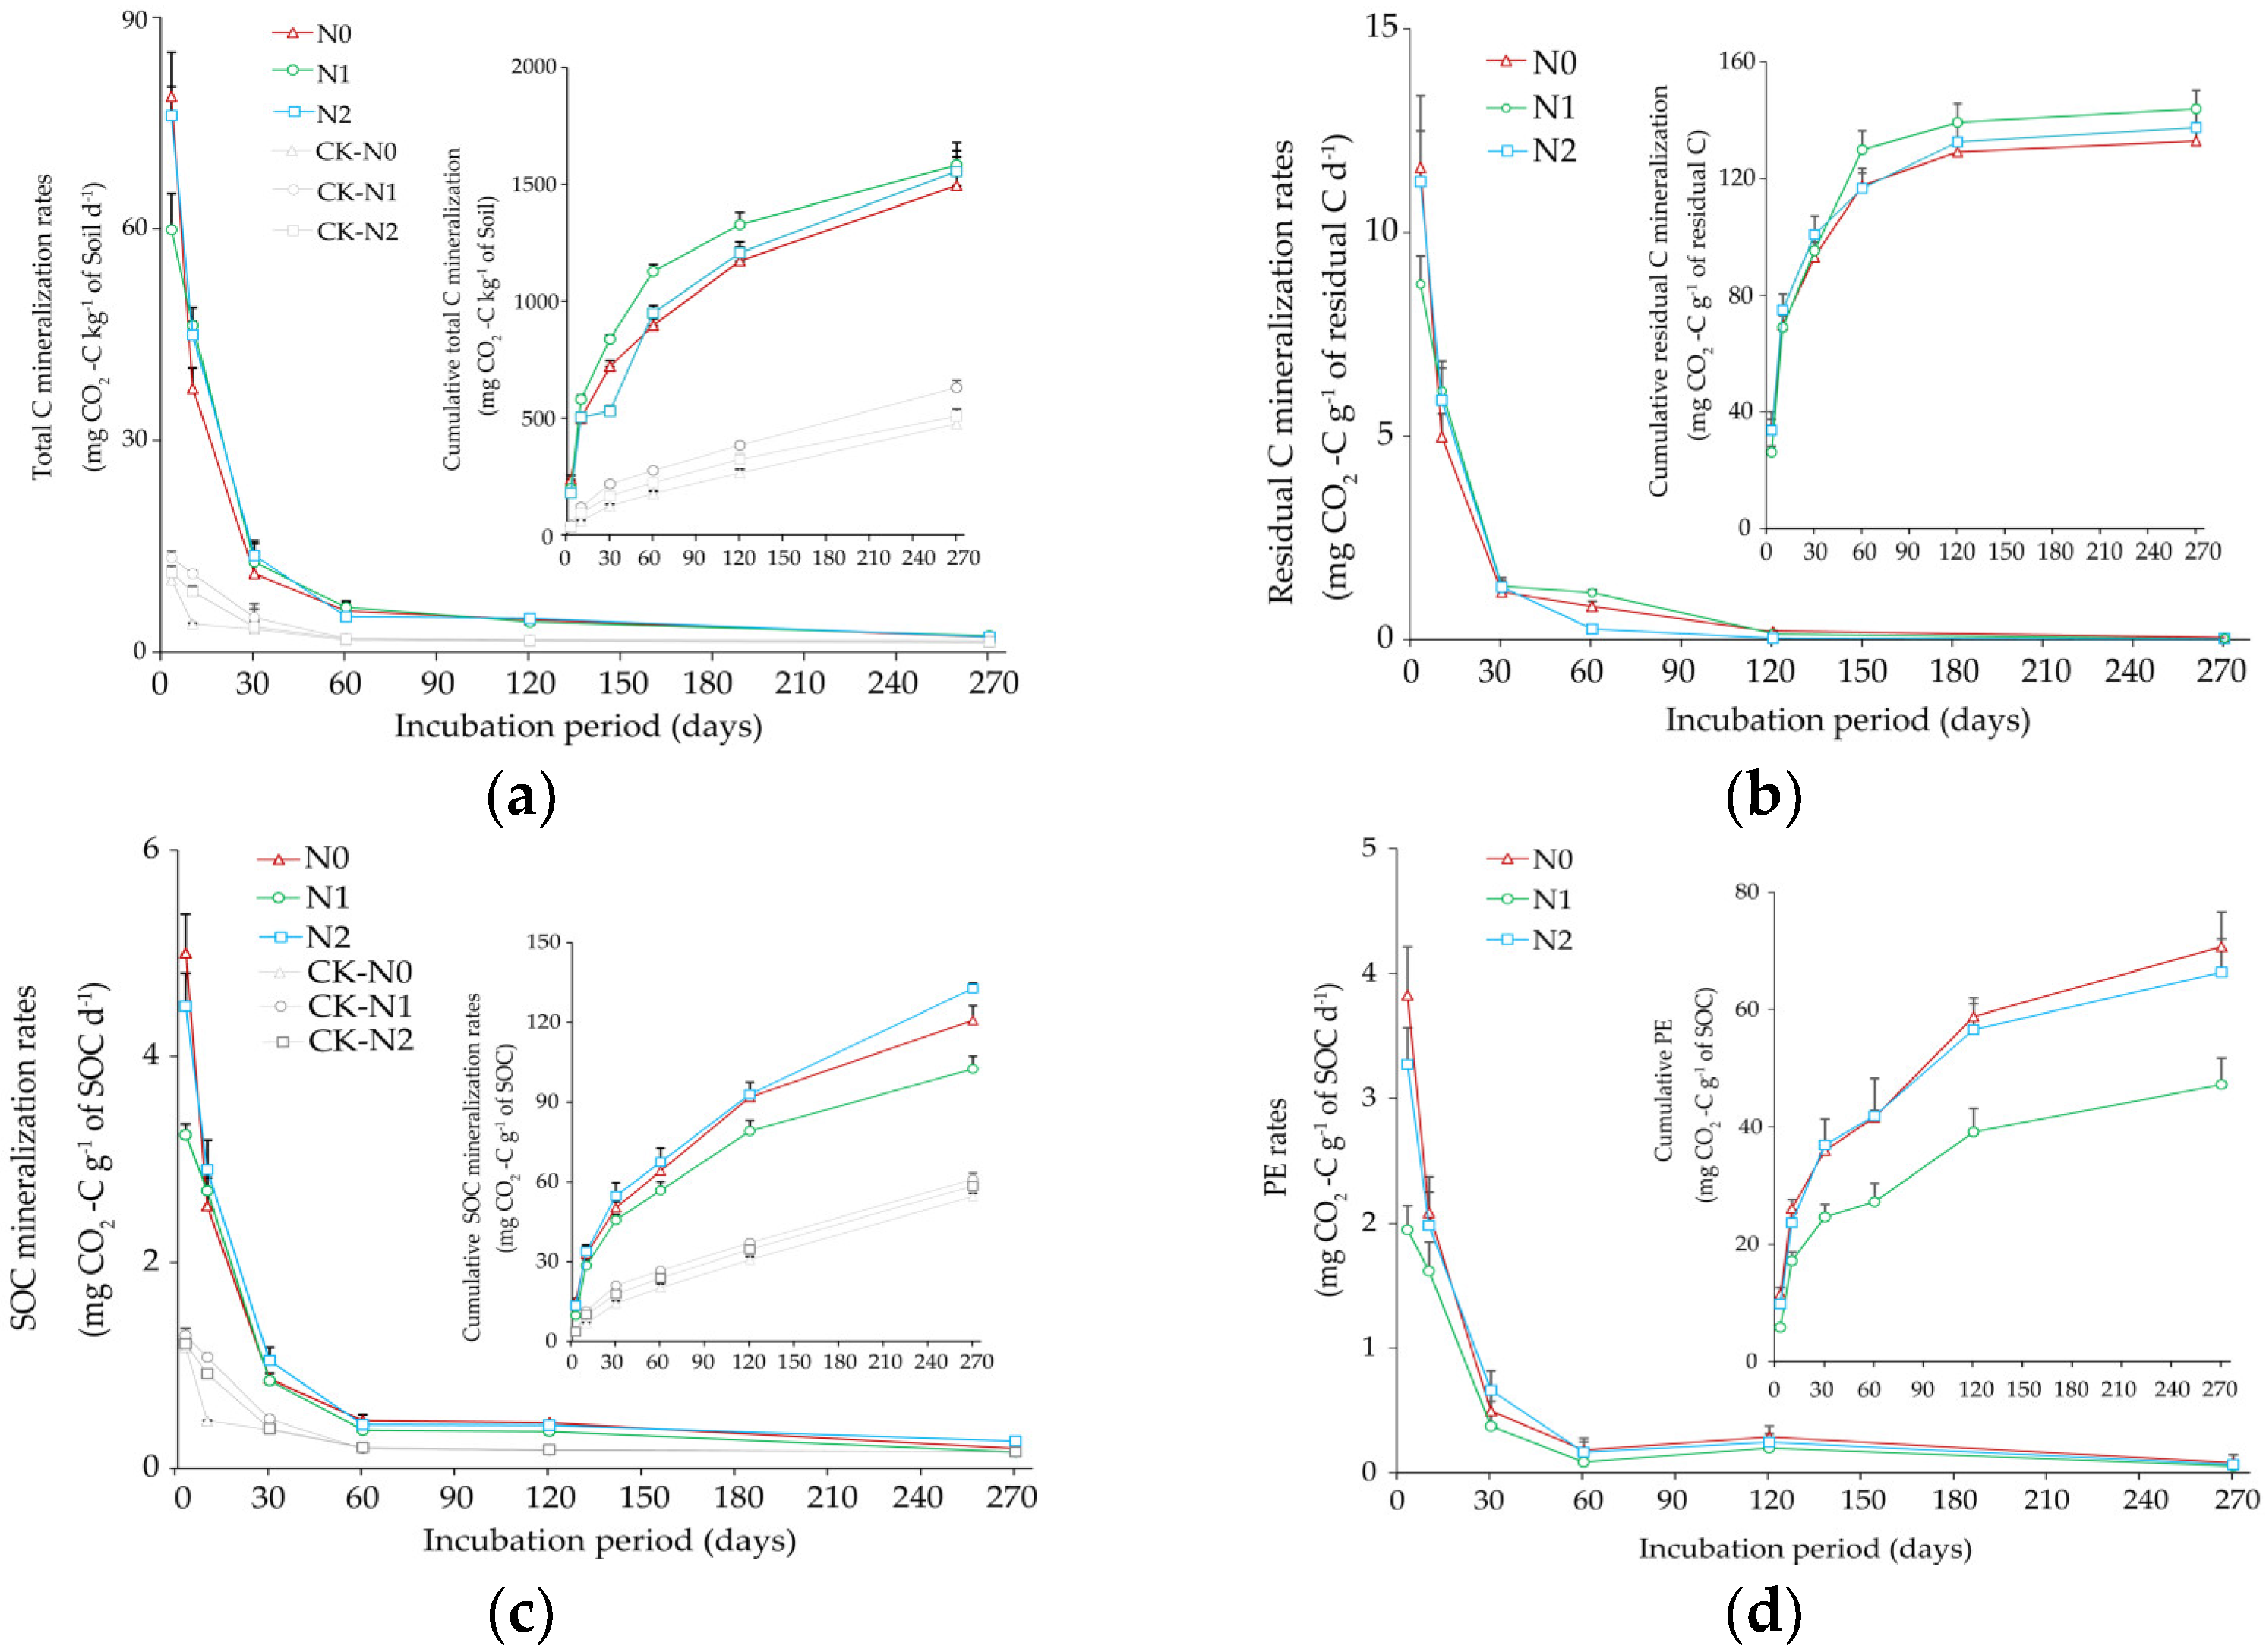
3.1. Total C, Residual C, Soil Organic C (SOC) Mineralization, and Priming Effect (PE)

The total C, residual C, SOC mineralization, and the PE were significantly influenced by the incubation time, N application level, and interactive effects of these two factors (Figure 1a–d, and Table S2). The total C mineralization rates were initially high among the soils with N treatments (10.27–78.76 mg CO2-C kg−1 of soil d−1) and then decreased over time in an exponential manner. Similar trends were observed in the residual C rates, SOC mineralization rates, and PE rates. At the end of the incubation, the cumulative total C and residual C mineralization of N1 were increased by 6.06% and 4.00% and by 1.65% and 8.35% compared with N0 and N2, respectively. However, the cumulative SOC mineralization and PE were decreased by 9.10% and 29.08% and by 17.71% and 33.34% compared with N0 and N2, respectively. These results highlight that in comparison with the application of no N and conventional N, reduced N application enhanced the total C and residual C mineralization but reduced SOC mineralization and the PE.

3.2. Microbial Biomass C (MBC) and Residue-Derived MBC

Both time and the N application level, as well as their interaction, significantly affected the total MBC and residue-derived MBC at each sampling time (Table S2). The residue input increased MBC content among all treatments. In general, N1 presented the highest total MBC and residue-derived MBC across all treatments during the experiment (Figure 2). At the initial stage, although the MBC in N0 was 18.20% higher than that of N2, N0 presented a 16.41% lower MBC than that of N2 at the end of the experiment. Similar trends were observed in the residue-derived MBC over the incubation period. On days 10, 30, and 120, N1 significantly increased the residue-derived MBC by 15.00, 14.05, and 22.13 mg C kg−1 of soil, respectively, in comparison with N0 and by 22.66, 14.72, and 18.23 mg C kg−1 of soil, respectively, in comparison with N2. Conversely, the residue-derived MBC in N2 exceeded that in N0 during the last stage.

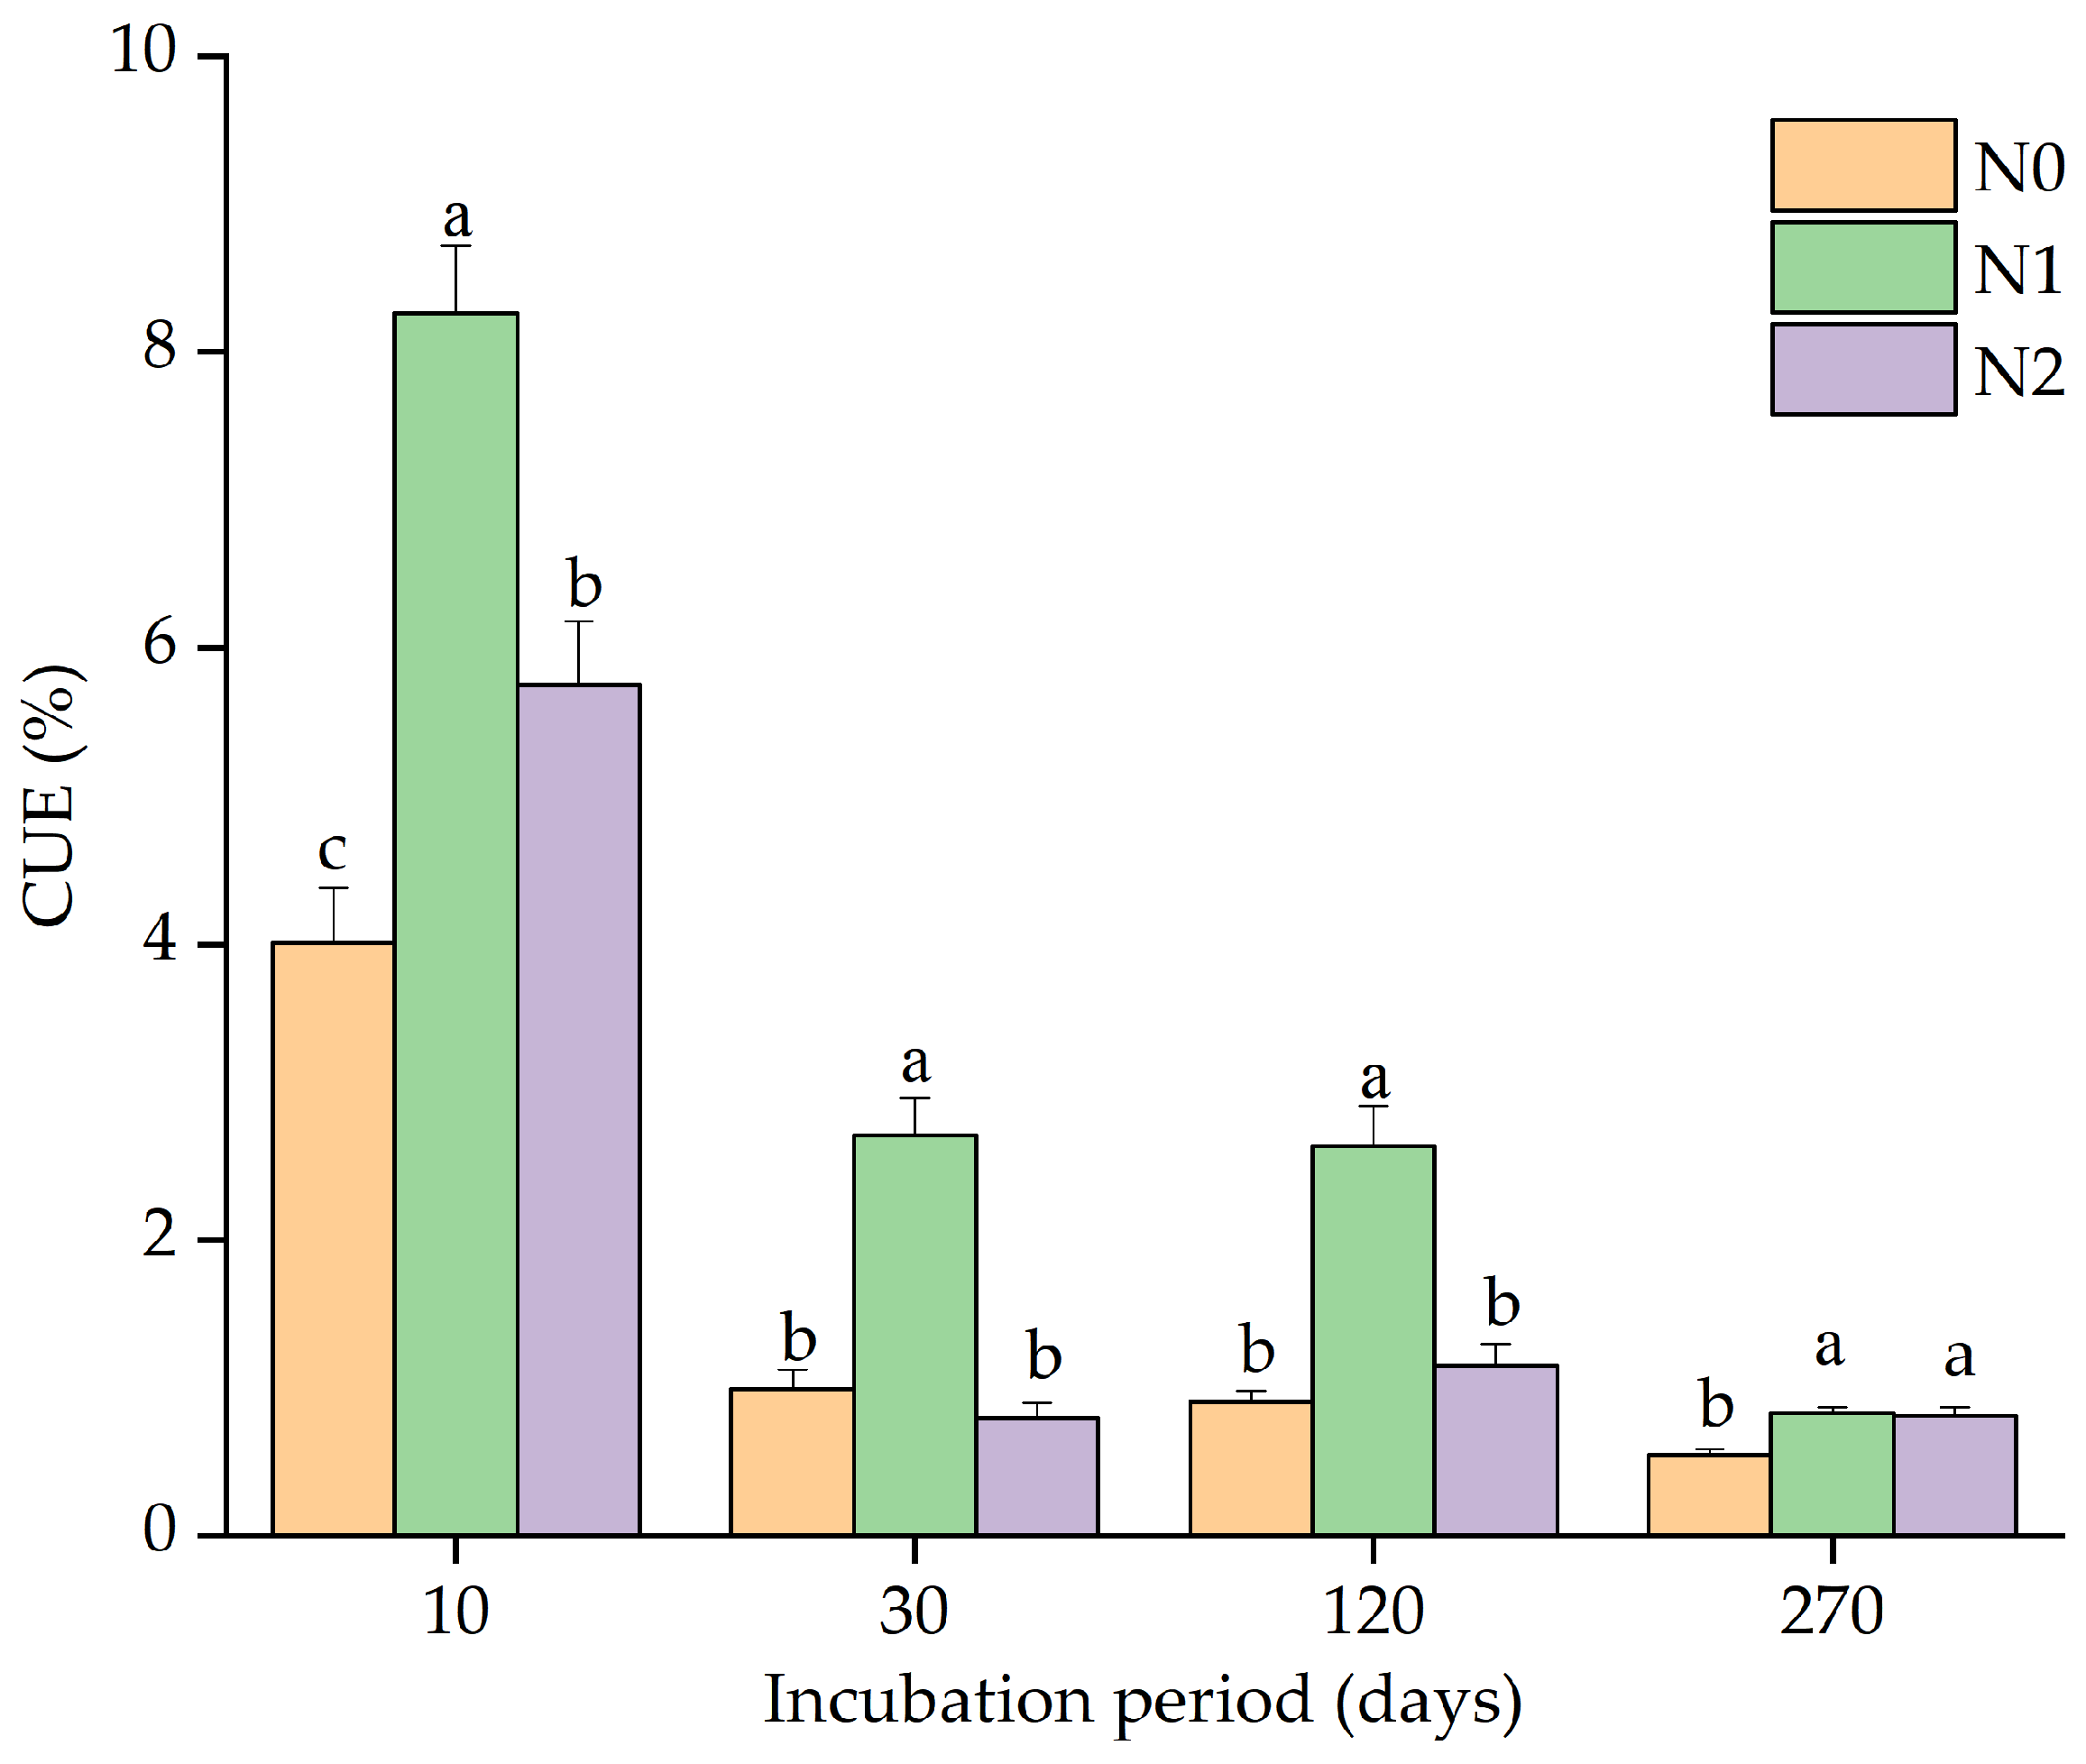
3.3. Microbial C Use Efficiency (CUE)

CUE was affected by time and the N application level. Additionally, time interacted strongly with the N application level (Table S1). Among these treatments, CUE was initially the highest and then continued to decrease over time (Figure 3). During the first three periods, the CUE of N1 significantly increased by 106.06%, 172.83%, and 189.37%, respectively, in comparison with N0 and by 43.70%, 241.61%, and 128.83%, respectively, in comparison with N2. N0 and N2 had similar CUE results at these sampling times, but N2 had a 51.82% higher CUE than that of N0.

3.4. Soil Microbial Communities’ Structure and Co-Occurrence Networks

The most abundant soil microbial phyla among the treatments are shown in Figure 4. During the experimental period, Proteobacteria, Firmicutes and Actinobacteria were the dominant bacterial phyla and accounted for about 60–80% of the relative abundance across the treatments. The relative abundance of Proteobacteria was initially 26.58–31.95% and decreased to 11.98–20.07% at the end of incubation. This phylum was highest in N1 but was lowest in N0 in comparison with the other treatments over the sampling period. Similar trends were observed for the abundance of Bacteroidota, which was initially higher but decreased over time (Figure 4a). For the fungal community (Figure 4b), N treatment significantly increased the relative abundance of Ascomycota from 48.18–75.45% (N0) to 74.84–88.82% (N1) and 72.46–89.29% (N2) over the sampling period. Conversely, Mortierellomycota markedly decreased from 11.69–47.33% (N0) to 1.59–8.44% (N1) and 0.58–7.64% (N2) over the sampling period. In general, the relative abundance of Ascomycota decreased over time to some extent, but that of Mortierellomycota increased over time across these treatments.
The different long-term N treatments changed the topological properties of the microbial co-occurrence patterns (Figures S1 and S2 and Table S3). The number of edges of bacteria increased by 45.68% in N1 but decreased by 22.22% in N2 in comparison with N0. For the fungal community, the edge numbers in N1 and N2 decreased by 22.33% and 21.40%, respectively, in comparison with N0. These results illustrated that during the period of maize residue decomposition, the fungal community’s network complexity decreased in the presence of N fertilizer, while that of the bacterial community increased with N1 but decreased with N2.

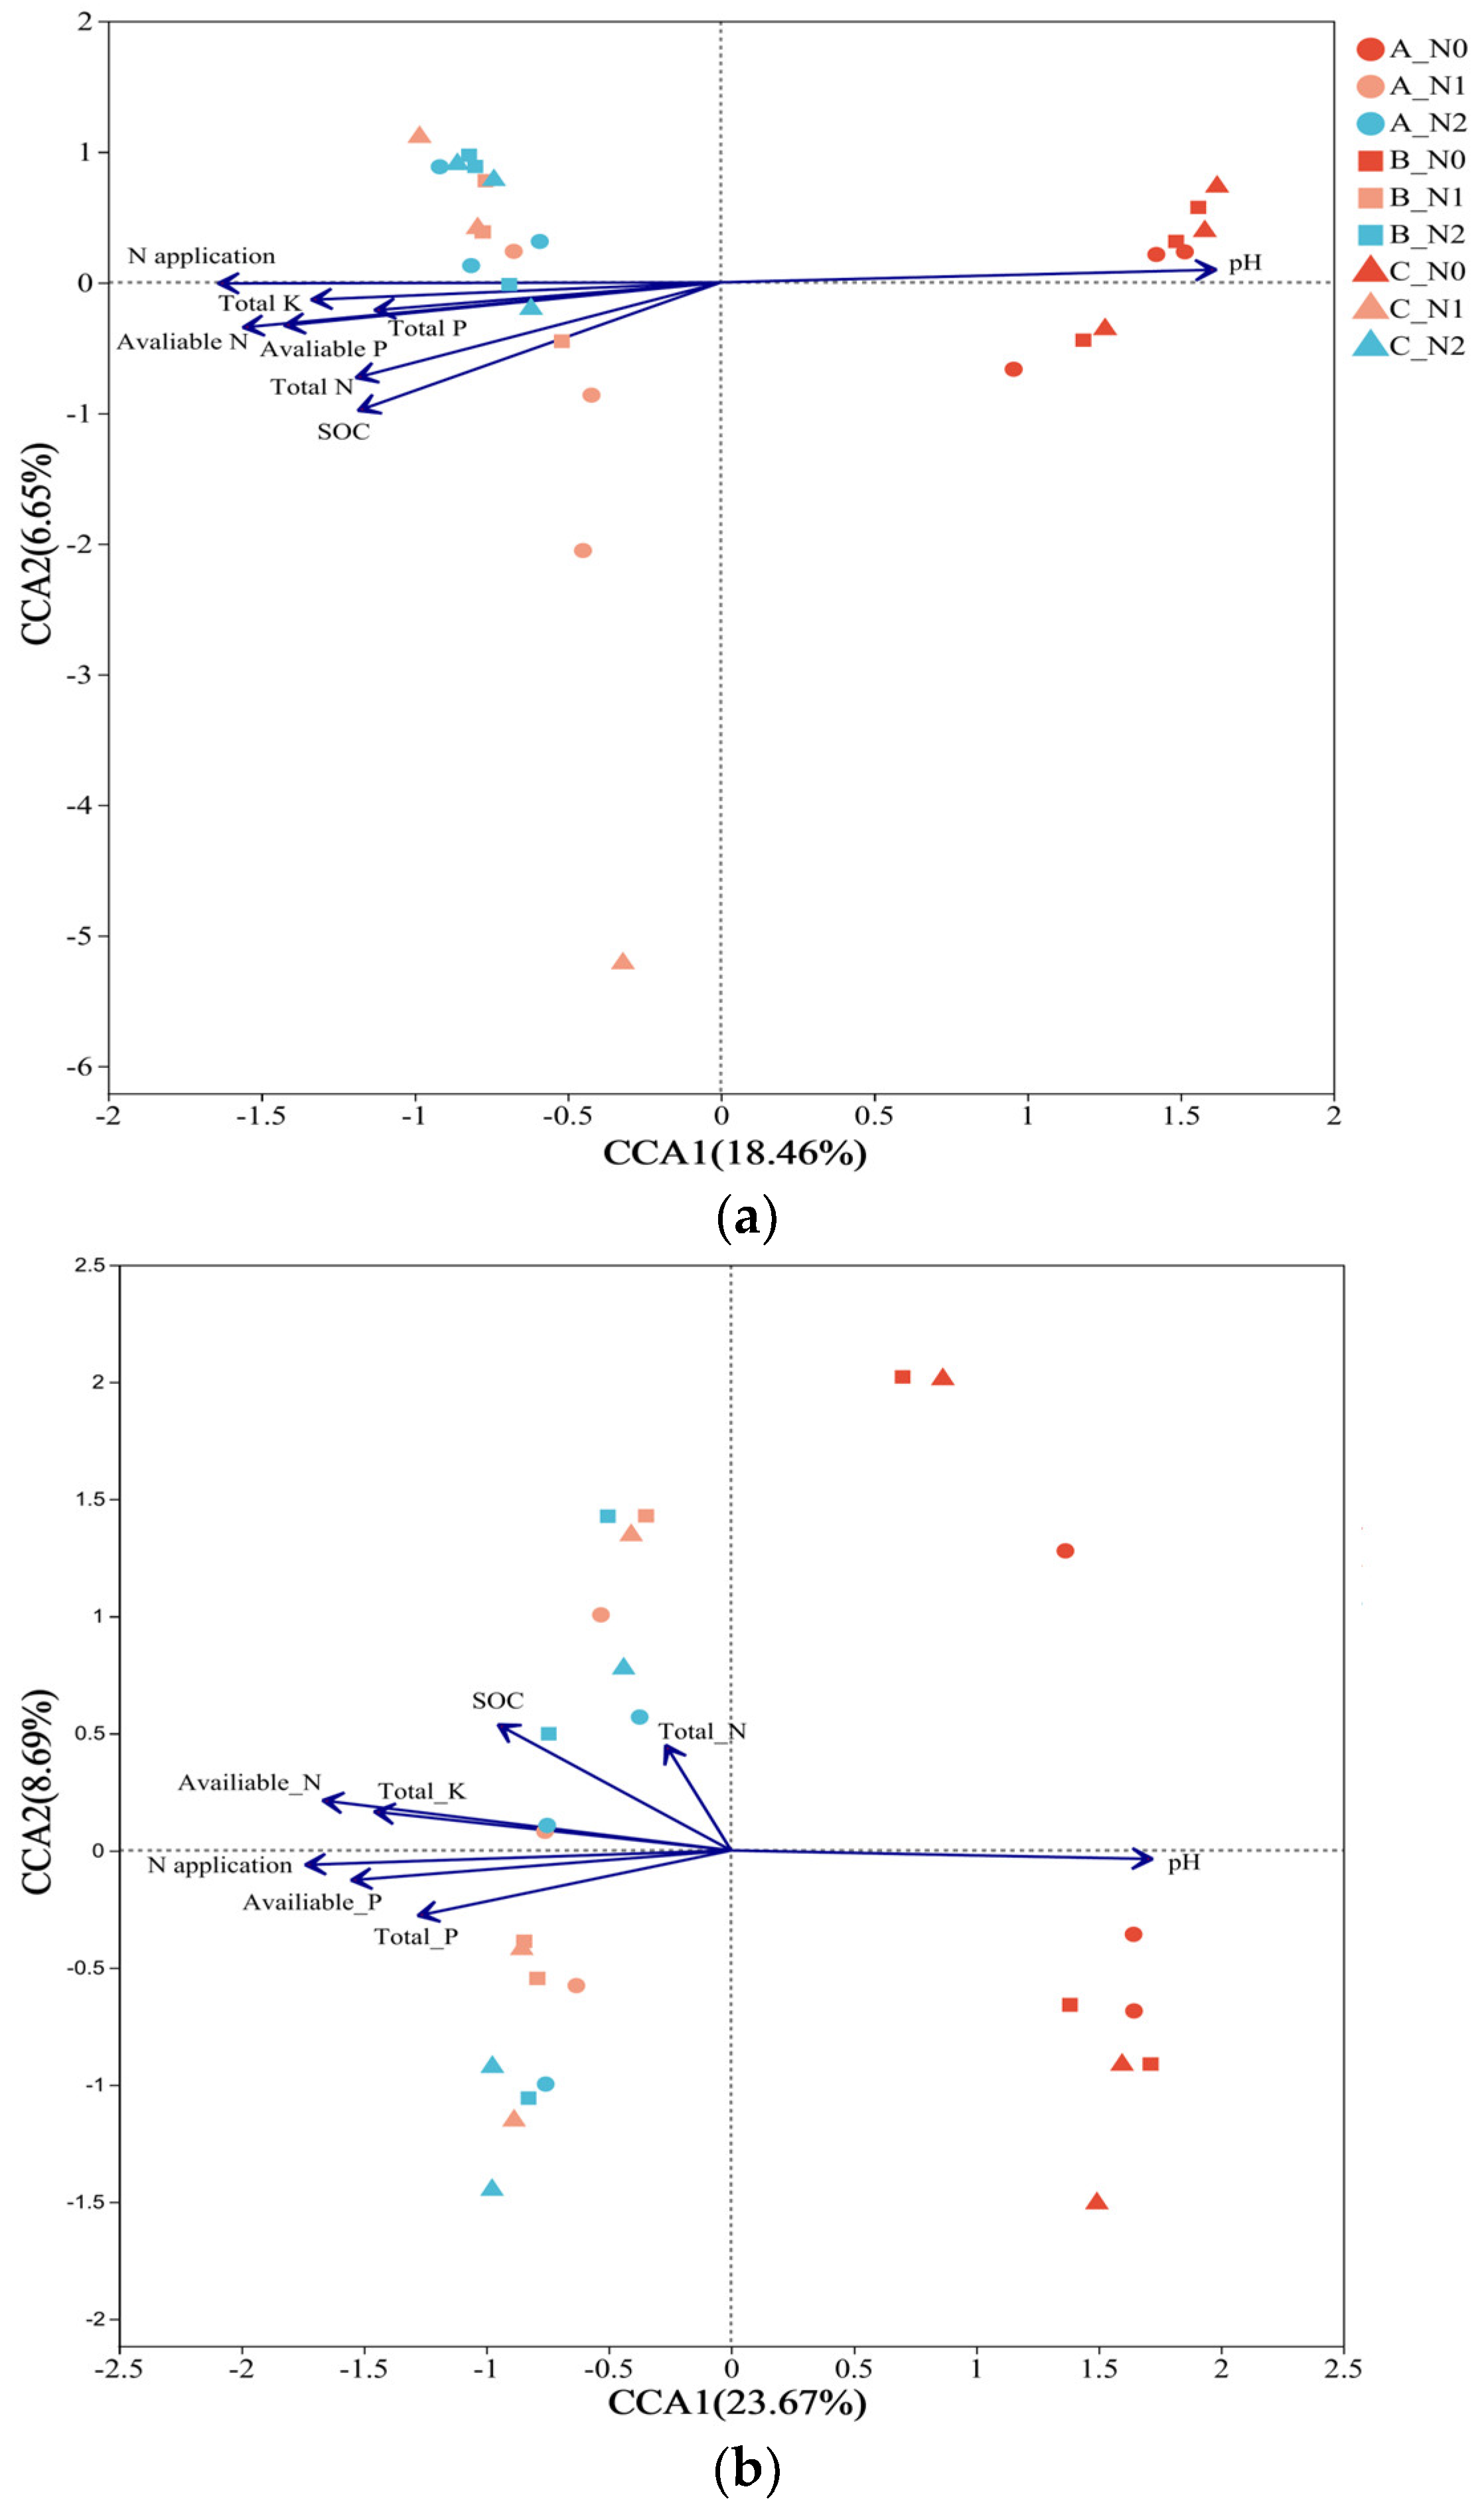
3.5. The Effects of Soil Chemical Properties on Assessments of Microbial Communities and Keystone Taxa

Canonical correspondence analyses (CCAs) were carried out to determine the relationships between the soil chemical properties among the treatments and the bacterial and fungal communities’ structure (Figure 5). Here, axis 1 indicates that 18.46% and 23.67% of the variation corresponded to a positive direction of pH. Conversely, 6.65% and 8.69% of the variation along axis 2 corresponded to a negative correlation between pH and N application, SOC, total N, total P, total K, available N, and available P. In terms of soil chemical properties, along axis 1, soil pH was associated with the bacterial and fungal communities in N0 across the three sampling periods, while those in N1 and N2 were associated with N application, SOC, total N, total P, total K, available N, and available P. These results indicated that the microbial communities’ structure in N0 was influenced by a higher pH and the nutrient-limited environment, whereas those of N1 and N2 may have been reshaped by the nutrient-rich environment and lower pH conditions.
The microbial keystone taxa across the experimental period in the various treatments are shown in Table S4. We found that the bacterial and fungal keystone taxa differed among the N application levels. Vicinamibacteraceae, Acidibacter, and Gemmatimonas were the keystone taxa of bacteria in the N0, N1, and N2 treatments, respectively. Penicillium, Sarocladium, and Cladophialophora were the keystone taxa of fungi in the N0, N1, and N2 treatments, respectively.

4. Discussion

In this study, we found that the long-term application of various levels of N influenced the arable soil pH, SOC, and availability of other nutrients. In the N0 treatment, maize and microbes needed to decompose SOC for N acquisition over a long period of time [21]. Therefore, SOC and other nutrients declined, which led to a nutrient-poor environment (Table 1). Conversely, chemical N acidified the arable land and created a low-pH environment in the N2 treatment. These disturbance factors were able to adjust the microbial communities, activities, and substrate preferences, which are critical for SOC turnover and nutrient cycling on farmlands [24,38].
The use of maize residues dramatically increased the cumulative total CO2-C emissions during the incubation period because of the mineralization of both residues and SOC (Figure 1a,b). The residue mineralization was initially high in the early stages because R strategists (Proteobacteria, Gemmatimonadota, and Actinobacteriota) quickly consumed the labile C of the residues (Figure 1b and Figure 4). Then, the mineralization declined during the second period, indicating a progressive reduction in available organic matter and an increase in recalcitrant components in the rest of the residues [40]. These results are similar to those obtained in other studies that found lower CO2-C emissions due to K strategists in the later stages of incubation, which consumed the recalcitrant C when the labile C declined [39,44]. Moreover, all of the N treatments triggered a positive PE because of the theories of microbial nutrient mining and microbial stoichiometric decomposition after the addition of residues [13,45]. The magnitude of the positive PE declined by about 30% in N1 compared to N0 and N2, indicating that bacteria and fungi preferred to use the labile residual C rather than the recalcitrant C in SOC in the N1 treatment. The increased PE in N0 can be explained by the microbial nutrient mining theory [46,47] and was shown by the increased abundance of K strategists (Acidobacteriota, Mortierellomycota, and Rozellomycota) in the soil with this treatment (Figure 4). To some extent, these microbes can endure environments with very low SOC, and N and are mainly responsible for decomposing complicated organic matter, such as lignin, lipids, and cellulose [48,49]. Conversely, the relationship between the higher abundance of R strategists and the positive PE in the N1 and N2 treatments can be illustrated by the theory of microbial stoichiometric decomposition [34,50].
Microbes show a negative correlation between SOC mineralization and microbial CUE [9,11]. This was proven by the significant negative relationship between CUE and the PE (Figure 1d and Figure 3) [8,51]. Among the N0, N1, and N2 treatments, the CUE of microbes in terms of maize residues was decreased over time, which corresponded with the results presented by other researchers [13,38]. This significant decrease in CUE can be accounted for by the following: (i) after rapid preferential consumption of degradable residual C resources by microbes, the rate of recalcitrant C was increased in the rest of the residues, thereby suppressing the respiration of microbes [52]; (ii) the strong increase in cumulative residual CO2-C emissions over time was able to reduce the microbial CUE, particularly during the latter period of incubation [13]. Moreover, the increased CUE in N1 indicated that more residual C was acquired by microbes. This meant that less SOC would be decomposed by the microbes, resulting in a microbial nutrient mining phenomenon [8,13], which, in turn, led to a lower PE in N1. Therefore, long-term reduced N application resulted in both a greater amount of residual C being immobilized by microbes and a reduction in SOC loss, which partly accounted for the higher SOC storage in N1 than that in N0 and N2 (Table 1). In addition, long-term conventional N application can acidify arable soil, thus reducing the mineralization rates of residues because microbial activities can be suppressed by low-ammonia metabolites in an acidic environment [24,53]. This result was demonstrated by the lower MBC and residue-derived MBC at the initial and middle stages of the incubation. However, the MBC and residue-derived MBC in N2 were increased at the end of incubation, which might have been due to the liming effect of maize residues, as this can enhance soil pH and alleviate acid suppression for microbes [13,24,38]. In summary, management practices that increase the stability of SOC against the PE can benefit from positive microbial feedback via a higher CUE.
Although the residues brought large amounts of labile C into the soil and promoted an increase in microbial biomass, we discovered that the bacteria and fungi showed diverse co-occurrence patterns. The addition of N led to a reduction in the complexity of the fungal community, but management with reduced N enhanced the bacterial complexity in this study. In general, the bacterial C/N ratio is lower than that of fungi. Consequently, the bacterial community’s complexity can be enhanced in N-rich environments due to its higher N demands [33,34]. Conversely, fungi favor N-limited environments over N-rich conditions; thus, a decrease in the complexity of the fungal network was observed in the N1 and N2 treatments [36,39]. Furthermore, these results also indicated stronger competitive and cooperative interactions between bacterial species for mineralizing maize residues in N1, meaning that the soil of N1 would provide a suitable habitat for bacterial development and contribute to better stability and resistance in the bacterial community [54,55]. Although the fungal community’s complexity decreased, this decrease did not influence the role of soil fungi in the mineralization of crop residues because of functional redundancy within the microbial communities, i.e., the functional roles of some fungal species in residual C decomposition and SOC turnover are more important than those of bacteria in arable soils [34,56,57].
Commonly, keystone taxa can associate with other taxa in microbial communities, which would affect residual C and SOC decomposition by reshaping bacterial and fungal communities’ structures [46,58,59]. In this study, the keystone taxa were specific to the different N treatments. Vicinamibacteraceae and Gemmatimonas were identified as bacterial keystone taxa in N0 and N2, respectively. They exhibited similar microbial functions. Vicinamibacteraceae belongs to the Acidobacteria phylum, which has a negative correlation with N availability and is likely to cause lower CUE but a higher PE by decomposing the refractory C in SOM [46,59]. Gemmatimonas can also dominate the mineralization of recalcitrant C in the soil to meet their living demands, and they were able to endure the very low pH in N2 [47,60,61]. Acidibacter was identified as a member of Proteobacteria; it has a heterotrophic lifestyle and belongs to the copiotrophic phylum, which prefers N-rich environments, and it managed to consume the labile C in residues; thus, it rapidly developed in N1 [62,63]. Ascomycota is the largest fungal phylum and a major consumer of organic matter. This phylum shows broad substrate consumption and a high tolerance for wide pH and nutrient gradients, and it is critical for decomposing recalcitrant C [57]. For example, Penicillium can excrete extracellular enzymes, such as cellulases and hemicellulases, which are correlated with high-C conditions [39]. As the N0 soil had inadequate SOC sources, the C available to the microbes gradually increased during the mineralization of maize residues [46]; thus, Penicillium was the keystone taxon in N0, while Sarocladium and Cladophialophora were the keystone taxa in N1 and N2, respectively. These results may be due to the higher nutrient and acidic environment tolerance abilities.

5. Conclusions

The reduced nitrogen treatment resulted in higher microbial carbon use efficiency and residue-derived microbial biomass carbon but lower positive priming effects and soil organic carbon mineralization in comparison with those found in the groups with no nitrogen and conventional nitrogen. Nitrogen addition decreased the fungal community’s complexity, but the reduced nitrogen strategy enhanced the bacterial community’s complexity. Acidibacter was the bacterial keystone taxon in the reduced nitrogen treatment, but Vicinamibacteraceae and Gemmatimonas were the bacterial keystone taxa in the no-nitrogen treatment and conventional nitrogen treatment, respectively, and were responsible for the high priming effect. Penicillium, Sarocladium, and Cladophialophora were the fungal keystone taxa in the no-nitrogen, reduced nitrogen, and conventional nitrogen treatments, respectively, and they exhibited wide substrate consumption in soil. Further studies focusing on comparing multiple types of residues under different types of long-term nitrogen management with the exact detection of microbial species and priming effects are needed. Such studies could uncover a stronger relationship among microbes, the priming effect, and dynamic changes in residual carbon in real farming systems.

Supplementary Materials

The following supporting information can be downloaded at: https://www.mdpi.com/article/10.3390/agronomy13071783/s1, Table S1: The properties of the 13C-labeling of maize residues; Table S2: Statistical significance (p values) of the fixed terms of soil, residue rate, nutrient rate, and/or time and their associated interactions with the dependent variables tested; Table S3: Topological properties of co-occurring microbial communities’ networks under different N treatments; Table S4: The keystone taxa in the bacterial and fungal networks under different N treatments; Figure S1. Network analyses illustrating the co-occurrence patterns of bacterial taxa in various treatments; Figure S2. Network analyses illustrating the co-occurrence patterns of fungal taxa in various treatments.

Author Contributions

Conceptualization, J.W.; data curation, K.Y. and K.W.; formal analysis, P.P. and F.D.; funding acquisition, J.W. and Y.C.; investigation, F.L.; methodology, Z.W. and C.Z.; project administration, H.T.; resources, F.D.; supervision, P.P. and F.L.; validation, Z.W., L.L., K.Y. and C.Z.; writing—original draft, K.Y.; writing—review and editing, L.L., P.P., H.T., F.L. and Y.C. All authors have read and agreed to the published version of the manuscript.

Funding

This research was funded by the National Natural Science Foundation of China (31971550) and the Science and Technology Planning Project of Guangzhou City, China (202201010763).

Institutional Review Board Statement

Not applicable.

Informed Consent Statement

Not applicable.

Data Availability Statement

Not applicable.

Acknowledgments

We are thankful for the valuable comments from the editor and experts which helped to improve this article.

Conflicts of Interest

The authors declare no conflict of interest.

References

  1. Blaud, A.; Menon, M.; Van, D.; Lair, G.J.; Banwart, S. Effects of Dry and Wet Sieving of Soil on Identification and Interpretation of Microbial Community Composition. Adv. Agron. 2017, 142, 119–142. [Google Scholar]
  2. Pankhurst, C.; Kirkby, C.; Hawke, B.; Harch, B. Impact of a change in tillage and crop residue management practice on soil chemical and microbiological properties in a cereal-producing red duplex soil in NSW, Australia. Biol. Fertil. Soils 2002, 35, 189–196. [Google Scholar]
  3. Song, X.J.; Li, J.Y.; Liu, X.T.; Liang, G.P.; Li, S.P.; Zhang, M.N.; Zheng, F.J.; Wang, B.S.; Wu, X.P.; Wu, H.J. Altered microbial resource limitation regulates soil organic carbon sequestration based on ecoenzyme stoichiometry under long-term tillage systems. Land Degrad. Dev. 2022, 33, 2795–2808. [Google Scholar] [CrossRef]
  4. Najera, F.; Dippold, M.A.; Boy, J.; Seguel, O.; Koester, M.; Stock, S.; Merino, C.; Kuzyakov, Y.; Matus, F. Effects of drying/rewetting on soil aggregate dynamics and implications for organic matter turnover. Biol. Fertil. Soils 2020, 56, 893–905. [Google Scholar] [CrossRef]
  5. Kok, D.D.; Scherer, L.; Vries, D.W.; Trimbos, P.M.; Bodegom, V. Relationships of priming effects with organic amendment composition and soil microbial properties. Geoderma 2022, 422, 115951. [Google Scholar] [CrossRef]
  6. Jackson, R.B.; Lajtha, K.; Crow, S.E.; Hugelius, G.; Kramer, M.G.; Piñeiro, G. The ecology of soil carbon: Pools, vulnerabilities, and biotic and abiotic controls. Annu. Rev. Ecol. Evol. Syst. 2020, 48, 419–445. [Google Scholar] [CrossRef]
  7. Chen, H.; Li, W.J.; Zheng, W.N.; Yin, C.; Fan, X.P.; Ye, M.J.; Gao, Z.X.; Wu, C.Y.; Liang, Y.C. Linking nitrogen- and straw-sensitive indicator species and their co-occurrences to priming effect in agricultural soil exposed to long-term nitrogen fertilization. Soil Biol. Biochem. 2023, 176, 108881. [Google Scholar] [CrossRef]
  8. Fang, Y.Y.; Nazaries, L.; Singh, B.K.; Singh, B.P. Microbial mechanisms of carbon priming effects revealed during the interaction of crop residue and nutrient inputs in contrasting soils. Glob. Chang. Biol. 2018, 24, 2775–2790. [Google Scholar] [CrossRef]
  9. Song, X.J.; Liu, X.T.; Liang, G.P.; Li, S.P.; Li, J.Y.; Zhang, M.N.; Zheng, F.J.; Ding, W.T.; Wu, X.P.; Wu, H.J. Positive priming effect explained by microbial nitrogen mining and stoichiometric decomposition at different stages. Soil Biol. Biochem. 2022, 175, 108852. [Google Scholar] [CrossRef]
  10. Wang, X.H.; Li, S.Y.; Zhu, B.; Peter, M.H.; Chen, G.S.; Yao, X.D.; Wu, D.M.; Yang, Z.J.; Lyu, M.K. Yusheng YangLong-term nitrogen deposition inhibits soil priming effects by enhancing phosphorus limitation in a subtropical forest. Glob. Change Biol. 2023, 29, 4081–4093. [Google Scholar] [CrossRef]
  11. Marie, B.; Tabata, B.; Jens, D.; Christine, W.; Rainer, G.J. Microbial carbon use efficiency of litter with distinct C/N ratios in soil at different temperatures, including microbial necromass as growth component. Biol. Fertil. Soils 2022, 58, 761–770. [Google Scholar]
  12. Wang, X.L.; Chen, Y.; Yang, K.P.; Duan, F.Y.; Liu, P.; Wang, Z.G.; Wang, J.W. Effects of legume intercropping and nitrogen input on net greenhouse gas balances, intensity, carbon footprint and crop productivity in sweet maize cropland in South China. J. Clean. Prod. 2021, 314, 127997. [Google Scholar] [CrossRef]
  13. Fang, Y.; Singh, B.P.; Collins, D.; Li, B.; Zhu, J.; Tavakkoli, E. Nutrient supply enhanced wheat residue Carbon mineralization, microbial growth, and microbial carbon-use efficiency when residues were supplied at high rate in contrasting soils. Soil Biol. Biochem. 2018, 126, 168–178. [Google Scholar] [CrossRef]
  14. Cui, H.; Chen, P.F.; He, C.; Jiang, Z.H.; Lan, R.; Yang, J.P. Soil microbial community structure dynamics shape the rhizosphere priming effect patterns in the paddy soil. Sci. Total Environ. 2023, 857, 159459. [Google Scholar] [CrossRef]
  15. Moran-Rodas, V.E.; Joergensen, R.G.; Wachendorf, C. Does liming improve microbial carbon use efficiency after maize litter addition in a tropical acidic soil? Biol. Fertil. Soils 2023, 1–9. [Google Scholar] [CrossRef]
  16. Schimel, J. Modeling ecosystem-scale carbon dynamics in soil: The microbial dimension. Soil Biol. Biochem. 2023, 178, 108948. [Google Scholar] [CrossRef]
  17. Aamer, M.; Chattha, M.B.; Mahmood, A.; Naqve, M.; Hassan, M.U.; Shaaban, M.; Rasul, F.; Batool, M.; Rasheed, A.; Tang, H.Y. Rice Residue-Based Biochar Mitigates N2O Emission from Acid Red Soil. Agronomy 2021, 11, 2462. [Google Scholar] [CrossRef]
  18. Dai, S.S.; He, P.; You, M.Y.; Li, L.J. The presence of soybean, but not soybean cropping frequency has influence on SOM priming in crop rotation systems. Plant Soil 2023, 487, 511–520. [Google Scholar] [CrossRef]
  19. Li, S.; Liu, J.J.; Yao, Q.; Yu, Z.H.; Li, Y.S.; Jin, J.; Liu, X.B.; Wang, G.H. Short-term lime application impacts microbial community composition and potential function in an acid black soil. Plant Soil 2022, 470, 35–50. [Google Scholar] [CrossRef]
  20. Zhang, C.; Zhao, X.; Liang, A.; Li, Y.Y.; Song, Q.; Li, X.Y.; Li, D.P.; Hou, N. Insight into the soil aggregate-mediated restoration mechanism of degraded black soil via biochar addition: Emphasizing the driving role of core microbial communities and nutrient cycling. Environ. Res. 2023, 228, 115895. [Google Scholar] [CrossRef] [PubMed]
  21. Ma, Q.X.; Pan, W.K.; Sheng, T.; Sun, X.D.; Xie, Y.N.; Chadwick, D.R.; Hill, P.W.; Si, L.L.; Wu, L.G.; Jones, D.L. Maize and soybean experience fierce competition from soil microorganisms for the uptake of organic and inorganic nitrogen and sulphur: A pot test using 13 C, 15 N, 14 C, and 35 S labelling. Soil Biol. Biochem. 2021, 157, 108260. [Google Scholar] [CrossRef]
  22. Feng, J.; Tang, M.; Zhu, B. Soil priming effect and its responses to nutrient addition along a tropical forest elevation gradient. Glob. Chang. Biol. 2021, 27, 2793–2806. [Google Scholar] [CrossRef] [PubMed]
  23. Song, X.; Lu, C.; Luo, J.; Gong, X.; Guo, D.; Ma, Y. Matured compost amendment improves compost nutrient content by changing the bacterial community during the composting of Chinese herb residues. Front. Microbiol. 2023, 14, 1146546. [Google Scholar] [CrossRef]
  24. Wang, X.J.; Clayton, R.; Butterly, C.R.; Baldock, J.F.; Tang, C.C. Long-term stabilization of crop residues and soil organic carbon affected by residue quality and initial soil pH. Sci. Total Environ. 2017, 587, 502–509. [Google Scholar] [CrossRef] [PubMed]
  25. Hu, Y.; Chen, M.; Yang, Z.L.; Cong, M.F.; Zhu, X.P.; Jia, H.T. Soil Microbial Community Response to Nitrogen Application on a Swamp Meadow in the Arid Region of Central Asia. Front. Microbiol. 2022, 12, 797306. [Google Scholar] [CrossRef]
  26. Goldstein, A.; Turner, W.R.; Spawn, S.A.; Anderson-Teixeira, K.J.; Cook-Patton, S.; Fargione, J.; Gibbs, H.K.; Griscom, B.; Hewson, J.H.; Howard, J.F.; et al. Protecting irrecoverable carbon in Earth’s ecosystems. Nat. Clim. Chang. 2020, 10, 287–295. [Google Scholar] [CrossRef]
  27. Chen, R.R.; Senbayram, M.; Blagodatsky, S.; Myachina, O.; Dittert, K.; Lin, X.G.; Blagodatskaya, E.; Kuzyakov, Y. Soil C and N availability determine the priming effect: Microbial N mining and stoichiometric decomposition theories. Glob. Chang. Biol. 2014, 20, 2356–2367. [Google Scholar] [CrossRef]
  28. Ramirez, K.S.; Craine, J.M.; Fierer, N. Consistent effects of nitrogen amendments on soil microbial communities and processes across biomes. Glob. Change Biol. 2012, 18, 1918–1927. [Google Scholar] [CrossRef]
  29. Bai, L.F.; Zhang, X.Q.; Li, B.Z.; Sun, F.C.; Zhao, X.Q.; Wang, Y.F.; Lu, Z.Y.; Zhang, D.J.; Fang, J. Fungal communities are more sensitive to nitrogen fertilization than bacteria in different spatial structures of silage maize under short-term nitrogen fertilization. Appl. Soil Ecol. 2022, 170, 104275. [Google Scholar] [CrossRef]
  30. Autret, B.; Guillier, H.; Pouteau, V.; Mary, B.; Chenu, C. Similar specific mineralization rates of organic carbon and nitrogen in incubated soils under contrasted arable cropping systems. Soil Tillage Res. 2020, 204, 104712. [Google Scholar] [CrossRef]
  31. Fu, X.H.; Li, S.Q.; Shen, Y.F.; Yue, S.C. Dynamic changes in bacterial community structure are associated with distinct priming effect patterns. Soil Biol. Biochem. 2022, 169, 108671. [Google Scholar] [CrossRef]
  32. Rottjers, L.; Faust, K. From hairballs to hypotheses-biological insights from microbial networks. FEMS Microbiol. Rev. 2018, 42, 761–780. [Google Scholar] [CrossRef] [PubMed]
  33. Su, Y.; Lv, J.; Yu, M.; Ma, Z.; Xi, H.; Kou, C.; He, Z.; Shen, A. Long-term decomposed straw return positively affects the soil microbial community. J. Appl. Microbiol. 2020, 128, 138–150. [Google Scholar] [CrossRef]
  34. Xiao, D.; He, X.Y.; Wang, G.H.; Xu, X.C.; Hu, Y.J.; Chen, X.B.; Zhang, W.; Su, Y.R.; Wang, K.L.; Soromotin, A.V.; et al. Network analysis reveals bacterial and fungal keystone taxa involved in straw and soil organic matter mineralization. Appl. Soil Ecol. 2022, 173, 104395. [Google Scholar] [CrossRef]
  35. Banerjee, S.; Schlaeppi, K.; Van der Heijden, M.G.A. Keystone taxa as drivers of microbiome structure and functioning. Nat. Rev. Microbiol. 2018, 16, 567–576. [Google Scholar] [CrossRef] [PubMed]
  36. Li, L.J.; Xia, Z.B.; Ye, R.Z.; Doane, T.A.; Horwath, W.R. Soil microbial biomass size and soil carbon influence the priming effect from carbon inputs depending on nitrogen availability. Soil Biol. Biochem. 2018, 119, 41–49. [Google Scholar] [CrossRef]
  37. Fang, Y.; Singh, B.P.; Badgery, W.; He, X. In situ assessment of new carbon and nitrogen assimilation and allocation in contrastingly managed dryland wheat crop–soil systems. Agric. Ecosyst. Environ. 2016, 235, 80–90. [Google Scholar] [CrossRef]
  38. Mo, F.; Zhang, Y.Y.; Liu, Y.; Liao, Y.C. Microbial carbon-use efficiency and straw-induced priming effect within soil aggregates are regulated by tillage history and balanced nutrient supply. Biol. Fertil. Soils 2021, 57, 409–420. [Google Scholar] [CrossRef]
  39. Zhuang, G.; Shuangyi, L.; Roland, B.; Zhu, P.; Peng, C.; An, T.T.; Cheng, N.; Liu, X.; Li, T.G.; Xu, Z.Q.; et al. Differential long-term fertilization alters residue-derived labile organic carbon fractions and microbial community during straw residue decomposition. Soil Tillage Res. 2021, 213, 105120. [Google Scholar]
  40. Nilsson, R.H.; Larsson, K.H.; Taylor, A.F.S.; Johan, B.P.; Bengtsson, P.J.; Jeppesen, T.S.; Schigel, D.; Kennedy, P.; Picard, K.; Glöckner, F.O.; et al. The UNITE database for molecular identification of fungi: Handling dark taxa and parallel taxonomic classifications. Nucleic Acids Res. 2018, 47, 259–264. [Google Scholar] [CrossRef]
  41. Qiu, Q.Y.; Wang, H.; Zhang, Q.F.; Mgelwa, A.S.; Zhu, B.; Hu, Y.L. Negative priming effect from tree leaf and root residues with contrasting chemical composition. Geoderma 2022, 427, 116118. [Google Scholar] [CrossRef]
  42. Rognes, T.; Flouri, T.; Nichols, B.; Quince, C.; Mah, F. VSEARCH: A versatile open source tool for metagenomics. PeerJ 2016, 4, 2584. [Google Scholar] [CrossRef] [PubMed]
  43. Wang, Q.; Garrity, G.M.; Tiedje, J.M.; Cole, J.R. Naive Bayesian classifier for rapid assignment of rRNA sequences into the new bacterial taxonomy. Appl. Environ. Microbiol. 2007, 73, 5261–5267. [Google Scholar] [CrossRef] [PubMed]
  44. Li, Z.Q.; Song, M.; Li, D.D.; Ma, L.; Zhao, B.Z.; Zhang, J.B. Effect of long-term fertilization on decomposition of crop residues and their incorporation into microbial communities of 6-year stored soils. Biol. Fertil. Soils 2020, 56, 25–37. [Google Scholar] [CrossRef]
  45. Sarker, J.R.; Singh, B.P.; Fang, Y.; Cowie, A.L.; Dougherty, W.J.; Collins, D.; Dalal, R.C.; Singh, B.K. Tillage history and crop residue input enhanced native carbon mineralisation and nutrient supply in contrasting soils under long-term farming systems. Soil Tillage Res. 2019, 193, 71–84. [Google Scholar] [CrossRef]
  46. Liu, X.A.; Sun, J.; Mau, R.L.; Finley, B.K.; Compson, Z.G.; Gestel, N.V.; Brown, J.R.; Schwartz, E.; Dijkstra, P.; Hungate, B.A. Labile carbon input determines the direction and magnitude of the priming effect. Appl. Soil Ecol. 2017, 109, 7–13. [Google Scholar] [CrossRef]
  47. Li, J.N.; Zhao, J.; Liao, X.H.; Yi, Q.; Zhang, W.; Lin, H.F.; Liu, K.P.; Peng, P.Q.; Wang, K.L. Long-term returning agricultural residues increases soil microbe-nematode network complexity and ecosystem multifunctionality. Geoderma 2023, 430, 116340. [Google Scholar] [CrossRef]
  48. Zhang, S.B.; Fang, Y.Y.; Kawasaki, A.; Tavakkoli, E.; Cai, Y.J.; Wang, H.L.; Ge, T.D.; Zhou, J.S.; Yu, B.; Li, Y.F. Biochar significantly reduced nutrient-induced positive priming in a subtropical forest soil. Biol. Fertil. Soils 2023, 1–19. [Google Scholar] [CrossRef]
  49. Arcand, M.M.; Levy, B.D.J.; Helgason, B.L. Resource legacies of organic and conventional management differentiate soil microbial carbon use. Front. Microbiol. 2017, 8, 02293. [Google Scholar] [CrossRef]
  50. Naether, A.; Foesel, B.U.; Naegele, V.; Wust, P.K.; Weinert, J.; Bonkowski, M.; Alt, F.; Oelmann, Y.; Polle, A.; Lohaus, G. Environmental factors affect acidobacterial communities below the subgroup level in grassland and forest soils. Appl. Environ. Microbiol. 2012, 78, 7398–7406. [Google Scholar] [CrossRef]
  51. Xie, N.; An, T.; Zhuang, J.; Mark, R.; Sean, S.; Li, S.; Wang, J.K. High initial soil organic matter level combined with aboveground plant residues increased microbial carbon use efficiency but accelerated soil priming effect. Biogeochemistry 2022, 160, 1–15. [Google Scholar] [CrossRef]
  52. Chen, X.B.; Xia, Y.H.; Rui, Y.C.; Ning, Z.; Hu, Y.J.; Tang, H.M.; He, H.B.; Li, H.X.; Kuzyakov, Y.K.; Ge, T.D.; et al. Microbial carbon use efficiency, biomass turnover, and necromass accumulation in paddy soil depending on fertilization. Agric. Ecosyst. Environ. 2020, 106, 816. [Google Scholar] [CrossRef]
  53. Wang, C.; Xiao, R.; Guo, Y.; Wang, Q.; Zhang, M. Changes in soil microbial community composition during phragmites australis straw decomposition in salt marshes with freshwater pumping. Sci. Total Environ. 2020, 762, 143996. [Google Scholar] [CrossRef] [PubMed]
  54. Jin, H.Y.; Zhang, D.Q.; Yan, Y.Q.; Yang, C.; Fang, B.T.; Li, X.D.; Shao, Y.H.; Wang, H.F.; Yue, J.Q.; Wang, Y.J. Short-term application of chicken manure under different nitrogen rates alters structure and co-occurrence pattern but not diversity of soil microbial community in wheat field. Front. Microbiol. 2022, 13, 975571. [Google Scholar] [CrossRef]
  55. Sun, Y.; Wang, J.; Mi, W.T.; Mu, W.Y.; Tao, W.H.; Chen, C.; Mi, W.H.; Su, L.J. Effects of slow- and controlled-release nitrogen fertilizers on bacterial and fungal community composition in a double-cropping rice system. Soil Tillage Res. 2023, 230, 105714. [Google Scholar] [CrossRef]
  56. Hui, C.; Jiang, H.; Liu, B.; Wei, R.; Zhang, Y.P.; Zhang, Q.C.; Liang, Y.C.; Zhao, Y.H. Chitin degradation and the temporary response of bacterial chitinolytic communities to chitin amendment in soil under different fertilization regime. Sci. Total Environ. 2020, 705, 136003. [Google Scholar] [CrossRef] [PubMed]
  57. Wagg, C.; Schlaeppi, K.; Banerjee, S.; Kuramae, E.E.; Heijden, M.G.A.V.D. Fungal-bacterial diversity and microbiome complexity predict ecosystem functioning. Nat. Commun. 2019, 10, 4841. [Google Scholar] [CrossRef]
  58. Liu, S.W.; Yu, H.; Yu, Y.H.; Huang, J.; Zhou, Z.Y.; Zeng, J.X.; Chen, P.B.; Xiao, F.S.; He, Z.L.; Yan, Q.Y. Ecological stability of microbial communities in Lake Donghu regulated by keystone taxa. Ecol. Indic. 2022, 136, 108695. [Google Scholar] [CrossRef]
  59. Wei, X.; Zhu, Z.; Liu, Y.; Luo, Y.; Deng, Y.; Xu, X.; Liu, S.; Richter, A.; Shibistova, O.; Guggenberger, G.; et al. C:N:P stoichiometry regulates soil organic carbon mineralization and concomitant shifts in microbial community composition in paddy soil. Biol. Fertil. Soils 2020, 56, 1093–1107. [Google Scholar] [CrossRef]
  60. Zhong, Y.; Liu, J.; Jia, X.; Shan, G.Z.; Wang, R.; Yan, W. Microbial community assembly and metabolic function during wheat straw decomposition under different nitrogen fertilization treatments. Biol. Fertil. Soils 2020, 14, 697–710. [Google Scholar] [CrossRef]
  61. Yan, F.; Wang, S.Q.; Huang, Z.H.; Liu, Y.R.; He, L.L.; Qian, F.Y. Microbial ecological responses of partial nitritation/anammox granular sludge to real water matrices and its potential application. Environ. Res. 2023, 266, 115701. [Google Scholar] [CrossRef] [PubMed]
  62. Dai, M.D.; Tan, X.F.; Ye, Z.R.; Li, B.J.; Zhang, Y.; Chen, X.T.; Kong, D.D. Soil bacterial community composition and diversity respond to soil environment in rooftop agricultural system. Environ. Technol. Innov. 2023, 30, 103042. [Google Scholar] [CrossRef]
  63. Fei, Y.M.; Zhang, B.G.; He, J.X.; Chen, C.B.; Liu, H. Dynamics of vertical vanadium migration in soil and interactions with indigenous microorganisms adjacent to tailing reservoir. J. Hazard Mater. 2022, 424, 127608. [Google Scholar] [CrossRef] [PubMed]
Figure 1. Total C mineralization rates (a), residual C mineralization rates (b), SOC mineralization rates (c), and PE rates (d) of N0, N1, and N2 over the 270-day incubation period. The insets in each subfigure show the cumulative total C mineralization, cumulative residual C mineralization, cumulative SOC mineralization, and cumulative PE in the corresponding treatments over the entire incubation period. N0: no N; N1: reduced N; N2: conventional N. Vertical bars indicate the standard error of three replicates.
Agronomy 13 01783 g001
Figure 2. MBC and residue-derived MBC (mg kg −1 soil) in N0, N1, and N2 on the 10th, 30th, 120th, and 270th days of incubation. N0: no N; N1: reduced N; N2: conventional N. Different letters indicate significant differences (p < 0.05) among different N treatments at the same incubation time. Vertical bars indicate the standard error of three replicates.
Agronomy 13 01783 g002
Figure 3. Microbial CUE in N0, N1, and N2 on the 10th, 30th, 120th, and 270th days of incubation. N0: no N; N1: reduced N; N2: conventional N. Different letters indicate significant differences (p < 0.05) among different N treatments at the same incubation time. Vertical bars indicate the standard error of three replicates.
Agronomy 13 01783 g003
Figure 4. Relative abundance of the taxonomic composition of the soil bacterial (a) and fungal communities (b) at the phylum level after the addition of maize residues. N0: no N; N1: reduced N; N2: conventional N. Soil sampling was conducted on the 10th, 120th, and 270th days after the addition of maize residues. Phylum names are color-coded on the right.
Agronomy 13 01783 g004
Figure 5. Canonical correspondence analyses (CCAs) of the OTU levels of the bacterial community’s (a) and fungal community’s (b) structure and soil chemical properties, i.e., pH, SOC, total N, total P, total K, available N, and available P. N0: no N; N1: reduced N; N2: conventional N. Soil sampling was conducted on the 10th day (A), 120th day (B), and 270th day (C) after the addition of maize residues.
Agronomy 13 01783 g005
Table 1. Basic soil properties before starting the in situ experiment.
TreatmentspHSOCTNTPTKANAPAKAnnual CO2 Emissions
g/kgg/kgg/kgg/kgmg/kgmg/kgmg/kgkg/hm2
N06.763 ± 0.108 a15.042 ± 0.338 b0.604 ± 0.012 c0.969 ± 0.012 b17.497 ± 0.971 b70.741 ± 3.739 b251.734 ± 13.435 c307.040 ± 2.323 b472.279 ± 23.76 a
N14.71 ± 0.155 b17.774 ± 0.320 a0.807 ± 0.014 a1.152 ± 0.014 a21.104 ± 0.792 a93.445 ± 1.575 a372.309 ± 5.404 a304.765 ± 4.684 a361.774 ± 18.87 b
N24.15 ± 0.023 c16.134 ± 0.293 b0.680 ± 0.015 b1.062 ± 0.015 ab19.383 ± 0.977 a87.323 ± 3.436 a333.077 ± 14.173 b395.305 ± 14.903 a378.424 ± 17.233 b
N0: no nitrogen; N1: reduced nitrogen; N2: conventional nitrogen. Different letters indicate significant differences (p < 0.05) between the different N treatments.
Disclaimer/Publisher’s Note: The statements, opinions and data contained in all publications are solely those of the individual author(s) and contributor(s) and not of MDPI and/or the editor(s). MDPI and/or the editor(s) disclaim responsibility for any injury to people or property resulting from any ideas, methods, instructions or products referred to in the content.

