Article

Biochar Amendment Suppressed Fusarium Wilt and Altered the Rhizosphere Microbial Composition of Tomatoes

1
Key Laboratory of Biology and Genetic Improvement of Horticultural Crops (Northeast Region), Ministry of Agriculture and Rural Affairs, Department of Horticulture, Northeast Agricultural University, Harbin 150030, China
2
College of Life Science, Northeast Agricultural University, Harbin 150030, China
*
Authors to whom correspondence should be addressed.
Agronomy 2023, 13(7), 1811; https://doi.org/10.3390/agronomy13071811
Submission received: 10 June 2023 / Revised: 3 July 2023 / Accepted: 4 July 2023 / Published: 7 July 2023

Abstract

:
The effectiveness of biochar application to promote plant growth and suppress plant diseases is usually dependent on the application dose of the biochar. Here, we evaluated the effects of biochar supplied at 0%, 1%, 2%, and 3% (w/w) on tomato growth, Fusarium wilt disease severity, and rhizosphere microbial community diversity. We found that biochar applied at 1% and 2% promoted tomato growth and decreased the severity of Fusarium wilt disease. High-throughput amplicon sequencing indicated that 1% biochar decreased the alpha diversity and altered the composition of the bacterial and fungal community in the tomato rhizosphere, increasing the abundance of potential plant-beneficial microorganisms. Quantitative PCR confirmed that all doses of biochar increased the abundance of rhizosphere bacteria; biochar applied at 1% and 2% decreased the abundance of rhizosphere fungi and Fusarium oxysporum f. sp. Lycopersici (FOL), while biochar applied at 3% increased abundance of FOL. Our results indicated that biochar applied at 1% and 2% suppressed tomato Fusarium wilt disease, which might be linked to the change of the rhizosphere microbial community structure and increased the abundance of potential plant-beneficial microorganisms such as Pseudomonas sp. within the microbiome.

1. Introduction

Intensive management practices adopted in modern agricultural systems, particularly long-term continuous monocropping, have resulted in increased soil-borne plant diseases and decreased crop performance [1]. Soil-borne disease is one of the major restrictions to modern intensive agriculture and can cause significant economic losses for many crops, such as tomatoes (Solanum lycopersicum L.) [2]. Fusarium wilt, one of the top ten fungal diseases affecting tomatoes, caused by Fusarium oxysporum f. sp. lycopersici (FOL), is one of the major limiting factors to tomato yield [3]. Traditional chemical control of soil-borne diseases is neither satisfactory nor environmentally friendly [4], which highlights the necessity to develop alternative disease-management strategies. As soil organic amendments, biochar has been reported to stimulate plant growth and inhibit soil-borne diseases, including Fusarium wilt [5,6,7].
Biochar is the pyrolysis product of biomass under anaerobic conditions [8]. The effectiveness of biochar in inhibiting plant disease has been reported to be dependent on the application rate of biochar [7,9,10]. In general, biochar applied at relatively lower doses can suppress plant disease and stimulate plant growth, whereas biochar applied at relatively higher doses (≥3%) is usually ineffective against plant diseases and can even promote plant diseases and retard plant growth [11,12,13]. Moreover, the optimal doses of biochar for plant-growth promotion and disease suppression usually do not coincide [7]. Studies even found that the optimal biochar application rate for plant-growth promotion may weaken the defense ability of plants [14]. For example, Viger et al. [15] have shown that Arabidopsis growth was promoted by a high dose of biochar and simultaneously downregulated defense-related genes. Akhter et al. [6] found that in a disease-free environment, biochar at 3% stimulated tomato growth but benefitted the Fusarium wilt disease. Therefore, the optimal doses of biochar for both plant growth and disease inhibition should be investigated for agricultural production.
Generally, biochar-induced plant protection against soil-borne diseases can be attributed to the increased nutrient supply to plants, changes in soil physiochemical characteristics [13], and the direct effects on plant pathogens [16]. Moreover, the plant defense system may be directly stimulated by biochar [17,18]. It is well recognized that the plant rhizosphere microbiome is an important factor affecting plant performance and a key driver of plant defense against soil-borne pathogens [19,20,21]. It was reported that the increase in microbial diversity and activity stimulated by biochar is linked to its ability to promote plant health and productivity [22,23]. In a previous study, we found that biochar at 1% can inhibit Fusarium wilt by promoting plants to recruit plant-beneficial bacteria [24]. However, we do not know what will happen to the rhizosphere microbes at higher doses of biochar. The optimal dose of biochar for inhibiting tomato Fusarium wilt and promoting growth is not clear. Addressing these questions will help us gain insight into the mechanism of disease inhibition and provide an important basis for the application of biochar in agriculture production.
The aims of this research were (1) to select the optimum application rate of biochar to promote tomato growth and suppress Fusarium wilt disease and (2) to assess the responses of the rhizosphere microbial community to biochar application. In this study, tomato seedlings grown in pots were supplied with different rates of biochar. Tomato plant growth and Fusarium wilt disease severity were monitored. Tomato rhizosphere microbial community diversity and abundance were evaluated by amplicon sequencing and quantitative PCR, respectively. We hypothesized that different application rates of biochar would have differing effects on tomato seedling performance and the rhizosphere microbiome.

2. Materials and Methods

2.1. Soil Collection and Preparation of Biochar and FOL Conidia

The soil was collected from a high tunnel that has been planted with tomatoes for 20 years in Harbin, China (45°41′ N, 126°37′ E). The soil used is continuous cropping soil, which is fertilized every year and has high fertility, so there was no fertilization during the experiment. The incidence of tomato Fusarium wilt in the greenhouse reached 60–80%. The study utilized sandy loam soil that had the following properties: inorganic N: 61.26 mg/kg, available P: 190.36 mg/kg, available K: 185.21 mg/kg, organic matter: 46.05 g/kg, EC (1:2.5, w/v): 0.34 mS/cm and pH (1:2.5, w/v): 7.01. The collected soil was passed through a 2 mm sieve before being used. Part of the soil was sterilized with autoclaving for seed germination. The remaining soil was used for transplantation.
The biochar was prepared from the stem of the Jerusalem artichoke (Helianthus tuberosus) as follows: the Jerusalem artichoke stem was dried in an oven. The dried materials were crushed and ground to <1.0 mm particle size and then were pyrolyzed under oxygen deprivation conditions at 450 °C for 2 h. The biochar had the following characteristics: 65.99% C, 1.765% N, 3.119% H, pH (1:2.5, w/v):9.24, EC (1:2.5, w/v):6.68 μS/cm, SA 2.63 m2/g. The biochar was ground through a 0.5 mm sieve before use.
FOL (strain F01), which was isolated previously [24], was cultivated for two weeks in the dark at 24 °C on Potato Dextrose Agar to obtain the conidia. The FOL culture plate was flooded with sterile water and rubbed with a blade gently. The density of microconidia was adjusted to 1.0 × 10⁷ conidial mL−1 by sterile water [25].

2.2. Pot Experiment

Tomato seeds (Dong Nong 708) were soaked in hot water (55 °C) for 30 min and then germinated in sterilized soil from the above soil (2.1). Background soils were mixed with 0%, 1%, 2%, and 3% (w/w) doses of biochar, respectively, then incubated at room temperature for 15 days before use. After incubation, soil with different doses of biochar was placed in pots, each containing 2 kg of soil. Tomato seedlings with two cotyledons were transplanted into pots—one seedling per pot. The experiment was replicated three times; there were 20 pots for each treatment in each replicate. In order to maintain consistent soil moisture for all pots, plants were irrigated with tap water to maintain the soil moisture at about 65% of its maximum water capacity with the gravimetric method.
Tomato seedlings with four leaves were inoculated with FOL, as previously described by Xu and Ko [26]. The tomato seedlings were gently removed from the soil, and about 1 cm of the root tips was cut off with sterilized scissors and soaked in a 1.0 × 10⁷ conidial mL−1 suspension of FOL for 5 min. Control seedlings were soaked in sterile water. Then, the seedlings were planted back into their original pots. The incidence of tomato Fusarium wilt disease as well as a disease index were documented 15 days after inoculating FOL as described by Akhter et al. [27]:
Disease incidence = Number of infected plants/Total number of plants × 100
The Plants were divided into five levels according to the length (%) of the infected stem: c1 = 1–5%, c2 = 5–15%, c3 = 15–35%, c4 = 35–67.5%, c5 = 67.5–100%). The disease index was calculated using the following formula:
Disease index = 5 × (nc1 + 2nc3 + 5nc3 + 10nc4 + 20nc5)/n infected plants

2.3. Survey of Plant Growth and Collection of Rhizosphere Soil

Tomato seedlings were harvested 60 days after transplanting, then the plant’s dry biomass and height were measured. Meanwhile, tomato seedling rhizosphere soils were collected as previously described [28]. After being gently removed from the soil, the loose soil was removed from the seedlings. Then, the remaining soil on the root surface was collected as rhizosphere soils. Next, the soils were screened through a 2 mm sieve and stored at −80 °C.

2.4. Soil DNA Extraction and Quantitative Real-Time PCR

DNA was extracted from 0.25 g of the −80 °C preserved soil with a Power Soil DNA Isolation Kit. Quantitative Real-time PCR (qPCR) was used to estimate the abundance of tomato rhizosphere bacteria, fungi, and FOL. For bacteria abundance, a primer set of 338F/518R [29] was used to amplify the partial bacterial 16S rRNA genes. For fungi abundance, a primer set of ITS1F/ITS4 [30] was used to amplify the ITS regions of the rRNA gene. FOL was identified by the Secreted in Xylem (SIX) gene’s copy number [31]. The PCR reaction mixture contained 9 uL of SYBR Premix Ex TaqTM, 0.5 uL of 10 uM forward and reverse primers (each), 8 uL of sterilized water, and 2.0 uL DNA. The q-PCR was performed with the following program: initial denaturation at 95 °C for 30 s, 30 amplification cycles at 95 °C for 5 s for denaturation, 59 °C for 45 s for 338F/518R(57 °C for 45 s for ITS1F/ITS4; 58 °C for 10 s for FOL), and final extension at 72 °C for 30 s. Plasmids containing the target genes of previously isolated Bacillus sp. B56 [21], Fusarium oxysporum MN533762 [32], and FOL (strain 01) [24] were diluted 10-fold to create standard curves for the total bacteria, fungi, and FOL, respectively. The initial copy number of the target gene was calculated by following the method we established earlier [33]. Sterile water was used as a negative control instead of DNA.

2.5. Illumina Miseq Sequencing Analysis

The bacterial community composition of the tomato rhizosphere was analyzed with the primer F515/R806 [33] and ITS1F/ITS2R [34], which target the V4–V5 regions of the bacterial and fungal 16S rRNA gene, respectively. Each soil DNA was amplified three times, and the production was mixed as one sample [35]. The samples were then sequenced on an Illumina MiSeq platform (2 × 300).
Operational taxonomic units (OTUs) were analyzed by following the method we used before [36]. Briefly, at a 97% similarity level, operational taxonomic units were derived with UPARSE. The taxonomic information of OTUs was assigned with SILVA. All sequences have been deposited in the NCBI Sequence Read Archive (Accession Number SRP300829).

2.6. Statistical Analysis

Homogeneity of variances and normality tests were checked with Levene’s test and Shapiro–Wilk’s test, respectively. qPCR data were log-transformed and tested with an ANOVA. Tukey’s HSD test was used to compute significant differences. For microbial communities, alpha diversities were computed as the number of OTUs and the Shannon index. Principal coordinate analysis (PCoA) based on the Bray-Curtis dissimilarity index was used for assaying beta diversities. The differences in bacterial and fungal community composition with the Bray-Curits distance were checked with an analysis of similarities (ANOSIM). ANOSIM, Shannon index, and PCoA analyses were calculated with the “vegan” package in “R”. The relationship between tomato-plant performance and main bacterial and fungal genera in the rhizosphere was tested using Spearman’s rank correlations with the “psych” package in “R”.

3. Results

3.1. Biochar Applied at 1% and 2% Promoted Tomato Growth and Inhibited Fusarium Wilt

All biochar treatments had no significant effect on tomato plant height (Figure 1A). However, 1% and 2% biochar amendment significantly increased plant biomass compared with the control, whilst at 3%, there was no significant difference from the non-amended value (Figure 1B) (p < 0.05).
Fusarium wilt disease incidence was lowest in the 1% and 2% treatments and significantly different from the control (p < 0.05). The disease index of 1% and 2% treatments was significantly lower than that of the control and 3% treatments. However, for both disease incidence and disease index, 1% did not differ with biochar applied at 2% (Figure 1C,D).

3.2. Tomato Rhizosphere Microbial Abundances Measured with qPCR

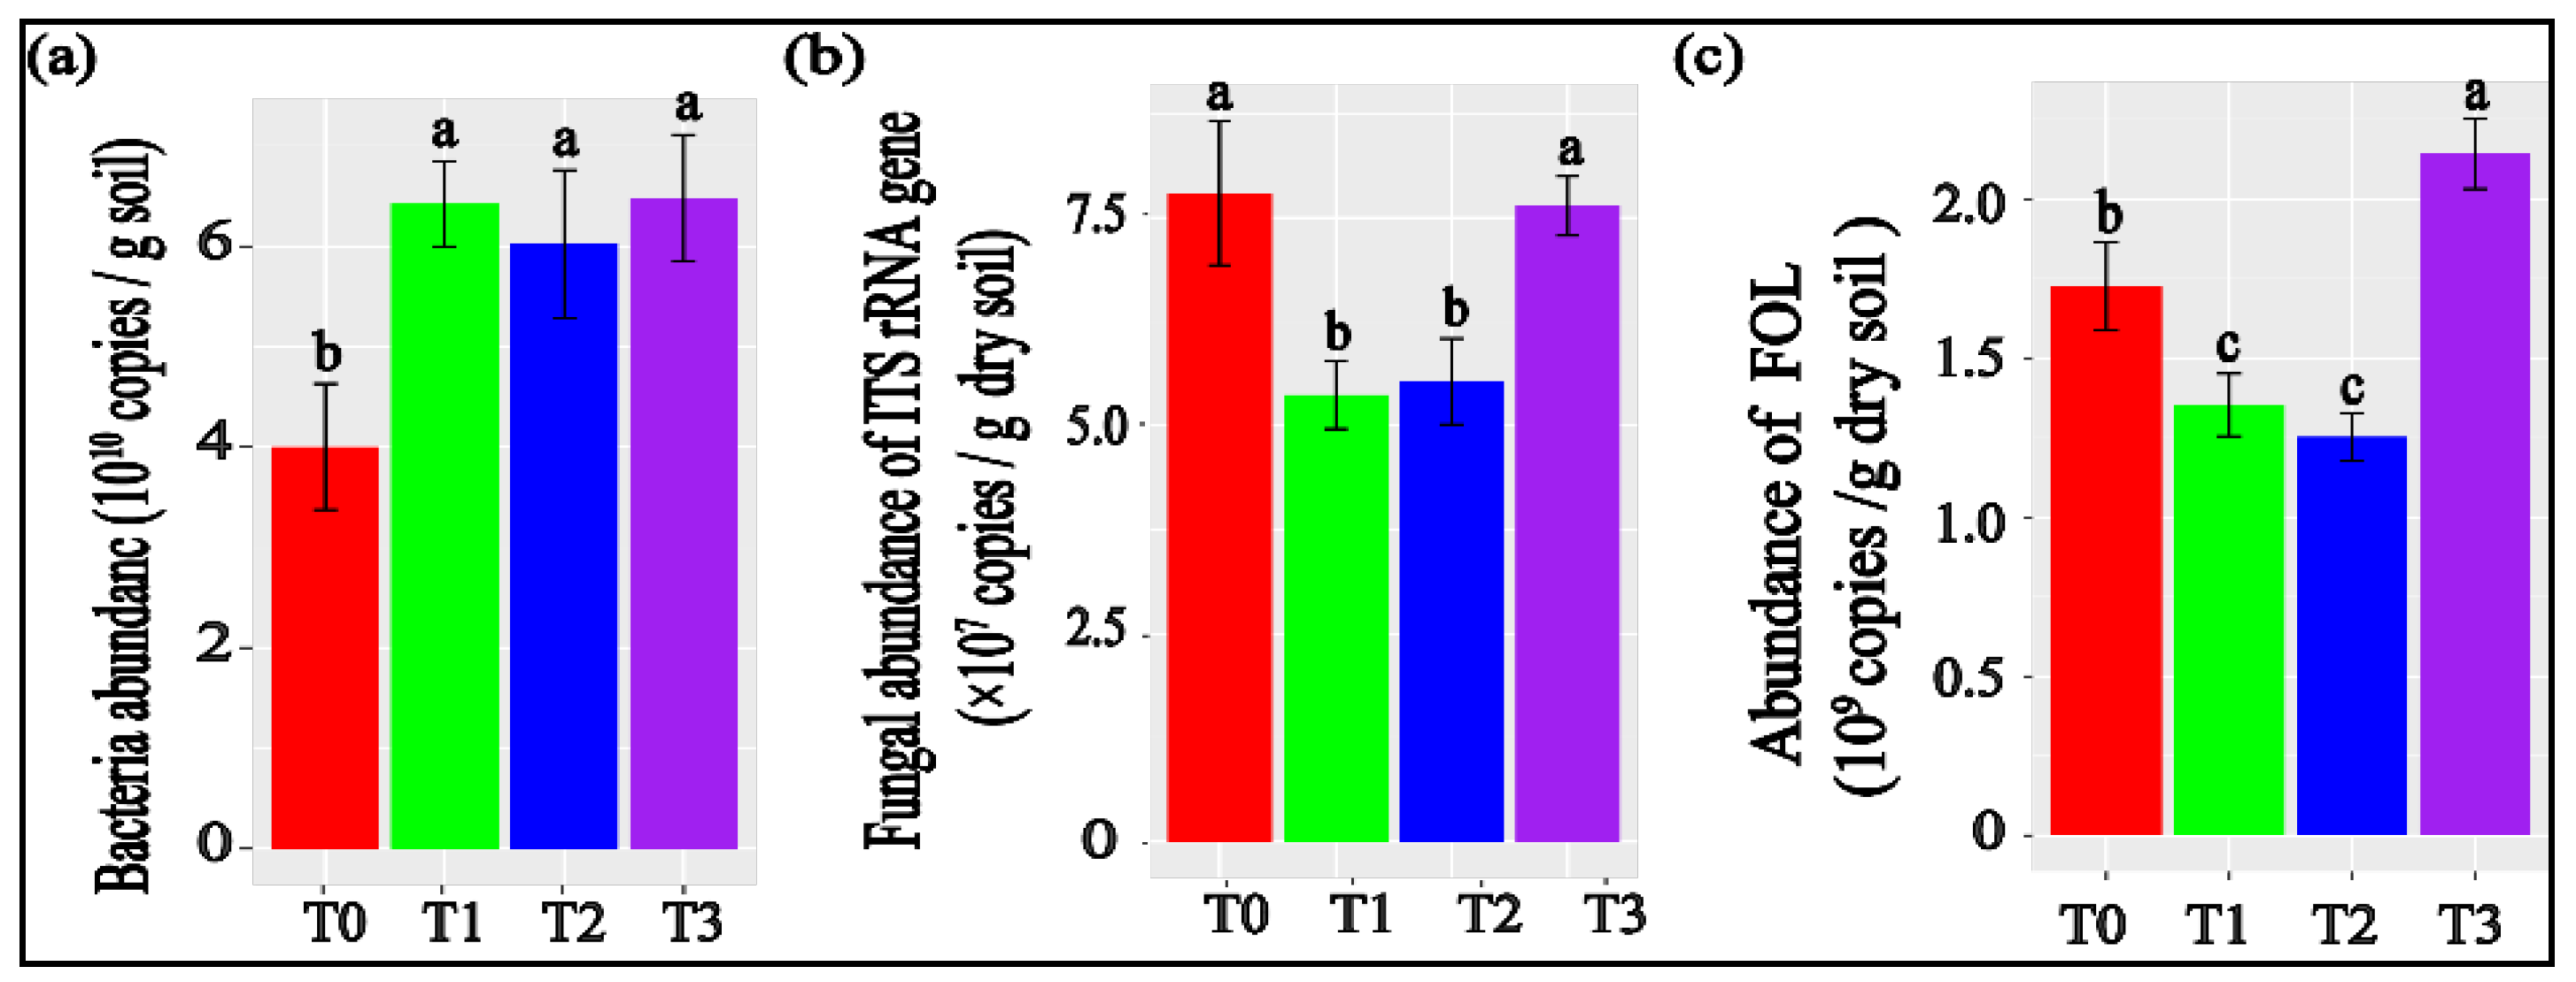
All biochar treatments significantly increased the tomato rhizosphere’s total bacteria abundance (p < 0.05) (Figure 2a); biochar applied at 1% and 2% decreased fungi and FOL abundance (p < 0.05) (Figure 2b,c); biochar applied at 3% increased FOL abundance. For fungal and FOL abundance, 1% did not differ from 2% (p < 0.05) (Figure 2c).

3.3. Tomato Rhizosphere Bacterial and Fungal Community ɑ and β Diversities

Biochar applied at 1% decreased the number of observed OTUs and the Shannon index of the bacterial community (p < 0.05). Furthermore, the Shannon index of the fungal community was decreased with biochar applied at 2% (p < 0.05) (Figure 3A).
A PCoA plot of bacterial and fungal communities shows that four treatments were separated, while samples from the same treatment were classified together (Figure 3B). The composition of tomato rhizosphere bacterial and fungal communities varied among different treatments. (bacterial community: ANOSIM, R = 0.62, p < 0.05; fungal communities: ANOSIM, R = 0.37, p = 0.013).

3.4. Bacterial and Fungal Community Composition in the Rhizosphere of Tomato Plants

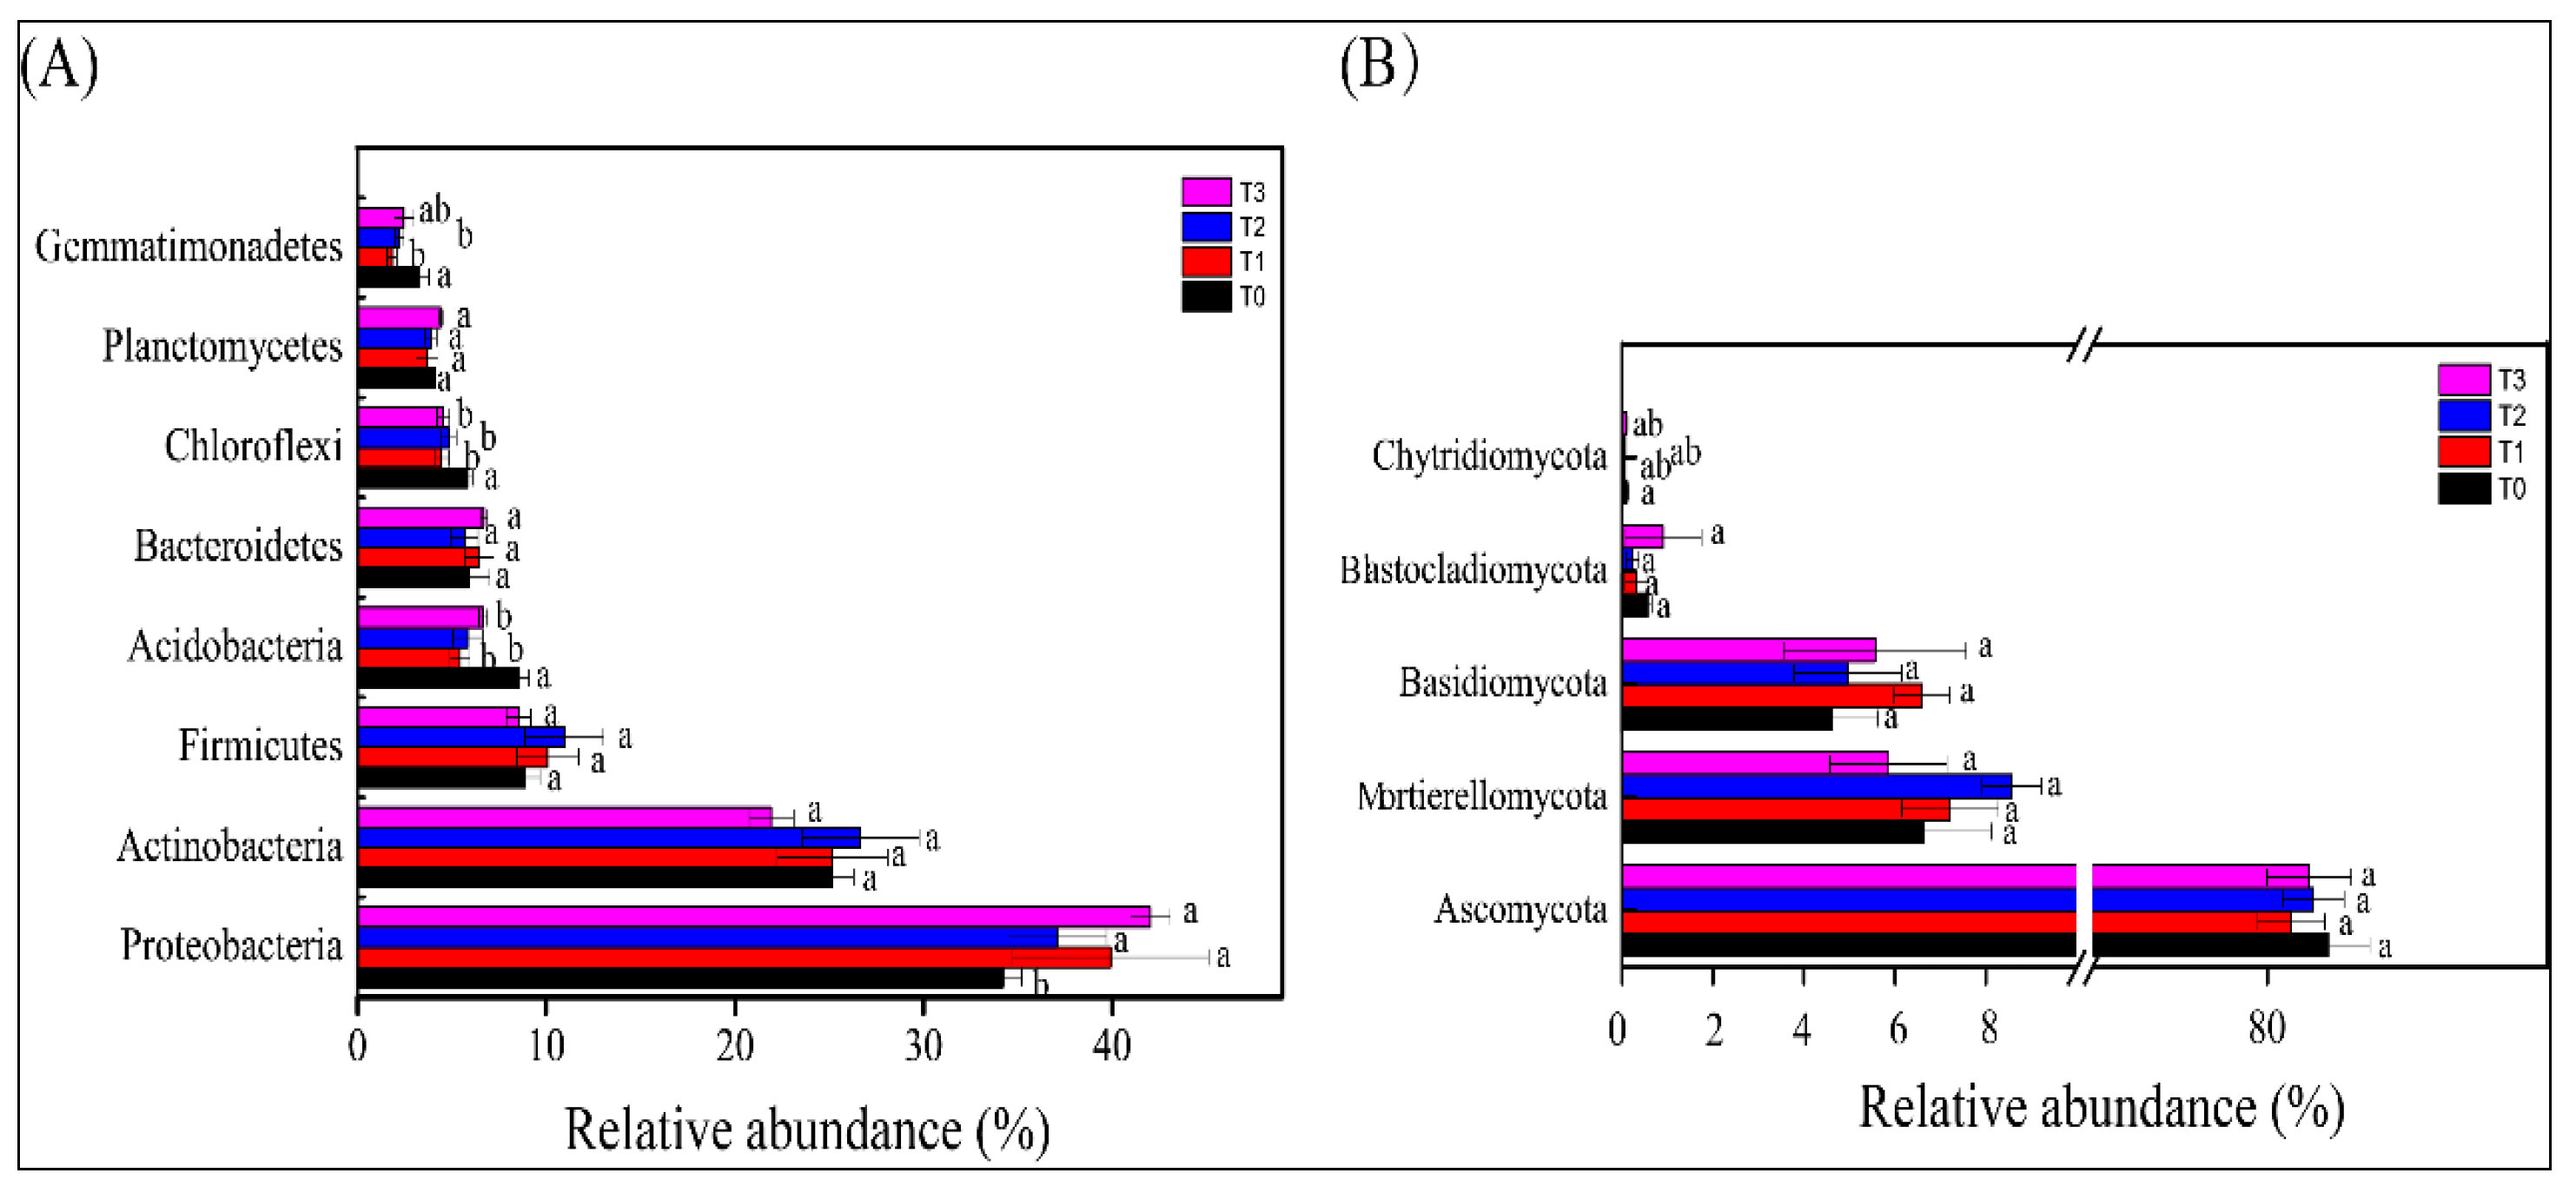
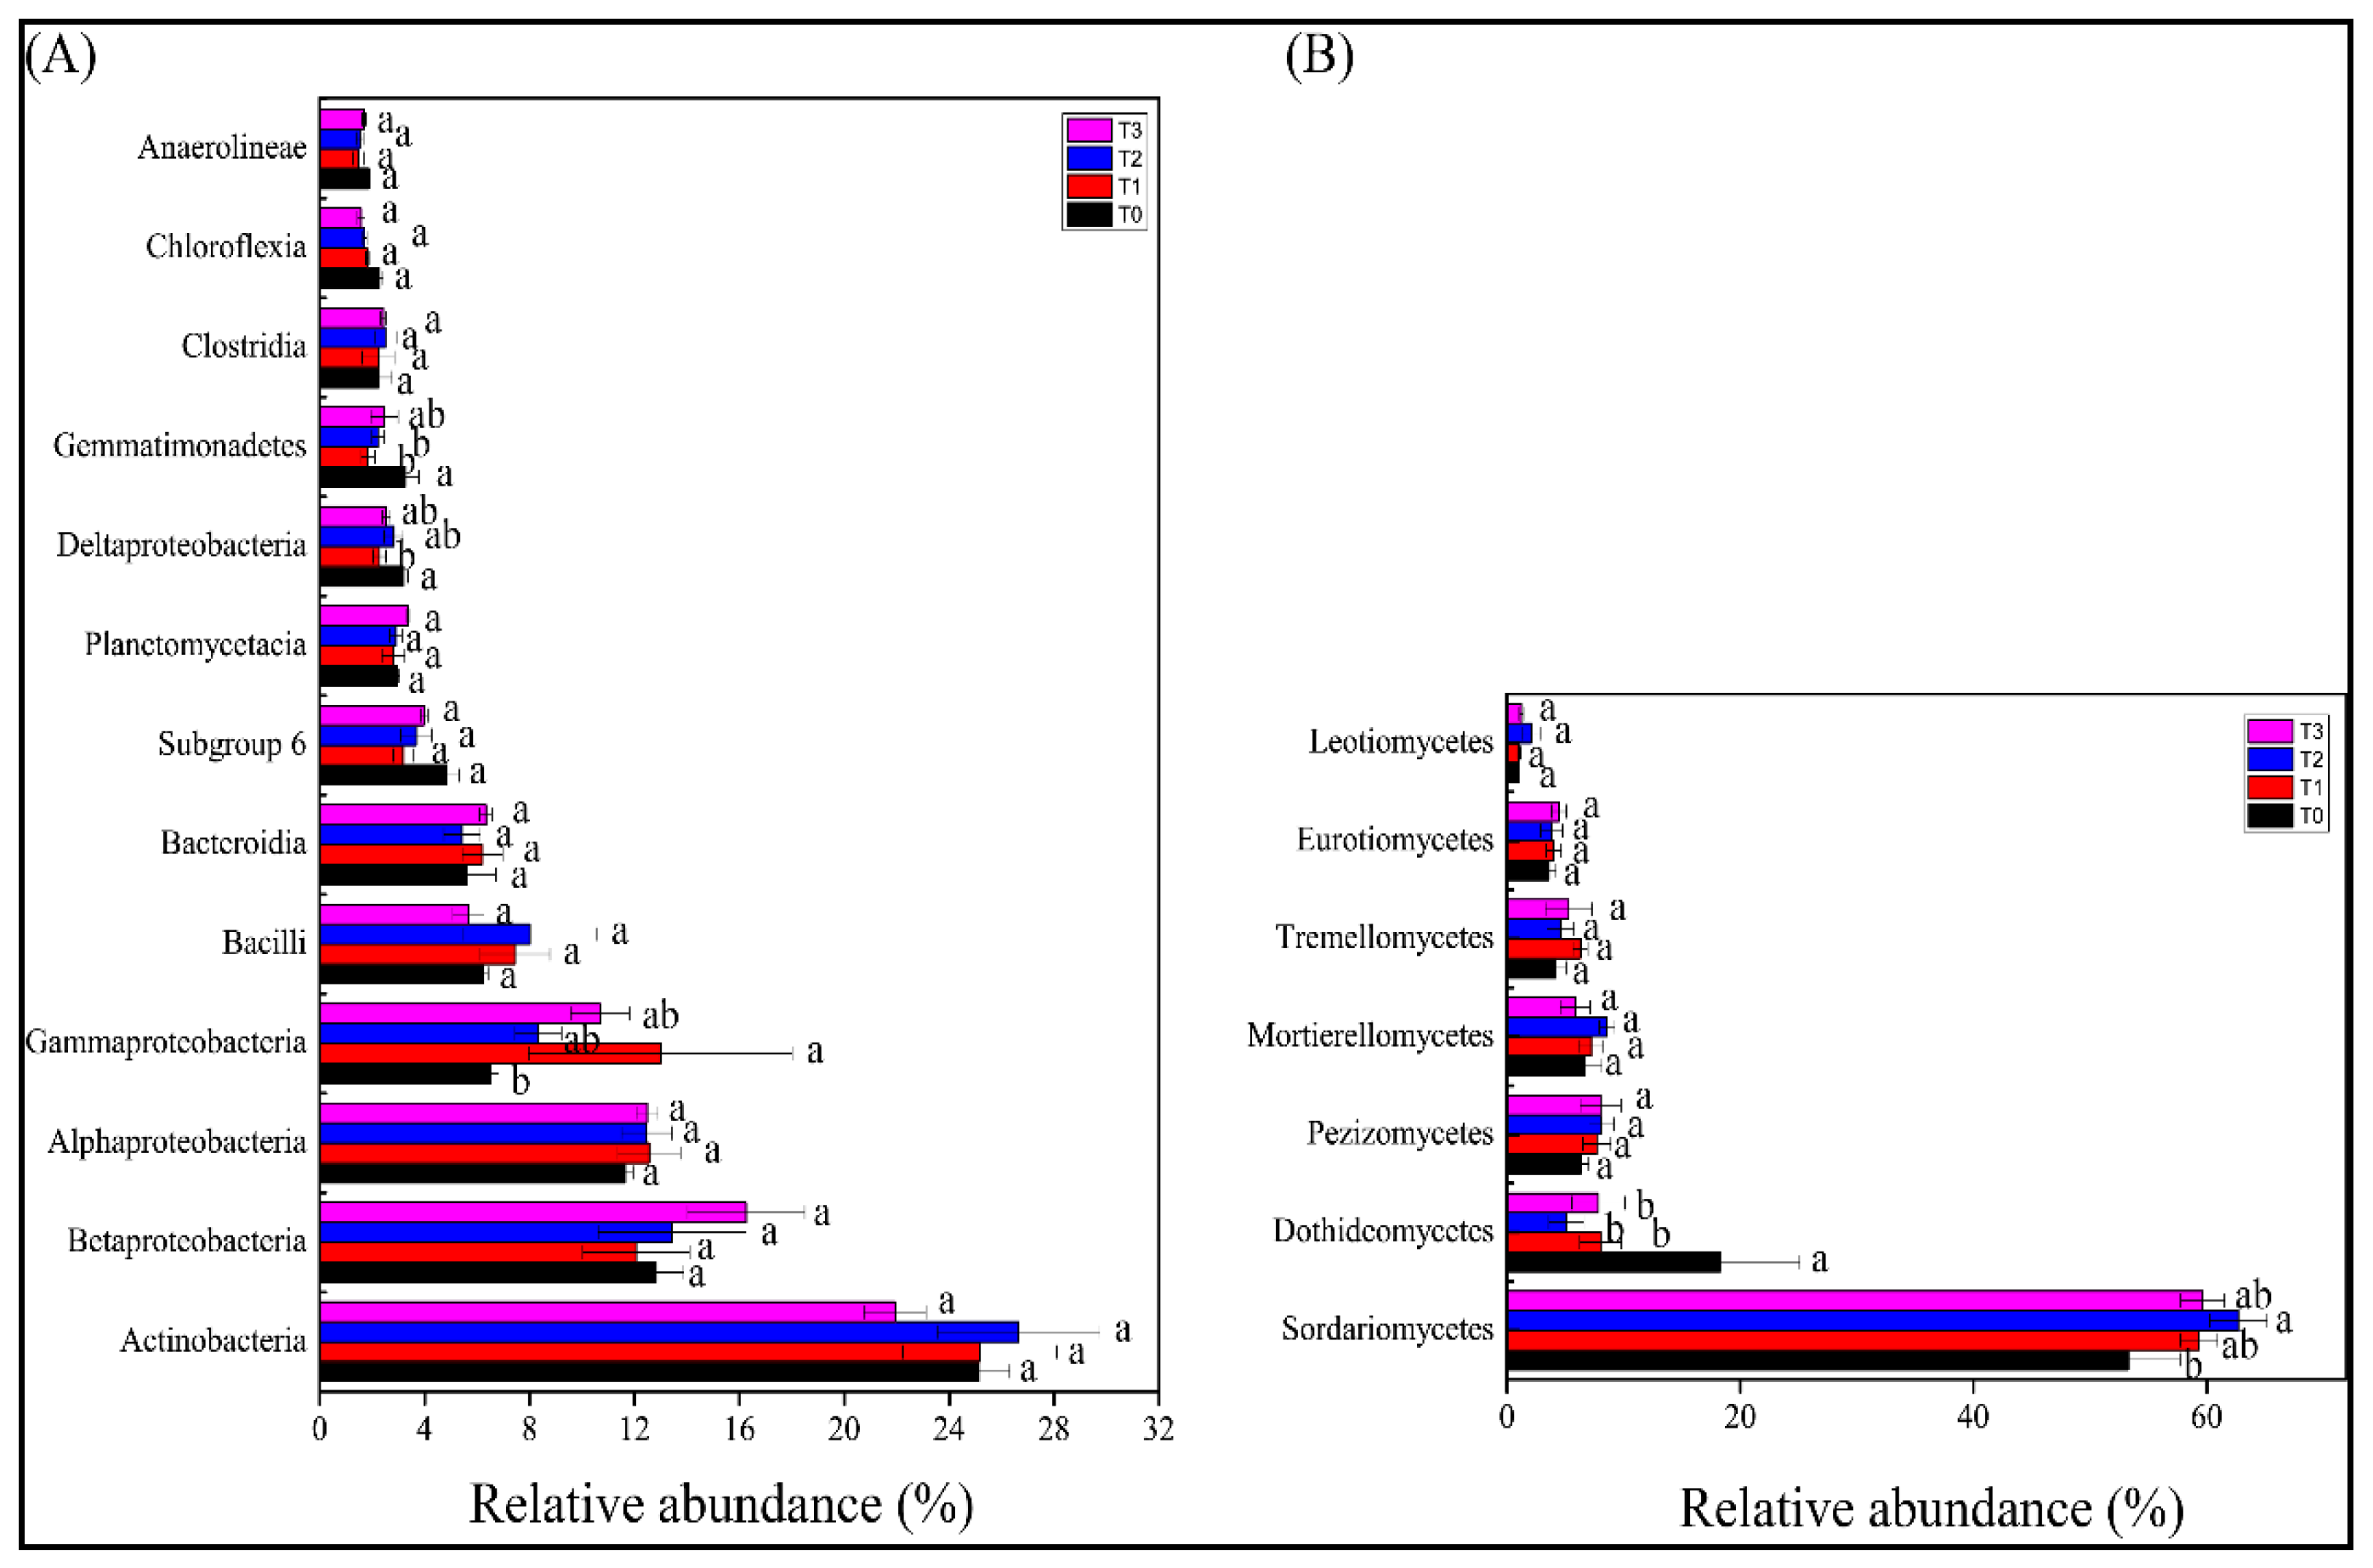
For the bacterial community, we found a total of 28 phyla, with 8 of these dominating across all of the samples (relative abundance > 5%): Proteobacteria, Actinobacteria, Firmicutes, Acidobacteria, Bacteroidetes, Chloroflexi, Planctomycetes, and Gemmatimonadetes as well as other 2% sequences that could not be classified into any known phylum. The relative abundance of Chloroflexi and Acidobacteria was decreased, and that of Proteobacteria was increased by all biochar treatments (p < 0.05). The relative abundance of the class Gemmatimonadetes was decreased by 1% and 2% biochar amendments (p < 0.05). Furthermore, the relative abundance of the class Gammaproteobacteria was increased, and that of the class Deltaproteobacteria was decreased by biochar applied at 1%. Biochar addition did not affect Planctomycetes and Firmicutes (p < 0.05) (Figure 4A and Figure 5A).
For the bacterial genera that were classified as dominant (average relative abundances >0.10%), 1%, 2%, and 3% increased the relative abundance of Pedobacter sp. and decreased Polycyclovorans and Pajaroellobacter spp. (p < 0.05) (Table 1). Furthermore, 1% increased the relative abundance of Pseudomonas, Microbacterium, Neorhizobium, and Adhaeribacter spp. and decreased Novosphingobium and Arenimonas spp. (p < 0.05) (Table 1). The relative abundance of Marmocricola and Opitutus spp. decreased, and Adhaeribacter sp. increased by 2% (p < 0.05) (Table 1). The relative abundance of Marmoricola sp decreased, and Macrobacteria, Altererythrobacter, Novosphingobium, Ammoniphilus, Arenimous, and Opitutus spp. increased by 3% (p < 0.05) (Table 1).
For the fungal community, at the phylum level, the relative abundance of fungi in tomato rhizosphere soil did not change under different treatments. Biochar applied at 2% increased the relative abundance of the fungal class Sordariomycetes. The relative abundance of the fungal class Dothideomycetes was decreased by all treatments (p < 0.05) (Figure 4B and Figure 5B). At the genus level, all biochar treatments decreased the relative abundance of Cladosporium and Arthrinium spp. (p < 0.05). In addition, biochar applied at 1% increased the relative abundance of Chaetomium sp. (Figure 6) but decreased Melanocarpus and Remersonia spp. Biochar applied at 2% increased Melanocarpus pp. Biochar applied at 3% increased Remersonia sp. (p < 0.05).

3.5. Correlations between Tomato Performance and Rhizosphere Microbial Genera

In our experiment, the relative abundance of Pedobacter, Adhaeribacter, and Chaetomium spp. were positively correlated and that of Melanocarpus and Arthrinium spp. were negatively correlated with the dry biomass of tomato seedlings (p < 0.05). The relative abundance of Polycyclovorans sp. was positively correlated and that of Microbacterium, Pseudomonas, and Neorhizobium spp. were negatively correlated with the Fusarium wilt disease severity of tomato plants (p < 0.05) (Table 2).

4. Discussion

Crop diseases induced by soil-borne pathogens, such as Fusarium wilt disease, are usually difficult to control and thus can severely reduce crop productivity [37]. In our pot experiment, tomato seedling growth was stimulated, while Fusarium wilt caused by FOL was suppressed. As a whole, biochar dose had a significant effect, especially for disease inhibition. The application of biochar at 1% was found to be the optimum level for suppressing Fusarium wilt. However, at 3% levels, biochar was found to be beneficial to disease development. This phenomenon is similar to the U-shaped dose-response patterns surveyed by Jaiswal [11]. A similar dose effect also appeared for tomato growth, with the optimal dose for plant growth response at a 2% level. Actually, U-shaped biochar dose responses have been surveyed in numerous biochar-cropping systems [9,10]. The optimum level for plant growth response and disease suppression is not always consistent [11,18,38]. In our experiment, 1% and 2% biochar amendments inhibited tomato Fusarium wilt and stimulated tomato growth. In addition, 1% did not differ from 2%. Considering economic benefits in agriculture, we believe that biochar applied at 1% is the optimal dose for disease reduction as well as for stimulating tomato growth. These results should help in future agricultural production and research. In the field, we calculate the total amount of applied biochar according to the mass ratios of the top 20 cm of the soil to make the concentration of biochar at 1% [39]. Then, we can evenly apply biochar to the soil surface and mix biochar with the soil through plowing.
Biochar amendment has been shown to modify the abundance and diversity of microbial communities in the rhizosphere [40]. In our study, the abundance of bacteria was increased, and that of fungi was decreased by biochar applied at 1%. Previous studies demonstrated that soil with neutral and slightly alkaline pH generally had a promoting effect on the growth of bacteria but had inhibitory effects on fungi [41]. The biochar was alkaline in our research, which may lead to a decrease in fungal abundance. Moreover, a 1% biochar amendment decreased the diversity of bacterial and fungal communities in the tomato rhizosphere (Figure 3A). This result is not consistent with those of other reports that show that the diversity of the bacterial community was increased by biochar in plant rhizosphere [39,42]. However, in these experiments, either no pathogen pressure was applied or the rhizosphere soils were collected before pathogen inoculation. Previous studies reported that biotic stresses could cause activation of plant immunity, which may act to reshape the microbiome, enriching microbes that likely benefit plant defense [43,44] whilst decreasing microbial diversity in the rhizosphere [45]. In addition, rhizosphere soil is regarded to be enriched in fast-growing microorganisms [46]. In our study, proteobacteria, which is regarded as fast-growing phyla [47], was proven to be positively correlated with the addition of biochar compared to the control; Basidiomycota, which is generally dominant in biochar remediation soils [46], is the dominant phylum in our research. In addition, the pH of the soil can directly affect the diversity of bacterial communities present in the soil. Additionally, it can indirectly affect the microbiome by altering the molecular structure of native soil organic matter [48]. These may potentially account for the decrease in bacterial and fungal diversity.
Here, different biochar doses alter the β diversities of both bacterial and fungal communities in the rhizosphere of tomato. Moreover, for the treatment of biochar at 1%, the disease suppression was related to the increased relative abundance of specific bacteria taxa, especially Pseudomonas sp., in the rhizosphere. It has previously been reported that Pseudomonas sp. inhibits plant pathogens directly and suppresses plant disease through inducing systemic resistance in plants indirectly [49]. In addition, 1% biochar amendment stimulated certain bacteria taxa (e.g., Opitutus/Microbacterium and Sphingopyxis spp.), which have been proven to promote plant growth [49,50,51,52] and widely distributed in natural environments, including the plant rhizosphere. Microbacterium and Sphingopyxis spp. were recognized to rescue plants from stresses, and their abundance in the rhizosphere can be stimulated by various biotic stresses [52]. These microbe taxa can inhibit protection via many mechanisms, such as induction of plant systemic resistance [51] and direct inhibition of the plant pathogens [52], which consequently decrease the abundance of FOL in the rhizosphere soil of tomato amended with biochar applied at 1% and ameliorate plant stresses. Furthermore, a Spearman analysis suggested that Fusarium wilt disease severity of tomato seedlings was negatively correlated with the abundance of Microbacterium, Pseudomonas, and Neorhizobium spp., which were stimulated by biochar applied at 1%. Polycyclovorans sp., which was inhibited by all biochar treatment, was positively correlated with the disease incidence of Fusarium wilt. Simultaneously, the dry biomass of the plant was positively correlated with Chaetomium, Pedobacter, Adhaeribacter, and Melanocarpus spp., which were increased by 1% and 2% biochar treatment. Arthrinium sp. was decreased by all biochar treatments and is negatively correlated with the dry biomass of tomato seedlings. Therefore, we speculate that the higher positive effect of 1% and 2% biochar on Jerusalem artichoke than other doses on tomato seedling growth and Fusarium wilt suppression was linked to their various effects on the diversity and composition of rhizosphere microbial communities, especially the higher promoting influence on some bacteria that possess plant-growth stimulating and plant pathogen-suppressing potentials.

5. Conclusions

Overall, our experiment has shown that biochar applied at 1% and 2% promoted tomato seedling growth and inhibited Fusarium wilt disease. Biochar amendment also altered the microbial community abundances, diversities, and compositions in the rhizosphere of tomatoes. The addition of biochar gives rise to an increase in the relative abundance of some bacterial genera that are rich in strains associated with the ability to promote plant development and prevent plant pathogens in the tomato rhizosphere, which may contribute to the observed decreased abundance of FOL. However, the role of rhizosphere microbial communities in suppressing tomato diseases is not fully understood. The effects of microbial community structure changes caused by biochar on tomato growth and resistance are currently underway. Our research suggested that it is feasible to control plant soil-borne diseases by adding a 1% dose of biochar made from Jerusalem artichoke. It should be highlighted that our findings were preliminary (based on a single experiment) and that additional experimental replications, particularly those in the field, are required before we can draw firm conclusions.

Author Contributions

Conceptualization, methodology, software, validation, formal analysis, investigation, data curation, writing—original draft preparation, X.J. and X.Z.; resources, visualization, F.W. and K.P.; supervision, project administration, W.X.; funding acquisition, F.W. and K.P. All authors have read and agreed to the published version of the manuscript.

Funding

This research was supported by the Open Project of Key Laboratory of Biology and Genetic Improvement of Horticultural Crops (Northeast Region), Ministry of Agriculture and Rural Affairs.

Data Availability Statement

Data presented in this study are available on request from the corresponding author.

Conflicts of Interest

The authors declare that there are no conflicts of interest.

References

  1. Tilman, D.; Balzer, C.; Hill, J.; Befort, B.L. Global food demand and the sustainable intensification of agriculture. Proc. Natl. Acad. Sci. USA 2011, 108, 20260–20264. [Google Scholar] [CrossRef] [PubMed]
  2. Koike, S.; Subbarao, K.; Davis, R.M.; Turini, T. Vegetable Diseases Caused by Soilborne Pathogens; UCANR Publications: Oakland, CA, USA, 2003. [Google Scholar]
  3. McGovern, R.J. Management of tomato diseases caused by Fusarium oxysporum. Crop Prot. 2015, 73, 78–92. [Google Scholar] [CrossRef]
  4. Panth, M.; Hassler, S.C.; Baysal-Gurel, F. Methods for management of soilborne diseases in crop production. Agriculture 2020, 10, 16. [Google Scholar] [CrossRef] [Green Version]
  5. Silva, L.G.; de Andrade, C.A.; Bettiol, W. Biochar amendment increase siol microbial biomass and plant growth and supresses Fusarium wilt in tomato. Trop. Plant Pathol. 2020, 45, 73–83. [Google Scholar] [CrossRef]
  6. Akhter, A.; Hage-Ahmed, K.; Soja, G.; Steinkellner, S. Potential of Fusarium wilt-inducing chlamydospores, in vitro behaviour in root exudates and physiology of tomato in biochar and compost amended soil. Plant Soil 2016, 406, 425–440. [Google Scholar] [CrossRef] [Green Version]
  7. Jaiswal, A.K.; Frenkel, O.; Elad, Y.; Lew, B.; Graber, E.R. Non-monotonic influence of biochar dose on bean seedling growth and susceptibility to Rhizoctonia solani: The “Shifted R max-Effect”. Plant Soil 2015, 395, 125–140. [Google Scholar] [CrossRef]
  8. Lehmann, J.; Joseph, S. Biochar for Environmental Management: Science, Technology and Implementation; Routledge: London, UK, 2015. [Google Scholar]
  9. Rajkovich, S.; Enders, A.; Hanley, K.; Hyland, C.; Zimmerman, A.R.; Lehmann, J. Corn growth and nitrogen nutrition after additions of biochars with varying properties to a temperate soil. Biol. Fertil. Soils 2012, 48, 271–284. [Google Scholar] [CrossRef]
  10. Spokas, K.A.; Cantrell, K.B.; Novak, J.M.; Archer, D.W.; Ippolito, J.A.; Collins, H.P.; Lentz, R.D. Biochar: A synthesis of its agronomic impact beyond carbon sequestration. J. Environ. Qual. 2012, 41, 973–989. [Google Scholar] [CrossRef] [Green Version]
  11. Jaiswal, A.K.; Elad, Y.; Graber, E.R.; Frenkel, O. Rhizoctonia solani suppression and plant growth promotion in cucumber as affected by biochar pyrolysis temperature, feedstock and concentration. Soil Biol. Biochem. 2014, 69, 110–118. [Google Scholar] [CrossRef]
  12. Copley, T.R.; Aliferis, K.A.; Jabaji, S. Maple bark biochar affects Rhizoctonia solani metabolism and increases damping-off severity. Phytopathology 2015, 105, 1334–1346. [Google Scholar] [CrossRef] [Green Version]
  13. Huang, W.K.; Ji, H.L.; Gheysen, G.; Debode, J.; Kyndt, T. Biochar-amended potting medium reduces the susceptibility of rice to root-knot nematode infections. BMC Plant Biol. 2015, 15, 267. [Google Scholar] [CrossRef] [PubMed] [Green Version]
  14. Frenkel, O.; Jaiswal, A.K.; Elad, Y.; Lew, B.; Kammann, C.; Graber, E.R. The effect of biochar on plant diseases: What should we learn while designing biochar substrates? J. Environ. Qual. 2017, 25, 105–113. [Google Scholar] [CrossRef] [Green Version]
  15. Viger, M.; Hancock, R.D.; Miglietta, F.; Taylor, G. More plant growth but less plant defence? First global gene expression data for plants grown in soil amended with biochar. GCB Bioenergy 2015, 7, 658–672. [Google Scholar] [CrossRef]
  16. Gu, Y.; Hou, Y.; Huang, D.; Hao, Z.; Wang, X.; Wei, Z.; Xu, Y. Application of biochar reduces Ralstonia solanacearum infection via effects on pathogen chemotaxis, swarming motility, and root exudate adsorption. Plant Soil 2017, 415, 269–281. [Google Scholar] [CrossRef]
  17. Jaiswal, A.K.; Frenkel, O.; Tsechansky, L.; Elad, Y.; Graber, E.R. Immobilization and deactivation of pathogenic enzymes and toxic metabolites by biochar: A possible mechanism involved in soilborne disease suppression. Soil Biol. Biochem. 2018, 121, 59–66. [Google Scholar] [CrossRef]
  18. Elad, Y.; David, D.R.; Harel, Y.M.; Borenshtein, M.; Kalifa, H.B.; Silber, A.; Graber, E.R. Induction of systemic resistance in plants by biochar, a soil-applied carbon sequestering agent. Phytopathology 2010, 100, 913–921. [Google Scholar] [CrossRef] [Green Version]
  19. Van Wees, S.C.; Van der Ent, S.; Pieterse, C.M. Plant immune responses triggered by beneficial microbes. Curr. Opin. Plant Biol. 2008, 11, 443–448. [Google Scholar] [CrossRef] [Green Version]
  20. Trivedi, P.; Leach, J.E.; Tringe, S.G.; Sa, T.; Singh, B.K. Plant-microbiome interactions: From community assembly to plant health. Nat. Rev. Microbiol. 2021, 19, 72. [Google Scholar] [CrossRef]
  21. Zhou, X.; Zhang, J.; Rahman, M.K.U.; Gao, D.; Wei, Z.; Wu, F.; Dini-Andreote, F. Interspecific plant interaction via root exudates structures the disease suppressiveness of rhizosphere microbiomes. Mol. Plant 2023, 16, 849–864. [Google Scholar] [CrossRef]
  22. Jaiswal, A.K.; Elad, Y.; Paudel, I.; Graber, E.R.; Cytryn, E.; Frenkel, O. Linking the belowground microbial composition, diversity and activity to soilborne disease suppression and growth promotion of tomato amended with biochar. Sci. Rep. 2017, 7, 44382. [Google Scholar] [CrossRef] [Green Version]
  23. Jin, X.; u Rahman, M.K.; Ma, C.; Zheng, X.; Wu, F.; Zhou, X. Silicon modification improves biochar’s ability to mitigate cadmium toxicity in tomato by enhancing root colonization of plant-beneficial bacteria. Ecotoxicol. Environ. Saf. 2023, 249, 114407. [Google Scholar] [CrossRef] [PubMed]
  24. Jin, X.; Bai, Y.; Rahman, M.K.U.; Kang, X.J.; Pan, K.; Wu, F.Z.; Pommier, T.; Zhou, X.G.; Wei, Z. Biochar stimulates tomato roots to recruit a bacterial assemblage contributing to disease resistance against Fusarium wilt. iMeta 2022, 2, 37. [Google Scholar] [CrossRef]
  25. Gayoso, C.; Pomar, F.; Novo-Uzal, E.; Merino, F.; de Ilárduya, Ó.M. The Ve-mediated resistance response of the tomato to Verticillium dahliae involves H2O2, peroxidase and lignins and drives PALgene expression. BMC Plant Biol. 2010, 10, 232. [Google Scholar] [CrossRef] [Green Version]
  26. Xu, X.L.; Ko, W.H. A quantitative confined inoculation method for studies of pathogenicity of fungi on plants. Bot. Bull. Acad. Sin. 1998, 39, 187–190. [Google Scholar]
  27. Akhter, A.; Hage-Ahmed, K.; Soja, G.; Steinkellner, S. Compost and biochar alter mycorrhization, tomato root exudation, and development of Fusarium oxysporum f. sp. lycoperdici. Front. Plant Sci. 2015, 6, 529. [Google Scholar] [CrossRef] [PubMed] [Green Version]
  28. Zhou, X.; Shen, Y.; Fu, X.; Wu, F. Application of sodium silicate enhances cucumber resistance to Fusarium wilt and alters soil microbial communities. Front. Plant Sci. 2018, 9, 624. [Google Scholar] [CrossRef] [Green Version]
  29. Muyzer, G.; De Waal, E.C.; Uitterlinden, A.G. Profiling of complex microbial populations by denaturing gradient gel electrophoresis analysis of polymerase chain reaction-amplified genes coding for 16S rRNA. Appl. Environ. Microbiol. 1993, 59, 695–700. [Google Scholar] [CrossRef] [Green Version]
  30. Gardes, M.; Bruns, T.D. ITS primers with enhanced specificity for basidiomycetes-application to the identification of mycorrhizae and rusts. Mol. Ecol. 1993, 2, 113–118. [Google Scholar] [CrossRef] [PubMed]
  31. Lievens, B.; Houterman, P.M.; Rep, M. Effector gene screening allows unambiguous identification of Fusarium oxysporum f. sp. lycopersici races and discrimination from other formae speciales. FEMS Microbiol. Lett. 2009, 300, 201–215. [Google Scholar] [CrossRef] [PubMed] [Green Version]
  32. Jin, X.; Wang, Z.L.; Wu, F.Z.; Li, X.G.; Zhou, X.G. Litter Mixing Alters Microbial Decomposer Community to Accelerate Tomato Root Litter Decomposition. Microbiol. Spectr. 2022, 10, e00186-22. [Google Scholar] [CrossRef]
  33. Zhou, X.; Zhang, J.; Pan, D.; Ge, X.; Jin, X.; Chen, S.; Wu, F. p-Coumaric can alter the composition of cucumber rhizosphere microbial communities and induce negative plant-microbial interactions. Biol. Fertil. Soils 2018, 54, 363–372. [Google Scholar] [CrossRef]
  34. Zhou, X.; Liu, J.; Wu, F. Soil microbial communities in cucumber monoculture and rotation systems and their feedback effects on cucumber seedling growth. Plant Soil 2017, 415, 507–520. [Google Scholar] [CrossRef]
  35. Schöler, A.; Jacquiod, S.; Vestergaard, G.; Schulz, S.; Schloter, M. Analysis of soil microbial communities based on amplicon sequencing of marker genes. Biol. Fertil. Soils 2017, 53, 485–489. [Google Scholar] [CrossRef]
  36. Jin, X.; Wang, J.; Li, D.L.; Wu, F.Z.; Zhou, X.G. Rotations with Indian mustard and wild rocket suppressed cucumber Fusarium wilt disease and changed rhizosphere bacterial communities. Microorganisms 2019, 7, 57. [Google Scholar] [CrossRef] [PubMed] [Green Version]
  37. Bonanomi, G.; Antignani, V.; Pane, C.; Scala, F. Suppression of soilborne fungal diseases with organic amendments. J. Plant Pathol. 2007, 89, 311–324. [Google Scholar]
  38. Harel, Y.M.; Elad, Y.; Rav-David, D.; Borenstein, M.; Shulchani, R.; Lew, B.; Graber, E.R. Biochar mediates systemic response of strawberry to foliar fungal pathogens. Plant Soil 2012, 357, 245–257. [Google Scholar] [CrossRef]
  39. Yao, Q.; Liu, J.; Yu, Z.; Li, Y.; Jin, J.; Liu, X.; Wang, G. Changes of bacterial community compositions after three years of biochar application in a black soil of northeast China. Appl. Soil Ecol. 2017, 113, 11–21. [Google Scholar] [CrossRef]
  40. Gong, X.; Huang, D.; Liu, Y.; Zeng, G.; Chen, S.; Wang, R.; Xu, P.; Cheng, M.; Zhang, C.; Xue, W. Biochar facilitated the phytoremediation of cadmium contaminated sediments: Metal behavior, plant toxicity, and microbial activity. Sci. Total Environ. 2019, 666, 1126–1133. [Google Scholar] [CrossRef]
  41. Chen, J.; Liu, X.; Zheng, J.; Zhang, B.; Lu, H.; Chi, Z.; Pan, G.; Li, L.; Zheng, J.; Zhang, X.; et al. Biochar soil amendment increased bacterial but decreased fungal gene abundance with shifts in community structure in a slightly acid rice paddy from Southwest China. Appl. Soil Ecol. 2013, 71, 33–44. [Google Scholar] [CrossRef]
  42. Kim, J.S.; Sparovek, G.; Longo, R.M.; De Melo, W.J. Bacterial diversity of terra preta and pristine forest soil from the Western Amazon. Soil Biol. Biochem. 2007, 39, 684–690. [Google Scholar] [CrossRef]
  43. Lee, B.; Lee, S.; Ryu, C.M. Foliar aphid feeding recruits rhizosphere bacteria and primes plant immunity against pathogenic and non-pathogenic bacteria in pepper. Ann. Bot. 2012, 110, 281–290. [Google Scholar] [CrossRef] [PubMed]
  44. Zhou, X.; Gao, H.; Zhang, X.; Rahman, M.K.U.; Mazzoleni, S.; Du, M.; Wu, F. Plant extracellular self-DNA inhibits growth and induces immunity via the jasmonate signaling pathway. Plant Physiol. 2023, 192, kiad195. [Google Scholar] [CrossRef] [PubMed]
  45. Liu, H.; Brettell, L.E.; Qiu, Z.; Singh, B.K. Microbiome-mediated stress resistance in plants. Trends Plant Sci. 2020, 25, 734–743. [Google Scholar] [CrossRef]
  46. Peiffer, J.A.; Spor, A.; Koren, O.; Jin, Z.; Tringe, S.G.; Dangl, J.L.; Ley, R.E. Diversity and heritability of the maize rhizosphere microbiome under field conditions. Proc. Natl. Acad. Sci. USA 2013, 110, 6548–6553. [Google Scholar] [CrossRef]
  47. Goldfarb, K.C.; Karaoz, U.; Hanson, C.A.; Santee, C.A.; Bradford, M.A.; Treseder, K.K.; Brodie, E.L. Differential growth responses of soil bacterial taxa to carbon substrates of varying chemical recalcitrance. Front. Microbiol. 2011, 2, 94. [Google Scholar] [CrossRef] [Green Version]
  48. Sheng, Y.; Zhu, L. Biochar alters microbial community and carbon sequestration potential across different soil pH. Sci. Total Environ. 2018, 622, 1391–1399. [Google Scholar] [CrossRef]
  49. Pieterse, C.M.; Zamioudis, C.; Berendsen, R.L.; Weller, D.M.; Van Wees, S.C.; Bakker, P.A. Induced systemic resistance by beneficial microbes. Annu. Rev. Phytopathol. 2014, 52, 347–375. [Google Scholar] [CrossRef] [PubMed] [Green Version]
  50. Lau, J.A.; Lennon, J.T. Rapid responses of soil microorganisms improve plant fitness in novel environments. Proc. Natl. Acad. Sci. USA 2012, 109, 14058–14062. [Google Scholar] [CrossRef]
  51. Chen, Y.; Wang, J.; Yang, N.; Wen, Z.; Sun, X.; Chai, Y.; Ma, Z. Wheat microbiome bacteria can reduce virulence of a plant pathogenic fungus by altering histone acetylation. Nat. Commun. 2018, 9, 3429. [Google Scholar] [CrossRef] [Green Version]
  52. Dudenhöffer, J.H.; Scheu, S.; Jousset, A. Systemic enrichment of antifungal traits in the rhizosphere microbiome after pathogen attack. J. Ecol. 2016, 104, 1566–1575. [Google Scholar] [CrossRef]
Figure 1. Effect of biochar at increasing rates (0, 1, 2, and 3%) on (A) plant height, (B) total biomass, (C) disease incidence, and (D) disease index in tomatoes with FOL inoculation. Values with different letters are significantly different (Welch’s t-test, p < 0.05). T0, T1, T2, and T3 represent 0%, 1%, 2%, and 3% biochar amendment, respectively.
Agronomy 13 01811 g001
Figure 2. Abundances of bacteria (a), fungi (b), and FOL (c) in tomato rhizosphere. T0, T1, T2, and T3 represent 0%, 1%, 2%, and 3% biochar amendment, respectively. Different letters indicate statistically significant differences among treatments (Tukey’s HSD test, p < 0.05).
Agronomy 13 01811 g002
Figure 3. The number of OTUs, Shannon index, and the PCoA analyses based on the Bray-Curtis dissimilarity of the bacterial (A) and fungal (B) communities in the tomato rhizosphere. Different letters indicate significant differences (Tukey’s HSD test, p < 0.05). T0, T1, T2, and T3 represent the 0%, 1%, 2%, and 3% biochar amendment, respectively.
Agronomy 13 01811 g003
Figure 4. Relative abundances of major bacterial (A) (the relative abundance > 5%) and fungal (B) (the relative abundance > 1%) phyla in the tomato rhizosphere. Different letters indicate significant differences (Tukey’s HSD test, p < 0.05). T0, T1, T2, and T3 represent the 0%, 1%, 2%, and 3% biochar amendment, respectively.
Agronomy 13 01811 g004
Figure 5. Relative abundances of major bacterial (A) and fungal (B) classes in the tomato rhizosphere. Different letters indicate significant differences (Tukey’s HSD test, p < 0.05). T0, T1, T2, and T3 represent the 0%, 1%, 2%, and 3% biochar amendment, respectively.
Agronomy 13 01811 g005
Figure 6. Relative abundances (%) of differentiated classified fungal genera in tomato rhizosphere soils. Different letters indicate significant differences (Tukey’s HSD test, p < 0.05). T0, T1, T2, and T3 represent the 0%, 1%, 2%, and 3% biochar amendment, respectively.
Agronomy 13 01811 g006
Table 1. Relative abundances (%) of main classified bacterial genera in tomato rhizosphere soils treated with different doses of biochar.
T0T1T2T3
Marmocricola sp.0.91 ± 0.08 a0.77 ± 0.04 ab0.65 ± 0.01 b0.64 ± 0.05 b
Polycyclovorans sp.0.10 ± 0.01 a0.01 ± 0.01 c0.03 ± 0.01 bc0.05 ± 0.01 b
Pajaroellobacter sp.0.11 ± 0.02 a0.06 ± 0.00 b0.09 ± 0.01 ab0.07 ± 0.01 b
Pseudomonas sp.0.65 ± 0.03 c7.08 ± 1.01 a3.11 ± 0.81 bc2.08 ± 0.78 bc
Microbacterium sp.0.45 ± 0.04 c0.88 ± 0.04 a0.67 ± 0.01 ab0.57 ± 0.04 b
Neorhizobium sp.0.16 ± 0.01 b0.43 ± 0.08 a0.25 ± 0.01 b0.20 ± 0.040 b
Amaricoccus sp.0.35 ± 0.02 ab0.29 ± 0.01 b0.40 ± 0.02 a0.31 ± 0.02 b
Adhaeribacter sp.0.14 ± 0.02 b0.21 ± 0.02 a0.24 ± 0.02 a0.19 ± 0.01 ab
Altereythrobacter sp.0.20 ± 0.02 bc0.16 ± 0.02 c0.24 ± 0.01 ab0.27 ± 0.02 a
Novosphingobium sp.0.14 ± 0.00 b0.09 ± 0.02 c0.11 ± 0.02 bc0.19 ± 0.01 a
Ammoniphilus sp.0.05 ± 0.01 b0.08 ± 0.02 b0.16 ± 0.03 b0.27 ± 0.05 a
Arenimonas sp.0.27 ± 0.03 b0.17 ± 0.03 c0.31 ± 0.01 b0.46 ± 0.01 a
Pedobacter sp.0.10 ± 0.01 c0.33 ± 0.06 b0.48 ± 0.04 b0.29 ± 0.01 a
Opitutus sp.0.12 ± 0.01 b0.21 ± 0.00 a0.19 ± 0.01 a0.11 ± 0.01 b
T0, T1, T2, and T3 represent biochar applied at 0% 1%, 2%, and 3% (w/w), respectively. Different letters in the same row indicate significant differences (Tukey’s HSD test, p < 0.05).
Table 2. Relationship between tomato plants’ performance and main classified bacterial and fungal genera in the rhizosphere.
Plant HeightDry
Biomass
Disease IncidenceDisease Index
Cladosporium sp.−0.40−0.800.400.40
Chaetomium sp.−0.801.00 *−0.80−0.80
Remersonia sp.−0.400.20−0.40−0.40
Melanocarpus sp.0.801.00 *−0.80−0.80
Arthrinium sp.−0.80−1.00 *0.800.80
Pedobacter sp.0.801.00 *−0.80−0.80
Polycyclovorans sp.−0.60−0.801.00 *1.00 *
Pajaroellobacter sp.0.00−0.400.800.80
Microbacterium sp.0.000.40−0.80 *−0.80
Neorhizobium sp.0.600.80−1.00 *−1.00 *
Adhaeribacter sp.0.801.00 *−0.80−0.80
Novosphingobium sp.−0.80−0.600.800.80
Arenimonas sp.−0.400.000.4000.40
Opitutus sp.0.400.00−0.40−0.40
Altererythrobacter sp.−0.110.210.320.32
Pseudomonas sp.0.000.40−0.80−0.88 *
Data shown are the Spearman correlations’ ρ. * indicates a significant correlation at p < 0.05.
Disclaimer/Publisher’s Note: The statements, opinions and data contained in all publications are solely those of the individual author(s) and contributor(s) and not of MDPI and/or the editor(s). MDPI and/or the editor(s) disclaim responsibility for any injury to people or property resulting from any ideas, methods, instructions or products referred to in the content.