Article

Development of Expressed Sequence Tag–Simple Sequence Repeat Markers Related to the Salt-Stress Response of Kenaf (Hibiscus cannabinus)

1
Zhejiang Xiaoshan Institute of Cotton & Bast Fiber Crops, Zhejiang Institute of Landscape Plants and Flowers, Zhejiang Academy of Agricultural Sciences, Hangzhou 311251, China
2
Institute of Resource Plants, Yunnan University, Kunming 650500, China
3
Hangzhou Xiaoshan District Agricultural (Forestry) Technology Promotion, Hangzhou 311203, China
4
Hangzhou Agricultural Technology Extension Center, Hangzhou 310020, China
5
Zhangjiajie Research Institute of Agricultural Science and Technology, Zhangjiajie 427000, China
*
Author to whom correspondence should be addressed.
Agronomy 2023, 13(7), 1946; https://doi.org/10.3390/agronomy13071946
Submission received: 19 June 2023 / Revised: 6 July 2023 / Accepted: 18 July 2023 / Published: 23 July 2023
(This article belongs to the Special Issue Genomics and Genetic Improvement of Bast Fiber Plants)

Abstract

:
Kenaf is one of the most important natural cannabis plants. Molecular marker-assisted breeding is vital for accelerating the breeding process of kenaf. However, the number of kenaf markers is insufficient for molecular marker-assisted breeding. Using transcriptome sequencing data for salt-stressed kenaf plants, the number and distribution of simple sequence repeats (SSRs) and single nucleotide variations (SNVs) in the expressed sequences were determined. The objectives of this study were to elucidate the sequence variations in kenaf genes expressed in response to salt stress and to identify stable and dependable molecular markers. Primers were designed for SSR loci and then EST-SSR molecular markers were generated. The subsequent analyses revealed that 30.50% of the unigenes contained SSR motifs, most of which were single nucleotides followed by trinucleotides and dinucleotides. The unigenes containing SSRs were mostly associated with kenaf salt tolerance. Additionally, 10,483 SNVs were detected in contig sequences. Of the 3995 differentially expressed genes encoding interacting proteins, 1297 contained SSRs. Most of these genes were associated with metabolic pathways (e.g., 03000 transcription factors, B09132 signal transduction, and 04122 sulfur relay system). We designed 20 pairs of EST-SSR primers to genotype 30 kenaf varieties (lines), of which 9 primer pairs were ideal for genotyping (e.g., 1 highly polymorphic marker and 2 moderately polymorphic markers). The primer pairs designed for the EST-SSR markers in the kenaf genome may be useful SSR molecular markers for future research on kenaf. The verified polymorphic markers may be applicable to the molecular marker-assisted breeding of salt-tolerant kenaf varieties.

1. Introduction

Approximately 20% of the irrigated agricultural land worldwide is affected by soil salinization, which has become the most urgent agricultural issue [1]. The deterioration of the natural environment, global warming, and poor irrigation methods have exacerbated soil salinization. The arable land area will likely decrease by 50% by the middle of the 21st century [2]. Thus, how to develop and utilize saline soil has become an urgent problem for agricultural production and environmental ecology [3].
Kenaf (Hibiscus cannabinus L.) is an economically important fiber and ornamental crop [4]. Due to its high salt tolerance and biological yield, it may be an ideal plant for saline soil [5,6,7,8]. The biological yield of kenaf is approximately 3 to 4 times greater than that of forest trees, while its carbon dioxide assimilation capacity is approximately 4 to 5 times greater than that of forest trees. The quality of kenaf pulp is similar to that of the pulp from broadleaf forest trees. Accordingly, kenaf pulp is considered to be a new raw material for the production of paper that can replace wood pulp, especially in developed countries [9]. Kenaf is also an important raw material for the traditional textile industry. In addition to being used to produce hemp rope, sacks, geo textiles, carpet cloth, wall coverings, canvas, and curtain cloth [10,11], kenaf-fiber raw materials have recently been widely used to develop and produce automobile linings, paper film, light plates, sewage purification materials, soil conditioners, plastic fillers, activated carbon, and environmentally friendly adsorption materials because it is a natural fiber with desirable characteristics (e.g., antibacterial, breathable, moisturizing, dries quickly, and degradable) [9]. Kenaf has been described as a “potential dominant crop in the 21st century” and a “futuristic crop” [9].
DNA molecular marker technology has several important applications, including analyses of genetic diversity, genetic structures, species evolution, and genetic mechanisms as well as DNA fingerprinting, assessments of seed purity, and molecular marker-assisted selection-based breeding of agriculturally important germplasm resources [12,13,14]. The development of kenaf DNA molecular marker technology was initiated relatively recently. Hence, a large number of methods must be used to generate markers useful for the selection of ideal kenaf accessions. The main molecular markers currently used for kenaf research include amplified fragment length polymorphisms (AFLPs), randomly amplified polymorphic DNA (RAPD), resistant gene analogs (RGAs), simple sequence repeats (SSRs), inter-simple sequence repeats (ISSRs), insertions/deletions (InDels), and chloroplast markers [5,10,15,16,17,18,19,20,21,22]. These molecular markers have primarily been applied to examine genetic diversity and population structures as well as the DNA fingerprinting of kenaf germplasm materials, but there is an insufficient number of markers.
Compared with other molecular markers, SSR markers are more commonly used to study kenaf genetic diversity. The recent decrease in sequencing costs has promoted the development of kenaf SSR molecular markers, which have been used to investigate genetic diversity and genetic differentiation [23]. Previous research confirmed that SSR markers may be used as part of a quick, simple, and inexpensive method to assess genetic diversity [5]. Moreover, the number of markers in kenaf has considerably increased [24,25,26,27]. Additionally, expressed sequence tag (EST)–SSR markers, which are highly reproducible, co-dominant, polymorphic, and conserved, can be used to analyze genetic diversity [28,29]. However, because of the particularity of transcriptome sequencing and the temporospatial specificity of gene expressions, the expressed sequences in different transcriptomes may vary. Therefore, sequencing transcriptomes and developing EST-SSR molecular markers are effective strategies for analyzing different physiological activities in the same crop.
In this study, EST-SSR markers were developed on the basis of the transcriptome of salt-stressed kenaf, which further enriched the number of molecular markers of kenaf. In addition, the interactions among a group of proteins encoded by the identified differentially expressed genes (DEGs) were analyzed. Moreover, a few primers were selected and verified using kenaf germplasm materials. The polymorphism of the novel EST-SSR molecular markers and the utility of these markers to analyze the genetic diversity and population structure of germplasm resources were assessed.

2. Materials and Methods

2.1. Plant Materials

Kenaf cultivar H368, provided by Professor Defang Li (Institute of Bast Fiber Crops, Chinese Academy of Agricultural Sciences), was grown under the following conditions: day/night cycle of 16 h/8 h at 28 °C/25 °C, respectively; light intensity of 700 μmol m−2 s−1; and relative humidity close to 60%. The plants were grown in pots (15 cm height; 18 cm diameter) containing the same weight of a soil mixture comprising red soil, humus, and vermiculite at a ratio of 2:1:1, v/v/v. Additionally, 250 mL 1/4 Hoagland nutrient solution was added to each pot every other day. When the plant height reached 55 cm, the kenaf seedlings entered a rapid development stage. During this period, the plant height increased by 2.1–5.0 cm per day and the kenaf seedlings were extremely sensitive to salinity stress. For the salt treatment, the 1/4 Hoagland nutrient solution was supplemented with 1 mol/L NaCl, as previously described [7]. For the two treatments (control and salt), 3 replicates were prepared, with 10 pots (3 seedlings each) in each replicate for a total of 180 seedlings. Kenaf samples were collected 72 h after initiating the salt treatment and then frozen in liquid nitrogen before being stored at −80 °C.
A total of 30 kenaf germplasm materials obtained from different regions worldwide were used to screen for and verify EST-SSR markers (Table 1).

2.2. RNA Extraction, Library Preparation, and Sequencing

Total RNA was extracted from the frozen kenaf stems using TRIzol reagent (Invitrogen, Waltham, CA, USA). The quality of the RNA was evaluated by gel electrophoresis using a 2100 Bioanalyzer (Agilent, Santa Clara, CA, USA). Duplicated cDNA libraries for the control (CO1 and CO2) and NaCl-treated (NA1 and NA2) kenaf samples were constructed. Briefly, poly-A mRNA was separated from the total RNA using magnetic beads and then fragmented. Double-stranded cDNA was synthesized using a SuperScript Double-Stranded cDNA Synthesis kit (Invitrogen) and a random hexamer (N6) primer (Illumina, San Diego, CA, USA). The constructed libraries were sequenced using the Illumina HiSeq 2000 platform. The raw sequencing data for the transcriptomes were submitted to the NCBI database (SRR9613936 to SRR9613939).

2.3. Transcriptome-Based SSR and SNP Variation Analysis

Unigene sequences obtained after the transcriptome sequencing analysis were screened for SSRs using MISA software Version 1.0. The type and frequency distribution of the SSRs were determined. The repeated units of the SSR loci were selected. When a single nucleotide was used as the repeating unit, there were more than 10 mononucleotide repeats, more than 6 dinucleotide repeats, and more than 5 trinucleotide, tetranucleotide, pentanucleotide, and hexanucleotide repeats, all of which were used to detect SSRs [30]. After identifying the SSRs, SSR primers were designed in batches using Primer3 and unigenes for the PCR amplification of fragments comprising 100–400 bp.
By comparing SAM and Picard Tools, the results were sorted by chromosome coordinates and repeated reads were discarded. Finally, the mutation detection software GATK3 Version 3.4 was used to label SNPs and InDels. The original results were screened to obtain information regarding high-quality SNP mutations.

2.4. GO and KEGG Enrichment Analyses

TBTools software Version 1.120 [4] was used to perform GO and KEGG enrichment analyses of the unigenes containing mutation sites (SSRs and SNPs) and the differentially expressed genes (DEGs) encoding proteins in the protein–protein interaction (PPI) network as well as to analyze the commonalities between the unigenes containing mutations and the DEGs in the PPI network as well as the main biological processes, molecular functions, cellular components, and metabolic pathway characteristics involved.

2.5. Analysis of the Interaction Network for the Proteins Encoded by Differentially Expressed Genes

The interactions and functions of the proteins encoded by DEGs were analyzed using String (https://string-db.org/) (accessed on 4 December 2017) and the PPI network was visualized and edited using Cytoscape software Version 3.6.1.

2.6. Genomic DNA Extraction

Genomic DNA was extracted from 200 mg tender kenaf leaves using a DNAsecure Plant DNA Kit (Tiangen). A 2 μL aliquot of the extracted DNA was analyzed using a NanoDrop ND1000 spectrophotometer to determine the concentration and purity (A260/A280 ratio). Additionally, DNA integrity was assessed by 1% agarose gel electrophoresis (4 μL volume). The DNA samples that produced a clear and non-tailed main band were used for the subsequent SSR genotyping.

2.7. SSR Genotyping

Differences in SSRs in expressed genes are likely to be associated with altered functions of the encoded proteins. Thus, specific EST-SSR sites in the DEGs encoding the proteins in the PPI network were selected for the synthesis of SSR primers. The 5′-end of the primers was ligated to FAM fluorescent groups. The DNA polymerase was Phi29 DNA Polymerase (TransGen). The PCR amplification was completed using a 20 μL reaction volume consisting of 2 μL DNA template, 2 μL buffer, 0.3 μL TransTaq, 1.6 μL dNTP, 12.1 μL ddH2O, and 1 μL forward and reverse primers (2 μmol/μL). The PCR amplification program was set as follows: pre-denaturation at 94 °C for 4 min, denaturation at 94 °C for 30 s → annealing at 56 °C for 90 s → extension at 72 °C for 1 min, these three stages are circulated for 35 times, extended at 72 °C for 5 min; and stored at 4 °C [31]. After the PCR amplification, a 1 μL aliquot of the PCR product was analyzed using an ABI3730xl capillary electrophoresis instrument. GeneMapper 4.0 software was used to obtain genotyping information.

2.8. Phylogenetic Analysis

The Nei and Takezaki (1983) genetic distance based on the allele frequency was calculated using PowerMarker 3.25 software [32]. A phylogenetic tree was constructed according to the neighbor-joining method using MEGA 11.0 software.

2.9. Genetic Diversity Analysis

The SSR genotyping data were converted into different formats depending on the requirements of various programs. The genotyping data were imported into POP GENE 1.32 and the diploid co-dominant data format was selected to analyze the allele number (Na), effective allele number (Ne), observed heterozygosity (Ho), expected heterozygosity (He), and Shannon’s diversity index (I) of individual SSR loci in the whole sample [33]. An F statistical analysis was carried out using GenAIEx 6.5 software [34]. The polymorphism information content (PIC) of each locus was calculated using PowerMarker 3.25. The Jaccard genetic similarity coefficient between two samples was computed using NTSYSPC 2.10 and the matrix of the genetic similarity coefficient was generated [35].

3. Results

3.1. Analysis of Genomic SSR and SNP Characteristics

The transcriptome sequencing reads were assembled into 175,216 unigenes. The SSRs in the unigene sequences were analyzed using MISA [35,36]. As shown in Table 2, 73,728 SSRs were detected in the unigenes. They were distributed in 53,444 sequences, accounting for 30.50% of the unigenes. On average, each sequence contained 1.38 SSRs. More specifically, 14,775 sequences contained more than one SSR. Additionally, there were 5717 SSRs present in a compound formation. The unigenes containing SSRs included 3685 DEGs responsive to salinity stress; among them, 42% were upregulated genes and 58% were downregulated genes.
A total of 10,483 single nucleotide mutations were found in all unigenes, including 6828 transitions and 3655 transversions. There were 4818 SNPs in the coding region. Specifically, 2107 (43.73%), 780 (16.19%), and 1931 (40.08%) SNPs were detected in the first, second, and third codon positions, respectively (Table 3). These SNP-containing genes included 436 DEGs associated with the kenaf response to salt stress.
Among the identified SSRs, the most abundant were mononucleotide motifs, followed by trinucleotide motifs and dinucleotide motifs (Figure 1). Primers were designed for 55,219 SSR loci in 44,332 unigenes (3 primer pairs per SSR locus). The marker library may be useful for the identification of polymorphic EST-SSR markers in future studies (Table S1).
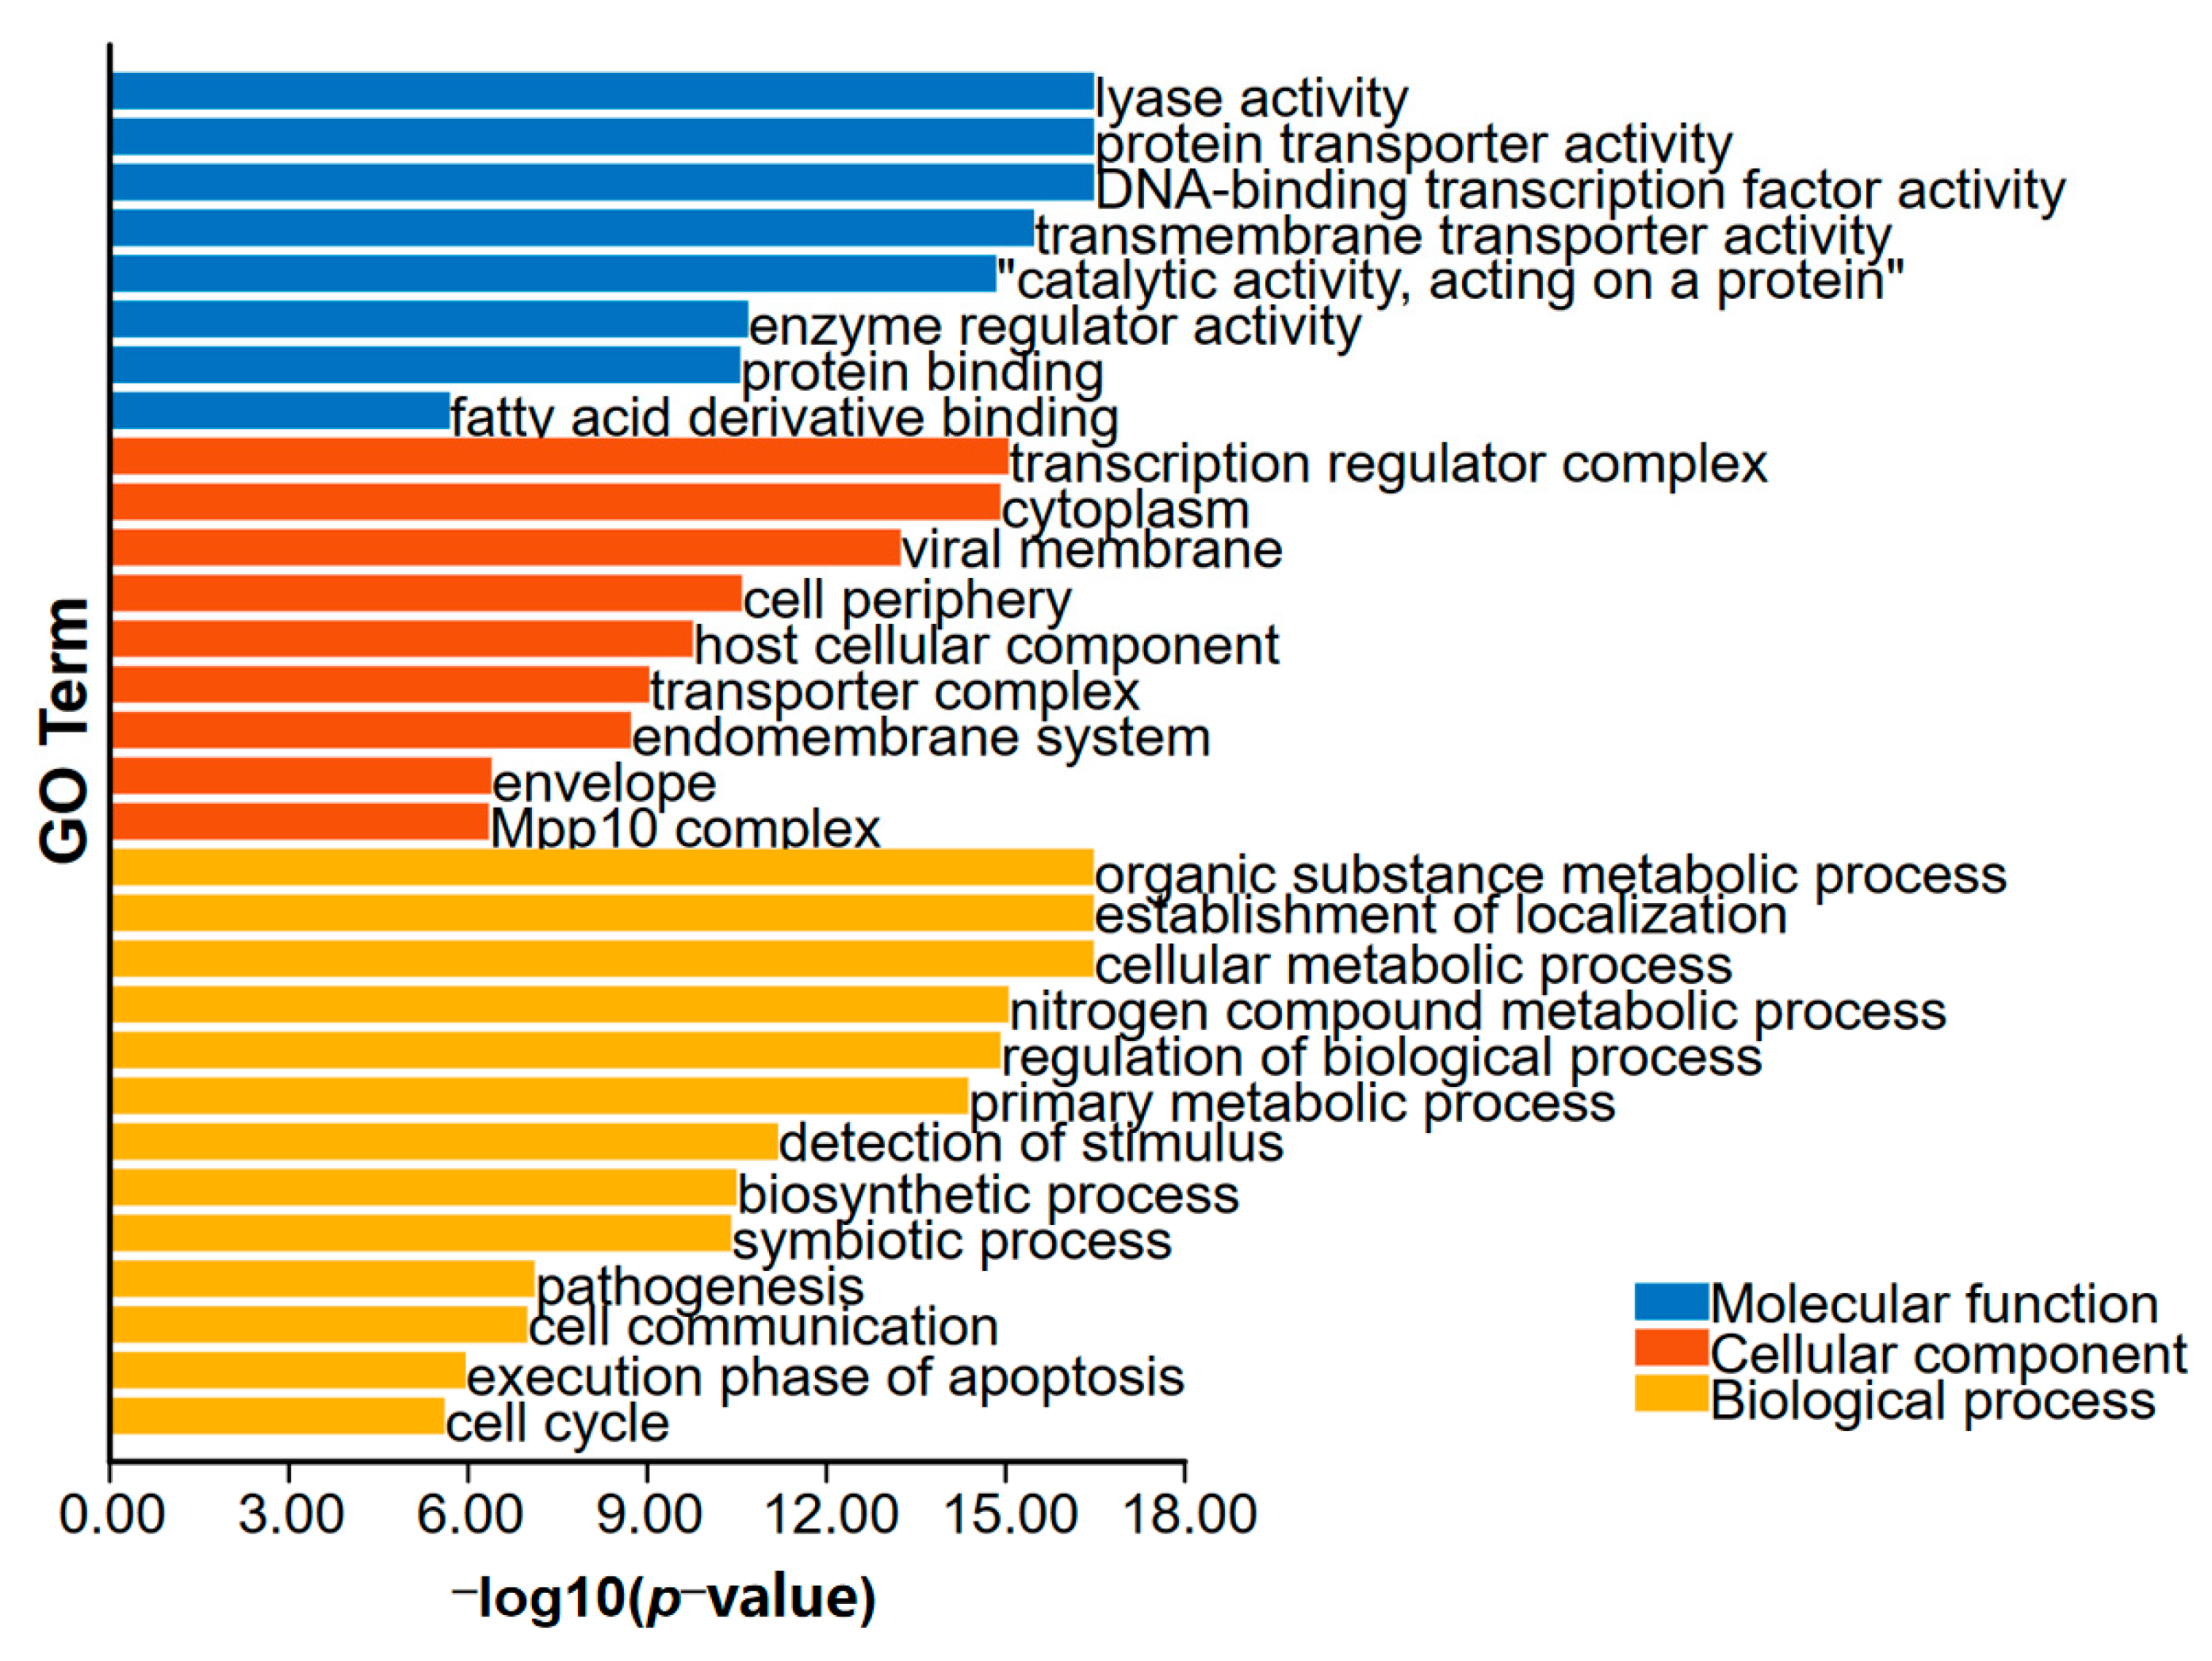
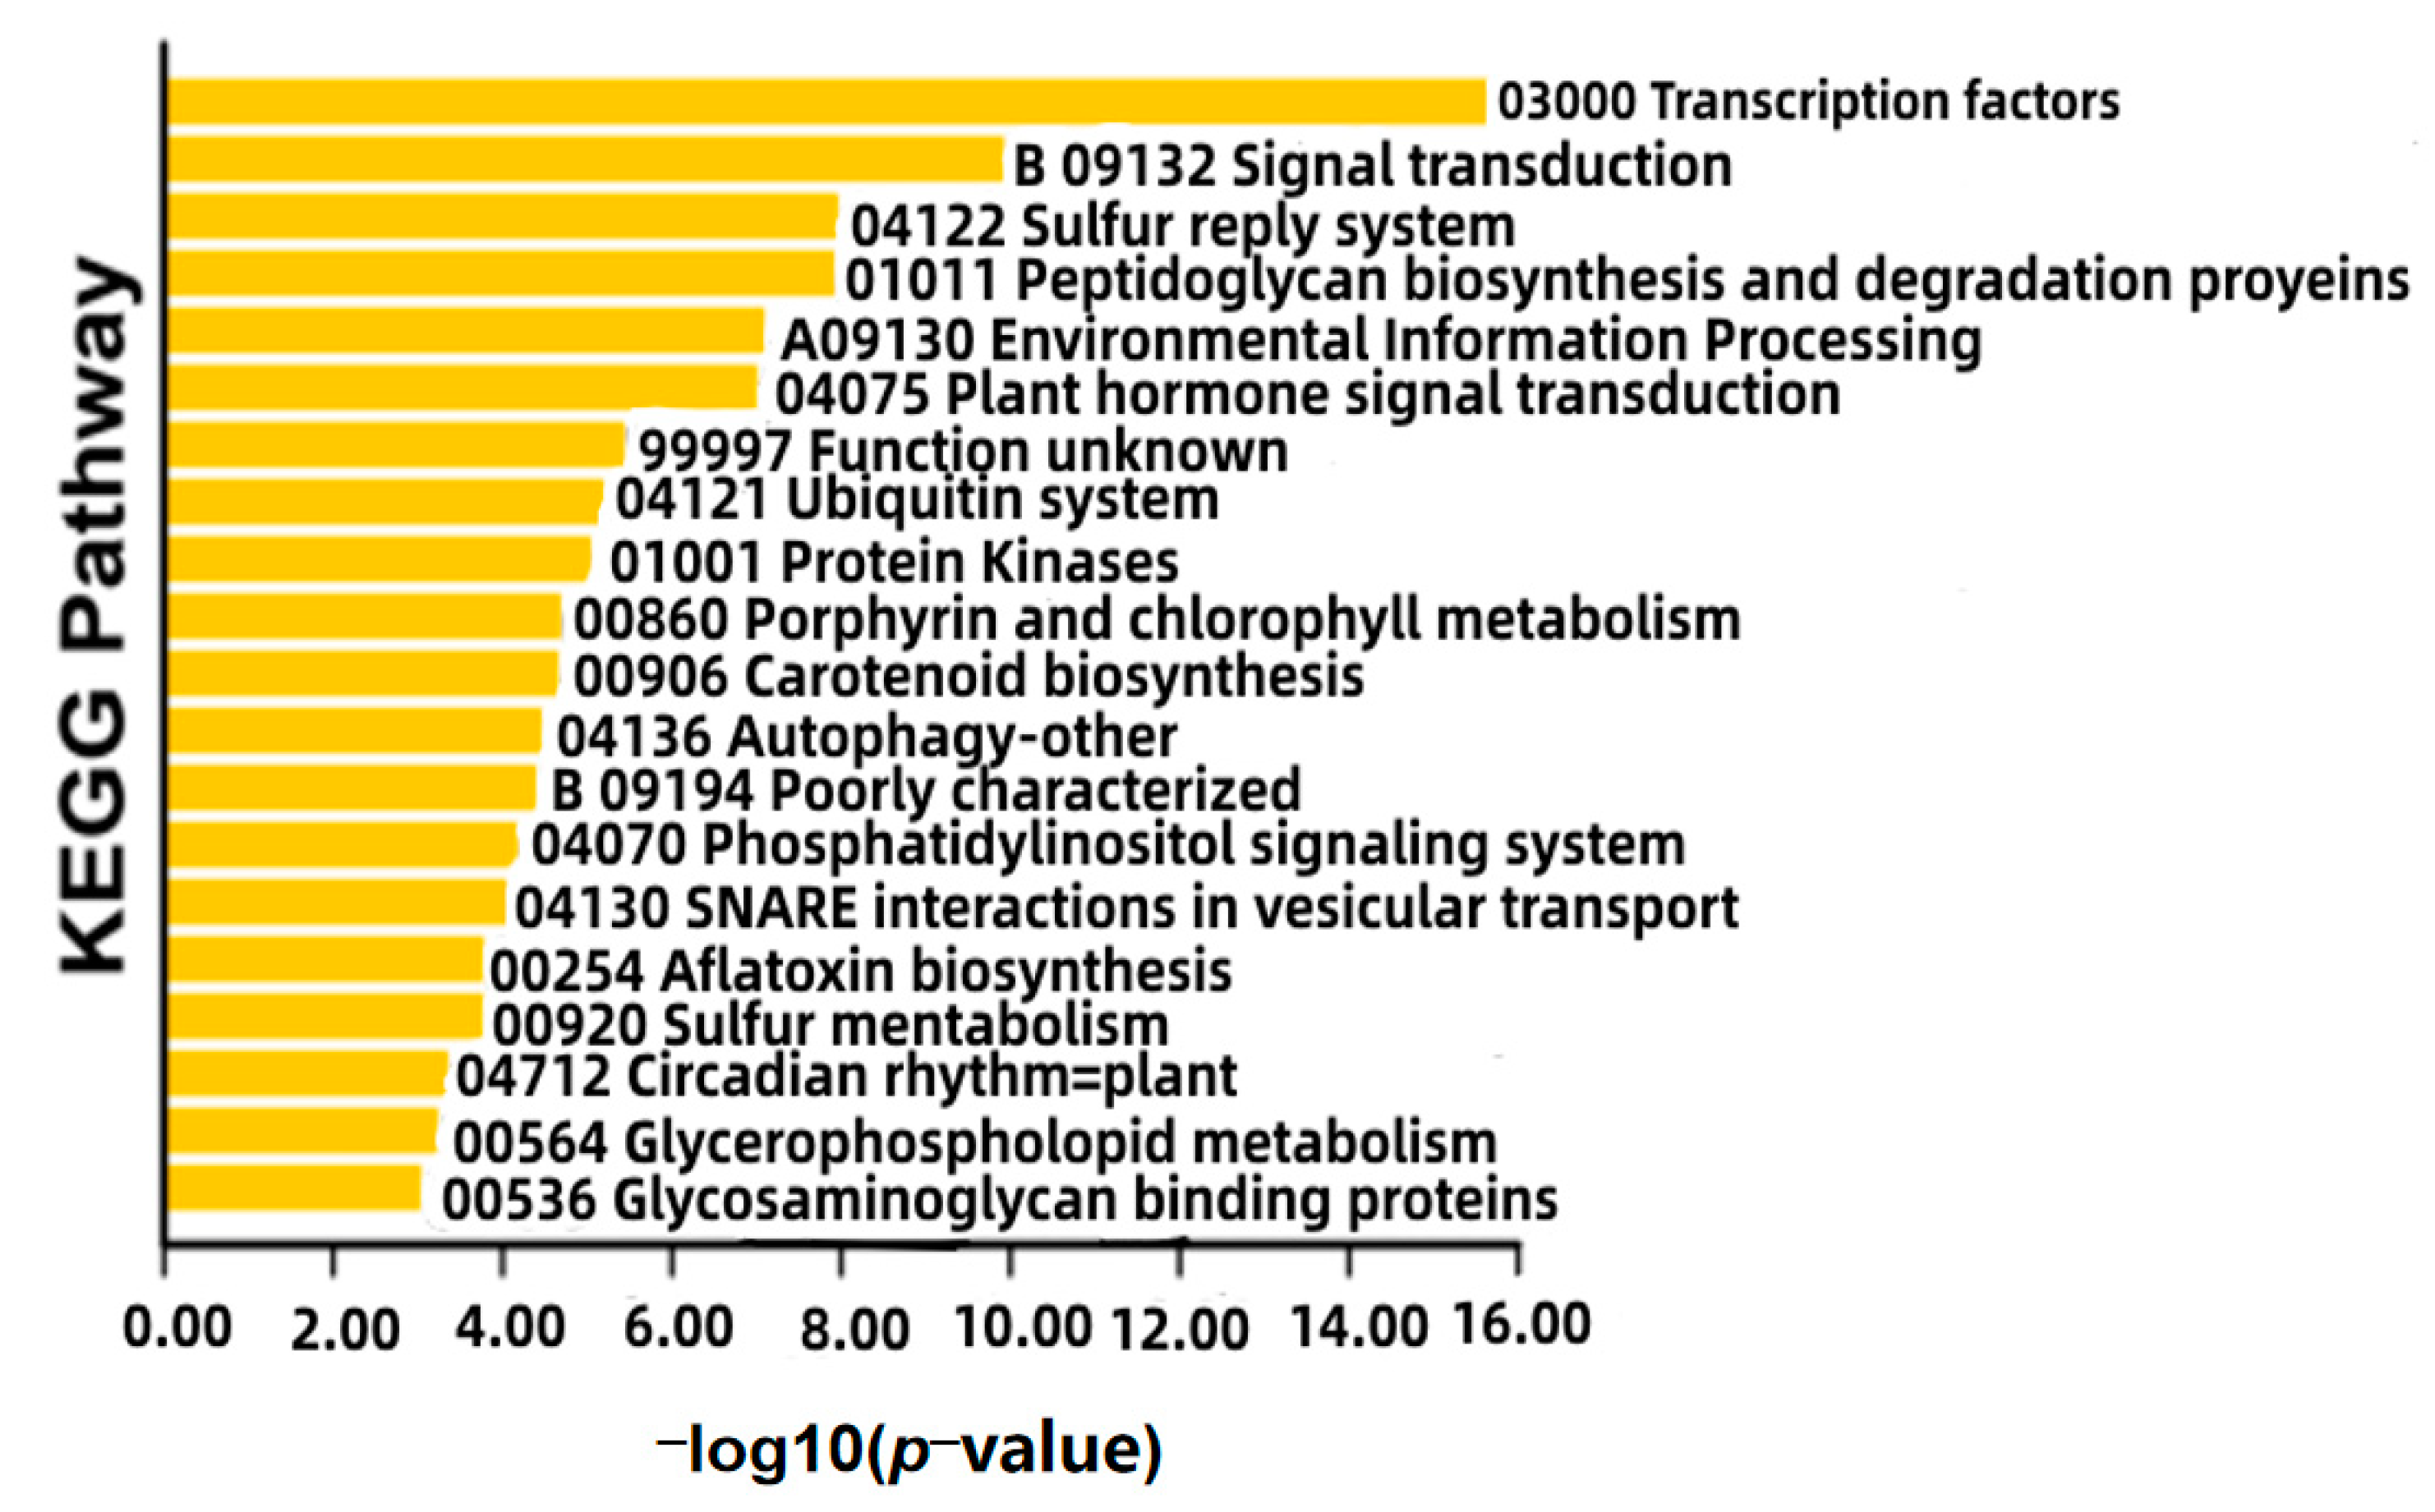
In order to further analyze the characteristics of the genes in these expression sequences containing variations and the life activities involved, we functionally characterized the unigenes containing SSRs and SNPs by performing GO and KEGG enrichment analyses (Figure 2 and Figure 3). The main enriched molecular function GO terms assigned to the unigenes containing SSRs were lyase activity (GO: 0016829), protein transporter activity (GO: 0140318), and DNA-binding transcription factor activity (GO: 0003700). The most enriched cellular component GO terms were transcription regulator complex (GO: 0005667), cytoplasm (GO: 0005737), and viral membrane (GO: 0036338). The main enriched biological process GO terms were organic substance metabolic process (GO: 0071704), establishment of localization (GO: 0051234), and cellular metabolic process (GO: 0006807). The significantly enriched KEGG pathways among the unigenes containing SSRs were (03000) transcription factors, (B09132) signal transduction, and (04122) sulfur relay system.

3.2. Interaction Network of Proteins Encoded by DEGs

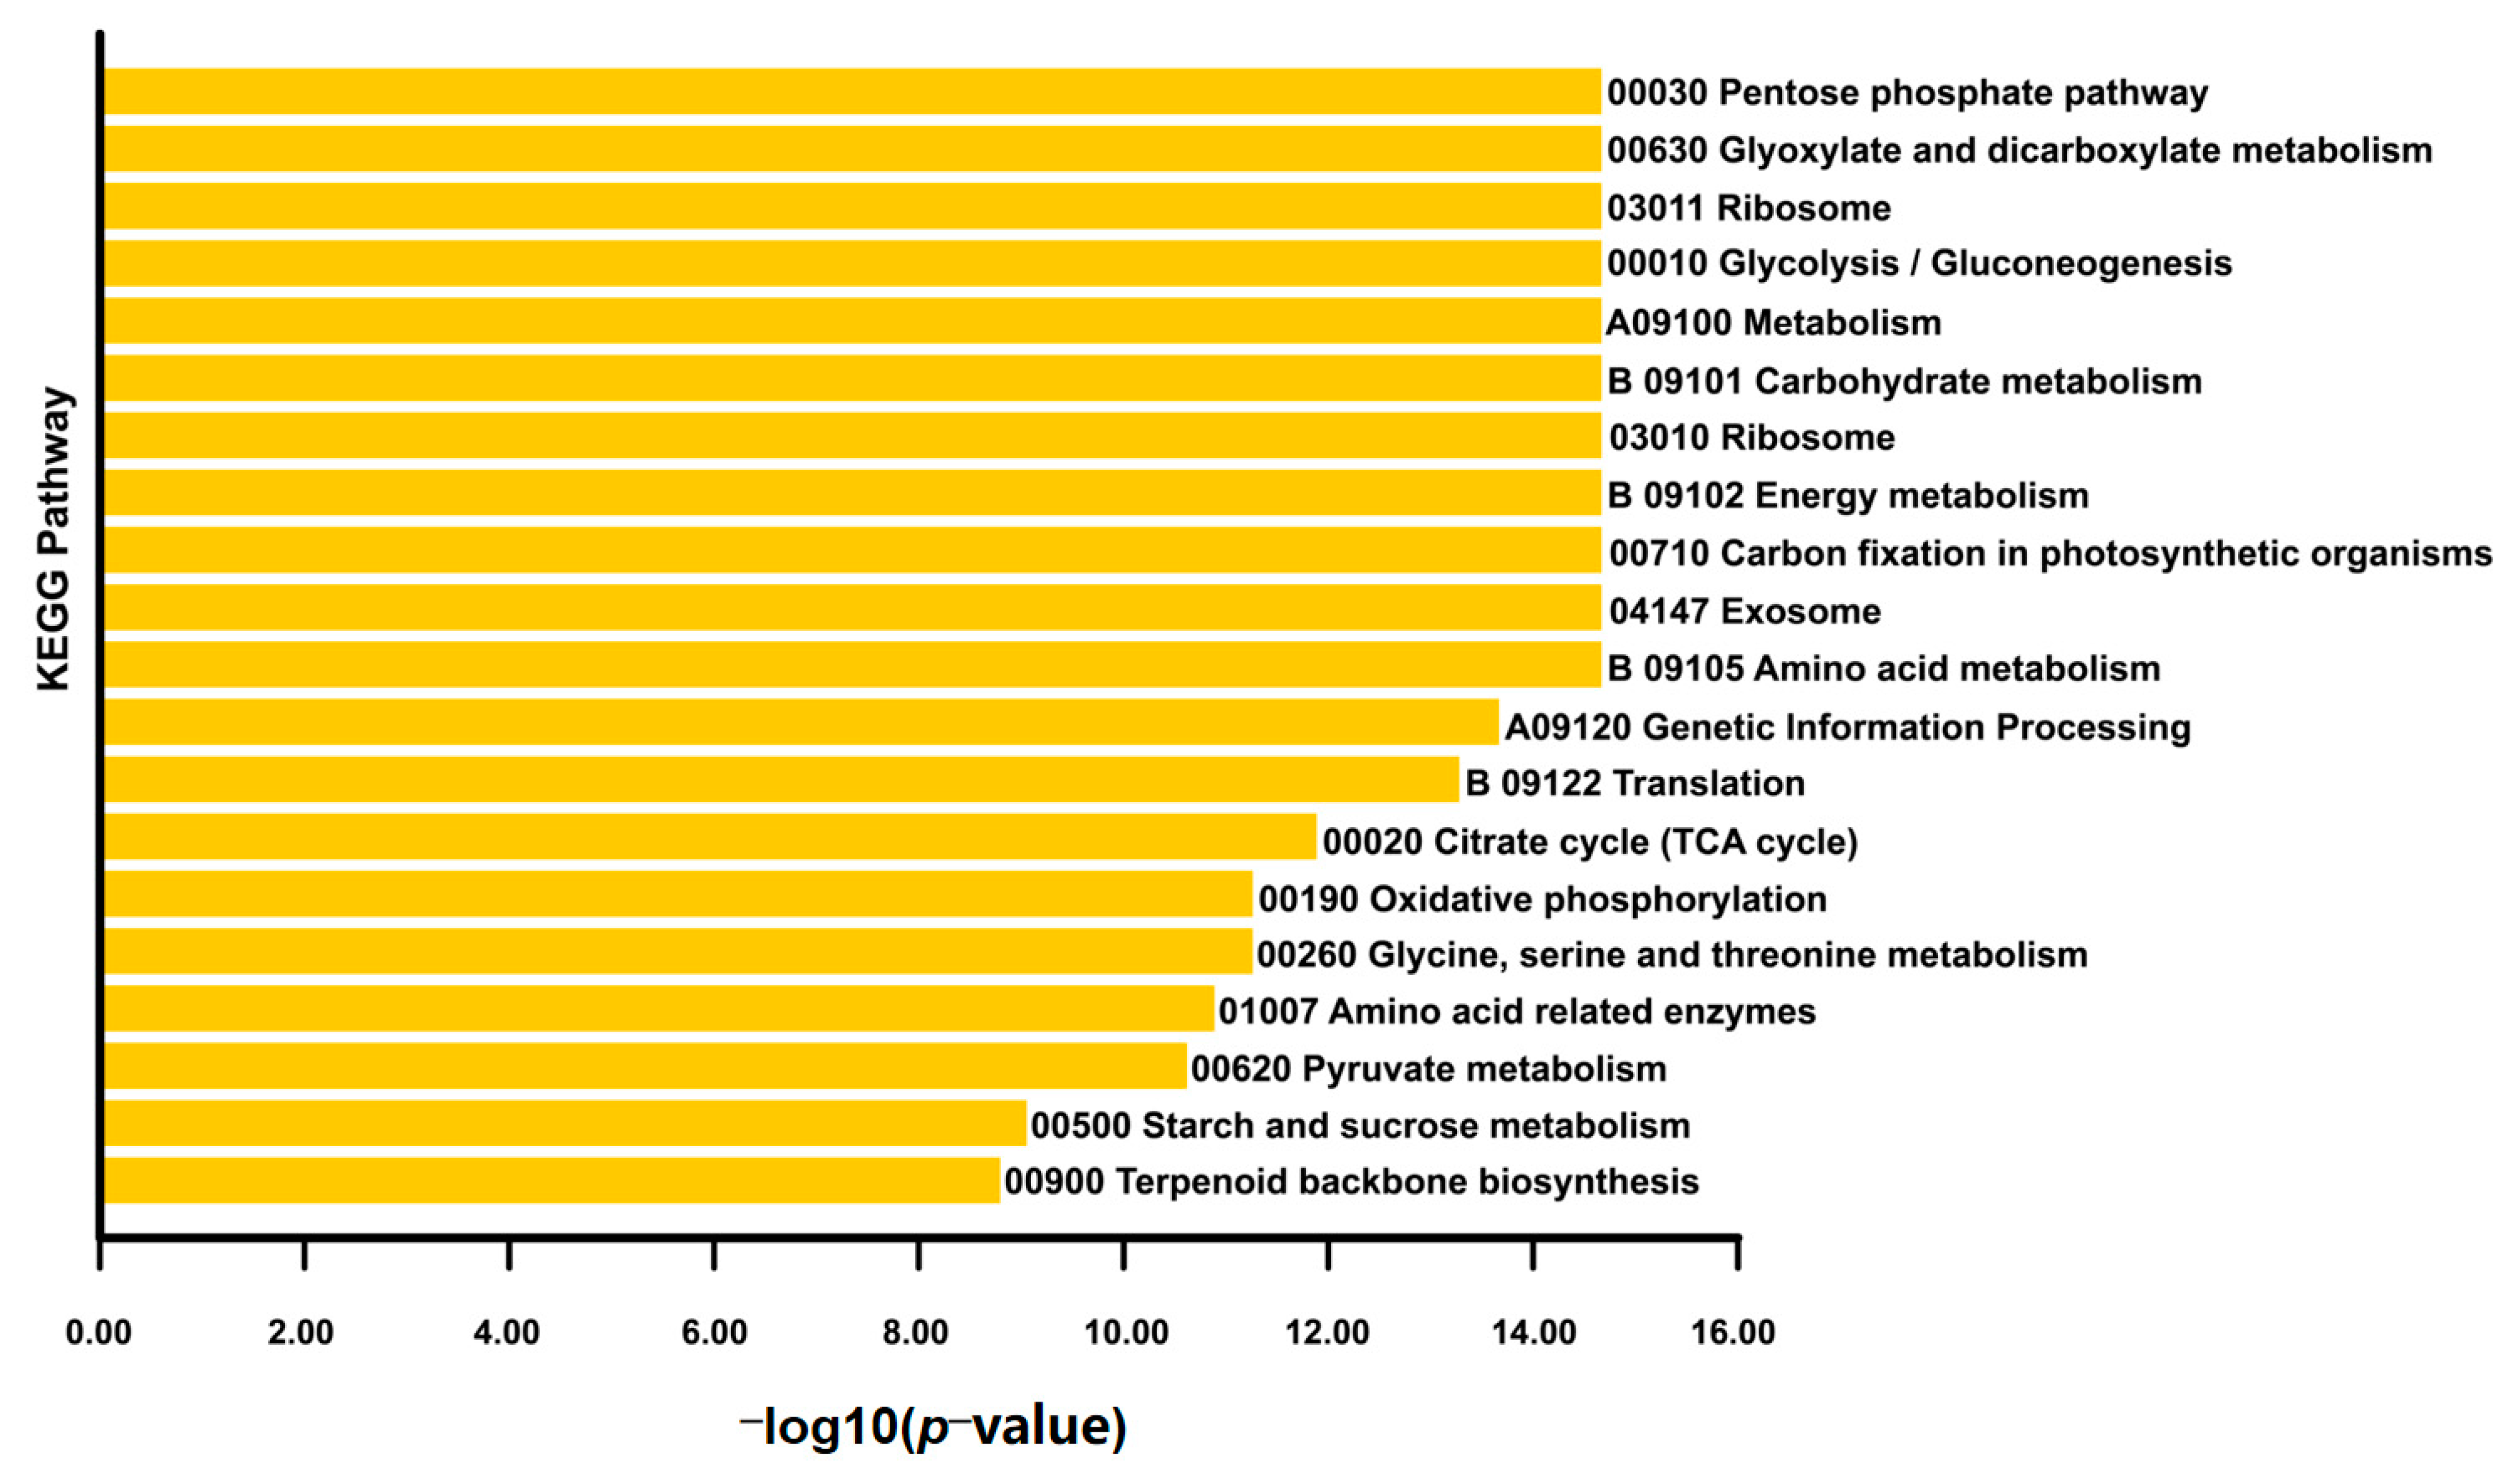
A total of 10,452 DEGs were detected in the transcriptome, of which 3995 (1606 upregulated genes and 2389 downregulated genes) could encode interacting proteins. Among the DEGs encoding proteins in the PPI network, 1297 contained at least one SSR. Primers were designed for these SSRs. The functional characterization of the DEGs encoding the proteins in the PPI network (Figure 4) revealed that the main biological process GO terms were catabolic process, oxidation-reduction process, and small molecule metabolic process. The main enrichment molecular function GO terms were small molecule binding, oxidoreductase activity, and cofactor binding. The main cellular component GO terms were thylakoid, replication fork, and membrane protein complex. The most enriched KEGG pathways were (00030) pentose phosphate pathway, (00630) glyoxylate and dicarboxylate metabolism, and (03011) ribosome (Figure 5).

3.3. EST-SSR Molecular Marker Verification

To verify the developed SSR markers and screen for available polymorphic markers, we synthesized 20 primer pairs for the SSR-containing genes encoding proteins in the PPI network. The polymorphic markers were verified using genomic DNA extracted from 30 kenaf varieties/lines. Finally, nine EST-SSR markers were confirmed as polymorphic in the analyzed kenaf germplasm materials (Table 4) with a polymorphism rate of 45%.

3.4. Genetic Diversity of Individual Loci

The genetic diversity of the newly developed EST-SSR markers in kenaf germplasm materials was evaluated (Table 5). The average Na for the nine EST-SSR markers was 3.44 (range: 2–6), whereas the average Ne was 1.57 (range: 1.11–3.18). The average major allele frequency was 0.81 (range: 0.50–0.95). The average Ho was 0.23 (range: 0–0.93), while the average He was 0.27 (range: 0.10–0.69). The average PIC was 0.25 (range: 0.09–0.65), with one, two, and seven sites with high, moderate, and low polymorphism rates, respectively. Moreover, the average I was 0.53 (range: 0.20–1.42). The average genetic similarity coefficient for the 30 kenaf germplasm materials was 0.69 (range: 0.18 to 1.00) (Table 6).

3.5. Genetic Structure Analysis

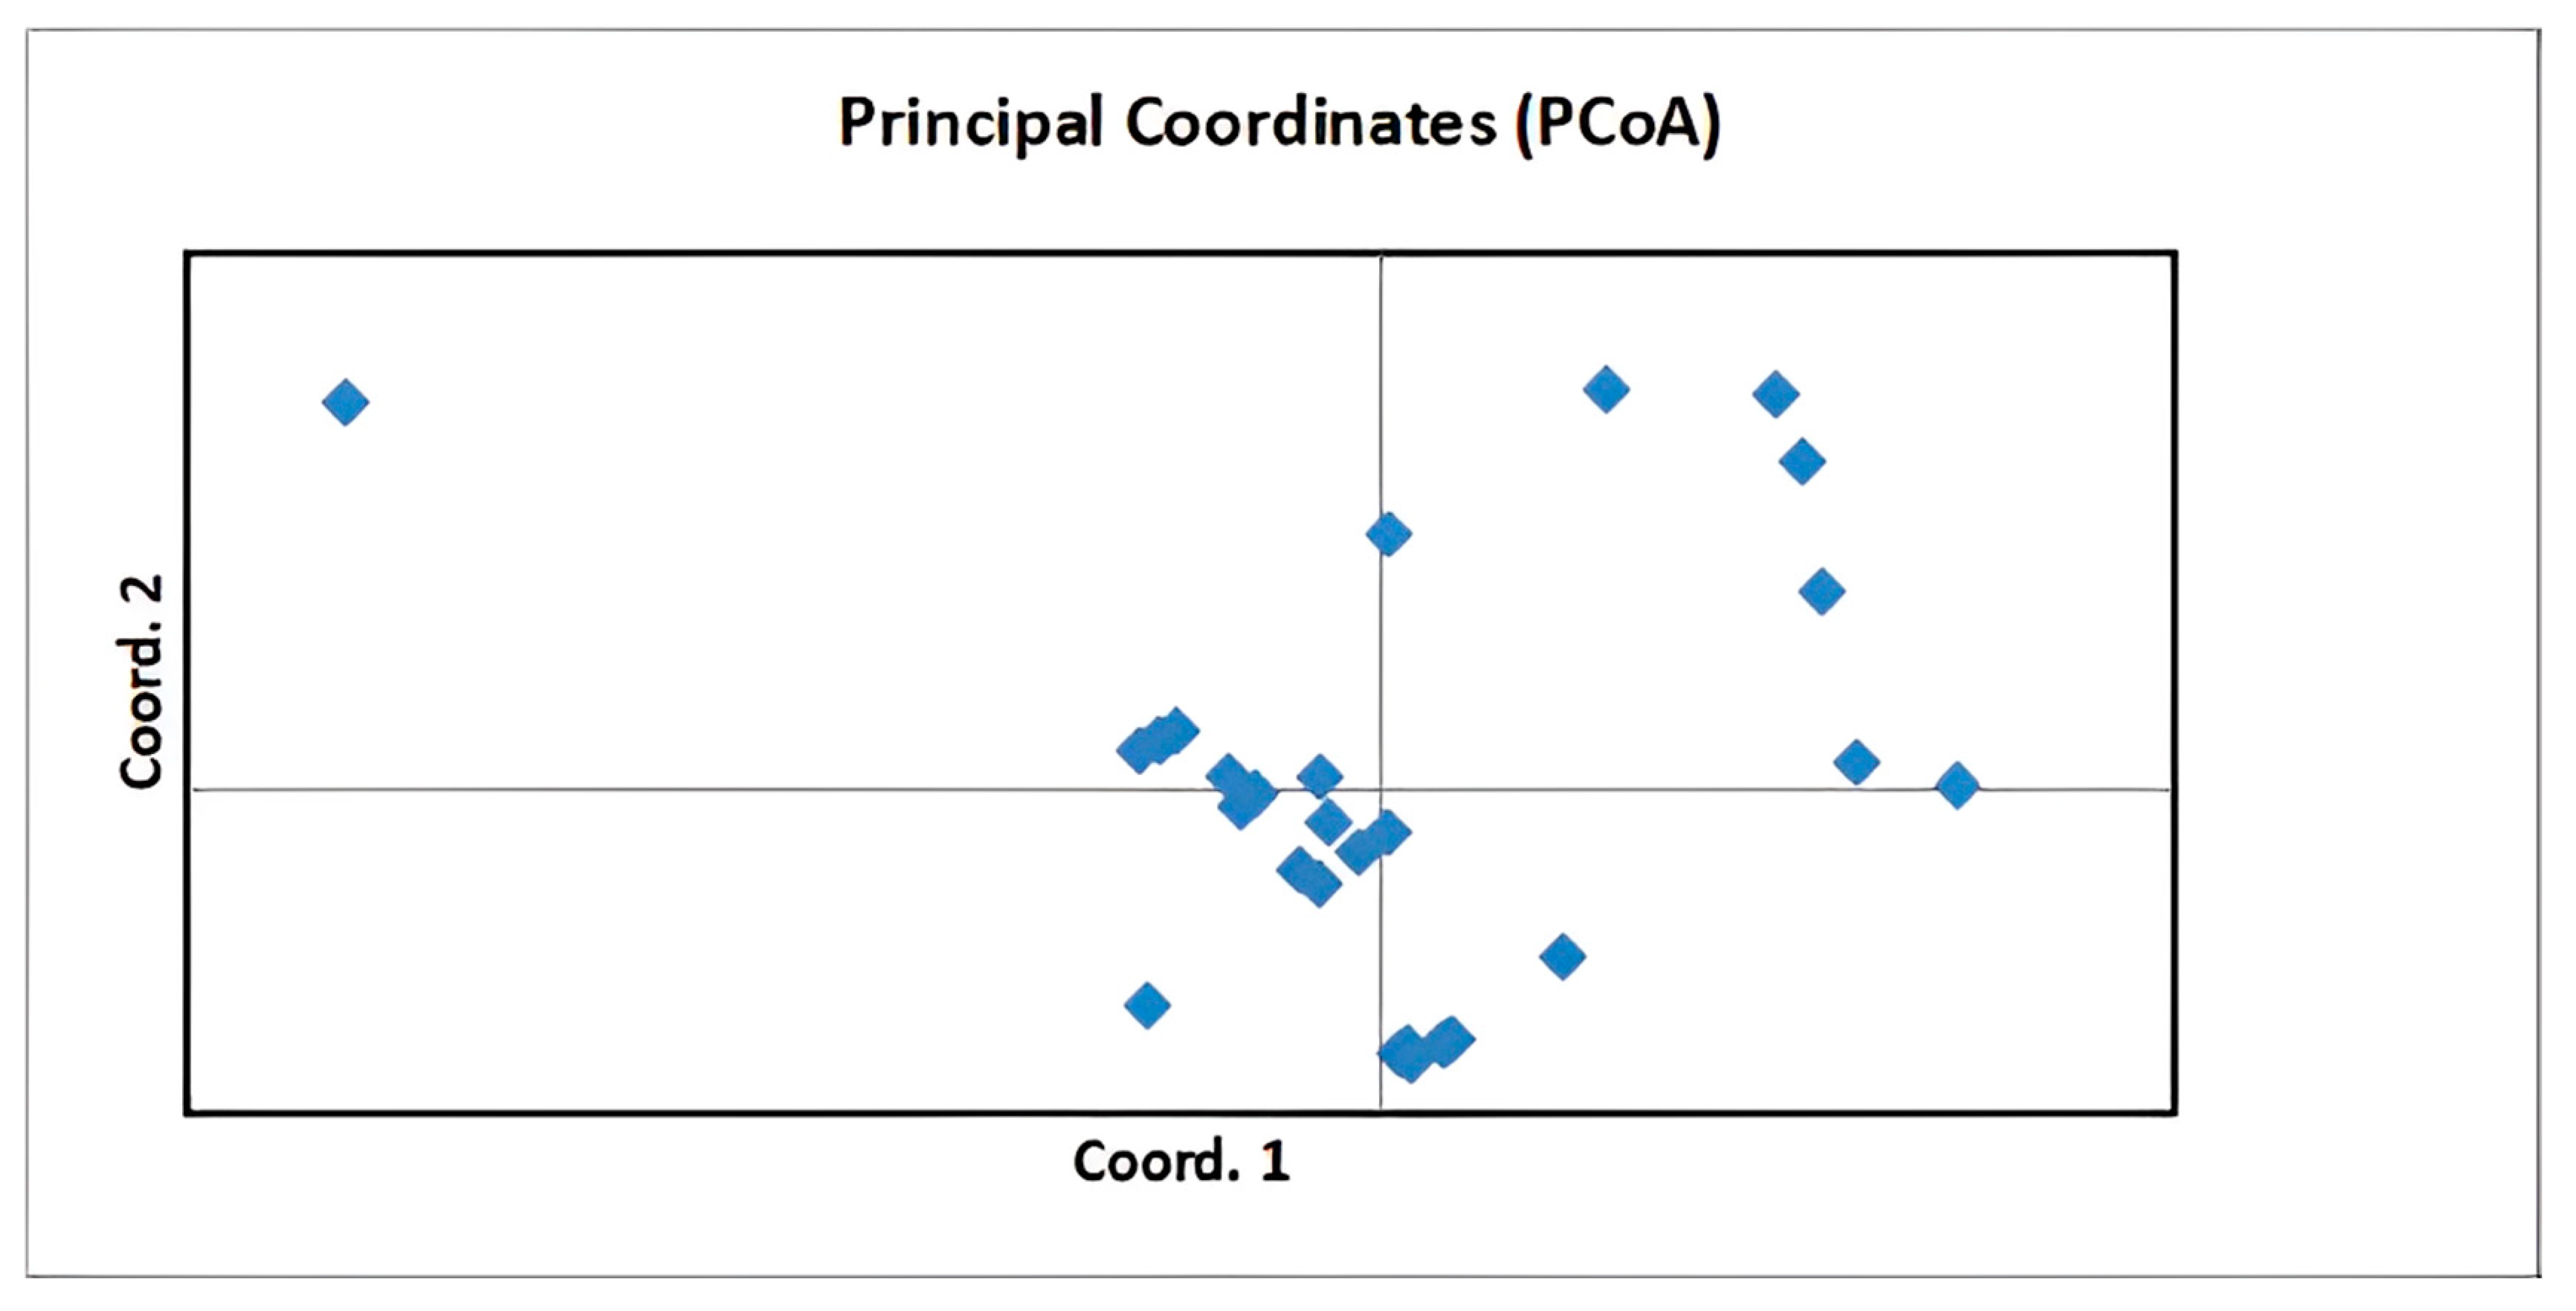
To clarify the genetic structure of the population, we calculated Nei’s genetic distance based on allelic frequency using PowerMarker software Version3.25. We also constructed a phylogenetic tree (Figure 6) according to the neighbor-joining method and conducted a two-dimensional principal coordinate analysis (PCoA) (Figure 7) using GenAIEx 6.5 software. Principal components 1–3 explained 67.62% of the variation. The genetic relationships were determined according to the distance separating the scattered points on the map. By combining the results of the PCoA and neighbor-joining phylogenetic analysis, the 30 kenaf germplasm materials were divided into 2 types.

4. Discussion

In this study, EST-SSR markers were developed using the transcriptome sequencing data for salt-treated kenaf samples. The number of inclusions spliced using sequencing reads from the marker source was compared with the corresponding data generated in previous kenaf transcriptome sequencing studies [7,21,26,37]. More common sequences, including SSR and InDel sequence variations, were detected in this study than in the earlier study by Jeong et al. [26], indicating that the EST-SSRs identified in this study may cover more expressed genes. Compared with other transcriptome analyses of kenaf (GO and KEGG enrichment analyses), we more thoroughly determined the functional characteristics of DEGs and the expression patterns varied between the different transcriptomes [6]. Therefore, developing EST-SSR markers using different transcriptomes for the same species is important to supplement the available molecular markers for kenaf.
According to the results of the GO and KEGG enrichment analyses, the genes containing SSRs and SNPs were primarily involved in transcription, metabolism, and signal transduction. Accordingly, the EST-SSR markers developed in this study mainly belonged to these genes. Most unigenes were found to have single nucleotide mutations, specifically for transitions and transversions. The genes containing SNPs included DEGs related to the response of kenaf to salt stress. Under saline conditions, kenaf genes encoding the proteins affecting metabolic activities, including amino acid metabolism and carbon–water metabolism, are highly enriched [38]. In the current study, the utility of EST-SSR markers was verified using some of the DEGs encoding proteins in the PPI network because of the potential functional correlation among these genes. In addition, EST-SSR markers may influence gene functions, leading to changes in the expression of other genes in the same network, which would likely lead to phenotypic changes in crops [7].
The enriched KEGG metabolic pathways among the DEGs encoding proteins in the PPI network included the (00030) pentose phosphate pathway, (00630) glyoxylate and dicarboxylate metabolism, and (03011) ribosome, which were similar to the enriched metabolic pathways among the DEGs containing sequence variations (SSRs and SNPs) that may be useful molecular markers. The population structure and distribution were determined according to the multi-locus genotypes [39]. Of the 55,219 pairs of SSR primers that were developed, 20 EST-SSR primer pairs were identified according to the EST sequences of the DEGs encoding proteins in the PPI network. A total of 30 kenaf germplasm materials were used for the marker verification. One highly polymorphic locus, two moderately polymorphic loci, and seven loci with a relatively low polymorphism rate were found. The genotypes of 9 EST-SSR markers divided the 30 kenaf germplasm materials into two types. The results of the two-dimensional PCoA and the phylogenetic analysis were consistent. Thus, these nine EST-SSR markers may be used to analyze the genetic diversity and genetic structure of kenaf germplasm resources in future investigations, laying the foundation for further research.
In summary, we developed a batch of EST-SSR markers using transcriptome data for kenaf plants grown under saline conditions and the SSR primers of the DEGs of PPI were selected for screening, verification, and application. Finally, nine primer pairs for new polymorphic EST-SSR markers suitable for genotyping were obtained and used to analyze the genetic diversity and population structure of kenaf germplasm resources, with implications for the molecular marker-assisted selection and characterization of the kenaf genome.

5. Conclusions

In this study, a set of EST-SSR markers related to the kenaf response to salinity stress was developed on the basis of the transcriptome data for kenaf plants exposed to salt stress. These markers were mainly single nucleotide repeats. The DEGs encoding proteins in the PPI network and the associated metabolic pathways were revealed. Moreover, 20 pairs of EST-SSR primers were used to genotype 30 kenaf varieties (lines), among which 9 primer pairs were confirmed as ideal markers according to the level of polymorphism (i.e., high, moderate, and low). The SSR molecular markers for kenaf developed in this study may be useful tools for the molecular marker-assisted breeding of salt-tolerant kenaf cultivars. Based on the polymorphic EST-SSR markers and kenaf EST-SSR marker library developed in this study, we can prove the relationship and effect between EST-SSR markers of these differentially expressed genes from salt-stress transcription groups and salt-stress phenotypes in natural populations as well as genetic linkage populations in the future, guiding the polymerization of excellent salt-tolerant alleles to truly apply these molecular markers to the creation and screening of salt-tolerant kenaf germplasms. Furthermore, these markers are of great significance for the development and discovery of important marker types related to kenaf salt stress in the future.

Supplementary Materials

The following supporting information can be downloaded at https://www.mdpi.com/article/10.3390/agronomy13071946/s1, Table S1: A marker library for the screening of polymorphic EST-SSR markers.

Author Contributions

Conceptualization, X.A., Q.L., J.Y., J.W., G.D., H.Z. and C.C.; Data Curation, X.A.; Formal Analysis, X.A.; Funding Acquisition, X.A.; Investigation, X.L.; Methodology, X.A. and Q.L.; Project Administration, X.A.; Resources, X.A.; Software, X.A. and W.L.; Supervision, X.A.; Validation, X.A., W.L. and T.L.; Visualization, X.A.; Writing—Original Draft, X.A. and L.Z.; Writing—Review and Editing, X.A. and Q.L. All authors have read and agreed to the published version of the manuscript.

Funding

This research was funded by the China Agriculture Research System of MOF and MARA and the China Agriculture Research System for Bast and Leaf Fiber Crops (CARS-16-S05).

Data Availability Statement

All datasets generated for this study are included in the article/Supplementary Material. The raw transcriptome sequencing data were submitted to the NCBI database (SRR9613936 to SRR9613939).

Acknowledgments

We are greatly indebted to the anonymous reviewers for their critical, helpful, and constructive comments regarding this manuscript.

Conflicts of Interest

The authors declare that the research was conducted in the absence of any commercial or financial relationships that could be construed as a potential conflict of interest.

References

  1. Ziska, L.H.; Bunce, J.A.; Shimono, H.; Gealy, D.R.; Baker, J.T.; Newton, P.C.; Reynolds, M.P.; Jagadish, K.S.; Zhu, C.; Howden, M.; et al. Food security and climate change: On the potential to adapt global crop production by active selection to rising atmospheric carbon dioxide. Proc. Biol. Sci. 2012, 279, 4097–4105. [Google Scholar] [CrossRef]
  2. Ludwig, M.; Wilmes, P.; Schrader, S. Measuring soil sustainability via soil resilience. Sci. Total Environ. 2018, 626, 1484–1493. [Google Scholar] [CrossRef] [PubMed]
  3. Savary, S.; Akter, S.; Almekinders, C.; Harris, J.; Korsten, L.; Rotter, R.; Waddington, S.; Watson, D. Mapping disruption and resilience mechanisms in food systems. Food Secur. 2020, 12, 695–717. [Google Scholar] [CrossRef]
  4. Chen, P.; Li, Z.; Luo, D.; Jia, R.; Lu, H.; Tang, M.; Hu, Y.; Yue, J.; Huang, Z. Comparative transcriptomic analysis reveals key genes and pathways in two different cadmium tolerance kenaf (Hibiscus cannabinus L.) cultivars. Chemosphere 2021, 263, 128211. [Google Scholar] [CrossRef] [PubMed]
  5. Zhang, L.; Li, A.; Wang, X.; Xu, J.; Zhang, G.; Su, J.; Qi, J.; Guan, C. Genetic diversity of kenaf (Hibiscus cannabinus) evaluated by inter-simple sequence repeat (ISSR). Biochem. Genet. 2013, 51, 800–810. [Google Scholar] [CrossRef]
  6. An, X.; Chen, J.; Jin, G.R. Transcriptome profiling of kenaf (Hibiscus cannabinus L.) under plumbic stress conditions implies the involvement of NAC transcription factors regulating reactive oxygen species-dependent programmed cell death. PeerJ 2020, 8, e8733. [Google Scholar] [CrossRef] [Green Version]
  7. An, X.; Chen, J.; Liu, T.; Li, W.; Luo, X.; Zou, L. Transcriptomic and Metabolic Profiling of Kenaf Stems under Salinity Stress. Plants 2022, 11, 1448. [Google Scholar] [CrossRef]
  8. An, X.; Luo, X.; Li, W.; Liu, T.; Zou, L. Development and Application of EST-SSR Markers Related to Lead Stress Responses in Kenaf Based on Transcriptome Sequencing Data. Sustainability 2023, 15, 1514. [Google Scholar] [CrossRef]
  9. An, X.; Jin, G.; Zhang, J.; Ma, G.; Jin, L.; Luo, X.; Chen, C.; Shi, X.; Zhou, J.; Wei, W.; et al. Research Progress on Tissue Culture and Genetic Transformation of Kenaf (Hibiscus cannabinus). Open Life Sci. 2017, 12, 465–472. [Google Scholar] [CrossRef] [Green Version]
  10. Kim, W.J.; Kim, D.S.; Kim, S.H.; Kim, J.B.; Goh, E.J.; Kang, S.Y. Analysis of genetic similarity detected by AFLP and PCoA among genotypes of kenaf (Hibiscus cannabinus L.). J. Crop Sci. Biotechnol. 2010, 13, 243–249. [Google Scholar] [CrossRef]
  11. Al-Mamun, M.; Rafii, M.Y.; Misran, A.b.; Berahim, Z.; Ahmad, Z.; Khan, M.M.H.; Oladosu, Y. Estimating Genetic Analysis Using Half Diallel Cross Underlying Kenaf (Hibiscus cannabinus L.) Fibre Yield in Tropical Climates. BioMed Res. Int. 2022, 2022, 1532987. [Google Scholar] [CrossRef] [PubMed]
  12. Gupta, P.K.; Varshney, R.K. The development and use of microsatellite markers for genetic analysis and plant breeding with emphasis on bread wheat. Euphyica 2000, 113, 163–185. [Google Scholar] [CrossRef]
  13. Reddy, M.P.; Sarla, N.; Siddiq, E.A. Inter simple sequence repeat (ISSR) polymorphism and its application in plant breeding. Euphytica 2002, 128, 9–17. [Google Scholar] [CrossRef]
  14. Wen, M.; Wang, H.; Xia, Z.; Zou, M.; Lu, C.; Wang, W. Developmenrt of EST-SSR and genomic-SSR markers to assess genetic diversity in Jatropha Curcas L. BMC Res. Notes 2010, 3, 42. [Google Scholar] [CrossRef] [Green Version]
  15. Cheng, Z.; Lu, B.R.; Baldwin, B.S.; Sameshima, K.; Chen, J.K. Comparative studies of genetic diversity in kenaf (Hibiscus cannabinus L.) varieties based on analysis of agronomic and RAPD data. Hereditas 2002, 136, 231–239. [Google Scholar] [CrossRef]
  16. Cheng, Z.; Lu, B.R.; Sameshima, K.; Fu, D.X.; Chen, J.K. Identification and genetic relationships of kenaf (Hibiscus cannabinus L.) germplasm revealed by AFLP analysis. Genet. Resour. Crop Evol. 2004, 51, 393–401. [Google Scholar] [CrossRef]
  17. Satya, P.; Karan, M.; Chakraborty, K.; Biswas, C.; Karmakar, P.G. Comparative analysis of diversification and population structure of kenaf (Hibiscus cannabinus L.) and roselle (H. sabdariffa L.) using SSR and RGA (resistance gene analogue) markers. Plant Syst. Evol. 2013, 300, 1209–1218. [Google Scholar] [CrossRef]
  18. Li, H.; Li, D.; Chen, A.; Tang, H.; Li, J.; Huang, S. Characterization of the Kenaf (Hibiscus cannabinus) Global Transcriptome Using Illumina Paired-End Sequencing and Development of EST-SSR Markers. PLoS ONE 2016, 11, e0150548. [Google Scholar] [CrossRef]
  19. Kim, J.M.; Lyu, J.I.; Lee, M.-K.; Kim, D.-G.; Kim, J.-B.; Ha, B.-K.; Ahn, J.-W.; Kwon, S.-J. Cross-species transferability of EST-SSR markers derived from the transcriptome of kenaf (Hibiscus cannabinus L.) and their application to genus Hibiscus. Genet. Resour. Crop Evol. 2019, 66, 1543–1556. [Google Scholar] [CrossRef]
  20. Mehmood, F.; Shahzadi, I.; Waseem, S.; Mirza, B.; Ahmed, I.; Waheed, M.T. Chloroplast genome of Hibiscus rosa-sinensis (Malvaceae): Comparative analyses and identification of mutational hotspots. Genomics 2020, 1121, 581–591. [Google Scholar] [CrossRef]
  21. Zhang, L.M.; Wan, X.B.; Zhang, L.L.; XU, Y.; Lin, L.H.; Qi, J.M.; Zhang, L.W. Development of InDel Markers for Identification of a Single Mendelian Locus Controlling Leaf Shape in Kenaf (Hibiscus cannabinus). Trop. Plant Biol. 2019, 12, 78–84. [Google Scholar] [CrossRef]
  22. Wan, X.B.; Xu, J.T.; Li, D.X.; Lin, L.H.; Qi, J.M.; Zhang, L.W. Construction of DNA fingerprinting in Kenaf (Hibiscus cannabinus) using microsatellite markers. J. Plant Genet. Res. 2018, 19, 87–95. [Google Scholar] [CrossRef]
  23. Yuan, C.Y.; Zhang, C.; Wang, P.; Hu, S.; Chang, H.P.; Xiao, W.J.; Lu, X.T.; Jiang, S.B.; Ye, J.Z.; Guo, X.H. Genetic diversity analysis of okra (Abelmoschus esculentus L.) by inter-simple sequence repeat (ISSR) markers. Genet Mol. Res. 2014, 13, 3165–3175. [Google Scholar] [CrossRef]
  24. Wang, X.M.; Hou, X.Q.; Zhang, Y.Q.; Yang, R.; Feng, S.F.; Li, Y.; Ren, Y. Genetic diversity of the endemic and medicinally important plant Rheum officinale as revealed by Inter-Simpe Sequence Repeat (ISSR) Markers. Int. J. Mol. Sci. 2012, 13, 3900–3915. [Google Scholar] [CrossRef] [Green Version]
  25. Wan, X.B.; Li, D.X.; Xu, Y.; Xu, J.T.; Zhang, L.L.; Zhang, L.M.; Lin, L.H.; Qi, J.M.; Zhang, L.W. Development and polymorphism evaluation of EST-SSR markers in kenaf. Acta Agron. Sin. 2017, 43, 1170–1180. [Google Scholar] [CrossRef]
  26. Jeong, S.W.; Kwon, S.-J.; Ryu, J.; Kim, J.-B.; Ahn, J.-W.; Kim, S.H.; Jo, Y.D.; Choi, H.-I.; Im, S.B.; Kang, S.-Y. Development of EST-SSR markers through de novo RNA sequencing and application for biomass productivity in kenaf (Hibiscus cannabinus L.). Genes Genom. 2017, 39, 1139–1156. [Google Scholar] [CrossRef]
  27. Jin, G.R.; An, X.; Luo, X.H.; Chen, C.L.; Li, W.L.; Li, P.F.; Tian, D.Q.; Wang, B.; Wu, W.Q.; Zhu, G.L. The EST-SSR markers of the response gene of kenaf under drought stress. Mol Plant. Breeding 2018, 16, 4735–4742. [Google Scholar] [CrossRef]
  28. Yang, X.; Gao, K.; Chen, Z.; Yang, X.Y.; Rao, P.; Zhao, T.Y.; An, X.M. Development and Application of EST-SSR Markers in Koelreuteria paniculata Laxm. Using a Transcriptomic Approach. Biotechnology 2017, 16, 45–56. [Google Scholar] [CrossRef]
  29. Kim, J.M.; Lyu, J.I.; Kim, D.G.; Hung, N.N.; Ryu, J.; Kim, J.B.; Ahn, J.W.; Ha, B.K.; Kwon, S.J. Analysis of genetic diversity and relationships of Perilla frutescens using novel EST-SSR markers derived from transcriptome between wild-type and mutant Perilla. Mol. Biol. Rep. 2021, 48, 6387–6400. [Google Scholar] [CrossRef]
  30. Jia, Y.; Bai, J.Q.; Liu, M.L.; Jiang, Z.F.; Wu, Y.; Fang, M.F.; Li, Z.H. Transcriptome analysis ofthe endangered Notoptery giumincisum: Coldtolerance gene discovery and identification ofEST-SSR and SNPmarkers. Plant Divers. 2019, 41, 1–6. [Google Scholar] [CrossRef]
  31. Yildiz, M.; Kocak, M.; Baloch, F.S. Genetic bottlenecks in Turkish okra germplasm and utility of iPBS retrotransposon markers for genetic diversity assessment. Genet Mol. Res. 2015, 14, 10588–10602. [Google Scholar] [CrossRef] [PubMed]
  32. Nei, M.; Takezaki, N. Estimation of genetic distances and phylogenetic trees from DNA analysis. In Proceedings of the 5th World Congress on Genetics Applied to Livestock Production, Guelph, ON, Canada, 7–12 August 1994; Volume 21, pp. 405–412. [Google Scholar]
  33. Yeh, F.C. Population genetic analysis of co-dominant and dominant markers and quantitative traits. Belg. J. Bot. 1997, 129, 157. [Google Scholar]
  34. Smouse, P.E.; Banks, S.C.; Peakall, R. Converting quadratic entropy to diversity: Both animals and alleles are diverse, but some are more diverse than others. PLoS ONE 2017, 12, e0185499. [Google Scholar] [CrossRef] [PubMed] [Green Version]
  35. Schafleitner, R.; Kumar, S.; Lin, C.Y.; Hegde, S.G.; Ebert, A. The okra (Abelmoschus esculentus) transcriptome as a source for gene sequence information and molecular markers for diversity analysis. Gene 2013, 517, 27–36. [Google Scholar] [CrossRef]
  36. Li, H.P.; Yao, Y.F.; Lian, D.M.; Lai, Z.F.; Hong, J.J. Transcriptome Sequencing and Analysis of Okra Fruit. Biotechnol. Bull. 2018, 34, 121–127. [Google Scholar] [CrossRef]
  37. Zhang, L.; Wan, X.; Xu, J.; Lin, L.; Qi, J. De novo assembly of kenaf (Hibiscus cannabinus) transcriptome using Illumina sequencing for gene discovery and marker identification. Mol. Breed. 2015, 35, 192. [Google Scholar] [CrossRef]
  38. Li, H.; Li, D.; Chen, A.; Tang, H.; Li, J.; Huang, S. RNA-seq for comparative transcript profiling of kenaf under salinity stress. J. Plant Res. 2017, 130, 365–372. [Google Scholar] [CrossRef] [Green Version]
  39. Pritchard, J.K.; Stephens, M.; Donnelly, P. Inference of Population Structure Using Multilocus Genotype Data. Genetics 2000, 155, 945–959. [Google Scholar] [CrossRef]
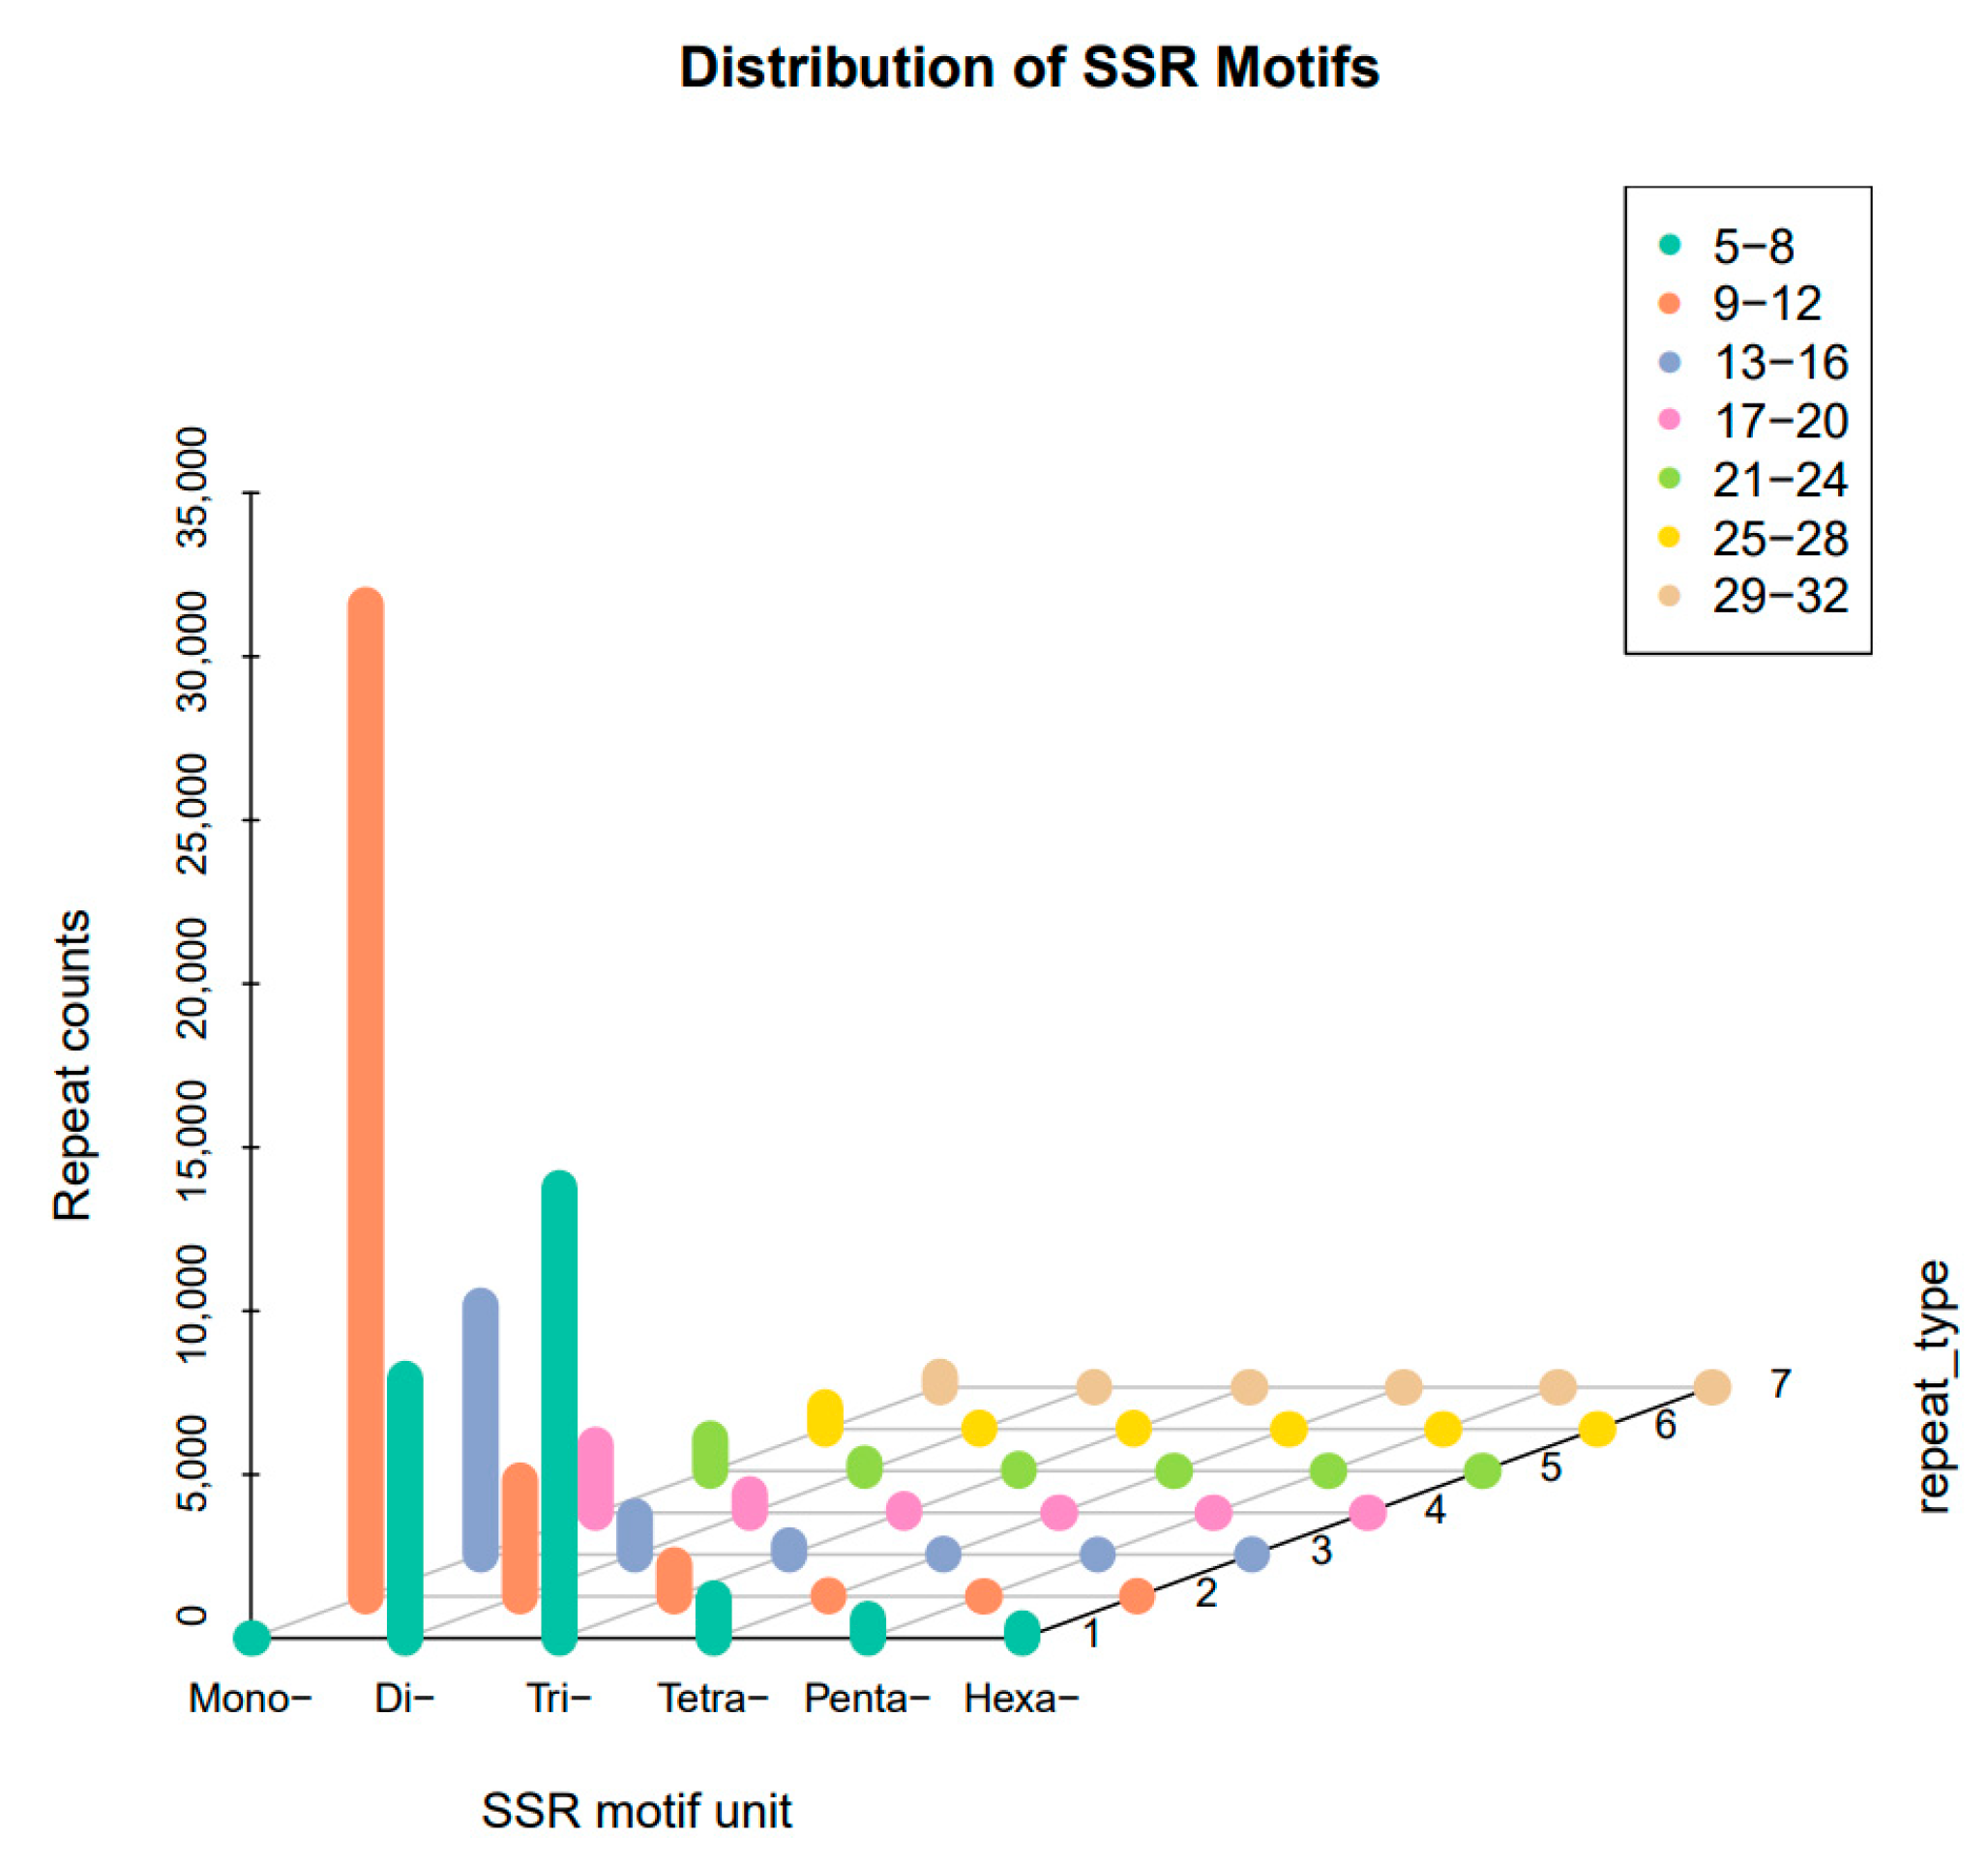
Figure 1. Distribution of SSR motifs in unigenes.
Agronomy 13 01946 g001
Figure 2. GO enrichment analysis of the DEGs containing SNPs and SSRs.
Agronomy 13 01946 g002
Figure 3. KEGG enrichment analysis of the DEGs containing SNPs and SSRs.
Agronomy 13 01946 g003
Figure 4. GO enrichment analysis (level 3) of the DEGs encoding proteins in the PPI network.
Agronomy 13 01946 g004
Figure 5. KEGG enrichment analysis of the DEGs encoding proteins in the PPI network.
Agronomy 13 01946 g005
Figure 6. Neighbor-joining phylogenetic tree with 30 kenaf germplasm materials.
Agronomy 13 01946 g006
Figure 7. Two-dimensional principal coordinate analysis. Note: The abscissa and ordinate represent the first and second principal coordinates of the two-dimensional principal coordinate analysis (PCoA), respectively. Each point in the graph represents a sample. The closer the distance between points, the closer the relationship between the samples. The farther the distance between points, the farther the relationship between the samples.
Agronomy 13 01946 g007
Table 1. Details regarding 30 kenaf germplasm materials.
NumberVariety NameOrigin
S3185–245Zimbabwe
S32C2032Cuba
S33Burmese KenafMyanmar
S34j-1-113USA
S35KG2006-014China
S36WhittenUSA
S37MSI-80USA
S38CPI-F8891China
S39PI-270116USA
S40FJ/026HFrance
S41FJ/01FHFrance
S42DY/069HChina
S43NY/061HNigeria
S44BL/012HUSA
S45DS/012HGuatemala
S46SM/025HEl Salvador
S4878-18RS10USA
S50GR2563USA
S52MasterfiberAfrica
S53MSI104grUSA
S54MSI135USA
S55MSI136USA
S56MSI139USA
S57MSI77USA
S58MSI78USA
S59MSI180USA
S60Soudan PreSudan
S61Indian Selection’98India
S62Zhe 1’96China
S64Zhejiang No. 2’96China
Table 2. Overview of the unigenes containing simple sequence repeats.
TypeNo.
Total number of sequences examined175,216
Total size of examined sequences (bp)268,192,545
Total number of identified SSRs73,728
Number of SSRs containing sequences53,444
Number of sequences containing more than 1 SSR14,775
Number of SSRs present in compound formation5717
Table 3. Overview of the SNPs in unigenes.
TypeCountFrequency Per kb
Transition
C/T33670.01
A/G34610.01
Transversion
A/T12120
A/C8680
T/G8770
C/G6980
Total10,4830.04
SNP Position in Codon
First2107
Second780
Third1931
Table 4. Information regarding nine primer pairs for polymorphic EST-SSRs.
PrimersIDSSR TypeSSRSizeForward Primer1 (5′-3′)Tm (°C)SizeReverse Primer1 (5′-3′)Tm (°C)SizeProduct Size (bp)
KSSR59Cluster-12086.5227p3(CCA)515AAGCCGAAAAAGCCTCACCT60.17920AGCTGGTGTTTCTTGGCTGT60.10720132
KSSR74Cluster-12086.35062p3(TTG)515TGCCGCTGCTTTCTCCAATA60.03620GCTTCATGCTTGTTTTGTGGA57.90421217
KSSR91Cluster-12086.23640p3(TCT)515GACAGCAAGGTGATCCTCCC60.10720ACGATGAAGACGACGAACCC60.10920230
KSSR102Cluster-12086.10800p2(AT)816ACACTTTGACAACCGGAGCA60.10720TGGAGAAACAGATTGACTTGGGA59.60623244
KSSR118Cluster-12086.3729p2(CT)714GTCGGAAGTGGTGAATGGCT60.32220ATAGGGAGGCTGATGGTGGT60.0320175
KSSR70Cluster-12086.36583p3(TCT)515ACCTGATTGCCTCACTGCTC60.03620CATCTTCAACGGCTGCCATG59.920217
KSSR79Cluster-12086.30425p3(GAG)515AAACCAGCAGACCTTTCAGT57.26320GTTGGCAGAGTGAAGGGTGA59.89120229
KSSR95Cluster-12086.9979p2(CT)612ACGTGAGTTCCATCAGCCAA59.60420AGCGTGCACTTAAACGGGTA59.96620228
KSSR111Cluster-12086.3242p4(ATAC)520AACTGGTGGTGCTCTGATGG59.96320CCAACAACTATGCACTGGACG59.53521246
Table 5. Genetic diversity of nine EST-SSR markers.
LocusNNaNeGenotype NoMajor Allele FrquencyIHoHePICF
KSSR59302.0001.10530.950.1990.0330.0950.09048750.649
KSSR74292.0001.99120.5344827590.6910.9310.4980.373808112−0.871
KSSR91294.0001.28050.8793103450.4640.1030.2190.2063667060.527
KSSR102206.0003.17580.51.4170.3500.6850.6497828130.489
KSSR118302.0001.14220.9333333330.2450.0000.1240.1167012351.000
KSSR70303.0001.10630.950.2300.0670.0960.0936035490.306
KSSR79295.0002.06970.6551724140.9780.4480.5170.4692199780.132
KSSR95243.0001.13530.93750.2740.0420.1190.1151074070.650
KSSR111284.0001.11540.9464285710.2680.1070.1030.101601953
Mean27.666666673.4441.5694.1111111110.8095808250.5290.2310.2730.246297695
Table 6. Pairwise genetic similarity coefficient matrix for 30 kenaf germplasm materials.
S128S100S101S102S103S104S105S106S107S108S109S110S111S112S113S114S115S116S117S118S119S120S121S122S123S124S125S126S127
S100
S1010.5714
S1020.53850.4667
S1030.61540.66670.5833
S1040.90.50.46150.6364
S1050.30.18180.33330.3750.375
S1060.63640.58330.50.72730.54550.3333
S1070.72730.63640.70.81820.77780.3750.7
S1080.69230.57140.53850.81820.72730.40.71
S1090.66670.46670.66670.80.58330.20.710.6667
S1100.57140.46670.66670.81820.58330.27270.710.69231
S1110.69230.46670.53850.750.72730.30.63640.90.69230.81820.8333
S1120.57140.57140.66670.90910.58330.30.80.90.69230.81820.83330.6923
S1130.66670.58330.63640.750.70.3750.63640.90.90.88890.90.81820.8182
S1140.50.58330.50.69230.70.33330.63640.66670.66670.70.66670.61540.750.6154
S1150.61540.50.58330.81820.63640.30.710.750.72730.750.750.750.90.6667
S1160.750.61540.58330.81820.80.44440.710.90910.72730.750.750.750.90.66670.8182
S1170.750.61540.58330.81820.80.44440.710.90910.72730.750.750.750.90.66670.81821
S1180.66670.72730.63640.90910.70.3750.80.90.90.88890.90.818210.81820.750.90.90.9
S1190.72730.63640.70.81820.77780.3750.711110.90.90.90.66671110.9
S1200.750.61540.58330.81820.80.44440.710.90910.72730.750.750.750.90.66670.8182110.91
S1210.64290.76920.50.90910.66670.40.80.90.76920.61540.64290.64290.76920.81820.750.69230.83330.833310.90.8333
S1220.61540.40.46150.66670.80.30.54550.80.61540.72730.750.90910.61540.72730.66670.66670.66670.66670.72730.80.66670.5714
S1230.61540.61540.46150.81820.80.44440.70.80.750.58330.61540.61540.750.72730.81820.66670.81820.81820.90.80.81820.83330.6667
S1240.53850.58330.50.750.54550.3750.63640.72730.72730.70.72730.66670.81820.66670.61540.72730.72730.72730.81820.72730.72730.81820.58330.7273
S1250.69230.57140.53850.750.72730.44440.63640.90.83330.66670.69230.69230.69230.81820.61540.750.90910.90910.81820.90.90910.76920.61540.750.8182
S1260.43750.35290.50.61540.42860.27270.50.72730.53330.61540.64290.53330.64290.66670.50.69230.57140.57140.66670.72730.57140.50.46670.46670.81820.6429
S1270.50.45450.36360.60.40.20.60.55560.55560.55560.55560.50.66670.50.50.55560.55560.55560.66670.55560.55560.66670.40.55560.8750.66670.6667
S1280.64290.64290.50.750.66670.40.63640.90.76920.61540.64290.64290.64290.81820.61540.69230.83330.83330.81820.90.83330.84620.57140.69230.66670.76920.50.5
S1290.58330.63640.54550.90.60.50.77780.80.80.77780.80.72730.90.80.66670.80.80.80.90.80.80.90.63640.80.72730.72730.58330.5556
Disclaimer/Publisher’s Note: The statements, opinions and data contained in all publications are solely those of the individual author(s) and contributor(s) and not of MDPI and/or the editor(s). MDPI and/or the editor(s) disclaim responsibility for any injury to people or property resulting from any ideas, methods, instructions or products referred to in the content.