Article

Chernozem Land Use Differentiation by Temperature-Dependent IR Spectra

by
Mikhail A. Proskurnin
1,*,
Dmitry S. Volkov
1,2,
Yaroslav V. Timofeev
1,
Dmitry S. Fomin
3 and
Olga B. Rogova
1,2
1
Chemistry Department, M.V. Lomonosov Moscow State University, Leninskie Gory, 1-3, GSP-1, 119991 Moscow, Russia
2
Department of Chemistry and Physical Chemistry of Soils, V.V. Dokuchaev Soil Science Institute, Pyzhevsky per., 7/2, 119017 Moscow, Russia
3
Laboratory of Digital Twins of Agrolandscapes, V.V. Dokuchaev Soil Science Institute, Pyzhevsky per., 7/2, 119017 Moscow, Russia
*
Author to whom correspondence should be addressed.
Agronomy 2023, 13(8), 1967; https://doi.org/10.3390/agronomy13081967
Submission received: 7 July 2023 / Revised: 21 July 2023 / Accepted: 24 July 2023 / Published: 26 July 2023

Abstract

:
Granulometric aggregate fractions (20 µm–2 mm) of chernozem soils with different agriculture-use histories (native steppe, permanent bare fallow, arable land, and shelterbelt) were investigated in mid-IR and far IR regions (4000–100 cm−1) by heating in the air from 25 to 215 °C, using ATR FTIR and linear discriminant analysis to differentiate the land-use samples without chemical perturbation. The temperature dependences of the band maxima significantly differed for bands of silicate matrix and bands with the contribution of soil organic matter and were more stable to experimental conditions compared to the absolute positions. The thermal behavior of the integral intensities of the IR bands at 790–750 cm−1 and 440–420 cm−1 that was different compared to pure quartz, may be attributed to –C–H bending of alkanes and (poly)aromatic structures and skeletal bending, and could be used to distinguish intact soils from agriculturally used samples. The different temperature behaviors of the bands for fractions of soils with different land use are shown, with the maximum difference in fractions below 20–50 µm and medium fractions (50–200 µm). Changes in the band-maximum frequencies and the integral intensities of the bands were reversible for a heating–cooling cycle. The linear discriminant analysis of the spectra obtained for granulometric fractions of chernozem soils made it possible to separate the samples of native steppe, arable land, bare fallow, and shelterbelt with a high probability based on the type of vegetation and agrogenic load, mainly on the basis of the spectral ranges associated with biogenic forms of quartz and phytoliths.

1. Introduction

Apart from the bulk properties of soils, knowledge of the anthropogenic and agrogenic effects on their physicochemical properties are relevant [1,2,3,4]. Some of these challenges are related to soil fractional and structural composition at mesoscale and microaggregate levels [5,6]. In turn, this requires the investigation of soils as complex samples comprised of minerals, other inorganic compounds, and organic matter with a broad particle size distribution [7,8] at the level of their molecular structures and molecular descriptors, including soil organic matter (SOM), in particular humic substances, as well as inorganic constituents of whole soils and soil aggregates [9,10].
Complex chemical and structural analysis and highly informative methods are needed for solving these problems. FTIR spectroscopy is a valuable non-destructive method for studying soils, but despite its versatility, this method is conventionally applied to the qualitative composition of functional groups of SOM and soils [11,12,13,14,15,16,17]. However, vibrational spectroscopy is based on the chemical bonds in substances and compounds and their interconnection; thus, an external perturbation that changes these bonds provides a larger volume of information with high selectivity. Among the approaches in IR spectroscopy that employ these features are correlation IR spectroscopy [18,19,20,21,22] and temperature-based IR measurements [23,24,25,26,27]. Temperature trends of IR spectra expose shifts in band parameters (intensities and positions) that are connected with the specific character of groups, species, and structures of the sample under study [23]. Such changes in IR spectra upon heating or cooling make it possible to increase the information volume by revealing several transformations (structural and phase transitions, polymorphic changes and changes in intramolecular interactions) [23,24].
Previously, we applied the temperature dependences of IR spectra to differentiating humic substances of various origins and characterizing bands of crystalline and amorphous silica and SOM [27,28]. However, along with the difficulties associated with the superposition of IR spectral bands intrinsic to any multicomponent object with complex composition, serious problems in the case of soils are associated with the overlapping of bands in significant spectral ranges, especially SOM, with bands of water, which are present in soils in various amounts and in all possible forms and states. The use of heating to a temperature that does not have a significant effect on the structure of the SOM, but at the same time makes it possible to gradually remove the effects of water due to targeted gradual dehydration, may give the maximum possible characteristics of the material composition of the fractions, determine their diagnostic role in indicating agrogenic changes, and without exposure to aggressive chemical agents or decomposition. Also, quantitative preparative fractionation is a versatile tool [29,30] as it is a non-destructive physical separation that does not change the composition of soil and soil aggregates at the molecular level, which is relevant for the differing compositions of both the SOM and the mineral matrix [9,10,31,32].
Chernozem is one of the most agriculturally demanded soils worldwide, with strong changes in primary structures on cultivation [33,34], and requires sample preparation for absorption-spectroscopy methods. Samples (native mown steppe, annually cultivated arable land, shelterbelt plantation, and permanent bare fallow) from long-term field research sites were selected. These samples are located in areas of intensive agricultural land use and confined to different ecosystems and land uses. They provide a set of soil variants that are subject to varying degrees of anthropogenic influence and various types of degradation processes. Chernozems in these areas were treated as arable land for dozens, if not hundreds of years before changing to forest plantations. Thus, the changes that have occurred in the profile of chernozem under shelterbelts allows us to consider them as the result of a natural-anthropogenic experiment that began at the time of planting shelterbelts and to compare them with the native steppe soil, making it possible to trace the direction of changes. Such processes are evident in the reduction of organic carbon [35,36], changes in the C/N ratio in the SOM composition [37] and its structure [38].
Based on the results of previous studies on the origins and mechanisms of degradation of the aggregate structure of chernozems and, in general, their physical properties [39,40], and from the generalization and reinterpretation of the existing data, it is clear that the integral effect of degradation processes is a new quality of the material composition of the solid phase of soils [41]. The results of field and laboratory studies revealed significant differences in the morphology and water-related physical properties of chernozem soils [42,43]. Increased density from addition, penetration resistance, and low filtration capacity of arable chernozems is a consequence of the degradation of their aggregate structure [44,45]. A deficiency in the fresh supply of organic matter into arable soils and the mineralization of organic components in aggregates lead to their destruction due to proppant pressure resulting from a violation of the natural balance of the hydrophobic–hydrophilic properties of the surface of the solid phase [46,47]. In turn, low values of soil density under natural vegetation (shelterbelts and mowed native steppe) and failed filtration capacity are associated with a high degree of aggregation of mineral mass [48,49]. Considering that the chernozem under the shelterbelt was previously arable land for a long time, the regular inflow of fresh organic matter to the mineral horizons led to the restoration of its aggregate structure.
At the same time, the question remains open about the similarity or differences in the material composition of the formed SOM, depending on the type of vegetation growing, the potential resistance of this to anthropogenic influences, which will affect the stability of the restoration of degraded soils. FTIR spectroscopy with sample heating is the method that can shed light on the problem of detecting such differences both at the level of the material composition of the SOM and, as it turned out unexpectedly, at the level of subtle changes in the silicate part. These changes are not detected by traditionally used methods of chemical or mineralogical (X-ray diffraction analysis of clay minerals) and may show changes in the state of chernozems.
Thus, we used temperature-dependent IR spectroscopy in a broad spectral range (mid-IR and far IR regions, 4000–100 cm−1) along with chemometric data analysis for chernozem size fractions to differentiate the different land use samples without chemical perturbation.

2. Materials and Methods

2.1. Soils

Typical chernozems (heavy silty–clay loam) were sampled from the sites of Kursk Research Institute of Agricultural Production and V.V. Alekhin Tsentralno-Chernozemny Nature Reserve, Russia (51°34′13.6″ N 36°05′23.1″ E). The topsoil (0–10 cm) samples maintained without changes since 1964 were taken: (1) natural-vegetation steppe, uncultivated for several centuries, annually mown; (2) annually cultivated arable land over the steppe at the same location as sample 1, with mineral fertilizers under permanent wheat; (3) annually plowed permanent bare fallow; and (4) shelterbelt plantation on the former arable land at the same location as sample 3 (the structure is being restored due to forest vegetation, high structural indicators [48]); more details are given in [32,50]. For comparison, pure quartz sand fraction of 10–50 μm was used. Sample preparation procedures are reported in detail elsewhere [22,32,51].
Common properties of all the samples: A + AB1 humus horizon, 105–130 cm; the arable layer (0–30 cm) bulk density, 1.20–1.25 g/cm3 [40]. Main matrix minerals: quartz (35–40% w/w) and illites and smectites (both, 12–15% w/w). Total organic carbon is 4–6% w/w. The detailed sample descriptions are given elsewhere [31,32,50,51].
Wet-sieving fractionation of the averaged soil samples and quartz was performed using an AS 200 vibratory sieve shaker (Retsch, Haan, Germany) with ultramicro sieves of 20, 30, and 40 μm (Precision Eforming LLC, Cortland, NY, USA) and precision sieves of 50, 63, 71, 80, 90, 100, 200, 250, 500 μm, and 1 mm (all from Retsch). More details are given in [31]. Due to similarities, the combined fractions were used: below 20 μm, below 50 μm, 20–30, 20–40, 40–50, 50–100, 100–200, 200–250, 250–500 μm, 0.5–1 mm, and over 1 mm.

2.2. IR Measurements and Data Handling

A single-beam Vertex 70 IR Fourier spectrometer (Bruker Optik GmbH, Ettlingen, Germany) with a globar source, a wide-range silicon beamsplitter and an uncooled DLaTGS pyroelectric detector was used throughout. A diamond-crystal GladiATRTM single-reflection ATR (Pike Technologies, Madison, WI, USA) and a PrayingMantis™ diffuse reflection (Harrick Scientific Products, Inc., Pleasantville, NJ, USA; beamsplitter, KBr) accessories were used. The spectrometer and accessories were constantly purged with a dry-air flow (500 L/h, a dew point of −70 °C) from a PG28L purge gas generator (PEAK Scientific, Glasgow, UK). The common measurement parameters were: double-sided, forward–backward acquisition mode; range, 4000–100 cm−1; resolution, 2 cm−1; scanner velocity, 10 kHz; sample and background scan numbers, 128; aperture, 8 mm. The sample during measurements was in an ambient atmosphere at 23 ± 1 °C. The baseline was not corrected during measurements.
As a background, before acquiring temperature-dependent ATR spectra for each sample, an empty crystal at 25 °C was recorded. Heating was continuous at a rate of +0.25 °C/min; measurements were performed from 25 °C with a step of +2.5 °C. After reaching 215 °C, the sample was cooled to 25 °C at a rate of −0.25 °C/min with a measurement step of −2.5 °C. The temperature during each measurement at both heating and cooling stages changed by 1 °C or below.
The resulting sets of IR spectra were assembled into a full dataset and a set of spectra of an empty crystal from the same sample was subtracted from it. Next, the resulting set was processed by ATR correction (OPUS Software, Bruker Optik GmbH, Ettlingen, Germany). To improve the quality of ATR correction, the assembled set after background subtraction was divided into parts of 4000–2600 cm−1 and 1800–100 cm−1. The range of 2600–1800 cm−1 was not used, being dominated by artifact bands.
The built-in method for x-position (the maximum of absorption bands) was used (OPUS Software). The sensitivity parameter was selected within the range of 0.1–20%. Other details are given in [28,31,32,51]. For the integration of band areas, the method B (OPUS software) was used: a straight line between the manually interactively defined wavenumbers (band boundaries) is used, and the area between this line and the band shape is integrated automatically.
FTIR spectra were subjected to linear discriminant analysis (LDA) of variance [52]. Linear analysis of variance was performed in the R environment [53] using caret [54], MASS [55], and klaR [56] libraries. The results were visualized with the ggplot2 library [57]. The search for specific wavenumbers was performed by a stepwise algorithm of variable selection, which is based on maximizing the ability to separate. The ability to separate is based on the distances between membership vectors and the vector representing the corresponding assigned class corner [58]. The least improvement of performance was selected as 0.80. Stepwise variable selection was performed in 50-fold replication. The variables (wavenumbers) and their contribution to the classification, obtained by 50 cycles of the algorithm, were included in the list of specific wavenumbers in the IR spectrum.

3. Results

3.1. Band Assignment

The three-dimensional processed spectra are given in Figure S1, and corresponding spectral series are shown in Figures S2 and S3 (quartz), and Figure S4 for heating and cooling conditions, respectively (Supplementary Materials). For processing and interpretation, the soil fraction spectra in the whole IR range studied of 4000–100 cm−1 were divided: the range of hydrogen bonds (4000–3100 cm−1), CH stretch (3100–2800 cm−1), SOM (2000–1270 cm−1, extended compared to humic substances [27] to overtone bands), and SiO2 overtone (1270–650 cm−1) and fundamental vibration ranges (650–100 cm−1). These subranges corresponded to the dominating type of functional, matrix, or SOM structural groups; the divisions were described previously [28,31,32,51]. The range of 2800–2000 cm−1 was excluded as noninformative. These ranges were selected as suitable for comparing soil samples with mineral or heavily contaminated samples.
As anticipated, the range of 4000–3100 cm−1 (Table 1) was dominated by condensed-phase hydrogen-bond continua at 3520–3370 cm−1 (antisymmetric) and more resolved 3270 cm−1 (symmetric); at temperatures below 100–110 °C, the unresolved continuum was centered at 3350 cm−1. Bands in this range were weak and unresolved: the range at 3740–3600 cm−1 included stretching of unbonded SiO–H and hydrogen-bonded SiO–HOH2, amorphous species mainly [59,60,61].
The CH region showed low-intensity stretching bands of antisymmetric (barely visible in the majority of samples) at 2920 cm−1 and symmetric at 2850 cm−1, of methylene; the former was beyond the sensitivity of ATR FTIR for fractions above 20 µm. Other bands, 2650, 2450, and 2410 cm−1, were artifact bands of the ATR crystal and excluded from the assignment and further analysis.
In the SOM range, broad and unresolved bands were mainly found: a band at 1625 cm−1 was a covalent bond HO–H bending of free or weakly absorbed water [84] and also silicate-bonded water [59]. Symmetric carboxylate stretch appeared as a band at 1450–1365 cm−1 [85]. A weak band at 1265–1260 cm−1 was a quartz combination band, although it may have been an SOM manifestation (Table 1) [65]. A narrow weak band at 1775 cm−1 was the quartz combination band [68]; other counterparts of the characteristic triplet of SiO2 overtone bands at 2000–1990 cm−1 and 1880–1870 cm−1 were poorly visible.
In the SiO2 overtone range, the bands at 1220, 797, 775, and 697 cm−1 belong to the quartz lattice [32,70]. The bands at 1175 cm−1 and 1120–1070 cm−1 were O–Si–O stretch in crystalline as well as amorphous SiO2 species; bands at 1120, 1037, 1000, and 930–910 cm−1 were amorphous SiO2 O–Si–O stretch [69] (the latter was not present in quartz samples). Weaker bands at 830 and 750–740 cm−1 can be assigned to Al–OH [75] or SOM (polyaromatic compounds) [77]. Broad bands at 720–710 and 650 cm−1 were probably water librations [76,80], –C–H bending vibrations [81], or joint C–H vibrations of alkanes [78].
In the fundamental SiO2 region, bands also corresponded to the quartz lattice [32,69,70]: 535, 513, 460, 445, 430–420, 394, 368–364, and 262–258 cm−1 (for the latter two frequencies, the maximum varied from sample to sample). Bands at 450 and 430–420 cm−1 may include C–C–C bending vibrations [86]. Vibrations of silicate-based minerals were at 303 and 279 cm−1.

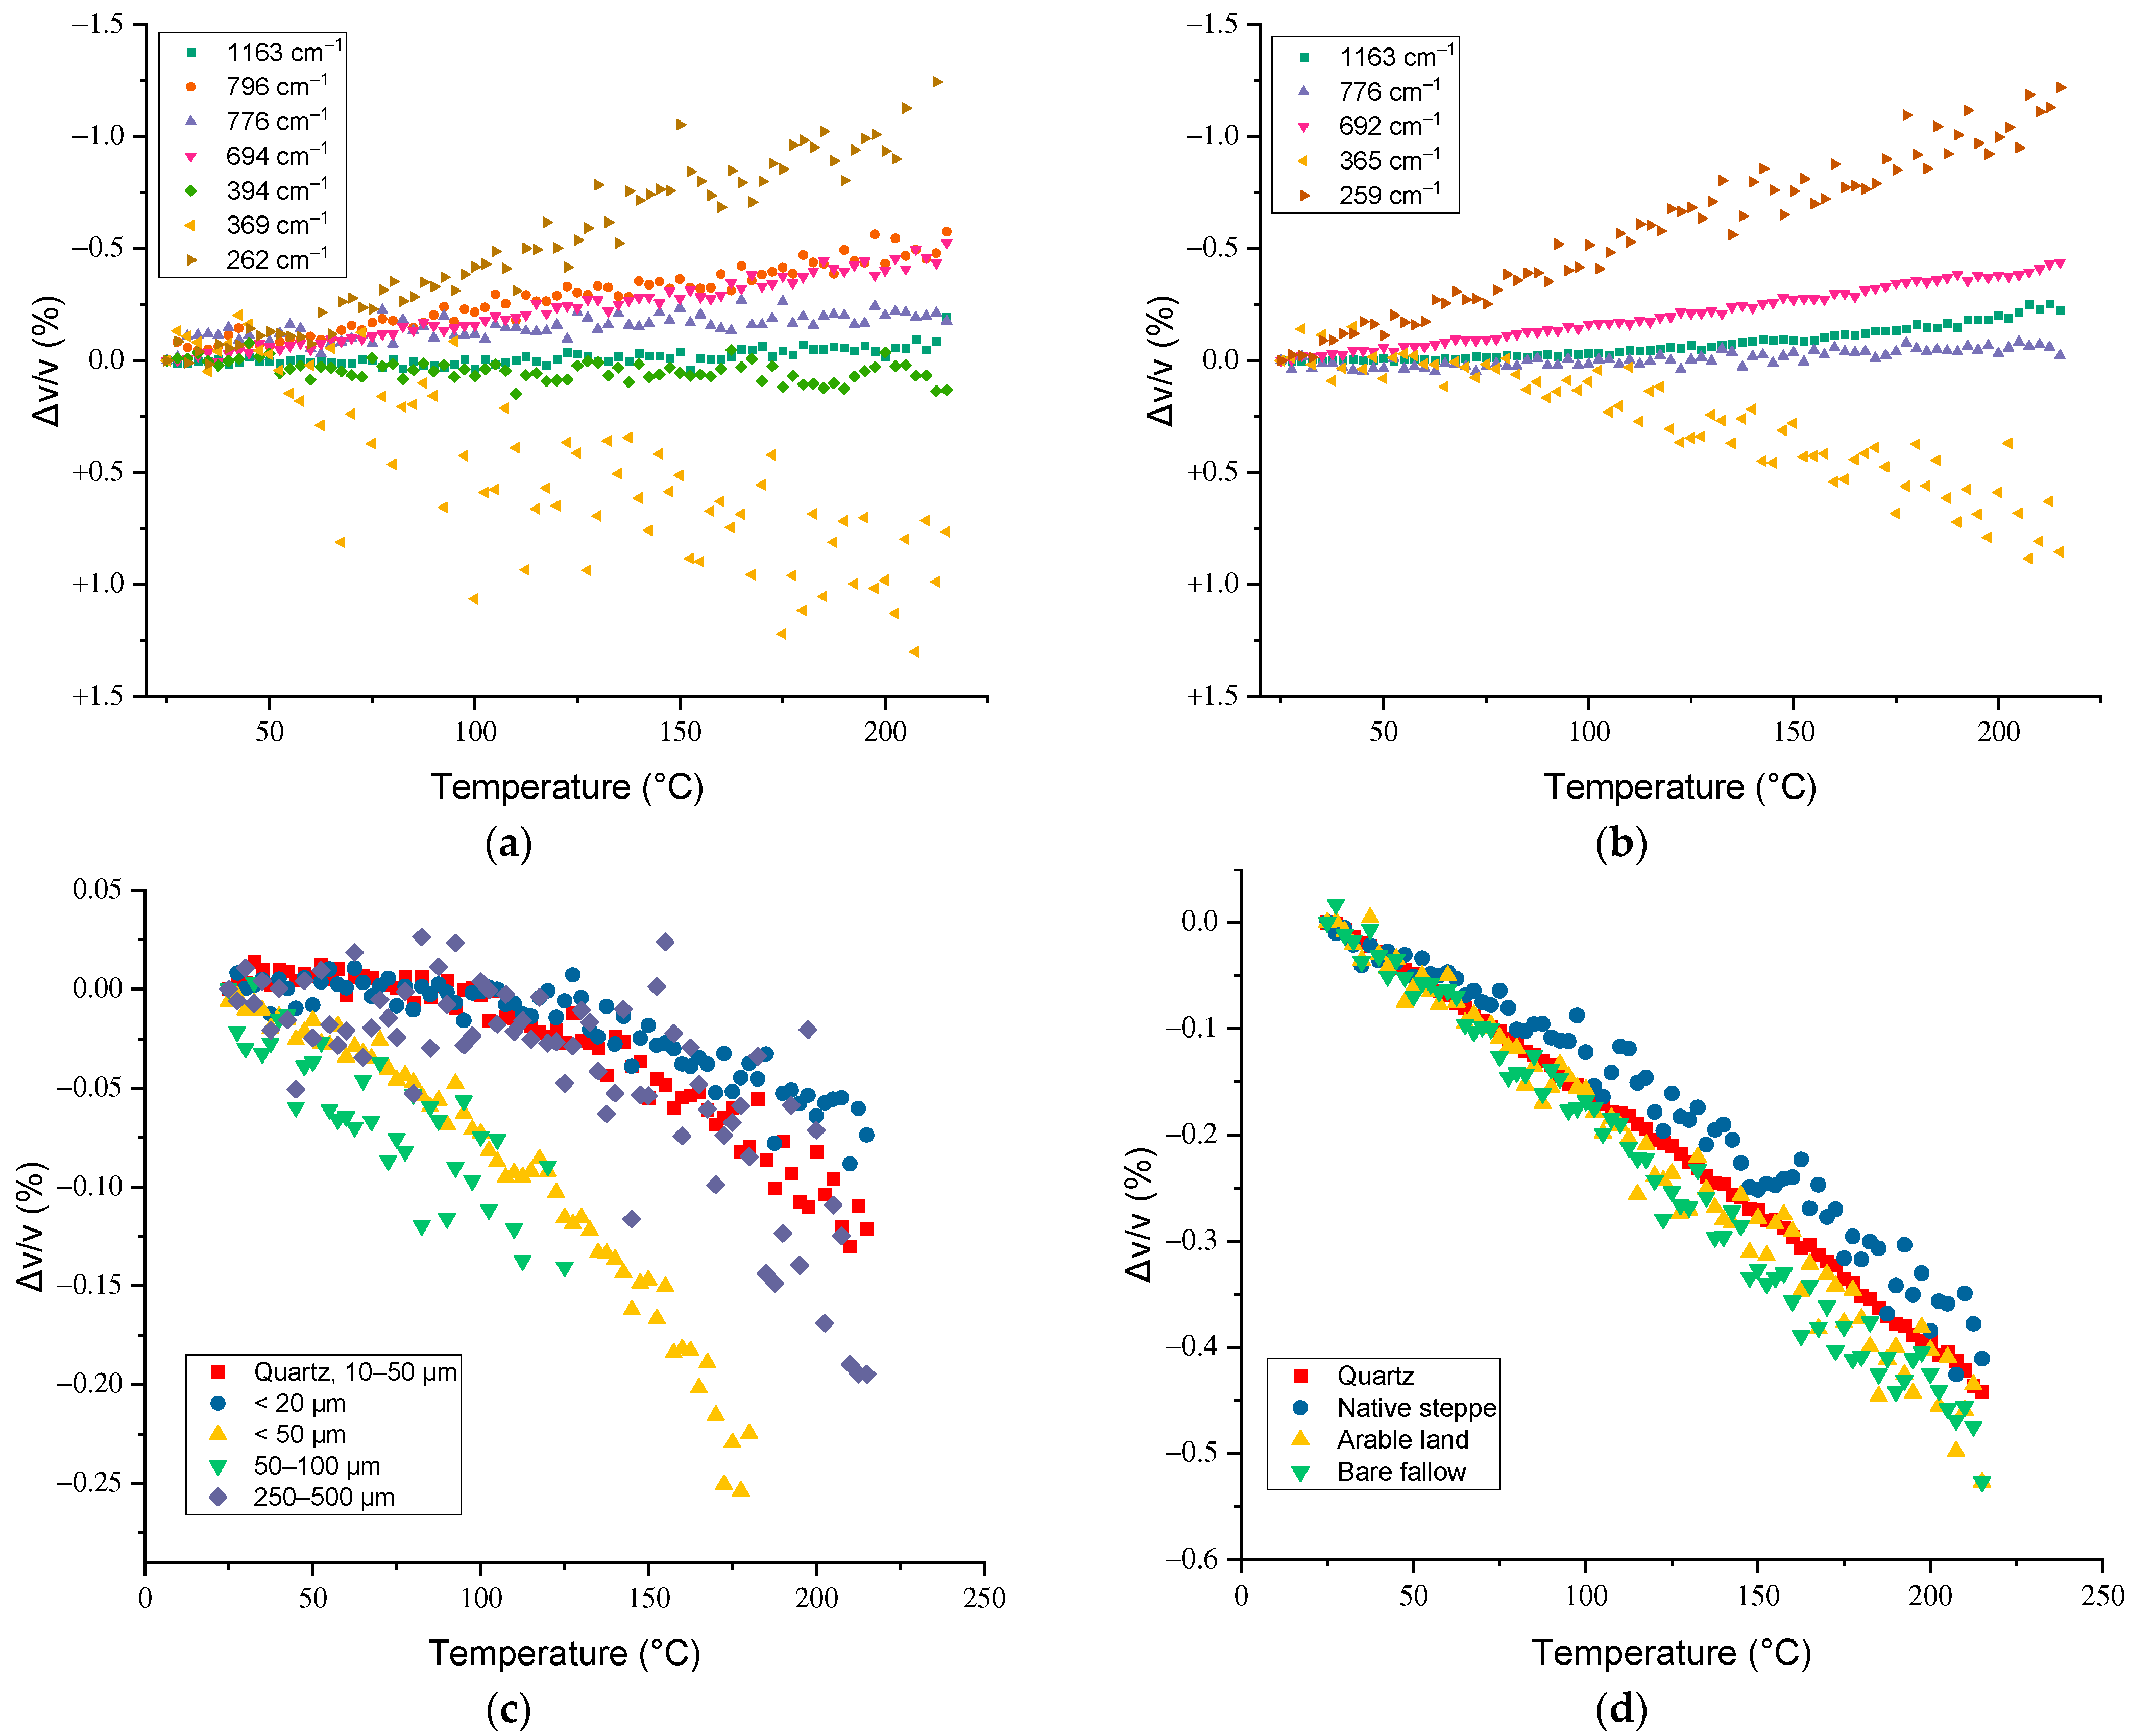
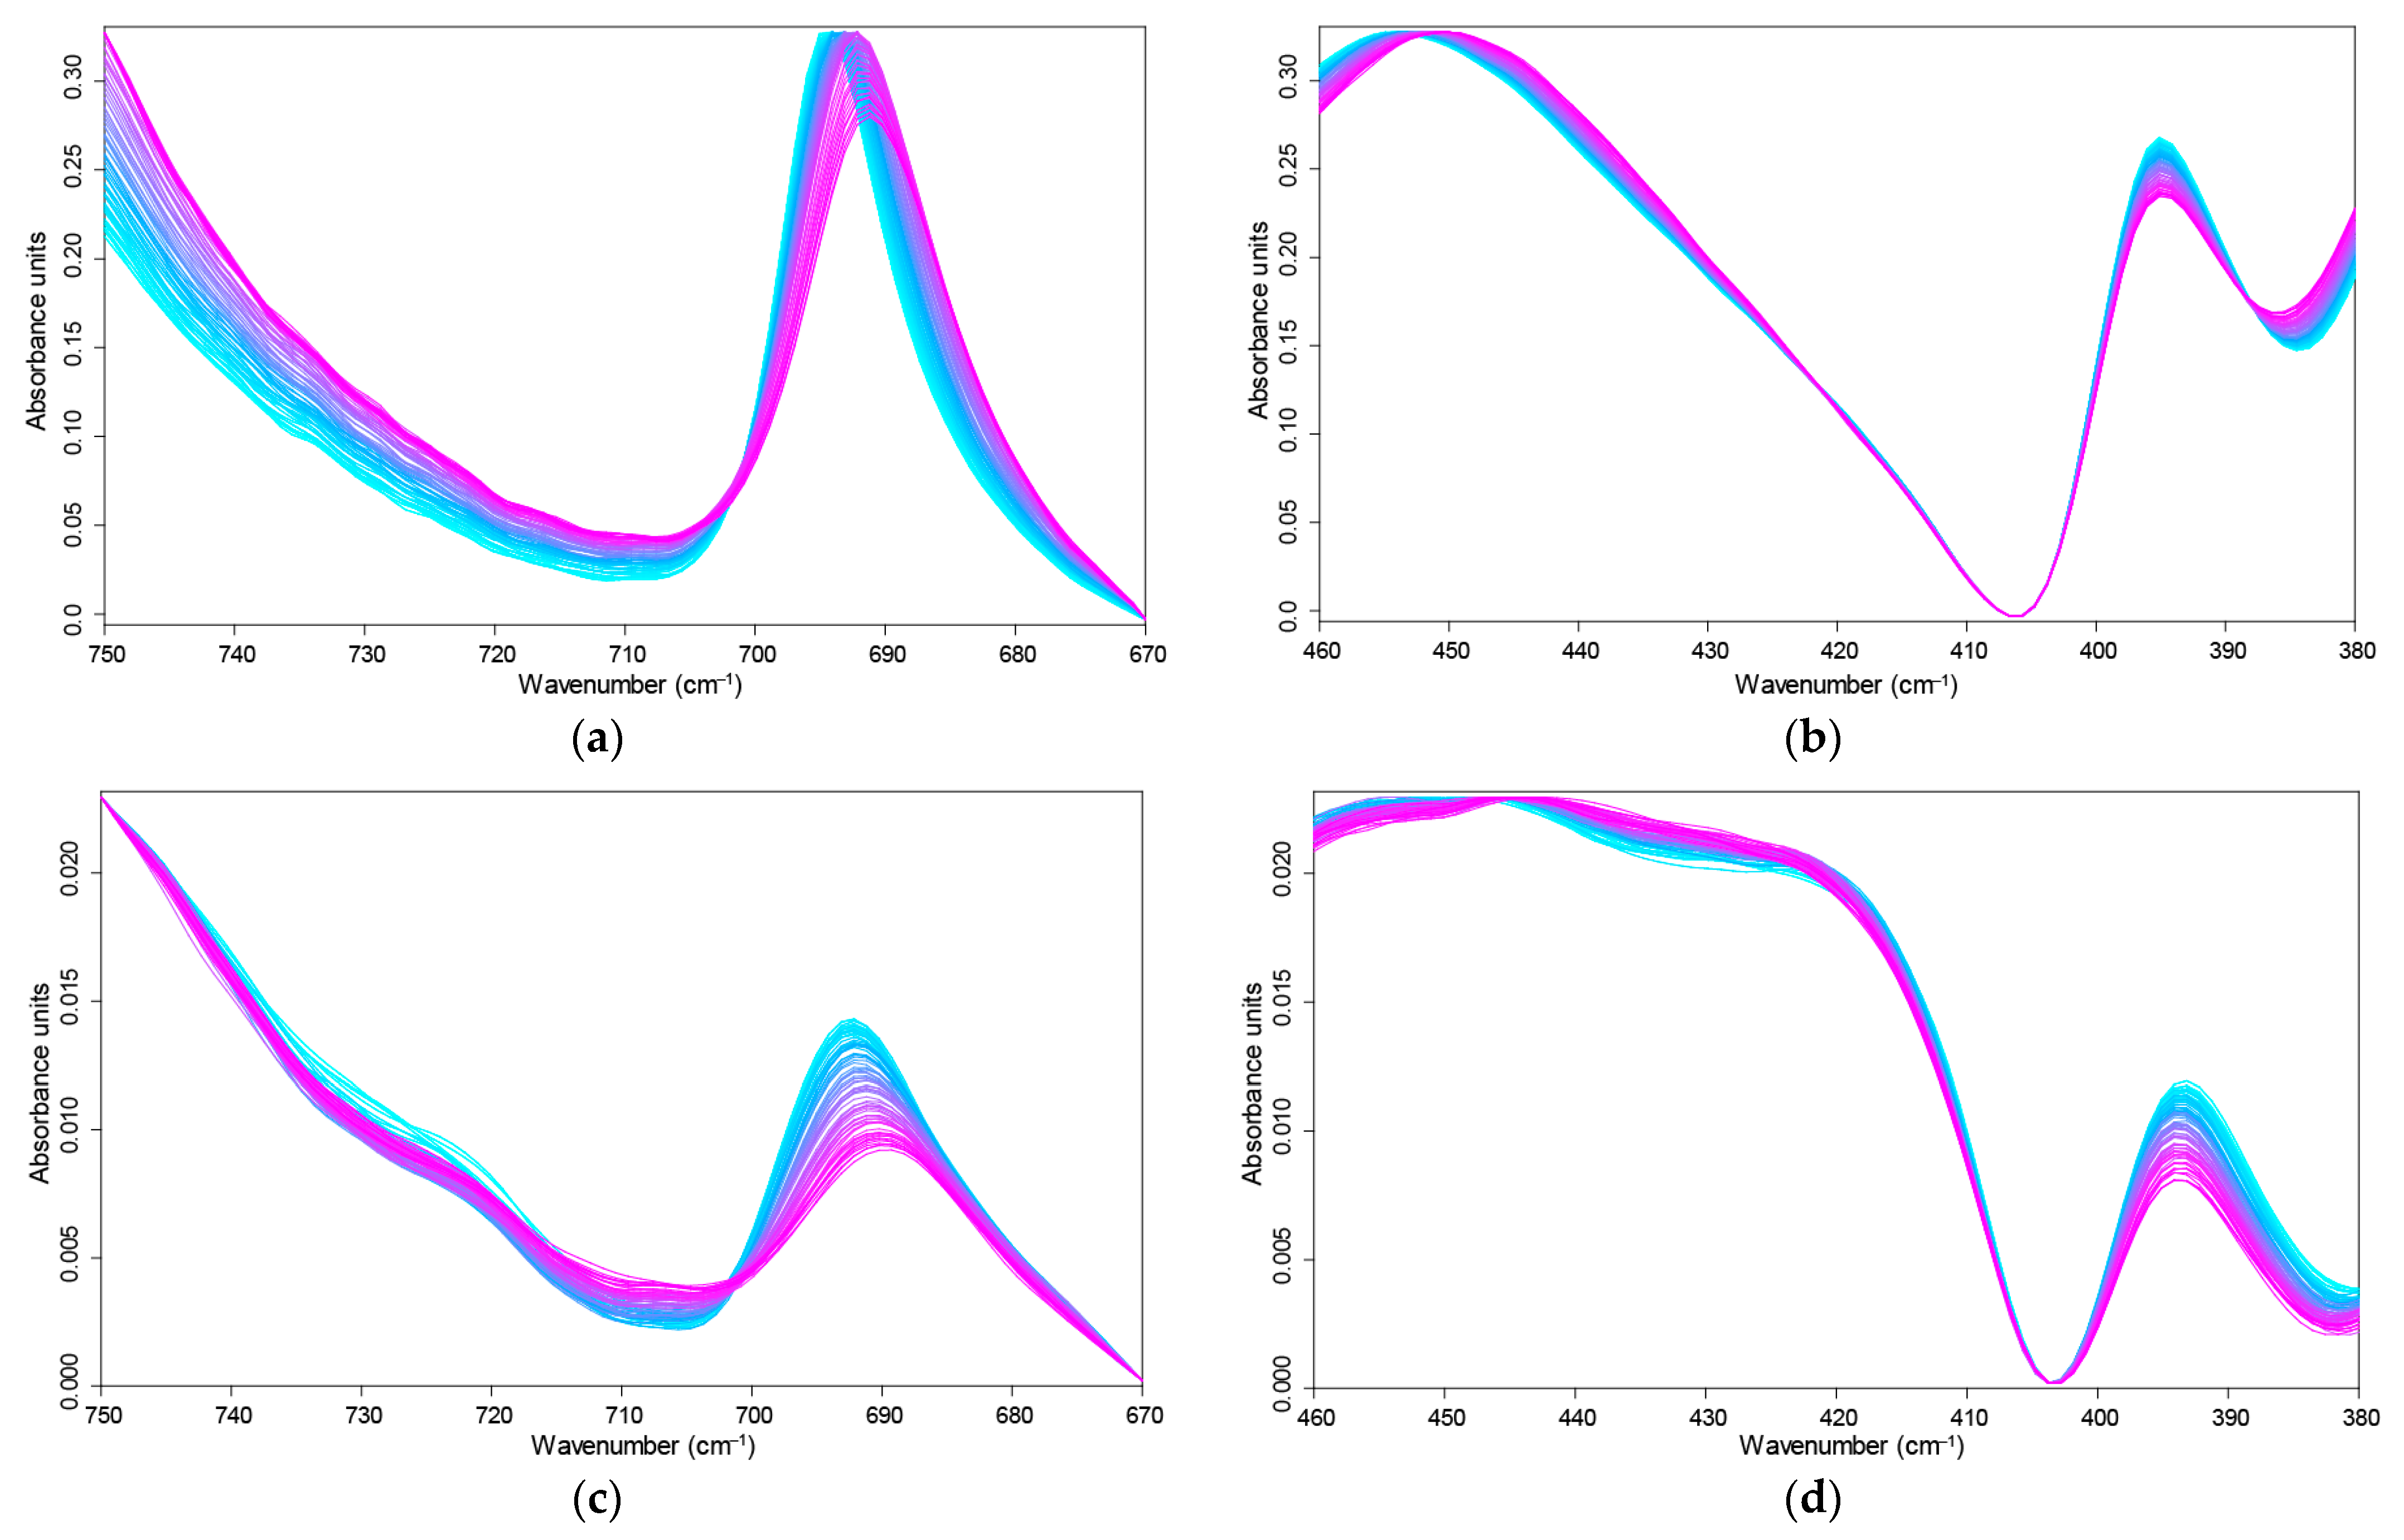
3.2. Temperature Dependences of Band Maxima

Changes in spectra with temperature are summed up in Figures S1 and S2 (Supplementary Materials). As for humic substances separated from brown coal [28] and the same chernozem soil [27], frequency shifts of band maxima were reversible upon heating to 215 °C; when heated and then cooled, the frequencies of all the bands were restored to their values at 25 °C without a hysteresis (Figure S5a, Supplementary Materials). However, it should be noted that this behavior is reliably attained only for bands assigned to quartz and other inorganic-matrix constituents due to the high intensities of these bands.
In the region of 4000–3100 cm−1, no significant changes in maximum frequencies were found (Table 1). This behavior is similar to humic substances separated from this type of soil [27]. Bands corresponding to C–H of methylene (2920 and 2850 cm−1) were too weak to find a reliable shift, so the comparison with separated humic substances was not possible.
Weak bands corresponding to overtones of quartz bands (1845 and 1790–1775 cm−1) and the broadband at 1450 cm−1 did not experience a shift in the maximum frequency. The absorbed-water band (1625 cm−1) demonstrated a blueshift of ca. +2 cm−1, which was larger than the value for humic substances isolated from the same soil (+0.5 cm−1) [27]. This difference may be accounted for by a larger amount of water in soils and the complex character of this band in soils, which involves SOM bands resolved in the IR spectra of humic substances [87].
In the SiO2 overtone region (1270–650 cm−1), lattice vibrations of quartz or other inorganic matrix constituents of chernozem showed significant and similar redshifts of −(0.1–1)%, Figure 1a,b, and Figure S6 (Supplementary Materials). This agrees with the data for residual silicate found in humic substances samples isolated from chernozem [27]. The bands at 1163 and 775 cm−1 exhibited smaller redshifts compared to other bands assigned to quartz (797, 695, and 262–258 cm−1). For a band at 695 cm−1, the dependence was similar to the thermal behavior of this band for humic substances separated from brown coal [28] and chernozem [27].
For a band at 1163 cm−1 [70], the thermal behavior was similar to changes characteristic to quartz lattice [88]. It was achieved for small (below 20 μm) and large fractions (over 250 µm), while medium fractions showed a more substantial redshift, Figure 1c,d. This may be a result of organic-matter contribution or the more cracked mineral matrix of the soil samples compared to quartz structures [68,88].
The exceptions from the redshift behavior were the bands at 394 and 368–364 cm−1, which experienced blueshifts of +0.05% (significantly different from unshifted bands in quartz) and +1% (Figure 1a), respectively. A band at 394 cm−1 changed mostly at temperatures below 100 °C, which may have been a manifestation of water libration bands [83]. A band at 830 cm−1 was a weak shoulder band with a blueshift of +1 cm−1. This behavior was the same as for this band in humic substances isolated from this soil [27].
The temperature dependences of bands at 795, 776, 695, 368–364, and 262–258 cm−1 were the same as for quartz samples, Figure 1a and Figure S6 (Supplementary Materials). Bands below 250 cm−1 were not shifted.

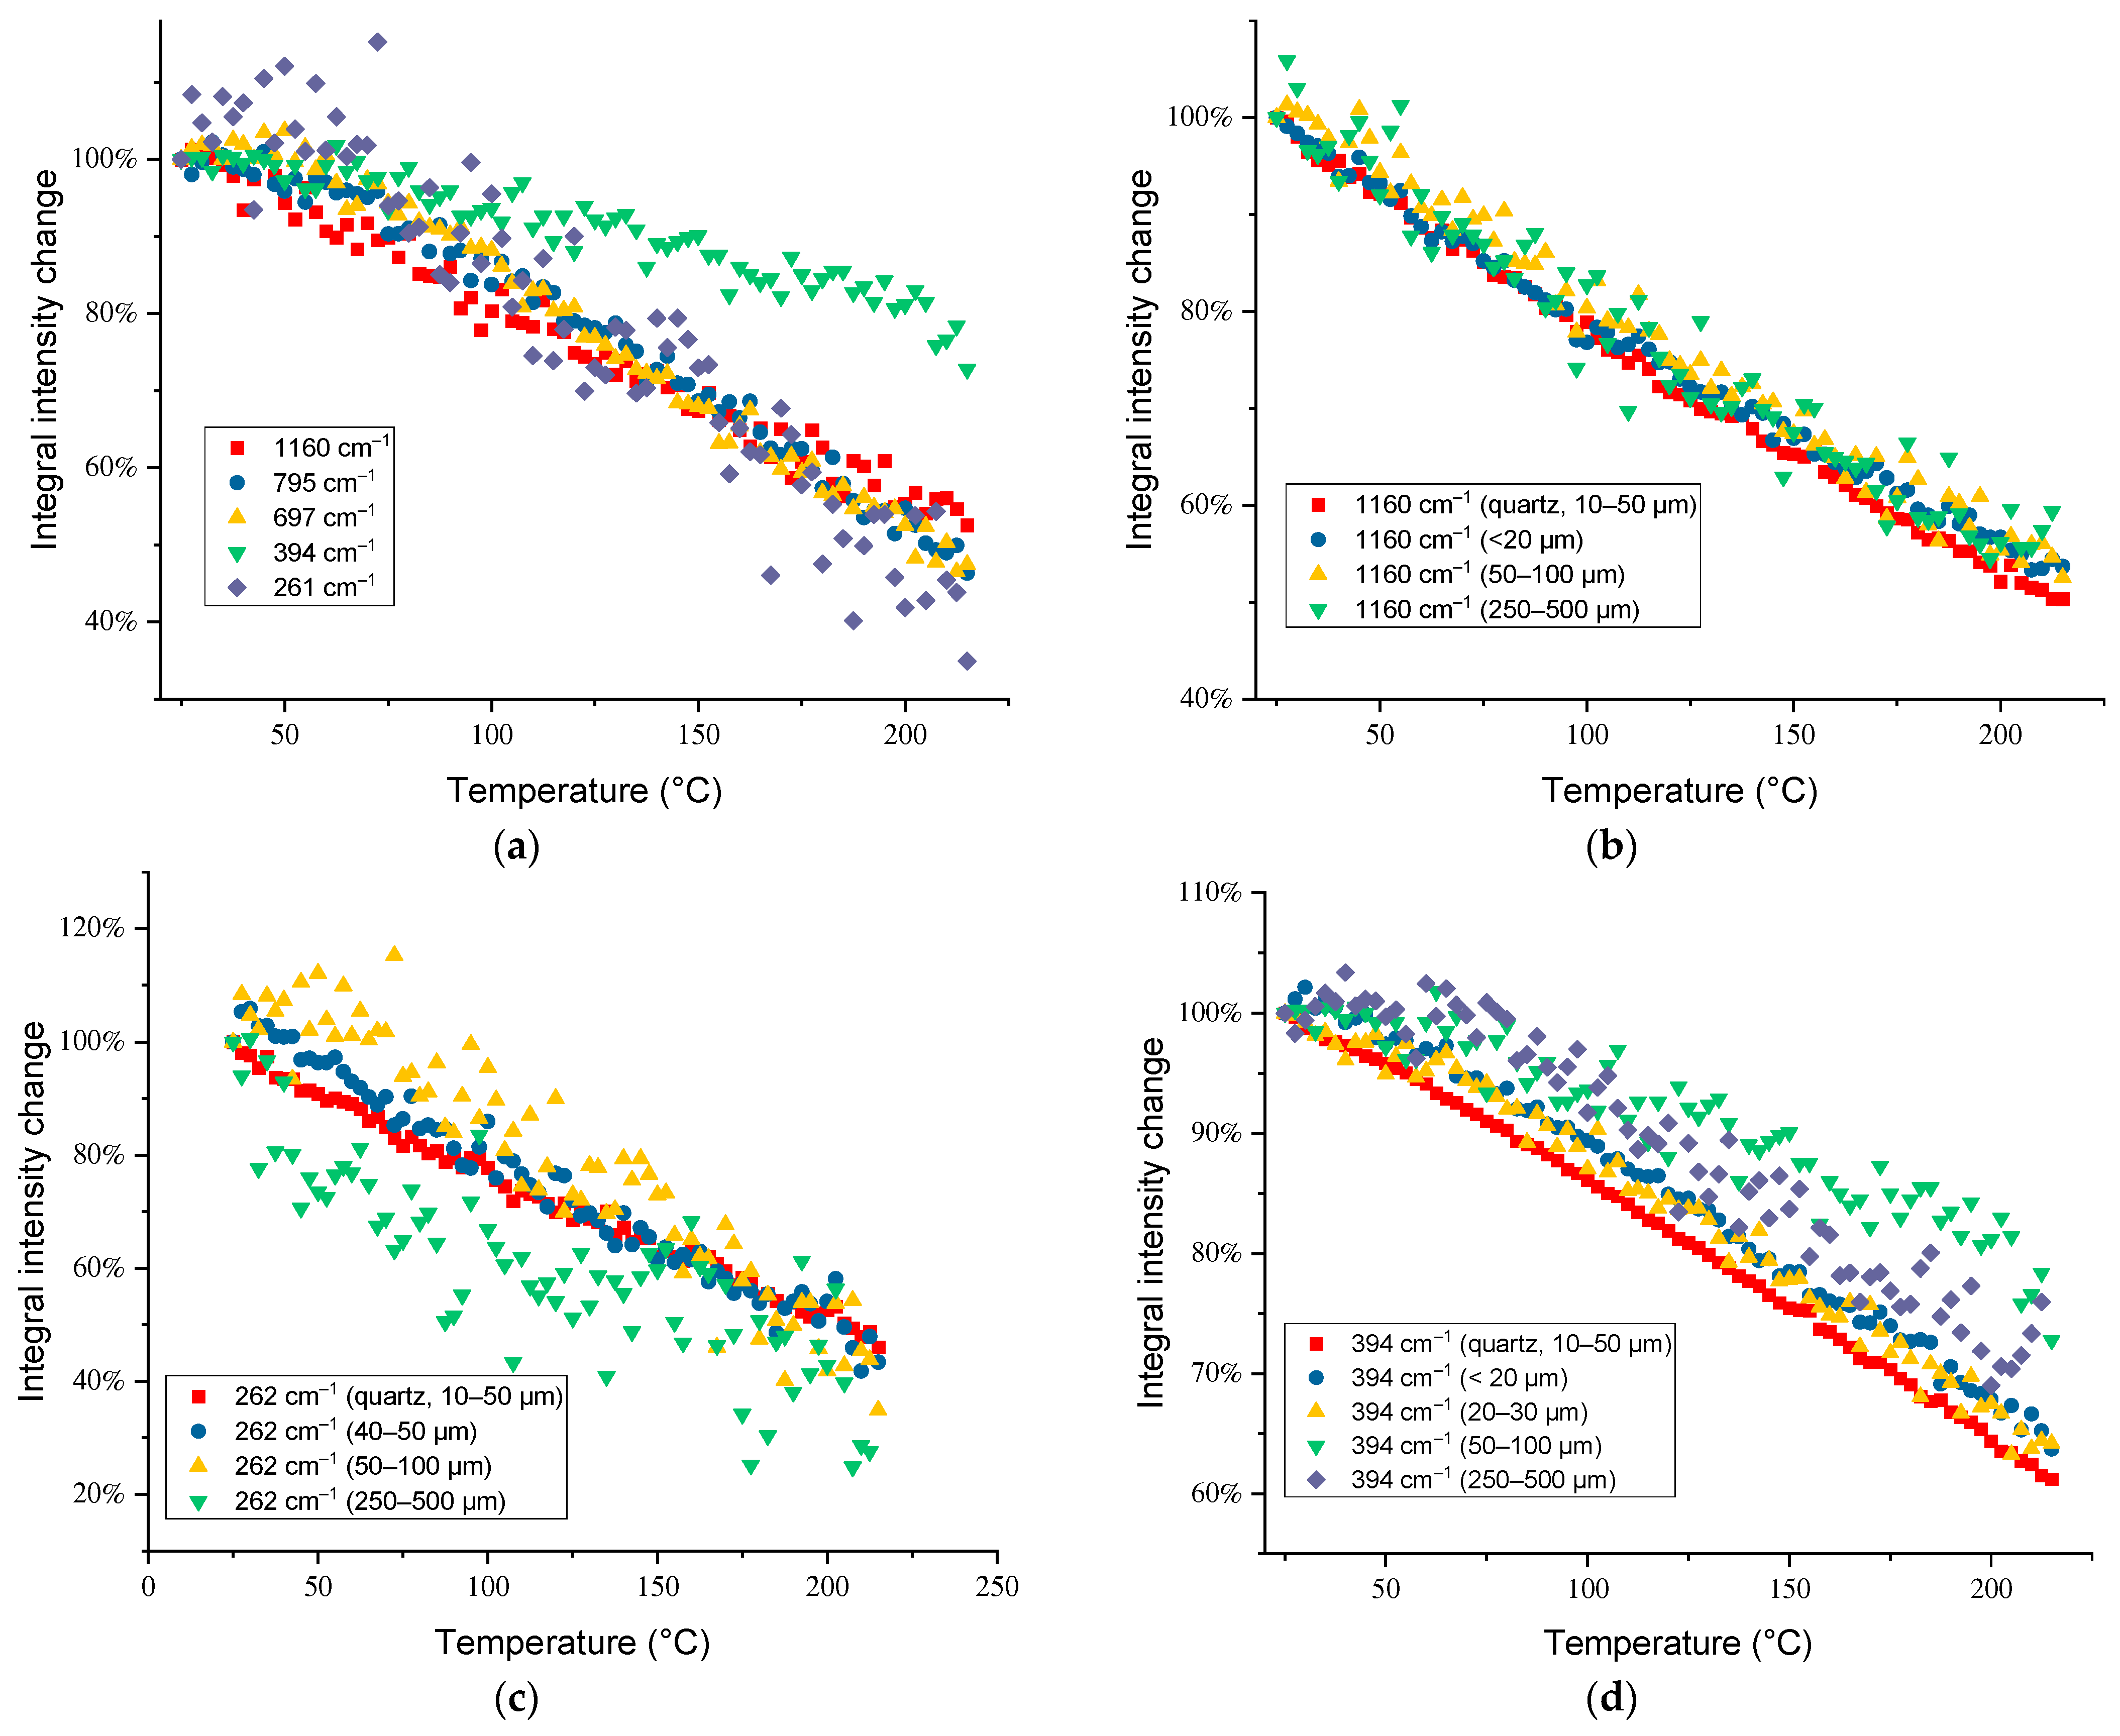
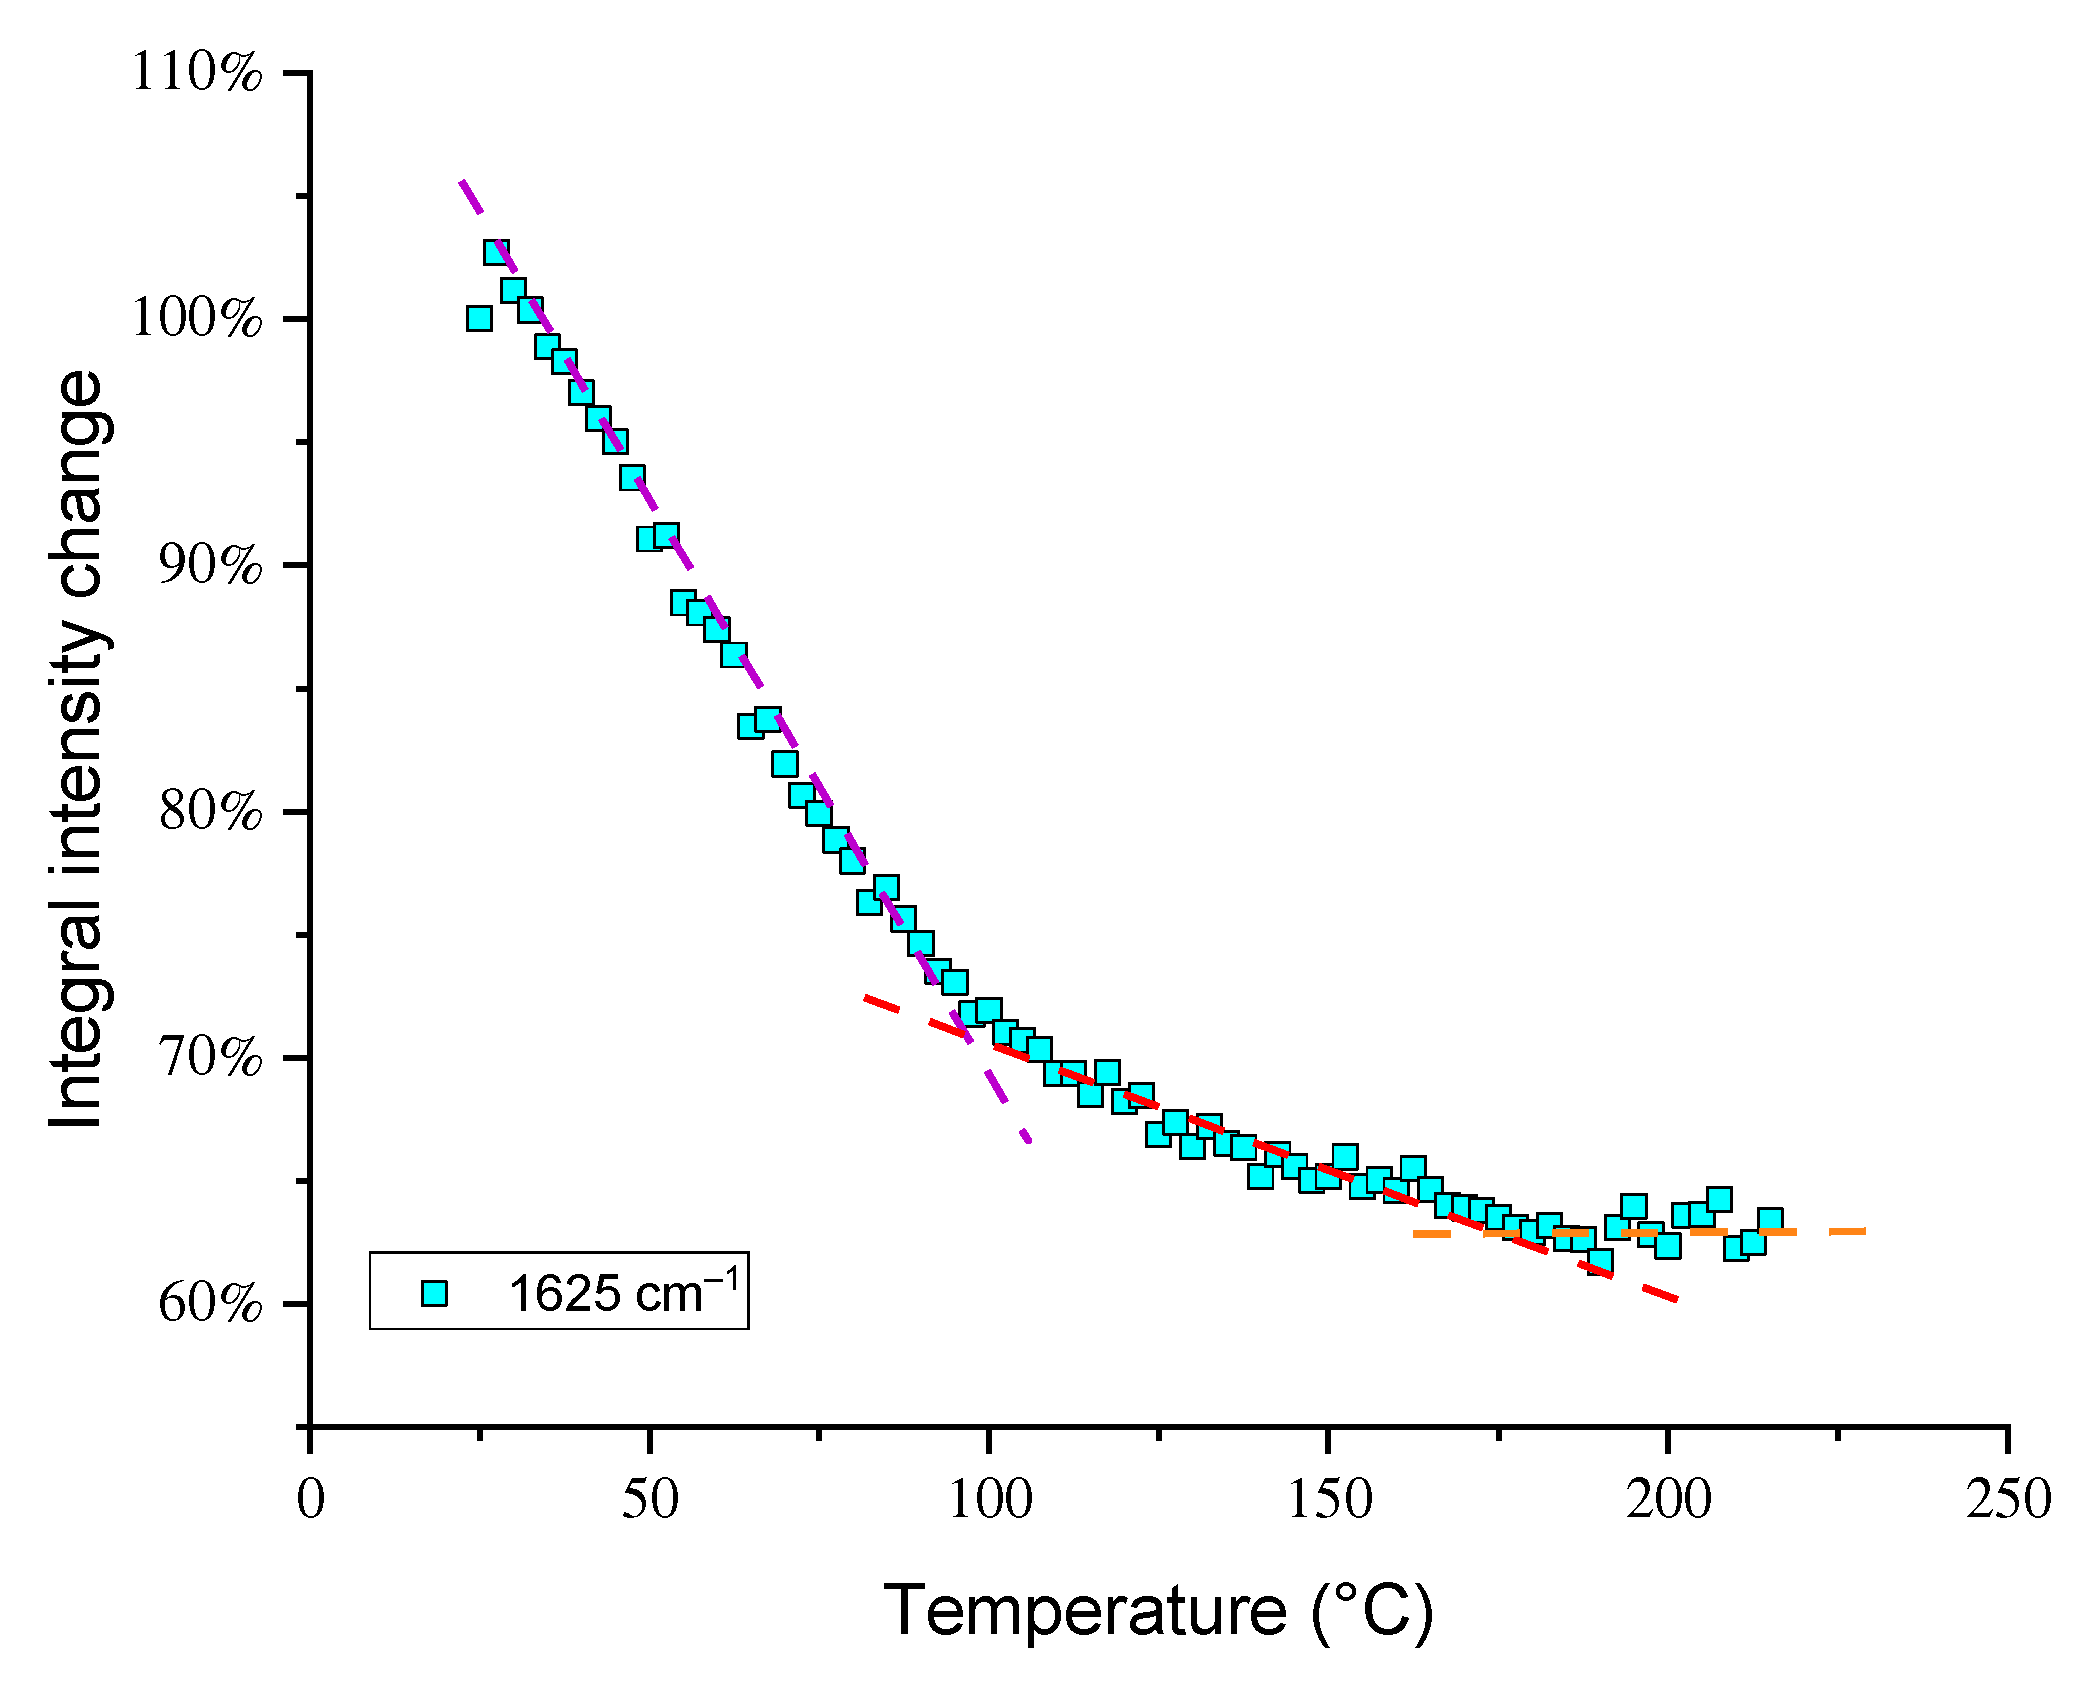
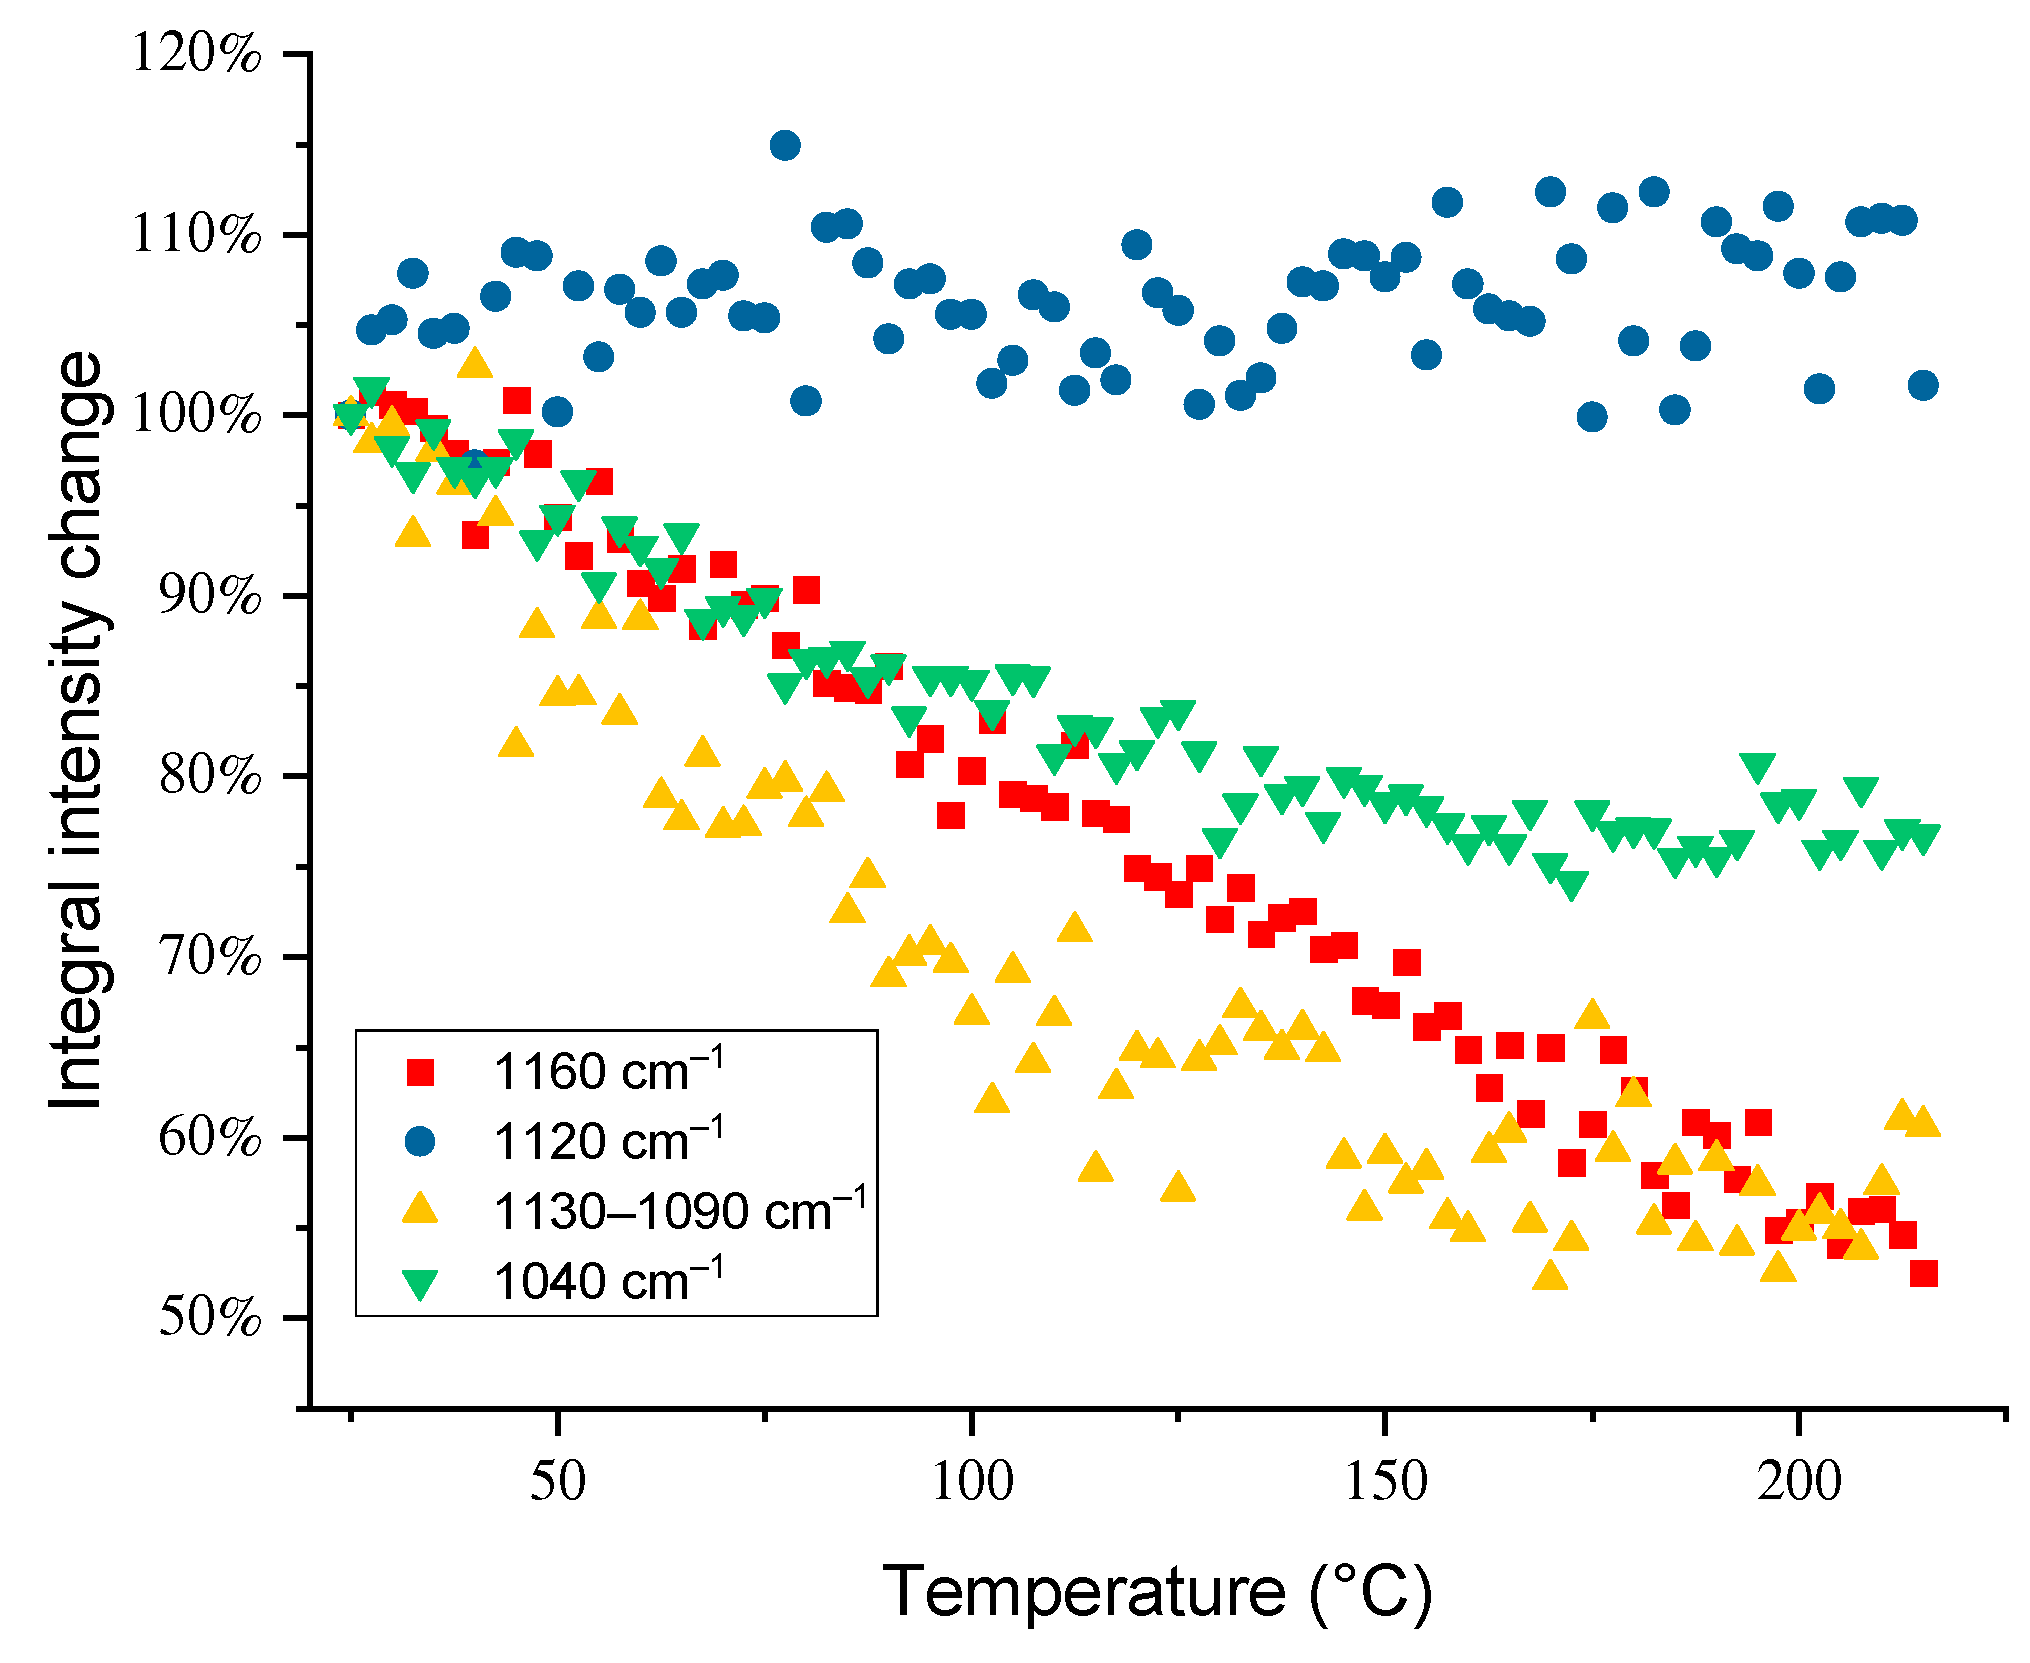
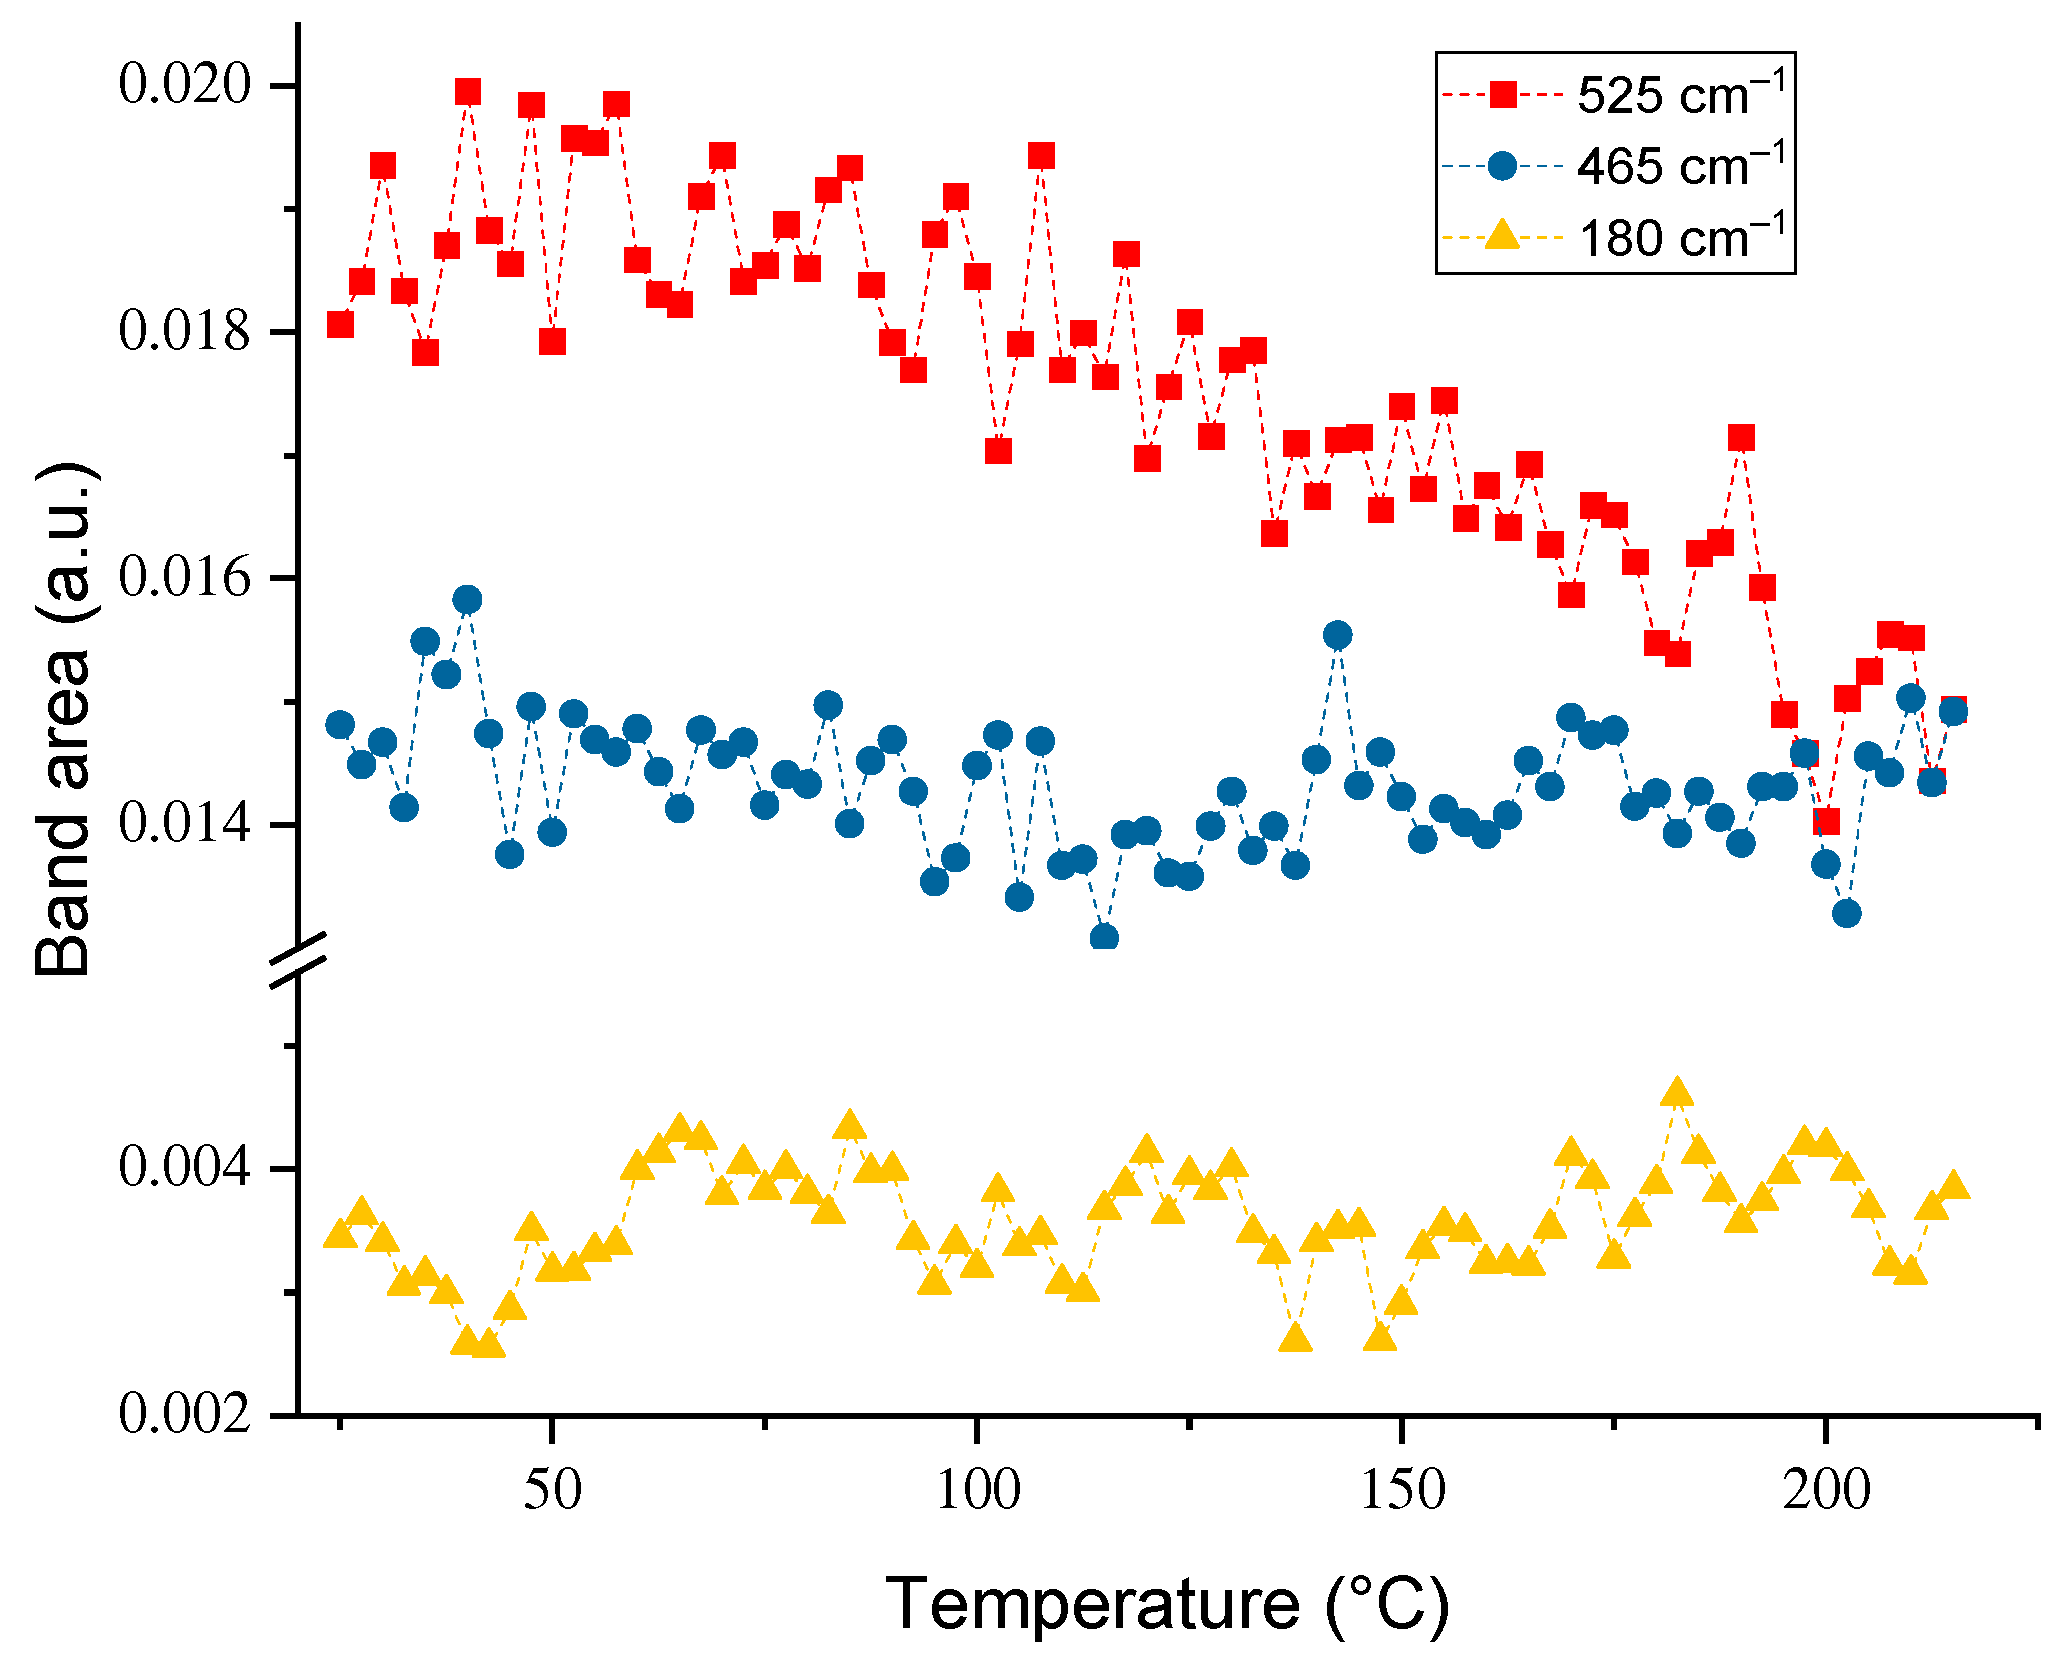
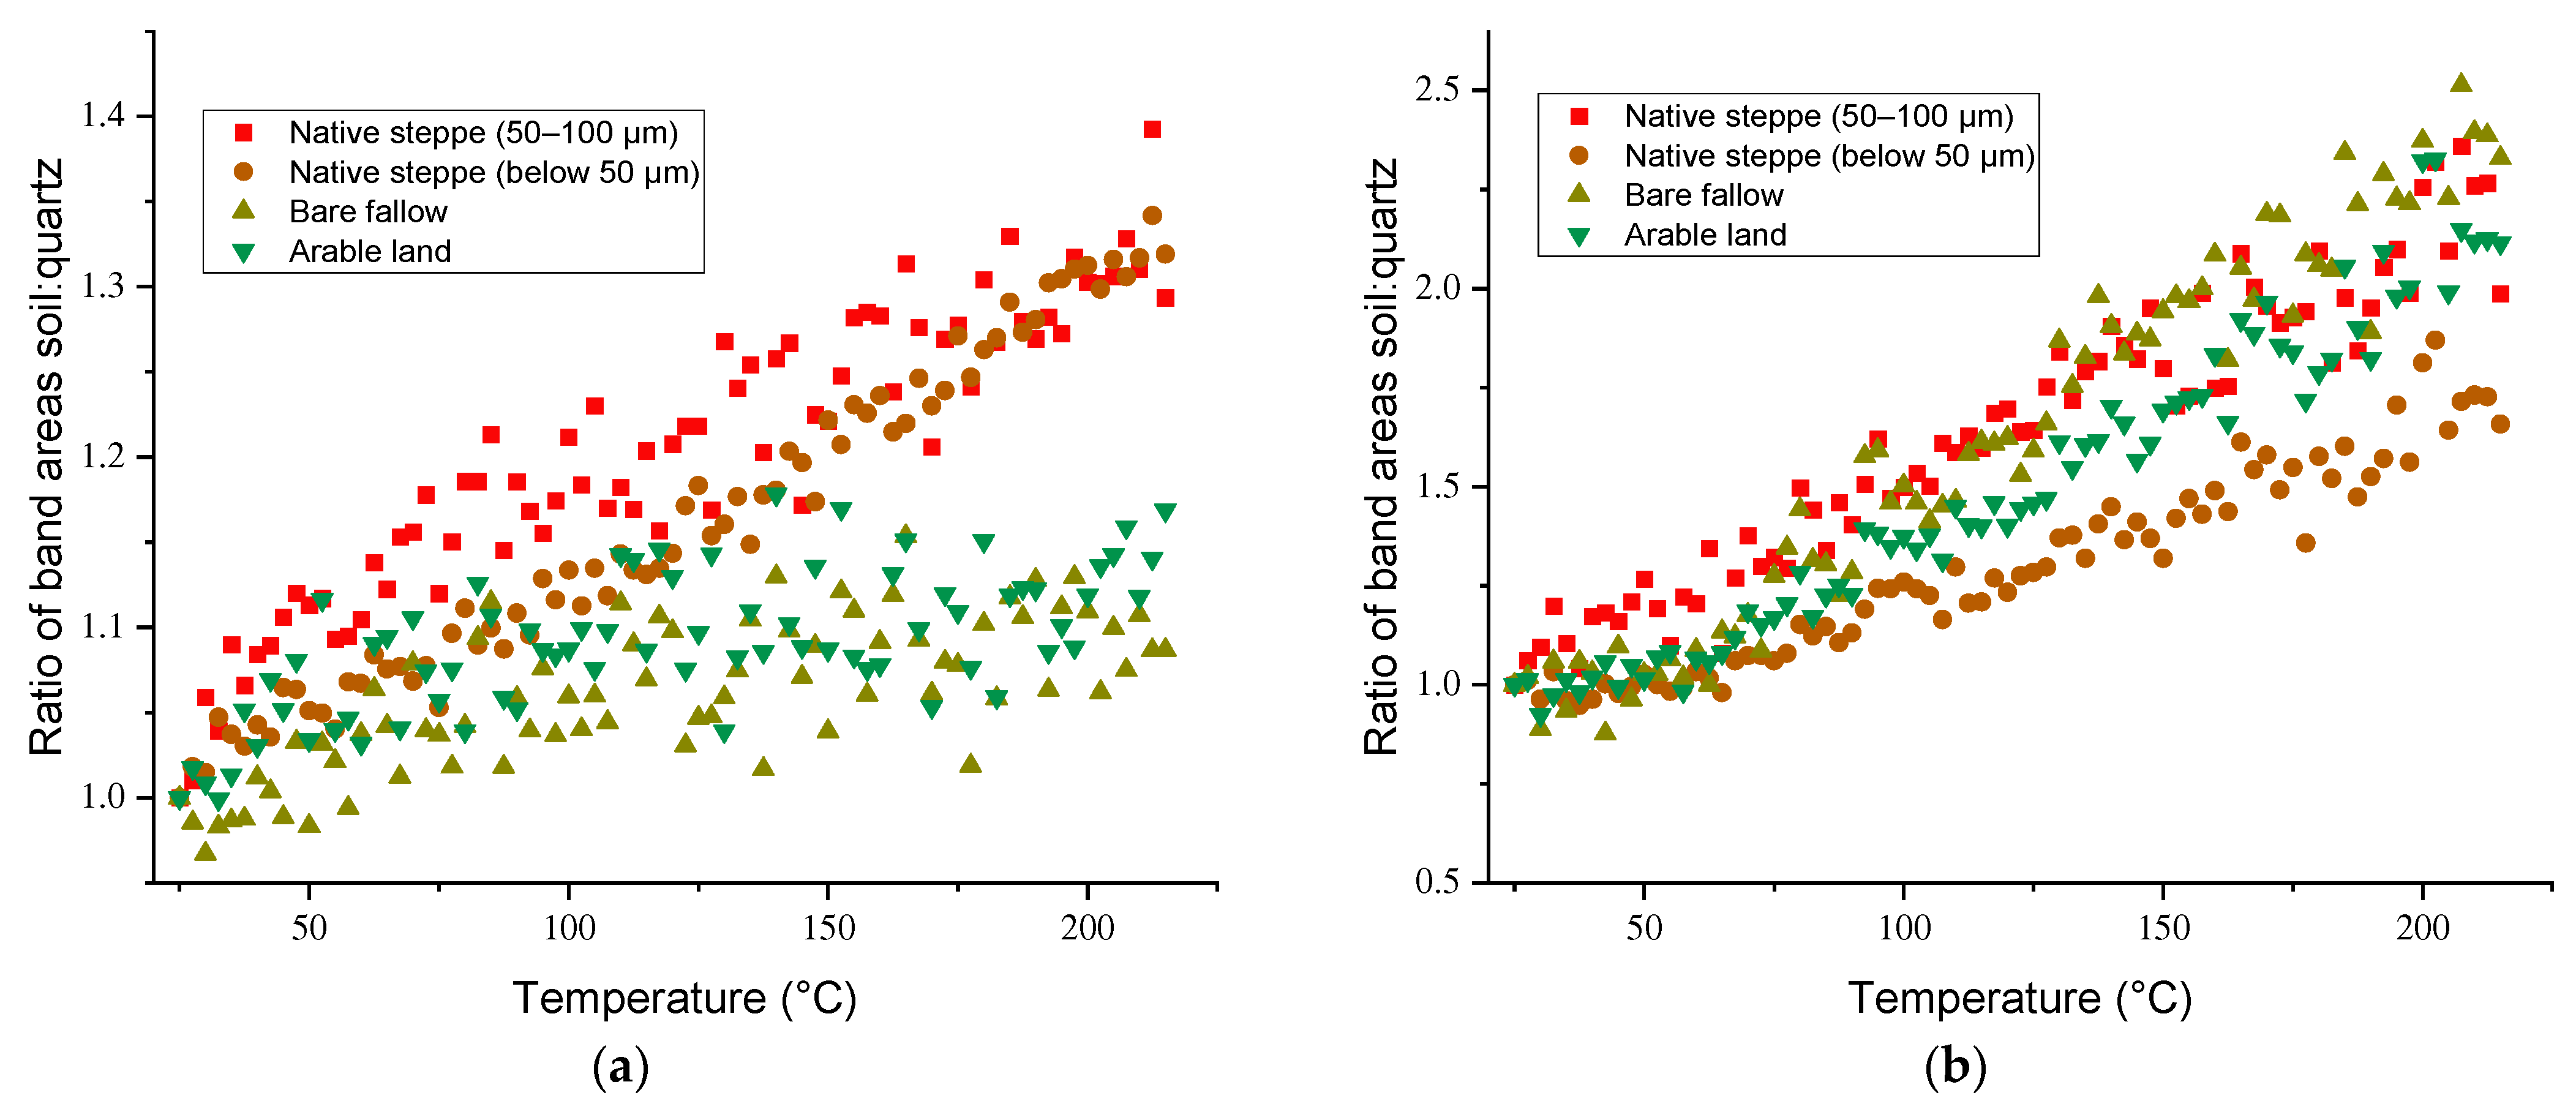
3.3. Temperature Dependences of Band Intensities

As for frequency shifts, the intensity changes upon heating were reversible; all the band intensities returned to their unheated values upon cooling (Figure S5b, Supplementary Materials), which agrees with the behavior for humic substances separated from brown coal [28] and chernozem [27]. This is supported by the previous findings that major changes in SOM (decomposition of labile matter like phenolic compounds and polysaccharides or functional-group elimination) occur at higher temperatures [89].
For all bands in the most informative range (1800–100 cm−1), the intensities for the bands of inorganic matrix experienced a significantly different thermal behavior compared to the bands assigned to SOM (Figure 2 and Figure 3a,b). For bands assigned to quartz, all the bands experiencing a redshift or almost no shift (1163 cm−1), Figure 1a, the relative change in intensity was the same, ca. 60% of the initial integral intensity at 25 °C (Figure 3a,c).
In contrast, for a band at 394 cm−1 with a blueshift (Figure 1a), the change in intensity with temperature for soil samples was considerably lower, ca. 20% (Figure 3d). This behavior could be attributed mainly to quartz, as quartz samples show the same behavior (Figure 3d), though a size-dependent difference in the behavior was found, larger fractions showed a lower decrease compared to quartz.
For the studied temperatures from room conditions to 215 °C, the main process was dehydration [90]. Possible changes in organic matter were small [50], and fully reversible changes in spectra confirmed that. Thus, the water-dominated band (1625 cm−1) changed most significantly. Its behavior may be divided into three temperature subranges with different slopes (Figure 4): 25–100 °C (the magenta line), which corresponded to liquid water evaporation; 100–180 °C, which showed a lower slope (the red line); and 180–215 °C, which showed almost no drop in intensity (Figure 4, the orange line).
Matrix bands corresponding to quartz and amorphous SiO2 species showed a significantly different picture (Figure 5). While quartz bands (1163 and 1040 cm−1) decreased in intensity, for the bands of amorphous components of the matrix (1120 cm−1), the intensity increased, though very slightly.
In the range of bands in the fundamental SiO2 region, this situation was even more expedient. The behavior of all the bands corresponding to quartz bands showed no changes in intensity (Figure 6), which is mainly the same as for the residual SiO2 bands in isolated humic substances [27]. The same change was found at 525 cm−1 as previously shown for humic substances isolated from the same soil as well as quartz [27].
Contrary to the behavior of the majority of bands in this region (Figure 6) characteristic for quartz, bands that may include contributions from polyaromatic compounds, 790–750 cm−1 [77] and C–C–C bending, 440–400 cm−1 [86], showed a drop in the integral intensities, although a growth compared to the thermal behavior of the same band areas in quartz was revealed (Figure 7).
The behavior for various samples in these ranges showed similar but still different features; soil samples showed the same change in frequency shifts compared to quartz, but different changes in intensities (Figure 8). In the range of 430–400 cm−1, an increase in the intensity was shown compared to quartz, which showed a different behavior (Figure 7b).
The increase in intensity was 5–10% for the highest temperature compared to the value at 25 °C, which was much lower than the changes in humic substances isolated from this sample [27], although the general trend was the same. This behavior was found for the region of 790–750 cm−1 for all fractions and land uses (Figure 7b and Figure 8a,c,e), while the behavior of the shoulder band in the range of 440–400 cm−1 was found for large fractions, higher than 50 µm; for finer fractions, the increase was lower (Figure 7b and Figure 8b,d,f).

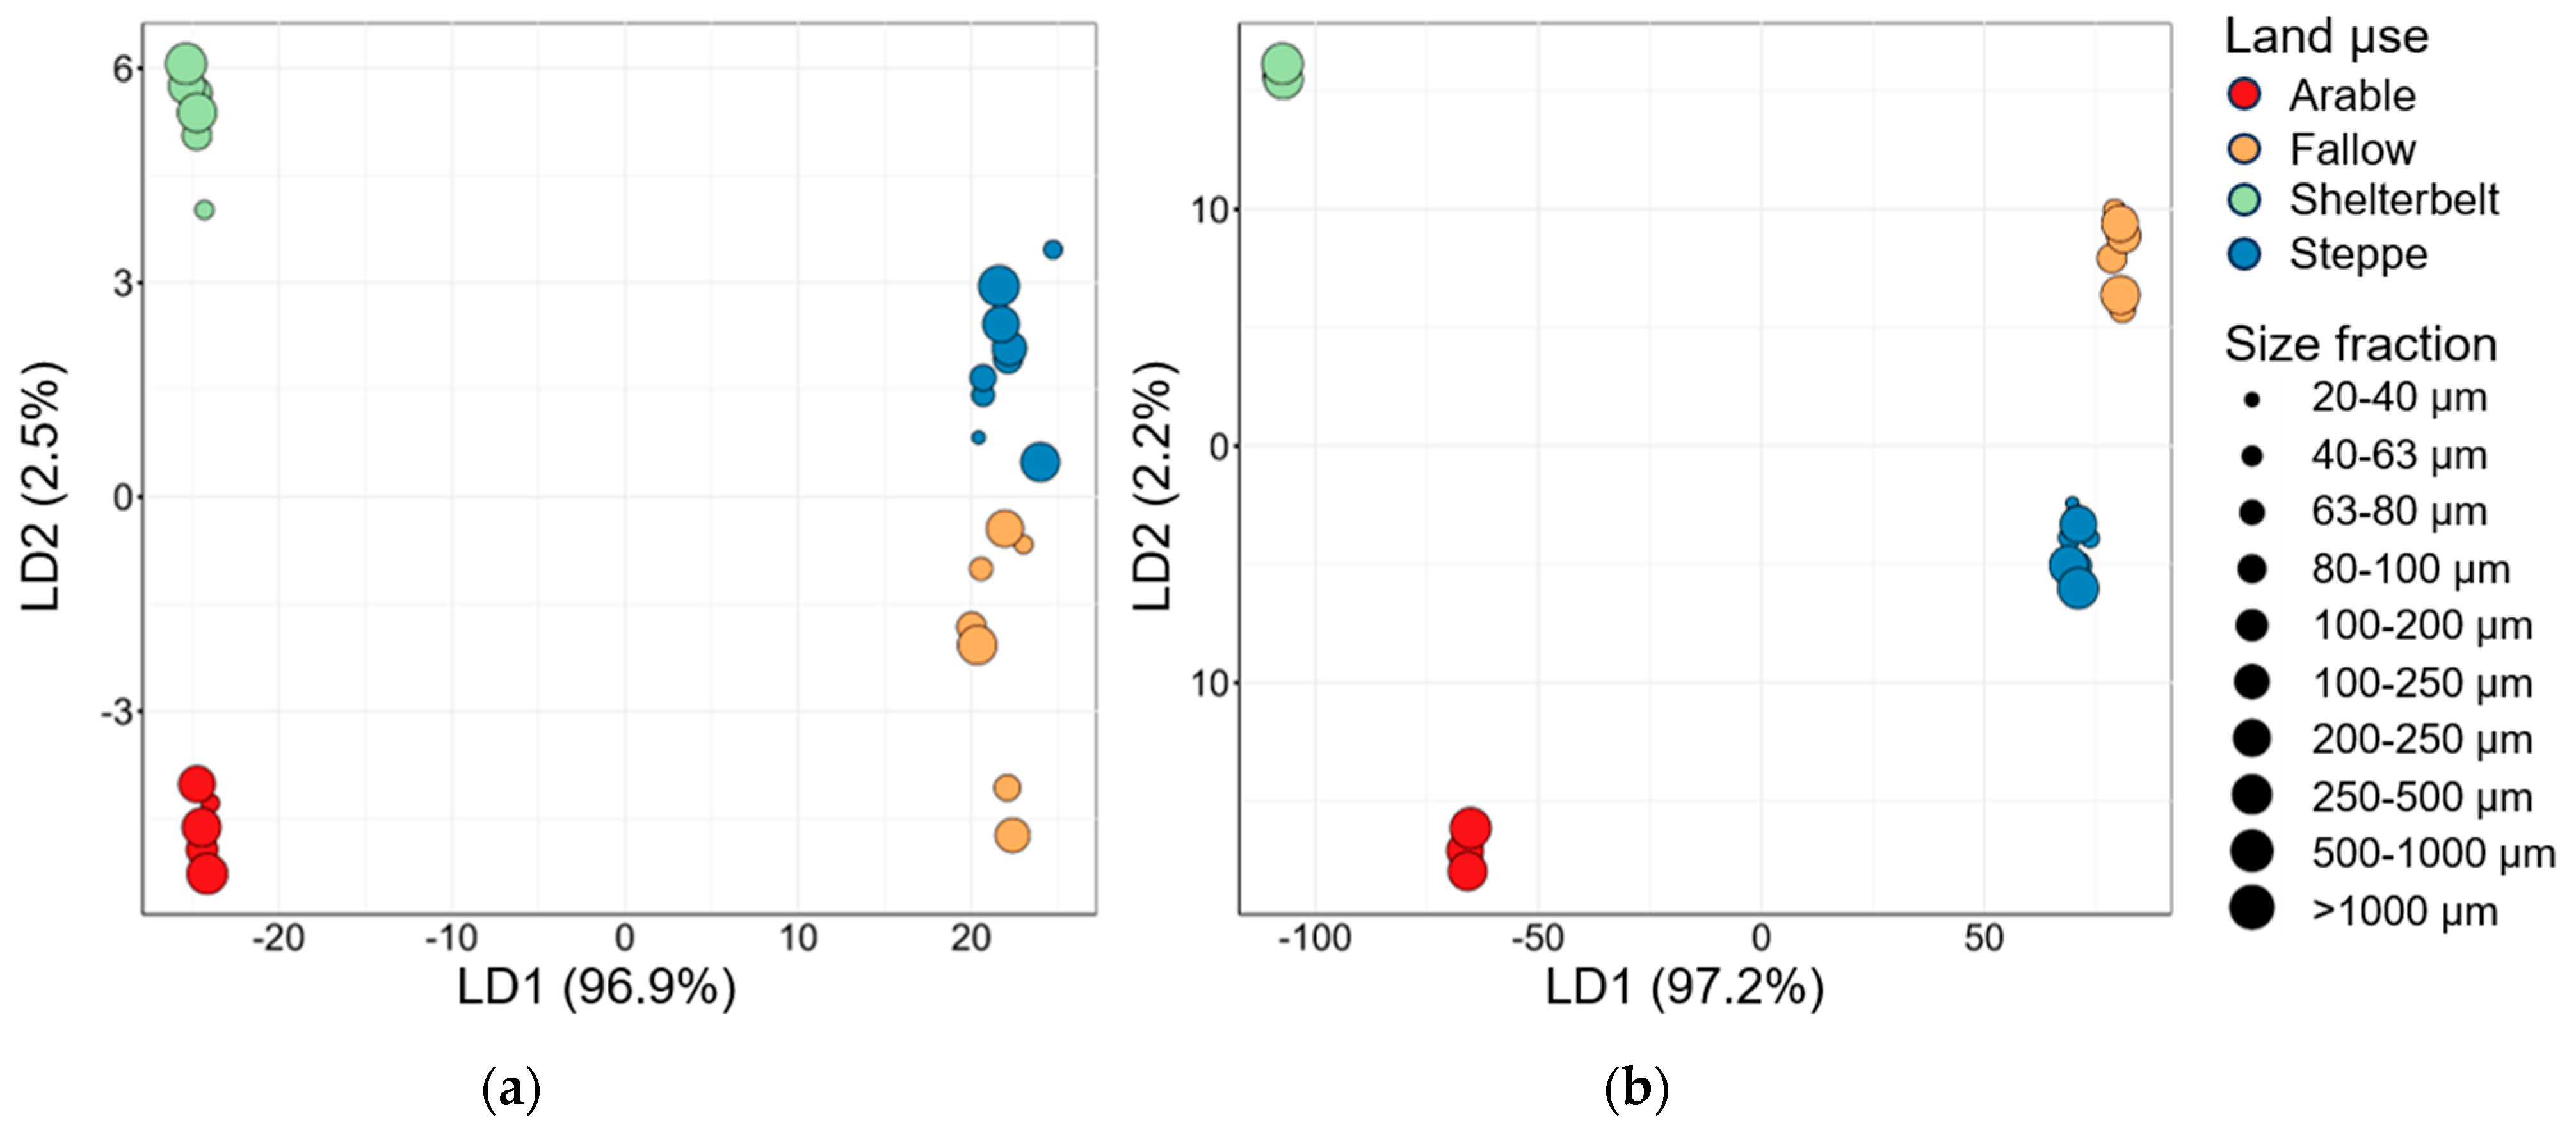
3.4. Linear Discrimination Analysis and Data Comparison

The spectra of the same samples of soils at 25 °C obtained by ATR-FTIR in temperature-dependent experiments and diffuse-reflectance measurements were subjected to linear discrimination analysis. The fractions were combined as 20–40, 40–63, 63–80, 80–100, 100–200, 100–250, 200–250, 250–500 μm, 0.5–1 mm, and over 1 mm (Figure 9). Contrary to previous results for chernozem soils based on 2D correlation analysis (2D-COS) with characteristic bands only [22], the whole FTIR spectra in the studied range, 4000–100 cm−1, were used (Figure 10).
The prediction quality of land-use types based on full FTIR spectra was 83% (accuracy, 0.8 ± 0.2 and kappa, 0.8 ± 0.3; Figure 9a). The dimensionality reduction of a large array of variables into multiple discriminant functions is one of the results of discriminant analysis. Thus, the first two discriminants describe 99.15% of the total variance.
The first discriminant function (LD1) describes 96.62% of the total variance and separates the subjects into two groups: shelterbelt/arable land and steppe/fallow (Figure 9a). The second discriminant function (LD2) describes 2.53% of the total variance and divides the objects into groups: shelterbelt/steppe and arable/bare fallow (Figure 9a).
For the comparison with temperature-dependent IR spectra, the stepwise variable selection algorithm was used. It discovered 33 specific wavenumbers in the FTIR spectrum (Table S1, Supplementary Materials). These values drop into ranges: 4000–3950, 3620–3615, 2000–1760, 1320–1290, 820–770, 620–605, 595–550, and 260–255 cm−1. The ranges of 4000–3950 and 620–605 cm−1 are chemically noninformative due to artifact bands in these ranges, so these ranges were excluded from the further discrimination. Classification of land-use types using these specific IR bands alone is equal to the accuracy of classification using the full FTIR spectrum (accuracy, 0.8 ± 0.2 and kappa, 0.8 ± 0.3), and the quality of land-use separation by these specific wavenumber regions is even higher (Figure 9b).
For a more detailed analysis of the possible role of SOM in land-use discrimination, LDA was made for the full spectra in a narrower range, 1200–200 cm−1. The accuracy of the classification dropped from 83 to 55%, mainly due to errors in the discrimination of steppe and bare fallow classes (Figure 10a). The stepwise variable selection algorithm for the SOM range provided wavenumber regions of 1020–1010, 820–810, 590–560, 410–400, and 260–255 cm−1, the LDA results by these wavenumber regions are shown in Figure 10b.

4. Discussion

We investigated the size fractions of chernozems from two sites of the Kursk region located at a distance of 15 km apart. As shown by the results of numerous studies and observations conducted in these territories over the past 70 years, as well as those currently continuing [48,49,91,92,93], the site, where the shelterbelt and arable land chernozems are located, is a genetic analogue of the site of the steppe/bare fallow pair, but the history of the current state and land use at these two sites has substantial differences [27]. For the former pair, the shelterbelt/arable land, until the middle of the last century, were the same arable land. In the 1960s, forest shelterbelt plantations were planted to combat drought. In the latter pair, steppe/fallow, chernozem under intact native (for several centuries) and regularly mowed steppe vegetation; and chernozem of bare fallow, annually plowed and deprived of the supply of any fresh plant material since the 1960s, were compared.
The FTIR spectra of the size fractions of these chernozem samples were tested under differing temperatures (25–215 °C) with the minimum decomposition of SOM in the soil [50] and, as shown previously, in separated humic substances [27]. Still, SOM may decompose in this range [50], which was taken into account.
As a whole, the spectra of the chernozem soils and fractions showed a lower number of bands compared to the spectrum of humic substances isolated from the same samples [27], with the domination of matrix bands of SiO2 (Table 1).
The changes in the band maximum frequencies in the quartz-dominated range (1200–100 cm−1) did not depend on the fraction size. For a band at 1163 cm−1, overall changes were lowest for native steppe, the changes for other land types were the same as for quartz (Figure 1d). At 1100–1080 cm−1 (a weak broad band probably assigned to amorphous silica), a slight blueshift was present. For amorphous species, the lattice stretch band at 1070 cm−1 [70] did not show a significant maximum frequency shift, which agreed with the behavior for humic substances isolated from these samples [27]. Similar behavior was found for bands at 1025–1000 and 930–910 cm−1, also in agreement with the case of isolated humic substances [27]. A band at 750–740 cm−1 also assigned to amorphous silica species with a possible contribution from SOM, revealed a frequency redshift, ca. −1 cm−1, which was smaller than for the redshifted bands of quartz (Figure 1a,b) and fully agrees with the values obtained for humic substances isolated from chernozem [27], which, taking into account the high degree of separation of humic substances from silicate [87] is an extra proof of a large SOM contribution to this band.
For different land-use samples, the comparison of frequency changes was made using fractions of 50–100 µm (Figure 1d) and in the range 1200–100 cm−1. Native steppe showed a deviation from quartz in the bands at 1163 cm−1 (larger redshifts for medium fractions), 695 cm−1, and 262–258 cm−1 (smaller redshifts); arable land, 368–364 and 695 cm−1, and bare fallow, 695 cm−1 only. This may indicate the differences between the matrices with a higher level of matrix amorphization of arable land and bare fallow, and probably a contribution of SOM at 1163 cm−1 or possible larger amounts of more defected structures of quartz in native steppe absent in cultivated lands or different amounts of quartz biogenic structures, phytoliths.
Comparing intensities, integral band areas were indicative and more pronounced compared to calculated maximum intensities of absorption bands at each temperature (Figure S7, Supplementary Materials), which confirms our previous studies for isolated humic substances [87]. Moreover, for soils, the contribution of other constituents to quartz bands provided an unreliable picture, contrary to pure quartz, where both intensities and areas were consistent (Figure S7a). For soil samples, integrated areas of quartz bands provided a much better fit with the behavior in pure quartz (Figure S7b), which could be used as a proof of the band nature (purely quartz or with other constituents). Thus, integrated areas were used only.
Also, bands of organic matter showed a growth in intensity (Figure 2), while the bands of quartz matrix experienced a drop in intensity (Figure 3a). The thermal behavior of bands assigned to SOM was also significantly different from the nearby backgrounds (Figure 2) and from the behavior of the same bands in quartz (Figure S8, Supplementary Materials).
Temperature dependences of band intensities (Figure 3b) were close to the behavior of quartz and some aluminosilicates [67]. The intensity of the most bands of quartz at the selected wavelength decreased, which may result from the displacement of the maximum of the vibrations band of the crystal lattice.
The behavior of the band at 1625 cm−1 (Figure 4) was roughly similar to the trends in intensity changes for humic substances separated from chernozem soil [27]; however, a higher content of water in soil samples results in a broader water band that hides informative bands corresponding to humic substances (carboxylic and carboxylate groups), so this characteristic band made the SOM analysis in the range of 1720–1480 cm−1 somewhat inexpedient, which is one drawback of temperature-dependent IR spectroscopy of soils compared to the same range in temperature-based IR measurements of separated humic substances.
In the regions with the dominating bands of quartz matrix (1200–100 cm−1), varying the integration range provided a way to distinguish two overlapping contributions. By integration along a broader range around the target band for a non-quartz component at 1120 cm−1, 1130–1080 cm−1 (Figure 5, yellow symbols), we increased the total influence of the quartz matrix, while for integration near the maximum of this candidate band (Figure 5, blue symbols), the different nature of the dependence was revealed.
The most informative ranges found from the analysis of ATR FTIR spectra were located in the range 800–350 cm−1 (Figure 7 and Figure 8). Here, although all the bands may be considered as quartz-dominated, the behavior of specific bands and even unresolved regions significantly deviated from quartz and depended on the land use and the fraction size. Based on the data obtained in this study, we can conclude that the contribution of SOM may be responsible for the difference in this behavior (Table 1). However, the changes in the mineral parts of soils, especially for different fractions, cannot be neglected.
From the viewpoint of the regularities found for the mineral constituents of the soil, the following points may be underlined. The properties of the surface of the mineral phase are formed by the organic matter sorbed on it, which in the soils are the products of the metabolism of microorganisms, the exudates of the roots of higher plants and water-soluble organic matter. Microbiologically and chemically stable, predominantly hydrophobic decomposition products of lignin and metabolic products of fungi are selectively sorbed by the solid phase, suppressing and displacing previously sorbed hydrophilic substances [94]. The result of the sorption of hydrophobic organic compounds on mineral primary soil particles is their new quality, the ability to enter interparticle interactions, which are the basis for the formation of a stable aggregate structure [95,96]. The implementation of this mechanism is facilitated by heavy-particle size distribution, high fine porosity of the system, the slow movement of gravitational moisture, alternating cycles of moistening (drying and freezing) and thawing. These indicators fully correspond to the lithological and bioclimatic characteristics of the soils of the chernozem zone. Thus, this may be considered a valid subject for further studies of chernozem soils.
Furthermore, the differences in the mineral parts of the spectra for different fractions may be established by phytoliths and other amorphous forms of quartz of a biological nature (bASi). Analysis of the composition of phytoliths in soils is widely used in paleogeographic studies, since the forms of phytoliths, which, in fact, are organogenic amorphous opal-like silicon structures, are specific to plant groups, and their ratios are specific to plant communities. Thus, it is shown that wheat phytoliths have predominantly elongated forms [97]. Among the phytoliths of the steppe communities, phytoliths of a rounded shape (rondel) dominate [98].
Given the significant content of phytoliths in soils, up to 5% of the mass in the upper layer, their contribution to the differences between mostly similar soils can be significant [99]. It increases even more with the specific sample preparation for analysis: we isolated individual particle-size fractions in the range from 20 μm to 2 mm, in particular, four fractions up to 100 μm. Since the size of phytoliths is mainly in the range of 20–80 μm, we actually concentrated the phytolithic material in the analyzed fractions compared to the whole soils. Since different phytoliths differ in the degree of resistance to chemical damage [100,101], it can be assumed that there are differences in the characteristics of the molecular bonds of these structures. At the same time, the positive role of the applied FTIR analysis was that it made it possible to identify those differences in the spectral parameters that were not distinguished by the initial assessment.
As a whole, the proposed approach based on the thermal dependences of IR spectra provided more information and more reliable data for the majority of bands in IR spectrum compared to individual spectra. However, the information volume on the SOM is considerably smaller than in the case of isolated humic substances [27] due to a lower concentration of SOM and the interference of highly absorbing inorganic matrix components. Thus, the possibilities of SOM characterization by temperature-dependent IR are fewer than those made by 2D-COS IR analysis towards this aim [22]. Thus, to differentiate chernozem soils with different agricultural land use by this approach, a combination of data both for SOM and changes in the behavior of inorganic matrix bands should be used.
To support the data of the temperature-dependent FTIR of soils, the spectra were subjected to linear discriminant analysis (LDA) of variance to find a linear combination of the spectral features that separated two or more classes of the studied objects [52].
LD1 (Figure 9) fundamentally separated the land-use samples located in the two isolated sampling sites (steppe, arable land, and fallow/shelterbelt) and this was obviously related to the peculiarities of the species composition of their perennial vegetation cover, manifested at the mineral level by phytoliths and bASi. In contrast, LD2 separated cultivated soils (arable land and bare fallow) and soils without agricultural impact (Figure 9). Thus, agricultural use with the annual alienation of crop residues leads to the removal of phytoliths, in particular [100,102], and silicon in general [100]. The authors of [100,102] noted that the export of silicon through harvesting and the increase in the rate of erosion as a result of plowing usually leads to the loss of bASi and the depletion of silicon available to plants in agricultural soils (anthropogenic desilication).
Based on the variance contribution ratio, we can conclude that features of the floristic composition of the site of land use, namely, the introduction of bioorganic forms of silicon and the form of phytoliths contributes 38 times more than the agricultural impact. Moreover, LDA by the full ATR-FTIR spectra in the range of 4000–100 cm−1 showed not only a difference in the mineralogy of soil-forming rocks, but the distinct separation according to the second discriminant, indicating the effect of agricultural use on the mineralogical composition of the samples. These results agreed well with the findings of 2D-COS diffuse reflection IR analysis of the same fractions and principal component analysis by the selected characteristic bands [22].
In other words, in a classification of the SOM-contributed range, steppe and bare fallow samples become closer due to the common SOM origin, because there was no source of other, different from the original steppe, organic matter in the history of these two sample types. The second linear discriminant LD2 for this narrower spectral range discriminates arable land, steppe/fallow, and shelterbelt by different vegetation and type of SOM. The labile part, associated with active or low-molecular compounds, has left the bare fallow and what remains is similar to the substances of the steppe. Arable land and shelterbelt are still different, by LDA of the whole-range spectra (Figure 9a): arable land and bare fallow are at one half-plane, while steppe and shelterbelt, at another. Thus, differences lie in the first feature, vegetation (left–right) and in the land use impact (bottom–top).
The specific regions found by LDA of 3620–3615, 2000–1760, and 260–255 cm−1 belong to the inorganic matrix, the first one corresponds to the SiO–HOH2 stretch in kaolin and various clay minerals [59,60,61]; the second one, to the overtone triplet of quartz, and the third one, to lattice vibrations that show the differences in the thermal behavior of the spectra of soils (Figure 3).
The regions 1320–1290, 820–770, and 595–550 cm−1 include the ranges with contributions of SOM (Table 1), like C–O stretch [65]; out-of-plane –C–H and C–O–H bend; and out-of-plane –C–H bend [81], respectively. Also, the bASi including phytoliths may show different contributions to these bands [103,104]. The range of 595–550 cm−1, most probably PO4 tetrahedra [105] contained in the coprolites of worms, appears in the analysis of diffuse-reflection IR spectra; this band is revealed here but not manifested in ATR-FTIR [31]. These specific regions maintain the discrimination of the shelterbelt and arable land, but better separate all the fractions of the native steppe and bare fallow (Figure 9b) due to changes in SOM and bASi contributions, which support the data of temperature-dependent FTIR analysis. As expected, the water-dominated region hides the specific features of IR spectra and does not provide the discrimination.
For full FTIR spectra in a narrower range, 1200–200 cm−1, the quality of discrimination is the same as by the whole spectral range (Figure 10a). For specific wavenumbers in the FTIR spectrum in the shorter SOM range, the quality of discrimination is still good, although somewhat degraded for the steppe/fallow pair (Figure 10b). The picture for specific wavenumbers is very similar to classification by full spectra in 1200–200 cm−1 (Figure 10a), but the separation by mineralogical composition (LD1) becomes slightly better, to account for different amorphous/crystalline components that appear in this wavenumber range. Probably, this is directly connected with phytoliths that are manifested as differences from mineral quartz and amorphous species; however, this hypothesis requires some additional proof. Three of the discrimination frequency ranges for the full spectrum (820–770, 595–550, and 260–255 cm−1) are confirmed here. It is interesting that the range of 820–810 cm−1 corresponds to amorphous silica [74] or Ti–O [106]; thus, it is doubtful that it includes SOM contributions. The range of 410–400 cm−1 corresponds well to the above-mentioned different shape and thermal behavior of the shoulder band in the range of 440–400 cm−1 with a possible SOM manifestation (Figure 7 and Figure 8). The range of 1020–1010 cm−1 satisfactorily corresponds to the specific behavior of the band at 1040 cm−1 (Figure 5), although it belongs to quartz.
Our data show that the studied soils and their fractions also differ in the content of polyaromatic compounds that may affect the growth and metabolism of plants [107]. At the same time, their maximum content is confined to fractions smaller than 250 μm of bare fallow, native steppe, and arable land (in this descending order). From these three samples, the SOM of the bare fallow contains almost no carboxyl groups, characteristic of labile organic matter [89,107,108], the arable land is relatively depleted in these compounds compared to the SOM of the steppe. Obviously, the soil of the shelterbelt is different from these two samples containing the maximum amounts of aliphatic compounds and carboxyl groups; that is, labile humic substances [22,108]. On the one hand, this is due, as noted above, to the rapid recovery of SOM content as a result of mineralization of readily degradable leaf litter of woody vegetation and is accompanied by the restoration of the soil structure [22]; on the other hand, it causes the risk of rapid degradation of this soil if the shelterbelt is cleared, and the soil is plowed again.
Thus, the exploration of LDA data, including diffuse-reflection spectra, shows satisfactory coincidence of the discrimination and the features obtained from the temperature-driven FTIR spectra. At a qualitative level, the differences in the composition that provides a distinct discrimination of land-use types (Figure 9) are determined by the different behaviors of bands that, according to temperature-dependent spectra, result from changes in SiO2 bands, especially in its crystallinity and hydrogen bonds and the possible contribution of SOM. The first phenomenon is also supported by the comparison of the IR spectra of the soils by different measurement techniques [31,32,51,109]; the second, by the thermal behavior of the IR spectra of humic substances separated from the same type of samples [27]. Entirely solving this problem requires both chemometric techniques like LDA of 2D correlation analysis [22,110] (probably with the use of heterospectral 2D-COS with techniques other than FTIR spectroscopy [111]). The problem of SOM is much more difficult as it involves the contributions of many compounds. Probably, the possibilities of data handling of all the spectra and physical separation of SOM are limited, and chemical fine-fractionation techniques are needed to fully resolve this matter.

5. Conclusions

Thus, the thermal behavior of the FTIR spectra of chernozem soils from 25 to 215 °C shows several significant band changes with temperature. The main bands, both belonging to the mineral matrix and the SOM, experience a reversible change in the frequencies of their maxima as well as band intensities, thus manifesting structural or interactional changes rather than decomposition (except for water desorption/absorption). SOM bands manifest themselves as an increase in the band integral intensities with temperature, even for weak bands, and this behavior is consistent with the analysis of the temperature dependences of isolated humic substances [27]. However, the direct analysis of the SOM bands for the soil fractions of chernozem seem to be very seriously hindered by the dominating contribution from the inorganic matrix and water.
Still, a comparison of the data obtained using thermal trends of ATR-FTIR spectra showed that samples of chernozem differ significantly, while individual spectra show greater similarity. These trends, confirmed by linear discriminant analysis, were observed for spectral ranges corresponding to hydrogen bonds (though only slightly due to low ATR-FTIR sensitivity), in the range of 1150–1000 cm−1, and for parts of composite bands of spectra at 820–700 and 450–350 cm−1, for which the brachial parts are weakly expressed. The differences in the thermal behavior indirectly indicate the involvement of SOM or changes in the mineral composition (quartz, amorphous species, and bASi). These changes are slight and require a larger set of data, including chemometric handling to obtain reliable data. However, the deconvolution analysis of individual soil IR spectra is difficult, so the temperature-dependent approach may provide both an increase in the information volume and data reliability.
Temperature dependences of the band maximum frequencies and areas in the middle and far IR regions of chernozem soil samples and their size fractions in the range of non-destructive temperatures using the highest sensitivity of ATR-FTIR spectroscopy in the range 1800–100 cm−1 can be considered stable qualitative parameters for comparing the spectral parameters at a single (room) temperature. The changes in the non-destructive temperature range in IR spectra soil fractions can be used for the analysis and evaluation of soils and are expedient for separating the contributions of SOM, bASi, and matrix components.
Certainly, such an information gain has its drawbacks: a long time spent taking measurements (ca. 10 h at the selected heating rate), especially if compared with conventional (single-temperature) IR spectroscopy. However, this is close to the time of thermogravimetric studies and can be reduced by selecting the conditions of IR spectra acquisition (faster measurements or narrower spectral ranges), which may be the subject of future research. Also, the obtained results highlight a need for further in-depth studies of the relationship between the aggregate structure and the physicochemical properties of the components of the solid phase of chernozems under different land-use conditions. As a whole, with further work, thermal-dependent FTIR may serve as a source of reliable indicators of changes in the state of chernozem soils.

Supplementary Materials

The following supporting information can be downloaded at: https://www.mdpi.com/article/10.3390/agronomy13081967/s1, Figure S1: Three dimensional spectra for temperature dependences of the IR spectra of chernozem (a) native steppe, fraction, 50–100 μm; (b) bare fallow, fraction, 50–100 μm; (c) arable land fraction, 50–100 μm, and (d) quartz sand, fraction, 10–50 μm; Figure S2: Normalized ATR IR absorption spectra of chernozem upon heating, (a) native steppe (fraction, 50–100 μm); (b) bare fallow (fraction, 50–100 μm); and (c) arable land (fraction, 50–100 μm). Temperature increases from 25 to 215 °C from brown, through red, orange, yellow, green, and blue, to violet lines; Figure S3: Normalized ATR IR absorption spectra of quartz (fraction, 10–50 μm). Temperature increases from 25 to 215 °C from brown, through red, orange, yellow, green, and blue, to violet lines; Figure S4: Normalized ATR IR absorption spectra of chernozem upon cooling, native steppe (fraction, 50–100 μm). Temperature decreases from 215 to 25 °C from violet, through blue, green, yellow, orange, and red, to brown lines; Figure S5: Changes upon heating and cooling in (a) relative band maximum positions, a band at 795 cm−1 and (b) integral intensity, a band at 1160 cm−1; Figure S6: Changes in the band maxima frequency shifts upon heating for chernozem, (a) native steppe (fraction, 50–100 μm); (b) bare fallow (fraction, 50–100 μm); and (c) native steppe (fraction, 250–500 μm) and (d) quartz (fraction, 10–50 μm); Figure S7: Thermal behavior of the intensity of the maximum absorption band at 776 cm−1 and the integral area of this band in the range of 786–763 cm−1 against the baseline, (a) quartz (fraction, 10–50 μm) and (b) native steppe (fraction, 50–100 μm). Values are normalized to the value at 25 °C; Figure S8: Thermal behavior of the integral band intensity at 1260 cm−1 for native steppe (fraction, 50–100 μm) and quartz (fraction, 10–50 μm); Table S1: Specific wavenumbers determining the discrimination of soil by linear discrimination analysis.

Author Contributions

Conceptualization, M.A.P.; methodology, D.S.V. and O.B.R.; formal analysis, M.A.P., O.B.R., D.S.F., Y.V.T. and D.S.V.; investigation, D.S.V. and O.B.R.; resources, O.B.R.; data curation, D.S.V.; writing—original draft preparation, M.A.P., D.S.F. and D.S.V.; writing—review and editing, M.A.P. and O.B.R.; visualization, D.S.V., D.S.F. and Y.V.T.; supervision, M.A.P.; project administration, M.A.P.; funding acquisition, M.A.P. All authors have read and agreed to the published version of the manuscript.

Funding

This work was supported by the Russian Science Foundation, grant no. 19-13-00117.

Data Availability Statement

Not applicable.

Acknowledgments

This research was performed according to the Development program of the Interdisciplinary Scientific and Educational School of Lomonosov Moscow State University, “The future of the planet and global environmental change”.

Conflicts of Interest

The authors declare no conflict of interest.

References

  1. Imeson, A. Desertification, Land Degradation and Sustainability; Wiley: Hoboken, NJ, USA, 2012. [Google Scholar]
  2. Kononova, M.M. Soil Organic Matter, 2nd ed.; Elsevier: Amsterdam, The Netherlands, 1966. [Google Scholar]
  3. Huang, P.M.; Li, Y.; Sumner, M.E. (Eds.) Handbook of Soil Sciences. Properties and Processes, 2nd ed.; CRC Press: Boca Raton, FL, USA, 2012; p. 1436. [Google Scholar]
  4. Gerke, J. The Central Role of Soil Organic Matter in Soil Fertility and Carbon Storage. Soil Syst. 2022, 6, 33. [Google Scholar] [CrossRef]
  5. Jong van Lier, Q.D.; Durigon, A. Soil thermal diffusivity estimated from data of soil temperature and single soil component properties. Rev. Bras. De Ciência Do Solo 2013, 37, 106–112. [Google Scholar] [CrossRef] [Green Version]
  6. Józefaciuk, G.; Sławiński, C.; Walczak, R.T.; Bieganowski, A. Review of Current Problems in Agrophysics; Institute of Agrophysics PAS: Lublin, Poland, 2005. [Google Scholar]
  7. Falkowski, P.; Scholes, R.J.; Boyle, E.; Canadell, J.; Canfield, D.; Elser, J.; Gruber, N.; Hibbard, K.; Högberg, P.; Linder, S.; et al. The Global Carbon Cycle: A Test of Our Knowledge of Earth as a System. Science 2000, 290, 291–296. [Google Scholar] [CrossRef] [PubMed] [Green Version]
  8. Totsche, K.U.; Amelung, W.; Gerzabek, M.H.; Guggenberger, G.; Klumpp, E.; Knief, C.; Lehndorff, E.; Mikutta, R.; Peth, S.; Prechtel, A.; et al. Microaggregates in soils. J. Plant Nutr. Soil Sci. 2017, 181, 104–136. [Google Scholar] [CrossRef] [Green Version]
  9. Chenu, C.; Plante, A.F. Clay-sized organo-mineral complexes in a cultivation chronosequence: Revisiting the concept of the ‘primary organo-mineral complex’. Eur. J. Soil Sci. 2006, 57, 596–607. [Google Scholar] [CrossRef]
  10. Chen, Y.; Tarchitzky, J. Organo-Mineral Complexes and their Effects on the Physico-Chemical Properties of Soils. In Carbon Stabilization by Clays in the Environment; Clay Minerals Society: Chantilly, VA, USA, 2009; pp. 32–49. [Google Scholar]
  11. Fultz, L.M.; Moore-Kucera, J.; Calderón, F.; Acosta-Martínez, V. Using Fourier-Transform Mid-Infrared Spectroscopy to Distinguish Soil Organic Matter Composition Dynamics in Aggregate Fractions of Two Agroecosystems. Soil Sci. Soc. Am. J. 2014, 78, 1940–1948. [Google Scholar] [CrossRef]
  12. Ge, Y.; Thomasson, J.A.; Morgan, C.L.S. Mid-infrared attenuated total reflectance spectroscopy for soil carbon and particle size determination. Geoderma 2014, 213, 57–63. [Google Scholar] [CrossRef]
  13. Tinti, A.; Tugnoli, V.; Bonora, S.; Francioso, O. Recent applications of vibrational mid-Infrared (IR) spectroscopy for studying soil components: A review. J. Cent. Eur. Agric. 2015, 16, 1–22. [Google Scholar] [CrossRef]
  14. Linker, R. Application of FTIR Spectroscopy to Agricultural Soils Analysis. In Fourier Transforms—New Analytical Approaches and FTIR Strategies; Nikolic, G., Ed.; InTech: Tokyo, Japan, 2011; pp. 385–404. [Google Scholar]
  15. Viscarra Rossel, R.A.; Walvoort, D.J.J.; McBratney, A.B.; Janik, L.J.; Skjemstad, J.O. Visible, near infrared, mid infrared or combined diffuse reflectance spectroscopy for simultaneous assessment of various soil properties. Geoderma 2006, 131, 59–75. [Google Scholar] [CrossRef]
  16. Tanykova, N.; Petrova, Y.; Kostina, J.; Kozlova, E.; Leushina, E.; Spasennykh, M. Study of Organic Matter of Unconventional Reservoirs by IR Spectroscopy and IR Microscopy. Geosciences 2021, 11, 277. [Google Scholar] [CrossRef]
  17. Artz, R.R.E.; Chapman, S.J.; Jean Robertson, A.H.; Potts, J.M.; Laggoun-Défarge, F.; Gogo, S.; Comont, L.; Disnar, J.-R.; Francez, A.-J. FTIR spectroscopy can be used as a screening tool for organic matter quality in regenerating cutover peatlands. Soil Biol. Biochem. 2008, 40, 515–527. [Google Scholar] [CrossRef]
  18. Unger, M.; Siesler, H.W. In situ orientation studies of a poly(3-hydroxybutyrate)/poly(epsilon-caprolactone) blend by rheo-optical fourier transform infrared spectroscopy and two-dimensional correlation spectroscopic analysis. Appl. Spectrosc. 2009, 63, 1351–1355. [Google Scholar] [CrossRef] [PubMed]
  19. Shen, Y.; Chen, E.; Ye, C.; Zhang, H.; Wu, P.; Noda, I.; Zhou, Q. Liquid-crystalline phase development of a mesogen-jacketed polymer-application of two-dimensional infrared correlation analysis. J. Phys. Chem. B 2005, 109, 6089–6095. [Google Scholar] [CrossRef] [PubMed]
  20. Arrondo, J.L.R.; Iloro, I.; Aguirre, J.; Goñi, F.M. A two-dimensional IR spectroscopic (2D-IR) simulation of protein conformational changes. J. Spectrosc. 2004, 18, 49–58. [Google Scholar] [CrossRef] [Green Version]
  21. Yan, Y.B.; Wang, Q.; He, H.W.; Zhou, H.M. Protein thermal aggregation involves distinct regions: Sequential events in the heat-induced unfolding and aggregation of hemoglobin. Biophys. J. 2004, 86, 1682–1690. [Google Scholar] [CrossRef] [PubMed] [Green Version]
  22. Proskurnin, M.A.; Volkov, D.S.; Rogova, O.B. Two-Dimensional Correlation IR Spectroscopy of Humic Substances of Chernozem Size Fractions of Different Land Use. Agronomy 2023, 13, 1696. [Google Scholar] [CrossRef]
  23. Katon, J.E.; Phillips, D.B. Infrared Spectroscopy at Subambient Temperatures. Appl. Spectrosc. Rev. 1973, 7, 1–45. [Google Scholar] [CrossRef]
  24. Zallen, R.; Conwell, E.M. The effect of temperature on libron frequencies in molecular crystals: Implications for TTF-TCNQ. Solid State Commun. 1979, 31, 557–561. [Google Scholar] [CrossRef]
  25. Nanda, S.; Reddy, S.N.; Hunter, H.N.; Butler, I.S.; Kozinski, J.A. Supercritical Water Gasification of Lactose as a Model Compound for Valorization of Dairy Industry Effluents. Ind. Eng. Chem. Res. 2015, 54, 9296–9306. [Google Scholar] [CrossRef]
  26. Sirotiak, M.; Bartošová, A. Changes in Structure and Content Humic Substances in Soil During the Laboratory Simulated Fires. Trans. Všb—Tech. Univ. Ostrav. Saf. Eng. Ser. 2016, 11, 42–48. [Google Scholar] [CrossRef] [Green Version]
  27. Proskurnin, M.A.; Volkov, D.S.; Rogova, O.B. Temperature Dependences of IR Spectral Bands of Humic Substances of Silicate-Based Soils. Agronomy 2023, 13, 1740. [Google Scholar] [CrossRef]
  28. Volkov, D.; Rogova, O.; Proskurnin, M. Temperature Dependences of IR Spectra of Humic Substances of Brown Coal. Agronomy 2021, 11, 1822. [Google Scholar] [CrossRef]
  29. Samofalova, I.A.; Rogova, O.B.; Luzyanina, O.A. Diagnostics of soils of different altitudinal vegetation belts in the Middle Urals according to group composition of iron compounds. Geogr. Nat. Resour. 2016, 37, 71–78. [Google Scholar] [CrossRef]
  30. Vodyanitskii, Y.N.; Rogova, O.B.; Pinskii, D.L. Application Of The Langmuir and Dubinin-Radushkevich Equations to the Description of Cu And Zn Adsorption In Rendzinas. Eurasian Soil Sci. 2000, 33, 1226–1233. [Google Scholar]
  31. Volkov, D.; Rogova, O.; Proskurnin, M. Organic Matter and Mineral Composition of Silicate Soils: FTIR Comparison Study by Photoacoustic, Diffuse Reflectance, and Attenuated Total Reflection Modalities. Agronomy 2021, 11, 1879. [Google Scholar] [CrossRef]
  32. Krivoshein, P.K.; Volkov, D.S.; Rogova, O.B.; Proskurnin, M.A. FTIR photoacoustic spectroscopy for identification and assessment of soil components: Chernozems and their size fractions. Photoacoustics 2020, 18, 100162. [Google Scholar] [CrossRef]
  33. Kholodov, V.A.; Konstantinov, A.I.; Kudryavtsev, A.V.; Perminova, I.V. Structure of humic acids in zonal soils from 13C NMR data. Eurasian Soil Sci. 2011, 44, 976–983. [Google Scholar] [CrossRef]
  34. Rogova, O.B.; Kolobova, N.A.; Ivanov, A.L. Phosphorus Sorption Capacity of Gray Forest Soil as Dependent on Fertilization System. Eurasian Soil Sci. 2018, 51, 536–541. [Google Scholar] [CrossRef]
  35. Sukhoveeva, O.E.; Zolotukhin, A.N.; Karelin, D.V. Climate-Determined Changes of Organic Carbon Stocks in the Arable Chernozem of Kursk Region. Arid. Ecosyst. 2020, 10, 148–155. [Google Scholar] [CrossRef]
  36. Mikhailova, E.A.; Post, C.J. Effects of land use on soil inorganic carbon stocks in the Russian Chernozem. J. Environ. Qual. 2006, 35, 1384–1388. [Google Scholar] [CrossRef]
  37. Krylov, V.A.; Mamontov, V.G.; Lazarev, V.I.; Ryzhkov, O.V. The Influence of Different Land Uses on the Elemental Composition of Labile Humus Substances in Typical Chernozem Typical of Kursk Oblast. Eurasian Soil Sci. 2022, 55, 1033–1040. [Google Scholar] [CrossRef]
  38. Artemyeva, Z.; Danchenko, N.; Kolyagin, Y.; Kirillova, N.; Kogut, B. Chemical structure of soil organic matter and its role in aggregate formation in Haplic Chernozem under the contrasting land use variants. Catena 2021, 204, 105403. [Google Scholar] [CrossRef]
  39. Shein, E.V.; Lazarev, V.I.; Aidiev, A.Y.; Sakunkonchak, T.; Kuznetsov, M.Y.; Milanovskii, E.Y.; Khaidapova, D.D. Changes in the physical properties of typical chernozems of Kursk oblast under the conditions of a long-term stationary experiment. Eurasian Soil Sci. 2011, 44, 1097–1103. [Google Scholar] [CrossRef]
  40. Kuznetsova, I.V. Changes in the physical status of the typical and leached chernozems of Kursk oblast within 40 years. Eurasian Soil Sci. 2013, 46, 393–400. [Google Scholar] [CrossRef]
  41. Krylov, V.A.; Mamontov, V.G. The Impact of Different Cenoses on the Thermal Characteristics of Labile Humic Substances of Typical Chernozem in Kursk Oblast. Eurasian Soil Sci. 2022, 55, 452–459. [Google Scholar] [CrossRef]
  42. Ovechkin, S.V.; Bazykina, G.S. The carbonate profile and water regime of migrational-mycelial chernozems in different ecosystems of Kursk oblast. Eurasian Soil Sci. 2011, 44, 1352–1363. [Google Scholar] [CrossRef]
  43. Arkhangel’skaya, T.A.; Velichenko, M.V.; Tikhonravova, P.I. Thermal properties of typical chernozems in Kursk Oblast. Eurasian Soil Sci. 2016, 49, 1109–1116. [Google Scholar] [CrossRef]
  44. Dubovik, E.V.; Dubovik, D.V. Relationships between the Organic Carbon Content and Structural State of Typical Chernozem. Eurasian Soil Sci. 2019, 52, 150–161. [Google Scholar] [CrossRef]
  45. Mamontov, V.G.; Rodionova, L.P.; Artemieva, Z.S.; Krylov, V.A.; Klyshbekov, G.K. Agrogenic and postagrogenic transformation of the structure of typical chernozem Kursk region. Mezhdunarodnyi Sel’skokhozyaistvennyi Zhurnal 2019, 62, 35–39. [Google Scholar] [CrossRef]
  46. Kholodov, V.A.; Yaroslavtseva, N.V.; Farkhodov, Y.R.; Belobrov, V.P.; Yudin, S.A.; Aydiev, A.Y.; Lazarev, V.I.; Frid, A.S. Changes in the Ratio of Aggregate Fractions in Humus Horizons of Chernozems in Response to the Type of Their Use. Eurasian Soil Sci. 2019, 52, 162–170. [Google Scholar] [CrossRef]
  47. Kholodov, V.A.; Yaroslavtseva, N.V.; Yashin, M.A.; Frid, A.S.; Lazarev, V.I.; Tyugai, Z.N.; Milanovskiy, E.Y. Contact angles of wetting and water stability of soil structure. Eurasian Soil Sci. 2015, 48, 600–607. [Google Scholar] [CrossRef]
  48. Khaidapova, D.D.; Chestnova, V.V.; Shein, E.V.; Milanovskii, E.Y. Rheological properties of typical chernozems (Kursk oblast) under different land uses. Eurasian Soil Sci. 2016, 49, 890–897. [Google Scholar] [CrossRef]
  49. Mikhailova, E.A.; Bryant, R.B.; Vassenev, I.I.; Schwager, S.J.; Post, C.J. Cultivation Effects on Soil Carbon and Nitrogen Contents at Depth in the Russian Chernozem. Soil Sci. Soc. Am. J. 2000, 64, 738–745. [Google Scholar] [CrossRef]
  50. Volkov, D.S.; Rogova, O.B.; Proskurnin, M.A.; Farkhodov, Y.R.; Markeeva, L.B. Thermal stability of organic matter of typical chernozems under different land uses. Soil Tillage Res. 2020, 197, 104500. [Google Scholar] [CrossRef]
  51. Krivoshein, P.K.; Volkov, D.S.; Rogova, O.B.; Proskurnin, M.A. FTIR Photoacoustic and ATR Spectroscopies of Soils with Aggregate Size Fractionation by Dry Sieving. ACS Omega 2022, 7, 2177–2197. [Google Scholar] [CrossRef]
  52. Figueroa-Cisterna, J.; Bagur-Gonzalez, M.G.; Morales-Ruano, S.; Carrillo-Rosua, J.; Martin-Peinado, F. The use of a combined portable X ray fluorescence and multivariate statistical methods to assess a validated macroscopic rock samples classification in an ore exploration survey. Talanta 2011, 85, 2307–2315. [Google Scholar] [CrossRef] [PubMed] [Green Version]
  53. R Core Team. R: A Language and Environment for Statistical Computing; R Foundation for Statistical Computing: Vienna, Austria, 2013. [Google Scholar]
  54. Kuhn, M. Building Predictive Models in R Using the caret Package. J. Stat. Softw. 2008, 28, 1–26. [Google Scholar] [CrossRef] [Green Version]
  55. Venables, W.N.; Ripley, B.D. Modern Applied Statistics with S; Springer: New York, NY, USA, 2002. [Google Scholar]
  56. Weihs, C.; Ligges, U.; Luebke, K.; Raabe, N. klaR Analyzing German Business Cycles. In Data Analysis and Decision Support; Baier, D., Decker, R., Schmidt-Thieme, L., Eds.; Studies in Classification, Data Analysis, and Knowledge Organization; Springer: Berlin/Heidelberg, Germany, 2005; pp. 335–343. [Google Scholar]
  57. Wickham, H. ggplot2; Springer: Cham, Switzerland, 2009. [Google Scholar]
  58. Garczarek, U. Classification Rules in Standardized Partition Spaces; Universität Dortmund: Dortmund, Germany, 2002. [Google Scholar]
  59. Kronenberg, A.K. Chapter 4. Hydrogen Speciation and Chemical Weakening of Quartz. In Silica; De Gruyter: Berlin, Germany, 1994; pp. 123–176. [Google Scholar]
  60. Russell, J.D.; Fraser, A.R. Infrared methods. In Clay Mineralogy: Spectroscopic and Chemical Determinative Methods; Wilson, M.J., Ed.; Springer: Dordrecht, The Netherlands, 1994; pp. 11–67. [Google Scholar]
  61. Madejová, J. Baseline Studies of the Clay Minerals Society Source Clays: Infrared Methods. Clays Clay Miner. 2001, 49, 410–432. [Google Scholar] [CrossRef]
  62. Raichlin, Y.; Millo, A.; Katzir, A. Investigations of the structure of water using mid-IR fiberoptic evanescent wave spectroscopy. Phys. Rev. Lett. 2004, 93, 185703. [Google Scholar] [CrossRef]
  63. Calderón, F.J.; Mikha, M.M.; Vigil, M.F.; Nielsen, D.C.; Benjamin, J.G.; Reeves, J.B. Diffuse-Reflectance Mid-infrared Spectral Properties of Soils under Alternative Crop Rotations in a Semi-arid Climate. Commun. Soil Sci. Plant Anal. 2011, 42, 2143–2159. [Google Scholar] [CrossRef]
  64. Calderón, F.J.; Reeves, J.B.; Collins, H.P.; Paul, E.A. Chemical Differences in Soil Organic Matter Fractions Determined by Diffuse-Reflectance Mid-Infrared Spectroscopy. Soil Sci. Soc. Am. J. 2011, 75, 568–579. [Google Scholar] [CrossRef] [Green Version]
  65. Changwen, D.; Jing, D.; Jianmin, Z.; Huoyan, W.; Xiaoqin, C. Characterization of Greenhouse Soil Properties Using Mid-infrared Photoacoustic Spectroscopy. Spectrosc. Lett. 2011, 44, 359–368. [Google Scholar] [CrossRef]
  66. Changwen, D.; Jianmin, Z.; Goyne, K.W. Organic and inorganic carbon in paddy soil as evaluated by mid-infrared photoacoustic spectroscopy. PLoS ONE 2012, 7, e43368. [Google Scholar] [CrossRef] [Green Version]
  67. Nguyen, T.T.; Janik, L.J.; Raupach, M. Diffuse reflectance infrared fourier transform (DRIFT) spectroscopy in soil studies. Soil. Res. 1991, 29, 49–67. [Google Scholar] [CrossRef]
  68. Hofmeister, A.M.; Bowey, J.E. Quantitative Infrared Spectra of Hydrosilicates and Related Minerals. Mon. Not. R. Astron. Soc. 2006, 367, 577–591. [Google Scholar] [CrossRef]
  69. Bock, J.A.N.; Su, G.-J. Interpretation of the Infrared Spectra of Fused Silica. J. Am. Ceram. Soc. 1970, 53, 69–73. [Google Scholar] [CrossRef]
  70. Spitzer, W.G.; Kleinman, D.A. Infrared Lattice Bands of Quartz. Phys. Rev. 1961, 121, 1324–1335. [Google Scholar] [CrossRef]
  71. Fung, M.F.K.; Senterman, M.K.; Mikhael, N.Z.; Lacelle, S.; Wong, P.T.T. Pressure-tuning fourier transform infrared spectroscopic study of carcinogenesis in human endometrium. Biospectroscopy 1998, 2, 155–165. [Google Scholar] [CrossRef]
  72. Wang, H.P.; Wang, H.C.; Huang, Y.J. Microscopic FTIR studies of lung cancer cells in pleural fluid. Sci. Total Environ. 1997, 204, 283–287. [Google Scholar] [CrossRef]
  73. Schulz, H.; Baranska, M. Identification and quantification of valuable plant substances by IR and Raman spectroscopy. Vib. Spectrosc. 2007, 43, 13–25. [Google Scholar] [CrossRef]
  74. Koike, C.; Noguchi, R.; Chihara, H.; Suto, H.; Ohtaka, O.; Imai, Y.; Matsumoto, T.; Tsuchiyama, A. Infrared Spectra of Silica Polymorphs and the Conditions of Their Formation. Astrophys. J. 2013, 778, 60. [Google Scholar] [CrossRef] [Green Version]
  75. Inoue, A.; Watanabe, T. Infrared Spectra of Interstratified Illite/Smectite from Hydrothermally Altered Tuffs (Shinzan, Japan) and Diagenetic Bentonites (Kinnekulle, Sweden). Clay Sci. 1989, 7, 263–275. [Google Scholar] [CrossRef]
  76. Ahmed, S.; Pasti, A.; Fernandez-Teran, R.J.; Ciardi, G.; Shalit, A.; Hamm, P. Aqueous solvation from the water perspective. J. Chem. Phys. 2018, 148, 234505. [Google Scholar] [CrossRef] [Green Version]
  77. Yu, H.-G.; Nyman, G. The Infrared and UV-Visible Spectra of Polycyclic Aromatic Hydrocarbons Containing (5, 7)-Member Ring Defects: A Theoretical Study. Astrophys. J. 2012, 751, 3. [Google Scholar] [CrossRef]
  78. Workman, J. The Handbook of Organic Compounds, Three-Volume Set: NIR, IR, R, and UV-Vis Spectra Featuring Polymers and Surfactants; Elsevier Science: Amsterdam, The Netherlands, 2000. [Google Scholar]
  79. San Andrés, E.; del Prado, A.; Mártil, I.; González-Díaz, G.; Bravo, D.; López, F.J.; Fernández, M.; Bohne, W.; Röhrich, J.; Selle, B.; et al. Bonding configuration and density of defects of SiOxHy thin films deposited by the electron cyclotron resonance plasma method. J. Appl. Phys. 2003, 94, 7462–7469. [Google Scholar] [CrossRef]
  80. Tong, Y.; Kampfrath, T.; Campen, R.K. Experimentally probing the libration of interfacial water: The rotational potential of water is stiffer at the air/water interface than in bulk liquid. Phys. Chem. Chem. Phys. 2016, 18, 18424–18430. [Google Scholar] [CrossRef] [Green Version]
  81. Chiang, H.P.; Song, R.; Mou, B.; Li, K.P.; Chiang, P.; Wang, D.; Tse, W.S.; Ho, L.T. Fourier transform Raman spectroscopy of carcinogenic polycyclic aromatic hydrocarbons in biological systems: Binding to heme proteins. J. Raman Spectrosc. 1999, 30, 551–555. [Google Scholar] [CrossRef]
  82. Schenzel, K.; Almlöf, H.; Germgård, U. Quantitative analysis of the transformation process of cellulose I → cellulose II using NIR FT Raman spectroscopy and chemometric methods. Cellulose 2009, 16, 407–415. [Google Scholar] [CrossRef]
  83. Zelsmann, H.R. Temperature dependence of the optical constants for liquid H2O and D2O in the far IR region. J. Mol. Struct. 1995, 350, 95–114. [Google Scholar] [CrossRef]
  84. Max, J.J.; Chapados, C. Isotope effects in liquid water by infrared spectroscopy. III. H2O and D2O spectra from 6000 to 0 cm–1. J. Chem. Phys. 2009, 131, 184505. [Google Scholar] [CrossRef]
  85. Baes, A.U.; Bloom, P.R. Diffuse Reflectance and Transmission Fourier Transform Infrared (DRIFT) Spectroscopy of Humic and Fulvic Acids. Soil Sci. Soc. Am. J. 1989, 53, 695–700. [Google Scholar] [CrossRef]
  86. Colthup, N.B.; Daly, L.H.; Wiberley, S.E. Introduction to Infrared and Raman Spectroscopy; Elsevier Science: San Diego, CA, USA, 1990. [Google Scholar]
  87. Kholodov, V.A.; Yaroslavtseva, N.V.; Konstantinov, A.I.; Perminova, I.V. Preparative yield and properties of humic acids obtained by sequential alkaline extractions. Eurasian Soil Sci. 2015, 48, 1101–1109. [Google Scholar] [CrossRef]
  88. Day, K.L. Temperature Dependence of Mid-Infrared Silicate Absorption. Astrophys. J. 1976, 203, L99. [Google Scholar] [CrossRef]
  89. Chan, T.F.; Su, J.H.; Chung, Y.F.; Chang, H.L.; Yuan, S.S. Decreased serum leptin levels in women with uterine leiomyomas. Acta Obstet. Gynecol. Scand. 2003, 82, 173–176. [Google Scholar] [CrossRef]
  90. Boguta, P.; Sokolowska, Z.; Skic, K. Use of thermal analysis coupled with differential scanning calorimetry, quadrupole mass spectrometry and infrared spectroscopy (TG-DSC-QMS-FTIR) to monitor chemical properties and thermal stability of fulvic and humic acids. PLoS ONE 2017, 12, e0189653. [Google Scholar] [CrossRef] [PubMed] [Green Version]
  91. Gerasimova, М.I.; Bronnikova, М.A.; Khitrov, N.B.; Shorkunov, I.G. Hierarchical morphogenetic analysis of Kursk chernozem. Dokuchaev Soil Bull. 2016, 86, 64–76. [Google Scholar] [CrossRef]
  92. Bazykina, G.S.; Ovechkin, S.V. Migration-mycelial chernozems in biospheric cycles within the Kursk region. Dokuchaev Soil Bull. 2012, 70, 3–18. [Google Scholar] [CrossRef]
  93. Chendev, Y.G.; Sauer, T.J.; Ramirez, G.H.; Burras, C.L. History of East European Chernozem Soil Degradation; Protection and Restoration by Tree Windbreaks in the Russian Steppe. Sustainability 2015, 7, 705–724. [Google Scholar] [CrossRef] [Green Version]
  94. Lützow, M.v.; Kögel-Knabner, I.; Ekschmitt, K.; Matzner, E.; Guggenberger, G.; Marschner, B.; Flessa, H. Stabilization of organic matter in temperate soils: Mechanisms and their relevance under different soil conditions—A review. Eur. J. Soil Sci. 2006, 57, 426–445. [Google Scholar] [CrossRef]
  95. Piccolo, A.; Mbagwu, J.S.C. Role of Hydrophobic Components of Soil Organic Matter in Soil Aggregate Stability. Soil Sci. Soc. Am. J. 1999, 63, 1801–1810. [Google Scholar] [CrossRef]
  96. Shein, E.V.; Milanovskiy, E. The Role of Organic Matter in the Formation and Stability of Soil Aggregates. Eurasian Soil Sci. 2003, 36, 51–58. [Google Scholar]
  97. Andriopoulou, N.C.; Christidis, G.E. Multi-analytical characterisation of wheat biominerals: Impact of methods of extraction on the mineralogy and chemistry of phytoliths. Archaeol. Anthropol. Sci. 2020, 12, 186. [Google Scholar] [CrossRef]
  98. Silantyeva, M.; Solomonova, M.; Speranskaja, N.; Blinnikov, M.S. Phytoliths of temperate forest-steppe: A case study from the Altay, Russia. Rev. Palaeobot. Palynol. 2018, 250, 1–15. [Google Scholar] [CrossRef]
  99. Struyf, E.; Smis, A.; Van Damme, S.; Meire, P.; Conley, D.J. The Global Biogeochemical Silicon Cycle. Silicon 2010, 1, 207–213. [Google Scholar] [CrossRef]
  100. Schaller, J.; Puppe, D.; Kaczorek, D.; Ellerbrock, R.; Sommer, M. Silicon Cycling in Soils Revisited. Plants 2021, 10, 295. [Google Scholar] [CrossRef] [PubMed]
  101. Wu, Y.; Yang, Y.; Wang, H.; Wang, C. The effects of chemical composition and distribution on the preservation of phytolith morphology. Appl. Phys. A 2013, 114, 503–507. [Google Scholar] [CrossRef]
  102. Haynes, R.J. The nature of biogenic Si and its potential role in Si supply in agricultural soils. Agric. Ecosyst. Environ. 2017, 245, 100–111. [Google Scholar] [CrossRef]
  103. Shillito, L.M.; Almond, M.J.; Nicholson, J.; Pantos, M.; Matthews, W. Rapid characterisation of archaeological midden components using FT-IR spectroscopy, SEM-EDX and micro-XRD. Spectrochim. Acta A Mol. Biomol. Spectrosc. 2009, 73, 133–139. [Google Scholar] [CrossRef]
  104. Zancajo, V.M.R.; Diehn, S.; Filiba, N.; Goobes, G.; Kneipp, J.; Elbaum, R. Spectroscopic Discrimination of Sorghum Silica Phytoliths. Front. Plant Sci. 2019, 10, 1571. [Google Scholar] [CrossRef] [Green Version]
  105. Cavalli, M.; Gnappi, G.; Montenero, A.; Bersani, D.; Lottici, P.P.; Kaciulis, S.; Mattogno, G.; Fini, M. Hydroxy- and fluorapatite films on Ti alloy substrates: Sol-gel preparation and characterization. J. Mater. Sci. 2001, 36, 3253–3260. [Google Scholar] [CrossRef]
  106. Noda, L.; Sensato, F.; Gonçalves, N. Titanyl Sulphate, an Inorganic Polymer: Structural Studies and Vibrational Assignment. Química Nova 2019, 42, 1112–1115. [Google Scholar] [CrossRef]
  107. Pizzeghello, D.; Schiavon, M.; Francioso, O.; Dalla Vecchia, F.; Ertani, A.; Nardi, S. Bioactivity of Size-Fractionated and Unfractionated Humic Substances from Two Forest Soils and Comparative Effects on N and S Metabolism, Nutrition, and Root Anatomy of Allium sativum L. Front. Plant Sci. 2020, 11, 1203. [Google Scholar] [CrossRef] [PubMed]
  108. Hamkalo, Z.; Bedernichek, T. Labile pool of soil organic matter as an indicator of its ecological quality under different land use conditions. Ekosyistemy Ikh Optim. I Okhrana (Optim. Prot. Ecosyst.) 2014, 10, 193–200. [Google Scholar]
  109. Volkov, D.S.; Rogova, O.B.; Proskurnin, M.A. Photoacoustic and photothermal methods in spectroscopy and characterization of soils and soil organic matter. Photoacoustics 2020, 17, 100151. [Google Scholar] [CrossRef] [PubMed]
  110. Park, Y.; Jin, S.; Noda, I.; Jung, Y.M. Continuing progress in the field of two-dimensional correlation spectroscopy (2D-COS), part I. Yesterday and today. Spectrochim. Acta A Mol. Biomol. Spectrosc. 2022, 281, 121573. [Google Scholar] [CrossRef]
  111. Park, Y.; Noda, I.; Jung, Y.M. Novel developments and applications of two-dimensional correlation spectroscopy. J. Mol. Struct. 2016, 1124, 11–28. [Google Scholar] [CrossRef]
Figure 1. Changes in the band maxima upon heating; redshifts are negative; blueshifts are positive and marked as colored backgrounds: (a) arable land (fraction, 50–100 μm); (b) native steppe (fraction, below 20 μm); (c) a band at 1163 cm−1, different fractions of native steppe and quartz (fraction, 10–50 μm); and (d) a band at 695 cm−1, different land uses (fractions, 50–100 μm) and quartz.
Agronomy 13 01967 g001
Figure 2. Thermal behavior of integral band areas of at 2780, 1360, and 1260 cm−1 of native steppe (fraction, 50–100 µm).
Agronomy 13 01967 g002
Figure 3. Thermal behavior of integral band areas (a) at 1160, 795, 697, 394, and 261 cm−1 of native steppe (fraction, 50–100 µm); (b) various fractions of native steppe and quartz, a band at 1160 cm−1; (c) various fractions of native steppe and quartz, a band at 262 cm−1; (d) various fractions of native steppe and quartz, a band at 394 cm−1.
Agronomy 13 01967 g003
Figure 4. Thermal behavior of the integral band area at 1625 cm−1; native steppe (fraction, 50–100 µm). Slopes for three linear parts of the curves are denoted by dashed lines. See the text for details.
Agronomy 13 01967 g004
Figure 5. Thermal behavior of integral band areas for the bands of 1160, 1120, and 1040 cm−1; native steppe (fraction, 50–100 µm).
Agronomy 13 01967 g005
Figure 6. Thermal behavior of the integral band areas at 525, 465, and 180 cm−1; native steppe (fraction, 50–100 µm).
Agronomy 13 01967 g006
Figure 7. Thermal behavior of ratios of integral band areas for chernozem samples and quartz: (a) 776 cm−1 (range, 785–765 cm−1) and (b) 420 cm−1 (range, 431–411 cm−1).
Agronomy 13 01967 g007
Figure 8. Normalized ATR IR absorption spectra in the ranges 750–670 cm−1 (a,c,e) and 460–380 cm−1 (b,d,f): (a,b) quartz (fraction, 10–50 μm); (c,d) native steppe (fraction, 50–100 μm), (e,f) bare fallow (fraction, 50–100 μm). Temperature increases from 25 to 215 °C, from light blue through violet to light magenta lines.
Agronomy 13 01967 g008aAgronomy 13 01967 g008b
Figure 9. Results of classification of chernozem land-use types based on linear discriminant analysis of IR spectra in the range of 4000–100 cm−1 by (a) a full spectrum and (b) by specific wavenumbers. The x-axis (LD1) is the first linear discriminant. The y-axis (LD2) is the second linear discriminant. The color indicates the type of land use. Point size shows the fraction size.
Agronomy 13 01967 g009
Figure 10. Results of classification of chernozem land-use types based on linear discriminant analysis of IR spectra in the range of 1200–200 cm−1 by (a) a full spectrum and (b) by specific wavenumbers. The x-axis (LD1) is the first linear discriminant. The y-axis (LD2) is the second linear discriminant. The color indicates the type of land use. Point size shows the fraction size.
Agronomy 13 01967 g010
Table 1. Major bands in ATR-FTIR spectra of studied chernozem soils and their fractions and their thermal behavior.
Band Maximum *,
cm−1
Band Intensities and Changes of Integral Intensity with Temperature *SiO2/Mineral and
Water Constituents
Organic Matter
3690, 3620m ↑SiO–HOH2 stretch (amorph.), kaolin [59,60,61]n/a
3520–3370s ↓water, v3O–H: phenolic, alcohol, carboxylic
3350s ↓SiO–H OH2
SiO–H stretch (α-quartz) [59];
water, v1, v3, and v2 overtone [62]
n/a
3270s ↑water, v1O–H, phenolic, alcohol, carboxylic C=O overtone
B 2920, B 2860–2850w ↑n/aC–H, CH2 stretch [63,64,65,66]
1845 Q, 1790–1775 Qw =SiO2 combination C=O stretching
R 1740w =n/aC=O stretching
R 1628s ↓SiOHHOH; HO–H stretching (amorph.) [59]; water, v2N–H bending, C=O stretching
1580 Qw =SiO2 overtoneC–C stretching, aromatic rings
1450–1400m =SiO2 amorph. combination;
carbonates [67]
O–H, C–H scissoring
R 1360w =SiO2 combination [68]n/a
R 1265m ↑SiO2 combination Amide III, C–O stretching, aromatic rings and carboxylic acids [65], CH2 rocking; C–N stretching
R 1175 Qw ↓SiO2 combination [68], amorph. [69]CH2 wagging
B 1153–1163 Qs ↑SiO2 lattice [70]C–O of carbohydrates; H-bonded stretching of C–OH; CH deformation [71,72,73]
1120m =amorph. silica [74]n/a
B 1100–1080 (sh) Qs =O–Si–O lattice stretch [70]in plane C–H bending (aromatic);
C=C bending
1070 Qs ↓SiO2 (kaolinite, illite)
O–Si–O lattice, stretching [70]
n/a
R 1037 (sh) Qs ↓silicate (kaolinite, illite) Si–O as stretching; Al–O stretching [67]in plane C–H bending (non-aromatic) and (?) carbohydrates
1000s ↓SiO2 Si–O stretching, latticein plane C–H bending (non-aromatic) and (?) carbohydrates; carboxyl out-of-plane C–O–H bending
930–910 (sh)s ↓silicate, aluminosilicates, overtone [69]n/a
B 830 (sh)w ↓Al–OH (clay minerals), smectite, illite [75]Cellulose
R 796 Qs ↓SiO2 silicate, lattice s Si–O–Si stretching [69,70] out-of-plane C–H bend (non-aromatic)
R 776–775 Qs ↓α-quartz [70,74]; water librations, wagging (L3) [76](?) polyaromatic;
–C–H bending (substituted)
R 750–740 (sh)w =Mg–OH, Al–OH (clay minerals)polyaromatic [77]; out of plane –C–H bending (aromatic);
in-phase rocking of alkanes C4+ [78]
R 722 (sh)w =(?) water, librationsout-of-plane –C–H bend (aromatic); in-phase rocking of alkanes C4+ [78]
R 697 Qm =SiO2 Si–O–Si bend [70]aromatic, polyaromatic
R 650m =Kaolin, clinochlore, Mg-Al-silicatesn/a
R 625 Qw =Structural vibrations, quartz [79]; water, librations, rocking (L2) [76,80]non-carboxylic, out-of-plane C–O–H bend; –C–H out-of-plane bending, in biosystems [81]
530–520 Qm ↓α-quartz (?) [70] kaolinite silicate O–Si–O bend [70], n/a
460 Qs =SiO2 O–Si–O bending [69]; O–Al–O [67]n/a
R 445 Qs =SiO2 O–Si–O bend lattice [69,70]C–C–C bending [82]
430–420 Qs ↑Mg–OH, Al–OH (clay minerals) water, librations twisting (L1) [76]C–C–C bending [82]
394 Qs =SiO2 O–Si–O, bend lattice [70]; water, librations, twisting mode (L1) [83]n/a
B 368–364 Qs ↓R(SiO4) [68]; amorph. silica [69]; SiO2 latticen/a
B 330 Qw =α-quartz, kaolin
(?) Mg–O stretch [68]
n/a
303w =montmorilloniten/a
279w =(?) amorphous silican/a
R 263–258 Qs ↓α-quartz [74]n/a
228w =α-quartz [74]n/a
190–180w =α-quartz [74]; hydrogen bond stretchingn/a
140w =α-quartz [74]n/a
Notes: * Bands with significant frequency shifts with temperature are denoted as bold with prefixes R (redshift) and B (blueshift); sh is a shoulder band; n/a is not available; Q after the wavenumber means an intense band in the quartz spectra; intensities: w, weak; m, medium; s, strong; “↑”, an increase; “↓”, a decrease; and “=”, no change.
Disclaimer/Publisher’s Note: The statements, opinions and data contained in all publications are solely those of the individual author(s) and contributor(s) and not of MDPI and/or the editor(s). MDPI and/or the editor(s) disclaim responsibility for any injury to people or property resulting from any ideas, methods, instructions or products referred to in the content.

