Abstract
Maize (Zea mays L.) is widely cultivated worldwide and in Brazil under different production systems and technology levels. However, the interaction with different environments may hinder an accurate indication of maize genotypes. The effects of the genotype × environment (G × E) interaction and the stability parameters must be considered to indicate responsive genotypes for the different cultivation regions. Thirteen maize varieties, including nine traditional (farmer-led selection and adaptation) and four commercial (bred and produced for specific markets through formal breeding programs) varieties, were evaluated in nine environments in Espírito Santo, Brazil, to study G × E interaction, identify adaptable and stable materials, and explore variability through genetic resources, using a randomized block design with three replications. Adaptability and stability parameters were tested using five different methodologies. The variety Aliança approached the level considered as broad adaptability. Environments 5, 6, 7, and 9 were classified as unfavorable. The varieties Alfredo Chaves, Catete and Catetim showed good stability indexes, with an average productivity of 5870.36, 5259.27 and 4914.20 kg/ha, respectively. Our findings will allow the exploration of the variability and genetic resources of some important materials, providing potential for gains in genetic breeding.
1. Introduction
Maize (Zea mays L.) is extensively grown in Brazil and globally across diverse production systems and several levels of technological advancements [1]. Nevertheless, the interaction of maize with different environments may hinder the indication of genotypes for each of the growing regions since the interaction can be positive regarding productivity and adaptation for one area and can show the opposite response for another. Therefore, it is essential to test these genotypes in different environments and planting times to verify their interaction with the environment, to optimize the effects of this interaction and to identify genotypes that best respond to changes, differences and environmental stimuli [2,3].
The production of maize grains per cultivated area has been growing in the last forty years. However, there are several growing regions with their own environmental peculiarities, causing great fluctuation when indicating suitable genotypes for these areas. The study of the genotype–environment interaction helps to minimize the risks of indicating genotypes that might not be suitable for a given region [4].
The effects of G × E interaction, together with adaptability and stability parameters, are indispensable for breeding programs [5]. Since genotypes can present behavior, development, and consequently differentiated productivity due to the environmental variations to which they are submitted, it is essential that the breeder is aware of the type of interaction and behavior the genotypes present in the face of the changes in the environment, so that they can properly plan the structure of the breeding program [6].
The study of adaptability and stability refers to the responsiveness of genotypes to environmental stimuli and the predictable behavior of these responses as a function of such stimuli, respectively [7]. The genotypes must be evaluated in different locations, at different planting times, not only in terms of their productivity but also considering their adaptability, stability and adequacy to each target region of work in order to reduce the chances of wrong recommendations [6]. The identification of superior genotypes through the G × E interaction is not a simple task [8]. However, such studies allow the identification of ideal genotypes for each region, increasing the productive potential and reducing production costs [9]. Several methods have been developed for this type of study. The methodology of mixed models considers errors within each environment and provides genetic values already in the function of their stability together with adaptability, allowing the selection under three important attributes: productivity, adaptability and stability [6].
The state of Espírito Santo, which belongs to the southeastern region of Brazil, presents many environmental, temperature and relief variations [10]. It is also a state in which agricultural production is predominantly carried out by small farmers, most of whom carry and maintain family traditions dating back hundreds of years. It is from this tradition that the seeds of the landrace maize varieties, the target of the present study, have been brought and conserved. The landrace varieties present potential to be used in several different manners since their genetic variability is gigantic and still little known. A study of adaptability and stability may indicate which varieties can produce and adapt in each region according to climatic variations, soil type and relief and different planting times.
The G × E analysis is important for studying maize because it provides insights into the complex interaction between genotypes and environments, guiding the selection and development of maize varieties that are well-adapted, high yielding, resilient to climate change, and optimized for resource utilization. Thus, the main aim of this work is to study the G × E interaction of maize varieties grown in the state of Espírito Santo to identify adaptable and stable materials. This will allow the exploration of the variability and genetic resources present in these materials, thereby offering the potential for genetic breeding improvements. Ultimately, this research will benefit producers, consumers, and the scientific community.
2. Material and Methods
2.1. Field Test
Thirteen varieties were selected for the test based on their widespread cultivation. The tests were installed in the following locations: Experimental Farm of Venda Nova do Imigrante (FEVN), Experimental Farm of Incaper de Linhares (FEL), Experimental Farm Bananal do Norte (FEBN—Cachoeiro de Itapemirim) and in rural properties in the municipalities of Mucurici and Mimoso do Sul.
The soil textures differed according to the regions as they present different terrains and climates. The following classification is attributed to each locality: FEVN—yellow latosol; FEL—Fluvic Cambisol; FEBN—red argisol; Mucurici—yellow argisol; Mimoso do Sul—yellow latosol [11].
Plantings were carried out in different years and harvests, totaling nine different environments (Table 1). The experiments were carried out in a randomized block design (DBC) with three replications; the experimental plots were composed of 4 rows of 2.0 m, spaced with 1.0 m between rows and five plants per linear meter. The useful area of the plot consisted of the two central lines with the evaluation of five plants randomly collected within the useful plot. Productivity was evaluated in the research.

Table 1.
Locations, planting time, cycle, precipitation, humidity and temperature of each planting region of the thirteen maize varieties in Espírito Santo.
2.2. Data Analysis
To estimate the adaptability and stability parameters, the following methods were used: Eberhart & Russell [13], Lin & Binns [14], Annicchiarico [15], additive main effects and multiplicative interaction (AMMI-Biplot) [16] and genotype+genotype-by-environment (GGE-Biplot) [17]. Such analyzes were performed using the Genes [18] and R [19] computer programs using the package “Metan”.
The method by Eberhart & Russel [13] is frequently used for adaptability and stability studies in several plant species [20]. This method estimates the average performance of a genotype in different environments, relating it to the performance of all of the genotypes evaluated in the same environments [21].
The Eberhart & Russel [13] method uses the following model:
where:
yij = β0i + β1i Ij + σ^ 2di + ε̅ij
Yij is the average of genotype i, on environment j;
β0i is the regression constant and represents the overall average of genotype i;
β1i is the linear regression coefficient, which measures the response of the i-th genotype to the variation of the j-th environment;
Ij is the encoded environmental index;
σ^ 2di is the variance of the regression deviations and;
ε̅ij is the mean experimental error.
The estimates of the adaptability and stability parameters are obtained through the regression coefficient β1i of each genotype in relation to the environmental index (adaptability) and through the mean square of the regression deviations σdi2 (stability). When the linear regression coefficient (β1i) is equal to 1, genotypes present general adaptability. When β1i > 1, genotypes show specific adaptability to favorable environments. When β1i < 1, genotypes present adaptability to unfavorable environments. Genotypes with predictability that is, stability of behavior, present σ^di2 = 0, and when they have unpredictable behavior, they present σdi2 ≠ 0. The coefficient of determination (R2) helps to determine the stability of the genotypes [22].
The method by Lin & Binns [14] measures the response of the genotype in relation to the best genotype in each of the environments. The estimation of the P parameter is performed through the mean square of the distance between the genotype mean and the maximum mean response obtained in the environment in which [23,24].
The Lin & Binns [14] method uses the following equation for adaptability analysis:
where:
a
Pi = ∑ (Yij − Mj)2/2a
j = 1
Pi: an estimate of the stability parameter of the ith genotype;
Yij: productivity of the i-th genotype in the j-th environment;
Mj: maximum response observed among all genotypes in the jth environment and;
a: number of environments.
According to Annicchiarico’s [15] method, all of the environments are considered for the unfolding of squares of environmental effects and G × E interaction. This then generates information for each genotype that is compared through an index that indicates favorable and unfavorable environments for each of the genotypes [25]. The adaptability and genotypic stability are given by: ωi(g) = μi(g) − Z(1 − α)σzi where ωi(g) is the recommendation index; μi(g) is the average percentage of genotypes i; Z(1-α) the percentage of the standard normal distribution function, and σzi is the standard deviation of the Zij values, which is associated with the ith genotype [26].
Annicchiarico’s [15] method is based on the ωi(g) decomposition, and the stability is analyzed using the following statistical model:
where:
ωi(g) = µi(g) − Z(1 − α)
ωi(g): recommendation index;
µi(g): average percentage of genotypes;
Z(1 − α): percentage of the standard normal distribution function;
σzi: standard deviation of Zij values associated with the ith genotype.
The AMMI-Biplot method combines analysis of variance with principal component analysis, where the additive components study the additive effects, and the multiplicative components study the G × E interaction [15]. This method uses the following equation:
where,
n
Y̅ij = μ + gi + aj + ∑ λkγikαjk + rij + εij
k = 1
Y̅ij is the average productivity of genotype i in environment j;
μ: is the general average of the experiments;
gi: effect of genotype i;
aj: effect of environment j;
∑ k = 1λkγikαjk: multiplicative interaction effect, where:
λk: singular value;
γik and αjk are the k-axis PCA scores for genotype and environment, respectively; n is the number of principal components retained to describe the pattern of G × E interaction;
rij: residual effect of the AMMI model;
εij: experimental error considered to be of random effect.
The GGE analysis uses the statistical model:
where:
Yij − μ − Ej = Y1εi1ρj1 + Y2εi2ρj2 + εij
Yij: productivity of the i-th genotype in the j-th environment;
μ: overall mean;
Ej: environment effect;
Y1 and Y2: singular values of IPCA1 and IPCA2;
εi1 and εi2: IPCA1 and IPCA2 scores referring to the ith genotype;
ρj1 and ρj2: IPCA1 and IPCA2 scores referring to the jth environment;
εij: residual effect not explained by any of the factors (“noise”).
3. Results
3.1. Classification of the Environments
The analysis of environmental index using the method proposed by Annicchiarico [15] (Table 2) revealed that four out of the nine environments, namely, environment 5 (Cachoeiro de Itapemirim 2019), environment 6 (Venda Nova do Imigrante 2019), environment 7 (Cachoeiro de Itapemirim 2019/2), and environment 9 (Cachoeiro de Itapemirim 2020), were categorized as unfavorable. The favorable environments followed the ranking according to average productivity: environment 1, environment 2, environment 4, environment 8 and environment 3.
Table 2.
Classification of the nine cultivation environments in Espírito Santo and average production by Annicchiarico’s method [15].
The environments are classified as favorable or unfavorable based on the index that each one obtained through the overall productivity average of the environments minus the average of each of the environments. Environments with higher values are considered favorable, and lower values are unfavorable. The environments with the highest production averages were 1, 2 and 4. The worst environments were 7, 9 and 5, all of them located in the municipality of Cachoeiro de Itapemirim, followed by environment 6 in Venda Nova do Imigrante.
Annicchiarico’s method [15] evaluates the performance of the genotype and its stability, where the highest values of the recommendation index (Wi) will express greater stability and genotypic adaptability (Table 3). The general analysis with all environments (WiG) shows the highest index for the variety Aliança, indicating greater stability of this variety for all environments. Later there are the varieties Catete, Incaper 201, Alfredo Chaves, Fortaleza, Incaper 203, Catetim and Palha Roxa with the highest stability indexes. The variety Milho Branco SMJ had the lowest index and was considered the most unstable among the varieties, followed by the varieties Agda Moreira, Milho Branco and Domingos Martins.
Table 3.
Estimation of stability parameters by Annicchiarico’s method [15] for grain yield, with the general analysis of all of the environments (WiG), favorable environments (WiF) and unfavorable environments (WiD).
When analyzed for favorable environments (WiF), there were differences in stability behavior. The variety Aliança maintained the highest stability index among the thirteen varieties. The varieties Palha Roxa, Incaper 203, Incaper 201, Milho Branco, Agda Moreira and Catetim showed an increase in the stability index, with emphasis on the variety Milho Branco, which passed from 65.51 (WiG) to 94.39 (WiF).
In the analysis for unfavorable environments (WiD), the varieties Fortaleza, Caiana Amarelo, Alfredo Chaves, Catete, Domingos Martins and Catetim, and Aliança presented the highest stability indexes.
The variety Aliança was highlighted with the best indices in all environments and was considered the most stable for all of the environments.
The varieties Fortaleza, Caiana Amarelo, Alfredo Chaves, Catete, Domingos Martins and Catetim showed greater stability in unfavorable environments. However, a decrease in the stability index of some varieties is also observed, as for Palha Roxa, Incaper 203, Incaper 201, Milho Branco, Agda Moreira and Milho Branco SMJ that showed better performance for favorable environments, declining when analyzed for all environments and decreasing even more when compared to unfavorable environments.
3.2. Adaptability and Stability
Varieties were also analyzed for their adaptability and stability estimates using the Eberhart and Russel [13] method (Table 4). This method is based on linear regression and considers an ideal genotype that presents high grain yield; the parameter for stability (S2d) must be low, and the parameter for adaptability (ß1) equal to 1, in addition to a high coefficient of determination (R2) [27].
Table 4.
Estimates of the adaptability and stability parameters by the method of Eberhart and Russel (1966) [13] for the characteristic grain yield of thirteen maize varieties from Espírito Santo.
The varieties Agda Moreira, Alfredo Chaves, Catete, Domingos Martins and Catetim were classified with specific adaptability to unfavorable environments since they presented ß1 lower than 1.0. Only the variety Aliança approached the classification of general or broad adaptability, as ß1 was 0.98, close to 1.0, which, according to the Eberhart and Russel method [13], is classified as general or broad adaptability.
The stability of varieties Incaper 203, Aliança, Milho Branco and Catete resulted in values lower than zero, indicating greater predictability in the face of environmental stimuli.
The method of Lin & Binns [14] indicated that the varieties Aliança, Alfredo Chaves, Catete, Catetim and Incaper 201 were the most stable considering the general analysis since they presented the lowest PiG indices highlighting the variety Aliança with the lowest index, thus showing greater stability in relation to the other genotypes in a general analysis considering all of the environments (Table 5). Some peculiarities when analyzing the performance of varieties in environments considered favorable [Pi(+)] and unfavorable [Pi(−)] are observed (Table 5). For the favorable environments, we have the varieties Aliança, Incaper 201, Alfredo Chaves, Palha Roxa and Milho Branco with the lowest PiG indices, presenting themselves as the most stable, respectively. In unfavorable environments, Alfredo Chaves, Catetim, Aliança, Domingos Martins and Fortaleza stand out with the best stability indexes. Alfredo Chaves and Catetim are noteworthy, presenting better indexes for unfavorable environments than for favorable environments, in which they are in seventh and ninth position, respectively, in relation to the thirteen varieties.
Table 5.
Estimation of adaptability and stability parameters by the method, Lin & Binns [14] for grain yield characteristics from the evaluation of thirteen landrace and commercial varieties cultivated in Espírito Santo. General response (PiG), favorable Pi (+) and unfavorable Pi (−) environments.
The variety Aliança presents the highest stability for favorable environments and ranks third among unfavorable environments.
The Agda Moreira and Milho Branco SMJ varieties showed the highest PiG indexes and were considered the least stable both in the general analysis and for favorable and unfavorable environments.
The study of adaptability and stability by AMMI graphical methods through representative points of varieties and environments (Figure 1) can explain in greater detail the interaction of genotypes with the external environment; it is being widely used in stability analyses with qualitative and quantitative characteristics [28]. The points of smaller distance, in relation to the main axis, represent greater stability. When varieties are close to or crossing the red lines that indicate environments, it shows a positive interaction. This indicates that the genotype can be grown in that location preferentially. The analysis with three principal components PC1 vs. PC2 vs. PC3 (Figure 1), together explain 80.8% of the variation in the results. The varieties Alfredo Chaves (G10) and Catetim (G13) showed greater stability to environments 6, 7 and 5, the variety Domingos Martins (G12) with the environment 6, the variety Catete (G11) with the environments 9 and 5. The aforementioned environments were previously considered unfavorable by the method of Annicchiarico, and the varieties related to them were considered with specific adaptability to unfavorable environments by the method of Eberhart and Russel [13]. The other environments were evaluated as favorable, and the rest of the varieties were classified as having specific adaptability to favorable environments. The varieties in the same directions as the environments indicate a positive association, demonstrating in which environment the material presented the greatest adaptability; that is, it managed to express its greatest potential. Variety Aliança (G4) showed a good performance since it was next to the central point of the graph, together with variety Incaper 203 (G2), indicating the greatest stability.
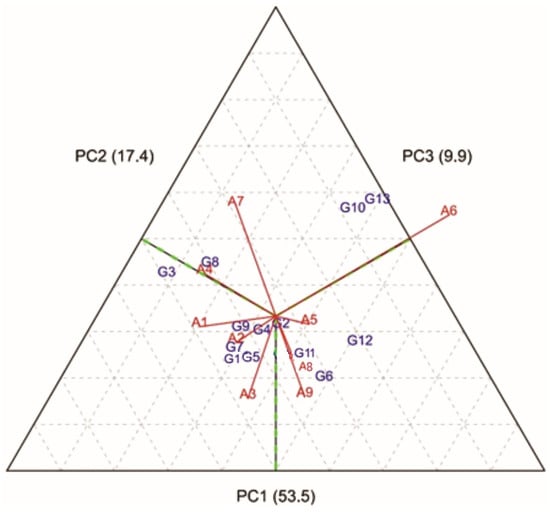
Figure 1.
AMMI analysis for grain yield of thirteen landrace and commercial maize varieties grown in Espírito Santo in nine growing environments. First principal component (PC1) × second principal component (PC2) × third principal component (PC3). G1—Palha Roxa; G2—Incaper 203; G3—Fortaleza; G4—Aliança; G5—Caiana Amarelo; G6—Incaper 201; G7—Milho Branco; G8—Agda Moreira; G9—Milho Branco SMJ; G10—Alfredo Chaves; G11—Catete; G12—Domingos Martins; G13—Catetim. A1—Venda Nova do Imigrante (2017); A2—Linhares (2018); A3—Mucurici (2019); A4—Mimoso do Sul (2019); A5—Cachoeiro de Itapemirim (2019); A6—Venda Nova do Imigrante (2019); A7—Cachoeiro de Itapemirim (2019-season 2); A8—Linhares 2020; A9—Cachoeiro de Itapemirim (2020).
3.3. Productivity
Figure 2 shows the productivity × PC1 analysis, which is the component that captured most of the explained variance (53.5%). Environments A1, A2, A3, A4 and A8 accounted for the highest yield averages among varieties. Environments A5, A6, A7 and A9 were considered worse in terms of productivity. Environment A6 presents a greater difference when compared to the others (Figure 2). Considering that there was no significant difference in the environmental conditions evaluated in the location of Venda Nova do Imigrante in 2017 and 2019, it is possible that there was some alteration in the soil that may have influenced the production. So the A6 environment was considered unfavorable in the year 2019.
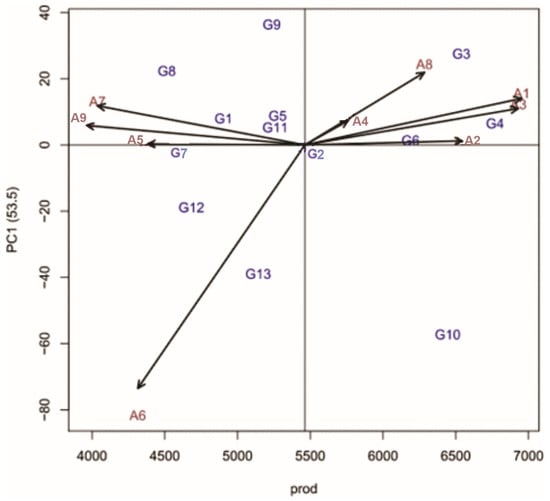
Figure 2.
AMMI analysis for grain yield of thirteen landrace and commercial maize varieties grown in Espírito Santo in nine growing environments. First principal component (PC1) × productivity (prod). G1—Palha Roxa; G2—Incaper 203; G3—Fortaleza; G4—Aliança; G5—Caiana Amarelo; G6—Incaper 201; G7—Milho Branco; G8—Agda Moreira; G9—Milho Branco SMJ; G10—Alfredo Chaves; G11—Catete; G12—Domingos Martins; G13—Catetim. A1—Venda Nova do Imigrante (2017); A2—Linhares (2018); A3—Mucurici (2019); A4—Mimoso do Sul (2019); A5—Cachoeiro de Itapemirim (2019); A6—Venda Nova do Imigrante (2019); A7—Cachoeiro de Itapemirim (2019—harvest 2); A8—Linhares 2020; A9—Cachoeiro de Itapemirim (2020).
Regarding productivity, variety Aliança (G4) resulted in the highest productivity (over 6500 kg/ha), followed by variety Fortaleza (G3), Alfredo Chaves (G10), Incaper 201 (G6) and Incaper 203 (G2). The variety Alfredo Chaves (G10) showed good productivity and proved to be more adaptable to environment 6, which was the environment that presented the worst performance for evaluating the productivity of the varieties.
The varieties that presented the worst productivity performances were Agda Moreira (G8), Milho Branco (G7), Domingos Martins (G12), Palha Roxa (G1) and Catetim (G13).
Figure 3 presents the GGE-Biplot of discrimination and representativeness. Environments with longer vectors are more discriminative, and those with shorter vectors are less discriminative. The environments that form the smallest angle between their vector and the environment-average axis (arrow in red in the diagonal position between the × and y axes of the graph) are considered the most representative. Thus, environments A6, A5 and A1 are considered the most discriminative, as they have the longest vectors. However, environment A6, despite being considered the most discriminative, has very low or no representativeness since the angle of its vector is very far from the environment-mean axis.
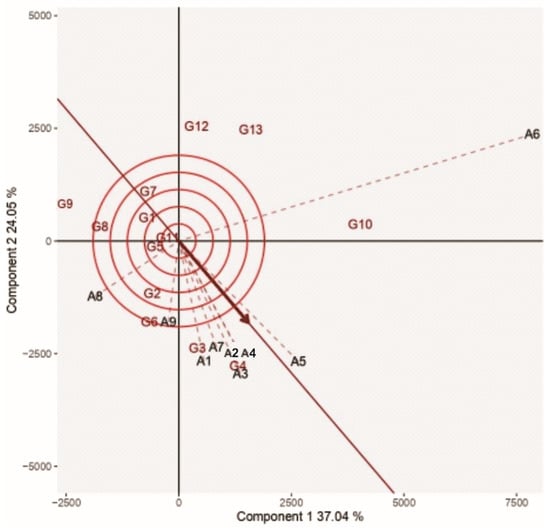
Figure 3.
GGE Biplot for discrimination and representativeness of the nine cultivation environments: A1—Venda Nova do Imigrante (2017); A2—Linhares (2018); A3—Mucurici (2019); A4—Mimoso do Sul (2019); A5—Itapemirim Waterfall (2019); A6—Venda Nova do Imigrante (2019); A7—Cachoeiro de Itapemirim (2019—season 2); A8—Linhares 2020; A9—Cachoeiro de Itapemirim (2020), based on the grain yield of 13 landrace and commercial maize varieties grown in Espírito Santo. G1—Palha Roxa; G2—Incaper 203; G3—Fortaleza; G4-Aliança; G5—Caiana Amarelo; G6—Incaper 201; G7—Milho Branco; G8—Agda Moreira; G9—Milho Branco SMJ; G10—Alfredo Chaves; G11—Catete; G12—Domingos Martins; G13—Catetim.
The A5 environment is considered to have the best performance as a test environment since, in addition to good discrimination, it has the smallest angle with the environment-mean axis, making it also the one with the best representativeness. Next are environments A3 and A2 with good discrimination and representativeness, with A2 being slightly higher when analyzed for representativeness and A3 slightly higher in the discriminant environment assessment. Environment A8 presents itself as a negative highlight for both discriminating and representative environments.
There was the formation of a mega environment consisting of environments A1, A2, A3, A5, A7 and A9 (Figure 4).
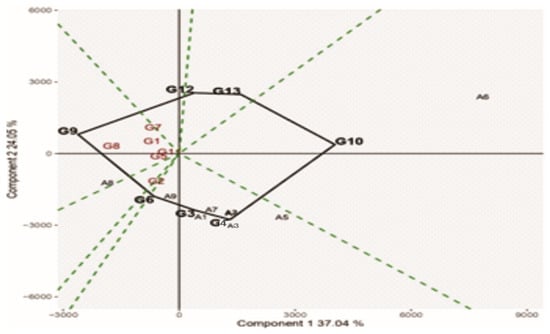
Figure 4.
GGE Biplot mega-environments (which won where) for the productivity of 13 landrace and commercial maize varieties grown in Espírito Santo across nine environments. G1—Palha Roxa; G2—Incaper 203; G3—Fortaleza; G4—Aliança; G5—Caiana amarelo; G6—Incaper 201; G7—Milho branco; G8—Agda Moreira; G9—Milho branco SMJ; G10—Alfredo Chaves; G11—Catete; G12—Domingos Martins; G13—Catetim. A1—Venda Nova do Imigrante (2017); A2—Linhares (2018); A3—Mucurici (2019); A5—Cachoeiro de Itapemirim (2019); A6—Venda Nova do Imigrante (2019); A7—Cachoeiro de Itapemirim (2019-harvest 2); A8—Linhares 2020; A9—Cachoeiro de Itapemirim (2020).
Figure 5 presents the GGE-Biplot of mean vs. stability. The red line with a single arrow points to the genotypes with the highest average productivity, and the dotted black lines indicate the stability of the genotypes. The greater the length of the dotted line, the more unstable the genotype. The varieties with the highest average production are Aliança (G4), Alfredo Chaves (G10), Fortaleza (G3), Incaper 201 (G6) and Incaper 203 (G2). The most stable varieties were Aliança (G4), Catete (G11), Caiana Amarelo (G5) and Palha Roxa (G1), and the most unstable were Alfredo Chaves (G10), Catetim (G13), Milho Branco SMJ (G9) and Domingos Martins (G12). Aliança (G4) and Milho Branco SMJ (G9) presented the best and worst average yield, respectively.
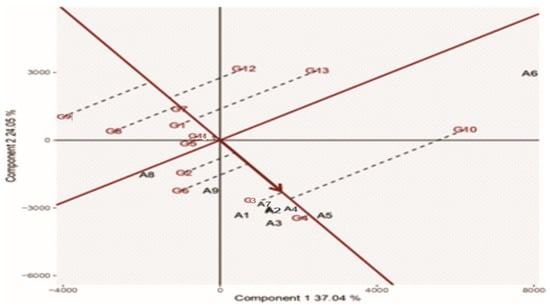
Figure 5.
Mean GGE Biplot vs. stability for grain yield of thirteen landrace and commercial maize varieties grown in Espírito Santo in nine growing environments. G1—Palha Roxa; G2—Incaper 203; G3—Fortaleza; G4—Aliança; G5—Caiana Amarelo; G6—Incaper 201; G7—Milho Branco; G8—Agda Moreira; G9—Milho Branco SMJ; G10—Alfredo Chaves; G11—Catete; G12—Domingos Martins; G13—Catetim. A1—Venda Nova do Imigrante (2017); A2—Linhares (2018); A3—Mucurici (2019); A4—Mimoso do Sul (2019); A5—Cachoeiro de Itapemirim (2019); A6—Venda Nova do Imigrante (2019); A7—Cachoeiro de Itapemirim (2019—season 2); A8—Linhares 2020; A9—Cachoeiro de Itapemirim (2020).
4. Discussion
The varieties Palha Roxa, Incaper 203, Fortaleza, Caiana Amarelo, Incaper 201, Milho Branco and Milho Branco SMJ showed a regression coefficient (ß1) greater than 1.0, which indicates specific adaptability to favorable environments, or that is, they perform better when under favorable conditions of climate, temperature and soil conditions, and may decrease performance in some adverse condition.
Only the variety Aliança approached the classification of general or broad adaptability, which is classified as general or broad adaptability. This result shows the potential of the variety Aliança, which in the two methods studied, Annicchiarico [15] and Eberhart and Russel [13], appears as the one that stands out the most, with a high capacity for adapting to different environments, whether favorable or unfavorable.
The varieties Incaper 203, Aliança, Milho Branco and Catete presented stability, which resulted in values lower than zero, indicating greater predictability in the face of environmental stimuli. According to Beyer et al. [29], genotypes with scores close to zero are more stable and show broad adaptation. The other varieties were considered of low predictability since they presented values greater than zero.
Oliveira et al. [30] evaluated 25 hybrid maize in 22 environments, divided between the states of Maranhão, Piauí and Sergipe, and observed two genotypes with specific adaptability to favorable environments and only four, of the 25 genotypes, with specific adaptability to unfavorable environments. The other genotypes were considered general adaptability. As for stability, according to the authors, all of the 25 genotypes were considered low predictability since they presented parameters with values greater than zero.
As observed in the present study, the varieties showed different behavior in relation to the evaluations for all of the environments. This behavior variation is interesting and important since it demonstrates the existing variability among varieties and points to materials that present broad and specific adaptability to certain environments. Another factor that can influence the results is the G × E interaction. The environment explains 80% of the variation found, while the genotype explains 10–15% of the variation [15].
The G × E interaction highlights the complex relationship between the genetic characteristics of a plant and the environmental conditions in which it is grown. The statement that the environment explains 80% of the observed variation, while the genotype explains 10–15% of the variation, emphasizes the primary importance of the environment in determining plant performance. Although the genotype is a relevant factor, it is the environment in which the plant grows that plays the most significant role in the observed variation in phenotypic traits [31].
Environmental variations, such as climate, soil, water availability, sunlight, and biotic stress, can have a substantial impact on plant development and, consequently, on their characteristics and productivity. A plant with a specific genotype may perform well in a favorable environment but exhibit inferior performance in an adverse environment. Therefore, plant adaptation to the environment is a critical factor to consider in genetic breeding and selection of plant varieties.
Complex interactions between genotype and environment can occur, where certain combinations of genotype and environment may have synergistic or antagonistic effects that amplify or reduce plant performance. Therefore, considering and understanding the G × E interaction is crucial for the development of more effective genetic improvement strategies and the selection of varieties adapted to different environmental conditions [30].
The varieties Agda Moreira and Milho Branco SMJ presented the highest PiG indexes and were both considered the least stable in the general analysis and in the favorable and unfavorable environments, which may indicate the non-adaptation to environments different from the environments where they were collected. Both come from the mountainous region of the state, Adga Moreira from the municipality of Domingos Martins and Milho Branco SMJ from Santa Maria de Jetibá.
The results of this study highlight the significant genetic variability observed among maize varieties cultivated in Espírito Santo, underscoring the importance of preserving and further studying these varieties. Specifically, the landrace varieties exhibit remarkable diversity, representing a valuable genetic resource with the potential for enhancing maize productivity and adapting to local environmental conditions.
The preservation of these landrace varieties is of utmost importance for several reasons. Firstly, these varieties often possess unique and valuable traits, such as resistance to specific diseases, pests, or adverse climatic conditions. By maintaining and studying these varieties, researchers and breeders can identify and incorporate these desirable traits into future maize breeding programs [32]. Furthermore, the utilization and improvement of these landrace varieties can lead to increased profitability for rural producers, particularly those operating small-scale farms. These varieties, adapted to the local agroecological conditions, have the potential to deliver higher yields and better withstand environmental stresses, thereby positively impacting the economic situation of farmers.
The conservation of genetic diversity also plays a crucial role in preserving the long-term viability and adaptability of maize crops in the face of climate change and evolving pest and disease pressures [33]. Overall, the recognition and valorization of the genetic variability found among maize varieties in Espírito Santo, particularly the landrace varieties, provide an opportunity to strengthen agricultural practices, promote sustainable farming systems, and improve the livelihoods of rural producers in the state.
For the selection of superior genotypes, it is important that the environments are both discriminative and representative, discriminating the genotypes well and being representative of all of the tested environments [4].
A mega environment consisting of environments A1, A2, A3, A5, A7 and A9 was formed (Figure 4). A mega environment consists of an irregular polygon and straight lines radiating from the biplot origin and intersecting the sides of the polygon at right angles. The vertices are genotype markers that radiate lines crossing one side of the polygon that represent hypothetical environments; that is, these radiated lines divide the graph into sectors. The genotypes are divided by these sectors, and the environments that fit into a single sector form a mega-environment [34,35].
Regarding the analysis of adaptability and stability with the different methods, four of the nine environments were considered unfavorable, three of them (A5, A7 and A9) in the municipality of Cachoeiro de Itapemirim and one of them (A6) in Venda Nova do Imigrante. Environment A1 also presents the same location as environment A6. However, A1 was evaluated as favorable and indicated good productivity for the varieties related to it. It is likely that environment A6 presented low productivity for the varieties due to the accumulated volume of rainfall during the period in which the varieties were being tested in the field. As observed in Table 1, precipitation reached 36.2 mm, and the maximum temperature did not exceed 28.4 °C, oscillating at lower temperatures in most of the evaluation period. The analysis of representative and discriminative environments shows other peculiarities, such as environment A5, which was considered unfavorable; however, the analysis presents it as the best performance for test environments with the best discrimination and representativeness, and the A8 environment is one of the favorable and among the best environments for productivity, was rated as the least discriminating and representative of the nine environments.
As there was a division of varieties for stability, there was also a division of groups for analysis of adaptability by the method of Eberhart & Russel [13]. Observations revealed the presence of varieties with distinct adaptability, displaying specific traits optimized for favorable environments, thereby maximizing their performance under these conditions. Conversely, other varieties demonstrated specific attributes that conferred adaptability to unfavorable environments, enabling them to withstand and thrive in challenging growing conditions. These findings highlight the importance of selecting and utilizing varieties tailored to specific environmental contexts to maximize agricultural productivity and resilience. Despite not having exactly reached the parameter for wide adaptability (ß1) equal to 1, the variety Aliança (ß1 = 0.98) in all of the evaluations of all of the applied methods, including AMMI and GGE biplot, presented the best indices and better average grain yield in all of the evaluated environments.
Regarding productivity, the variety Agda Moreira had the lowest average production with 3636.67 kg, followed by the varieties Milho Branco SMJ with 4061.48 kg, Milho Branco with 4352.02 kg and Domingos Martins with 4362.5 kg. The commercial variety Aliança was the most productive with 6769.88 kg. The landrace variety with the highest productive average was Alfredo Chaves with 5870.36 kg; this average was even higher than the commercial varieties Incaper 201, Fortaleza and Incaper 203 and surpassing the national average, which, according to CONAB [36] is 5525 kg/ha. The varieties Catete, Catetim and Caiana Amarelo also stood out in terms of production.
5. Conclusions
The statistical methods used for the evaluations showed agreeing results for the parameters of adaptability and stability. Among them, the Eberhart and Russell and the Lins and Binns methods are generally considered simpler and more straightforward for assessing genotype-by-environment (G × E) interaction, stability, and adaptability.
The variety Aliança presented the best results in all of the analyzes of adaptability and stability, confirming its indication for cultivation in Espírito Santo. The varieties Palha Roxa, Caiana Amarelo, Milho Branco and Milho Branco SMJ, Incaper 203, Incaper 201 and Fortaleza are more suitable for environments 1, 2, 3, 4 and 8, classified as favorable. The Agda Moreira, Alfredo Chaves, Catete, Domingos Martins and Catetim varieties are more suitable for environments 5, 6, 7 and 9, classified as unfavorable; The variety Aliança can be considered with general adaptability; The most prominent landrace varieties were Alfredo Chaves, Catete and Catetim.
Author Contributions
All authors contributed to the study’s conception and design. Material preparation and data collection were performed by D.P.d.C., W.B.d.S.O. and J.S.d.O. Analysis was performed by J.H.S.G. and A.F. The first draft of the manuscript was written by D.P.d.C. and C.d.O.B. All activities were supervised and complemented by M.F.d.S.F., S.C.P.P. and A.F. All authors commented on previous versions of the manuscript. All authors have read and agreed to the published version of the manuscript.
Funding
FAPES: CAPES and CNPq.
Data Availability Statement
Not applicable.
Acknowledgments
The authors thank the Foundation for Research and Innovation Support of Espírito Santo (FAPES), the Coordination of Improvement of Higher Level Personnel (CAPES), and the National Council of Scientific and Technological Development (CNPq) for the financial support and the opportunity to carry out this study.
Conflicts of Interest
The authors declare no conflict of interest.
References
- Food and Agriculture Organization. FAO Database. 2021. Available online: http://www.fao.org/faostat/en/#data (accessed on 7 July 2023).
- Faria, S.V.; Luz, L.S.; Rodrigues, M.C.; Carneiro, J.E.S.; Carneiro, P.C.S.; Delima, R.O. Adaptability and stability in commercial maize hybrids in the southeast of the State of Minas Gerais, Brazil. Rev. Cienc. Agron. 2017, 48, 347–357. [Google Scholar] [CrossRef]
- Oliveira, T.R.A.; Carvalho, H.W.L.; Nascimento, M.; Costa, E.F.N.; Oliveira, G.H.F.; Gravina, G.A.; Amaral Junior, A.T.; Carvalho Filho, J.L.S. Adaptability and stability evaluation of maize hybrids using Bayesian segmented regression models. PLoS ONE 2020, 15, e0236571. [Google Scholar] [CrossRef]
- Santos, D.C.; Pereira, C.H.; Nunes, J.A.R.; Lepre, A.L. Adaptability and stability of maize hybrids in unreplicated multienvironment trials. Rev. Cienc. Agron. 2019, 50, 83–89. [Google Scholar] [CrossRef]
- Li, D.; Li, G.; Wang, H.; Guo, Y.; Wang, M.; Lu, X.; Luo, Z.; Zhu, X.; Weiß, T.M.; Roller, S.; et al. Genetic Dissection of Phosphorus Use Efficiency and Genotype-by-Environment Interaction in Maize. Int. J. Mol. Sci. 2022, 22, 13943. [Google Scholar] [CrossRef]
- Pinto, J.F.N.; Candido, W.S.; Pinto, J.F.N.; Reis, E.F. Adaptability and Stability in Maize Populations. J. Agric. Sci. 2019, 11, 23. [Google Scholar] [CrossRef]
- Souza, M.H.; Pereira Júnior, J.D.; Steckling, S.M.; Mencalha, J.; Dias, F.S.; Rocha, J.R.A.S.C.; Carneiro, P.C.S.; Carneiro, J.E.S. Adaptability and stability analyses of plants using random regression models. PLoS ONE 2020, 15, e0233200. [Google Scholar] [CrossRef]
- Oliveira, T.R.A.; Carvalho, H.W.L.; Oliveira, G.H.F.; Costa, E.F.N.; Gravina, G.A.; Santos, R.D.; Carvalho Filho, J.L.S. Hybrid maize selection through GGE biplot analysis. Bragantia 2019, 78, 166–174. [Google Scholar] [CrossRef]
- Oyekunle, M.; Haruna, A.; Badu-Apraku, B.; Usman, I.S.; Mani, H.; Ado, S.G.; Olaoye, G.; Obeng-Antwi, K.; Abdulmalik, R.O.; Ahmed, H.O. Assessment of early-maturing maize hybrids and testing sites using GGE biplot analysis. Crop Sci. 2017, 57, 2942–2950. [Google Scholar] [CrossRef]
- EMBRAPA. Contando Ciência—Região Sudeste. Available online: https://www.embrapa.br/contando-ciencia/regiao-sudeste (accessed on 7 July 2023).
- Cunha, A.D.M.; Feitoza, H.N.; Feitoza, L.R.; de Oliveira, F.S.; Lani, J.L.; Cardoso, J.K.F.; Trindade, F.S. Atualização da legenda do mapa de reconhecimento de solos do Estado do Espírito Santo e implementação de interface no GEOBASES para uso dos dados em SIG. Geografares 2016, 1, 32–66. [Google Scholar] [CrossRef]
- Agritempo: Sistema de Monitoramento Agrometeorológico. Available online: https://www.agritempo.gov.br/agritempo/jsp/PesquisaClima/index.jsp?siglaUF=ES (accessed on 30 November 2020).
- Eberhart, S.A.; Russell, W.A. Stability parameters for comparing varieties. Crop Sci. 1966, 6, 36–40. [Google Scholar] [CrossRef]
- Lin, C.S.; Binns, M.R. A superiority measure of cultivar performance for variety x location data. Can. J. Plant Sci. 1988, 68, 193–198. [Google Scholar] [CrossRef]
- Annicchiarico, P. Cultivar adaptation and recommendation from alfalfa trials in Northern Italy. J. Genet. Breed. 1922, 46, 269. [Google Scholar]
- Zobel, R.W.; Wright, M.J.; Gauch, H.G. Statistical Analysis of a Yield Trial. Agron. J. 1988, 80, 388–393. [Google Scholar] [CrossRef]
- Yan, W.; Hunt, L.A.; Sheng, Q.; Szlavnics, Z. Cultivar Evaluation and Mega-Environment Investigation Based on the GGE Biplot. Crop Sci. 2000, 40, 597–605. [Google Scholar] [CrossRef]
- Cruz, C.D. Genes software—Extended and integrated with the R, Matlab and Selegen. Acta Sci. Agron. 2016, 38, 547–552. [Google Scholar] [CrossRef]
- R Core Team. R: A Language and Environment for Statistical Computing; R Foundation for Statistical Computing: Vienna, Austria, 2020; Available online: http://www.Rproject.org/ (accessed on 22 February 2020).
- Cargnelutti Filho, A.; Guadagnin, J.P. Sufficient number of experiments for the adaptability and stability analyses of maize using the Eberhart and Russell method. Pesqui. Agropecu. Bras. 2018, 53, 673–683. [Google Scholar] [CrossRef]
- Mafouasson, H.; Gracen, V.; Yeboah, M.A.; Ntsomboh-Ntsefong, G.; Tandzi, L.N.; Mutengwa, C.S. Genotype-by-Environment Interaction and Yield Stability of Maize Single Cross Hybrids Developed from Tropical Inbred Lines. Agronomy 2018, 8, 62. [Google Scholar] [CrossRef]
- Cruz, C.D.; Regazzi, A.J.; Carneiro, P.C.S. Modelos Biométricos Aplicados ao Melhoramento Genético, 4th ed.; UFV: Viçosa, MG, Brazil, 2012; 514p. [Google Scholar]
- Teodoro, P.E.; Farias, F.J.C.; Carvalho, L.P.; Ribeiro, L.P.; Nascimento, M.; Azevedo, C.F.; Cruz, C.D.; Bhering, L.L. Adaptability and Stability of Cotton Genotypes Regarding Fiber Yield and Quality Traits. Crop Sci. 2019, 59, 518–524. [Google Scholar] [CrossRef]
- Yamamoto, L.E.; Gonçalves, M.C.; Davide, L.M.C.; Santos, A.; Candido, L.S. Adaptability and stability of maize genotypes in growing regions of central Brazil. Ceres 2021, 68, 201–211. [Google Scholar] [CrossRef]
- Rother, V.; Verdi, C.A.; Thurow, L.B.; Carvalho, I.R.; Oliveira, V.F.; Maia, L.C.; Venske, E.; Pegoraro, C.; Oliveira, A.C. Uni- and multivariate methods applied to the study of the adaptability and stability of white oat. Pesqui. Agropecu. Bras. 2019, 54, e00656. [Google Scholar] [CrossRef]
- Carneiro, A.R.T.; Sanglard, D.A.; Azevedo, A.M.; Souza, T.L.P.O.; Pereira, H.S.; Melo, L.C. Fuzzy logic in automation for interpretation of adaptability and stability in plant breeding studies. Sci. Agric. 2019, 76, 123–129. [Google Scholar] [CrossRef]
- Carneiro, V.Q.; Prado, A.L.; Cruz, C.D.; Carneiro, P.C.S.; Nascimento, M.; Carneiro, J.E.S. Fuzzy control systems for decision-making in cultivars recommendation. Acta Scientiarum. Agron. 2018, 40, 39314. [Google Scholar] [CrossRef]
- Ye, M.J.; Wei, J.W.; Bu, J.Z.; Gu, Z.; Wang, Y.; Chen, S.; Peng, H.; Yue, H.; Xie, J. Application of AMMI model to assess spring maize genotypes under multi-environment trials in Hebei province. Int. J. Agric. Biol. 2019, 21, 827–834. [Google Scholar]
- Beyer, H.; Schmalenberg, A.K.; Jansen, G.; Jürgens, H.U.; Uptmoor, R.; Broer, I.; Huckauf, J.; Dietrich, R.; Michel, V.; Zenk, A.; et al. Evaluation of variability, heritability and environmental stability of seed quality and yield parameters of L. angustifolius. Field Crops 2015, 174, 40–47. [Google Scholar] [CrossRef]
- Oliveira, T.R.A.; Carvalho, H.W.L.; Nascimento, M.; Costa, E.F.N.; Amaral Junior, A.T.; Gravina, G.A.; Carvalho Filho, J.L.S. The Eberhart and Russel’s Bayesian method used as an instrument to select maize hybrids. Euphytica 2018, 214, 64. [Google Scholar] [CrossRef]
- Hallauer, A.R. Evolution of plant breeding. Crop Breed. Appl. Biotechnol. 2011, 11, 201–202. [Google Scholar] [CrossRef]
- Mukarumbwa, P.; Taruvinga, A. Landrace and GM maize cultivar’ selection choices among rural farming households in the Eastern Cape Province, South Africa. GM Crops Food 2023, 14, 1–15. [Google Scholar] [CrossRef]
- Govindaraj, M.; Vetriventhan, M.; Srinivasan, M. Importance of Genetic Diversity Assessment in Crop Plants and Its Recent Advances: An Overview of Its Analytical Perspectives. Genet. Res. Int. 2015, 2015, 431487. [Google Scholar] [CrossRef]
- Yan, W. GGE biplot vs. AMMI graphs for Genotypes-by-Environments Data Analysis. J. Indian Soc. Agric. Stat. 2011, 65, 181–193. [Google Scholar]
- Machado, N.G.; Lotufo-Neto, N.; Hongyu, K. Statistical analysis for genotype stability and adaptability in maize yield based on environment and genotype interaction models. Ciência Nat. 2019, 41, e25. [Google Scholar] [CrossRef]
- CONAB. Acompanhamento da Safra Brasileira. Cia. Nac. Abast. 2020, 7, 1–89. Available online: https://www.conab.gov.br/info-agro/safras/graos (accessed on 16 February 2021).


Disclaimer/Publisher’s Note: The statements, opinions and data contained in all publications are solely those of the individual author(s) and contributor(s) and not of MDPI and/or the editor(s). MDPI and/or the editor(s) disclaim responsibility for any injury to people or property resulting from any ideas, methods, instructions or products referred to in the content. |
© 2023 by the authors. Licensee MDPI, Basel, Switzerland. This article is an open access article distributed under the terms and conditions of the Creative Commons Attribution (CC BY) license (https://creativecommons.org/licenses/by/4.0/).