Article

Microbial Communities and Soil Respiration during Rice Growth in Paddy Fields from Karst and Non-Karst Areas

1
Environmental Science and Engineering College, Guilin University of Technology, Guilin 541004, China
2
Guangxi Key Laboratory of Environmental Pollution Control Theory and Technology, Guilin University of Technology, Guilin 541004, China
3
Collaborative Innovation Center for Water Pollution Control and Water Safety in Karst Area, Guilin University of Technology, Guilin 541004, China
*
Author to whom correspondence should be addressed.
Agronomy 2023, 13(8), 2001; https://doi.org/10.3390/agronomy13082001
Submission received: 30 June 2023 / Revised: 21 July 2023 / Accepted: 24 July 2023 / Published: 28 July 2023
(This article belongs to the Special Issue Metagenomic Analysis for Unveiling Agricultural Microbiome)

Abstract

:
Soil microorganism and their relationships with soil respiration in paddy systems in karst areas (KA) of southern China is important for understanding the mechanisms of greenhouse gas emission reduction. Soils were collected from the tillage layer (0–20 cm) during the rice growing season from KA and non-karst areas (NKA) (red soils) from the Guilin Karst Experimental Site in China. Community structures and inferred functionalities of bacteria and fungi were analyzed using the high-throughput sequencing techniques, FAPROTAX and FUNGuild. A bacterial–fungal co-occurrence network was constructed and soil respiration was measured using dark box-gas chromatography and built their relationships. The results indicated that soil respiration was significantly lower in KA than in NKA. Principal component analysis indicated that bacterial and fungal community structures significantly differed between KA and NKA. The OTU ratio of fungi to bacteria (F/B) was positively correlated with soil respiration (p = 0.044). Further, the key network microorganisms were OTU69 and OTU1133 and OTU1599 in the KA. Soil respiration negatively correlated with Acidobacteria Gp6, dung saprotroph-endophyte-litter saprotroph-undefined saprotroph, aerobic nitrite oxidizers and nitrifier in KA (p < 0.05). Overall, this study demonstrated that soil respiration was reduced when soil microorganisms shifted from bacterial to fungal dominance during the rice growing season in KA.

Graphical Abstract

1. Introduction

Karst ecosystem is an ecosystem restricted by geological background which accounts for one-third of the national land area in China [1]. In karst area (KA) with high temperature and humidity, the dissolution of carbonate brings a large amount of calcium ion (Ca2+ ) and HCO3 into the soil. HCO3 combines with H+ in the water to generate Carbon dioxide (CO2), which increases soil CO2 concentration [2]. The carbonate weathering consumes CO2 and represent large sinks for atmospheric CO2 that can influence global carbon balance [3,4]. Thereby, carbon cycles during the weathering of carbonate rocks are very important [5], and biological activities catalyze and regulate this process of weathering, thus resulting in alkaline soils rich in calcium [6]. This process also alters soil microbial communities involved in carbon cycling within KA.
CO2 is the most important greenhouse gases (GHG) [7] and the global CO2 imbalance is one of the most critical problems for the global carbon cycle [8]. Soil respiration was an important process of CO2 emission and initially used to describe soil metabolic processes [9], and soil aeration, temperature, moisture, and microbial communities influence respiration [10]. Microbial respiration accounts for more than 80% of all soil respiration [11], which indicated that microbes were the main contributor to soil CO2 emissions [12]. In general, long-term inundation slows down the degradation process of soil organic matter in paddy field, which is conducive to the accumulation of soil organic carbon (SOC). The degradable organic carbon in paddy soil increase aboveground and underground biomass of rice [13], thus enhancing the outflow of root exudates and increasing the microbial biomass [14]. Both decreasing the ratio of carbon to nitrogen [15] and increasing the exogenous organic matter [16] retard soil respiration and increase SOC accumulation in paddy soils. The soil characterized by neutral alkalinity, the metal ions (including Ca2+) can not only combine with inorganic carbon [17,18], but also with carboxyl group of soil organic matter, which changed the microbial community and its utilization of organic matter, thus affecting soil respiration [14,19]. Consequently, soil respiration and its relation with microbe in rice fields of KA are critical for the accumulation and stability of SOC.
Both bacteria and fungi are important microbial taxa that synergistically interact with soil respiration during rice cultivation [20,21] and determine the carbon sequestration potential of paddy fields [22]. The inter-roots of rice colonization can rapidly limit oxygen and establish anaerobic zones that lead to some microbial populations performing the anaerobic respiration of nitrates and carbonates, thereby accelerating the release of photosynthetically fixed carbon through roots into the surrounding soils [23]. The input of carbon substrates drives the structural and functional changes in soil microbial communities, making the assimilated carbon of microorganisms more stable than aboveground and root-derived carbon [24].
SOC played an important pole in shaping the pattern of soil bacteria and fungi community structures [25], which indicated that increasing biomasses of root and litter stimulated microbial growth in KA [26]. In addition, bacterial and fungal populations are able to increase the stability of calcareous SOC [27] that might reduce the decomposition of soil organic matter. For example, Flavobacterium and Lysobacter dominated the karst area communities and exhibited relative abundances of 1.24–14.73%,which Flavobacterium can decompose organic matter and Lysobacter can synthesize organic matter using CO2 as a carbon source [25]. Further, numerous bacterial and fungal taxa (such as Bradyrhizobium, Herbaspirillum, Cellulomonas, Blastococcus, some endophytes and ectomycorrhizae) that are symbiotic with moss plants in KA are able to increase the peroxidase activity of mosses, thereby enhancing the photosynthetic efficiency of the plants [28]. Thus, bacteria and fungi in karst ecosystem play critical roles in dynamic changes of carbon fixation and CO2 emissions. In previous studies, we reported that soil bacterial communities of rice field in KA are considerably different with those in NKA at the same latitude, which is mainly attributed to the main ecological factors such as SOC, total nitrogen, pH and so on [25]. Our study also found that there are significant differences in the bacterial community structure, key groups, and functional groups across the three particle size aggregates between KA and NKA [29]. At the same time, we monitored the soil respiration of paddy fields during fallow and found that the soil respiration in KA was far lower than that in NKA (Supplementary Figure S1). During rice growth, soil microbial community structure may be more variable due to the influence of aboveground litter, roots and their secretions, which will affect soil respiration [30,31,32]. However, if there was difference in the soil respiration of paddy field during rice growth between KA and NKA? Which specific microorganisms are closely related to soil respiration? and which are the top microorganisms in the two different areas? The above problems are rarely reported.
In this study, the karst experimental site in Maocun village of Guangxi Zhuang Autonomous Region, China was as research site. The paddy fields across the entire rice growing period in KA and NKA were selected to investigate: (1) dynamic changes in bacterial and fungal abundances during rice growth using real-time PCR and high-throughput sequencing; (2) in situ soil respiration in rice fields across the growth season using static box-meteorological chromatography; (3) predicted functional groups of bacteria and fungi; and (4) co-occurrence networks of fungal and bacterial communities. These studies were used to analyze the relationship between major microbial groups and soil respiration and to help us understand the process and mechanism of microbial communitiy affecting soil respiration in KA during rice growth.

2. Materials and Methods

2.1. Soil Collection and Gas Sampling

2.1.1. Soil Sample Collection and Soil Physicochemical Properties Analysis

From June to September 2019, rice fields from a typical karst area (KA) (25°08′30″ N, 110°31′28″ E) and a non-karst area (NKA) (25°10′51″ N, 110°31′35″ E) were selected as studying fields within the karst experimental site in Maocun village of Guangxi Zhuang Autonomous Region, China. The soil type in the KA is a limestone brown soil, whereas the soil type in NKA is a silicate red soil (Soil forming parent material are mainly sandstone and granite). Each field was divided into three replicate plots with the same area (KA: 42.20 m2 and NKA: 46.67 m2) using by ridge. Each plot was subjected to uniform irrigation, fertilization, and management practices. Three random sampling points were used in each plot. Paddy fields were planted with single-season rice, and the rice growing period was 94 d. Compound fertilizers (N-P2O5-K2O) containing 18% each of nitrogen, phosphorus and potassium were applied as base fertilizer to the fields at 7.56 kg (KA) and 8.53 kg (NKA) before transplanting seedlings. In addition, 5.70 kg (KA) and 6.40 kg (NKA) of compound fertilizer were applied in each plot as follow-up fertilizer on 14 July. A total of 1 kg of soil was collected from each sample point at a sampling depth of 0–20 cm; the soil samples from the three sampling points were equally and uniformly mixed into a single 3 kg sample. A total of 48 soil samples were collected on eight dates with intervals of about 14 d (with the exception of the first sampling interval of 7 d). The sample from 4 June represented the rice planting date, 12 June was from the seedling stage, 26 June and 10 July were from the tillering stage, 24 July was from the nodulation stage, 7 August was from the gestation stage, 21 August was from the tasseling stage, and 4 September was from the maturity stage.
Soil physicochemical properties were analyzed by routine methods [33]. Briefly, soil moisture content was measured using the drying method. pH was measured using CO2-free distilled water as the leaching agent after mixing soil with water at a 1:2.5 ratio, followed by measurement with a precision pH meter (model: IS128C). SOC was measured using the sulfuric acid potassium dichromate external heating method. Soil total nitrogen (TN) and hydrolyzed nitrogen (AN) measured using the concentrated sulfuric acid digestion-Kjeldahl method and the alkali hydrolysis diffusion method. Total phosphorus (TP) and available phosphorus (AP) determined by the sodium carbonate melting method and the hydrochloric acid-ammonium fluoride method. Soluble organic carbon (DOC) was extracted by shaking a soil-water mix (at a ratio of 10:1), filtering through a 0.45 μm fiber membrane, and analysis on a multi N/C3100 total organic carbon analyzer (Analytik Jena, Jena, Germany). Cation exchange capacity (CEC) was measured using the EDTA-ammonium fast method. An optima 7000 DV inductively coupled plasma emission spectrometer (Perkin Elmer, Waltham, MA, USA) (ICP-OES) was used to measure the exchangeable calcium (Ca2+) and magnesium (Mg2+) ion concentrations.

2.1.2. Measurement of Soil Respiration

Static dark boxes with 50 cm × 50 cm × 50 cm were used as a field gas collection device, with the boxes raised as plant heights changed. The box was constructed polyethylene (PVC) covered with foam and reflective material and had a fan for mixing gases inside the box installed on the top along with a gas collection port. The gas was collected in a vacuum bag using a syringe from 9:00 to 9:30 on the above-mentioned soil sample collection date. Each sample collection point needs to be separated by 10 min for continuous gas collection. Temperature was measured with a thermometer (JM624, Guangzhou, China) at 5 cm depth. Three rice plants were randomly collected from each sample site during rice harvesting and then dried in oven at 105 °C until achieving. Gas samples were immediately brought to the laboratory for quantification of CO2 using an Agilent 7890 B gas chromatograph-mass spectrometer (Agilent, Santa Clara, CA, USA) with a hydrogen flame ion detector (FID). An external standard working curve was plotted after running every 48 samples. The gas emission rate (dc/dt) was derived from the slope of four consecutive sample concentration values using linear regression analysis. Greenhouse gas emission flux was calculated using the following equation:
F = H M P R ( 273 + T ) d c d t
where F is the gas emission flux (units of mg·m−2·h−1); H is the height of the sampling box (m); M is the molar mass of gas (g·mol−1); P is the air pressure at the sampling point (Pa); R is the universal gas constant (8.314, Pa·m3·mol−1·k−1); T is the average temperature inside the box at the time of sampling (°C) and dc/dt is the gas emission rate (uL·L−1·min−1).
Heterotrophic respiration (Rh) was then calculated using the following equations:
NPP = NPPseeds +NPPstraw +NPProots +NPPapoplast +NPProot sediment
GPP = NPP + Ra
Rh = ReRa
where NPP is the total carbon added to the above- and below-ground portions of the plant during the entire growth cycle (kg·hm−2); NPPseeds and NPPstraw are the estimated biomass from the harvested plants after drying, while NPProot, NPPapoplast and NPProot sediment were estimated by referencing previous studies [30,31,32]. The equation assumed an aboveground/root system ratio for rice of 1.0/0.1, and apoplankton coverage of 5% and 8% of the upper and root dry biomass, respectively, and root sediment accounted for 15% of the total plant biomass. In Equation (3), GPP is total primary productivity, Ra is autotrophic respiration (unit: kg·hm−2), and the NPP/GPP ratio is 0.58 [34]. In Equation (4), Re is ecosystem respiration and Rh is heterotrophic respiration (kg·hm−2).
The cumulative greenhouse gas (single-season rice) emissions were calculated as follows:
E c = F 1 + F n 2 + i = 1 n ( F i + F i + 1 2 ) × ( t i + 1 t i ) × 24 × 0.01 × a
where Ec is cumulative greenhouse gas (single-season rice) emissions (kg·hm−2); n is the number of observations during a single rice season; i is the sampling interval, Fi and Fi+1 are the GHG emission fluxes (mg·m−2·h−1) at the ith and i + 1th sampling, respectively; F1 and Fn are the GHG emission fluxes at the first and last sampling times, respectively; ti+1 and ti are the time intervals (d) between the i + 1th and ith sampling; and a is a conversion factor of 98/94.
The cumulative net CO2 emission, FCO2, was calculated as follows:
FCO2 = Ec − Ra
where FCO2 is the cumulative CO2 emission minus plant autotrophic respiration (kg·hm−2).

2.2. High-Throughput DNA Sequencing

The genomic DNA of total 48 soil samples was extracted using an EZNA Soil DNA extraction kit (Omega, Norcross, GA, USA) according to the manufacturer’s instructions (0.5 g per sample). The V3-V4 and ITS3-ITS4 amplicons of 16S rRNA genes and an internal transcribed spacer between ribosomal genes were amplified using a KAPA HiFi Hot Start Ready Mix (2x, TaKaRa Bio Inc., Kusatsu City, Japan). Universal PCR primers (PAGE purified) were used including the bacterial PCR forward primer (CCTACGGGNGGCWGCAG) and reverse primer (GACTACHVGGGTATCTAATCC) in addition to the fungal forward primer (GCATCGATGAAGAACGCAGC) and fungal reverse primer (TCCTCCGCTTATTGATATGC) [35,36] (primer sequences provided by Sangon Biotech company(Shanghai, China)). Reactions included 2 μL of DNA (10 ng μL−1); 1 μL each of PCR forward and reserve primers (10 μmol each); 15 μL of 2× KAPA HiFi Hot Start Ready Mix; and total reaction 30 μL. PCR plates were sealed and PCRs were performed in a thermal cycler (Applied Biosystems 9700, Waltham, MA, USA) using the following steps: pre-denaturation at 94 °C for 3 min, followed by denaturation at 95 °C for 20 s, 20 s of annealing at 55 °C, and a final extension at 72 °C for 30 s. The above denaturation, annealing, and extension steps were repeated for 20 cycles. The PCR products were detected gel electrophoresis using a 1% agarose gel in TBE (Tris-H₃BO₃-EDTA) buffer and stain with ethidium bromide (EB), followed by visualization with UV light. Samples were used to construct libraries using the universal Illumina adapters and indices. Sequencing was then performed on an Illumina MiSeq system (Illumina MiSeq, San Diego, CA, USA). The paired-end (PE) reads were obtained via paired-end sequencing and first combined using the fast length adjustment of short reads (FLASH) software package, which was also used to quality filter the datasets and obtain high-quality sequences for subsequent analysis. Using PRINSEQ to cut off the bases with quality value below 20 in the tail of reads, and set a 10 bp window. If the average quality value in the window is lower than 20, cut off the back-end bases from the window, filter the N-containing sequences and short sequences after quality control and finally filtered out the sequences with low complexity. After sequencing, chimeras were removed using the UCHIME programs. Quality-filtered sequences from each sample were taxonomically classified using the RDP classifier accessed on 28 June 2020. (RDP 16S database: http://rdp.cme.msu.edu/misc/resources.jsp and RDP ITS database: http://rdp.cme.msu.edu/misc/resources.jsp). A total of 211,930 bacterial sequences with 211,696 valid sequences and 67,106 fungal sequences with 66,988 valid sequences were detected. The datasets generated during the current study have been uploaded to the Sequence Read Archive (SRA), and had the accession number PRJNA763299.

2.3. Data Processing

Data processing was performed using the Excel 2016 software program. Correlation line plots were produced from fungal and bacterial OTUs in addition to fungal/bacterial OTU ratios in association with in situ CO2 fluxes for the 8 sampling dates. Histograms of fungal and bacterial OTUs numbers, in addition to soil respiration rates, were also established for the 8 and 14 sampling dates, respectively. The above were all using Origin 2017 software. Classes with greater than 1% relative abundance were designated as dominant classes, and the Origin 2017 software established relative abundance histogram. OTUs with greater than 1% relative abundance were designated as dominant OTUs, and the CoNet plug-in for the Cytoscape 3.7.1 software was used to construct a bacterial-fungal co-occurrence network [37]. Four statistical algorithms were used: Pearson’s correlation, Spearman correlation, Bray-Curtis dissimilarity and Kullback-Leibler dissimilarity. The Brown method was used to integrate the p values. The data with significant correlation (p < 0.05) were selected for subsequent analysis. The Benjamin–Hochberg method was used as the multiple test correction. The MCODE plug-in for Cytoscape 3.7.1 was used to analyze network modularity using default criteria, whereas the Network Analyzer for Cytoscape 3.7.1 was used to identify the number of nodes, number of connected edges, and the connectivity within the network. Functional predictions based on the dominant fungal and bacterial OTUs were inferred using the FUNGuild and FAPROTAX databases, respectively, and the resulting functional profiles were visualized as heat maps using the R Studio 5.3.1 program. All statistical analyses were carried out with SPSS 24.0. Correlation analysis was conducted using Pearson correlation (trigonometric function converted to normal distribution) and Spearman correlation [38]. The abundance difference was conducted with independent sample t-test [39].

3. Results

3.1. Physicochemical Properties of Paddy Soils in Karst and Non-Karst Areas

The 11 physicochemical indicators of paddy soils in KA were significantly higher than those in NKA [Table 1], which indicated that there was significantly difference between KA and NKA.

3.2. In Situ Soil Respiration and Cumulative CO2 Emissions of Paddy Fields during Rice Growth in KA and NKA

Variation of in situ soil respiration in KA and NKA ranged from 26.86 to 1293.59 mg·m−2·h−1 and 62.99 to 1501.21 mg·m−2·h−1, respectively, during rice growing where the temperature ranged from 27 to 36 °C [Figure 1]. Among the 14 sampling times evaluated across the growing period, eight of the in situ CO2 flux values in KA were significantly lower than those in NKA, while one sample measurement was significantly higher than those in NKA, and five were not significantly different. The total cumulative CO2 emissions across the entire growth period were 7632.82 kg·hm−2 and 9637.66 kg·hm−2 in KA and NKA, respectively. Thus, soil respiration of paddy field in KA was generally lower than that in NKA.

3.3. The Abundance of Bacteria and Fungi and the Ratio of Fungi to Bacteria (F/B) in Paddy Field Soils of KA and NKA

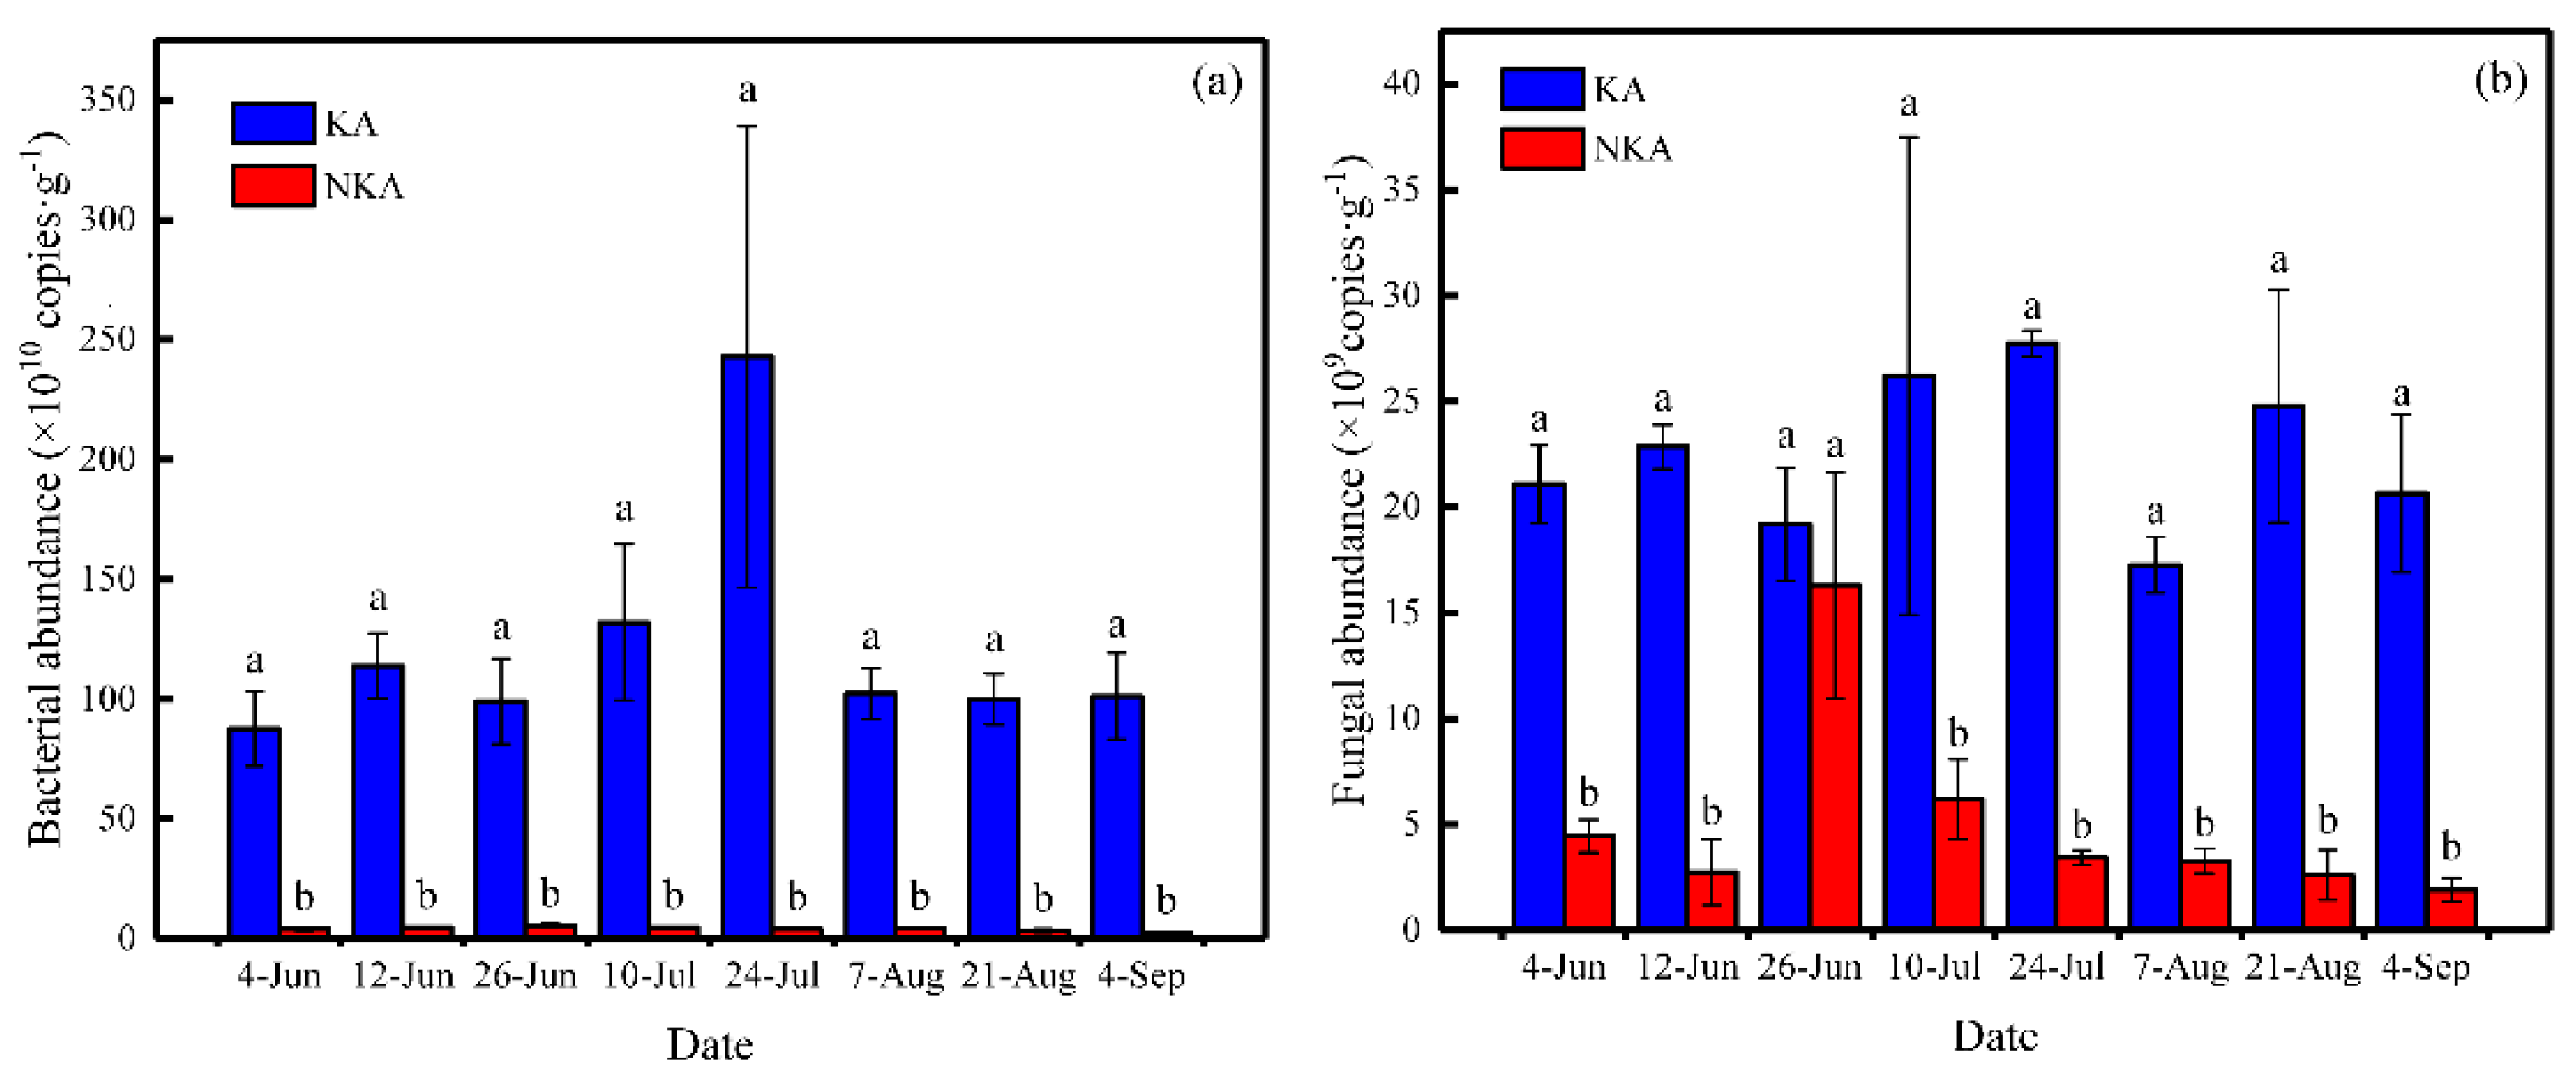
Among the 14 sampling times evaluated across the growing period, the bacterial abundance in the KA which was (87.52 ± 15.54) ×1010 ~ (242.79 ± 96.20) × 1010 copies·g−1 was significantly higher than that in the NKA which had an abundance of (2.51 ± 0.54) × 1010 copies·g−1 ~ (5.52 ± 0.87) × 1010 copies ·g−1 [Figure 2a]. The fungal abundance in the KA which was (17.26 ± 1.32) × 109 copies ·g−1 ~ (27.73 ± 0.61) × 109 copies·g−1 was significantly higher than that in the NKA which had an abundance of (1.90 ± 0.55) × 109 ~ (13.26 ± 1.47) × 109 copies g−1 on Jun-26 (tillering stage) [Figure 2b].
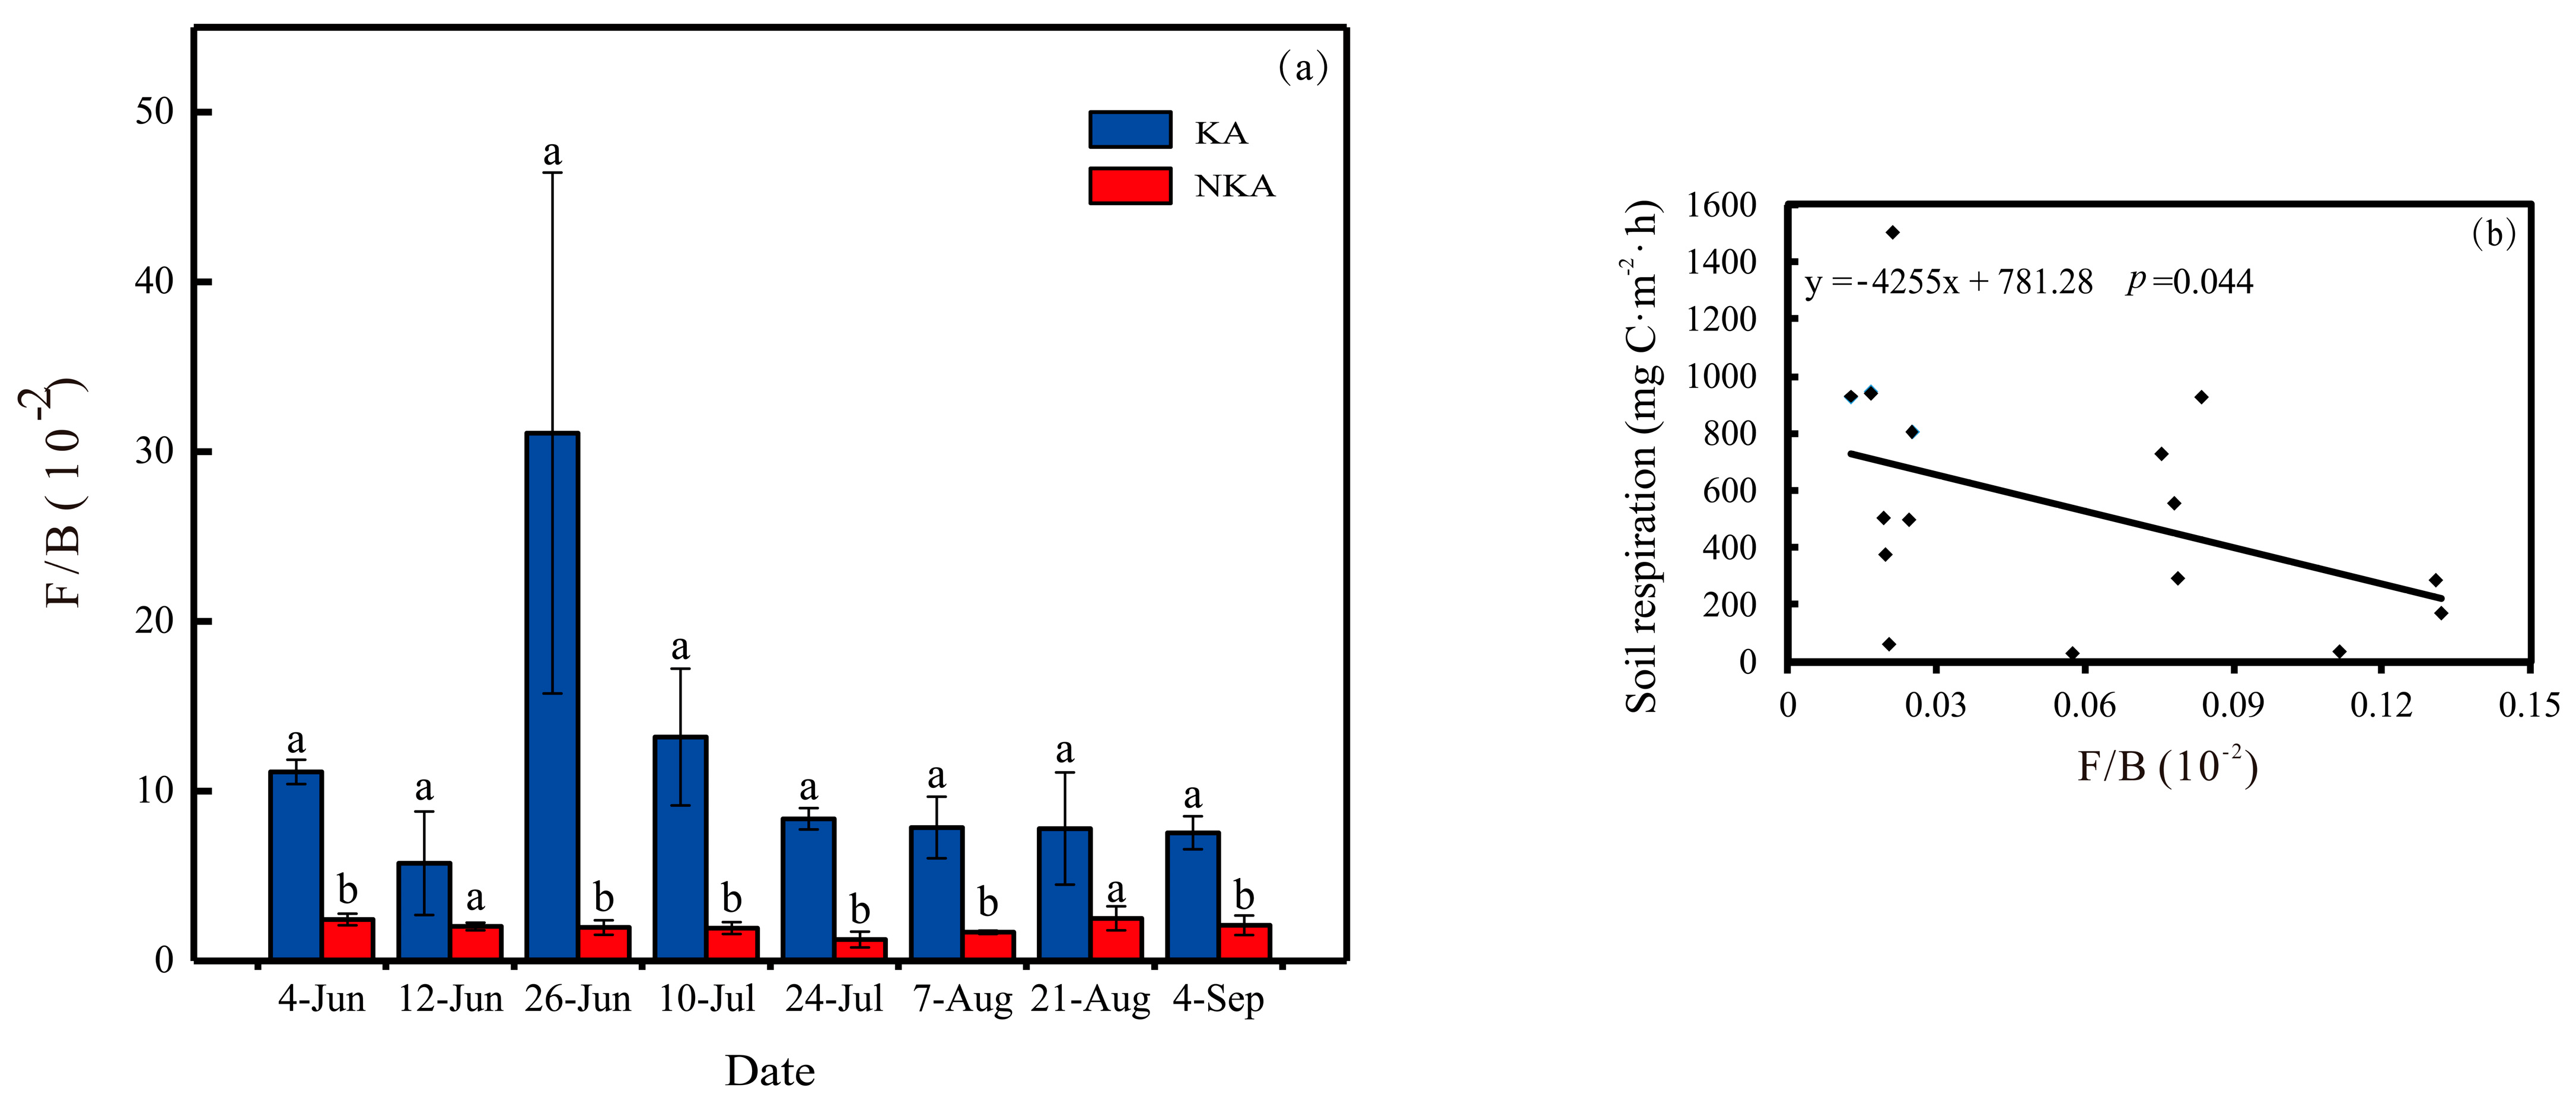
Across the entire rice growing period, the F/B was 5.76 × 10⁻² ~ 31.1 × 10⁻² and 1.26 × 10⁻² ~ 2.51 × 10⁻² in KA and NKA, respectively [Figure 3a]. The F/B in KA exhibited significantly higher than those in NKA. The F/B was also significantly negatively correlated with soil respiration when combining the data of both areas (p = 0.044) [Figure 3b]. Thus, soil respiration decreases with reducing F/B during the rice growing period.

3.4. Variation in Fungal and Bacterial Communities in Paddy Fields of KA and NKA

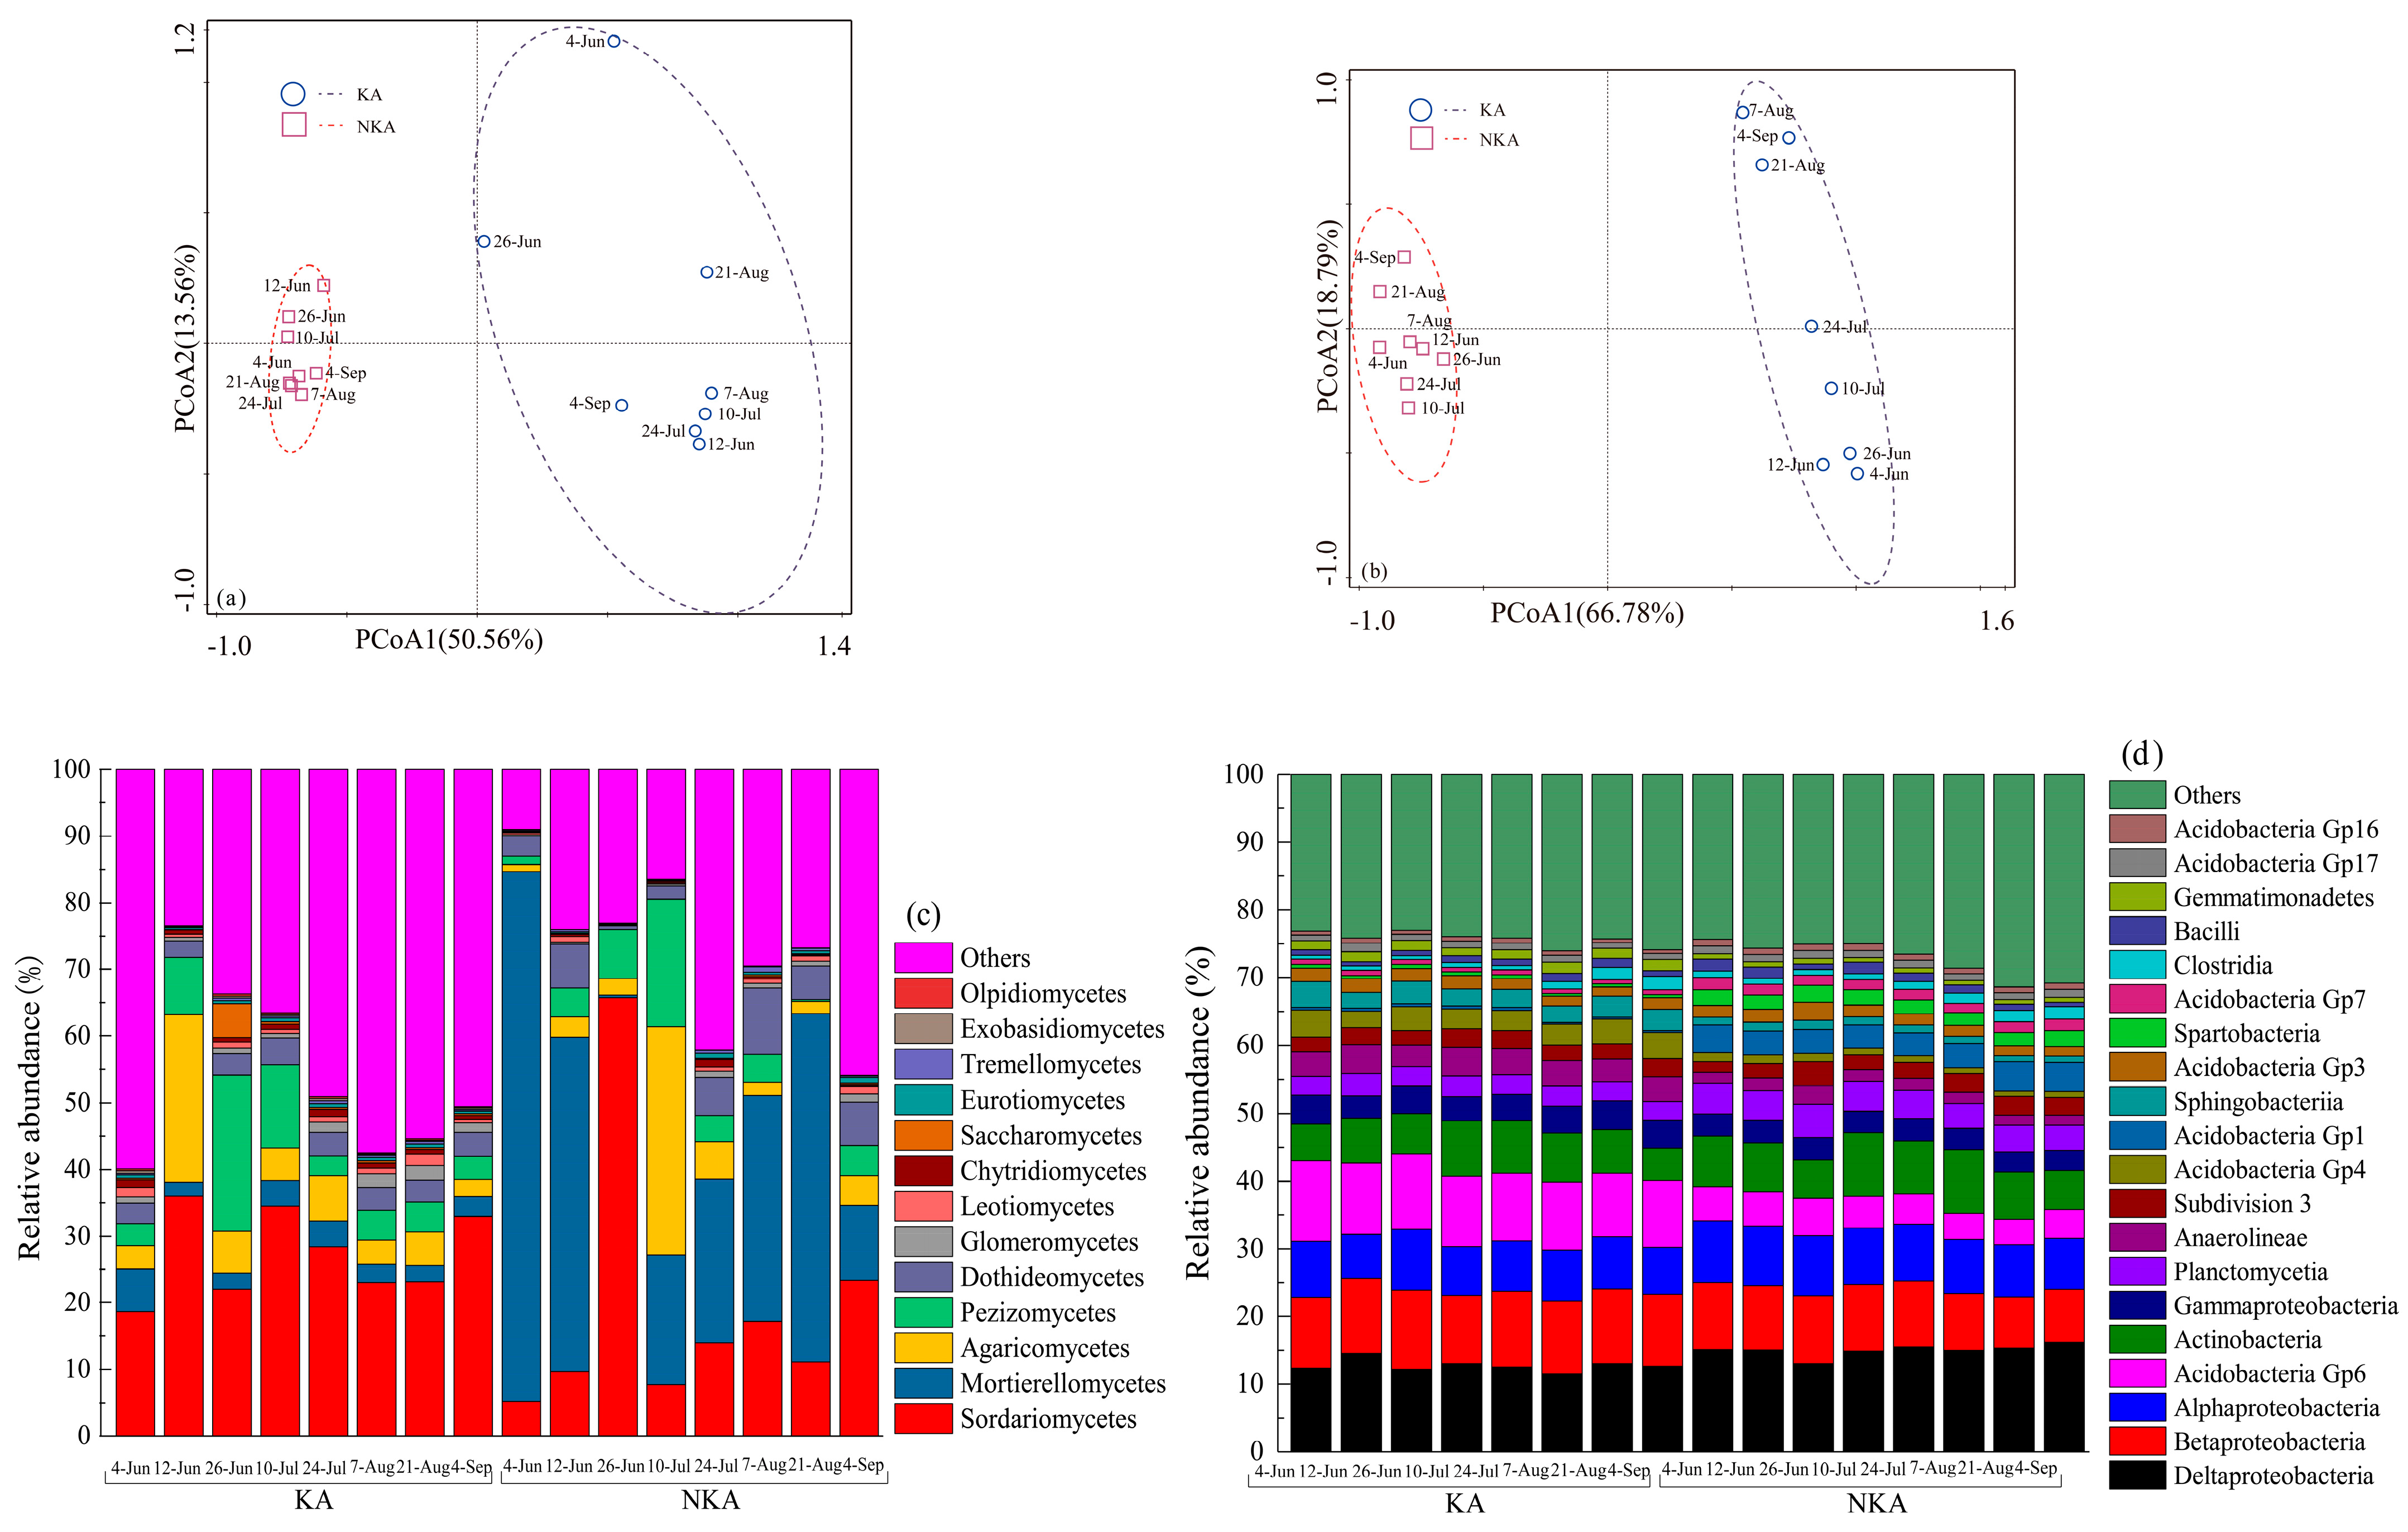
PCoA analysis based on Bray-Curtis distances revealed that 50.56% and 13.56% of the fungal community variation was explained by axes 1 and 2, respectively [Figure 4a], while 66.78% and 18.79% of bacterial community variation was explained by axes 1 and 2 [Figure 4b]. Bacteral and fungal communities generally segregated across the ordinations, indicating clear microbial differences between the KA and the NKA.
At the class level, fungi and bacteria had a total of 13 and 20 dominant classes, respectively [Figure 4c,d]. The average relative abundances of fungal Glomeromycetes, Chytridiomycetes and Exobasidiomycetes (0.91%, 0.98% and 0.23%) in KA were significantly higher than those in NKA (0.47%, 0.28% and 0.04%). The average relative abundances of bacterial β-proteobacteria, Acidobacteria Gp6, γ-proteobacteria, Anaerolineae, Acidobacteria Gp4, Sphingobacteriia and Gemmatimonadetes (10.32%, 9.88%, 3.74%, 3.54%, 3.13%, 2.76% and 1.38%) in KA were significantly higher than those (9.07%, 4.54%, 3.18%, 1.78%, 1.01%, 1.10% and 0.73%). The above results showed that there was a significantly difference of microorganisms between KA and NKA.

3.5. Co-Occurrence Network Analysis of Fungal and Bacterial Taxa in Rice Field Soils

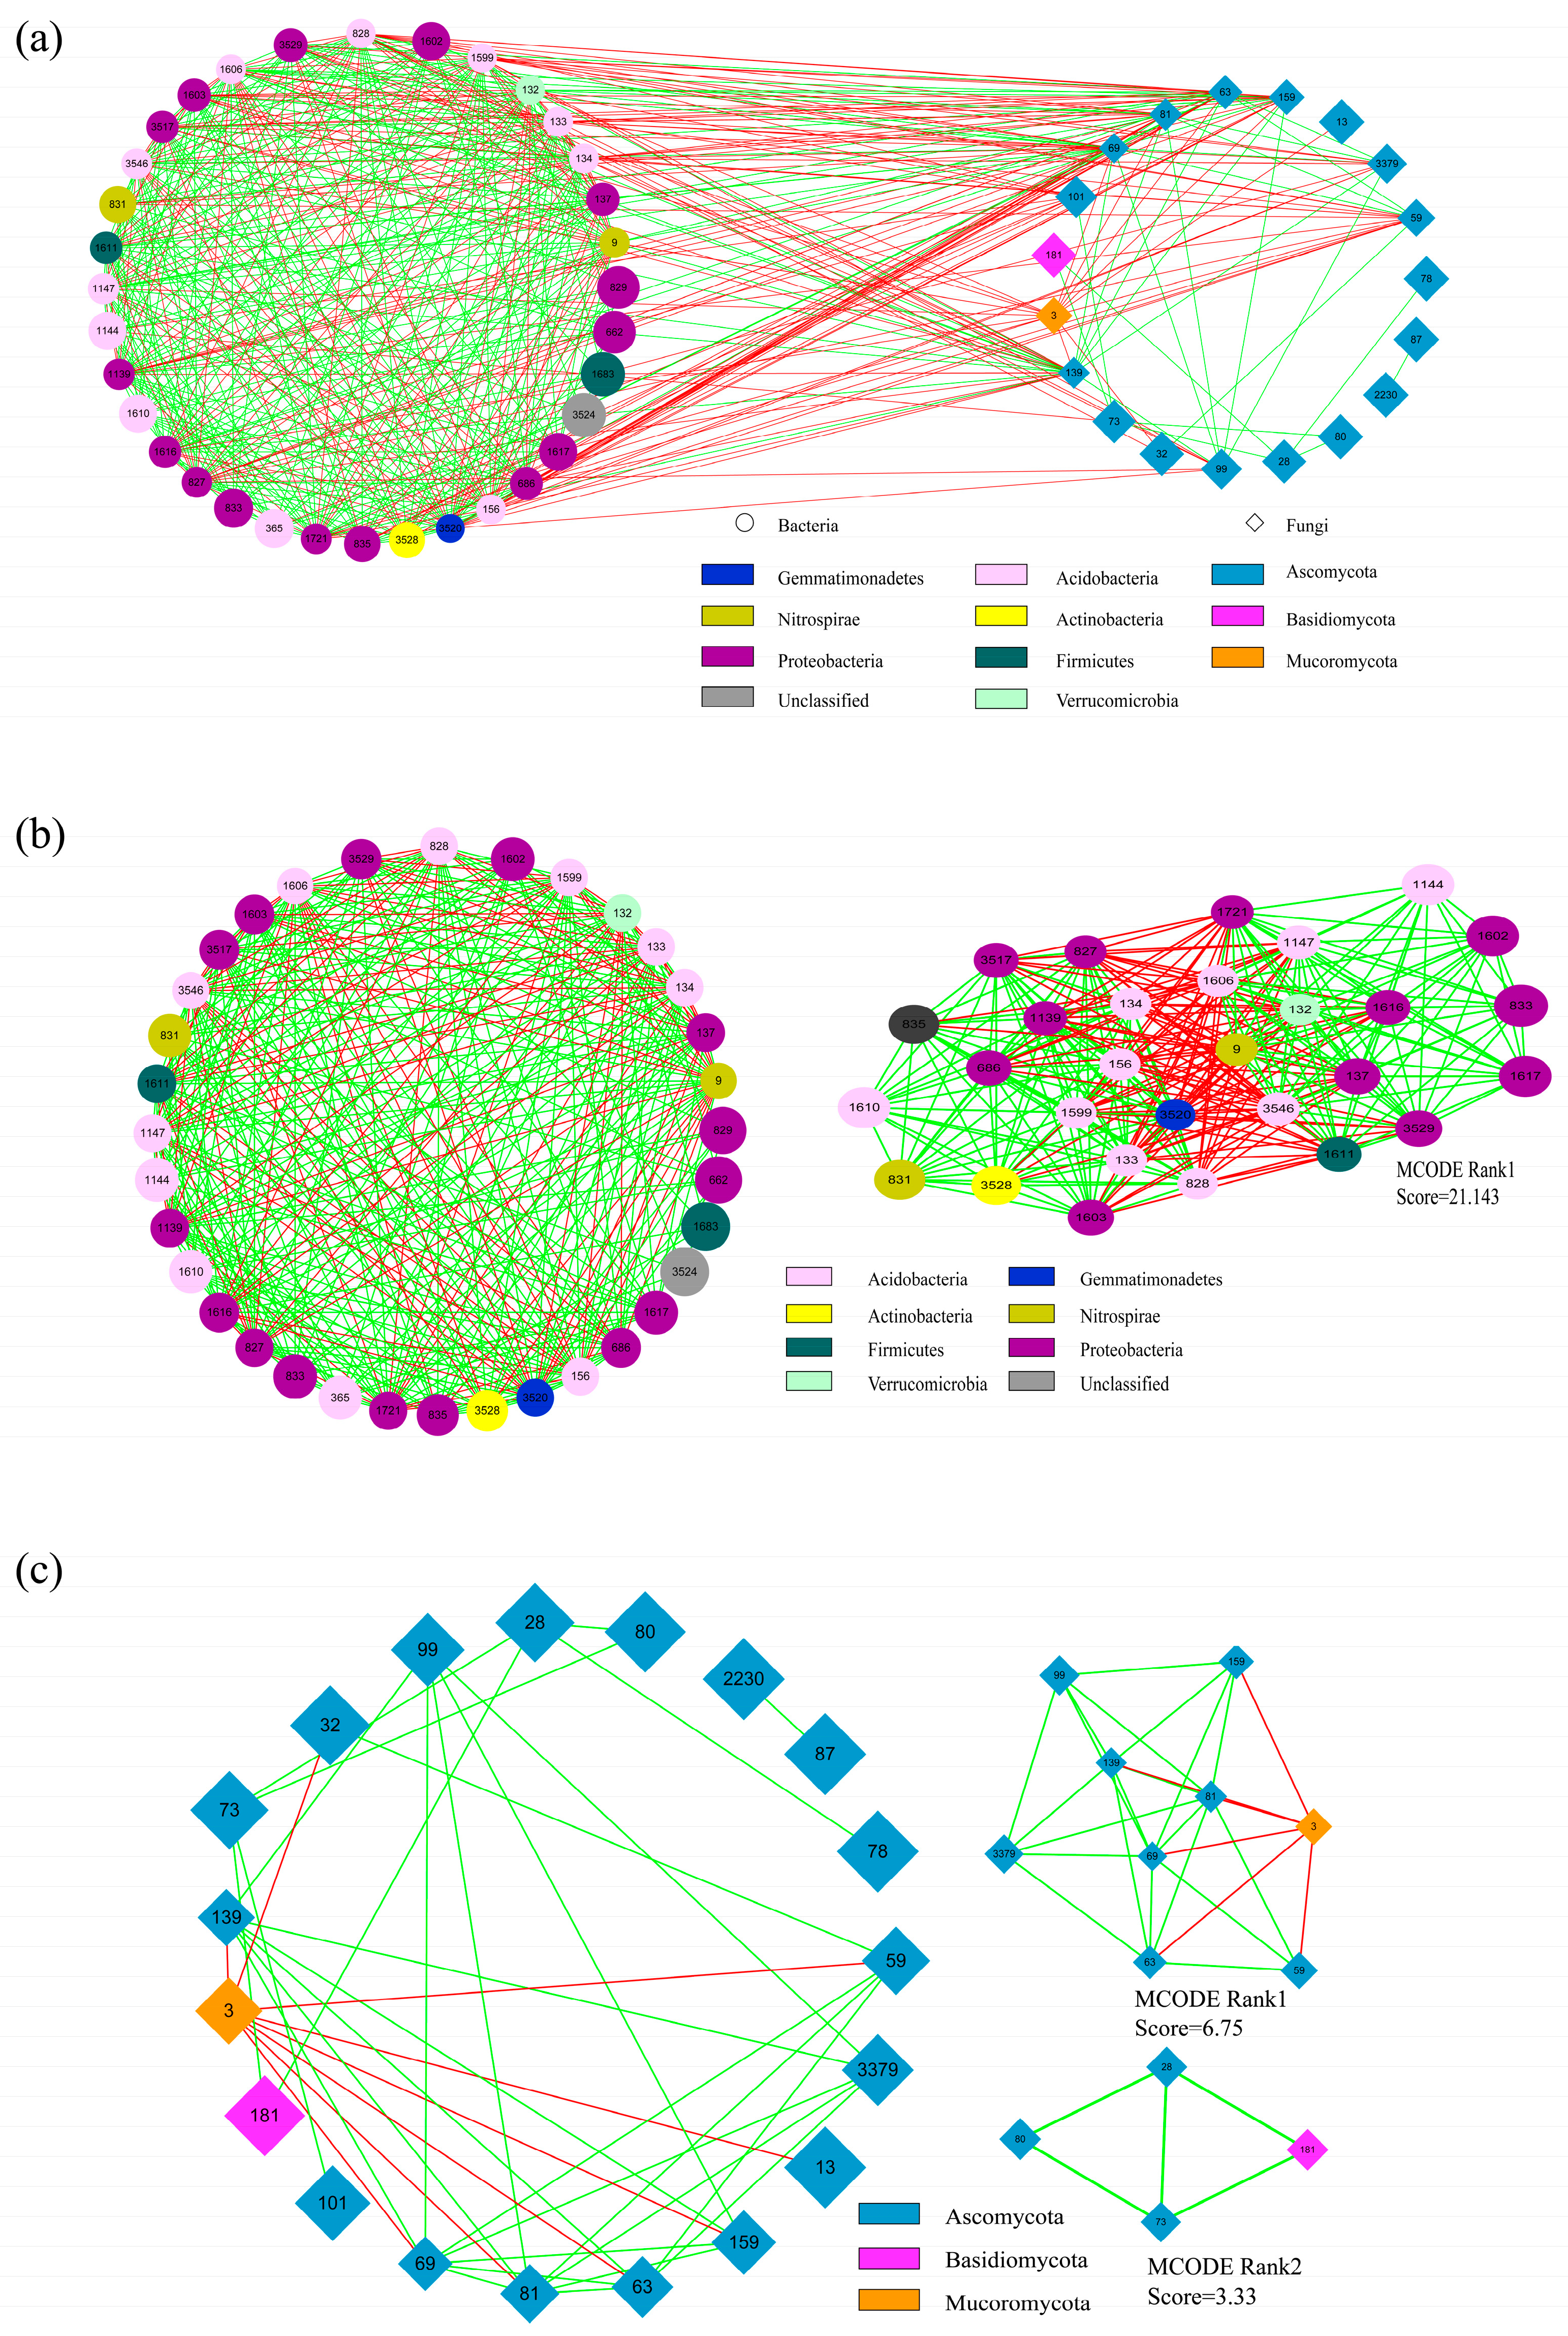
The distributions of dominant fungal (19 total) and bacterial (34 total) OTUs were used to construct fungal and bacterial co-occurrence networks [Figure 5a], With bacterial and fungal networks analyzed separately in [Figure 5b,c]. The characteristic path length (CPL) of the fungal-bacterial co-occurrence network was 1.59 cm (Figure 5), with a diameter of 5.00 cm, and a clustering coefficient (CC) of 0.35. The bacterial-only co-occurrence network also contained 53 nodes that were significantly correlated, comprising a total of 502 edges representing 293 and 209 positive and negative correlations, respectively. Thus, putative mutualistic or cooperative relationships between bacterial and fungal taxa (58.36%) were more apparent than putative competitive associations (41.64%). The OTUs with the highest connectivity in the fungal and bacterial networks were identified as top network taxa. The top taxa in KA soil networks included OTU69 (Emericellopsis) (connectivity of 31) in addition to OTUs 1599 (Acidobacteria Gp6) and 1133 (Acidobacteria Gp6) (both with a connectivity of 24), which were mutually exclusive. The top fungal and bacterial taxa in NKA were OTU139 (Sordariales) and OTU9 (Nitrospira) (connectivity of 26), respectively, which exhibited a positive correlation with one another.
The CPL of the bacterial correlation network was 1.38 cm [Figure 5b], while the diameter was 3.00 cm, and the clustering coefficient (CC) was 0.41. The network consisted of 34 nodes and 329 edges representing 229 positive and 100 negative correlations. The CPL of the network in module 1 was 1.254 cm, and the diameter was 3.00 cm, while the CC was 0.43, and the module comprised 29 nodes and 296 edges (196 positive and 100 negative correlations). The top bacterial OTUs, OTU1599 (Acidobacteria Gp6) and OTU9 (Nitrospira), were present in module 1. The top bacteria of KA was OTU1599 (Acidobacteria Gp6), which exhibited positive correlations with OTU1603 (Burkholderiales), OTU3528 (Phycicoccus), and OTU835 (ß-proteobacteria). The top bacteria in NKA included OTU9 (Nitrospira), which exhibited mutually exclusive relationships with OTU835 (ß-proteobacteria), OTU3528 (Phycicoccus), and OTU1603 (Burkholderiales).
The internal fungal correlation network CPL was 1.39 cm, its diameter was 3.00 cm, and its CC was 0.28 [Figure 5c]. The network consisted of 19 nodes and 38 edges representing 30 positive and 8 negative correlations. The network CPL for module 1 was 1.23 cm, its diameter was 2.00 cm, and its CC was 0.41. The network consisted of 9 nodes and 27 edges, with 22 positive and 5 negative correlations. The network CPL for module 2 was 1.17 cm, while its diameter was 2.00 cm, and its CC was 0.42. The network consisted of four nodes and four positively correlated edges. The top fungal taxa, OTU69 (Emericellopsis) and OTU139 (Sordariales), in KA were present in module 1. Both the OTUs exhibited positive correlations with OTU3379 (Gaeumannomyces), OTU81 (Sordariaceae), and OTU63 (Fusarium).

3.6. Correlational Analysis of Soil Respiration with Fungal and Bacterial Functional Groups

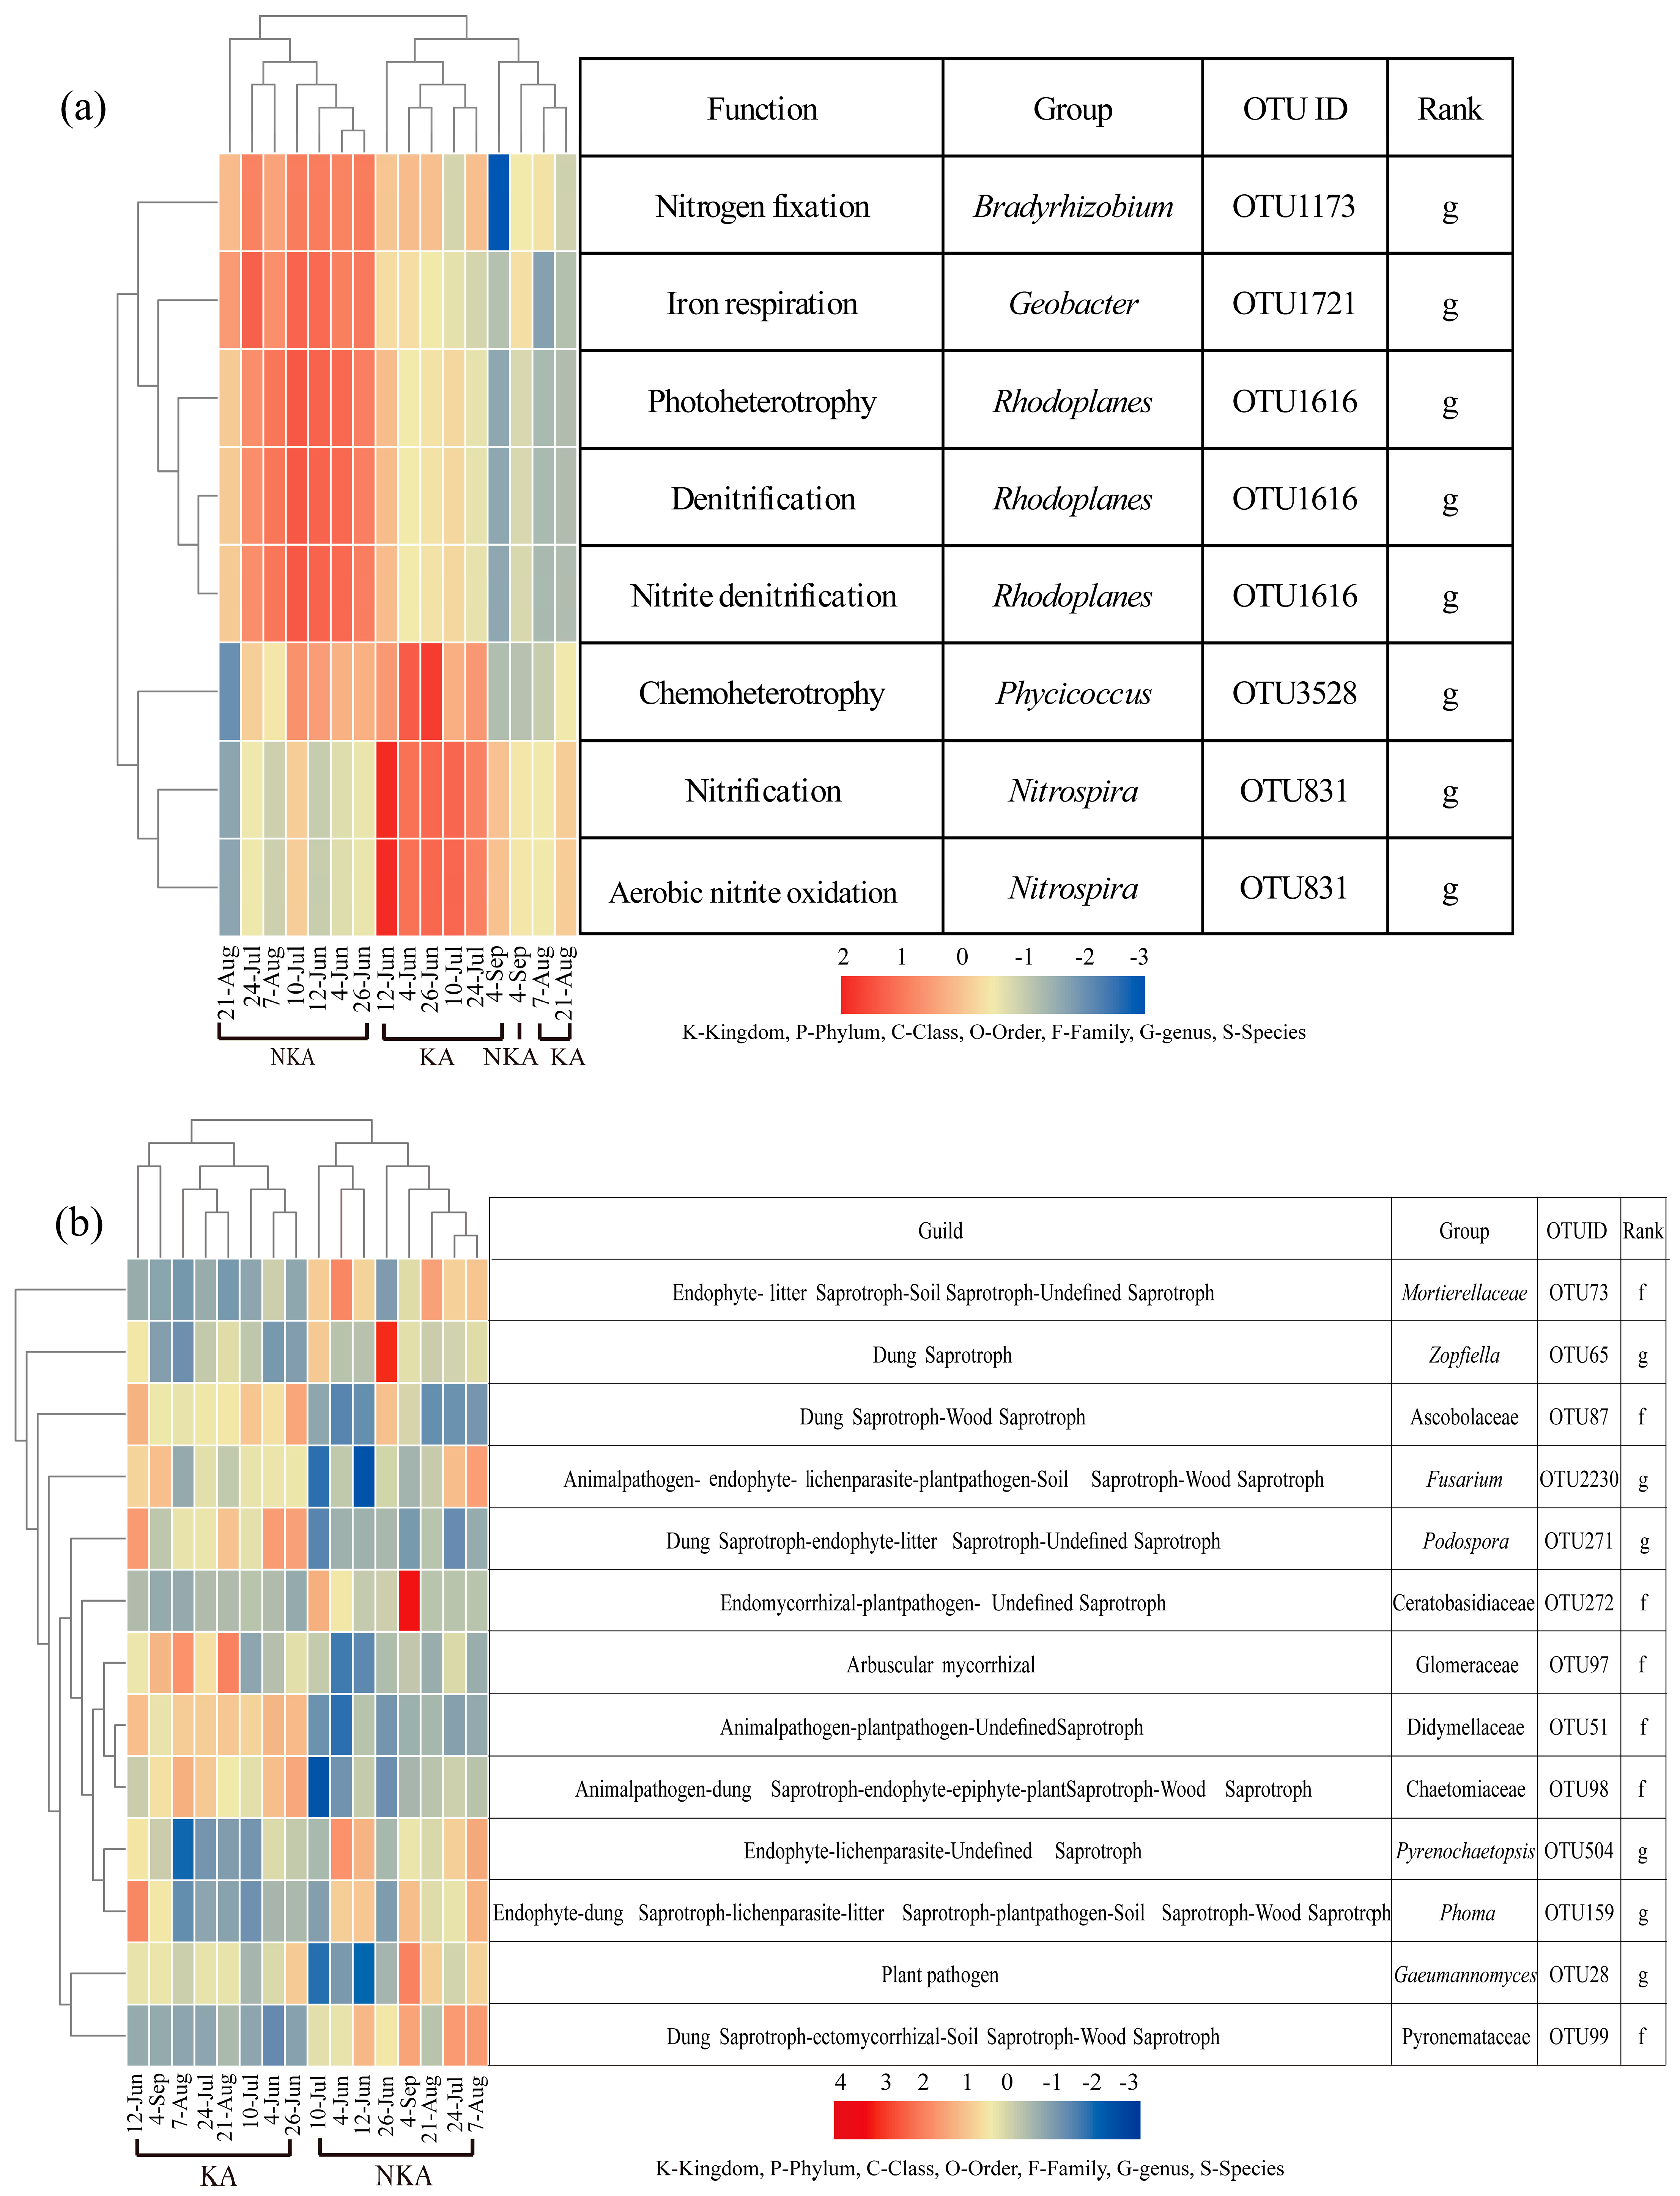
The abundances of the dominant fungal and bacterial OTUs were subjected to functional group prediction using FAPROTAX and FUNGuild, respectively [Figure 6a,b], and their correlations with in situ CO2 fluxes were analyzed [Table 2]. The mean abundance of Stellatospora in NKA accounted for 0.07% of that of all fungi and its abundances were positively correlated with in situ CO2 fluxes. The mean abundance of Acidobacteria Gp6 in KA accounted for 7.05% of that of all bacteria and was negatively correlated with in situ CO2 fluxes. Among the predicted functional groups, the average abundance of fungal plant pathogens in KA and endomycorrhizal-plant pathogen-undefined saprotrophs in NKA accounted for 2.61% and 0.26% of the average abundance of functional taxa, respectively, and the abundances of both were positively correlated with in situ CO2 fluxes. In addition, the average abundance of dung saprotroph-endophyte-litter saprotroph–undefined saprotrophs in KA accounted for 0.88% of the total fungal functional groups and was negatively correlated with in situ CO2 fluxes. The average abundance of aerobic nitrite oxidizers (nitrifiers) were 2.13% of all bacterial functional groups and negatively correlated with in situ CO2 fluxes.

4. Discussion

4.1. Effects of the F/B on In Situ CO2 Fluxes

In present study, the abundance of bacteria and fungi in KA was higher than that in NKA, which indicated that higher soil nutrients shaped higher abundance of microorganisms. In KA, high levels of cations (such as Ca2+ and Mg2+) tend to combine with easily decomposed organics to form more stable large aggregates and organic carbon pools [40,41]. Therefore, compared with fungi, bacteria are more susceptible to partly inhibition in KA environment.
The higher contents of chitin and chitosan in fungi cell wall could not be easily degraded, so that the total biomass of fungi was significantly higher than that of bacteria, which indicated that refractory organic matter form fungi is an important sources of SOC accumulation [42]. Long-term combination of organic and inorganic fertilization increased SOC accumulation of paddy fields in South China. The numbers of fungi and bacteria both also increased significantly, but fungi increased more than bacteria, thereby increasing the F/B [14]. Thiet argued that fungi didn’t have greater growth efficiency than bacteria in greater C storage and slower C turnover in fungal-dominated soils [43]. Luo et al. [40] reported that there was a significant correlation between the SOC and F/B with the reason of increased fungal necromass resulting in a change in the SOC composition. The above result is in accordance with the findings of higher SOC content and F/B in KA in present study.
The KA with high temperature and humidity, the dissolution of carbonate brings a large amount of Ca2+ and HCO3 into the soil. HCO3 combines with H+ in the water to generate CO2, which increases soil CO2 concentration [44]. Though some CO2 in KA soil was consumed through reversibly combining with H2O to form H2CO3 to a certain [3], CO2 concentration of surface soil in KA is still higher than that in NKA. The higher concentration of soil CO2 also change the quantity and quality of soluble sugars, organic acids, amino acids and other compounds secreted by rice roots. The bacterial abundance was significantly decreased and the fungal abundance and biomass were significantly increased, resulting in a significant increase in the F/B as previously reported [45,46].
More studies in the past 20 years have shown that the primary producers of CO2 in soils are microorganism [13,14,47]. In present study, soil respiration in KA was lower than that in NKA, and the communities of both bacteria and fungi in KA were also significantly different with those in the NKA. Moreover, the F/B was higher in the KA than in the NKA. We also found that there was a significant negative correlation between soil respiration and the F/B across KA and NKA. In KA, soil carbon turnover rate would increase due to the changes on soil physical properties and the effect of fungi on physiology [43]. Keiblinger reported that more CO2 will be released in bacterium-dominated soil because of lower carbon utilization efficient of bacteria [48]. Other researches have showed that fungal-derived soil processes and fungal biomass increased in the presence of elevated atmospheric CO2 concentrations, which leading to increased organic C inputs into soils [46]. These results showed that fungi played an important role in the allocation of higher carbon and nitrogen nutrients in paddy soil, thus affecting soil respiration.
In our study, arbuscular mycorrhizal fungi were dominant in KA (showed in Figure 6b). The contribution of mycorrhizal fungi to the high carbon content of soil is reflected the conversion of floor C into mineral soil C [49] and the acceleration of microbial residues into soil [50]. Studies had shown that inoculation with arbuscular mycorrhizal fungi could promote the formation of large aggregates and ease their decomposition into aggregates with smaller particle sizes [51], which enhanced the formation of macroaggregates caused by sequestration of SOC [52]. Fungal hyphae and their cell wall residues act as binders by adsorption, cross-linking and adhesion of primary mineral particles, organic matter, and microaggregates, thereby enhancing the formation and stability of large aggregates [52]. Therefore, the distribution difference of mycorrhizal fungi in aggregates with different particle sizes in paddy soil between KA and NKA deserves further study.

4.2. Effect of Fungal and Background Community Composition On Paddy Field In Situ CO2

Fungal-bacterial co-occurrence network analysis indicated a greater degree of putative mutualistic symbiotic relationships between fungi and bacteria (58.36%) compared with putative competitive relationships (41.64%) of KA and NKA. The presence of a typical “core” plant-microbe microbiota has been documented in several environmental studies [20,53]. These microbiomes may interact through direct or indirect mechanisms of carbon sequestration and can promote plant development [53,54]. Significantly higher relative abundance of Acidobacteria Gp6 in KA of this study (average relative abundance of 7.05%) was negatively correlated with in situ CO2 fluxes. Acidobacterium Gp6 may be the top microbial species in paddy soil in karst areas, as it is present in aggregate networks of different particle size grades [29]. Previous studies have demonstrated that the average relative abundance of Acidobacteria Gp6 was positively correlated with SOC and pH [55] in addition to amylase activity [56]. These results suggest the presence of coordinated activities of bacteria in KA with respect to SOC and pH. In addition, elevated CO2 treatments have been shown to increase the relative abundance of Acidobacteria Gp6 [57], presumably because some Acidobacteria exhibit photosynthetic capacity. Some acidobacterial genomes contain pscA genes that encode the Fenna-Matthews-Olson (FMO) protein that binds to the bacterial chlorophyll molecule (BCh1) in photoresponse I, enabling chlorophyll-based photosynthetic capacity [58]. In this study, some strains of Acidobacteria Gp6 who absorb CO2 for photosynthesis might have led to reduced CO2 emissions in KA soils. Nevertheless, the carbon sequestration capacity of Acidobacteria Gp6 taxa in KA soils deserves our attention.
Nitrospira (OTU9) was also a top taxon in the internal bacterial correlation network and was dominant in NKA. Nitrospira abundance were negatively correlated with pH and TOC [59], and are highly resistant to high ammonia, high pH, salt, and SOC environments. In particular, the Nitrospira was most likely represented by the single-step nitrifying bacteria comammox Nitrospira that drives full nitrification [60]. Comammox Nitrospira encode a single gene cluster containing both amo and hao genes, but do not use Ca2+ (e.g., calcium nitrate and calcium nitrate) in nitrification reactions [61]. Instead, comammox Nitrospira require oxygen molecules to activate ammonia during nitrification [62], which are key adaptations for red soil environments with low carbon, nitrogen, and Ca2+ concentrations. Thus, OTU9 (comammox Nitrospira) is probably an important indicator in NKA rather than KA.
The internal fungal correlation network indicated that OTU69 (Emericellopsis) and OTU139 (Sordariales) as the core groups within the soil fungal networks in KA and NKA, respectively. Emericellopsis is an alkalophilic endophytic fungus with the ability to resist pathogenic peptide synthesis [63] and it enhances the plant host’s ability to cope with environmental stresses, while also contributing to healthy host-plant growth and reproduction [64]. The neutral-alkaline pH in KA resulted in increased relative abundances of Emericellopsis that may then intermittently raise the quantity and quality of algae during the flooding periods within rice fields. Further, most water column algae in KA can use CO2 and free HCO3 to conduct photosynthesis and produce organic carbon. The synergistic interaction between algae and their endophytic fungi in photosynthesis of KA therefore requires further investigation [65]. Stellatospora belongs to the Sordariales group, whose abundances were positively correlated with CO2 emission. Some studies have shown that Sordariales are highly adapted to tropical soil environments that experience warming due to elevated atmospheric CO2 [66]. Thus, Stellatospora might be regarded as a biomarker indicator to distinguish NKA from KA.

4.3. Effects of Fungal and Bacterial Functional Groups on Paddy Field In Situ CO2 Fluxes

Among the predicted fungal functional groups, the endomycorrhizal-plant pathogen-undefined saprotroph functional group was largely represented by Ceratobasidiaceae, with dominant relative abundances in NKA. Ceratobasidiaceae are able to rice blight, where in stems and leaves become yellow and wilt, leading to weakened photosynthetic ability [67]. The plant pathogenic fungal functional group was largely represented by the genus Gaeumannomyces, which also exhibited higher abundances in NKA. Some fungi of this genus are capable of infesting wheat and resulted in wheat allozyme diseases. The plant pathogenic and endomycorrhizal-plant pathogen-undefined saprotroph abundances were positively correlated with CO2 in situ emission. The infected plants transmit infection information to soil through root exudates, causing the bacterial quorum sensing [68] leading to compensatory increase in soil respiration. In addition, Ca2+ affect activity of the antifungal proteins released by bacteria [69], which in turn influences the resistance of crops to allozyme disease. Therefore, the interaction between pathogenic microbes and antagonistic microbes in KA and NKA should be further studied.
The abundance of dung saprotroph-endophyte-litter saprotroph–undefined saprotroph group were negatively correlated with in situ CO2 emission. This functional group was mostly represented by Podospora that are dominant in KA. van Erven reported that Podospora anserine, a late colonizer of herbivorous dung, has high NADPH oxidase activity [70]. The oxidase promotes the formation of H2O2 and acts specifically on the more recalcitrant fraction of lignocellulose, which may promote the degradation of organic matter. Malagnac reported that NADPH oxidase can also promote the sexual reproduction and ascospore germination of the filamentous fungus Podospora anserina [71]. The products of lignocellulose degradation by fungi are likely to be used by bacteria, which improved utilization efficiency of organic matter and increased thermally stable SOC [72]. These results suggest that the relationship between soil microorganisms including Podospora and the thermal stability of SOC in KA is worth further study.
CO2 in soils not only changed general microbial taxa, but also can be assimilated by autotrophic bacteria and turned into microbial biomass [73]. In the present study, autotrophic bacteria (such as aerobic nitrite oxidizers and nitrifiers) using CO2 as the only carbon source were dominant in KA (as shown in Figure 6a). This was similar to the results of our previous investigation, which showed that high abundance of carbon fixing bacteria was in KA [25]. Among the predicted bacterial functional groups, the abundances of aerobic nitrite oxidizers and nitrifiers were negatively correlated with in situ CO2 fluxes. These functional groups derive from the aerobic nitrite oxidation and nitrification activities associated with OTU831 (Nitrospira), which were dominant in KA. Ammonia-oxidizing bacteria (AOB) are autotrophic microorganisms using CO2 as a carbon source in autotrophy [74]. Nitrification substrates are NH3 molecules rather than NH4+ ions, and a neutral alkaline karst environment might make the chemical equilibrium of NH3 and NH4+ tend towards NH3 molecule production. Consequently, the abundances of AOB and their ability to fix CO2 might be improved by increasing the abundances of NH4+-N [75,76]. Therefore, the lower in situ CO2 emission in KA might also contribute to autotrophic nitrification by Nitrospira [77].

5. Conclusions

In this study, we observed higher abundance of bacteria and fungi and higher F/B but lower soil respiration in karst area compared with those in non-karst area. We found that there was a significant difference of bacterial and fungi community between karst area and non-karst area. We also found that there was a significantly negatively correlation between soil respiration and ratio of fungi to bacteria. On the one hand, higher abundances of fungi and their associated functional activities might enable better use of recalcitrance. On the other hand, bacterial abundances were decreased to adapt to environmental stresses from reduced easily available carbon supplies. Further, in response to the unique karst environments, microbial community structures and their associated functional groups were altered. In addition, the abundances of some autotrophic carbon-fixing bacteria and arbuscular mycorrhizal fungi increased and the abundance of pathogenic fungi decreased, which thereby also probably improved the utilization of SOC and reduces soil CO2 emissions. In the future research, combining these microbial characteristics associated with soil respiration and through C and N isotopic labeling tracking technology and indoor incubation experiments can be provided more accurate soil carbon and nitrogen dynamics in KA.

Supplementary Materials

The following supporting information can be downloaded at: https://www.mdpi.com/article/10.3390/agronomy13082001/s1, Figure S1: The soil respiration of paddy fields during fallow.

Author Contributions

Conceptualization, Z.J. and J.Z.; software, J.Z.; formal analysis, G.C. and J.Z.; investigation, L.X., X.L., W.C., J.Z. and Z.J.; data curation, W.Y. and J.Z.; writing—original draft preparation, J.Z.; writing—review and editing, Z.J. and J.Z.; visualization, J.Z. All authors have read and agreed to the published version of the manuscript.

Funding

This work was supported by grants from the National Natural Science Foundation of China (41867008), the Key Research and Development Program of Guangxi (GuiKe-AB21196050, GuiKe-AB20297039), Guangxi Natural Science Foundation of China (2018GXNSFAA281247), Foundation of Guilin University of Technology (GUTQDJJ2004041), and Technology Planning Project (gxzz201903).

Data Availability Statement

The datasets generated during the current study were uploaded to the Sequence Read Archive (SRA) and have the accession number PRJNA763299.

Acknowledgments

Thank Xiaowen Zhang of Guilin University of Technology for providing qPCR experimental guidance.

Conflicts of Interest

The authors declare that they have no known competing financial interest or personal relationships that could have appeared to influence the work reported in this paper.

References

  1. Wang, K.; Zhang, C.; Chen, H.; Yue, Y.; Zhang, W.; Zhang, M.; Qi, X.; Fu, Z. Karst Landscapes of China: Patterns, Ecosystem Processes and Services. Landsc. Ecol. 2019, 34, 2743–2763. [Google Scholar] [CrossRef] [Green Version]
  2. Liu, C.; Huang, Y.; Wu, F.; Liu, W.; Ning, Y.; Huang, Z.; Tang, S.; Liang, Y. Plant Adaptability in Karst Regions. J. Plant Res. 2021, 134, 889–906. [Google Scholar] [CrossRef] [PubMed]
  3. Liu, Z.; Dreybrodt, W. Significance of the Carbon Sink Produced by H2O-Carbonate-CO2-Aquatic Phototroph Interaction on Land. Sci. Bull. 2015, 60, 182–191. [Google Scholar] [CrossRef]
  4. Abbaszadeh, M.; Nasiri, M.; Riazi, M. Experimental Investigation of the Impact of Rock Dissolution on Carbonate Rock Properties in the Presence of Carbonated Water. Environ. Earth Sci. 2016, 75, 791. [Google Scholar] [CrossRef]
  5. Zeng, S.; Liu, Z.; Kaufmann, G. Sensitivity of the Global Carbonate Weathering Carbon-Sink Flux to Climate and Land-Use Changes. Nat. Commun. 2019, 10, 5749. [Google Scholar] [CrossRef] [Green Version]
  6. Dass, P.; Houlton, B.Z.; Wang, Y.; Warlind, D.; Morford, S. Bedrock Weathering Controls on Terrestrial Carbon-Nitrogen-Climate Interactions. Glob. Biogeochem. Cycle 2021, 35, e2020GB006933. [Google Scholar] [CrossRef]
  7. Zhao, B.; Su, Y. Process Effect of Microalgal-Carbon Dioxide Fixation and Biomass Production: A Review. Renew. Sustain. Energ. Rev. 2014, 31, 121–132. [Google Scholar] [CrossRef]
  8. Sha, Z.; Bai, Y.; Li, R.; Lan, H.; Zhang, X.; Li, J.; Liu, X.; Chang, S.; Xie, Y. The Global Carbon Sink Potential of Terrestrial Vegetation Can Be Increased Substantially by Optimal Land Management. Commun. Earth Environ. 2022, 3, 8. [Google Scholar] [CrossRef]
  9. Huang, W.; Han, T.; Liu, J.; Wang, G.; Zhou, G. Changes in Soil Respiration Components and Their Specific Respiration along Three Successional Forests in the Subtropics. Funct. Ecol. 2016, 30, 1466–1474. [Google Scholar] [CrossRef] [Green Version]
  10. Bond-Lamberty, B.; Thomson, A. Temperature-Associated Increases in the Global Soil Respiration Record. Nature 2010, 464, 579–582. [Google Scholar] [CrossRef]
  11. Su, Y.G.; Huang, G.; Lin, Y.J.; Zhang, Y.M. No Synergistic Effects of Water and Nitrogen Addition on Soil Microbial Communities and Soil Respiration in a Temperate Desert. Catena 2016, 142, 126–133. [Google Scholar] [CrossRef]
  12. Jian, J.; Steele, M.K.; Thomas, R.Q.; Day, S.D.; Hodges, S.C. Constraining Estimates of Global Soil Respiration by Quantifying Sources of Variability. Glob. Change Biol. 2018, 24, 4143–4159. [Google Scholar] [CrossRef]
  13. Moinet, G.Y.K.; Cieraad, E.; Hunt, J.E.; Fraser, A.; Turnbull, M.H.; Whitehead, D. Soil Heterotrophic Respiration Is Insensitive to Changes in Soil Water Content but Related to Microbial Access to Organic Matter. Geoderma 2016, 274, 68–78. [Google Scholar] [CrossRef]
  14. Ming, L.; Ekschmitt, K.; Bin, Z.; Holzhauer, S.I.J.; Zhong-pei, L.; Tao-lin, Z.; Rauch, S. Effect of Intensive Inorganic Fertilizer Application on Microbial Properties in a Paddy Soil of Subtropical China. Agric. Sci. China 2011, 10, 1758–1764. [Google Scholar] [CrossRef]
  15. Chen, X.; Xia, Y.; Rui, Y.; Ning, Z.; Hu, Y.; Tang, H.; He, H.; Li, H.; Kuzyakov, Y.; Ge, T.; et al. Microbial Carbon Use Efficiency, Biomass Turnover, and Necromass Accumulation in Paddy Soil Depending on Fertilization. Agric. Ecosyst. Environ. 2020, 292, 106816. [Google Scholar] [CrossRef]
  16. Jia, X.; Zha, T.; Wu, B.; Zhang, Y.; Chen, W.; Wang, X.; Yu, H.; He, G. Temperature Response of Soil Respiration in a Chinese Pine Plantation: Hysteresis and Seasonal vs. Diel Q10. PLoS ONE 2013, 8, e57858. [Google Scholar] [CrossRef] [PubMed] [Green Version]
  17. Ji, W.; Yang, Z.; Yu, T.; Yang, Q.; Wen, Y.; Wu, T. Potential Ecological Risk Assessment of Heavy Metals in the Fe-Mn Nodules in the Karst Area of Guangxi, Southwest China. Bull. Environ. Contam. Toxicol. 2021, 106, 51–56. [Google Scholar] [CrossRef]
  18. Miao, X.; Hao, Y.; Liu, H.; Xie, Z.; Miao, D.; He, X. Effects of Heavy Metals Speciations in Sediments on Their Bioaccumulation in Wild Fish in Rivers in Liuzhou—A Typical Karst Catchment in Southwest China. Ecotox. Environ. Saf. 2021, 214, 112099. [Google Scholar] [CrossRef]
  19. Liu, S.; Zhang, Y.; Zong, Y.; Hu, Z.; Wu, S.; Zhou, J.; Jin, Y.; Zou, J. Response of Soil Carbon Dioxide Fluxes, Soil Organic Carbon and Microbial Biomass Carbon to Biochar Amendment: A Meta-Analysis. GCB Bioenergy 2016, 8, 392–406. [Google Scholar] [CrossRef]
  20. Bulgarelli, D.; Rott, M.; Schlaeppi, K.; van Themaat, E.V.L.; Ahmadinejad, N.; Assenza, F.; Rauf, P.; Huettel, B.; Reinhardt, R.; Schmelzer, E.; et al. Revealing Structure and Assembly Cues for Arabidopsis Root-Inhabiting Bacterial Microbiota. Nature 2012, 488, 91–95. [Google Scholar] [CrossRef]
  21. Pierce, E.C.; Morin, M.; Little, J.C.; Liu, R.B.; Tannous, J.; Keller, N.P.; Pogliano, K.; Wolfe, B.E.; Sanchez, L.M.; Dutton, R.J. Bacterial-Fungal Interactions Revealed by Genome-Wide Analysis of Bacterial Mutant Fitness. Nat. Microbiol. 2021, 6, 87–102. [Google Scholar] [CrossRef] [PubMed]
  22. Wu, M.; Feng, Q.; Sun, X.; Wang, H.; Gielen, G.; Wu, W. Rice (Oryza Sativa L.) Plantation Affects the Stability of Biochar in Paddy Soil. Sci. Rep. 2015, 5, 10001. [Google Scholar] [CrossRef] [PubMed] [Green Version]
  23. Lecomte, S.M.; Achouak, W.; Abrouk, D.; Heulin, T.; Nesme, X.; Haichar, F.e.Z. Diversifying Anaerobic Respiration Strategies to Compete in the Rhizosphere. Front. Environ. Sci. 2018, 6, 139. [Google Scholar] [CrossRef]
  24. Zhu, Z.; Ge, T.; Hu, Y.; Zhou, P.; Wang, T.; Shibistova, O.; Guggenberger, G.; Su, Y.; Wu, J. Fate of Rice Shoot and Root Residues, Rhizodeposits, and Microbial Assimilated Carbon in Paddy Soil—Part 2: Turnover and Microbial Utilization. Plant Soil 2017, 416, 243–257. [Google Scholar] [CrossRef]
  25. Zhou, J.; Jin, Z.; Leng, M.; Xiao, X.; Wang, X.; Pan, F.; Li, Q. Investigation of Soil Bacterial Communities and Functionalities Within Typical Karst Paddy Field Soils in Southern China. Fresenius Environ. Bull. 2021, 30, 3537–3548. [Google Scholar]
  26. Xu, H.; Du, H.; Zeng, F.; Song, T.; Peng, W. Diminished Rhizosphere and Bulk Soil Microbial Abundance and Diversity across Succession Stages in Karst Area, Southwest China. Appl. Soil Ecol. 2021, 158, 103799. [Google Scholar] [CrossRef]
  27. Yang, H.; Xie, Y.; Zhu, T.; Zhou, M. Reduced Organic Carbon Content during the Evolvement of Calcareous Soils in Karst Region. Forests 2021, 12, 221. [Google Scholar] [CrossRef]
  28. Cao, W.; Xiong, Y.; Zhao, D.; Tan, H.; Qu, J. Bryophytes and the Symbiotic Microorganisms, the Pioneers of Vegetation Restoration in Karst Rocky Desertification Areas in Southwestern China. Appl. Microbiol. Biotechnol. 2020, 104, 873–891. [Google Scholar] [CrossRef] [Green Version]
  29. Xiao, X.; Jin, Z.; Leng, M.; Li, X.; Xiong, L. Comparison of Bacterial Community Structure and Functional Groups of Paddy Soil Aggregates Between Karst and Non-Karst Areas. Huan Jing Ke Xue = Huanjing Kexue 2022, 43, 3865–3875. [Google Scholar] [CrossRef] [PubMed]
  30. Huang, Y.; Zhang, W.; Sun, W.; Zheng, X. Net Primary Production of Chinese Croplands from 1950 to 1999. Ecol. Appl. 2007, 17, 692–701. [Google Scholar] [CrossRef] [PubMed]
  31. Kimura, M.; Murase, J.; Lu, Y.H. Carbon Cycling in Rice Field Ecosystems in the Context of Input, Decomposition and Translocation of Organic Materials and the Fates of Their End Products (CO2 and CH4). Soil Biol. Biochem. 2004, 36, 1399–1416. [Google Scholar] [CrossRef]
  32. Mandal, B.; Majumder, B.; Adhya, T.K.; Bandyopadhyay, P.K.; Gangopadhyay, A.; Sarkar, D.; Kundu, M.C.; Choudhury, S.G.; Hazra, G.C.; Kundu, S.; et al. Potential of Double-Cropped Rice Ecology to Conserve Organic Carbon under Subtropical Climate. Glob. Change Biol. 2008, 14, 2139–2151. [Google Scholar] [CrossRef]
  33. Li, X.; Jin, Z.; Xiong, L.; Tong, L.; Zhu, H.; Zhang, X.; Qin, G. Effects of Land Reclamation on Soil Bacterial Community and Potential Functions in Bauxite Mining Area. Int. J. Environ. Res. Public Health 2022, 19, 16921. [Google Scholar] [CrossRef] [PubMed]
  34. Zhang, L.; Yu, D.; Shi, X.; Weindorf, D.C.; Zhao, L.; Ding, W.; Wang, H.; Pan, J.; Li, C. Simulation of Global Warming Potential (GWP) from Rice Fields in the Tai-Lake Region, China by Coupling 1:50,000 Soil Database with DNDC Model. Atmos. Environ. 2009, 43, 2737–2746. [Google Scholar] [CrossRef]
  35. Claesson, M.J.; O’Sullivan, O.; Wang, Q.; Nikkilae, J.; Marchesi, J.R.; Smidt, H.; de Vos, W.M.; Ross, R.P.; O’Toole, P.W. Comparative Analysis of Pyrosequencing and a Phylogenetic Microarray for Exploring Microbial Community Structures in the Human Distal Intestine. PLoS ONE 2009, 4, e6669. [Google Scholar] [CrossRef] [Green Version]
  36. Schmieder, R.; Edwards, R. Quality Control and Preprocessing of Metagenomic Datasets. Bioinformatics 2011, 27, 863–864. [Google Scholar] [CrossRef] [Green Version]
  37. Cannon, A.J. Multivariate Quantile Mapping Bias Correction: An N-Dimensional Probability Density Function Transform for Climate Model Simulations of Multiple Variables. Clim. Dyn. 2018, 50, 31–49. [Google Scholar] [CrossRef] [Green Version]
  38. Doncheva, N.T.; Assenov, Y.; Domingues, F.S.; Albrecht, M. Topological Analysis and Interactive Visualization of Biological Networks and Protein Structures. Nat. Protoc. 2012, 7, 670–685. [Google Scholar] [CrossRef]
  39. Zallot, R.; Oberg, N.; Gerlt, J.A. The EFI Web Resource for Genomic Enzymology Tools: Leveraging Protein, Genome, and Metagenome Databases to Discover Novel Enzymes and Metabolic Pathways. Biochemistry 2019, 58, 4169–4182. [Google Scholar] [CrossRef]
  40. Luo, Y.; Xiao, M.; Yuan, H.; Liang, C.; Zhu, Z.; Xu, J.; Kuzyakov, Y.; Wu, J.; Ge, T.; Tang, C. Rice Rhizodeposition Promotes the Build-up of Organic Carbon in Soil via Fungal Necromass. Soil Biol. Biochem. 2021, 160, 108345. [Google Scholar] [CrossRef]
  41. Song, Y.; Liu, C.; Wang, X.; Ma, X.; Jiang, L.; Zhu, J.; Gao, J.; Song, C. Microbial Abundance as an Indicator of Soil Carbon and Nitrogen Nutrient in Permafrost Peatlands. Ecol. Indic. 2020, 115, 106362. [Google Scholar] [CrossRef]
  42. Ananyeva, N.D.; Polyanskaya, L.M.; Stolnikova, E.V.; Zvyagintzev, D.G. Fungal to Bacterial Biomass Ratio in the Forests Soil Profile. Biol. Bull 2010, 37, 254–262. [Google Scholar] [CrossRef]
  43. Thiet, R.K.; Frey, S.D.; Six, J. Do Growth Yield Efficiencies Differ between Soil Microbial Communities Differing in Fungal: Bacterial Ratios? Reality Check and Methodological Issues. Soil Biol. Biochem. 2006, 38, 837–844. [Google Scholar] [CrossRef]
  44. Jianhua, C.; Daoxian, Y.; Groves, C.; Fen, H.; Hui, Y.; Qian, L. Carbon Fluxes and Sinks: The Consumption of Atmospheric and Soil CO2 by Carbonate Rock Dissolution. Acta Geol. Sin.-Engl. Ed. 2012, 86, 963–972. [Google Scholar] [CrossRef]
  45. Zhong, L.; Bowatte, S.; Newton, P.C.D.; Hoogendoorn, C.J.; Luo, D. An Increased Ratio of Fungi to Bacteria Indicates Greater Potential for N2O Production in a Grazed Grassland Exposed to Elevated CO2. Agric. Ecosyst. Environ. 2018, 254, 111–116. [Google Scholar] [CrossRef]
  46. Laughlin, R.J.; Rutting, T.; Mueller, C.; Watson, C.J.; Stevens, R.J. Effect of Acetate on Soil Respiration, N2O Emissions and Gross N Transformations Related to Fungi and Bacteria in a Grassland Soil. Appl. Soil Ecol. 2009, 42, 25–30. [Google Scholar] [CrossRef]
  47. Li, W.; Yu, L.J.; Yuan, D.X.; Xu, H.B.; Yang, Y. Bacteria Biomass and Carbonic Anhydrase Activity in Some Karst Areas of Southwest China. J. Asian Earth Sci. 2004, 24, 145–152. [Google Scholar] [CrossRef]
  48. Keiblinger, K.M.; Hall, E.K.; Wanek, W.; Szukics, U.; Haemmerle, I.; Ellersdorfer, G.; Boeck, S.; Strauss, J.; Sterflinger, K.; Richter, A.; et al. The Effect of Resource Quantity and Resource Stoichiometry on Microbial Carbon-Use-Efficiency. FEMS Microbiol. Ecol. 2010, 73, 430–440. [Google Scholar] [CrossRef] [PubMed]
  49. Lin, G.; McCormack, M.L.; Ma, C.; Guo, D. Similar Below-Ground Carbon Cycling Dynamics but Contrasting Modes of Nitrogen Cycling between Arbuscular Mycorrhizal and Ectomycorrhizal Forests. New Phytol. 2017, 213, 1440–1451. [Google Scholar] [CrossRef]
  50. Craig, M.E.; Turner, B.L.; Liang, C.; Clay, K.; Johnson, D.J.; Phillips, R.P. Tree Mycorrhizal Type Predicts Within-Site Variability in the Storage and Distribution of Soil Organic Matter. Glob. Change Biol. 2018, 24, 3317–3330. [Google Scholar] [CrossRef] [PubMed]
  51. Tian, X.; Wang, C.; Bao, X.; Wang, P.; Li, X.; Yang, S.; Ding, G.; Christie, P.; Li, L. Crop Diversity Facilitates Soil Aggregation in Relation to Soil Microbial Community Composition Driven by Intercropping. Plant Soil 2019, 436, 173–192. [Google Scholar] [CrossRef]
  52. Xiao, L.; Zhang, W.; Hu, P.; Xiao, D.; Yang, R.; Ye, Y.; Wang, K. The Formation of Large Macroaggregates Induces Soil Organic Carbon Sequestration in Short-Term Cropland Restoration in a Typical Karst Area. Sci. Total Environ. 2021, 801, 149588. [Google Scholar] [CrossRef] [PubMed]
  53. Lundberg, D.S.; Lebeis, S.L.; Paredes, S.H.; Yourstone, S.; Gehring, J.; Malfatti, S.; Tremblay, J.; Engelbrektson, A.; Kunin, V.; del Rio, T.G.; et al. Defining the Core Arabidopsis Thaliana Root Microbiome. Nature 2012, 488, 86–90. [Google Scholar] [CrossRef] [PubMed] [Green Version]
  54. Bulgarelli, D.; Schlaeppi, K.; Spaepen, S.; van Themaat, E.V.L.; Schulze-Lefert, P. Structure and Functions of the Bacterial Microbiota of Plants. Annu. Rev. Plant Biol. 2013, 64, 807–838. [Google Scholar] [CrossRef] [PubMed] [Green Version]
  55. Han, Z.; Ma, J.; Yang, C.-H.; Ibekwe, A.M. Soil Salinity, PH, and Indigenous Bacterial Community Interactively Influence the Survival of E. Coli O157:H7 Revealed by Multivariate Statistics. Environ. Sci. Pollut. Res. 2021, 28, 5575–5586. [Google Scholar] [CrossRef] [PubMed]
  56. Zhang, Y.; Cong, J.; Lu, H.; Li, G.; Qu, Y.; Su, X.; Zhou, J.; Li, D. Community Structure and Elevational Diversity Patterns of Soil Acidobacteria. J. Environ. Sci. 2014, 26, 1717–1724. [Google Scholar] [CrossRef]
  57. Dunbar, J.; Gallegos-Graves, L.V.; Steven, B.; Mueller, R.; Hesse, C.; Zak, D.R.; Kuske, C.R. Surface Soil Fungal and Bacterial Communities in Aspen Stands Are Resilient to Eleven Years of Elevated CO2 and O3. Soil Biol. Biochem. 2014, 76, 227–234. [Google Scholar] [CrossRef]
  58. Bryant, D.A.; Costas, A.M.G.; Maresca, J.A.; Chew, A.G.M.; Klatt, C.G.; Bateson, M.M.; Tallon, L.J.; Hostetler, J.; Nelson, W.C.; Heidelberg, J.F.; et al. Candidatus Chloracidobacterium Thermophilum: An Aerobic Phototrophic Acidobacterium. Science 2007, 317, 523–526. [Google Scholar] [CrossRef] [Green Version]
  59. Mehrani, M.-J.; Sobotka, D.; Kowal, P.; Ciesielski, S.; Makinia, J. The Occurrence and Role of Nitrospira in Nitrogen Removal Systems. Bioresour. Technol. 2020, 303, 122936. [Google Scholar] [CrossRef]
  60. Hu, H.-W.; He, J.-Z. Comammox-a Newly Discovered Nitrification Process in the Terrestrial Nitrogen Cycle. J. Soils Sediments 2017, 17, 2709–2717. [Google Scholar] [CrossRef]
  61. Palomo, A.; Pedersen, A.G.; Fowler, S.J.; Dechesne, A.; Sicheritz-Pontén, T.; Smets, B.F. Comparative Genomics Sheds Light on Niche Differentiation and the Evolutionary History of Comammox Nitrospira. ISME J. 2018, 12, 1779–1793. [Google Scholar] [CrossRef] [Green Version]
  62. Koch, H.; van Kessel, M.A.H.J.; Lucker, S. Complete Nitrification: Insights into the Ecophysiology of Comammox Nitrospira. Appl. Microbiol. Biotechnol. 2019, 103, 177–189. [Google Scholar] [CrossRef] [Green Version]
  63. Baranova, A.A.; Rogozhin, E.A.; Georgieva, M.L.; Bilanenko, E.N.; Kul’ko, A.B.; Yakushev, A.V.; Alferova, V.A.; Sadykova, V.S. Antimicrobial Peptides Produced by Alkaliphilic Fungi Emericellopsis Alkalina: Biosynthesis and Biological Activity Against Pathogenic Multidrug-Resistant Fungi. Appl. Biochem. Microbiol. 2019, 55, 145–151. [Google Scholar] [CrossRef]
  64. Goncalves, M.F.M.; Vicente, T.F.L.; Esteves, A.C.; Alves, A. Novel Halotolerant Species of Emericellopsis and Parasarocladium Associated with Macroalgae in an Estuarine Environment. Mycologia 2020, 112, 154–171. [Google Scholar] [CrossRef] [PubMed]
  65. Zaitseva, L.V.; Orleanskii, V.K.; Gerasimenko, L.M.; Ushatinskaya, G.T. The Role of Cyanobacteria in Crystallization of Magnesium Calcites. Paleontol. J. 2006, 40, 125–133. [Google Scholar] [CrossRef]
  66. de Oliveira, T.B.; de Lucas, R.C.; de Almeida Scarcella, A.S.; Contato, A.G.; Pasin, T.M.; Martinez, C.A.; Teixeira de Moraes Polizeli, M.d.L. Fungal Communities Differentially Respond to Warming and Drought in Tropical Grassland Soil. Mol. Ecol. 2020, 29, 1550–1559. [Google Scholar] [CrossRef] [PubMed]
  67. Selim, H.M.M.; Gomaa, N.M.; Essa, A.M.M. Application of Endophytic Bacteria for the Biocontrol of Rhizoctonia solani (Cantharellales: Ceratobasidiaceae) Damping-off Disease in Cotton Seedlings. Biocontrol Sci. Technol. 2017, 27, 81–95. [Google Scholar] [CrossRef]
  68. Qu, T.; Du, X.; Peng, Y.; Guo, W.; Zhao, C.; Losapio, G. Invasive Species Allelopathy Decreases Plant Growth and Soil Microbial Activity. PLoS ONE 2021, 16, e0246685. [Google Scholar] [CrossRef]
  69. Wang, Z.; Wang, Y.; Zheng, L.; Yang, X.; Liu, H.; Guo, J. Isolation and Characterization of an Antifungal Protein from Bacillus Licheniformis HS10. Biochem. Biophys. Res. Commun. 2014, 454, 48–52. [Google Scholar] [CrossRef]
  70. van Erven, G.; Kleijn, A.F.; Patyshakuliyeva, A.; Di Falco, M.; Tsang, A.; de Vries, R.P.; van Berkel, W.J.H.; Kabel, M.A. Evidence for Ligninolytic Activity of the Ascomycete Fungus Podospora Anserina. Biotechnol. Biofuels 2020, 13, 75. [Google Scholar] [CrossRef] [Green Version]
  71. Malagnac, F.; Lalucque, H.; Lepere, G.; Silar, P. Two NADPH Oxidase Isoforms Are Required for Sexual Reproduction and Ascospore Germination in the Filamentous Fungus Podospora Anserina. Fungal Genet. Biol. 2004, 41, 982–997. [Google Scholar] [CrossRef]
  72. Domeignoz-Horta, L.A.; Pold, G.; Liu, X.-J.A.; Frey, S.D.; Melillo, J.M.; DeAngelis, K.M. Microbial Diversity Drives Carbon Use Efficiency in a Model Soil. Nat. Commun. 2020, 11, 3684. [Google Scholar] [CrossRef] [PubMed]
  73. Zhao, X.; Zhao, C.; Stahr, K.; Kuzyakov, Y.; Wei, X. The Effect of Microorganisms on Soil Carbonate Recrystallization and Abiotic CO2 Uptake of Soil. Catena 2020, 192, 104592. [Google Scholar] [CrossRef]
  74. Luecker, S.; Wagner, M.; Maixner, F.; Pelletier, E.; Koch, H.; Vacherie, B.; Rattei, T.; Damste, J.S.S.; Spieck, E.; Le Paslier, D.; et al. A Nitrospira Metagenome Illuminates the Physiology and Evolution of Globally Important Nitrite-Oxidizing Bacteria. Proc. Natl. Acad. Sci. USA 2010, 107, 13479–13484. [Google Scholar] [CrossRef] [PubMed]
  75. Di, H.J.; Cameron, K.C.; Shen, J.P.; Winefield, C.S.; O’Callaghan, M.; Bowatte, S.; He, J.Z. Nitrification Driven by Bacteria and Not Archaea in Nitrogen-Rich Grassland Soils. Nat. Geosci. 2009, 2, 621–624. [Google Scholar] [CrossRef]
  76. Kemmitt, S.J.; Wright, D.; Goulding, K.W.T.; Jones, D.L. PH Regulation of Carbon and Nitrogen Dynamics in Two Agricultural Soils. Soil Biol. Biochem. 2006, 38, 898–911. [Google Scholar] [CrossRef]
  77. Zhang, Q.; Li, Y.; He, Y.; Brookes, P.C.; Xu, J. Elevated Temperature Increased Nitrification Activity by Stimulating AOB Growth and Activity in an Acidic Paddy Soil. Plant Soil 2019, 445, 71–83. [Google Scholar] [CrossRef]
Figure 1. Situ soil respiration and cumulative CO2 emissions of paddy fields. Note: Different lowercase letters in the same date indicate statistically significant differences between the KA and NKA (p < 0.05); KA, karst areas; NKA, non-karst areas.
Agronomy 13 02001 g001
Figure 2. The abundance of soil bacteria (a) and fungi (b) based on real-time PCR during rice growth in the KA and NKA. Note: Different lowercase letters in the same date indicate statistically significant differences between KA and NKA (p < 0.05); KA, karst areas; NKA, non-karst areas.
Agronomy 13 02001 g002
Figure 3. (a) The F/B during rice growth; (b) Correlation between soil respiration and the F/B. Note: Different lowercase letters in the same date indicate statistically significant differences between KA and NKA (p < 0.05); KA, karst areas; NKA, non-karst areas; F/B, ratio of fungi to bacteria.
Agronomy 13 02001 g003
Figure 4. Principal coordinates analysis (PCoA) ordination of fungal (a) and bacterial (b) community variation based on Bray-Curtis distances; The relative abundances of the soil fungal (c) and bacterial (d) community at Class level. Note: KA, karst areas; NKA, non-karst areas.
Agronomy 13 02001 g004
Figure 5. (a): Co-occurrence network analysis of dominant fungal and bacterial taxa; (b): Co-occurrence network and modules comprising dominant bacterial OTUs among KA and NKA soils; (c): Co-occurrence network and modules of dominant fungal OTUs among KA and NKA soils. Note: KA, karst areas; NKA, non-karst areas. Different colored nodes in [Figure 5a] represent different clades of bacteria and fungi, with the value on the node indicating the OTU number for the particular taxa, and node size representing the abundance of the taxa. Different colored nodes in [Figure 5b] represent the different phylum classifications for bacterial OTUs; and the value on the node represents the number of each bacterial OTU, while the size of the node indicates abundance. Different colored nodes [Figure 5c] represent different phylum classifications for fungal OTUs; and the value on the node represents the number of each OTU, while the size of the node indicates abundance. Green edges indicate positive correlations, while red edges indicate negative correlations.
Agronomy 13 02001 g005
Figure 6. The heatmap clustering and distribution of bacterial (a) and fungal (b) functional groups. Note: KA, karst areas; NKA, non-karst areas.
Agronomy 13 02001 g006
Table 1. Physicochemical properties of paddy soils in KAs and NKAs.
SitepH
(H2O)
SOC
/g·kg−1
DOC
/ug·L−1
TN
/g·kg−1
AN
/mg·kg−1
TP
/g·kg−1
AP
/mg·kg−1
C/N
/g·kg−1
CEC
/cmol·kg−1
Ca2+
/cmol·kg−1
Mg2+
/cmol·kg−1
Karst area7.40 ± 0.18 a25.15 ± 1.03 a261.62 ± 9.22 a1.74 ± 0.09 a90.21 ± 1.24 a1.24 ± 0.02 a22.04 ± 1.63 a12..46 ± 0.11 a13.79 ± 0.42 a3.89 ± 0.04 a1.20 ± 0.01 a
Non-karst area5.76 ± 0.15 b13.86 ± 1.61 b202.78 ± 20.46 b1.50 ± 0.04 b85.24 ± 0.09 b0.49 ± 0.01 b18.63 ± 0.57 b9.23 ± 0.47 b6.09 ± 0.17 b2.36 ± 0.01 b0.48 ± 0.03 b
Note: Different lowercase letters in the same column indicate statistically significant differences between KA and NKA (p < 0.05). Data represent means ± standard deviation. KA, karst areas; NKA, non-karst areas; SOC, soil organic carbon; DOC, dissolved organic carbon; TN, total nitrogen; TP, total phosphorus; AP, Available phosphorus; C/N, ratio of SOC to TN; CEC, Cation exchange capacity; Ca2+, exchangeable calcium; magnesium Mg2+, exchangeable magnesium.
Table 2. Correlation between soil respiration and bacterial and fungal functional.
Microbial TaxaGroupsRegionPercentageCorrelation Coefficient
BacteriaAcidobacteria Gp6KA7.05%−0.565 *
FungiStellatosporaNKA0.07%0.571 *
Functional groups of fungiPlant pathogenKA2.61%0.582 *
Endomycorrhizal-plant pathogen-undefined saprotrophNKA0.26%0.530 *
Dung saprotroph-endophyte-litter saprotroph-undefined saprotrophKA0.88%−0.568 *
Functional groups of bacteriaAerobic nitrite oxidizers (Nitrifiers)KA2.13%−0.545 *
Note: * Significant at the 0.05 level (two-tailed); KA, karst areas; NKA, non-karst areas.
Disclaimer/Publisher’s Note: The statements, opinions and data contained in all publications are solely those of the individual author(s) and contributor(s) and not of MDPI and/or the editor(s). MDPI and/or the editor(s) disclaim responsibility for any injury to people or property resulting from any ideas, methods, instructions or products referred to in the content.