Article

Influence of Different Nitrogen, Phosphorus, and Potassium Fertilizer Ratios on the Agronomic and Quality Traits of Foxtail Millet

1
College of Agriculture, Shanxi Agricultural University, Jinzhong 030801, China
2
Hou Ji Laboratory in Shanxi Province, Shanxi Agricultural University, Taiyuan 030031, China
3
State Key Laboratory of Sustainable Dryland Agriculture, Shanxi Agricultural University, Taiyuan 030031, China
*
Authors to whom correspondence should be addressed.
Agronomy 2023, 13(8), 2005; https://doi.org/10.3390/agronomy13082005
Submission received: 2 July 2023 / Revised: 21 July 2023 / Accepted: 25 July 2023 / Published: 28 July 2023
(This article belongs to the Section Soil and Plant Nutrition)

Abstract

:
Foxtail millet is highly valued in China; however, its optimal fertilization parameters are unknown. This study investigated the effects of nitrogen (N), phosphorus (P), and potassium (K) fertilizer combinations on foxtail millet agronomic traits, photosynthetic characteristics, yield, and quality to promote rational fertilizer application. Pot experiments were conducted using the “3414” fertilizer effect scheme and the representative crop variety was JG21, containing four NPK levels and 20 replicates per treatment, individually. The effects of N, P, and K levels on agronomic traits were analyzed during the jointing, heading, and filling stages. JG21 performed optimally under treatment with N160P90K150 (T6); the yield and fat content increased by 49.32% and 13% compared to the control. Correlation analysis revealed that N was significantly positively (negatively) correlated with the protein (amylose) content. P was significantly positively correlated with the fat and moisture content and K was correlated with the moisture, fat, and protein content, but was negatively with the amylose content. Overall, rational ratios of NPK fertilization improved foxtail millet yield and quality. Based on fuzzy comprehensive evaluation, the T6 treatment (N160P90K150) demonstrated the highest comprehensive effect among 13 NPK fertilizer combinations. Rational application of NPK in foxtail millet may improve agronomic performance by enhancing leaf photosynthetic efficiency and aboveground biomass accumulation.

1. Introduction

Nitrogen (N), phosphorus (P), and potassium (K) are fundamental nutrients for plant growth and development [1]. An insufficient N supply has adverse effects on plant height, leaf size, chlorophyll content, photosynthesis, and protein and nucleic acid synthesis [2,3,4]. Conversely, excessive N fertilizer leads to undesirable vegetative growth, impedes reproductive growth, causes nutrient accumulation, reduces yield and quality, and interferes with the absorption of other nutrients, such as K and P [5,6,7]. An inadequate P supply causes poor root development, delayed maturity, reduced yield and quality, and poor absorption of other nutrients, such as iron and zinc [8,9,10,11]. An insufficient P supply not only retards plant growth but also impedes the absorption of other nutrients by plants [12,13]. Conversely, excessive P leads to inadequate uptake of trace elements, such as zinc and sulfur, resulting in nutritional imbalances and decreased crop quality [11,14,15]. Maintaining an appropriate P supply is essential for optimal plant growth, development, and yield, and for avoiding negative impacts on nutrient absorption and crop quality. K is a crucial activator of several plant enzymes that stimulate carbohydrate metabolism and regulate sugar, cellulose, and fat synthesis. Inadequate or excessive K fertilizer application affects nutrient absorption, leading to suboptimal plant growth and reduced yields [16,17,18]. An adequate K supply promotes plant growth, enhances stress resistance, and improves crop quality [19,20,21]. However, insufficient K negatively affects plant growth, yield, and quality, and increases the susceptibility of plants to pests and diseases [20,22,23].
Rational integrated NPK fertilization practices not only enhance the crop yield and quality, such as oil content, soluble protein, vitamin C, and soluble sugar [24,25], but also increase fertilizer utilization efficiency, leading to optimal economic benefits [26,27]. Thus, it is crucial to maintain a balanced supply of these essential nutrients to achieve optimal plant growth, development, and yield while minimizing the negative effects of excess or inadequate supply [28,29].
Foxtail millet (Setaria italica L.), a member of the Poaceae family, is one of the world’s oldest domesticated crops [30]. It has gained significant attention in recent years because of its unique drought-resistant characteristics, adaptability, and high water-utilization efficiency; hence, it is the primary crop promoted for green development in Northern China’s arid land ecological agriculture [31,32,33,34]. As a traditional coarse grain in China, foxtail millet is highly valued for its nutritional content, which includes abundant micronutrients including calcium, iron, and zinc, as well as its pleasing taste and texture [35,36,37]. Despite its long history of cultivation and consumption, much remains to be learned about the optimal cultivation practices for foxtail millet, particularly regarding fertilization. In current agricultural production, unreasonable fertilization practices, combinations, and levels have been found to have detrimental effects on the growth, yield, and quality of foxtail millet, and cause fertilizer waste, lower utilization efficiency, soil mineral nutrient imbalances, and environmental pollution [38,39]. Therefore, it is imperative to develop and implement rational fertilization methods that promote sustainable and efficient agricultural production. Optimized fertilizer recommendations have been proposed for wheat [40], rice [39], and maize [24], based on the agronomic efficiency and yield response. Foxtail millet is recognized as having a high water and fertilizer utilization efficiency and robust stress resistance; moreover, it is an essential component of green development in ecological agriculture in the arid and semi-arid regions of Northern China [41]. However, despite its potential, there was not much improvement in the yields and quality of foxtail millet owing to production issues and natural conditions in these areas.
Several studies have reported the positive effects of integrated fertilization on foxtail millet, emphasizing the importance of achieving a balanced supply of N, P, and K to boost crop productivity and improve the quality of the harvested produce [27,33,40,42]. However, although fertilizers have the potential to significantly increase grain yield, their indiscriminate use can lead to increased production costs and environmental pollution, which are detrimental to the sustainable development of agriculture in these areas. Thus, it is crucial to identify and implement optimal fertilization management practices that effectively promote the growth and yield of foxtail millet, while minimizing environmental pollution and maintaining soil fertility.
This study aimed to investigate the effects of integrated N, P, and K fertilization on the growth and quality of foxtail millet by using the “3414” fertilizer effect scheme in pot experiments. Furthermore, this study aimed to identify optimal fertilization applications to achieve high-quality yields. The specific objectives included determination of the efficiency of NPK fertilizers by quantifying the traits, grain yield, and grain quality of foxtail millet, and photosynthetic traits were further analyzed in order to reveal the mechanism of fertilizer effects. The foxtail millet variety Jingu21 (JG21) was selected as the study material based on the previous evaluation of six foxtail millet varieties under 14 treatments, and the best fertilization scheme was selected based on the membership function analysis. Our findings intend to provide a theoretical foundation for rational fertilization practices of foxtail millet production. In the future, the results of this study can be used as the basis for improving fertilizer utilization and promoting sustainable agricultural practices.

2. Materials and Methods

2.1. Experimental Site and Materials

The experiment was conducted in 2021 at the experimental base (latitude: 37°25′ N, longitude: 112°35′ E) of the molecular breeding team for coarse cereals at Shanxi Agricultural University, with buckwheat as the previous crop. The texture of soil used in the experiment was sandy loam, and the organic matter content of the 0–30 cm soil layer was 13.83 g/kg, with available N at 59.67 mg/kg, available P at 14.44 mg/kg, available K at 88.64 mg/kg, and a pH of 8.18. The proportion of soil particles with a diameter less than 0.002 mm was 0.82% of the total soil particles, particles with a diameter ranging from 0.002 to 0.02 mm accounted for 7.93%, and those ranging from 0.02 to 2 mm accounted for 91.22%.
JG21 was tested in the experiment, which is the recommended foxtail millet variety in Shanxi Province and was provided by the molecular breeding team for coarse cereals at Shanxi Agricultural University. The N fertilizer used in the experiment was composed of urea (containing 46.0% pure N), the P fertilizer was composed of calcium superphosphate (containing 12.0% P2O5), and the K fertilizer was composed of potassium sulfate (containing 52.0% K2O).
The experiment employed the “3414” fertilizer effect scheme, involving four levels for each of the three elements N, P, and K, totaling 14 treatments (Table 1) [27,43]. Pot and integrated NPK fertilization experiments were conducted on JG21 to investigate the individual influences of N, P, and K fertilizers on the agronomic traits, photosynthetic characteristics, physiological characteristics, and grain quality.

2.2. Experimental Design

The field experiment was conducted using a pot culture method to simulate field conditions and improve control of the fertilizer conditions. The “3414” fertilizer effect field trial scheme was adopted, with each pot (diameter D = 25 cm, height H = 25 cm) containing 10 kg of sieved air-dried soil. The N, P, and K fertilizers were applied as basal fertilizers at the beginning of the experiment, whereas the control (T1) had no fertilizer. To analyze the single-factor effects of N, P, and K, the other two factors were fixed (Table 1). Fully plump seeds were selected and sown on May 19th, with 20 replicates for each treatment, three holes per pot, and ten seeds per hole. Seedlings were thinned to three plants per pot at the two-leaf stage and normal weeding and watering were carried out during the growth period.

2.3. Measurement of Foxtail Millet Characteristics

2.3.1. Agronomic Trait Measurements

Five plants with consistent growth were selected at the jointing, heading, and filling stages to measure plant height, leaf area, and stem diameter. The average values were obtained for each trait.

2.3.2. Measurement of Soil Plant Analysis Development (SPAD) Values

Five plants with consistent growth were selected at the jointing, heading, and filling stages. The relative chlorophyll content was measured using a SPAD-502 chlorophyll meter (Knoica Minolta Holdings, Inc., Tokyo, Japan) on the middle part of the second fully expanded leaf from the top of the plant, and the average values were recorded for each measurement.

2.3.3. Measurement of Photosynthetic Parameters

Five plants with consistent growth were selected at the jointing, heading, and filling stages. From 9:00–11:30 a.m. on sunny and windless days, a CI-340 handheld photosynthesis measurement system (LI-6400, LI-COR Biosciences, Lincoln, NE, USA) was used to measure the net photosynthetic rate (Pn), transpiration rate (E), stomatal conductance (C), and intercellular CO2 concentration (IntCO2) of the second fully expanded leaf from the top of each plant. Average values were obtained for each parameter.

2.3.4. Measurement of Foxtail Millet Yield and Related Traits

During the foxtail millet maturity period, five plants with consistent growth were selected to measure the panicle length, panicle diameter, single panicle weight, single grain weight, and thousand grain weight. Based on the number of foxtail millet plants per pot (three plants) and the area occupied by each pot, the average production per pot (PPP, g/pot) and the hectare yield was calculated and predicted.

2.3.5. Measurement of Foxtail Millet Grain Quality Traits

Foxtail millet husks were removed using a dehulling machine, and full and uniformly sized grains were selected using a color sorter. Five grams of the grains were weighed, ground into a powder using a high-speed tissue grinding instrument, and passed through a 100-mesh sieve. Water, protein, fat, and amylose contents were measured using an NIRSTMDS 2500 tabletop near-infrared quality analyzer produced in Denmark (Foss Co, Slangerupgade, Denmark).

2.4. Recommended Fertilizer Application Quantity Calculation and Statistical Analysis

The experimental data were organized using Microsoft Excel 2010 (Microsoft, Redmond, WA, USA). Variance analysis, multiple comparisons, and membership function calculations were performed using SPSS 22.0 (IBM, Armonk, NY, USA) and GraphPad Prism 9.0 (GraphPad, San Diego, CA, USA).
During the process of data analysis, we used the following formula for calculating the standard error (SE) (Equation (1)):
S E = σ n ,
where σ represents the standard deviation of the sample population and n represents the sample size.
The formula used for Turkey’s test is shown in Equation (2):
H S D = q α ( k , v ) S C 2 n ,
where k is the number of sample groups being compared, v represents the degrees of freedom for the pooled variance, n is the sample size for each sample, and q refers to the range distribution, as shown by Equation (3):
q = x m a x x m i n S C 2 n ,
where the numerators represent the means of the maximum and minimum samples, respectively.
One-way analysis of variance (ANOVA) was used as shown in the following formula (Equation (4)):
F = S S A / d f 1 S S E / d f 2 ,
where SSA (sum of square for factor A) represents the sum of squares for the between-group variation, SSE (sum of square for error) represents the sum of squares for the within-group random error, and df represents the degrees of freedom.

Recommended Fertilizer Calculation

To calculate the recommended fertilizer amount, the foxtail millet yield was set as the dependent variable, and the amounts of N, P, and K fertilizer were set as independent variables. A univariate quadratic fertilizer response function and a ternary quadratic fertilizer response function were used to fit the data and predict the optimal amounts of N, P, and K fertilizer for maximum foxtail millet yield.
A comprehensive evaluation of 14 combinations of N, P, and K fertilizers was conducted using the fuzzy membership function method [44]. The comprehensive ability coefficient for each individual trait was calculated as the measured value of the treatment group (with different combinations of N, P, and K fertilizers) at the filling stage divided by the measured value of the control group. This ratio represents the strength of the comprehensive ability (SCA) (Equation (5)).
SCA = XTi/XT1,
      with: i = 2, 3, …, 14,
Membership function calculation was carried out using the following formula:
µ(Xi) = (XiXmin)/(XmaxXmin),
  with: i = 1, 2, 3, …, n,
where µ(Xi) represents the membership function value of the comprehensive indicator of agronomic traits and grain quality for the ith JG21 under different combinations of N, P, and K fertilizers; Xi is the comprehensive indicator value for the ith JG21 under different combinations of N, P, and K fertilizers; Xmax is the maximum value of the comprehensive indicator of agronomic traits and grain quality for the ith JG21 under different combinations of N, P, and K fertilizers; and Xmin is the minimum value of the comprehensive indicator of agronomic traits and grain quality for the ith JG21 under different combinations of N, P, and K fertilizers.
The weights of the comprehensive indicators were calculated using Equation (7):
Wi = Pimi = 1 Pi,
     with i = 1, 2, 3, …, n
where Wi represents the importance and weight of the ith comprehensive indicator among all comprehensive indicators, determined based on a specific weighting method; and Pi represents the contribution rate of the ith comprehensive indicator for each variety.
The evaluation value was calculated using Equation (8):
D = Ʃ mi = 1 [µ(Xi) × (Wj)],
    with i = 1, 2, 3, …, n
where D represents the evaluation value of the comprehensive ability of each variety after undergoing different combinations of N, P, and K fertilizer treatments.

3. Results

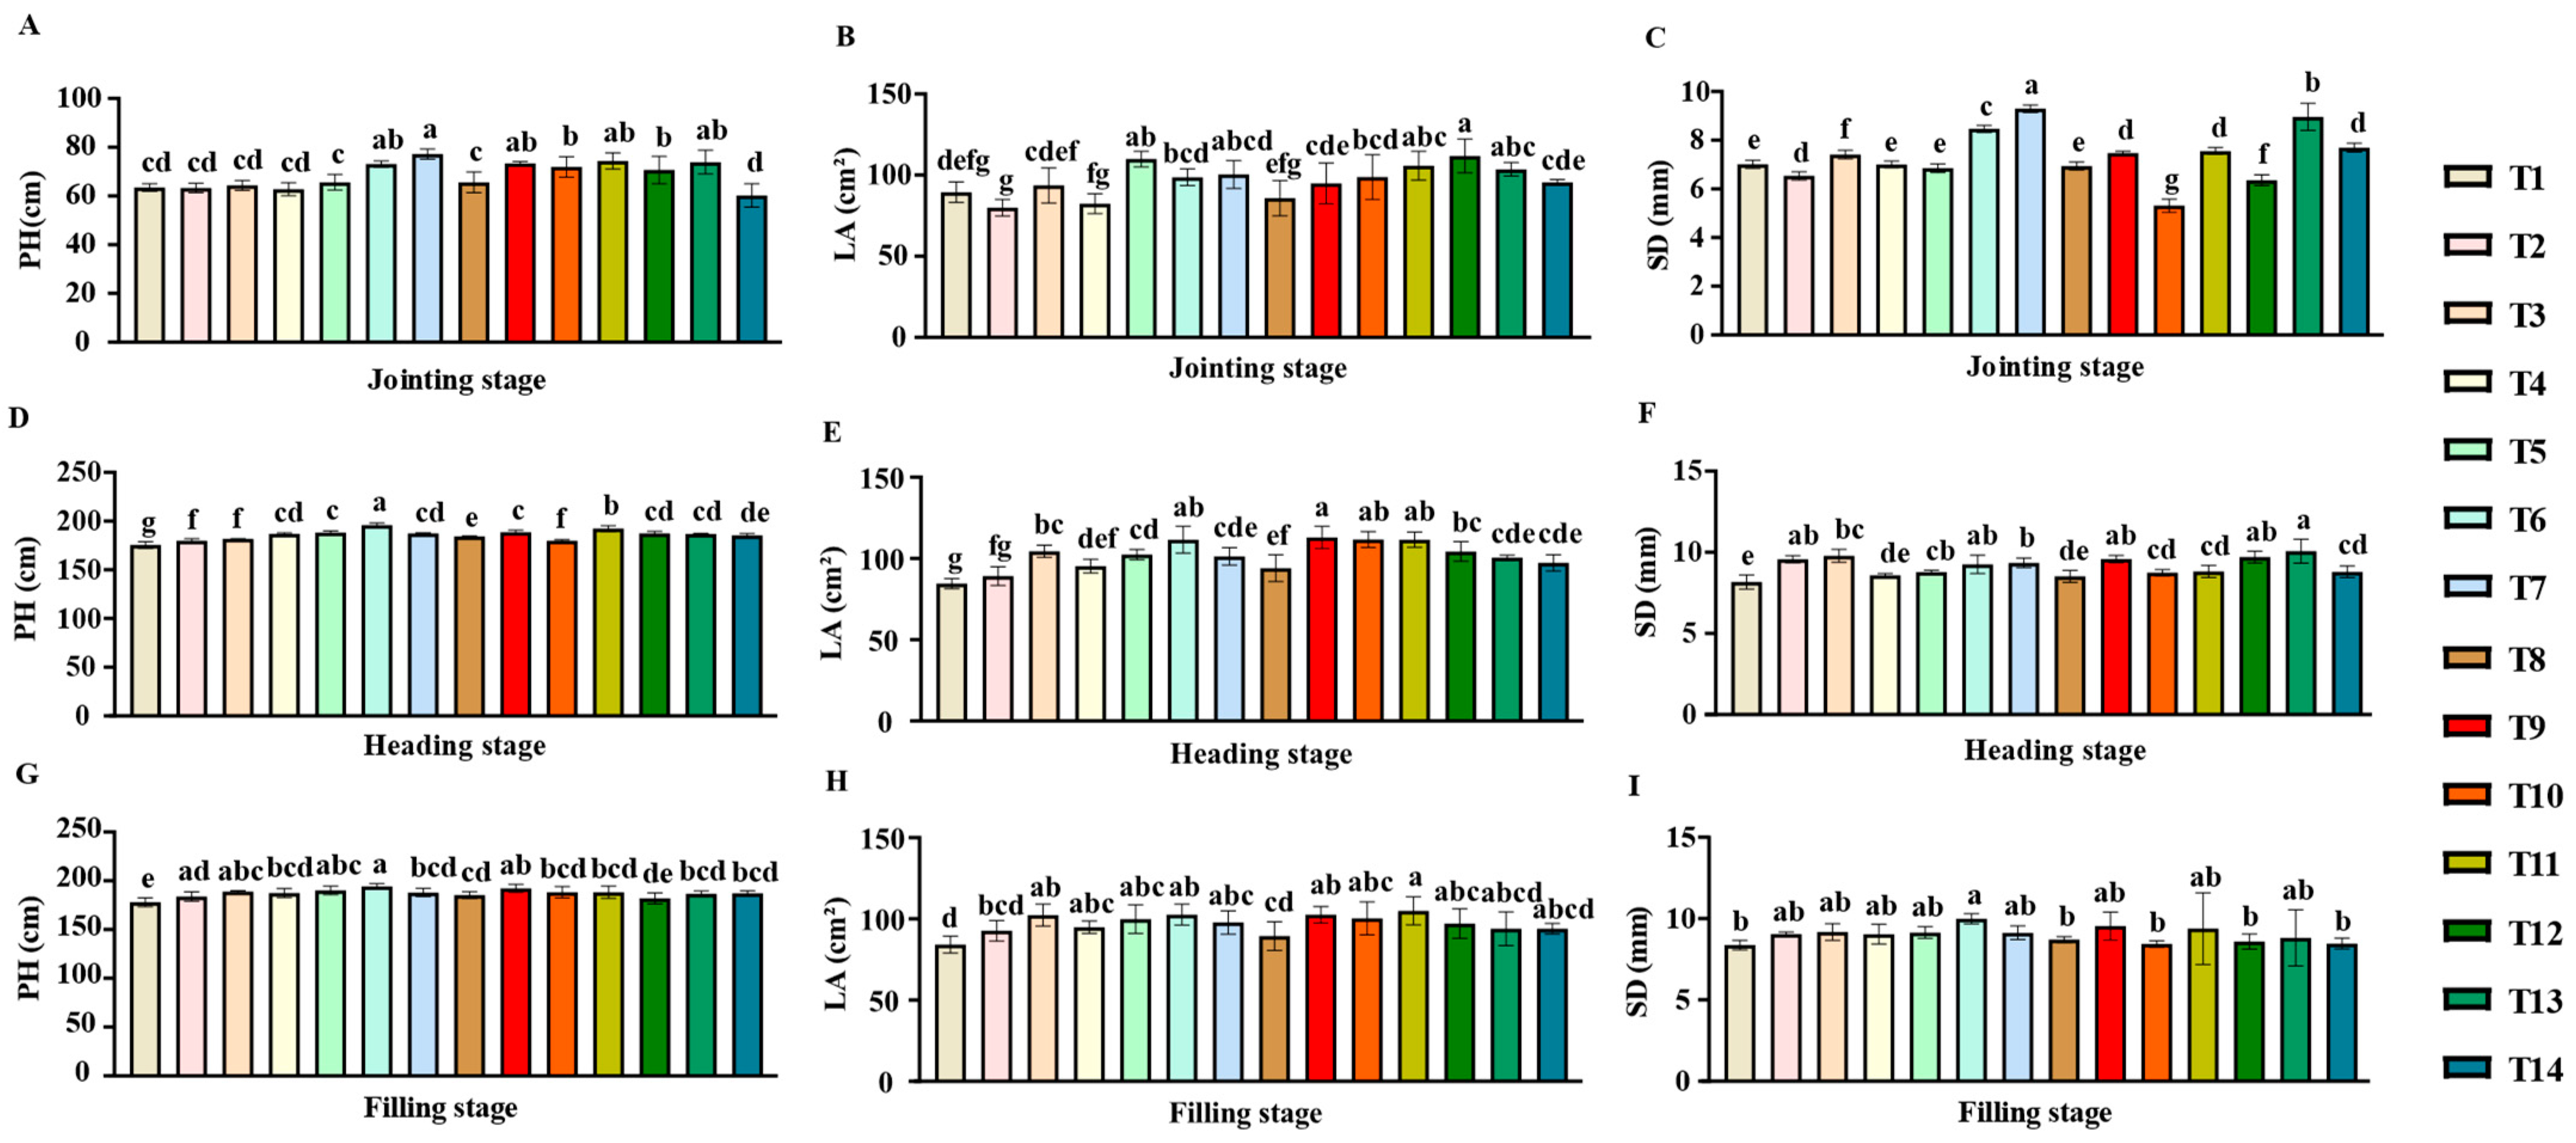
3.1. Effects of N, P, and K Fertilizers on Agronomics of JG21

Significant differences were observed in plant height, leaf area, and stem diameter of JG21 under different fertilizer treatments at the same growth stages (Figure 1). Significant differences were observed in plant height at the jointing, heading, and filling stages (F = 13.07, 42.88, and 4.45, respectively). The T6 and T7 treatments caused increased growth at the jointing stage, whereas at the heading stage, the plant height increased under T6 and T11 treatments was 20.41 cm and 16.92 cm higher than that under T1 treatments, respectively. In the filling stage, the plant heights of JG21 under T6, T9, and T11 treatments increased by 16.28, 14.27, and 10.28 cm, respectively, compared with that under the control treatment (p < 0.05) (Figure 1).
Significant differences were observed in the leaf area of JG21 under the different treatments. At the jointing stage, the T5 and T12 treatments resulted in the largest leaf area, which increased significantly by 16.35 cm2 and 22.37 cm2, respectively, compared with that under the T1 treatment (p < 0.05). At the heading and filling stages, the leaf development of JG21 improved under the T6, T9, T10, and T11 treatments, and the leaf area increased by 18.48–27.02, 18.4–28.38, 16.2–27.06, and 20.77–27.02 cm2 compared with that under T1 treatment (p < 0.05).
Stem diameter differed significantly among plants under different treatments at the jointing and heading stages (F = 110.41 ** and F = 11.24 **, respectively), but not at the filling stage (F = 1.46). At the jointing stage, plants subjected to the T6, T7, and T13 treatments had the largest stem diameters (8.47, 9.29, and 8.96 cm, respectively). At the heading and filling stages, the best performance was observed under the T6, T7, T9, and T11 treatments, with an increase in stem diameter of 1.61–1.62, 0.76–1.18, 1.16–1.41, and 0.65–1.01 cm, respectively, compared with that under T1 treatment (Figure 1).
Overall, the results indicated that fertilization significantly improved the plant height, leaf area, and stem diameter of JG21, and based on a comprehensive analysis of the data, the T6, T9, and T11 treatments were the most favorable for growth and development.

3.2. Effects of N, P, and K Fertilizers on JG21 Photosynthetic Characteristics

The analysis of the photosynthetic characteristics of foxtail millet under different fertilization treatments revealed that, compared with the T1 treatment, all fertilization treatments increased the relative chlorophyll content in the second-to-last leaf. The differences in relative chlorophyll content of JG21 under the different treatments decreased gradually with the progression of the growth stages, showing a rapid increase from the jointing to the heading stage and then stabilizing during the filling stage. This trend was consistent with the growth dynamics of plant height and stem diameter in JG21. Throughout the growth period, JG21 plants under the T6 and T11 treatments had the best performance in terms of the relative chlorophyll content of the second-to-last leaf, increasing by 7.97–14.73% and 3.36–19.22%, respectively, compared with that under the CK treatment (p < 0.05). The differences were most significant at the jointing stage (F = 5.69 **), and the differences between the treatments decreased as growth progressed.
The study of photosynthetic parameters showed that the net Pn, E, and C of JG21’s second-to-last leaf increased to varying degrees after fertilization treatments compared with that after the T1 treatment, whereas IntCO2 decreased. These trends were most significant at the heading stage, and the changes in Pn were the most significant. Overall, the T6 treatment exhibited the best performance in JG21 in terms of all parameters, with JG21 second-to-last leaves showing an increase of 6.94–36.56%, 15.44–29.88%, and 20.19–33.22% in Pn, E, and C, respectively, and a decrease of 41.34–64.67% in IntCO2, compared with those under the T1 treatment (p < 0.05) (Table 2).
These results indicate that reasonable fertilization effectively promoted photosynthesis in foxtail millet. Meanwhile, an increase in E and C accelerated the absorption, transport, and metabolism of water, inorganic salts, and other nutrients, which is beneficial for the production of photosynthetic products and their transport and accumulation in the panicles.

3.3. Effects of N, P, and K Fertilizers on the Traits Related to Yield

Significant differences were observed in foxtail millet yield and related traits under the different treatments. Compared with the control treatment (T1), the fertilization treatments increased the panicle length, panicle diameter, single panicle weight, single grain weight, thousand grain weight, and yield by 3.41%, 9.20%, 16.99%, 18.97%, 7.46%, and 27.52%, respectively. The longest panicle length (27.37 cm) was observed under the T6 treatment, whereas the maximum values for panicle diameter (33.32 mm), single panicle weight (36.22 g), single grain weight (30.1 g), and yield (90.29 g/pot) were obtained under the T11 treatment. The highest thousand grain weight (3.42 g) was observed under the T14 treatment, with increases of 16.88%, 23.22%, 40.93%, 46.12%, 53.02%, and 15.93% compared with that under the T1 treatment (Table 3).
The average production per pot under N deficiency (T2), P deficiency (T4), and K deficiency (T8) treatments was 70.76 g/pot, which was 14.49% higher than that under the unfertilized treatment. The average production per pot under the other fertilization treatments was 74.36 g/pot, which was 20.3% higher than that under the unfertilized treatment. This indicates that nutrient deficiency affects the yield of foxtail millet, and reasonable fertilization practices are beneficial for increasing its yield. When the fertilizer amounts of any two nutrients were fixed, the yield of JG21 continued to increase with increasing N application rates (T2, T3, T6, and T11), but the rate of increase decreased as the concentration level increased. Under a gradient of P concentration levels (T4, T5, T6, and T7) and K concentrations (T8, T9, T6, and T10), the yield initially increased and then decreased. This indicates that in actual production, a reasonable combination of N, P, and K within a certain concentration range may effectively increase the yield of foxtail millet, whereas ratios that are too low or too high may have negative effects on yield (Table 3).

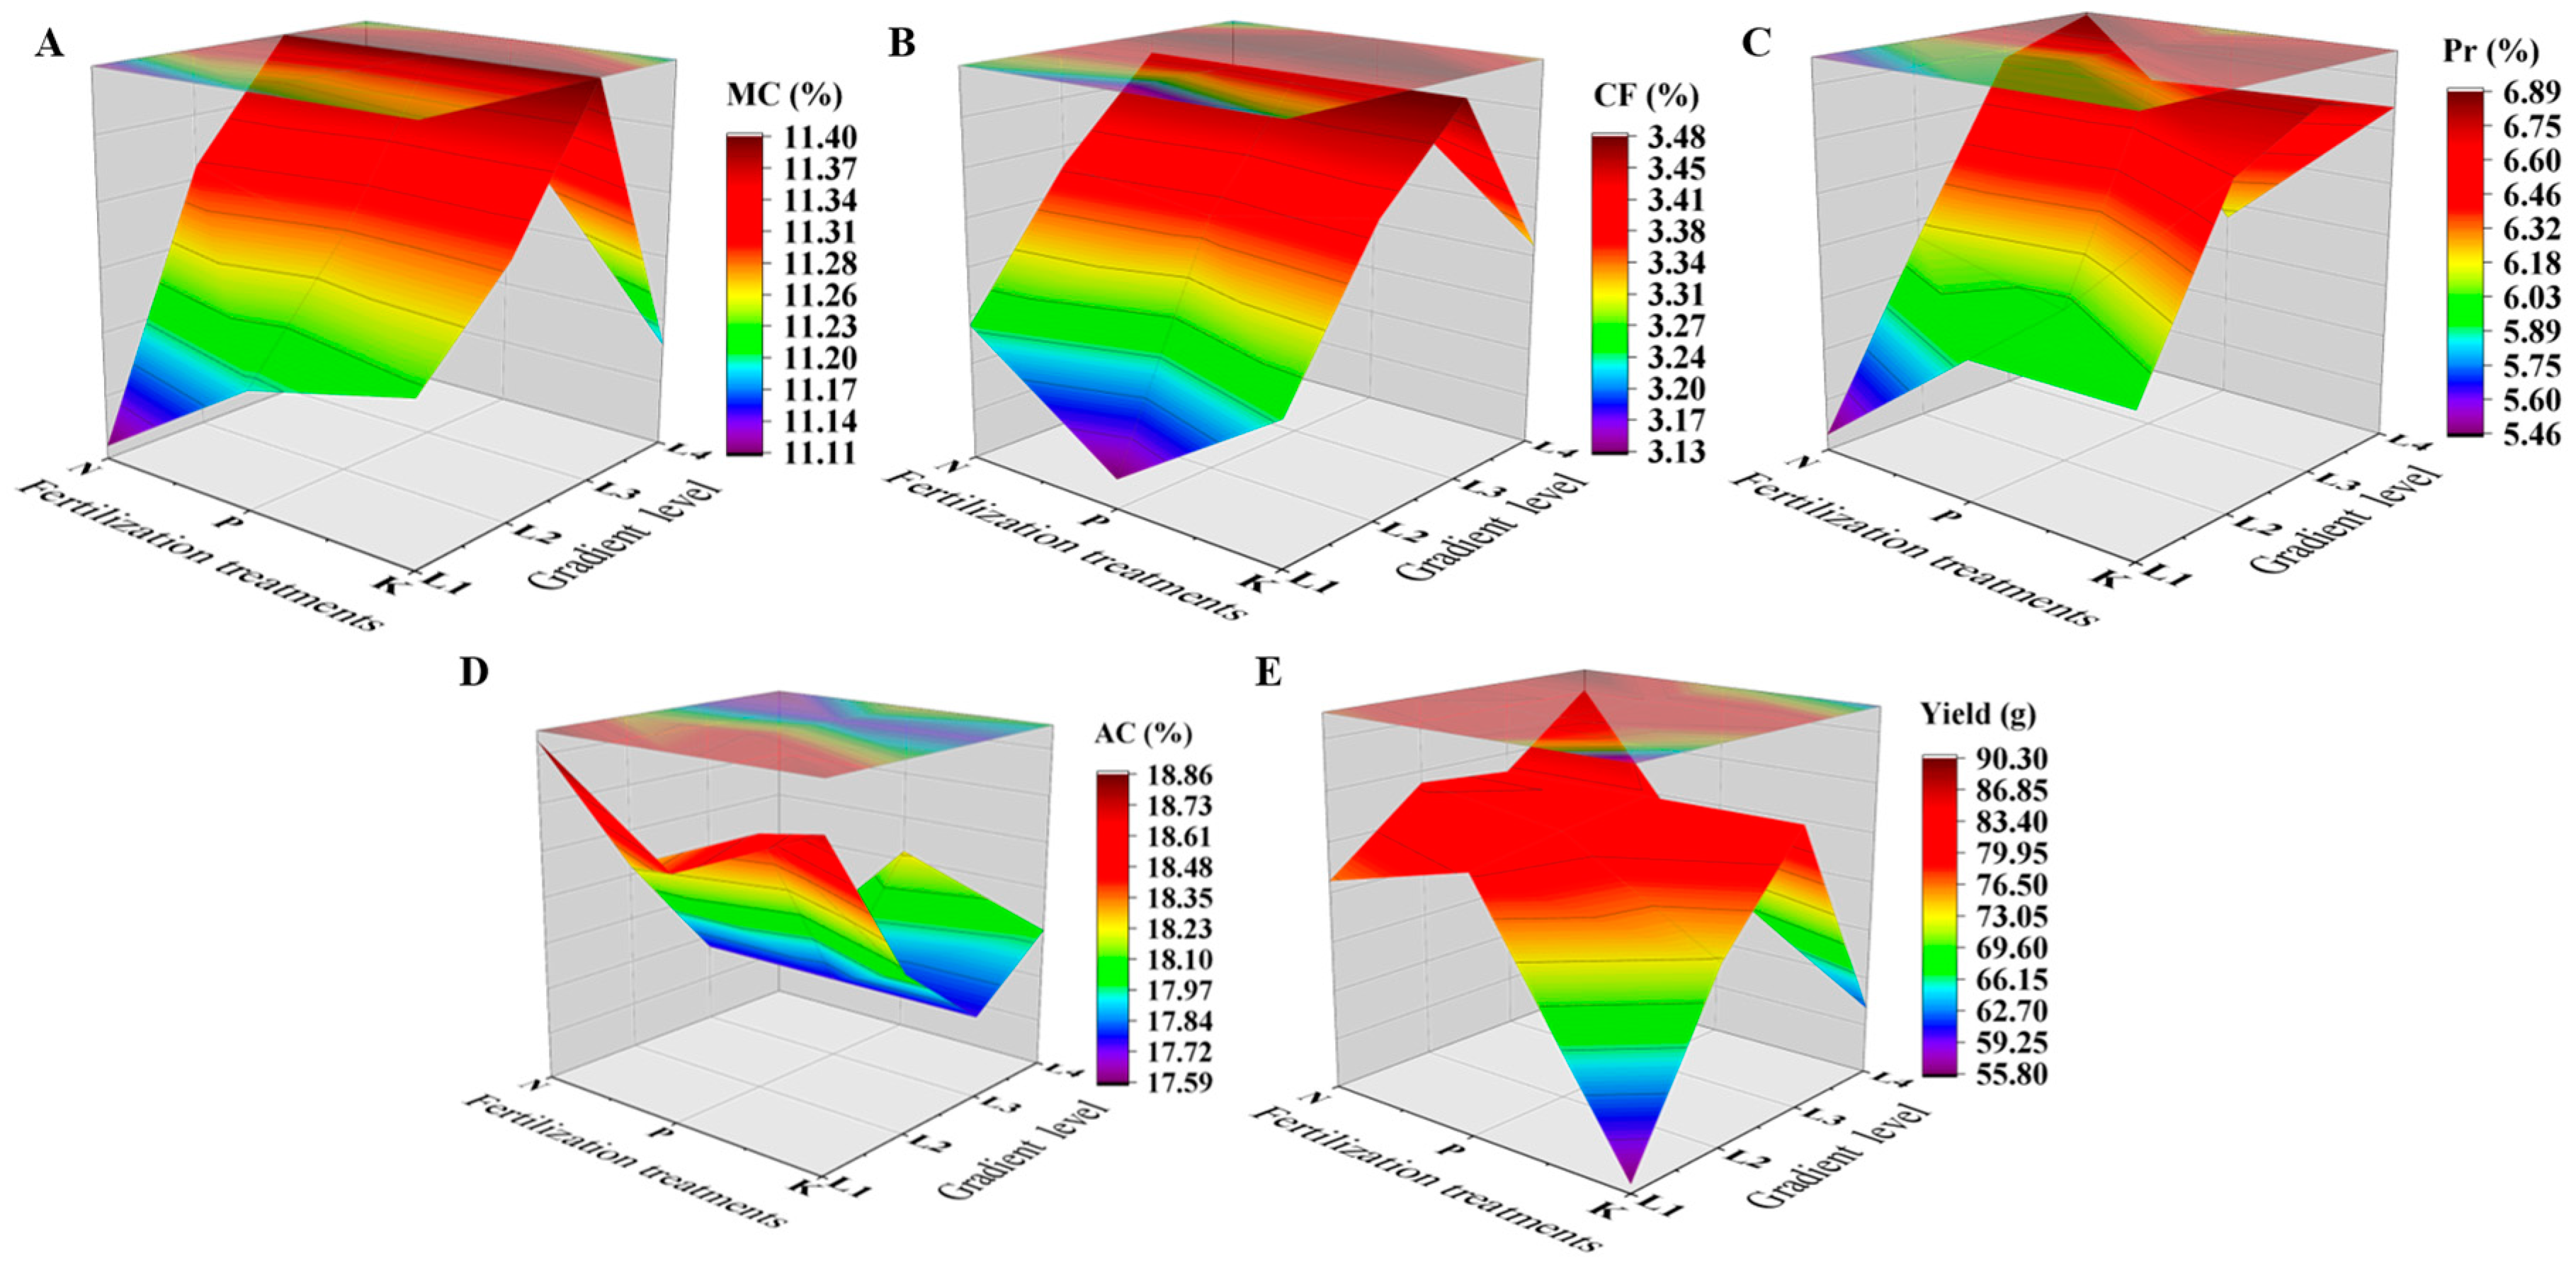
3.4. Effects of N, P, and K Fertilizers on JG21 Quality Characteristics

The measurements of moisture, fat, protein, and amylose content in JG21 grains showed significant differences under the different treatments (Table 4). Compared with those under the T1 treatment, the fertilization treatments increased the moisture content by an average of 2.64%, fat content by an average of 7.57%, and protein content by an average of 21.84%, while decreasing the amylose content by an average of 3.47%. Protein content continued to increase with increasing N fertilizer application (T2, T3, T6, and T11), reflecting the importance of fertilizers, especially N fertilizers, in protein accumulation (Table 4).
The content of moisture, fat, protein, and amylose, and the yield show significant differences among different treatments (Figure 2). Among them, the moisture, fat, and protein content generally exhibit a trend of increasing initially and then decreasing under different levels of NPK treatments. Notably, the grain moisture content significantly decreased at the K4 level (Figure 2A), whereas the protein content of grain showed a significant increase at the N4 level (Figure 2C). In contrast, the amylose content displayed an opposite trend to the other three quality indicators (Figure 2D). The yield of JG21 showed an increase with increased N levels under the same P and K levels (Figure 2E).
Correlation analysis between different agronomy traits, yield, and quality traits revealed that plant height was significantly positively correlated with leaf area (r = 0.79 *), stem diameter (r = 0.77 **), net photosynthetic rate (r = 0.67 **), and yield (r = 0.60 **). Otherwise, it was significantly negative correlated with intercellular CO2 concentration (r = −0.70 **). Leaf area significantly positively correlated with stem diameter (r = 0.67 **) and yield (r = 0.73 **), and significantly negatively correlated with intercellular CO2 concentration (r = −0.89 **). Stem diameter was significantly positively correlated with the relative chlorophyll content (r = 0.60 *), net photosynthetic rate (r = 0.57 **), and yield (r = 0.67 **), while it was significantly negatively correlated with the intercellular CO2 concentration (r = −0.63 *). The relative chlorophyll content was significantly positively correlated with yield (r = 0.63 *), and significantly negatively correlated with the intercellular CO2 concentration (r = −0.65 *). The net photosynthetic rate was significantly positively correlated with the transpiration rate (r = 0.61 *) and stomatal conductance (r = 0.64 *). The transpiration rate was significantly positively correlated with stomatal conductance (r = 0.76 **). The intercellular CO2 concentration was significantly negatively correlated with yield (r = −0.69 **) (Figure 3).

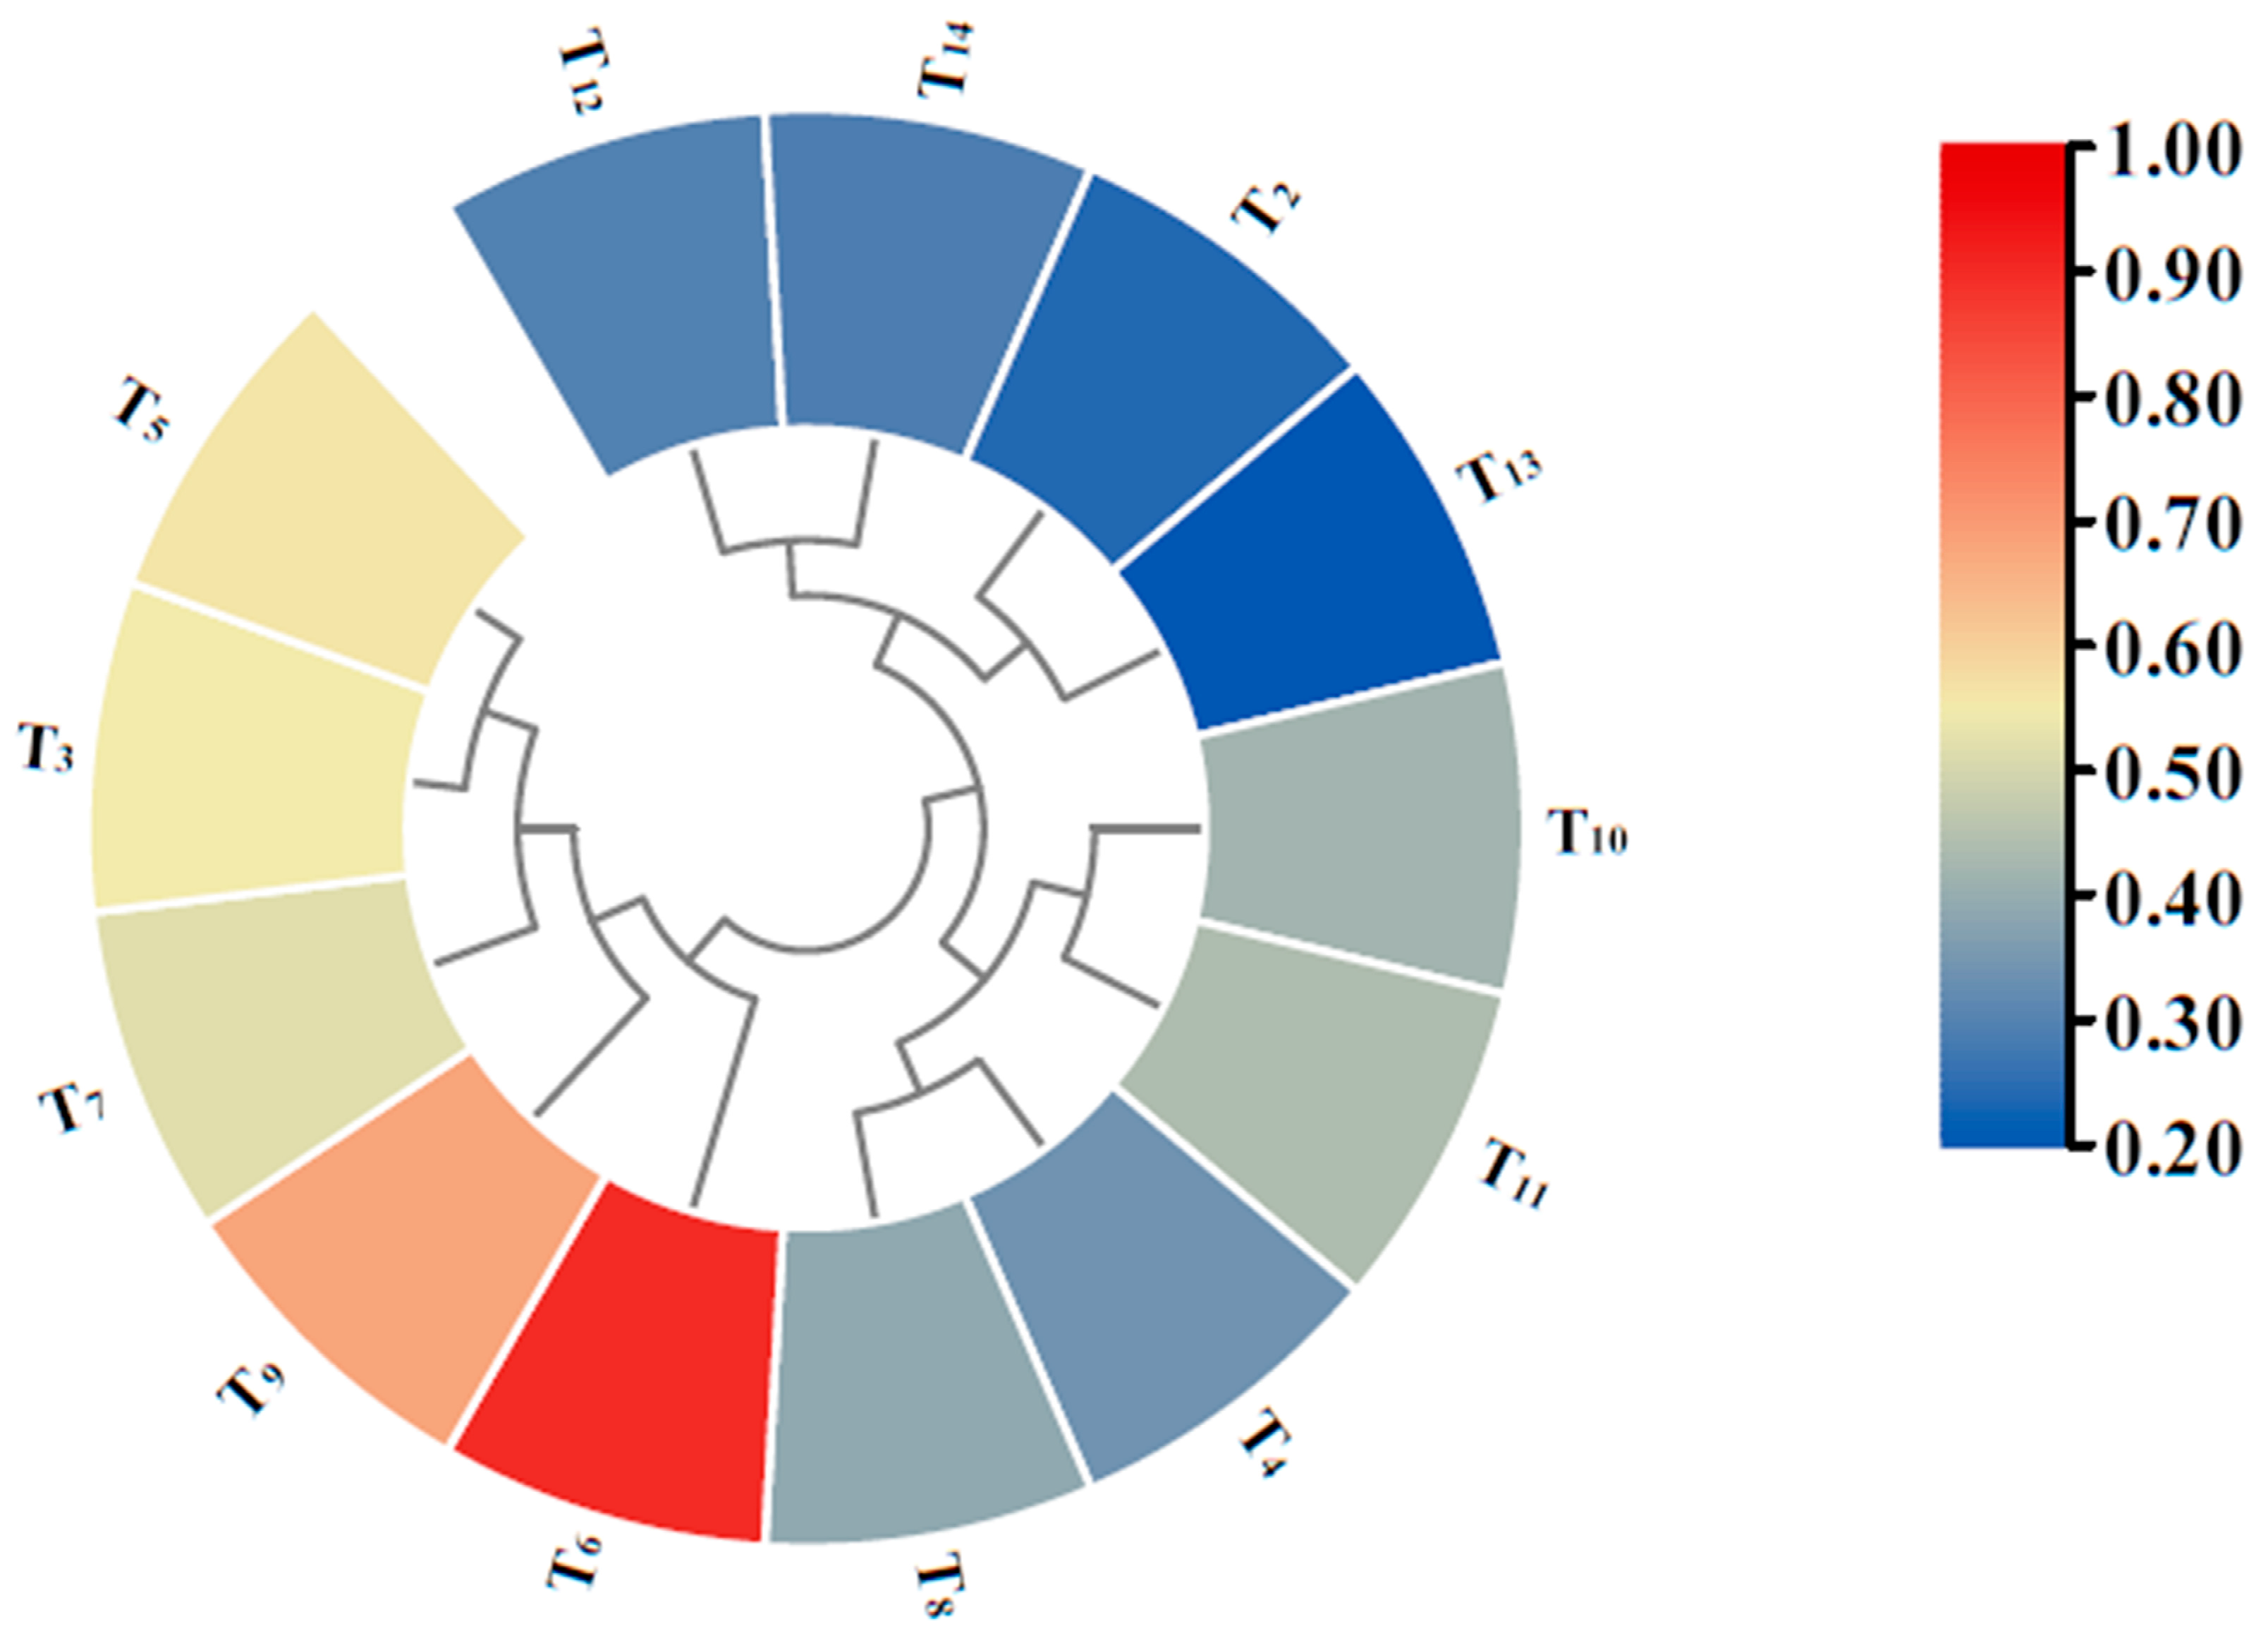
3.5. Principal Component Analysis (PCA) and Membership Function Analysis of Related JG21 Traits under Coordinated Fertilization

To determine the optimal fertilizer treatment, we conducted a PCA based on the relative changes in various traits during the grain-filling period and yield quality-related traits. The results showed that the first principal component had the highest contribution rate and was characterized by five single-item indicators: panicle length, panicle thickness, single panicle weight, single grain weight, and yield, with a feature value of 8.63. This component reflects changes in both yield and panicle traits, explaining up to 47.94% of the original indicator information. The second principal component had relatively high loadings for net Pn, E, and C, which reflected changes in photosynthetic characteristics and explained 21.63% of the original indicator variance. The third principal component had relatively high loadings for water, fat, and linear starch content, with a feature value of 1.91, accounting for 10.58% of the total variance. The fourth principal component had relatively high loadings for IntCO2 concentrations, accounting for 6.20% of the total variance. These four principal components cumulatively explained over 86% of the original data, representing most of the information contained in the original indicators (Table 5, Supplementary Tables S1 and S2).
Based on the PCA, we calculated the membership function values µ(Xj) for the corresponding composite indicators. From Table 6, it can be seen that among the fertilization treatments, the T13 treatment had the smallest membership function value (µ(X)) in composite indicator Z1, indicating its weakest effect on the various traits of JG21 in Z1; the T6 treatment had the largest µ(X) value in Z1, indicating its strongest effect on the increase in the composite indicator Z1. The treatments with the highest µ(i) values in the composite indicators Z2 and Z3 were T8 and T6, respectively, whereas those with the lowest µ(X) values were T3 and T11, indicating that the results of the three composite indicators were different. Therefore, to comprehensively analyze and evaluate the changes in various foxtail millet traits after fertilization, we calculated comprehensive evaluation D values for the four composite indicators (Table 7). The analysis showed that the D values of each indicator were ranked from highest to lowest as follows: T6 > T9 > T5 > T3 > T7 > T11 > T10 > T8 > T4 > T12 > T14 > T2 > T13. The comprehensive evaluation values of T6, T7, T5, and T4 were relatively high, indicating that the change in the amount of P fertilizer did not have a significant effect on the overall traits of JG21 when N and K fertilizer application rates were at the two levels (N160 K150). The changes in N and P concentrations had the greatest impact on the rankings. Under the N concentration gradient, the ranking was T6 > T3 > T11 > T2, and under the P concentration gradient, the ranking was T6 > T5 > T7 > T4. This indicates that when the application rates of NPK were at moderate-to-low concentrations, JG21 exhibited excellent overall traits, and the T6 treatment was the best; relatively speaking, the promoting effect of P fertilizer was better than that of N fertilizer (Figure 4).

3.6. Orthogonal Analysis and Regression Curve Analysis of Different Fertilization Treatments and JG21 Yield

To further investigate the effects of different fertilizer treatments on the JG21 yield and to explore the optimal NPK ratios for high yields in practical production, we estimated the results of an orthogonal experiment on the JG21 yield based on the pot experiment under different fertilizer treatments. The results showed that the K3 value for N fertilizer was the highest, with 240 kg/ha (N3) being the best; the K1 value for P fertilizer was the highest, with 45 kg/ha (P1) being the optimal rate; and the K2 value for K fertilizer was the highest, with 150 kg/ha (K2) being the most effective. The best fertilization combination was N3P1K2. Range analysis indicated that K had the largest effect on the JG21 yield, followed by N, whereas P had the smallest effect, with a priority order of K > N > P, which was consistent with the comprehensive evaluation results (Table 8).
The quadratic regression equation of the correlation between N, P, and K application and expected yield of JG21 was as follows (Equation (9)):
Y = 1513.386 − 1.335N − 9.283P + 16.082K + 0.011N2 − 0.009P2 − 0.037K2 + 0.085NP − 0.047NK + 0.017PK
Using Equation (9), with fixed P and K fertilizer application rates, the maximum N fertilizer application rate and highest yield were calculated as 229.72 kg/ha and 2373.88 kg/ha, respectively (Table 8). With fixed N and K fertilizer application rates, the maximum P fertilizer application rate and highest yield were 64.29 kg/ha and 2291.62 kg/ha, respectively. Finally, with fixed N and P fertilizer application rates, the maximum K fertilizer application rate and highest yield were 126.04 kg/ha and 2266.38 kg/ha, respectively.
Furthermore, a ternary quadratic fertilizer model was constructed to explore the relationship between different NPK combinations and yield. The results showed that the JG21 yield was highest at an application rate of N:153.26 kg/ha, P:68.85 kg/ha, and K:130.73 kg/ha, with a yield of 2463.67 kg/ha. This result was similar to that of T6 (N160P90K150) in the experimental design (Table 9).

4. Discussion

4.1. Screening and Evaluation of JG21 Agronomy Traits and Qualities

The main objective of most foxtail millet research is to optimize its yield and quality [45]. Plant height, leaf area, and stem thickness are closely related to high and stable yields. The panicle length, panicle diameter, single panicle weight, and thousand grain weight are all indices of essential yield components, and the protein and fat content and are the main indices for high grain quality [45,46] Therefore, in this study, we investigated the effect of fertilizers on the agronomic traits, yield, and yield components, and on quality indices. Studies have shown that different NPK combinations have significant effects on the nutritional and growth characteristics of foxtail millet JG21 [26,27]. In the present study, we found that there were significant differences in the effects of N, P, and K fertilizers and their interactions on the yield and quality in foxtail millet. Previous studies suggested that N fertilization was the most important factor in foxtail millet to the grain yield and aboveground [27], and under nitrogen deficiency, a lower folate content is found [26]. In our study, we found that N had a significant positive correlation with yield and protein content. P and K absorption rates were inhibited by excess N application at the same P and K levels. Reasonable N:P:K ratios improve nutrient absorption, biomass accumulation, and crop yield; this phenomenon has also been observed in rice and other foxtail millet studies [27,47]. N2P2K2 (N160P90K150, or the T6 treatment) resulted in the highest plant height, leaf area, and stem thickness in JG21. Stem thickness was well developed under N2P2K2 treatment during the heading and grain-filling stages. This indicates that reasonable NPK-balanced fertilization at N2P2K2 treatment promoted the growth and development of JG21, whereas excessive fertilization inhibited it. This is consistent with the results reported by Guan et al, in which the yield was strongly correlated with plant height, leaf length and width, and chlorophyll, and this is consistent with our results. On this basis, we in found that photosynthesis was critical for optimizing crop yield and quality; moreover, foxtail millet may accumulate organic matter, providing energy for their activities and improving their quality [48,49,50]. Rational nitrogen fertilization increases the leaf area index, reduces the IntCO2 concentration, and improves the net Pn, thereby improving JG21’s ability to carry out photosynthesis [50]. In addition, moderate P application improves the net Pn and E and improves the photosynthetic performance [51]. In this experiment, under balanced NPK fertilization, N2P2K2 treatment showed a significant improvement compared with the control treatment. Simultaneously, under different NPK combinations, the net Pn was positively correlated with the relative chlorophyll content, E and C, and negatively correlated with the IntCO2 concentration. This indicates that moderately increasing the chlorophyll content, E and C, improves JG21′s carbon dioxide utilization efficiency and photosynthetic capacity, and promotes the net Pn. This is consistent with the results reported by Li et al. [51].
Previous studies have shown that reasonable N application significantly increases the protein content of JG21 grains and improves the quality. Zhang et al. found that excessive N application inhibited the accumulation of fat in JG21 [49]. Li et al. found that amylose content is negatively correlated with the taste quality of foxtail millet, indicating that the lower the amylose content, the better the taste [46]. In this experiment, under different NP combinations, except for amylose content, all quality traits increased significantly under N2P2K2 treatment. This indicates that reasonable NPK fertilization changes the balance of the grain moisture, fat, protein, and amylose content in JG21 grains, fundamentally changing the taste and nutritional quality, which is similar to the findings of previous research [45]. Furthermore, we investigated the correlation, and found that N was highly positively correlated with protein content and negatively correlated with amylose content. P was highly positively correlated with fat content and significantly positively correlated with grain moisture content. K was strongly correlated with moisture, fat, and protein content and negatively correlated with amylose content. In addition, there were certain correlations between various quality traits; amylose content was negatively correlated with other traits and significantly negatively correlated with protein content, similar to the findings of the previous review [37].

4.2. Comprehensive Evaluation of the Effects of N, P, and K Application on Foxtail Millet JG21

Different traits indices showed different effects responding to N, P, and K [52,53]. The ecological factors and commercial quality attributes of foxtail millet contained KWG, fat, and others. Thus, the PCA was established for the different fertilization schedules. Four principal components represented most (85%) of the effect of fertilizer. N2P2K2 was the best treatment based on the comprehensive evaluation.
Under the condition of this experiment, the relationship between the combined fertilizer application and the yield was in accordance with the quadratic orthogonal regressive rotation design considering the three factors (recall Equation (9)). Based on the single and two-factor analyses of different proportions of N, P, and K, the results showed that N fertilizer affected the content of protein, P affected the content of fat, and K affected the moisture, fat, and protein content.
In this study, an appropriate regression model of N, P, and K fertilization was established based on the contents of fat, moisture, protein, and amylose, as well as the target yield. Meanwhile the factor of N, P, and K and interaction effects of different fertilizers were also analyzed. Our findings provide a theoretical foundation for foxtail millet production and growers in China, in terms of establishing rational fertilizer combinations to achieve maximum grain yield and quality. This is important for foxtail millet agroecological systems, which are not only affected by these factors, but also by climate factors and soil fertility, irrigation, and costs [45]. Therefore, future research should focus on the combination of these factors for improving foxtail millet economic benefit, in order to provide better guidance for the agricultural production practice.

5. Conclusions

Based on the “3414” fertilizer plan, the effects of different combinations of fertilizers on the agronomic traits, photosynthetic characteristics, yield, and quality of foxtail millet was investigated, which demonstrated that the T6 treatment (N160P90K150) showed the best performance in JG21 for various trait indicators. By the orthogonal analysis of the effects of different fertilization treatments, we found that the optimal fertilization ratio of N, P, and K was N2P2K2, and the application rates of N (urea), P (P2O5), and K (K2O) were 229.72, 64.29, and 126.04 kg/hm2.

Supplementary Materials

The following supporting information can be downloaded at: https://www.mdpi.com/article/10.3390/agronomy13082005/s1, Table S1: Relative change value of each character under different fertilization treatments.; Table S2: Matrix of factor loading.

Author Contributions

Formal analysis, J.M. and X.L.; Methodology, G.X.; Writing-original draft, G.X.; Investigation, B.L. and G.W.; Supervision, Y.H. and S.H.; Writing—review & editing, Y.H. and S.H. All authors have read and agreed to the published version of the manuscript.

Funding

This work was supported by the Grand Science and Technology Special Project in Shanxi Province (202101140601027), Natural Science Foundation of Shanxi Province (20210302123364), Shanxi Scholarship Council of China (2021-071), and National College Students’ Innovation and Entrepreneurship Training Program (20220146).

Data Availability Statement

All datasets supporting the results of this study are included within the article.

Acknowledgments

We would like to thank Zhaoxia Sun and Xingchun Wang of the University of Shanxi Agricultural University, China for discussions and help with the manuscript. In addition, we would like to thank Donald Grierson, University of Nottingham, UK, for discussions and help with the manuscript.

Conflicts of Interest

The authors declare no conflict of interest.

References

  1. Wang, Y.; Chen, Y.; Wu, W. Potassium and phosphorus transport and signaling in plants. J. Integr. Plant Biol. 2021, 63, 34–52. [Google Scholar] [CrossRef] [PubMed]
  2. Mu, X.; Chen, Y. The physiological response of photosynthesis to nitrogen deficiency. Plant Physiol. Biochem. 2021, 158, 76–82. [Google Scholar] [CrossRef] [PubMed]
  3. Bassi, D.; Menossi, M.; Mattiello, L. Nitrogen supply influences photosynthesis establishment along the sugarcane leaf. Sci. Rep. 2018, 8, 2327. [Google Scholar] [CrossRef] [PubMed]
  4. Peng, J.; Feng, Y.; Wang, X.; Li, J.; Xu, G.; Phonenasay, S.; Luo, Q.; Han, Z.; Lu, W. Effects of nitrogen application rate on the photosynthetic pigment, leaf fluorescence characteristics, and yield of indica hybrid rice and their interrelations. Sci. Rep. 2021, 11, 7485. [Google Scholar] [CrossRef]
  5. Xu, G.; Fan, X.; Miller, A.J. Plant nitrogen assimilation and use efficiency. Annu. Rev. Plant Biol. 2012, 63, 153–182. [Google Scholar] [CrossRef]
  6. Zhao, C.; Liu, G.; Chen, Y.; Jiang, Y.; Shi, Y.; Zhao, L.; Liao, P.; Wang, W.; Xu, K.; Dai, Q.; et al. Excessive nitrogen application leads to lower rice yield and grain quality by inhibiting the grain filling of inferior grains. Agriculture 2022, 12, 962. [Google Scholar] [CrossRef]
  7. Liu, L.; Zheng, X.; Wei, X.; Kai, Z.; Xu, Y. Excessive application of chemical fertilizer and organophosphorus pesticides induced total phosphorus loss from planting causing surface water eutrophication. Sci. Rep. 2021, 11, 23015. [Google Scholar] [CrossRef]
  8. Malhotra, H.; Vandana; Sharma, S.; Pandey, R. Phosphorus Nutrition: Plant Growth in Response to Deficiency and Excess. In Plant Nutrients and Abiotic Stress Tolerance, 6th ed.; Hasanuzzaman, M., Fujita, M., Oku, H., Nahar, K., Hawrylak-Nowak, B., Eds.; Springer: Singapore, 2018; pp. 171–190. [Google Scholar]
  9. Hopkins, B.G.; Hansen, N.C. Phosphorus management in high-yield systems. J. Environ. Qual. 2019, 48, 1265–1280. [Google Scholar] [CrossRef]
  10. Neocleous, D.; Savvas, D. The effects of phosphorus supply limitation on photosynthesis, biomass production, nutritional quality, and mineral nutrition in lettuce grown in a recirculating nutrient solution. Sci. Hortic. 2019, 252, 379–387. [Google Scholar] [CrossRef]
  11. Nam, H.I.; Shahzad, Z.; Dorone, Y.; Clowez, S.; Zhao, K.; Bouain, N.; Lay-Pruitt, K.S.; Cho, H.; Rhee, S.Y.; Rouached, H. Interdependent iron and phosphorus availability controls photosynthesis through retrograde signaling. Nat. Commun. 2021, 12, 7211. [Google Scholar] [CrossRef]
  12. Kaminsky, L.M.; Thompson, G.L.; Trexler, R.V.; Bell, T.H.; Kao-Kniffin, J. Medicago sativa has reduced biomass and nodulation when grown with soil microbiomes conditioned to high phosphorus inputs. Phytobiomes J. 2018, 2, 237–248. [Google Scholar] [CrossRef]
  13. Meng, X.; Chen, W.; Wang, Y.; Huang, Z.; Ye, X.; Chen, L.; Yang, L. Effects of phosphorus deficiency on the absorption of mineral nutrients, photosynthetic system performance and antioxidant metabolism in Citrus grandis. PLoS ONE 2021, 16, e0246944. [Google Scholar] [CrossRef] [PubMed]
  14. Xie, X.; Hu, W.; Fan, X.; Chen, H.; Tang, M. Interactions Between Phosphorus, Zinc, and Iron Homeostasis in Nonmycorrhizal and Mycorrhizal Plants. Front. Plant Sci. 2019, 10, 1172. [Google Scholar] [CrossRef] [PubMed]
  15. Lay-Pruitt, K.S.; Wang, W.; Prom-u-thai, C.; Pandey, A.; Zheng, L.; Rouached, H. A tale of two players: The role of phosphate in iron and zinc homeostatic interactions. Planta 2022, 256, 23. [Google Scholar] [CrossRef]
  16. Zörb, C.; Senbayram, M.; Peiter, E. Potassium in agriculture--status and perspectives. J. Plant Physiol. 2014, 171, 656–669. [Google Scholar] [CrossRef]
  17. Johnson, R.; Vishwakarma, K.; Hossen, M.S.; Kumar, V.; Shackira, A.M.; Puthur, J.T.; Abdi, G.; Sarraf, M.; Hasanuzzaman, M. Potassium in plants: Growth regulation, signaling, and environmental stress tolerance. Plant Physiol. Biochem. 2022, 172, 56–59. [Google Scholar] [CrossRef]
  18. Kuzin, A.; Solovchenko, A. Essential role of potassium in apple and its implications for management of orchard fertilization. Plants 2021, 10, 2624. [Google Scholar] [CrossRef]
  19. Yasin, N.A.; Zaheer, M.M.; Khan, W.U.; Ahmad, S.R.; Ahmad, A.; Ali, A.; Akram, W. The beneficial role of potassium in Cd-induced stress alleviation and growth improvement in Gladiolus grandiflora L. Int. J. Phytoremediat. 2018, 20, 274–283. [Google Scholar] [CrossRef]
  20. Zahoor, R.; Zhao, W.; Abid, M.; Dong, H.; Zhou, Z. Potassium application regulates nitrogen metabolism and osmotic adjustment in cotton (Gossypium hirsutum L.) functional leaf under drought stress. J. Plant Physiol. 2017, 215, 30–38. [Google Scholar]
  21. Wang, Y.; Zhang, Z.; Liang, Y.; Han, Y.; Han, Y.; Tan, J. High potassium application rate increased grain yield of shading-stressed winter wheat by improving photosynthesis and photosynthate translocation. Front. Plant Sci. 2020, 11, 134. [Google Scholar] [CrossRef]
  22. Bednarz, C.W.; Oosterhuis, D.M.; Evans, R.D. Leaf photosynthesis and carbon isotope discrimination of cotton in response to potassium deficiency. Environ. Exp. Bot. 1998, 39, 131–139. [Google Scholar] [CrossRef]
  23. Rawat, J.; Pandey, N.; Saxena, J. Role of potassium in plant photosynthesis, transport, growth and yield. In Role of Potassium in Abiotic Stress, 1st ed.; Iqbal, N., Umar, S., Eds.; Springer: Singapore, 2022; pp. 1–14. [Google Scholar]
  24. Ray, K.; Banerjee, H.; Dutta, S.; Hazra, A.K.; Majumdar, K. Macronutrients influence yield and oil quality of hybrid maize (Zea mays L.). PLoS ONE 2019, 14, e0216939. [Google Scholar] [CrossRef]
  25. Ray, K.; Banerjee, H.; Dutta, S.; Sarkar, S.; Murrell, T.S.; Singh, V.K.; Majumdar, K. Macronutrient management effects on nutrient accumulation, partitioning, remobilization, and yield of hybrid maize cultivars. Front. Plant Sci. 2020, 11, 1307. [Google Scholar] [CrossRef] [PubMed]
  26. Wang, Y.; Wang, J.; Dong, E.; Liu, Q.; Wang, L.; Chen, E.; Jiao, X.; Diao, X. Foxtail millet [Setaria italica (L.) P. Beauv.] grown under nitrogen defixiency exhibits a lower folate contents. Front. Nutr. 2023, 10, 1035739. [Google Scholar] [CrossRef] [PubMed]
  27. Guan, R.; Pan, H.; He, W.; Sun, M.; Wang, H.; Cui, X.; Lou, Y. Fertilizer recommendation for foxtail millet based on yield response and nutrient accumulation. J. Plant Nutr. 2022, 45, 332–345. [Google Scholar] [CrossRef]
  28. Shrivastav, P.; Prasad, M.; Singh, T.B.; Yadav, A.; Goyal, D.; Ali, A.; Dantu, P.K. Role of nutrients in plant growth and development. In Contaminants in Agriculture, 3rd ed.; Naeem, M., Ansari, A., Gill, S., Eds.; Springer: Cham, Switzerland, 2020; pp. 43–59. [Google Scholar]
  29. Selim, M.M. Introduction to the integrated nutrient management strategies and their contribution to yield and soil properties. Int. J. Agron. 2020, 2020, 2821678. [Google Scholar] [CrossRef]
  30. Zhang, G.; Liu, X.; Quan, Z.; Cheng, S.; Xu, X.; Pan, S.; Xie, M.; Zeng, P.; Yue, Z.; Wang, W.; et al. Genome sequence of foxtail millet (Setaria italica) provides insights into grass evolution and biofuel potential. Nat. Biotechnol. 2012, 30, 549–554. [Google Scholar] [CrossRef]
  31. Yang, Q.; Yu, Z.; Guimei, C.; Panpan, Z. Water use efficiency of foxtail millet (Panicum italicum L.) under climate change conditions in Northwest regions of China. Agrociencia 2016, 50, 665–676. [Google Scholar]
  32. Yan, J.; Zhang, N.; Kang, F.; Wang, J.; Wang, X. Cultivar replacement increases water use efficiency in foxtail millet in Shaanxi Province, China. Plant Physiol. Biochem. 2021, 164, 73–81. [Google Scholar] [CrossRef]
  33. Nadeem, F.; Ahmad, Z.; Hassan, M.U.; Wang, R.; Diao, X.; Li, X. Adaption of foxtail millet (Setaria italica L.) to abiotic stresses: A special perspective of responses to nitrogen and phosphate limitations. Front. Plant Sci. 2020, 11, 187. [Google Scholar] [CrossRef]
  34. Lata, C.; Gupta, S.; Prasad, M. Foxtail millet: A model crop for genetic and genomic studies in bioenergy grasses. Rev. Environ. Sci. Biotechnol. 2013, 33, 328–343. [Google Scholar] [CrossRef]
  35. Hou, S.; Men, Y.; Wei, M.; Zhang, Y.; Li, H.; Sun, Z.; Han, Y. Total protein content, amino acid composition and eating-quality evaluation of foxtail millet (Setaria italica (L.) P. Beauv). Foods 2022, 12, 31. [Google Scholar] [CrossRef]
  36. Sun, M.; Kang, X.; Wang, T.; Fan, L.; Wang, H.; Pan, H.; Yang, Q.; Liu, H.; Lou, Y.; Zhuge, Y. Genotypic diversity of quality traits in Chinese foxtail millet (Setaria italica L.) and the establishment of a quality evaluation system. Food Chem. 2021, 353, 129421. [Google Scholar] [CrossRef]
  37. Yousaf, L.; Hou, D.; Liaqat, H.; Shen, Q. Millet: A review of its nutritional and functional changes during processing. Food Res. Int. 2021, 142, 110197. [Google Scholar] [CrossRef] [PubMed]
  38. Feng, Y.; Guo, Z.; Zhong, L.; Zhao, F.; Zhang, J.; Lin, X. Balanced fertilization decreases environmental filtering on soil bacterial community assemblage in North China. Front. Microbiol. 2017, 8, 2376. [Google Scholar] [CrossRef] [PubMed]
  39. Yousaf, M.; Li, J.; Lu, J.; Ren, T.; Cong, R.; Fahad, S.; Li, X. Effects of fertilization on crop production and nutrient supplying capacity under rice-oiled rape rotation system. Sci. Rep. 2017, 7, 1270. [Google Scholar] [CrossRef]
  40. Chuan, L.; He, P.; Pampolino, M.F.; Johnston, A.M.; Jin, J.; Xu, X.; Zhao, S.; Qiu, S.; Zhou, W. Establishing a scientific basis for fertilizer recommendations for wheat in China: Yield response and agronomic efficiency. Field Crops Res. 2013, 140, 1–8. [Google Scholar] [CrossRef]
  41. Sachdev, N.; Goomer, S.; Singh, L.R. Foxtail millet: A potential crop to meet future demand scenario for alternative sustainable protein. J. Sci. Food Agric. 2021, 101, 831–842. [Google Scholar] [CrossRef]
  42. Li, Y.; Yin, M.; Li, L.; Zheng, J.; Yuan, X.; Wen, Y. Optimized potassium application rate increases foxtail millet grain yield by improving photosynthetic carbohydrate metabolism. Front. Plant Sci. 2022, 13, 1044065. [Google Scholar] [CrossRef]
  43. Wu, Z.; Yan, J.; Shi, W.; Zeng, S. The Design and Statistic Analysis of Effect Experiment of Fertilizer “3414”. Xinjiang Agric. Sci. 2008, 17, 135–141. [Google Scholar]
  44. Yuan, Y.; Chen, X.; Li, M.; Li, P.; Jia, Y.; Han, Y.; Xing, G. Screening of germplasm tolerant to low phosphorus of seedling stage and response of root protective enzymes to low phosphorus in foxtail millet. Acta Agron. Sin. 2019, 45, 601–612. [Google Scholar]
  45. Ma, K.; Zhao, L.; Zhao, X.; Li, X.; Dong, S.; Zhang, L.; Guo, P.; Yuan, X.; Diao, X. The relationship between ecological factors and commercial quality of high-quality foxtail millet “Jinggu 21”. Food Res. Int. 2023, 163, 112225. [Google Scholar] [CrossRef] [PubMed]
  46. Li, S.; Zhao, W.; Min, G.; Li, P.; Zhang, A.; Zhang, J.; Wang, Y.; Liu, Y.; Liu, J. Effects of different amylose contents of foxtail millet flour varieties on textural properties of chinese steamed bread. Processes 2021, 9, 1131. [Google Scholar] [CrossRef]
  47. Song, T.; Das, D.; Hu, Q.; Yang, F.; Zhang, J. Alternate wetting and drying irrigation and phosphorus rates affect grain yield and quality and heavy metal accumulation in rice. Agric. Water Manag. 2019, 223, 105686. [Google Scholar] [CrossRef]
  48. Wang, N.; Fu, F.; Wang, H.; Wang, P.; He, S.; Shao, H.; Ni, Z.; Zhang, X. Effects of irrigation and nitrogen on chlorophyll content, dry matter and nitrogen accumulation in sugar beet (Beta vulgaris L.). Sci. Rep. 2021, 11, 16651. [Google Scholar] [CrossRef]
  49. Zhang, Y.; Li, S.; Fu, W.; Wen, H. Effects of nitrogen application on yield, photosynthetic characteristics and water use efficiency of hybrid millet. J. Heilognjiang Bayi Agric. Univ. 2014, 20, 1119–1126. [Google Scholar]
  50. Xue, Y.; Miao, X.; Wang, Y. Effects of nitrogen application on photosynthetic yield and quality of foxtail millet. J. Heilognjiang Bayi Agric. Univ. 2019, 31, 1–7. [Google Scholar]
  51. Li, P.; Li, B.; Seneweera, S.; Zong, Y.; Li, F.Y.; Han, Y.; Hao, X. Photosynthesis and yield response to elevated CO2, C4 plant foxtail millet behaves similarly to C3 species. Plant Sci. 2019, 285, 239–247. [Google Scholar] [CrossRef]
  52. Yu, M.; Liu, Z.; Yang, B.; Chen, H.; Zhang, H.; Hou, D. The contribution of photosynthesis traits and plant height components to plant height in wheat at the individual quantitative trait locus level. Sci. Rep. 2020, 10, 12261. [Google Scholar] [CrossRef] [PubMed]
  53. Pan, J.; Zhao, J.; Liu, Y.; Huang, N.; Tian, K.; Shah, F.; Liang, K.; Zhong, X.; Liu, B. Optimized nitrogen management enhances lodging resistance of rice and its morpho-anatomical, mechanical, and molecular mechanisms. Sci. Rep. 2019, 9, 20274. [Google Scholar] [CrossRef]
Figure 1. Effects of different fertilization treatments on the agronomic traits of JG21. (AC), (DF), and (GI) represent plant height, leaf area, and stem diameter at the jointing stage, the heading stage and the filling stage, under 14 treatement, individually. Note: PH, plant height; LA, leaf area; SD, stem diameter; different letter indicated significantly difference at p < 0.05 level between two treatments according to Duncan’s k-ratio LSD test.
Agronomy 13 02005 g001
Figure 2. The 3-D map of the mutual effect of N, P, and K fertilizers on the quality traits and yield of JG21. (A) MC, moisture content; (B) CF, crude fat; (C) Pr, protein; (D) AC, amylose content; (E) yield.
Agronomy 13 02005 g002
Figure 3. Correlation analysis of JG21 agronomy, photosynthetic traits, and yield under different fertilization treatments. PH, plant height; LA, leaf area; SD, stem diameter; and SPAD, Pn, E, C, and IntCO2 represent the relative chlorophyll content, net photosynthetic rate, transpiration rate, stomatal conductance, and intercellular carbon dioxide concentration, respectively (* p < 0.05; ** p < 0.01).
Agronomy 13 02005 g003
Figure 4. Cluster plot of 13 processing capabilities. The colors represent the different effects of fertilization; red indicates the strongest effect, and blue indicates the weakest effect. The darker the color, the greater the effect.
Agronomy 13 02005 g004
Table 1. Overall planning levels of nitrogen, phosphorus, and potassium.
TreatmentFertilization LevelAmount of Fertilizer (kg/hm2)Actual Fertilizer Application (g/Basin)
N (Urea)P (P2O5)K (K2O)N (Urea)P (P2O5)K (K2O)N (Urea)P (P2O5)K (K2O)
T1N0P0K0000000000
T2N0P90K15002209015000.40.667
T3N80P90K15012280901500.3560.40.667
T4N160P0K15020216001500.71100.667
T5N160P45K150212160451500.7110.20.667
T6N160P90K150222160901500.7110.40.667
T7N160P135K1502321601351500.7110.60.667
T8N160P90K02201609000.7110.40
T9N160P90K7522116090750.7110.40.333
T10N160P90K225223160902250.7110.41
T11N240P90K150322240901501.0670.40.667
T12N160P45K7521116045750.7110.20.333
T13N80P90K751218090750.3560.40.333
T14N80P45K15011280451500.3560.20.667
Table 2. Analysis of photosynthetic characteristics of JG21 under integrated fertilization of N, P and K.
PeriodTreatmentSPADPnECIntCO2
(μmol/m2/s)(mmol/m2/s)(mmol/m2/s)(μmol/mol)
Jointing
stage
T1N0P0K047.22 ± 1.47 e19.7 ± 0.06 ab3.1 ± 0 cdef98.42 ± 3.46 bcde236 ± 2.89 a
T2N0P90K15053.58 ± 1.48 bcd20.65 ± 1.1 a3.1 ± 0.35 cdef103 ± 18.48 bcde185 ± 1.73 abcd
T3N80P90K15054 ± 1.5 bcd20.92 ± 0.46 a3.05 ± 0.03 def85 ± 1.15 de174 ± 5.77 bcd
T4N160P0K15051.84 ± 0.42 cd20.35 ± 0.43 a3.25 ± 0.2 bcde106.5 ± 11.26 bcd220.5 ± 38.39 ab
T5N160P45K15053.34 ± 0.44 bcd20.05 ± 0.61 ab4.1 ± 0 a134 ± 1.73 a186 ± 21.83 abcd
T6N160P90K15055.38 ± 0.92 b21.17 ± 0.09 a3.9 ± 0.21 a123.33 ± 11.1 ab156 ± 4.62 cd
T7N160P135K15051.72 ± 1.33 cd16.7 ± 0.58 de3.55 ± 0.03 abcd112.5 ± 4.33 abc201 ± 15.59 abc
T8N160P90K054.34 ± 1.1 bcd18.05 ± 0.03 bcd2.55 ± 0.32 f82.5 ± 3.75 de210.5 ± 5.48 abc
T9N160P90K7553.9 ± 1.09 bcd19.4 ± 0.17 abc3.75 ± 0.09 ab115 ± 4.62 abc177.5 ± 32.04 abcd
T10N160P90K22554.98 ± 0.86 bc14.15 ± 0.95 f2.85 ± 0.38 ef77 ± 12.7 e137 ± 30.02 d
T11N240P90K15058.46 ± 0.84 a14.2 ± 0.87 f3.05 ± 0.03 def91 ± 1.73 cde196.5 ± 10.1 abc
T12N160P45K7552.98 ± 0.79 bcd15.5 ± 0.87 ef3.25 ± 0.03 bcde95.5 ± 1.44 cde191.5 ± 10.68 abcd
T13N80P90K7551.28 ± 0.63 d17.55 ± 1.18 cd3.7 ± 0.12 abc115.5 ± 8.95 abc205.5 ± 2.02 abc
T14N80P45K15051.96 ± 1.14 bcd14.85 ± 0.2 ef3.55 ± 0.03 abcd98.5 ± 2.02 bcde204.5 ± 0.87 abc
F value5.69 **15.16 **5.58 **5.38 **2.05
Heading
stage
T1N0P0K057.12 ± 1.21 a25.07 ± 0.91 e5.31 ± 0.33 b122.9 ± 14.07 c199.1 ± 6.33 a
T2N0P90K15058.24 ± 1.22 ab28.27 ± 0.31 bcde5.89 ± 0.16 ab139.43 ± 10.1 bc169.67 ± 4.2 bc
T3N80P90K15063.36 ± 0.72 a28.77 ± 1.02 bcd6.06 ± 0.2 a155.54 ± 11.97 abc161.4 ± 8.25 bcde
T4N160P0K15058.84 ± 0.78 a29.82 ± 1.08 abc6.11 ± 0.19 a156.23 ± 11.85 abc151.9 ± 4.35 cde
T5N160P45K15057.64 ± 0.39 ab31.05 ± 2.1 ab6.31 ± 0.1 a180.81 ± 9.77 a145.43 ± 11.01 cde
T6N160P90K15062.2 ± 1.19 a33.17 ± 1.83 a6.28 ± 0.12 a184.06 ± 2.85 a140.87 ± 4.91 e
T7N160P135K15061.56 ± 1.54 a28.17 ± 0.27 bcde6.12 ± 0.2 a166.1 ± 5.36 ab144.2 ± 8.07 de
T8N160P90K057.98 ± 0.49 ab31.34 ± 0.59 ab6.18 ± 0.19 a154.85 ± 4.32 abc165.83 ± 3.79 bcd
T9N160P90K7561.62 ± 2.46 a29.29 ± 1.03 bcd6.04 ± 0.05 a169.13 ± 13.23 ab169.53 ± 3.5 bc
T10N160P90K22551.6 ± 2.19 b26.34 ± 0.25 cde5.95 ± 0.21 ab166.11 ± 4.33 ab166.27 ± 17.85 bcd
T11N240P90K15062.84 ± 0.87 a25.83 ± 0.42 de5.84 ± 0.18 ab162.54 ± 6.69 ab170.13 ± 3.28 bc
T12N160P45K7560.5 ± 1.51 a26.32 ± 1.53 cde5.9 ± 0.35 ab164.7 ± 21.3 ab168.9 ± 1.53 bc
T13N80P90K7557.96 ± 0.65 ab27.33 ± 0.24 cde5.92 ± 0.24 ab159.5 ± 11.22 ab176.73 ± 6.84 ab
T14N80P45K15059.86 ± 0.69 a26.12 ± 1.31 de6.01 ± 0.09 a154.27 ± 7.97 abc179.6 ± 2.02 ab
F value1.794.77 **1.422.054.48 **
Filling
stage
T1N0P0K054.72 ± 3.22 ab19.35 ± 0.94 cd4.06 ± 0.33 c99.75 ± 17.7 c206.83 ± 17.63 a
T2N0P90K15055.02 ± 2.51 ab20 ± 0.86 bcd4.41 ± 0.29 bc112.69 ± 12.23 bc168.33 ± 6.56 abc
T3N80P90K15058.86 ± 1.22 a22.28 ± 1.35 bcd4.82 ± 0.2 abc102.2 ± 13.16 c102.93 ± 7.32 c
T4N160P0K15056.46 ± 1.01 ab21.26 ± 1.03 bcd4.34 ± 0.16 bc112.46 ± 12.7 bc178.4 ± 16.59 ab
T5N160P45K15056.88 ± 0.58 ab25.69 ± 2.15 abc4.93 ± 0.06 abc106.89 ± 7.9 bc131.07 ± 17.44 bc
T6N160P90K15059.46 ± 0.52 a30.5 ± 0.94 a5.79 ± 0.41 ab140.24 ± 6.61 abc125.6 ± 19.8 bc
T7N160P135K15055.74 ± 0.96 ab22.81 ± 1.78 bcd5.13 ± 0.27 abc138.72 ± 14.29 abc159.93 ± 9 bc
T8N160P90K054.46 ± 1.22 ab24.73 ± 3.05 abc6.28 ± 0.26 a187.14 ± 14.21 a183.47 ± 8.58 ab
T9N160P90K7556 ± 1.05 ab27.04 ± 2.22 ab5.84 ± 0.41 ab167.38 ± 28.26 a137.67 ± 23.47 bc
T10N160P90K22552.8 ± 1.15 b23.28 ± 1.46 bcd6.11 ± 0.38 a156.77 ± 14.14 ab159.3 ± 17.17 bc
T11N240P90K15056.62 ± 1.14 ab16.94 ± 1.4 d5.01 ± 0.74 abc100.74 ± 8.71 c130.77 ± 14.96 bc
T12N160P45K7556.06 ± 0.71 ab20.29 ± 4.11 bcd5.89 ± 0.58 ab105.66 ± 25.72 bc147.33 ± 17.79 bc
T13N80P90K7556.6 ± 0.42 ab18.79 ± 4.48 cd3.57 ± 0.33 c102.32 ± 19.94 c158.2 ± 16.78 bc
T14N80P45K15057.72 ± 2.14 ab19.71 ± 1.53 bcd4.21 ± 1.14 c104.56 ± 13.23 bc161.93 ± 6.7 bc
F value1.352.66 **3.18 **3.21 **2.45 *
Pn, net photosynthetic rate; E, transpiration rate; C, stomatal conductance; IntCO2, intercellular CO2 concentration. Different lowercase letters indicate a significant difference at the 5% level, (* p < 0.05, ** p < 0.01).
Table 3. Analysis of yield and related characteristics of JG21 under integrated fertilization of N, P, and K.
TreatmentPL
(cm)
PD
(mm)
SPW
(g)
SGW
(g)
TGW
(g)
PPP
(g)
T1N0P0K022.75 ± 0.37 cd27.04 ± 0.71 c25.7 ± 1.24 cd20.6 ± 1.22 cd2.95 ± 0.08 fg61.81 ± 2.11 b
T2N0P90K15022.27 ± 0.17 de28.99 ± 1.35 bc29.98 ± 2.07 abcd25.39 ± 1.81 abc3.02 ± 0.02 efg76.17 ± 3.13 ab
T3N80P90K15024.7 ± 1.05 bc31.76 ± 1.3 ab32.92 ± 1.22 ab27.94 ± 1.73 ab3.11 ± 0.04 def83.82 ± 2.99 ab
T4N160P0K15024.25 ± 0.32 bcd30.11 ± 1.06 abc31.72 ± 1.04 abcd26.75 ± 0.95 ab3.03 ± 0.05 efg80.26 ± 1.65 ab
T5N160P45K15025.51 ± 0.99 ab30.06 ± 1.42 abc32.4 ± 1.27 abc27.26 ± 0.2 ab3.17 ± 0.04 bcde81.77 ± 0.35 ab
T6N160P90K15027.37 ± 0.41 a31.71 ± 0.53 ab33.06 ± 0.84 ab27.68 ± 0.82 ab3.29 ± 0.03 abc83.05 ± 1.42 a
T7N160P135K15022.67 ± 0.69 cde28.54 ± 0.74 bc31.58 ± 1.39 abcd23.88 ± 0.23 bcd3.24 ± 0.06 bcd71.65 ± 0.40 ab
T8N160P90K022.55 ± 0.87 cde28.38 ± 2.08 bc24.89 ± 3.25 d18.62 ± 2.53 d3.13 ± 0.05 cde55.87 ± 4.39 b
T9N160P90K7522.7 ± 0.38 cde29.83 ± 1.06 abc29.66 ± 1.94 abcd24.24 ± 2.4 abcd3.31 ± 0.07 ab72.73 ± 4.16 ab
T10N160P90K22522.46 ± 0.52 de26.91 ± 1.06 c25.26 ± 1.7 d20.6 ± 1.4 cd3.31 ± 0.07 ab61.81 ± 2.43 b
T11N240P90K15024.75 ± 1.08 bc33.32 ± 1.97 a36.22 ± 1.25 a30.1 ± 1.32 a3.1 ± 0.01 def90.29 ± 2.28 a
T12N160P45K7523.15 ± 0.47 cd28.39 ± 0.67 bc28.32 ± 3.86 bcd23.37 ± 3.72 bcd3.15 ± 0.01 bcde70.1 ± 6.44 ab
T13N80P90K7520.54 ± 0.51 e26.18 ± 1.19 c24.89 ± 1.95 d18.75 ± 0.78 d2.93 ± 0.01 g56.25 ± 1.35 b
T14N80P45K15022.91 ± 0.68 cd29.68 ± 1.02 abc29.99 ± 2.89 abcd24.03 ± 2.56 bcd3.42 ± 0.1 a72.1 ± 4.43 ab
F value6.40 **2.65 **3.00 **3.86 **7.63 **3.86 **
PL, panicle length; PD, panicle diameter; SPW, single panicle weight; SGW, single grain weight; TGW, thousand grain weight; PPP, production per pot. Different lowercase letters indicate a significant difference at the 5% level. (** p < 0.01).
Table 4. Analysis of quality characteristics of JG21 under integrated fertilization of N, P, and K.
TreatmentMCCFPrAC
T1N0P0K010.94 ± 0.03 f3.07 ± 0.02 h5.08 ± 0.13 f18.95 ± 0.05 a
T2N0P90K15011.11 ± 0.07 de3.24 ± 0.02 ef5.46 ± 0.06 e18.86 ± 0.08 a
T3N80P90K15011.31 ± 0.02 abc3.38 ± 0.01 bcd6.13 ± 0.04 d18.24 ± 0.07 cd
T4N160P0K15011.19 ± 0.03 cde3.13 ± 0.02 gh5.93 ± 0.1 d18.43 ± 0.17 bc
T5N160P45K15011.28 ± 0.02 abc3.36 ± 0.03 cd5.99 ± 0.03 d18.5 ± 0.07 bc
T6N160P90K15011.4 ± 0.02 a3.48 ± 0.01 a6.77 ± 0.03 ab17.75 ± 0.06 e
T7N160P135K15011.33 ± 0.03 ab3.45 ± 0.05 ab6.14 ± 0.1 d18.24 ± 0.13 cd
T8N160P90K011.22 ± 0.09 bcd3.24 ± 0.01 ef5.93 ± 0.08 d18.7 ± 0.06 ab
T9N160P90K7511.29 ± 0.05 abc3.39 ± 0.03 bc6.6 ± 0.07 b18.06 ± 0.08 d
T10N160P90K22511.18 ± 0.05 cde3.31 ± 0.04 cde6.69 ± 0.14 ab18.01 ± 0.02 d
T11N240P90K15011.2 ± 0.01 bcd3.2 ± 0.01 fg6.89 ± 0.01 a17.59 ± 0.04 e
T12N160P45K7511.17 ± 0.02 cde3.25 ± 0.02 ef6.36 ± 0.07 c18.15 ± 0.03 d
T13N80P90K7511.23 ± 0.03 bcd3.3 ± 0.01 de5.65 ± 0.03 e18.69 ± 0.05 ab
T14N80P45K15011.07 ± 0.02 e3.2 ± 0.06 fg5.92 ± 0.04 d18.58 ± 0.13 b
F value7.73 **18.89 **45.98 **22.21 **
MC, moisture content; CF, crude fat; Pr, protein; AC, amylose content. Different lowercase letters indicate a significant difference at the 5% level. (** p < 0.01).
Table 5. Eigenvalue and contribution of each comprehensive index.
Principal ComponentEigenvalueContributive Ratio (%)Cumulative Contributive Ratio (%)
18.6347.9447.94
23.8921.6369.57
31.9110.5880.15
41.126.2086.35
Table 6. The μ(X) value of different fertilization treatments.
Treatmentμ(1)μ(2)μ(3)μ(4)
T20.13 0.11 0.65 0.82
T30.70 0.19 0.74 0.34
T40.33 0.09 0.53 0.95
T50.59 0.35 0.77 0.73
T61.00 0.77 0.80 0.79
T70.43 0.66 0.68 0.50
T80.03 0.94 0.56 0.99
T90.61 0.92 0.52 0.58
T100.24 1.00 0.07 0.36
T110.75 0.00 0.00 0.38
T120.26 0.41 0.21 0.37
T130.00 0.33 1.00 0.00
T140.25 0.15 0.36 1.00
Table 7. The comprehensive evaluation value (D) of different fertilization treatments.
TreatmentD1D2D3D4DRank
T20.07 0.03 0.08 0.06 0.24 12
T30.39 0.05 0.09 0.02 0.55 4
T40.18 0.02 0.06 0.07 0.34 9
T50.33 0.09 0.09 0.05 0.56 3
T60.56 0.19 0.10 0.06 0.90 1
T70.24 0.17 0.08 0.04 0.52 5
T80.02 0.24 0.07 0.07 0.39 8
T90.34 0.23 0.06 0.04 0.68 2
T100.13 0.25 0.01 0.03 0.42 7
T110.42 0.00 0.00 0.03 0.44 6
T120.15 0.10 0.03 0.03 0.30 10
T130.00 0.08 0.12 0.00 0.20 13
T140.14 0.04 0.04 0.07 0.29 11
Table 8. Orthogonal analysis of the effects of different fertilization treatments on JG21 yield.
TreatmentN (Urea)P (P2O5)K (K2O)Yield
(kg/hm2)
T10001554.71
T20221952.13
T31222211.42
T42022069.86
T52122200.63
T62222321.43
T72321972.7
T82201494.1
T92212049.74
T102231741.95
T113222378.99
T122111875.9
T131211398.88
T141122104.73
S03506.843624.573048.81
S15715.036181.265324.52
S215,726.3115,548.6417,211.89
S32378.991972.71741.95
K01753.421812.291524.41
K11905.012060.421774.84
K21965.791943.582151.49
K32378.991972.71741.95
R rage625.57248.14627.08
S0, S1, S2, and S3 represent the predicted total yields of JG21 at the gradient levels of 0, 1, 2, and 3 for nitrogen, phosphorus, and potassium, respectively. K0, K1, K2, and K3 represent the average yield of JG21 at the gradient levels of 0, 1, 2, and 3 when the nitrogen, phosphorus, and potassium application rates are 0, 1, 2, and 3, respectively.
Table 9. Univariate quadratic regression analysis of N, P, and K application rates and JG21 yield.
FertilizerFertilizer Effect EquationR2Maximum Fertilization
Application (kg/hm2)
Maximum Yield (kg/hm2)
N (urea)y = −0.0079x2 + 3.6295x + 19570.9956229.722373.88
P (P2O5)y = −0.0592x2 + 7.6124x + 2046.90.848164.292291.62
K (K2O)y = −0.0504x2 + 12.705x + 1465.70.9587126.042266.38
Disclaimer/Publisher’s Note: The statements, opinions and data contained in all publications are solely those of the individual author(s) and contributor(s) and not of MDPI and/or the editor(s). MDPI and/or the editor(s) disclaim responsibility for any injury to people or property resulting from any ideas, methods, instructions or products referred to in the content.

