Article

Effects of Bio-Organic Fertilizer on Soil Infiltration, Water Distribution, and Leaching Loss under Muddy Water Irrigation Conditions

1
State Key Laboratory of Eco-Hydraulics in Northwest Arid Region, Xi’an University of Technology, Xi’an 710048, China
2
School of Geology and Mining Engineering, Xinjiang University, Urumqi 830046, China
3
College of Hydraulic & Environmental Engineering, China Three Gorges University, Yichang 443002, China
4
School of Water Conservancy and Hydroelectric Power, Hebei University of Engineering, Handan 056038, China
*
Author to whom correspondence should be addressed.
Agronomy 2023, 13(8), 2014; https://doi.org/10.3390/agronomy13082014
Submission received: 24 June 2023 / Revised: 27 July 2023 / Accepted: 27 July 2023 / Published: 29 July 2023
(This article belongs to the Section Water Use and Irrigation)

Abstract

:
This study analyzes the soil water infiltration characteristics under muddy water irrigation and bio-organic fertilizer conditions in the current context of muddy water irrigation rarely being used in agricultural production and in combination with the problems of water resource shortages and low soil fertility in arid and semi-arid regions. An indoor one-dimensional soil column infiltration device was used for studying the effects of four muddy water sediment concentration levels (ρ0: 0; ρ1: 4%; ρ2: 8%; ρ3: 12%) and four bio-organic fertilizer levels (FO0: 0; FO1: 2250 kg·hm−2; FO2: 4500 kg·hm−2; sFO3: 6750 kg·hm−2) on soil water infiltration, evaporation characteristics, and leaching loss. The results demonstrated that a higher muddy water sediment concentration and fertilization level resulted in a smaller wetting front distance and cumulative infiltration amount within the same time, but the infiltration reduction rate (η) gradually increased. The three infiltration models (Kostiakov, Philip, and Horton) were fitted, and it was discovered that all three had good fitting results (R2 > 0.8), with the Kostiakov model displaying the best fit and the Horton model exhibiting the worst fit. The cumulative evaporation amount and evaporation time in muddy water irrigation and fertilization conditions was consistent with the Black and Rose evaporation models (R2 > 0.9), the Black model was proved to be higher than the Rose model. In comparison to ρ0, muddy water irrigation increased conductivity and total dissolved solids (TDS) in the leaching solution, but it reduced cumulative evaporation, soil moisture content, the uniformity coefficient of soil water distribution, and leaching solution volume. Compared with FO0, the application of bio-organic fertilizer increased soil water content and reduced soil water evaporation while also reducing the leaching solution volume, conductivity, and TDS in the leaching solution. The results of this research can provide scientific reference for the efficient utilization of muddy water irrigation and the rational application of bio-organic fertilizer.

1. Introduction

A shortage of water resources and low soil fertility are the main factors that limit efficient agricultural production in arid and semi-arid regions. The effective utilization of irrigation water by soil is determined using the water infiltration process of soil, which also determines the degree of surface runoff and soil erosion, thereby affecting water distribution in the crop root zone and the effective utilization of water, ultimately impacting both crop growth and yield [1,2]. Improving the soil structure, regulating soil fertility, and improving the effective utilization of soil water and fertilizer through muddy water irrigation and bio-organic fertilizer are important topics that have attracted a great deal of attention in arid and semi-arid regions.
A vast area of the Yellow River Basin in China is in arid and semi-arid regions. The region has low rainfall and large evaporation, which lead to a serious agricultural irrigation water shortage. The Yellow River has the highest sediment concentration of any river in the world. Due to the loose soil structure in the Loess Plateau, serious vegetation destruction, low coverage, and the rainfall during the year consisting of mainly rainstorms, the Yellow River carries a large amount of sediment as it flows through the Loess Plateau. To solve the issue of agricultural water use, some irrigation areas in the Yellow River Basin with their own basin characteristics and production practice have introduced muddy water as a means of irrigating farmland in irrigation areas. Researchers have conducted abundant research on making improvements to muddy water utilization. Nasirian et al. found that the direct use of muddy water for field irrigation reduces deep seepage and improves the water-use efficiency of channels [3]. Soil following muddy water irrigation is suitable for crop growth. As the number of cultivated years increases, so does cultivated land quality and the crop yield [4]. Wang et al. [5] modified the existing Green Ampt infiltration model based on muddy water infiltration and found that the main reason for the decrease in the infiltration of muddy water is that the infiltration of muddy water reduces the average suction of wet peaks. Research by Bai et al. [6] shows that the sediment concentration in muddy water has no effect on the variation pattern of cumulative infiltration, but the larger the sediment concentration, the more significant the reduction effect of infiltration. When the wetting peak migrates to the interface between soil and sand, there is a significant pause in the vertical direction of the wetting peak, but it migrates horizontally. There is a significant stagnation in the vertical direction but not in the horizontal direction. After the water supply is completed, the soil moisture in the wetting body is mainly concentrated above the sand layer. Zhong et al. demonstrated that the cumulative infiltration, infiltration rate, and wetting front migration distance of muddy water infiltration decreases as sediment concentration increases [7]. Water and fertilizer leaching is one of the primary causes of water and fertilizer loss in farmland, resulting in resource wastage and environmental problems that include increased salinity and eutrophication in groundwater [8]. It is currently unknown whether muddy water irrigation is able to improve the water and fertilizer storage capacity of soil while also reducing water and fertilizer leaching loss.
Bio-organic fertilizer is a new type of organic fertilizer that contains several beneficial microbial communities. These unique microbial communities have the ability to activate soil, improve the physical and chemical properties of soil, and increase soil microbial diversity, which results in increased crop yield [9]. Bio-organic fertilizer application can effectively reduce surface runoff, improve soil water storage capacity, and coordinate the contradiction between soil water supply and crop water demand. It can also improve fertilizer use efficiency, reduce nitrogen loss that is caused by leakage or runoff, and significantly improve the negative impact of improper chemical fertilizer application on soil and the environment [10]. Bio-organic fertilizer can improve and maintain fertilization. In comparison to no fertilization, the volume of leaching solution treated with bio-organic fertilizer decreases by 1.25~6.78% [11]. The application of organic fertilizer is conducive to soil macroaggregate formation and also improves soil aggregate structure and stability, which is conducive to soil porosity improvement [12]. Bio-organic fertilizer increases humus content under the action of soil microorganisms, and humus is mostly hydrophilic colloid, which improves water retention capacity in soil [13].
Many studies have examined soil water and fertilizer retention capacity under the application of bio-organic fertilizer or muddy water irrigation, but relatively few have reported the effects of the combination of muddy water irrigation and bio-organic fertilizer on soil water infiltration and leaching loss. Therefore, this study uses bio-organic fertilizer and muddy water sediment concentration as experimental materials, conducting an indoor one-dimensional soil column simulation experiment as a means of exploring the impact that the combined application of bio-organic fertilizer has on water infiltration and fertilizer leaching in muddy water irrigation conditions. The aim is to provide scientific basis for muddy water irrigation coupled with bio-organic fertilizer for the improvement of soil water and fertilizer retention capacity.

2. Materials and Methods

2.1. Material Preparation

An indoor vertical one-dimensional infiltration soil column experiment was performed in the State Key Laboratory of Eco-hydraulics in the Northwest Arid Region and the Artificial Intelligence Climate Room of Modern Agricultural Engineering of Xi’an University of Technology. The experimental soil was collected from the 0~40 cm plow layer soil in the farmland experiment field of Baqiao District, Xi’an City, Shaanxi Province, China. The undisturbed soil was air dry and rolled being passed through a 2 mm sieve for backup. The soil initial water content and saturated moisture content were measured as 2.34% and 40.12% using the oven drying method. The soil profile pH was 7.21 (1:2.5 soil:water), the EC1:5 (electric conductivity) was 179 μS·cm−1, the soil organic matter content was 13.45 g·kg−1, the available nitrogen was 75.42 g·kg−1, the available phosphorus was 22.74 g·kg−1, and the available potassium was 186.54 g·kg−1. Soil texture was determined in order to use a Mastersizer-2000 laser particle size analyzer (Malvern Instruments Limited, Malvern, UK). Based on the international soil texture classification standard, the test soil was classified as silt loam soil (consisting of 3.28% clay, 12.25% silt, 84.17% sand). Sediment from the muddy infiltration water was collected from the bottom of the Jinghui Canal irrigation area in the Yellow River basin, China, and it was air dried before being passed through a 1 mm sieve. Its soil organic matter content was 9.35 g·kg−1, alkali hydrolysable nitrogen content was 30.47 g·kg−1, available phosphorus content was 41.56 g·kg−1, and available potassium content was 86.41 g·kg−1. Muddy water with different sediment content was configured using the weighing method. Bio-organic fertilizer with a total nitrogen content of 1.9%, an effective phosphorus content of 1%, a potassium oxide content of 2.9%, an organic matter content of 55%, and a pH value of 7.02 was acquired from Yuanlong Biotechnology Co., Ltd., Puyang, China.

2.2. Experimental Design

Two factors of muddy water sediment concentration and fertilizer application were set in the experiment. The average horizontal sediment concentration in the Yellow River is 3.5% (mass ratio), and the maximum sediment concentration is able to achieve more than 10% [14,15]. Based on these data, four levels of muddy water sediment concentration were established, which were ρ0 (clear water), ρ1 (sediment concentration in muddy water was 4%), ρ2 (sediment concentration in muddy water was 8%), and ρ3 (sediment concentration in muddy water was 12%). In addition, there were also four levels of bio-organic fertilizer application, which were FO0 (0 kg·hm−2), FO1(2250 kg·hm−2), FO2(4500 kg·hm−2), and FO3 (6750 kg·hm−2), respectively. There was a total of 16 treatments and each treatment was repeated three times. A transparent soil column of 40 cm in height with a 10 cm inner diameter was chosen for the experiment. The screened soil sample was mixed with bio-organic fertilizer before being evenly loaded into the soil column in seven layers based on the soil bulk density of 1.45 g·cm−3, with each layer of 5 cm and a total depth of 35 cm. Each layer of soil column was tamped and beaten between layers. The inner walls of the columns were coated with Vaseline before column filling as a means of avoiding preferential flow. At the bottom of the columns, filter paper was used to prevent finer particle leakage. Following soil-loading completion, the infiltration experiment was conducted after it had stood for 24 h.
The one-dimensional constant head vertical infiltration method was used for determining soil infiltration characteristics. The infiltration device consisted of a soil column, a Mariotte bottle, and a magnetic spectroscopy stirrer (Figure 1). Mariotte bottles with an inner diameter of 8 cm and a height of 50 cm were used for supplying water to the soil columns. A ruler was used on the outer surface of the Mariotte bottle for recording the amount of water infiltration. To maintain a stable sediment content in muddy water, a Mariotte bottle, and a magnetic spectroscopy stirrer was combined to form a muddy water Mariotte bottle for infiltration. A magnetic stirrer was placed into a Martensite bottle filled with muddy water and then placed on a magnetic spectroscopy stirrer. Magnetic force rotated the stirrer inside the bottle to ensure that the muddy water was continuously stirred and to yield a stable sand sediment concentration within it. The infiltration head was 3 cm and changes in Mariotte bottled water level and wetting front with infiltration time were observed during infiltration. Following infiltration to the saturation of the soil column, the leaching solution was collected at the same time (210 min) using a beaker. The measured indicators were all of the new soil column.

2.3. Measurements and Calculations

(1) Wetting front and cumulative infiltration amount: the wetting front process was recorded using a stopwatch. Subjected to the principle of first dense and then sparse, observation times were 1 min, 2 min, 3 min, 4 min, 5 min, 6 min, 7 min, 8 min, 9 min, 10 min, 12 min, 14 min, 16 min, 18 min, 20 min, 25 min, 30 min, 35 min, 40 min, 50 min, 60 min, 80 min, and 100 min for the first 100 min and then every 30 min until the wetting front depth reached 35 cm. At the same time, the Mariotte bottle scale was recorded to indicate infiltration.
(2) Leaching solution volume: the observation times were 30 min, 45 min, 60 min, 75 min, 90 min, 105 min, 120 min, 135 min, 150 min, 165 min, 180 min, 195 min, and 210 min.
(3) Soil water evaporation: following the completion of the infiltration and leaching experiment, all soil columns were placed in an Artificial Intelligence Climate Room to measure their evaporation in a certain environment. The temperature was controlled at 30 ℃. Each soil column was weighed at 8 am each day and the Artificial Intelligence Climate Room was opened and turned off at 8 pm. The evaporation process lasted for 30 days. The daily evaporation calculation formula used for each treatment was [16]:
E = 10 M D π r 2
where E is the daily evaporation of the soil column, mm; MD is the difference between the two days before and after weighing the soil column, g; and r is the radius of the soil column, cm.
(4) Soil moisture content: immediately following evaporation, a soil drill was used to sample the wetted soil column in layers. Sampling points were spaced at a distance of 5 cm and soil water content was measured using the drying method.
(5) Conductivity: conductivity was measured by a conductivity meter (Shanghai RayMag DDSJ-307A, Shanghai, China).
(6) pH: pH was determination using the potentiometric method [17].
(7) Total dissolved solids (TDS): TDS were determined using a TDS pen (Shenzhen Lishan Electronic Technology Co., Ltd., Shenzhen, China).

2.4. Evaluation Models and Indicators

1. The Kostiakov model, Philip model, and Horton model were used for fitting the trend of infiltration rate and infiltration time.
(1) Kostiakov model
i = K t α
where i is the infiltration rate (cm·min−1); t is the infiltration time (min); K is the fitting index; and α is an empirical index that reflects the attenuation rate of soil infiltration capacity.
(2) Philip model:
i = S t 0.5
where i is the infiltration rate (cm·min−1); t is the infiltration time (min); and S is the soil permeability (cm·min−0.5).
(3) Horton model:
i = i f + ( i 0 i f ) e g t
where i is the infiltration rate (cm·min−1); t is the infiltration time (min); if is the steady state infiltration rate (cm·min−1); i0 is the initial infiltration rate (cm·min−1); and g is the model parameter.
2. The uniformity coefficient of soil moisture content is calculated via the Christensen formula [18]:
C u = ( 1 i = 1 n θ i θ v n × θ v ) × 100 %
where Cu is the soil water distribution uniformity coefficient (%); θv is the average water content of the soil layer (%); θi is the water content of the ith sampling point (%); and n is the number of sampling points.
3. The Black and Rose evaporation models were used for fitting the trend of cumulative evaporation and time [19].
(1) Black model:
E = a t 0.5 + b
(2) Rose model:
E = c t 0.5 + d t
where E is the cumulative evaporation, mm; t is the evaporation time, d; a, b is the evaporation parameter; c is the stable evaporation parameter; and d is the water diffusion parameter.

2.5. Data Statistics and Analysis

Data processing was completed using Excel 2016 software, SPSS.25 software was used for data fitting and analysis, and origin.2021 and Auto CAD 2016 were used for drawing.
Using the determination coefficients (R2) and root mean square error (RMSE) as the model evaluation index, the formula is:
R 2 = i = 1 n ( M i s i ¯ ) 2 i = 1 n ( S i S i ¯ ) 2
R M S E = 1 n i = 1 n ( S i M ) 2
where n is the number of data; Si is the measured value; and M is the calculated value of the model.

3. Results

3.1. Wetting Front

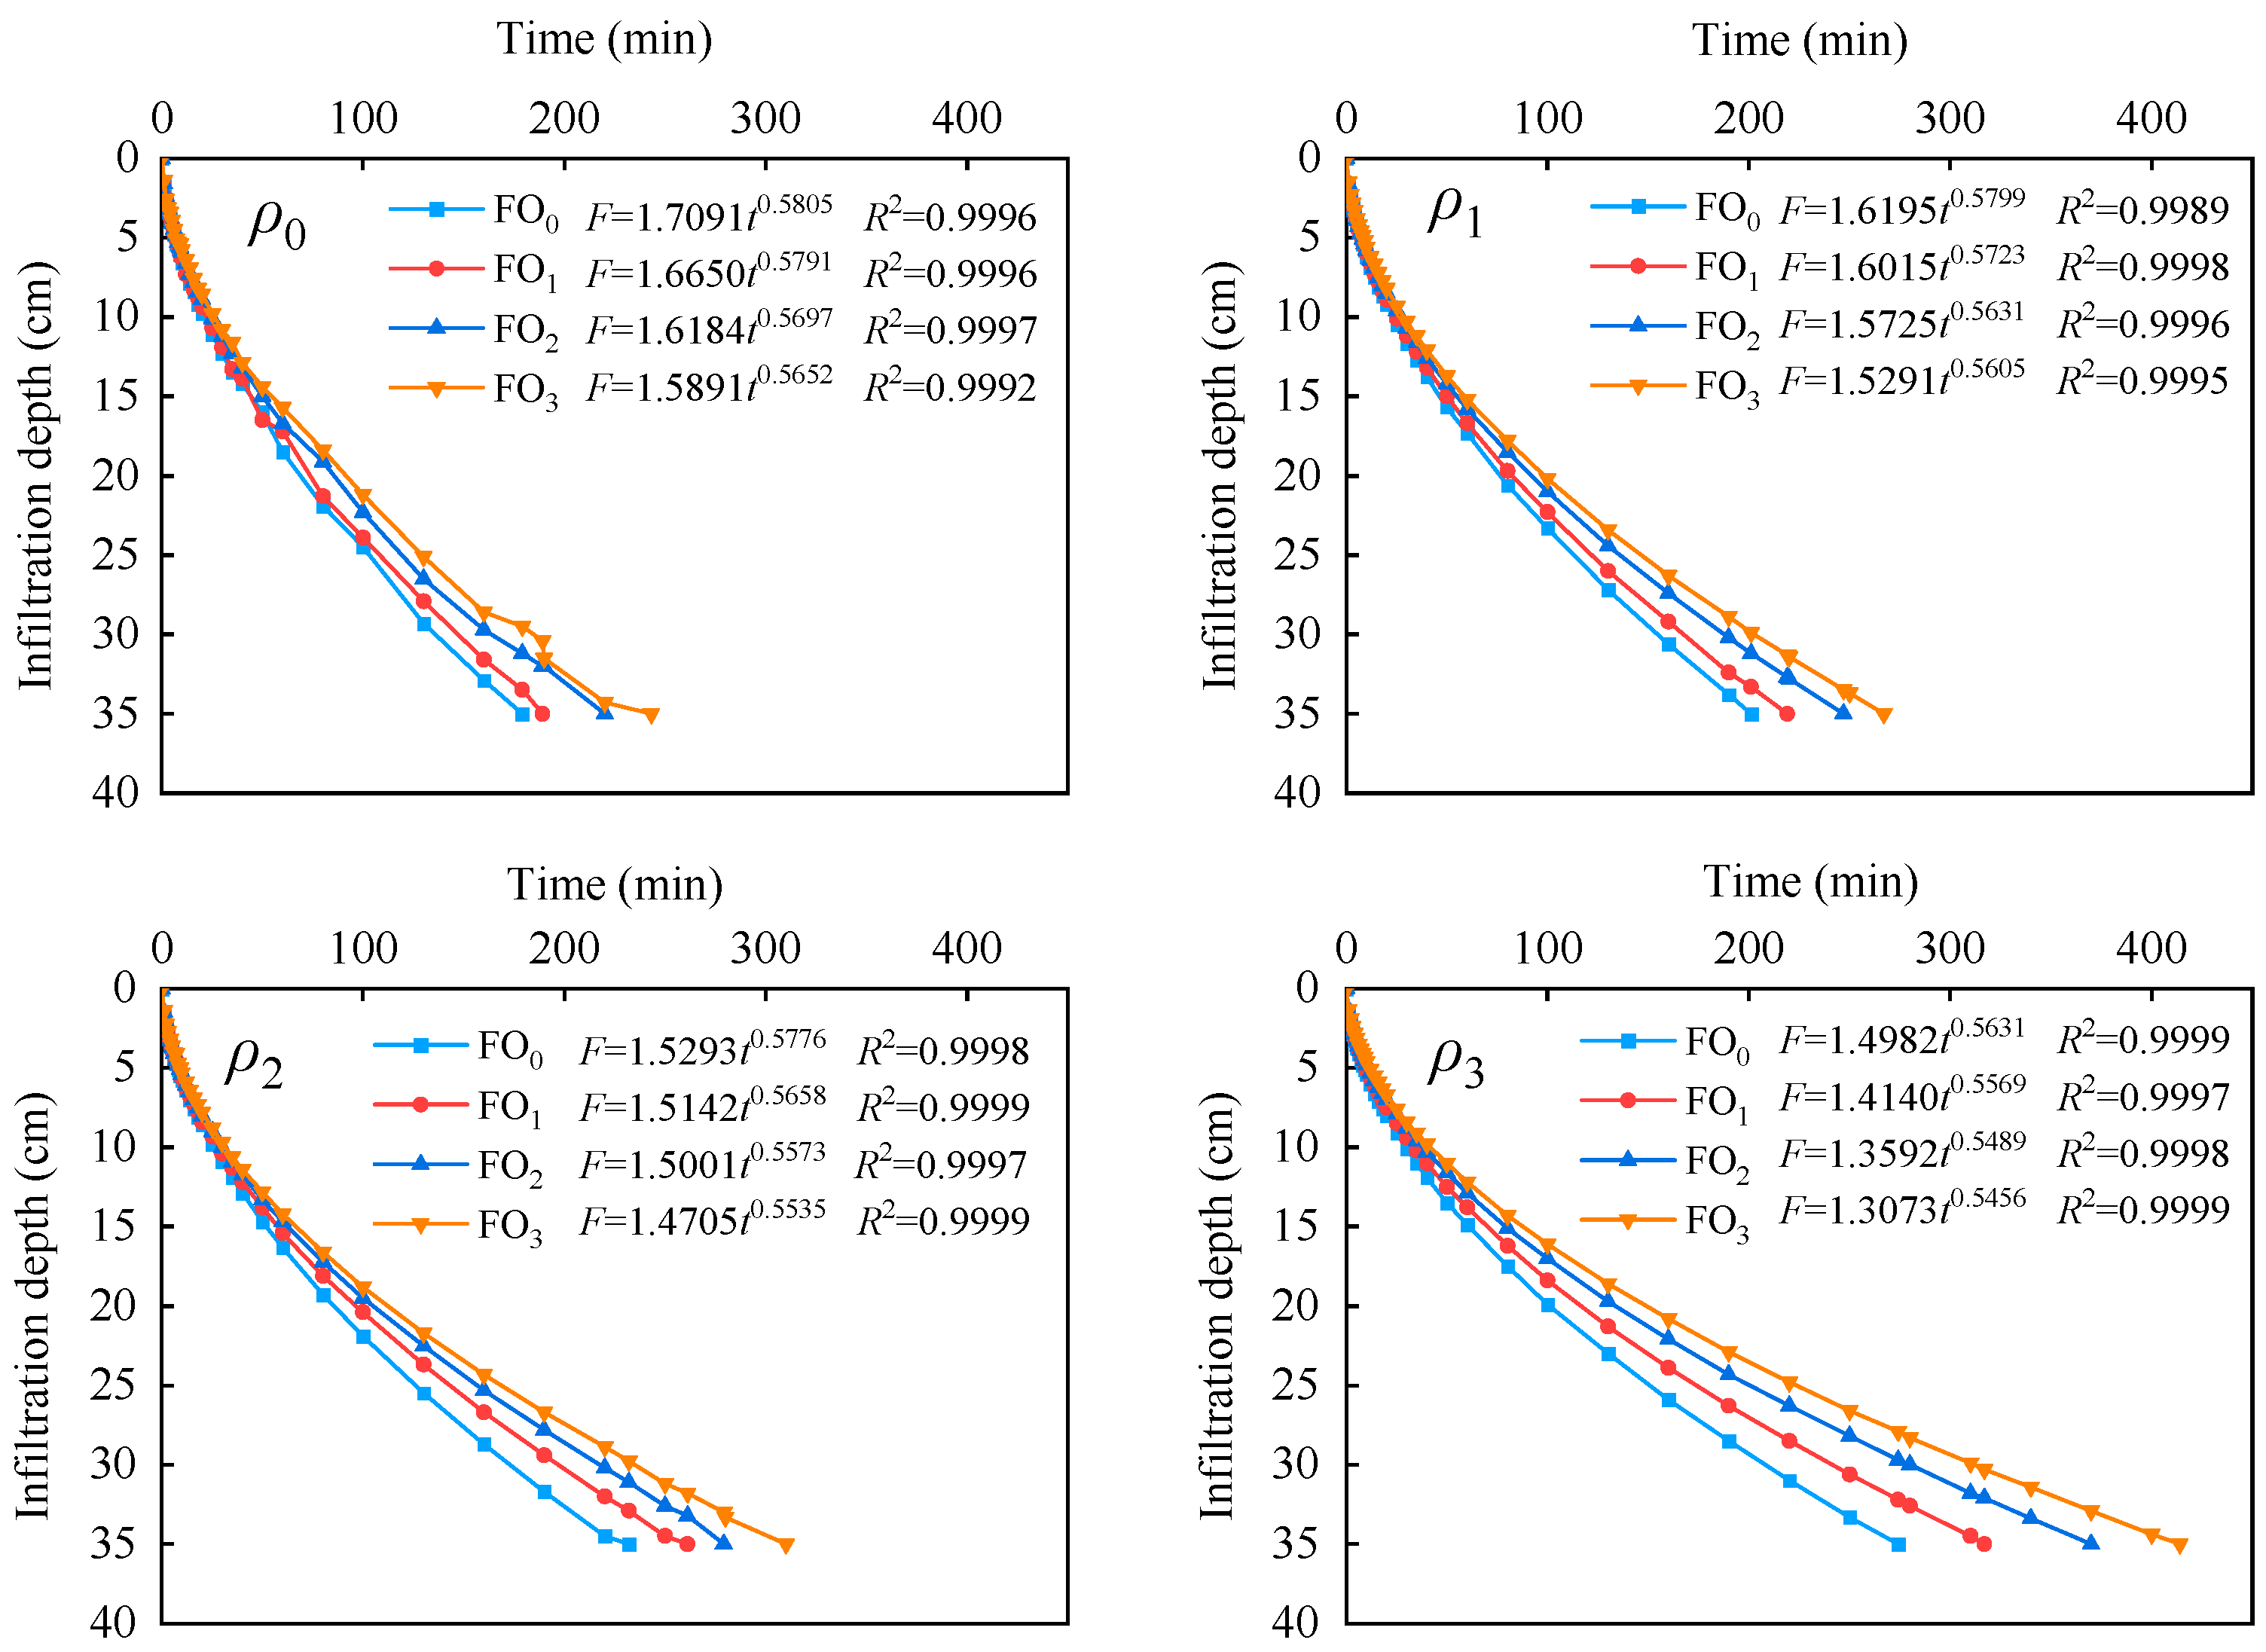
Wetting front was an obvious dry–wet junction front that was found at the lower edge of the wetting layer during water infiltration. It was able to characterize the movement characteristics of water under the action of soil matrix suction and gravity. As Figure 2 showed, the one-dimensional vertical movement of the wetting front gradually increased with infiltration time for each treatment in the experiment, but there were variations in the time that was taken to reach the bottom of the soil column. In comparison to the infiltration time of ρ0, ρ1, ρ2, and ρ3 increased by 9.88–15.87%, 26.82–38.10%, and 53.07–70.37%, respectively. This demonstrated that the muddy water sediment concentration had a significant impact on the transport speed of the wetting front, and as the sediment concentration level increased, the transport speed of the wetting front became slower, compared to the infiltration times of FO0, FO1, FO2, and FO3, which increased by 8.96–15.69%, 20.26–35.04%, and 32.84–51.09%, respectively.
Fitting the relationship between wetting depth F (cm) and infiltration time t (min) shows that it conforms to a power function:
F = A t B
where A is the advancing distance of the wet front after the first timing unit and B is the attenuation degree of wetting front process [20].
The results shown in Figure 2 demonstrated that the determination coefficients R2 of the simulation results were all greater than 0.99, p < 0.01, which indicated that this power function better simulated the wetting depth front variation law in muddy water irrigation and bio-organic fertilizer conditions. Coefficient A decreased as bio-organic fertilizer and muddy water sediment concentration increased, which was mainly because muddy water irrigation and the addition of bio-organic fertilizer slowed down the initial water infiltration rate to varying degrees. Power index B did not change significantly as muddy water sediment concentration and bio-organic fertilizer level increased.

3.2. Cumulative Infiltration

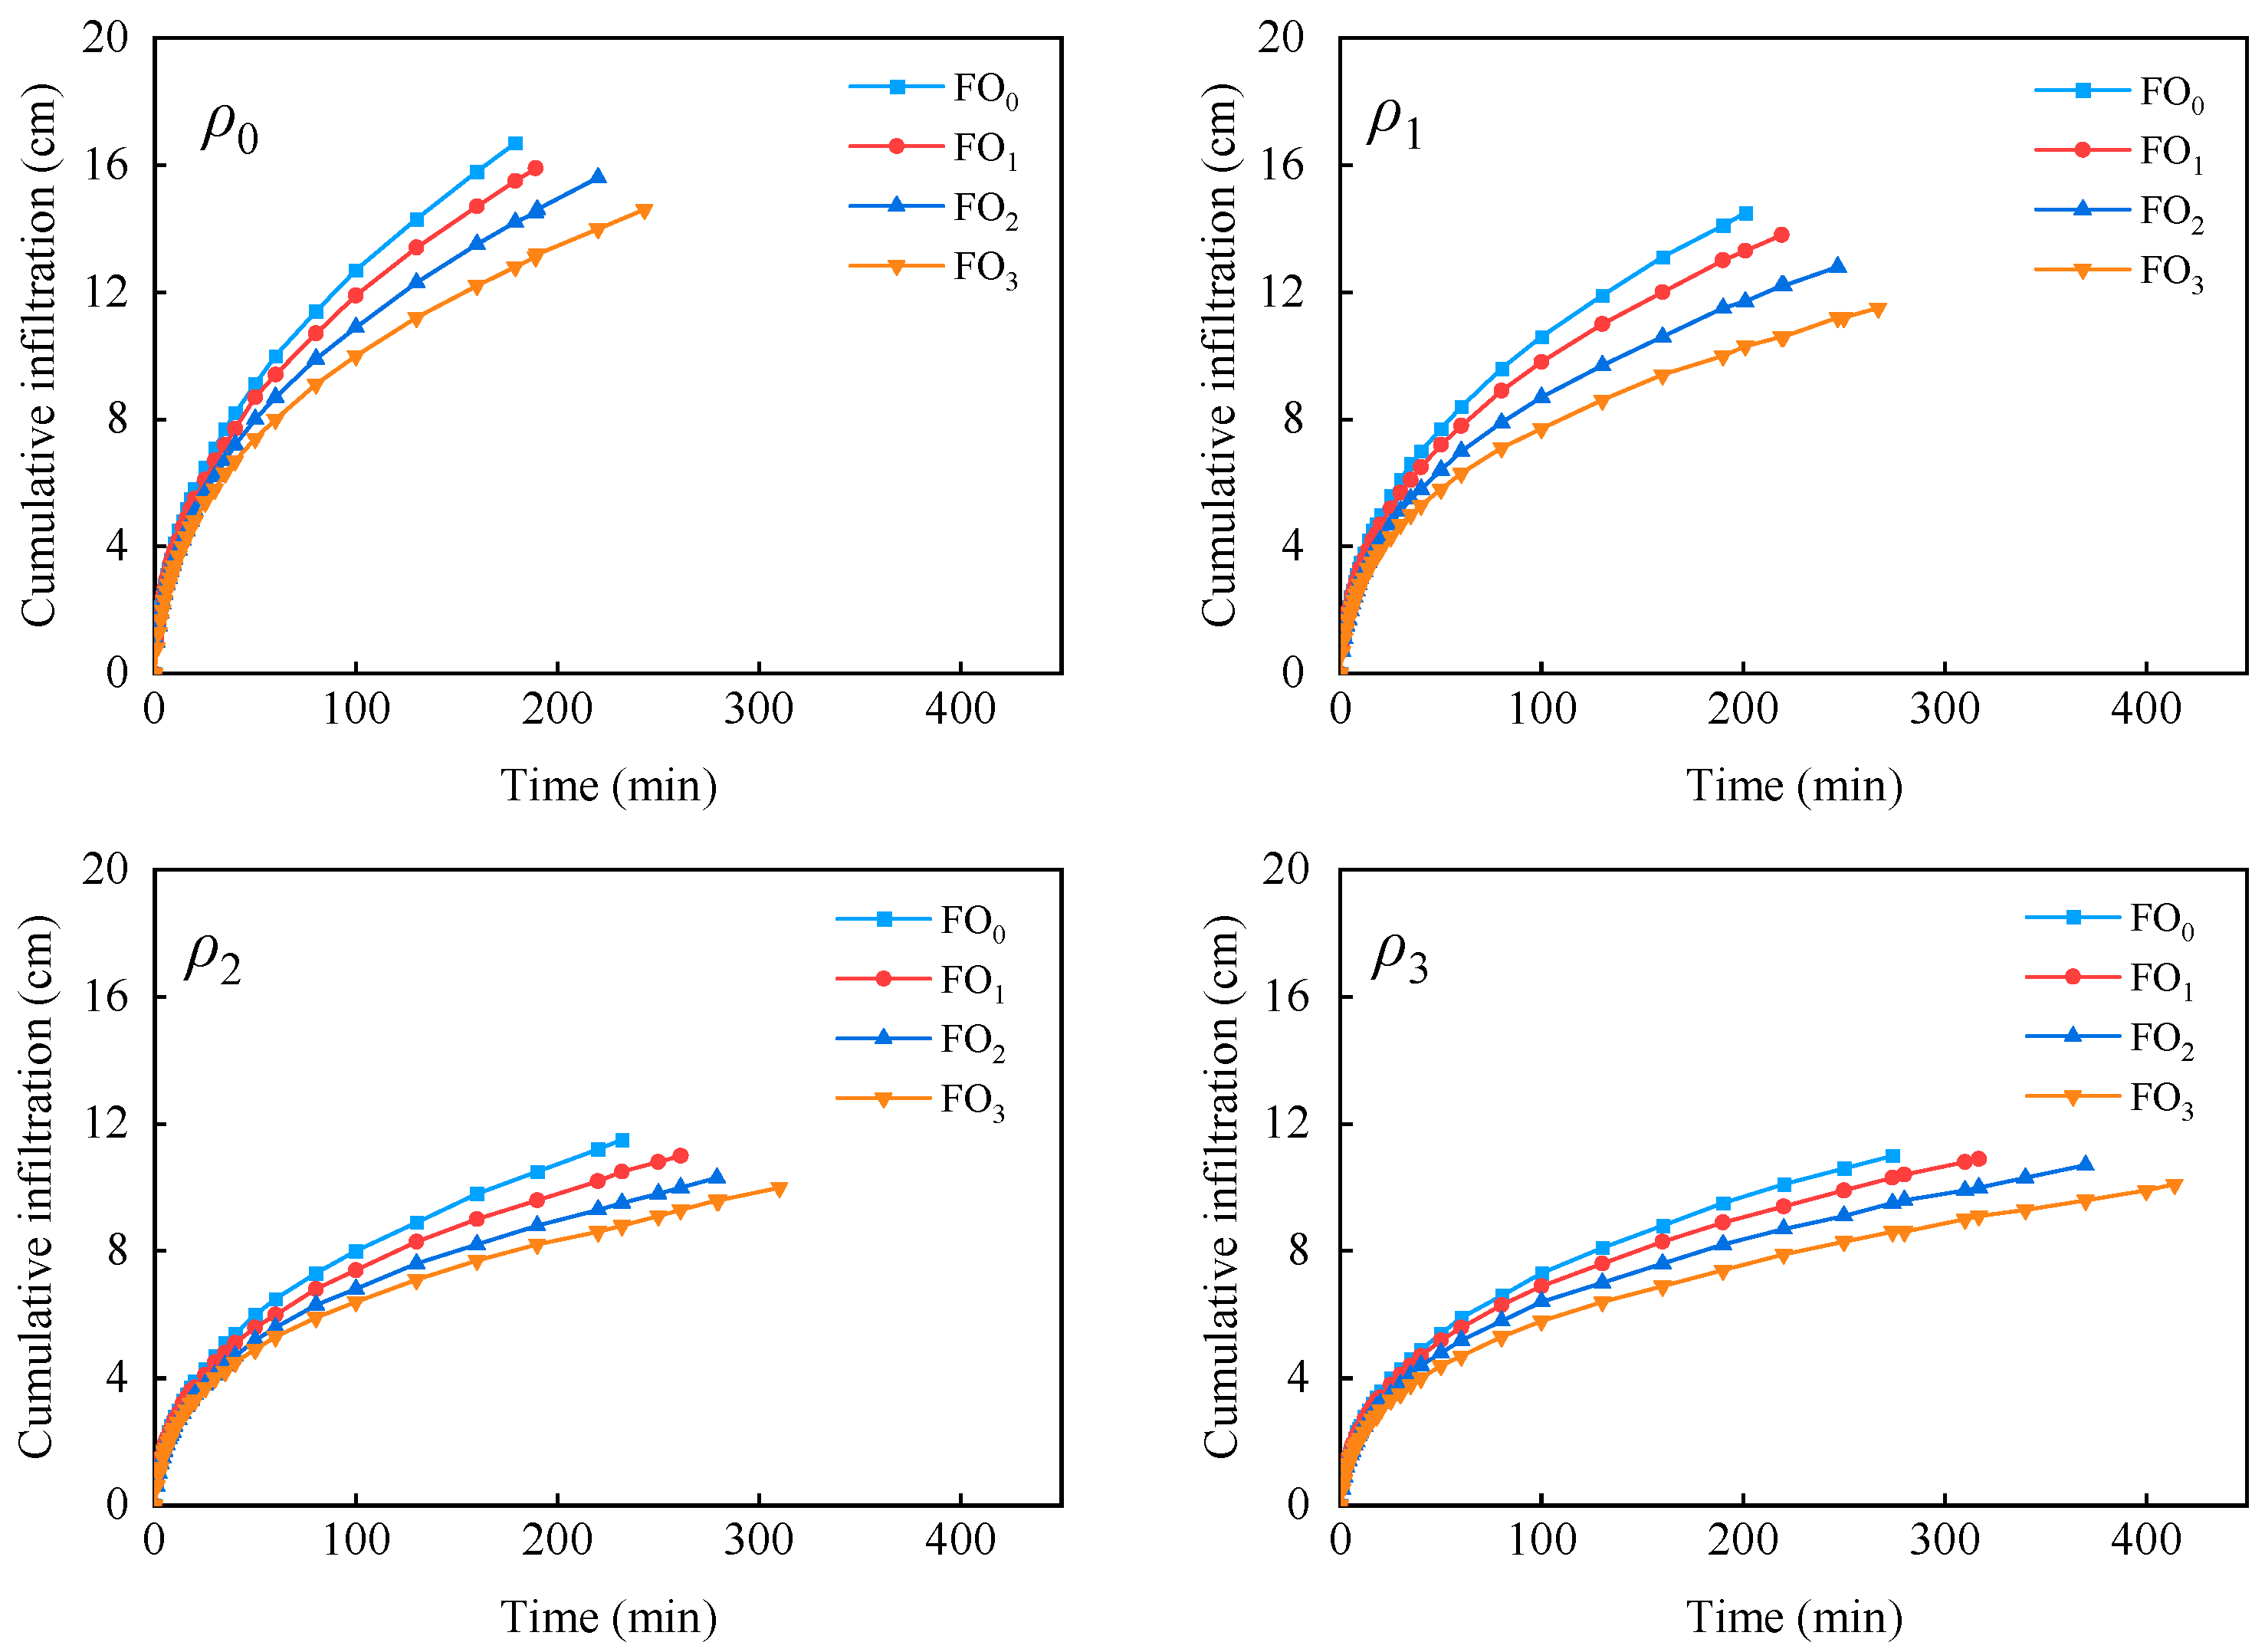
Once the soil infiltration process achieves stability, the stable infiltration rate can be used for characterizing soil infiltration ability. However, before stable infiltration is reached, the cumulative infiltration amount is commonly used for characterizing soil infiltration ability. The cumulative infiltration amount is reflected by the variations in water level in the Mariotte bottle during the infiltration process. Figure 3 showed that the cumulative infiltration amount of all treatments increased with time, but this gradually slowed down. During the initial stage of infiltration, no significant difference in cumulative infiltration amount was observed between the treatments, but with the extension of time, the impact each treatment had on the cumulative infiltration amount started to emerge. When infiltrating to the bottom of the soil column, the cumulative infiltration amounts of FO0, FO1, FO2, and FO3 decreased by 0.91–4.83%, 2.73–11.72%, and 8.18–20.69%, respectively, and those of ρ0, ρ1, ρ2, and ρ3 decreased by 13.17–21.23%, 31.14–33.97%, and 30.82–34.13%, respectively.

3.3. Infiltration Rate and Parameters

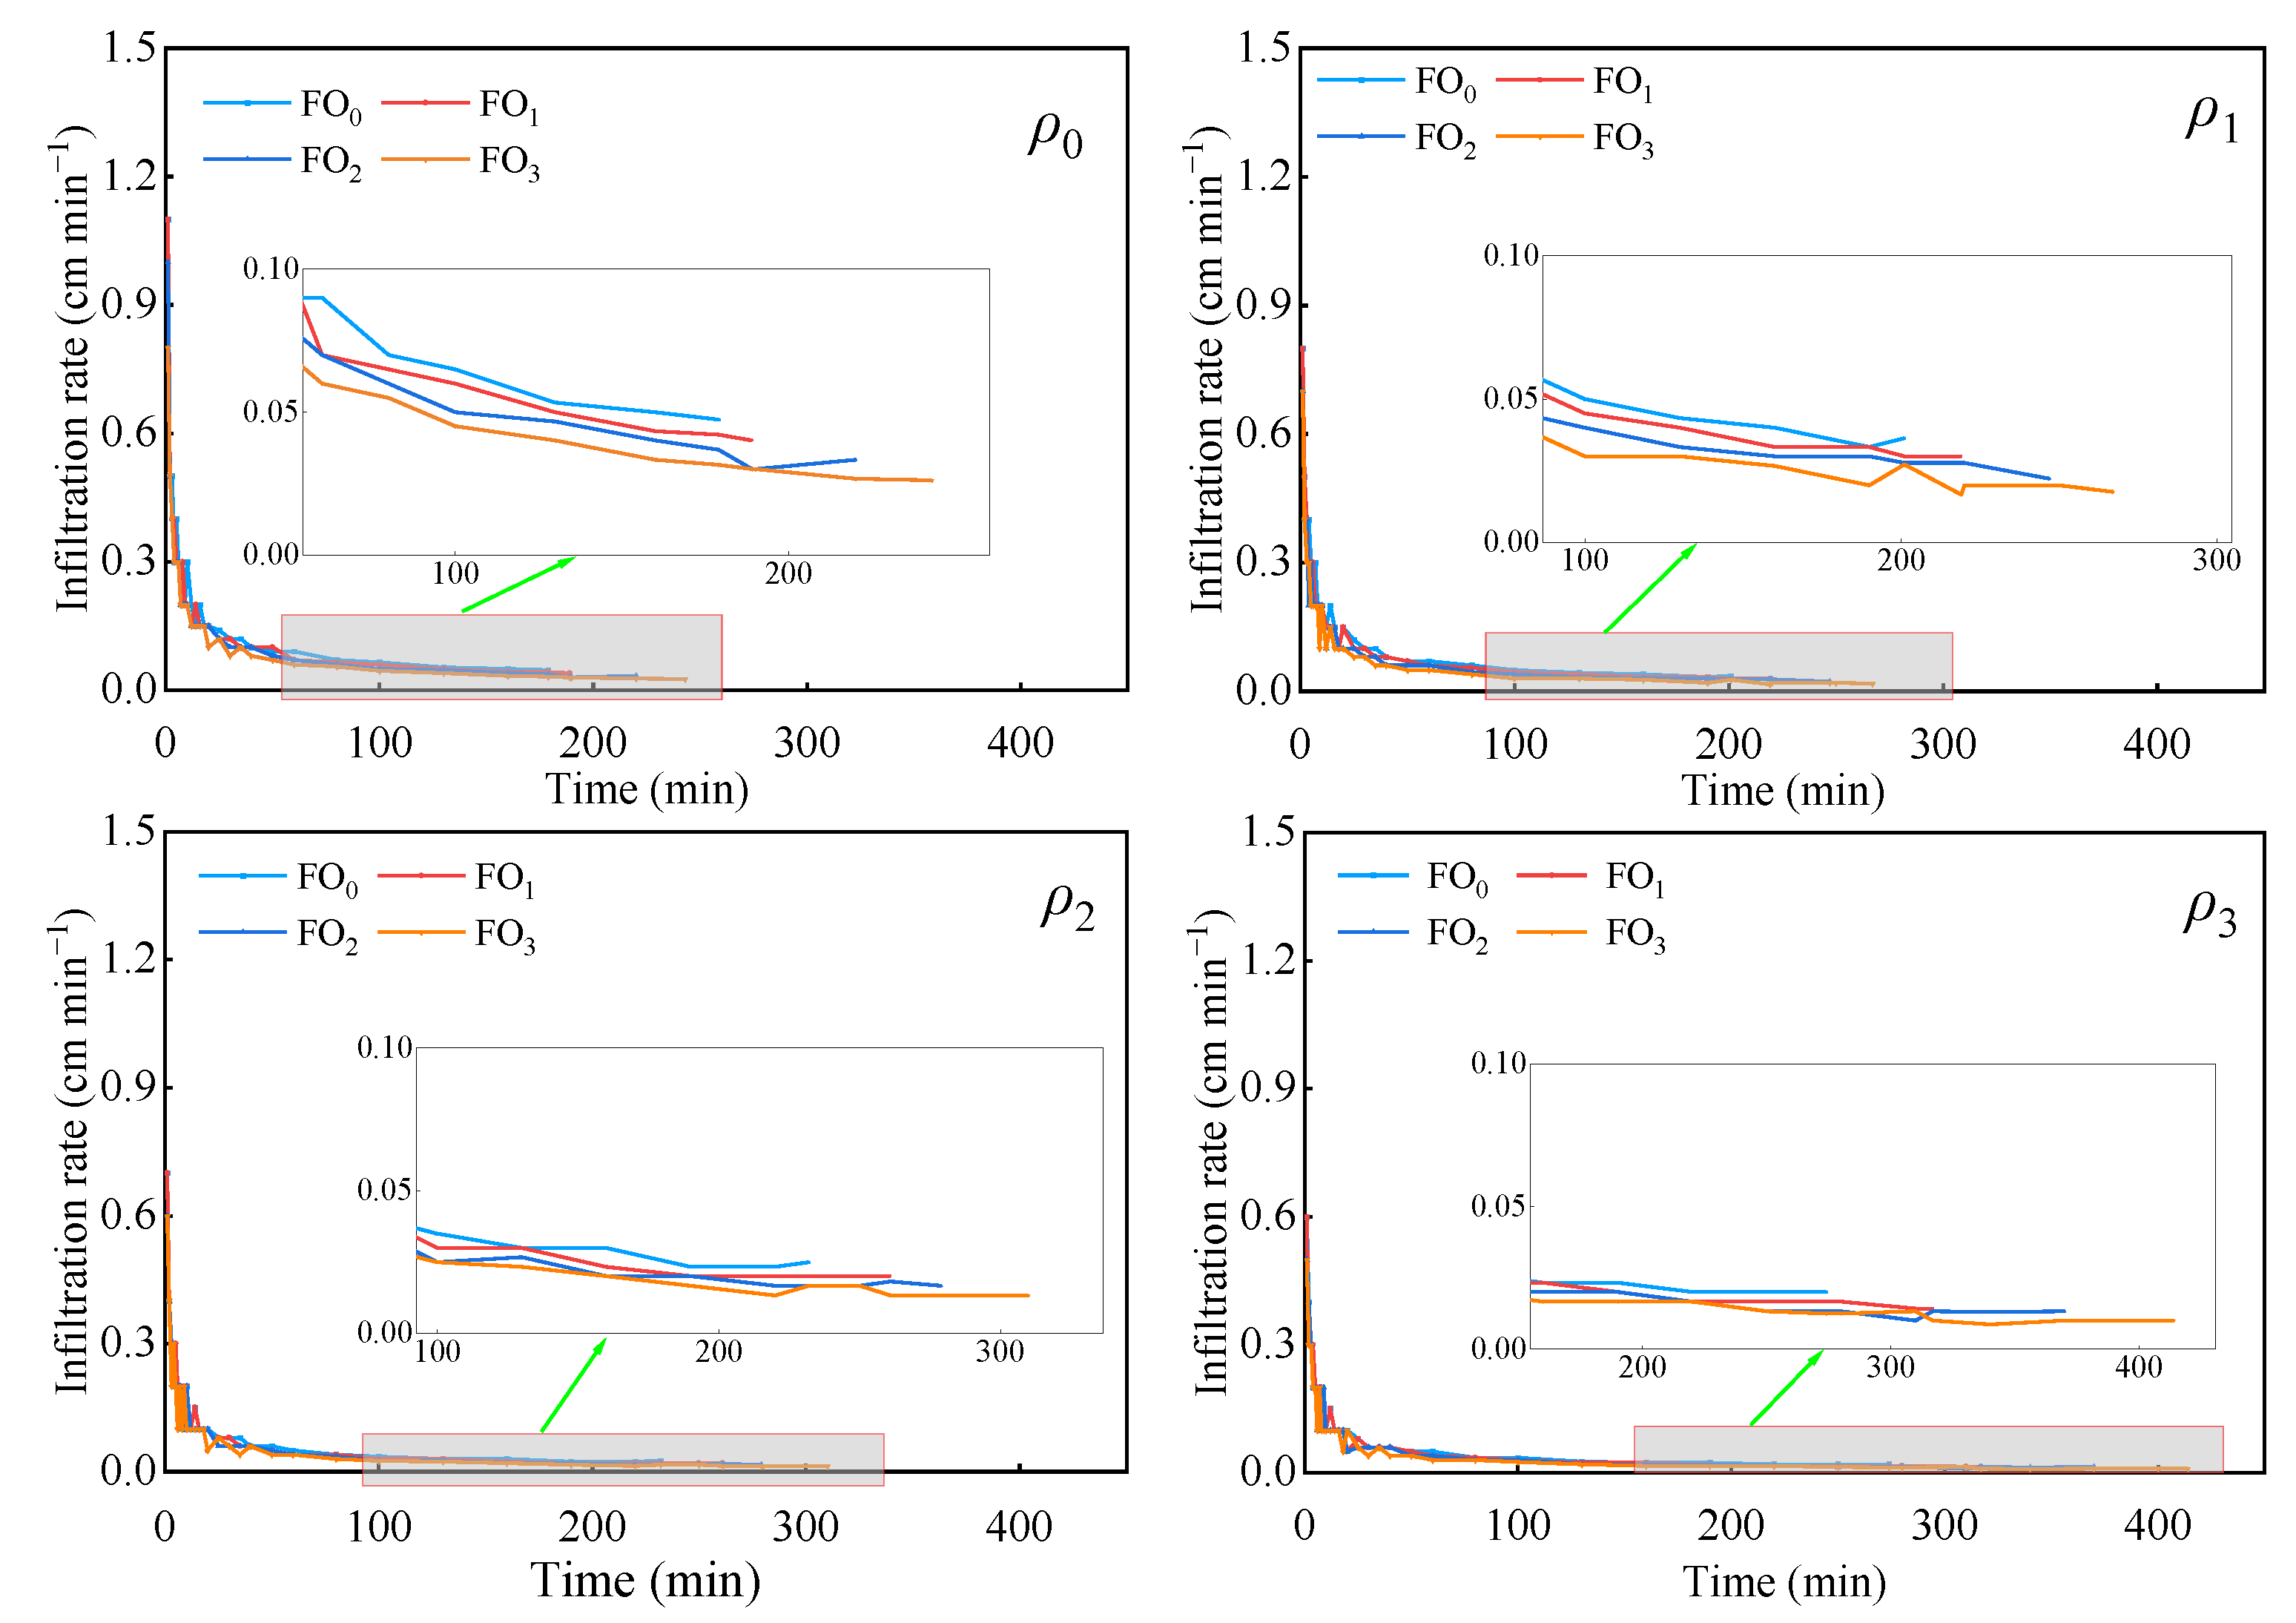
Figure 4 showed that the change rule of infiltration rate with time was basically consistent in each treatment, showing an “L” shape. During the initial infiltration stage (0–10 min), under the dual influence of soil matrix potential and gravity potential, water infiltration was fairly rapid. During the relatively stable stage (10~80 min), the soil matrix potential continued to weaken as infiltration continued. Water infiltration was mainly affected by gravity, and the infiltration rate decreased. During the stable stage of infiltration (after 80 min), the soil matrix potential gradually decreased to zero, and the infiltration rate gradually stabilized. At this time, only gravity influenced water infiltration. At the same bio-organic fertilizer level, the infiltration rate of clean water was greater than that of muddy water, and as muddy water sediment concentration increased, infiltration rate decreased. The application of bio-organic fertilizer could significantly reduce the infiltration rate of soil water. This indicates that bio-organic fertilizer application could effectively slow down the movement speed of water in the soil while also prolonging the retention time of water in the soil.
Table 1 depicted the dynamic characteristics of infiltration rate and time changes fitted by the Kostiakov model, Philip model, and Horton model. The determination coefficient (R2) for fitting the relationship between infiltration rate and time using Kostiakov was between 0.9346 and 0.9918. The infiltration coefficient K value of the Kostiakov model was between 0.4806 and 0.8362, and the empirical index α was between 0.5640 and 0.6430. A higher K value resulted in the maximum initial infiltration rate. As muddy water sediment concentration and bio-organic fertilizer level both increased, the initial infiltration rate decreased. The larger α value, the greater the slope of the soil infiltration curve, and the faster the instantaneous infiltration rate would decay. As sand content and fertilization amount increased, α enlarged. The S value of the Philip model ranged between 0.421 and 0.836, with the R2 value between 0.883 and 0.955. With the increase in muddy water sediment concentration and bio-organic fertilizer level, the S value gradually decreased, indicating that muddy water irrigation and bio-organic fertilizer had the effect of reducing infiltration. The parameter g of the Horton model determines, to some extent, the rate at which the infiltration rate decreased from the initial infiltration rate to a stable rate. The g value of Horton model ranged from 0.164 to 0.250, with R2 between 0.818 and 0.899.
Based on the R2 values for the three infiltration models, the Kostiakov model, Philip model, and Horton model could all describe the relationship between infiltration rate and time under the conditions of bio-organic fertilizer and muddy water irrigation. The smaller the root-mean-square error (RMSE), the better the model quality and the more accurate the prediction. From Table 1, it could be observed that the RMSE values of the three models followed a descending order: the Kostiakov model, the Philip model, and the Horton model. The Kostiakov model was more capable of describing the relationship between infiltration rate and time under the condition of bio-organic fertilizer and muddy water irrigation, while the Horton model yields the least satisfactory simulation results.

3.4. Infiltration Reduction Rate

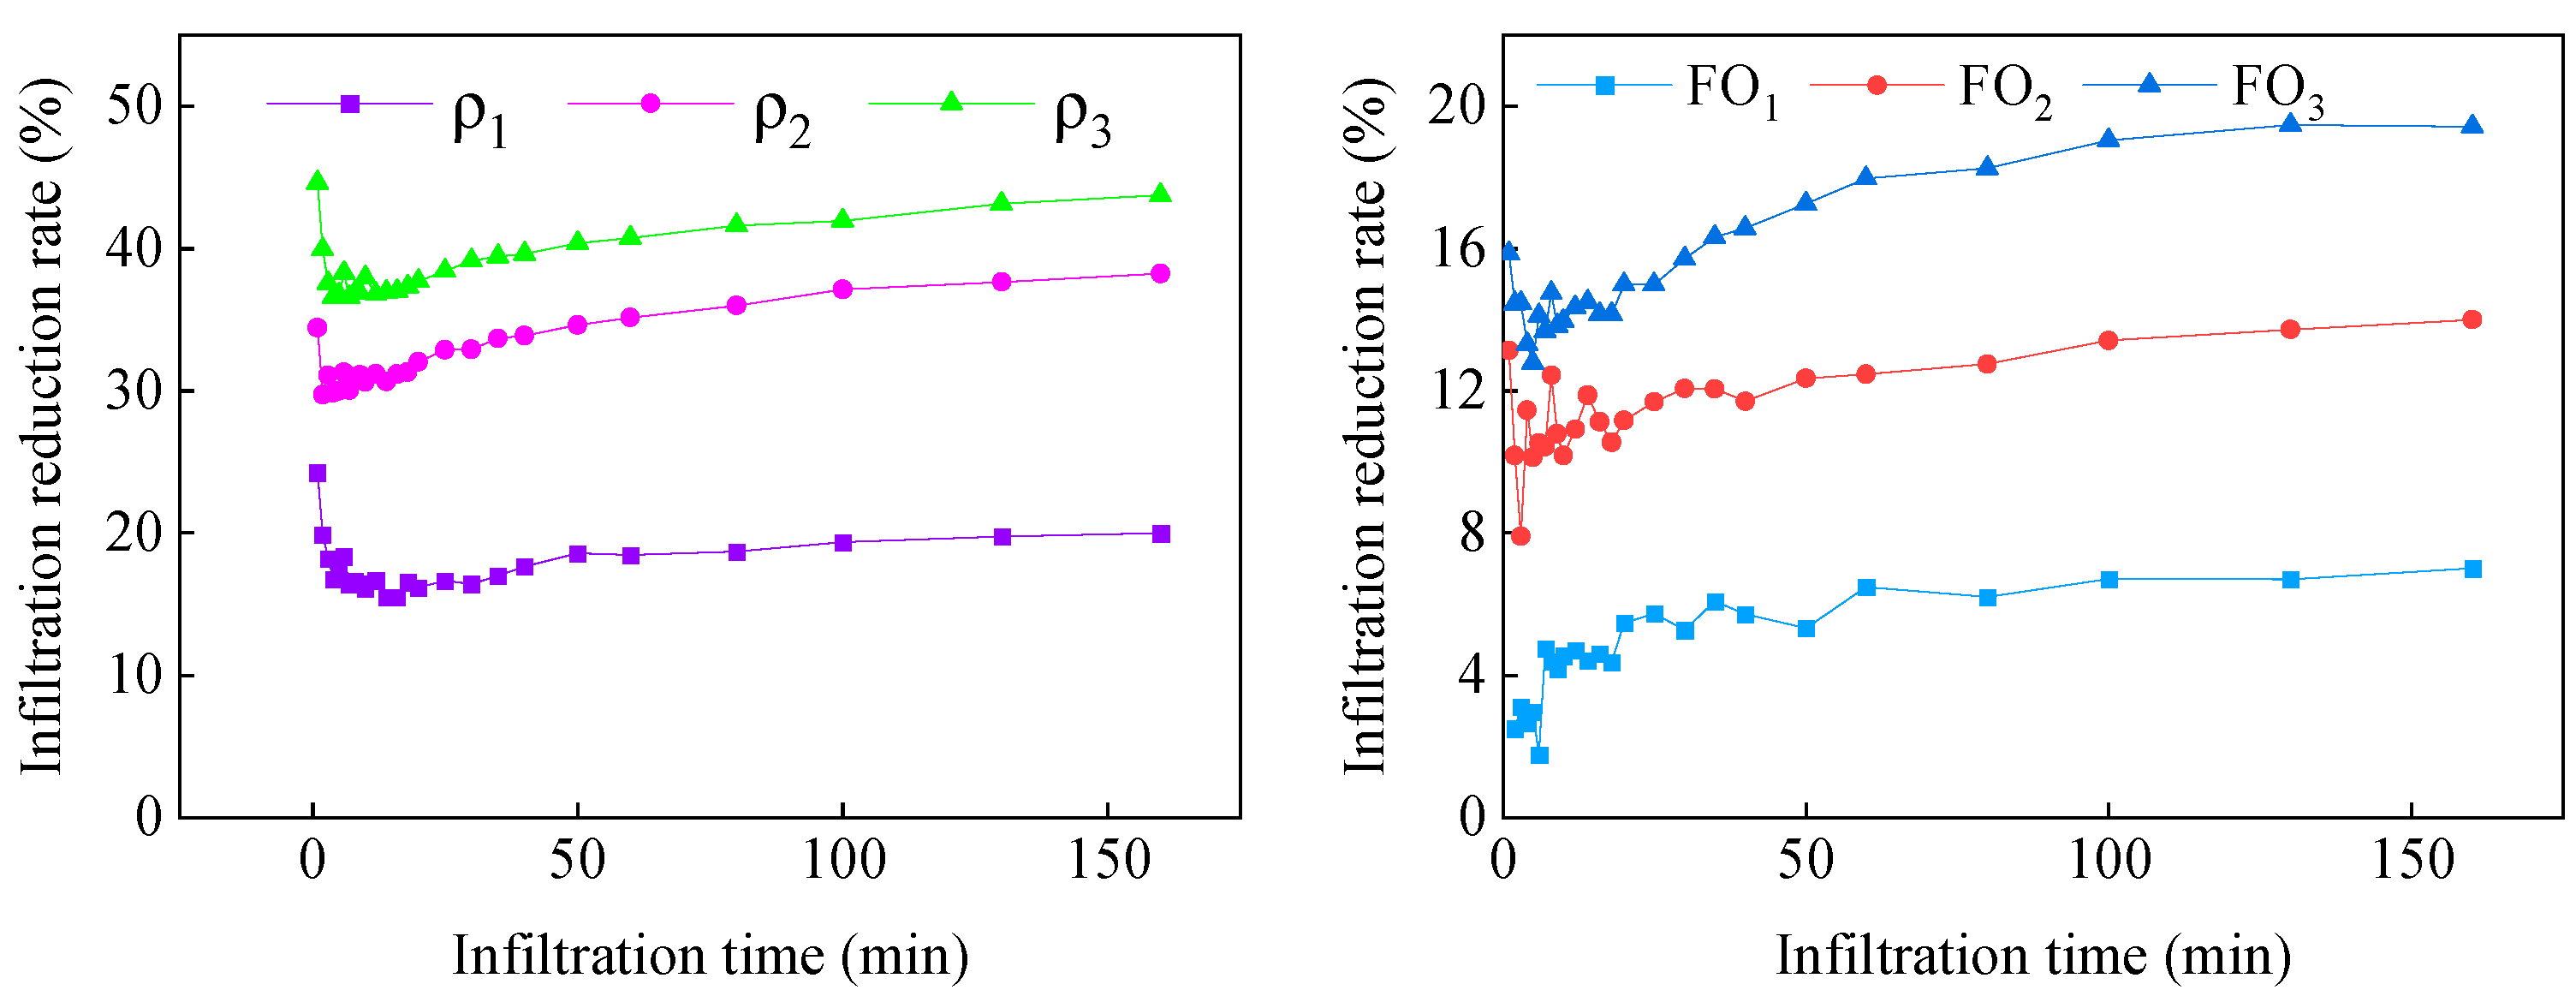
Directly comparing cumulative infiltration amount or infiltration model parameters alone was insufficient for reflecting the influence of muddy water sediment concentration and bio-organic fertilizer on infiltration. Thus, the infiltration reduction rate was defined in order to express the reduction effect of muddy water sediment concentration and bio-organic fertilizer on one-dimensional vertical free infiltration. Using clear water and no fertilization as controls, the infiltration reduction rate was determined [21]:
η = ( I 0 I t ) / I 0 × 100 %
where η is the infiltration reduction rate,%; I0 is the cumulative infiltration amount of clean water or no fertilization, cm; and It is the cumulative infiltration amount of muddy water sediment concentration or bio-organic fertilizer, cm.
Figure 5 clearly demonstrated significant differences in the infiltration reduction rates (η), corresponding to different muddy water sediment concentration and bio-organic fertilizer levels. The η became stronger as the muddy water sediment concentration and bio-organic fertilizer level increased. Muddy water irrigation rapidly decreased the η in the early stage of infiltration (t ≤ 10 min), followed by a slight increase. After 50 min of infiltration, the η stabilized. For an infiltration time of 160 min, compared to the η of ρ1, ρ2 increased by 91.39% and ρ3 increased by 119.04%. The η of bio-organic fertilizer applied changed gradually with increasing infiltration time. The permeability reduction rate gradually increased before 50 min and then stabilized. Furthermore, as depicted in Figure 5, the η under muddy water irrigation was significantly higher than that under bio-organic fertilizer conditions.

3.5. Soil Water Evaporation

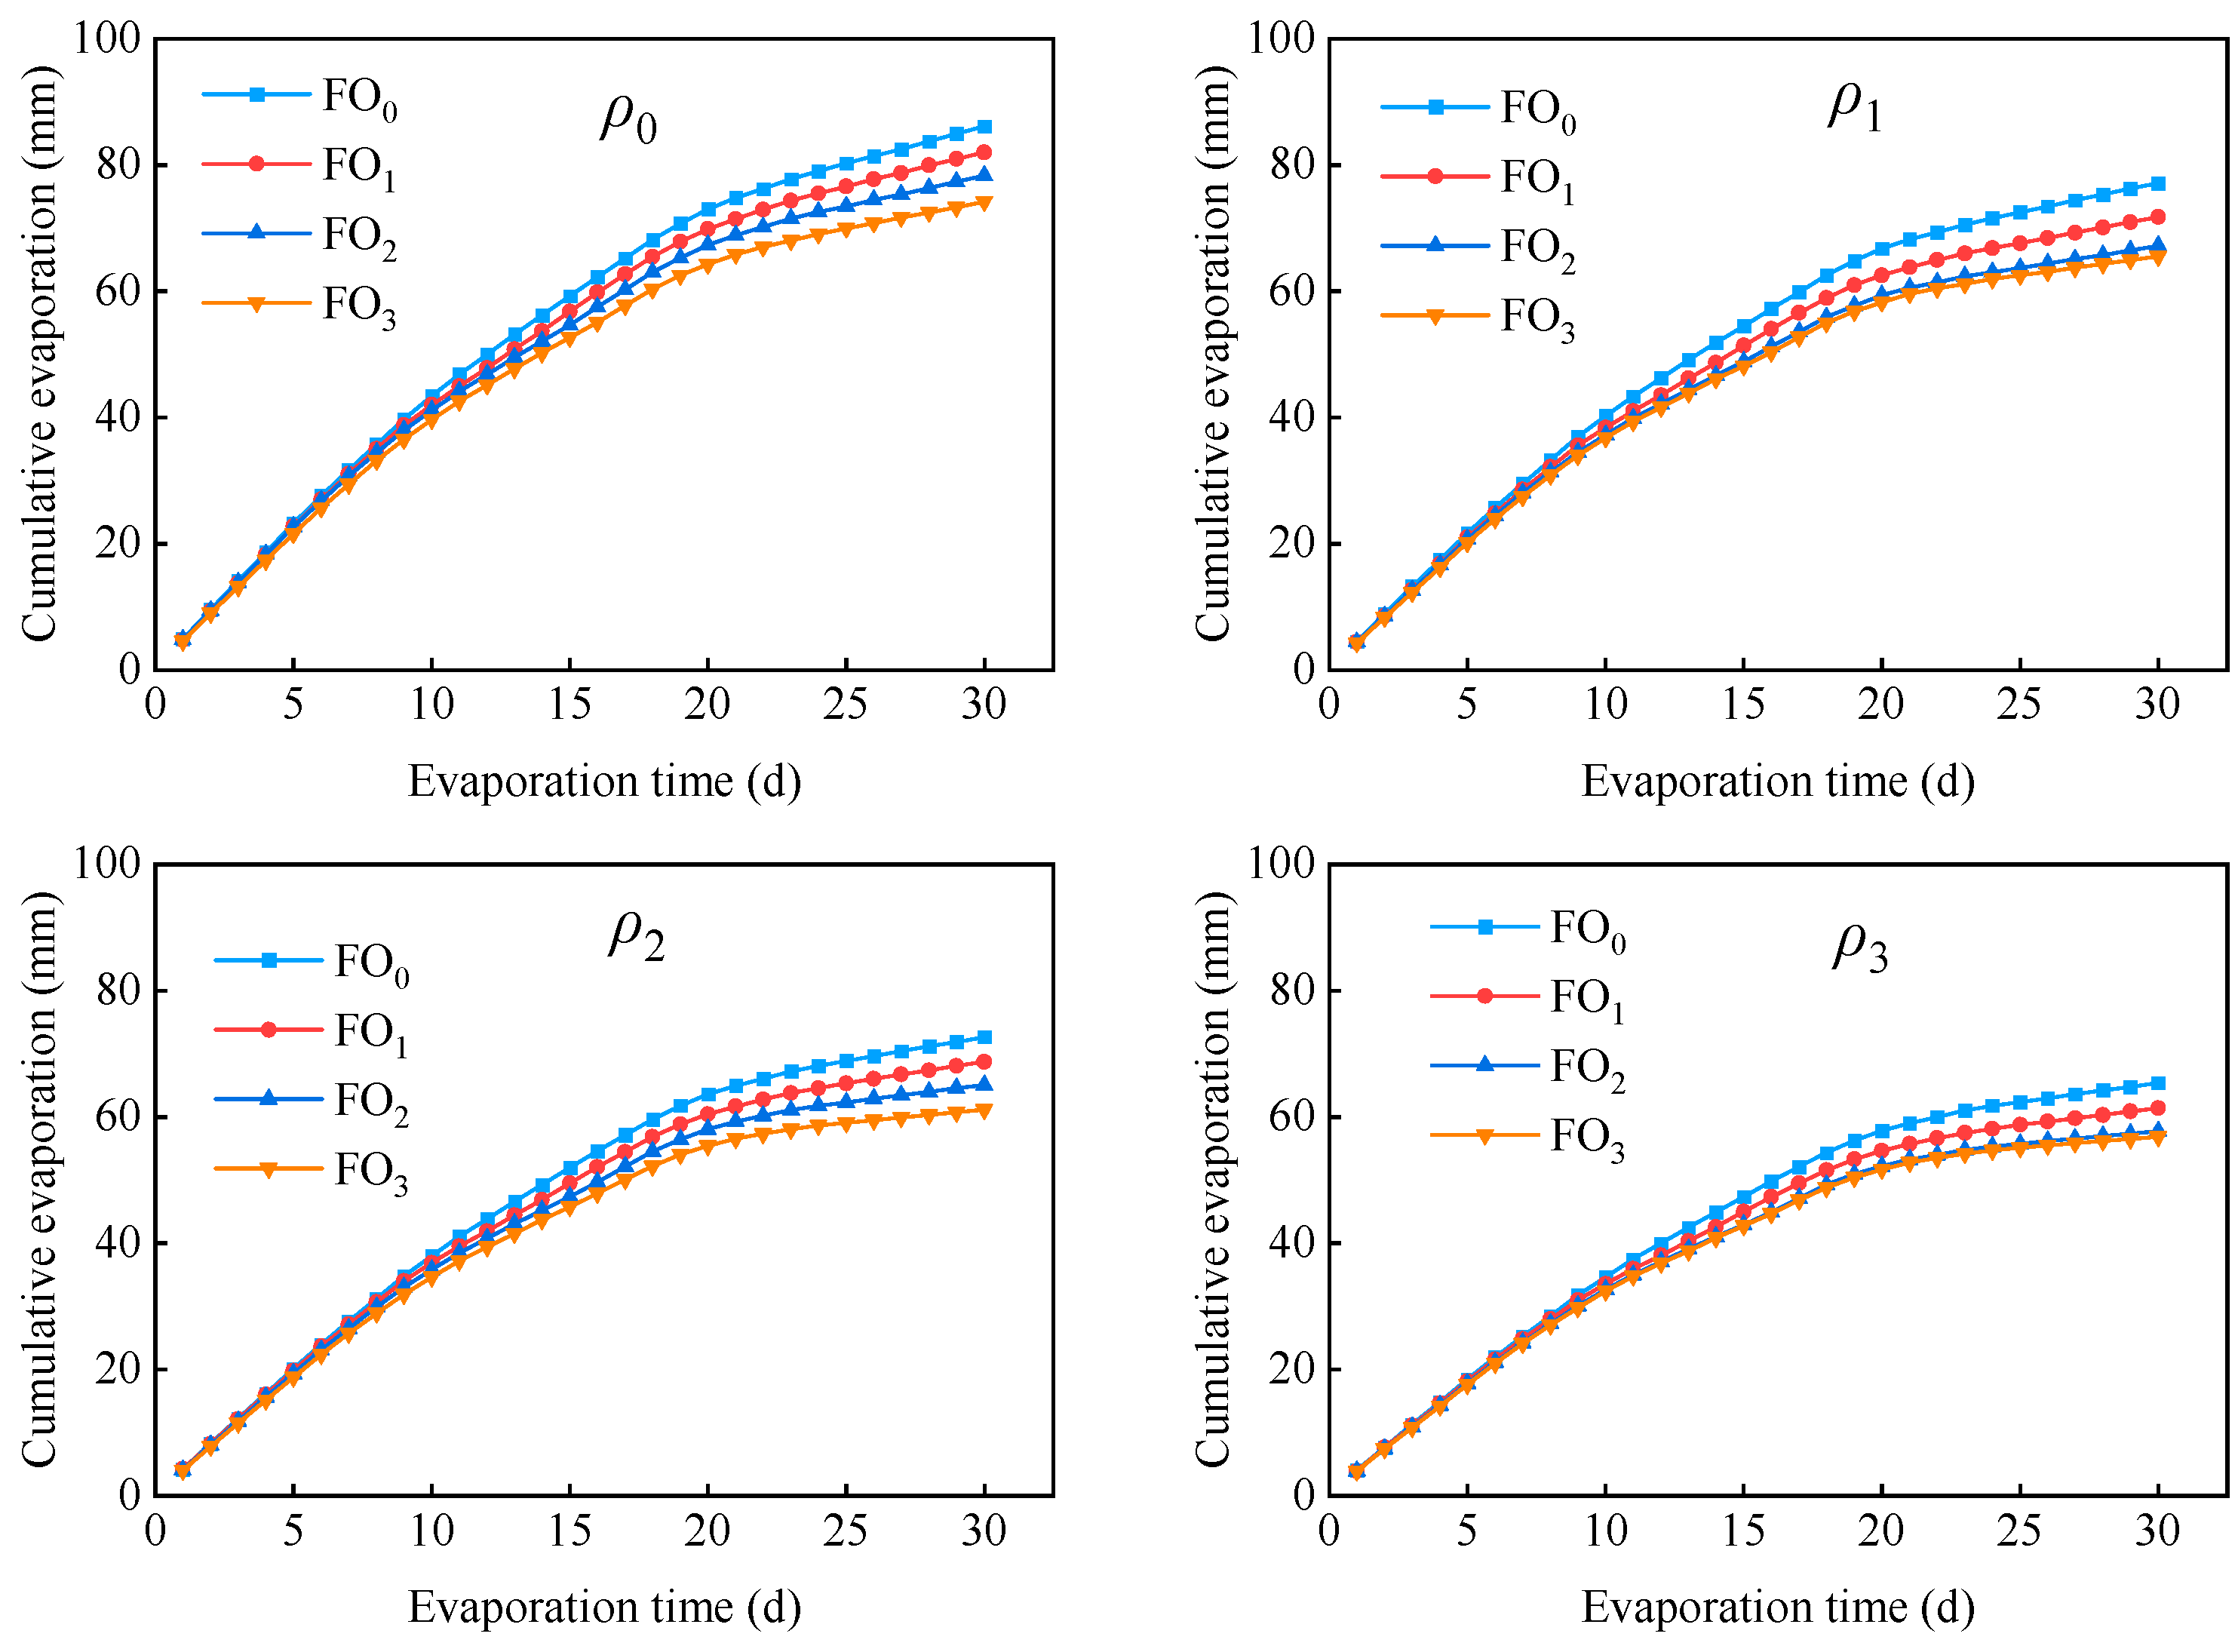
Water movement during irrigation was able to alter the soil surface structure and therefore impact soil evaporation. The relationship between cumulative evaporation and time under different treatments is shown in Figure 6. In comparison to clean water infiltration, the cumulative evaporation amount of muddy water infiltration decreased, and the cumulative evaporation amount decreased as muddy water sediment concentration increased. In comparison to ρ0, the cumulative evaporation of ρ1, ρ2, and ρ3 decreased by 10.44–14.19%, 15.62–17.58%, and 23.36–26.24%, respectively. As the bio-organic fertilizer level increased, cumulative evaporation decreased. FO0, FO1, FO2, and FO3 reduced cumulative evaporation by 4.76–6.94%, 9.03–12.85%, and 13.04–15.83%, respectively.
Black and Rose evaporation models were used for fitting the cumulative evaporation amount and time. The fitting results can be seen in Table 2. From the simulation of the Black and Rose models, it was found that the two different models were able to fit the relationship between cumulative evaporation and time well. The determination coefficient R2 was greater than 0.96, and the corresponding minimum R2 were 0.9820 and 0.9650, respectively. As the muddy water sediment concentration increased, parameters F of the Black model and C and D of the Rose model decreased, while parameter B of the Black model increased. As bio-organic fertilizer level increased, parameter F of the Black model and parameter D of the Rose model decreased, while parameter B of the Black model increased and parameter C of the Rose model did not change significantly. In addition, the RMSE of the Black evaporation model was found to be smaller than that of the Rose model, meaning that the Black evaporation model had better simulation accuracy for soil evaporation using bio-organic fertilizer in muddy water infiltration conditions.

3.6. Soil Moisture Content

Due to the different effects that muddy water irrigation and bio-organic fertilizer addition have on soil water infiltration and evaporation characteristics, significant differences were observed in terms of soil water content when different treatments were used. Figure 7 showed the relationship between soil profile and soil water content following evaporation for each treatment. As shown in the figure, the soil moisture content showed an increasing trend with the increase in soil depth. As muddy water sediment concentration increased, soil water content decreased. In comparison to ρ0, the average water content of ρ1, ρ2, and ρ3 decreased by 3.34–4.37%, 5.23–6.00%, 7.11–8.03%, respectively, while conductivity increased by 12.41–24.27%, 17.07–33.04%, and 26.85–49.26%, respectively. The organic matter increase was not significant and was within 3%. As bio-organic fertilizer level increased, soil water content also increased but not significantly. The increase in bio-organic fertilizer level from FO0 to FO3 resulted in only a 4.00–4.86% increase in soil moisture content.
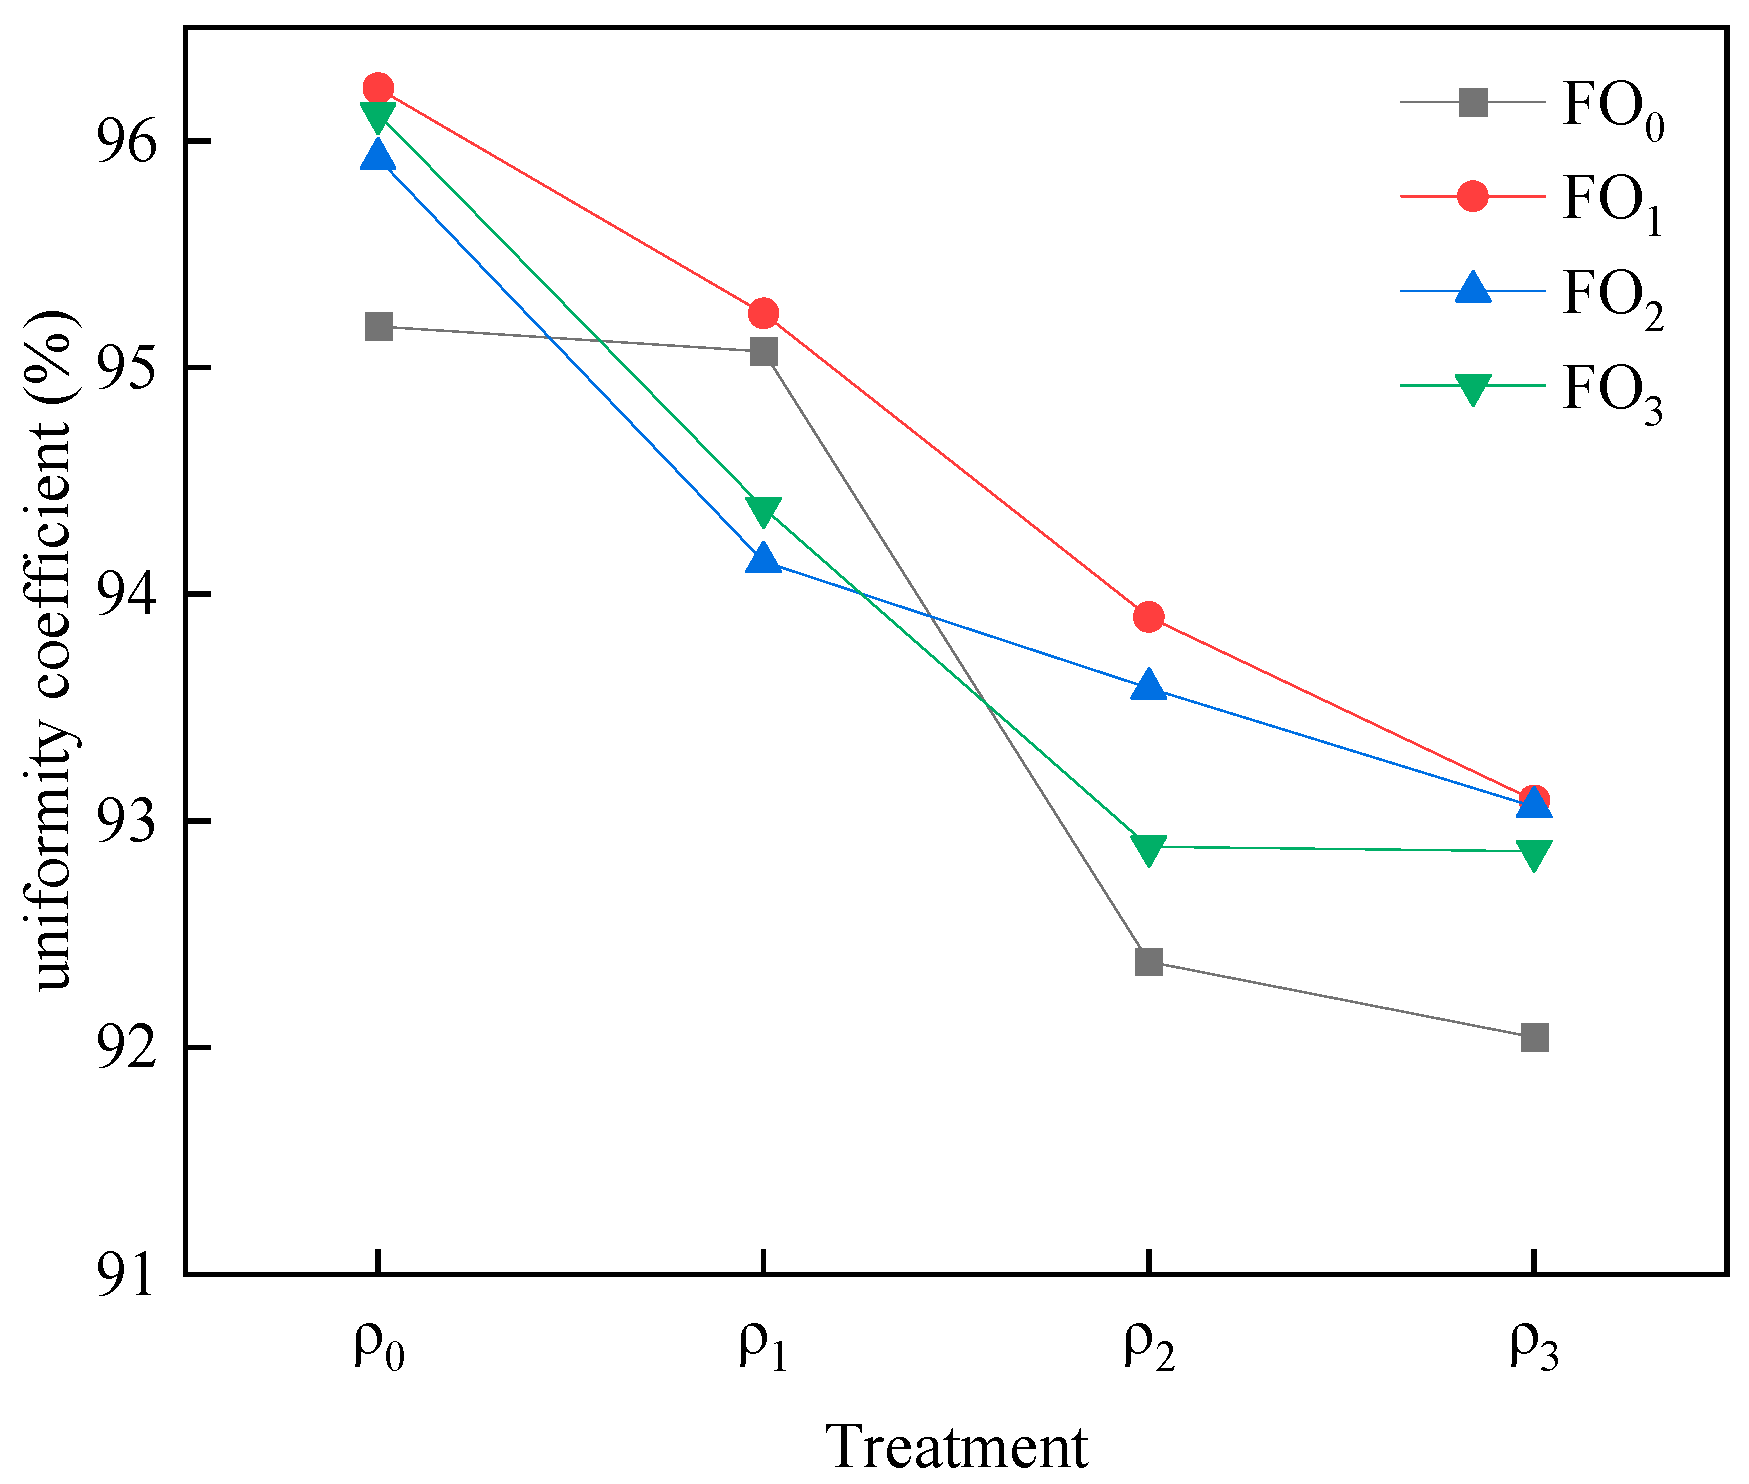
The distribution of soil moisture content with different muddy water sediment concentration and bio-organic fertilizer was represented by the uniformity coefficient, which primarily reflected the uniformity of the distribution of soil moisture content in the soil moisture body and the deviation between the size of soil moisture content and its average value. Figure 8 presented the uniformity coefficient of soil moisture content for different muddy water sediment concentrations and bio-organic fertilizer levels, calculated using the Christensen formula. It was evident that higher muddy water sediment concentration resulted in a smaller uniformity coefficient of soil moisture content. The effect of bio-organic fertilizer level on the uniformity coefficient was not significant.

3.7. Leaching Characteristic

3.7.1. Leaching Solution Volume

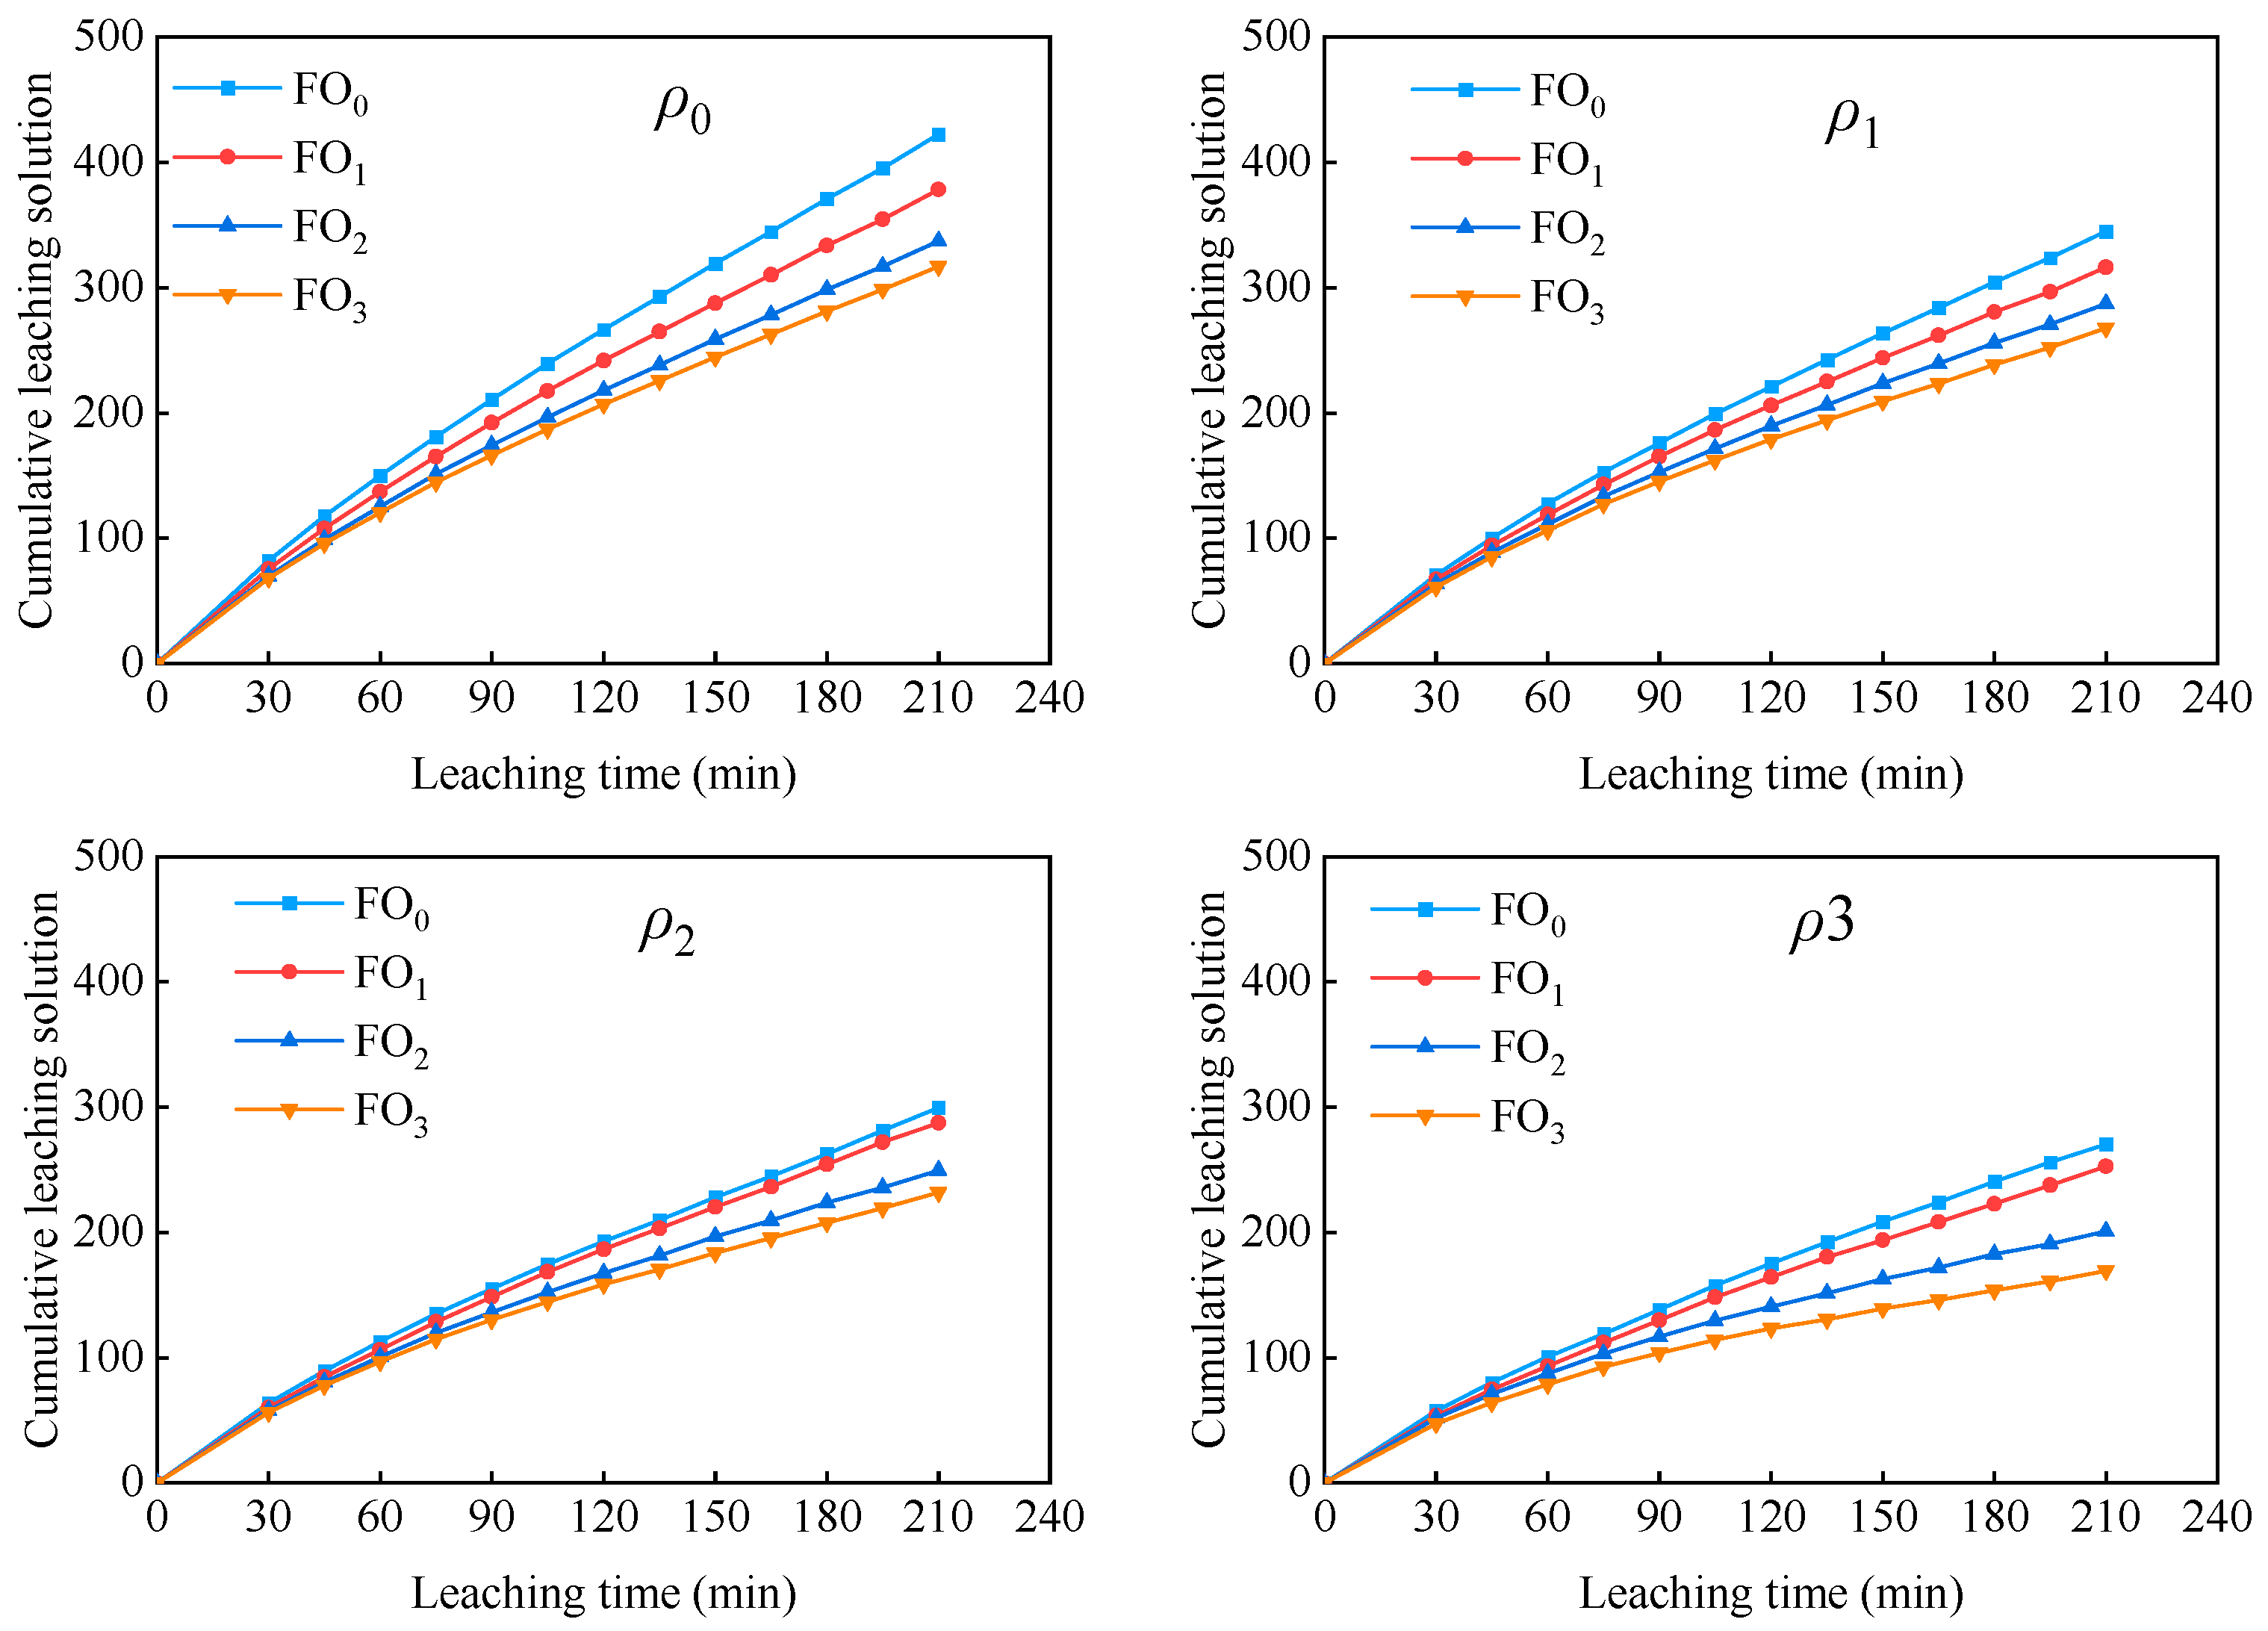
The relationship between cumulative leaching solution volume and leaching time under different treatments was shown in Figure 9. This demonstrated that the leaching solution volume of muddy water irrigation and bio-organic fertilizer application was basically consistent with the change rule over leaching time during the entire leaching process, and leaching solution volume gradually increased as leaching time increased. Under the same leaching times, the leaching solution amount decreased as muddy water sediment concentration increased. At the end of leaching, in comparison to ρ0, the cumulative leaching solution volume of ρ1, ρ2, and ρ3 decreased by 14.85–18.31%, 24.08–29.05%, and 33.25–46.55%, respectively. In comparison, the leaching solution volume of FO0, FO1, FO2, and FO3 decreased by 4.14–10.42%, 16.81–25.72%, and 22.42–37.31%, respectively.

3.7.2. pH Value, Conductivity, and TDS

As leaching time increased, changes in pH, conductivity, and total dissolved solids (TDS) in each treatment were basically consistent and could be divided into three stages (Figure 10): the first stage (0–60 min)—rapid change stage (rapid increase in pH value and rapid decrease in conductivity and TDS); the second stage (60–120 min)—slow change stage (pH value slowly increased, while conductivity and TDS slowly decreased); and the third stage (120–210 min)—the stable stage. pH value decreased as muddy water sediment concentration and bio-organic fertilizer level increased, but this change was not significant and the reduction range was within 3%. Conductivity and TDS increased as muddy water sediment concentration increased. ρ0, ρ1, ρ2, and ρ3 increased their average conductivity by 15.56–27.63%, 24.95–52.18%, and 49.06–86.83%, respectively, and increased their average TDS by 9.19–9.66%, 16.61–18.21%, and 25.88–29.39%, respectively. As bio-organic fertilizer level increased, conductivity and TDS both decreased. In comparison to FO0, the average conductivity of FO1, FO2, and FO3 decreased by 18.62–25.74%, 24.70–31.85%, and 30.98–44.94%, respectively, while the average TDS decreased by 9.44–12.44%, 19.00–19.77%, and 24.41–25.14%, respectively.

4. Discussion

This study focused on the plow layer soil, and when paired with the characteristics of muddy water irrigation and farmland fertilization in the Yellow River irrigation area in China, the effects of muddy water irrigation and the application of organic fertilizer on water penetration were investigated. Improving the soil water content and water storage capacity of crop roots is of great significance. One major measure for saving water in agriculture is reducing the soil water infiltration rate. A slow soil water infiltration rate can reduce the leakage loss of water and fertilizer, which is conducive to making improvements to the utilization efficiency of water and fertilizer. At the same time, it is also beneficial for reducing the loss of N, P, K, and other nutrients, which reduces groundwater pollution risk [22,23,24].
Many studies had found that muddy water irrigation had the advantages of water resource utilization improvement, drought prevention and soil moisture preservation, soil improvement, and soil and water conservation [25,26,27,28]. This study demonstrated that muddy water irrigation could reduce the migration rate and cumulative infiltration of water in soil. The reason for the infiltration reduction effect of muddy water irrigation was potentially because when muddy water infiltrated, sediment particles in the muddy water deposited on the surface of the soil form a dense layer, and a larger sediment content results in the faster and thicker formation of the dense layer, thus changing the upper boundary conditions and the properties of soil infiltration, which result in decreased soil water conductivity and the inhibition of soil water infiltration [7,29]. At the same time, as muddy water sediment concentration increased, the average suction at the wetting front decreased and the suction had a negative correlation with sediment concentration, thereby reducing infiltration rate [5]. Soil porosity is one of the main factors that affects soil water evaporation capacity, and the large number of pores promotes the continuity of the rising water movement [30]. At the end of evaporation, compared with ρ0, the cumulative evaporation decreased by 10.44–26.24% at different sediment concentration levels, and the higher the sediment concentration of muddy water, the less the evaporation. With the infiltration of water, fine particles are brought into the soil pores, which reduces the pore volume and number inside the soil, thereby reducing soil evaporation. At the same time, the dense layer that is formed on the soil surface is not conducive to soil evaporation to a certain extent.
Bio-organic fertilizer can effectively improve soil structure, soil water and fertilizer retention capacity, and crop water and fertilizer use efficiency and yield, in addition to increasing soil water storage [31,32,33]. This study found that the application of bio-organic fertilizer could also reduce water transport rate due to bio-organic fertilizer containing a large amount of organic matter, which infiltrated the soil mass, made it hydrophobic, weakened the soil wetting process and the movement speed of capillary water, slowed down the downward movement speed of water in the soil, prolonged water residence time in the soil, and increased the water-holding capacity of the soil [34]. In addition, the organic matter in bio-organic fertilizer may affect the soil pores, thereby affecting water migration and distribution. Previous studies have demonstrated that bio-organic fertilizer can reduce soil surface water evaporation due to bio-organic fertilizer having the ability to change soil structure, increase soil non-capillary porosity, and reduce water capillary movement height and speed in soil [35]. This is consistent with the results of this study. Compared with FO0, the application of organic fertilizer reduced the cumulative evaporation by 4.76–15.83%.
In their study, Ma et al. conducted water infiltration experiments on different soil layers under various vegetation restoration conditions [36]. They compared and analyzed the calculated results of the Philip model, Kostiakov model, and Horton model infiltration models with the measured cumulative infiltration amount. They found that the three models exhibited higher accuracy for short infiltration times. However, for longer infiltration times, the Philip infiltration model required greater parameter accuracy and sensitivity. This study took into consideration the goodness of fit evaluation method of the infiltration model, used the root-mean-square deviation (RMSE) to comprehensively and scientifically evaluate the adaptability of each model. This provided a theoretical basis for the evaluation method of soil infiltration models under the condition of muddy water irrigation and bio-organic fertilizer in the future. According to the experimental results of this study, the Kostiakov formula, among the three most commonly used infiltration models, was more suitable for soil infiltration under muddy water irrigation and bio-organic fertilizer conditions.
Leaching is one of the main factors that results in water and nutrient loss in soil and is also a major cause of environmental water pollution [37,38,39]. Compared with ρ0, muddy water infiltration reduced the leaching solution volume, and the leaching solution volume decreased with the increase in sediment concentration. This is related to the infiltration rate—the slower the infiltration rate, the slower the leaching rate. Otherwise, this study found that in comparison to ρ0, muddy water infiltration was able to increase the total dissolved solids (TDS) content in the leaching solution. Pores in the soil act as reservoirs, capable of storing a substantial amount of water [40]. However, as sediment particles in muddy water gradually fill and block the large and small pores in the soil, the soil’s water retention and fertilizer retention capacities weaken, leading to an increase in TDS content in the leaching solution. Gai et al. discovered that the application of bio-organic fertilizer could enhance soil fertility and reduce the risk of fertilizer loss [41]. In the short term, after fertilization, bio-organic fertilizer was able to reduce the loss of nutrient elements and improve fertilizer utilization by promoting soil fixation. This study found that compared to FO0 (no manure application), the bio-organic fertilizer reduced the conductivity and TDS in the leaching solution, which could be attributed to the high organic matter content in manure. Research had shown that organic matter could transform the soil’s single particle structure into an aggregated structure, thereby increasing soil water and fertilizer retention capacities and reducing deep water and fertilizer leaching [42].
The use of muddy water irrigation and the application of organic fertilizer to the soil were found to effectively reduce the water infiltration rate and cumulative infiltration and alleviate the loss of soil water leakage in this study. For soil with good moisture content, reducing soil infiltration capacity is conducive to improving soil water storage in the root zone, and conducive to plant root water absorption, which results in improved soil water use efficiency. For soil with poor moisture, enhancing soil infiltration capacity is necessary for achieving the purpose of accelerating the infiltration of irrigation water and improving the utilization rate of irrigation water. At the same time, reducing soil infiltration capacity will result in rainfall gathering on the soil surface and having more difficulty entering the plow layer to a certain extent, which can potentially lead to increased soil surface runoff. In summary, the results of this study are applicable in areas with good soil moisture but low rainfall intensity.

5. Conclusions

(1)
Muddy water irrigation and bio-organic fertilizer exerted substantial influence on water infiltration. The cumulative infiltration amount, infiltration rate, and cumulative evaporation amount declined as the muddy water sediment concentration and bio-organic fertilizer increased. Of the three infiltration models (Kostiakov model, Philip model, and Horton model), the Kostiakov infiltration model was appropriate for fitting soil water infiltration under muddy water sediment concentration and bio-organic fertilizer conditions.
(2)
Muddy water irrigation was able to reduce soil moisture content and water uniformity but increased infiltration reduction rate. Moreover, as the bio-organic fertilizer level increased, both the soil moisture content and infiltration reduction rate exhibited an upward trajectory.
(3)
The cumulative volume and pH value of the leaching solution exhibited a decline as the muddy water sediment concentration and bio-organic fertilizer increased, whereas the conductivity and total dissolved solids (TDS) displayed an increase with increasing muddy water sediment concentration and a decrease with increasing bio-organic fertilizer. In comparison to ρ0, muddy water infiltration manifested a decrease in cumulative leaching solution volume, ranging from 14.85% to 46.55%, accompanied by an increase in conductivity, ranging from 15.56% to 86.83%, and a rise in TDS, ranging from 9.19% to 29.39%. Conversely, in contrast to FO0, the application of bio-organic fertilizer resulted in a reduction in cumulative leaching solution volume by 4.14% to 37.31%, a decline in conductivity by 18.62% to 44.94%, and a decrease in TDS by 9.44% to 25.14%.

Author Contributions

Conceptualization, L.F.; methodology, Y.P. and Q.F.; software, F.J. and F.S.; validation, L.L. and K.H.; formal analysis, Y.P.; investigation, L.F.; resources, L.F.; data curation, Y.P.; writing—original draft preparation, Y.P.; writing—review and editing, Y.P.; visualization, F.J.; supervision, K.H.; project administration, L.F.; funding acquisition, L.F. All authors have read and agreed to the published version of the manuscript.

Funding

This research is supported by the National Natural Science Foundation of China (52079105, 51779205) and the Doctoral Dissertations Innovation Fund of Xi’an University of Technology, China (310-252072215).

Data Availability Statement

The data presented in this study are available upon request from the corresponding author.

Conflicts of Interest

The authors declare that they have no conflict of interest in this research.

References

  1. Cao, J.H.; Chen, P.P.; Gao, X.D.; Zou, Q.F.; Fang, Y.J.; Gu, X.B.; Zhao, X.N.; Li, Y.N. Effects of plastic film residue and emitter flow rate on soil water infiltration and redistribution under different initial moisture content and dry bulk density. Sci. Total Environ. 2022, 807, 151381. [Google Scholar]
  2. Wang, H.; Shao, D.G.; Ji, B.; Gu, W.Q.; Yao, M.L. Biochar effects on soil properties, water movement and irrigation water use efficiency of cultivated land in Qinghai-Tibet Plateau. Sci. Total Environ. 2022, 829, 154520. [Google Scholar] [CrossRef]
  3. Nasirian, A.; Maghrebi, M.F.; Mohtashami, A. Numerical and Experimental Assessment of Suspended Material Effects on Water Loss Reduction from Irrigation Channels. IJST-T CIV Eng. 2022, 46, 2483–2493. [Google Scholar] [CrossRef]
  4. Duo, L.H.; Hu, Z.Q. Soil Quality Change after Reclaiming Subsidence Land with Yellow River Sediments. Sustainability 2018, 10, 4310. [Google Scholar] [CrossRef]
  5. Wang, Q.J.; Wang, W.Y.; Shao, M.A.; Wang, Z.R.; Lv, D.Q. Mechanism and Simulating Model for Muddy Water Infiltration. Trans. CSAE 1999, 15, 141–144. [Google Scholar]
  6. Bai, R.; Fei, L.J.; Chen, L.; Zhong, Y. Effect of sediment concentration on single point source free infiltration characteristics of muddy waterin layered soil with film hole irrigation. J. Soil. Water Conserv. 2020, 34, 43–49, 55. [Google Scholar]
  7. Zhong, Y.; Fei, L.J.; Zhu, S.J.; Kang, S.X.; Liu, L.H.; Hao, K.; Jie, F.L. Infiltration Characteristics of Muddy Water Film-Hole lrrigation and Formation Characteristics of Dense Layers. J. Soil. Water Conserv. 2022, 36, 238–246, 254. [Google Scholar]
  8. Bristow, K.L.; Simunek, J.; Helalia, S.A.; Siyal, A.A. Numerical simulations of the effects furrow surface conditions and fertilizer locations have on plant nitrogen and water use in furrow irrigated systems. Agr. Water Manag. 2020, 232, 106044. [Google Scholar] [CrossRef]
  9. Jin, N.; Jin, L.; Wang, S.Y.; Li, J.W.; Liu, F.H.; Liu, Z.C.; Luo, S.L.; Wu, Y.; Lyu, J.; Yu, J.H. Reduced Chemical Fertilizer Combined with Bio-Organic Fertilizer Affects the Soil Microbial Community and Yield and Quality of Lettuce. Front. Microbiol. 2022, 13, 863325. [Google Scholar] [CrossRef]
  10. Nest, T.V.; Vandecasteele, B.; Ruysschaert, G.; Cougnon, M.; Merckx, R.; Reheul, D. Effect of organic and mineral fertilizers on soil P and C levels, crop yield and P leaching in a long term trial on a silt loam soil. Agr. Ecosyst. Env. 2014, 197, 309–317. [Google Scholar] [CrossRef]
  11. Cui, H.Y.; Xu, W.C.; Sun, Y.M.; Niu, J.Y.; Fang, Z.S. Effects of Different Organic Manures Application on Soil Moisture, Yield and Quality of Oil Flax. J. Soil. Water Conserv. 2014, 28, 307–312. [Google Scholar]
  12. Tang, H.M.; Li, C.; Xiao, X.P.; Pan, X.C.; Cheng, K.K.; Shi, L.H.; Li, W.Y.; Wen, L.; Wang, K. Effects of long-term fertiliser regime on soil organic carbon and its labile fractions under double cropping rice system of southern China. Acta Agric. Scand. Sect. B—Soil Plant Sci. 2020, 70, 409–418. [Google Scholar] [CrossRef]
  13. Xu, Y.; Li, H.Y.; Tan, L.; Li, Q.; Liu, W.; Zhang, C.X.; Gao, Y.; Wei, X.C.; Gong, Q.; Zheng, X.Q. What role does organic fertilizer actually play in the fate of antibiotic resistome and pathogenic bacteria in planting soil. J. Environ. Manag. 2022, 317, 115382. [Google Scholar] [CrossRef]
  14. Wang, J.; Na, W. Relationship between the Flood Cement and Cement Sand in the Yellow River Helong Reach Based on the Typical Sediment Content. J. Irrig. Drain. 2019, 38, 107–110. [Google Scholar]
  15. Chen, C.X.; Fu, J.; Wu, M.X.; Gao, X.; Ma, L.M. High-efficiency Sediment Transport Requirements for operation of the Xiaolangdi Reservoir in the Lower Yellow River. Water Supply 2022, 22, 8572–8586. [Google Scholar] [CrossRef]
  16. Zou, Y.P.; Zhang, S.Y.; Shi, Z.Y.; Zhou, H.X.; Zheng, H.W.; Hu, J.H.; Mei, J.; Bai, L.; Jia, J.L. Effects of mixed-based biochar on water infiltration and evaporation in aeolian sand soil. J. Arid Land 2022, 14, 374–389. [Google Scholar] [CrossRef]
  17. Diao, S.; Wang, H.Q.; Qiu, C. Differences and discussion on determination methods of soll pH value. Environ. Eng. 2015, 33, 1015–1017. [Google Scholar]
  18. Xue, S.P.; Ge, M.S.; Zhang, Q.W. Sprinkler irrigation uniformity assessment: Relational analysis of Christiansen uniformity and Distribution uniformity. Irrig. Drain. 2023. [Google Scholar] [CrossRef]
  19. Xing, X.G.; Li, Y.B.; Ma, X.Y. Effects on Infiltration and Evaporation When Adding Rapeseed-Oil Residue or Wheat Straw to a Loam Soil. Water 2017, 9, 700. [Google Scholar] [CrossRef]
  20. Xiao, Q.; Zhang, H.P.; Shen, Y.F.; Li, S.Q. Effects of biochar on water infiltration, evaporation and nitrate leaching in semi-arid loess area. Trans. Chin. Soc. Agric. Eng. 2015, 31, 128–134. [Google Scholar]
  21. Chen, S.; Wu, F.P.; Wang, H.; Ouyang, Z. Influence of biochar on biogas infiltration and infiltration reduction effect of clayey and sandy red soil. J. Agro-Environ. Sci. 2023, 42, 578–588. [Google Scholar]
  22. Zhang, J.H.; Wang, Q.J.; Shan, Y.Y.; Guo, Y.; Mu, W.Y.; Wei, K.; Sun, Y. Effect of Sodium Carboxymethyl Cellulose on Water and Salt Transport Characteristics of Saline-Alkali Soil in Xinjiang, China. Polymers 2022, 14, 2884. [Google Scholar] [CrossRef] [PubMed]
  23. Javadi, A.; Mostafazadeh-Fard Shayannejad, M.; Mosaddeghi, M.R.; Ebrahimian, H. Soil physical and chemical properties and drain water quality as affected by irrigation and leaching managements. Soil Sci. Plant Nutr. 2019, 65, 321–331. [Google Scholar] [CrossRef]
  24. Dos Santos, W.M.; Gonzaga, M.I.S.; da Silv, A.J.; de Almeida, A.Q. Improved water and ions dynamics in a clayey soil amended with different types of agro-industrial waste biochar. Soil. Till Res. 2022, 223, 105482. [Google Scholar] [CrossRef]
  25. Liu, L.H.; Fei, J.; Chen, L.; Hao, K. Effects of sediment concentration of muddy water on water and nitrogen transport characteristics under film hole irrigation with fertilizer infiltration. Trans. Chin. Soc. Agric. Eng. 2020, 36, 120–129. [Google Scholar]
  26. Liu, L.H.; Fei, L.J.; Chen, L.; Hao, K.; Zhang, Q.J. Effects of initial soil moisture content on soil water and nitrogen transport under muddy water film hole infiltration. Int. J. Agr. Biol. Eng. 2021, 14, 182–189. [Google Scholar] [CrossRef]
  27. Chen, L.N.; Zhao, Z.L.; Li, J.; Wang, H.M.; Guo, G.M.; Wu, W.B. Effects of muddy water irrigation with different sediment particle sizes and sediment concentrations on soil microbial communities in the Yellow River Basin of China. Agr. Water Manag. 2022, 270, 107750. [Google Scholar] [CrossRef]
  28. Yang, H.B.; Li, E.C.; Zhao, Y.; Liang, Q.H. Effect of water-sediment regulation and its impact on coastline and suspended sediment concentration in Yellow River Estuary. Water Sci. Eng. 2018, 10, 311–319. [Google Scholar] [CrossRef]
  29. Zhong, Y.; Fei, L.J.; Zhu, S.J.; He, J.; Kang, S.X. Effect of sediment concentration of muddy water on one-dimensional vertical infiltration characteristics and dense layer formation characteristics. Soil 2022, 54, 602–609. [Google Scholar]
  30. Meng, W.; Sun, X.H.; Ma, J.J.; Guo, X.H.; Zheng, L.J. Evaporation and Soil Surface Resistance of the Water Storage Pit Irrigation Trees in the Loess Plateau. Water 2019, 11, 648. [Google Scholar] [CrossRef]
  31. Xiang, Y.Z.; Li, Y.; Luo, X.Q.; Liu, Y.; Yue, X.J.; Yao, B.; Xue, J.M.; Zhang, L.Y.; Fan, J.; Xu, X.Y.; et al. Manure properties, soil conditions and managerial factors regulate greenhouse vegetable yield with organic fertilizer application across China. Front. Plant Sci. 2022, 13, 1009631. [Google Scholar] [CrossRef]
  32. Jin, L.; Jin, N.; Wang, S.Y.; Li, J.W.; Meng, X.; Xie, Y.D.; Wu, Y.; Luo, S.L.; Lyu, J.; Yu, J.H. Changes in the Microbial Structure of the Root Soil and the Yield of Chinese Baby Cabbage by Chemical Fertilizer Reduction with Bio-Organic Fertilizer Application. Microbiol. Spectr. 2022, 10, e01215-22. [Google Scholar] [CrossRef]
  33. Brar, B.S.; Singh, J.; Singh, G.; Kaur, G. Effects of Long Term Application of Inorganic and Organic Fertilizers on Soil Organic Carbon and Physical Properties in Maize-Wheat Rotation. Agronomy 2015, 5, 220–238. [Google Scholar] [CrossRef]
  34. Liu, S.T.; Zhang, H.Y.; Liu, Q.J.; Zong, H.; Yu, X.X. Effect of long-term application of manure and nitrogen fertilizer on infiltration for a wheat-maize rotation system. Land Degrad. Dev. 2018, 29, 3250–3261. [Google Scholar] [CrossRef]
  35. Li, Y.P.; Shao, M.G.; Wang, J.; Li, T.C. Effects of Earthworm Cast Application on Water Evaporation and Storage in Loess Soil Column Experiments. Sustainability 2020, 12, 3112. [Google Scholar] [CrossRef]
  36. Ma, X.Y.; Mu, X.M.; Wang, S.Y.; Gu, C.J.; Tan, X.J. Study on the Effects of Different Vegetation Restoration on Soil lnfiltration and Suitable Models in the Loess Hilly Region. J. Soil. Water Conserv. 2023, 37, 67–75. [Google Scholar]
  37. Bai, X.L.; Zhang, Z.B.; Cui, J.J.; Liu, Z.J.; Chen, Z.J.; Zhou, J.B. Strategies to mitigate nitrate leaching in vegetable production in China: A meta-analysis. Environ. Sci. Pollut. Res. 2020, 27, 18382–18391. [Google Scholar] [CrossRef]
  38. Dal Molin, S.J.; Ernani, P.R.; Soldatelli, P.; Cassol, P.C. Leaching and Recovering of Nitrogen Following N Fertilizers Application to the Soil in a Laboratory Study. Commun. Soil Sci. Plan. 2018, 49, 1099–1106. [Google Scholar] [CrossRef]
  39. Kodur, S.; Shrestha, U.B.; Maraseni, T.N.; Deo, R.C. Environmental and economic impacts and trade-offs from simultaneous management of soil constraints, nitrogen and water. J. Clean. Prod. 2019, 222, 960–970. [Google Scholar] [CrossRef]
  40. Jiang, R.R.; Fei, L.J.; Kang, S.X. Numerical Study on the Characteristics of Mult-point Interference lnfiltration Wetted Body in Muddy Water Film Hole lrrigation. J. Soil. Water Conserv. 2022, 36, 190–195. [Google Scholar]
  41. Gai, X.P.; Liu, H.B.; Zhai, L.M.; Wang, H.Y. Effects of Corn-Stalk Biochar on Inorganic Nitrogen Leaching from Soil. J. Agro-Env. Sci. 2015, 34, 310–318. [Google Scholar]
  42. Liu, Y.; Miao, H.T.; Chang, X.F.; Wu, G.L. Higher species diversity improves soil water infiltration capacity by increasing soil organic matter content in semiarid grasslands. Land Degrad. Dev. 2019, 30, 1599–1606. [Google Scholar] [CrossRef]
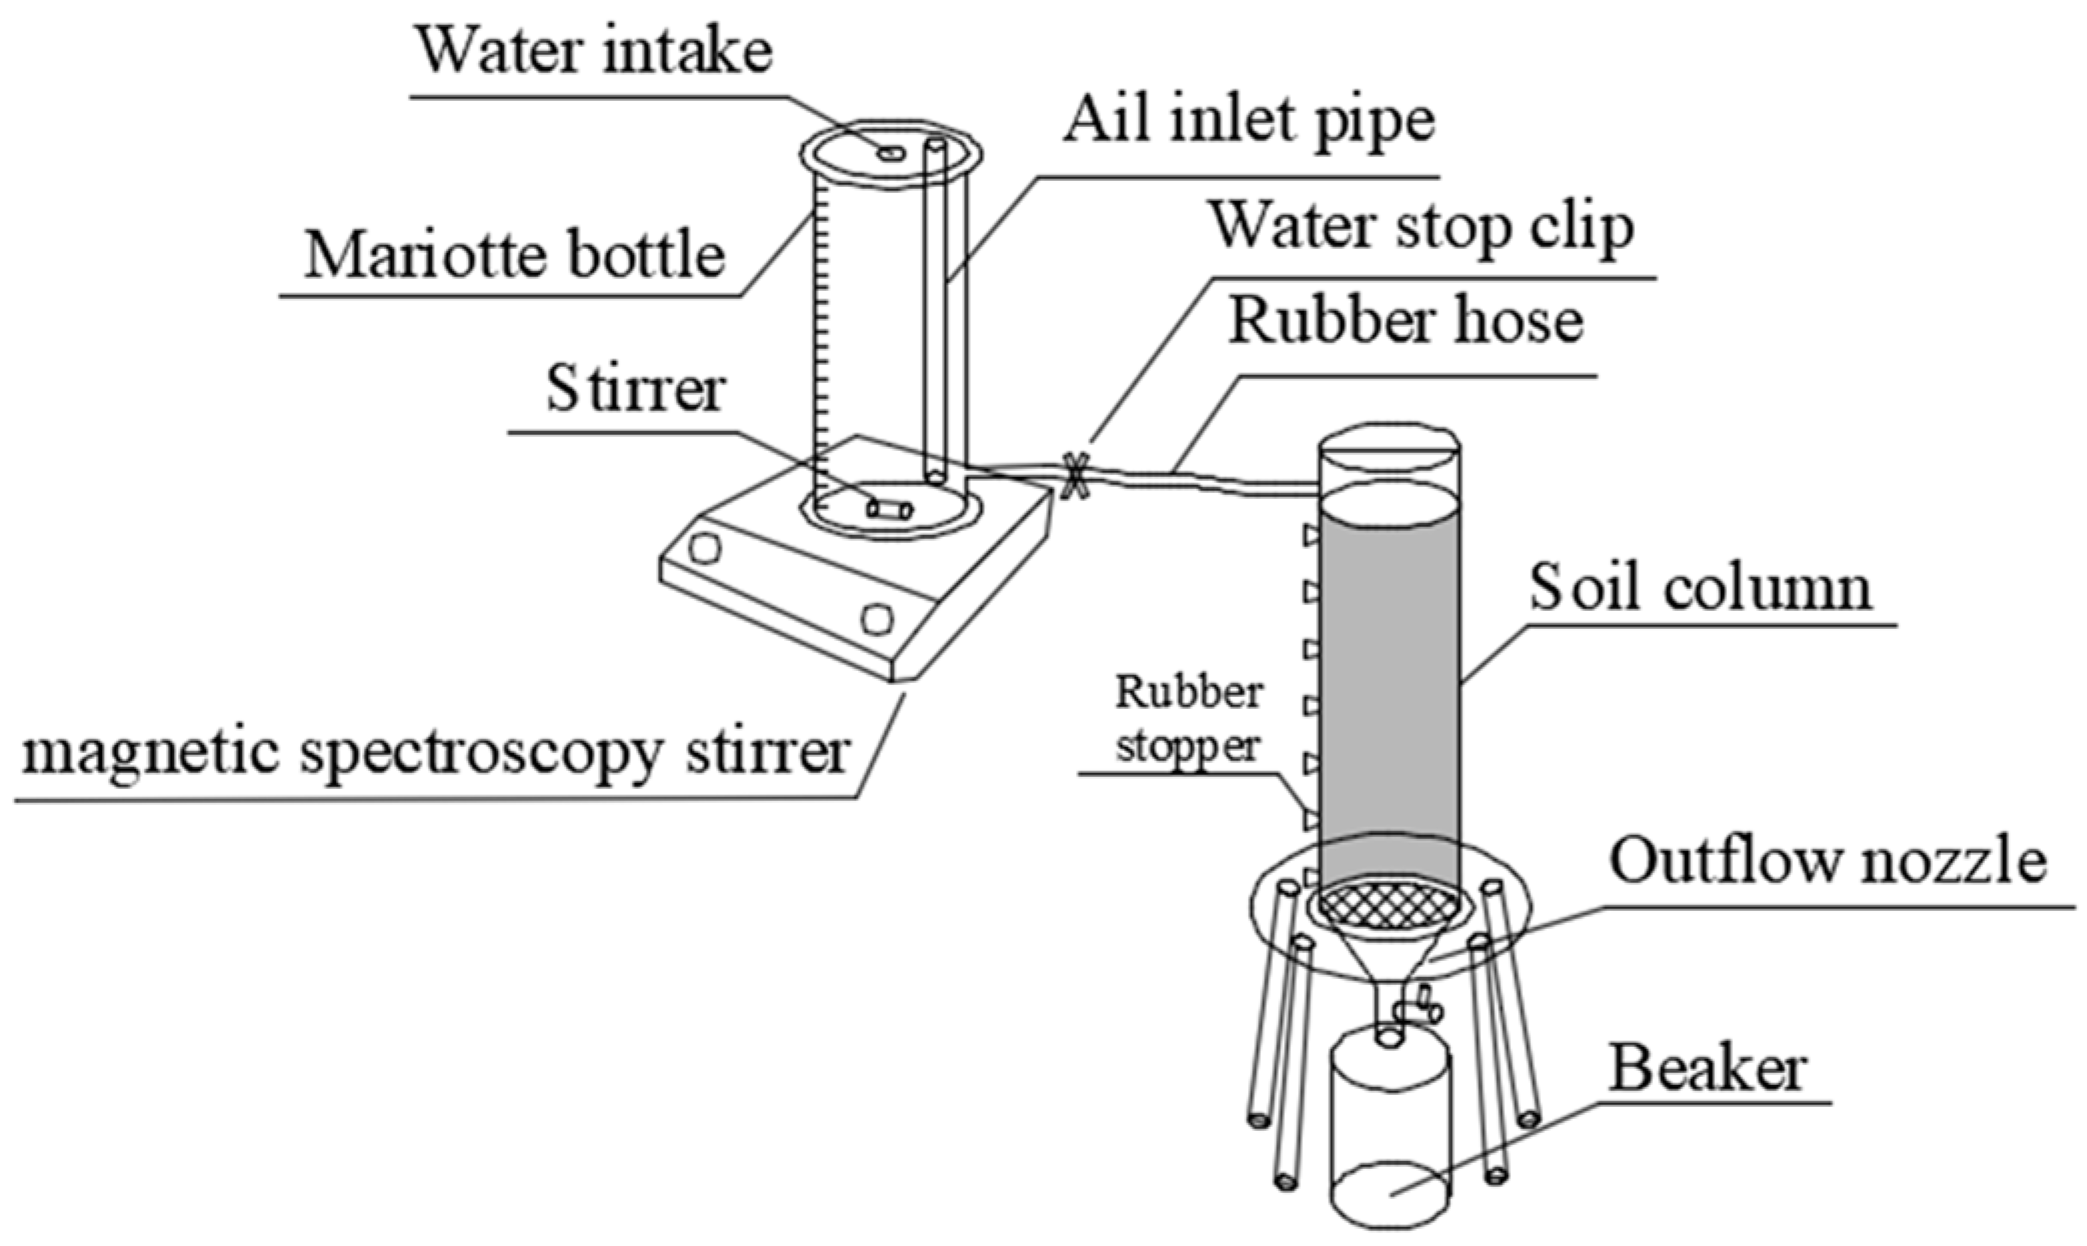
Figure 1. Schematic diagram of experiment device.
Agronomy 13 02014 g001
Figure 2. Effects of muddy water sediment concentration and bio-organic fertilizer on the wetting front. Note: ρ0, ρ1, ρ2, and ρ3 are muddy water sediment concentrations of 0, 4%, 8%, and 12%, respectively; FO0, FO1, FO2, and FO3 are fertilizer levels of 0, 2250, 4500, and 6750 kg·hm−2, respectively. Same as below.
Agronomy 13 02014 g002
Figure 3. Effects of muddy water sediment concentration and bio-organic fertilizer on the cumulative infiltration.
Agronomy 13 02014 g003
Figure 4. Effects of muddy water sediment concentration and bio-organic fertilizer on the infiltration rate.
Agronomy 13 02014 g004
Figure 5. Relationship between time and infiltration reduction rate under muddy water sediment concentration and bio-organic fertilizer conditions.
Agronomy 13 02014 g005
Figure 6. Relationship between time and cumulative evaporation under muddy water sediment concentration and bio-organic fertilizer conditions.
Agronomy 13 02014 g006
Figure 7. Effects of muddy water sediment concentration and bio-organic fertilizer on the soil moisture content.
Agronomy 13 02014 g007
Figure 8. Effects of muddy water sediment concentration and bio-organic fertilizer on the soil moisture uniformity coefficient.
Agronomy 13 02014 g008
Figure 9. Relationship between time and leaching solution volume under muddy water sediment concentration and bio-organic fertilizer conditions.
Agronomy 13 02014 g009
Figure 10. Relationship between pH, conductivity, TDS, and leaching time under muddy water sediment content and bio-organic fertilizer conditions.
Agronomy 13 02014 g010
Table 1. Characteristics of fitting parameters of Kostiakov, Philip, and Horton infiltration models under muddy water sediment concentration and bio-organic fertilizer conditions.
TreatmentsKostiakovPhilipHorton
Muddy Water
Sediment
Concentration
Bio-Organic
Fertilizer
KαR2RMSESR2RMSEgR2RMSE
ρ0FO10.8360.5640.9350.0630.8360.8910.0710.2360.8180.092
FO20.8080.5770.9430.0620.8040.8850.0720.2500.8360.086
FO30.7820.5950.9640.0460.7430.9030.0600.2410.8540.073
FO40.7750.6170.9920.0160.6790.9550.0350.1860.8990.053
ρ1FO10.7600.5890.9780.0260.6990.9510.0380.1800.8920.056
FO20.7320.6050.9810.0260.6650.9380.0410.1970.8770.058
FO30.6650.6110.9650.0290.5910.9340.0380.1850.8660.053
FO40.6380.6370.9780.0250.5590.9240.0390.2030.8810.049
ρ2FO10.6110.6100.9730.0280.5620.9220.0400.2060.8710.051
FO20.5870.6330.9720.0390.5430.8860.0480.2150.8570.054
FO30.5730.6430.9720.0240.4990.9220.0360.1910.8850.043
FO40.5230.6360.9420.0370.4810.8830.0430.2020.8630.046
ρ3FO10.5760.6260.9780.0200.5070.9350.0330.1880.8850.043
FO20.5480.6330.9550.0300.4850.9090.0370.1950.8730.044
FO30.5200.6370.9500.0290.4540.9160.0330.1640.8940.037
FO40.4810.6420.9630.0240.4210.9200.0290.1820.8970.024
Table 2. Characteristics of fitting parameters of Black and Rose evaporation models under muddy water sediment concentration and bio-organic fertilizer conditions.
TreatmentsBlackRose
Muddy Water Sediment ConcentrationBio-Organic FertilizerFBRMSER2CDRMSER2
ρ0FO119.85−18.812.02570.9938.841.463.51720.980
FO218.82−17.211.92380.9938.831.323.35680.979
FO317.81−15.251.86080.9939.121.143.22340.979
FO416.91−14.161.94590.9918.971.033.24600.976
ρ1FO117.76−15.822.08130.9918.761.173.44880.976
FO216.40−13.712.03130.9908.760.983.27690.974
FO315.17−11.412.03110.9899.050.763.12180.973
FO414.89−11.162.14340.9878.970.733.20340.970
ρ2FO116.92−15.302.21820.9898.251.133.50150.973
FO215.85−13.452.07580.9898.350.963.26550.973
FO314.98−12.052.13900.9878.430.833.22910.970
FO414.07−10.562.29900.9838.540.683.26530.966
ρ3FO115.24−13.382.15720.9877.750.963.28040.970
FO214.15−11.492.04510.9877.870.793.06690.970
FO313.26−9.942.09850.9848.020.643.00570.967
FO413.08−9.662.17280.9828.050.613.04960.965
Disclaimer/Publisher’s Note: The statements, opinions and data contained in all publications are solely those of the individual author(s) and contributor(s) and not of MDPI and/or the editor(s). MDPI and/or the editor(s) disclaim responsibility for any injury to people or property resulting from any ideas, methods, instructions or products referred to in the content.