
Effects of Irrigation and Fertilization Management on Yield and Quality of Rice and the Establishment of a Quality Evaluation System


 ,
,  ,
,
Abstract
:1. Introduction
2. Materials and Methods
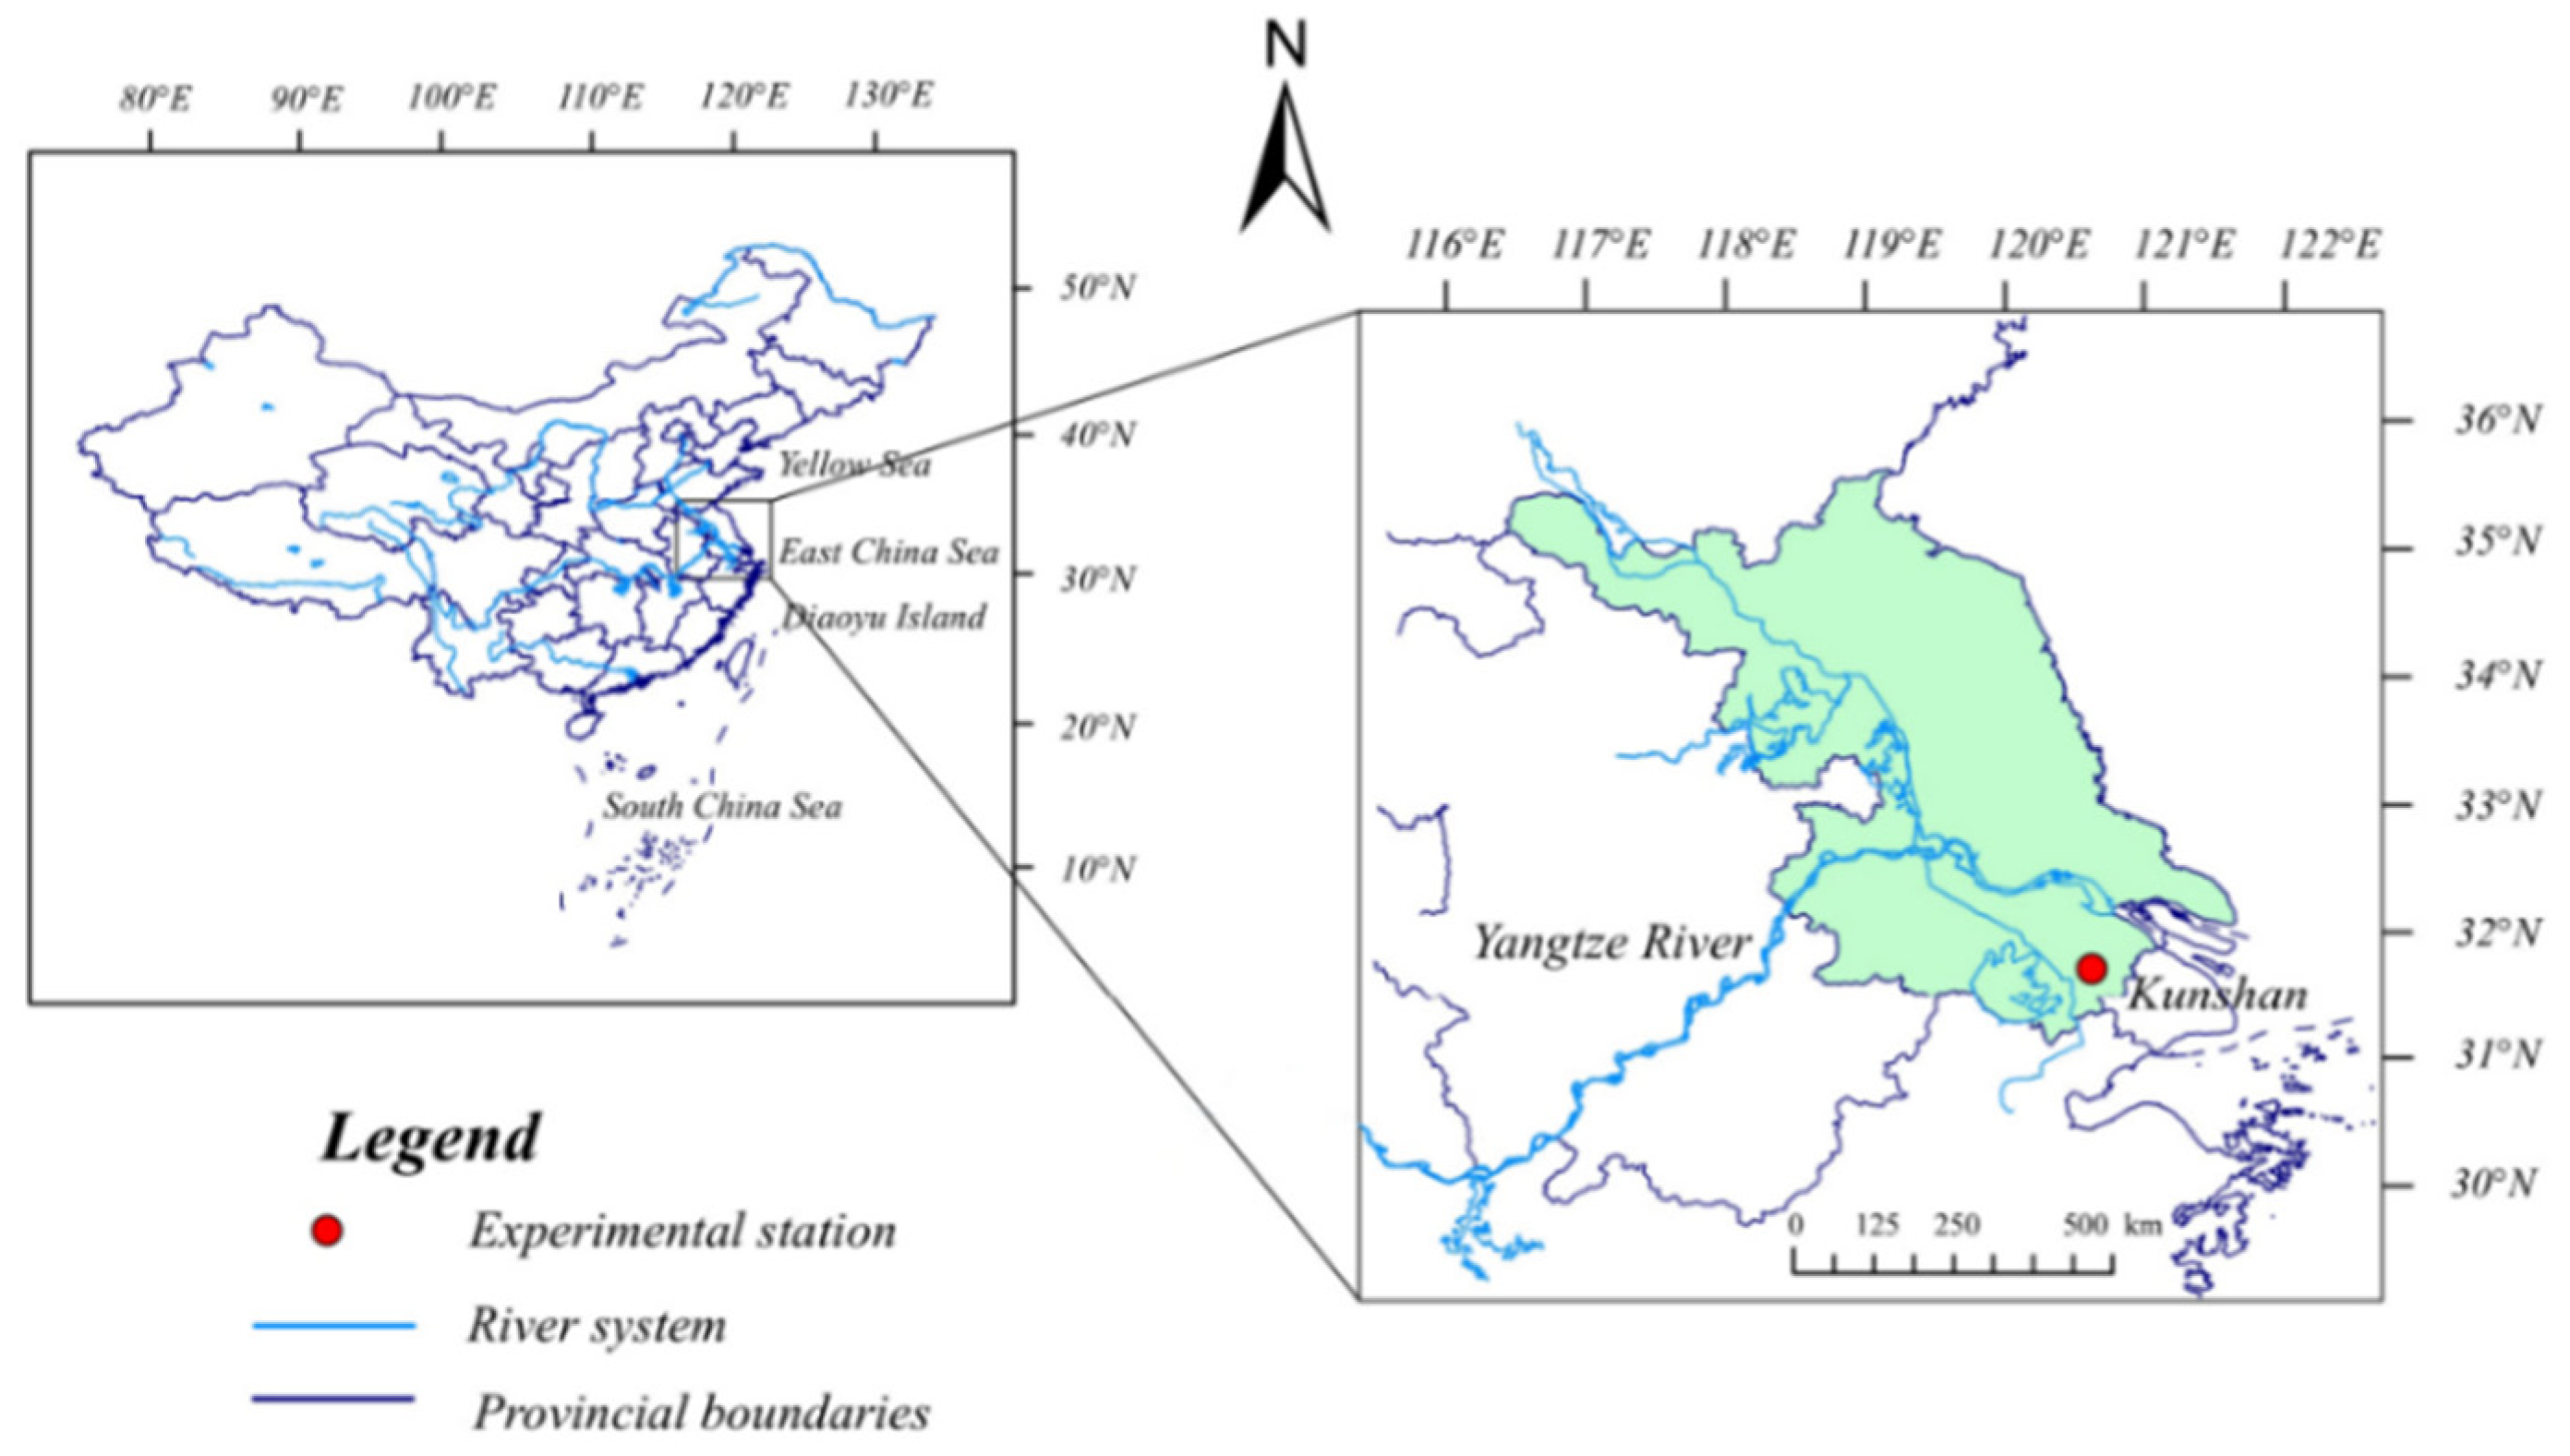
2.1. Experimental Design
2.2. Growth and Yield Indicators Measurement
2.3. Quality Indicators Measurement
2.4. Enzyme Activity and Soluble Sugar Content Measurement
2.5. Construction of Comprehensive Quality Evaluation Model
2.6. Statistical Analysis
3. Results
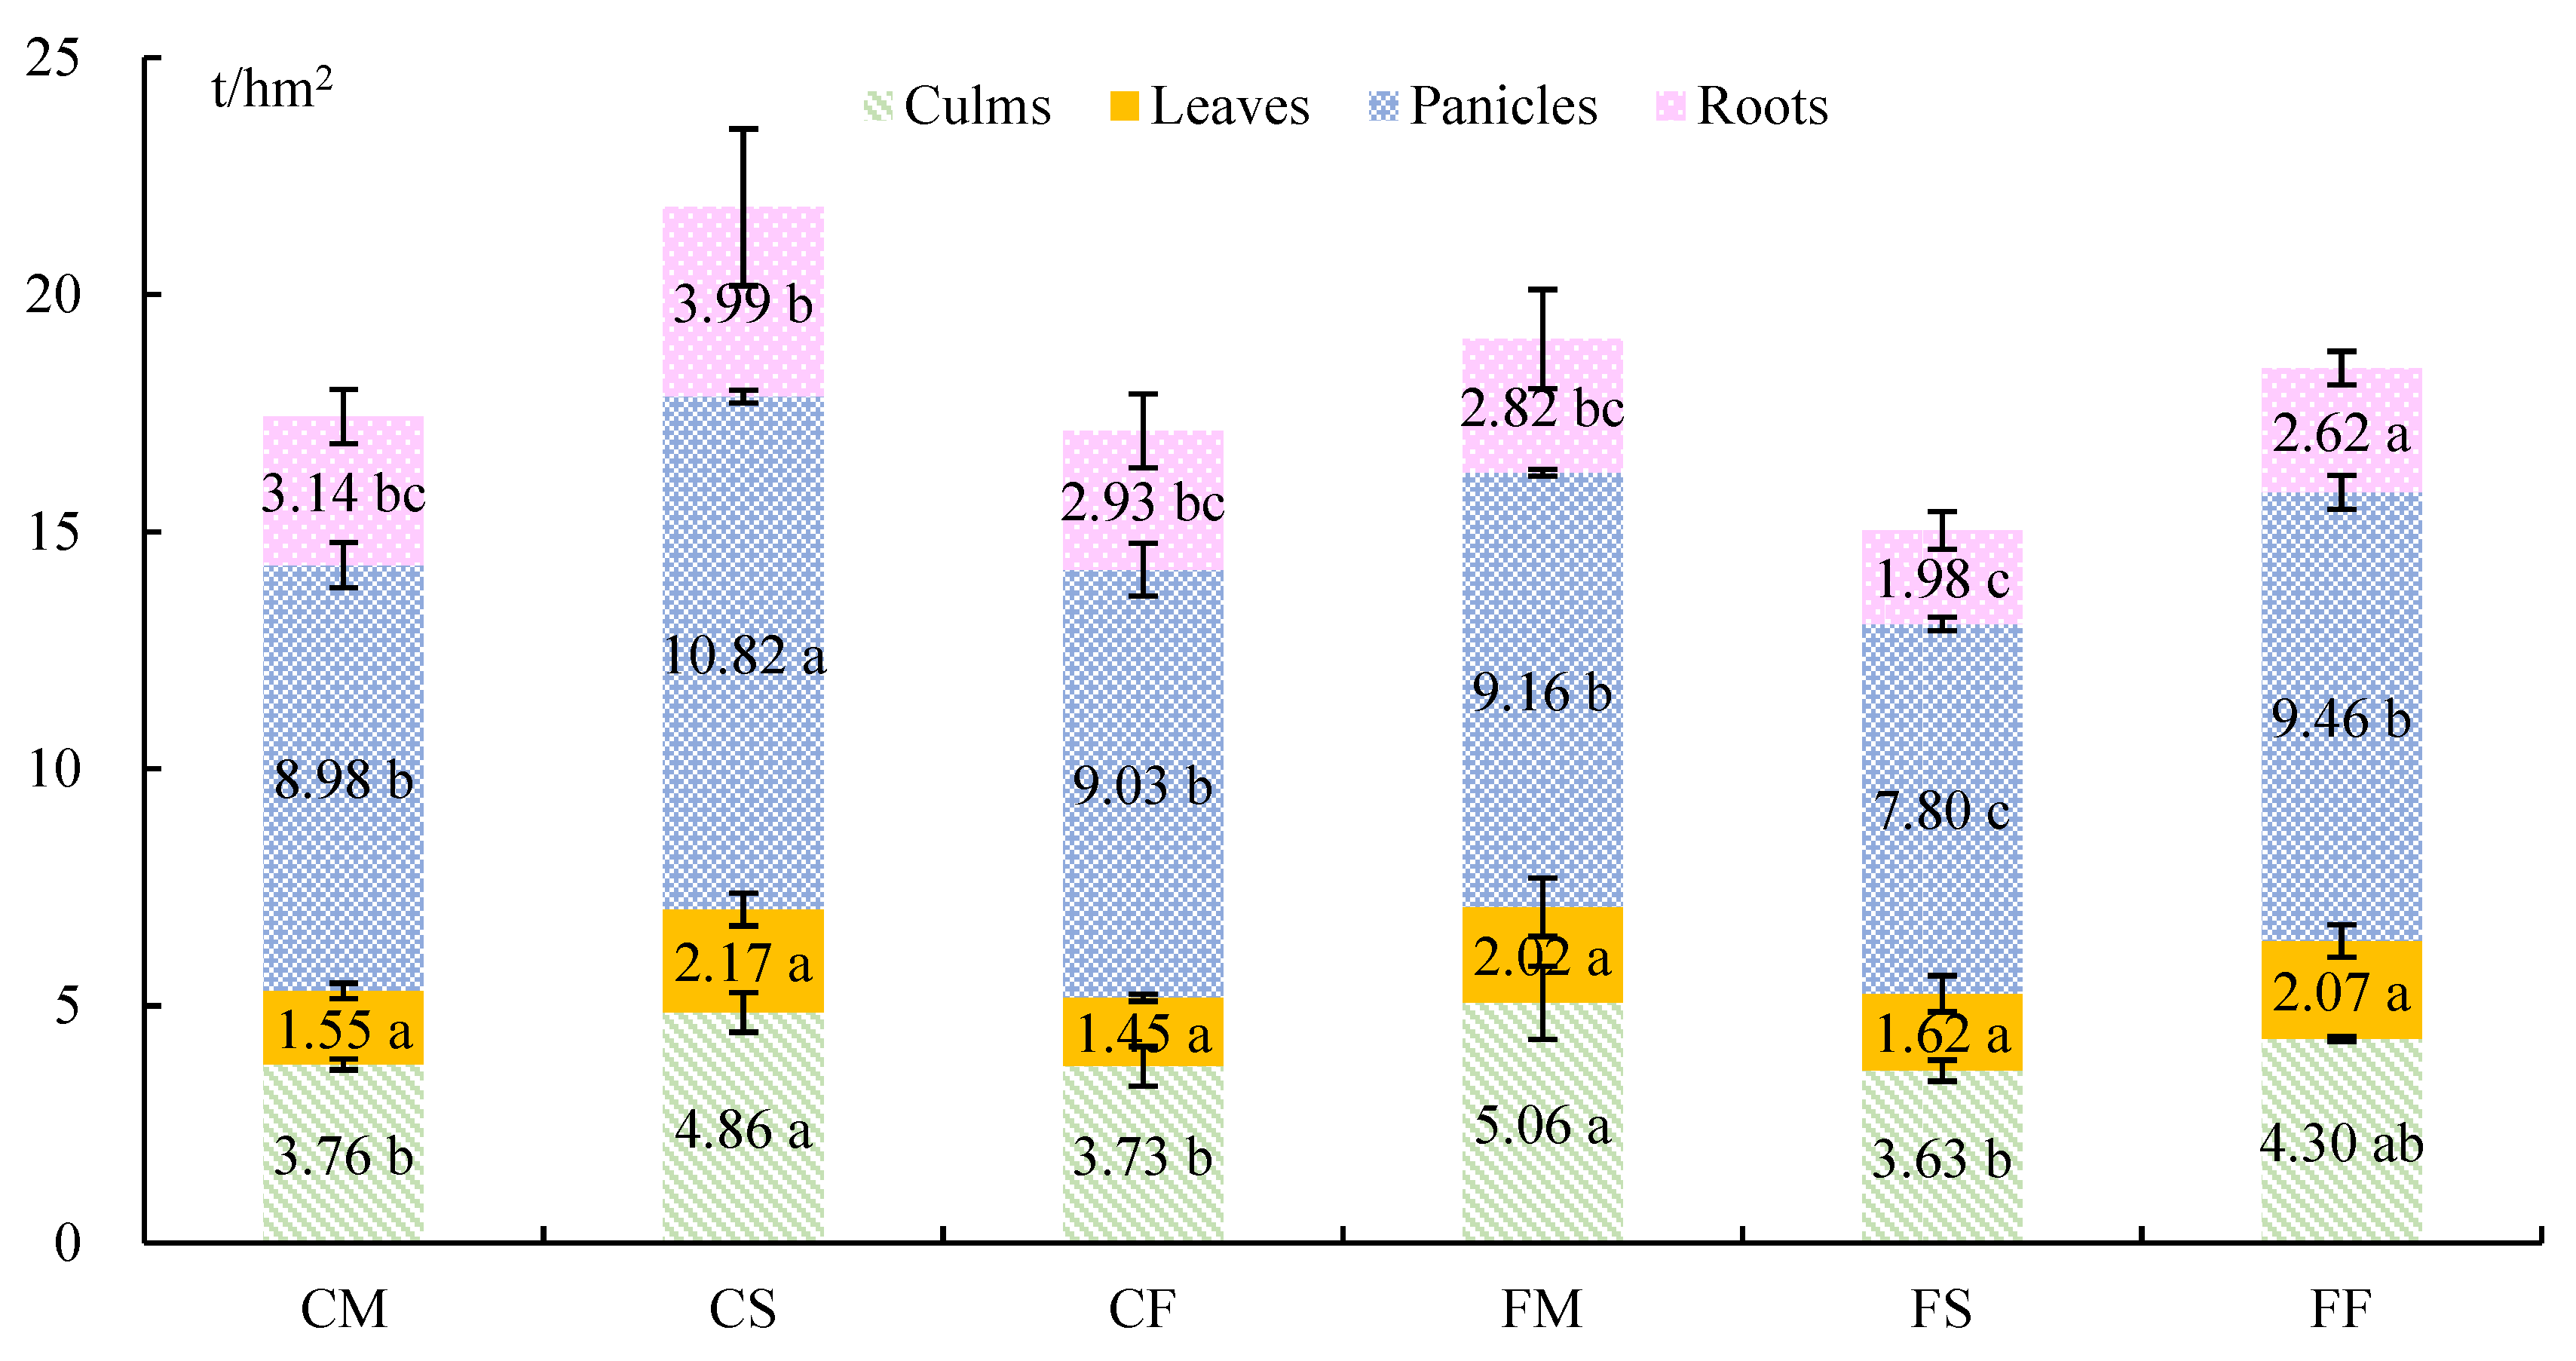
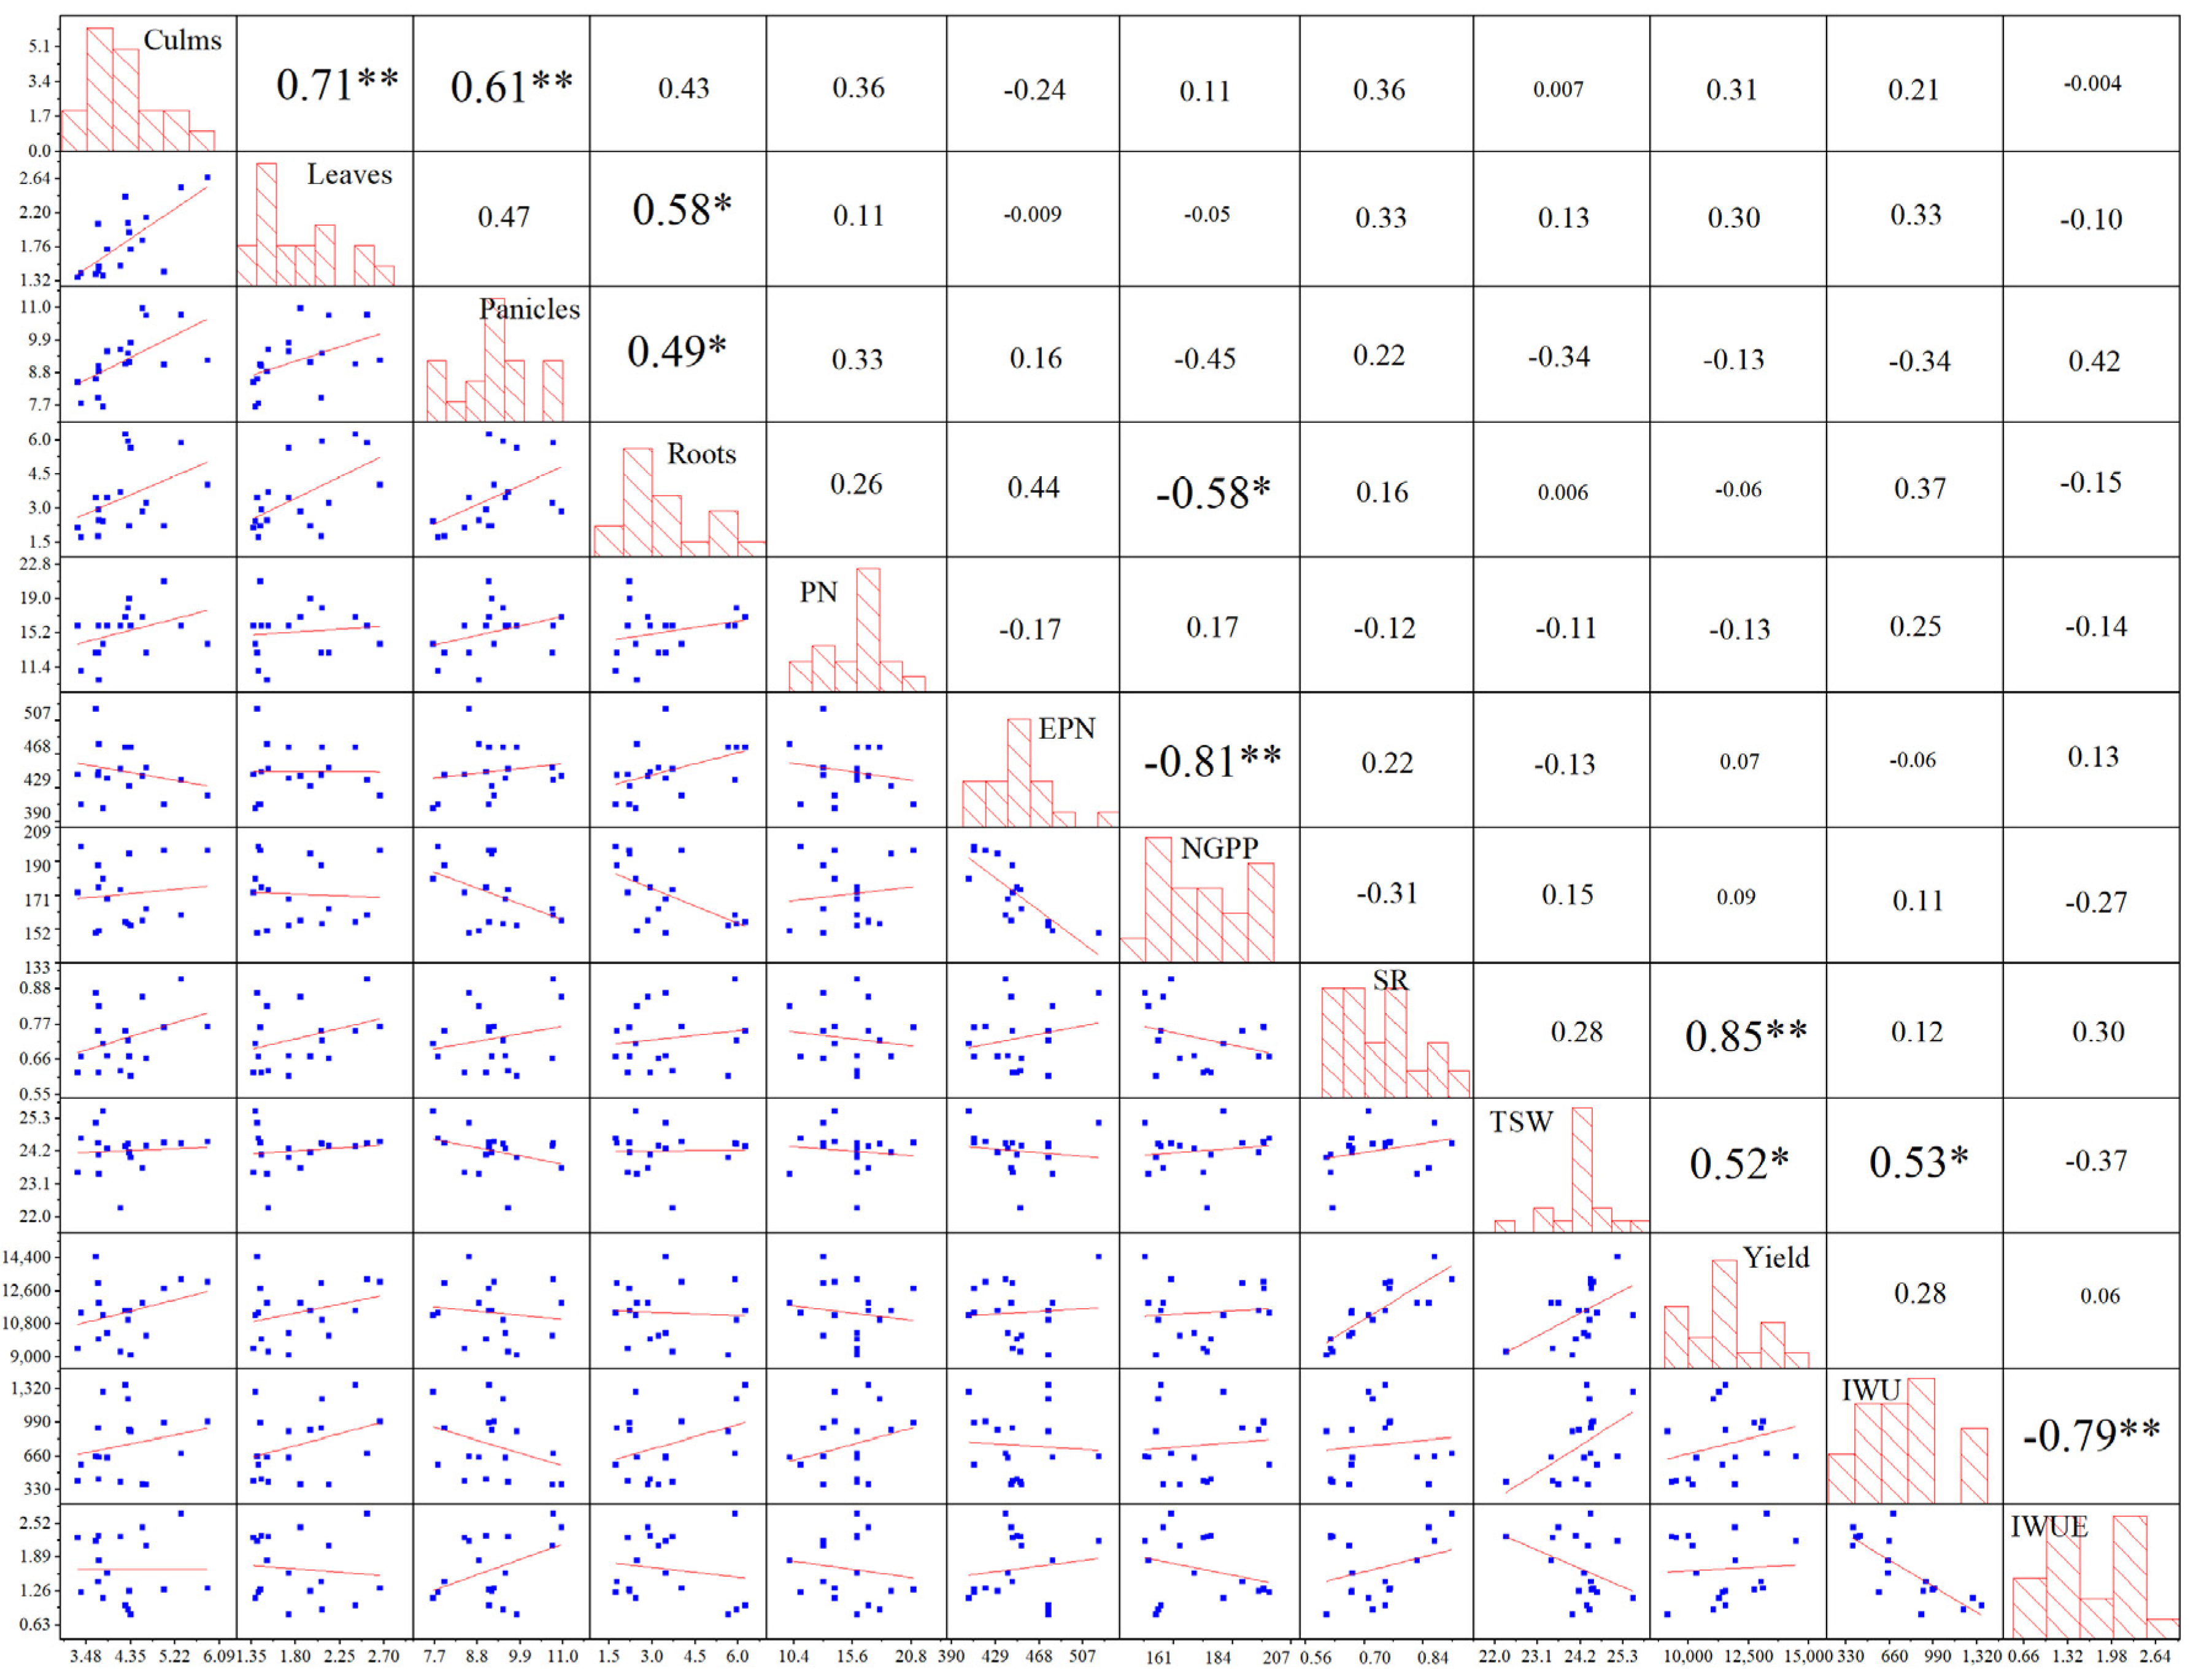
3.1. Rice Yield
3.2. Rice Quality
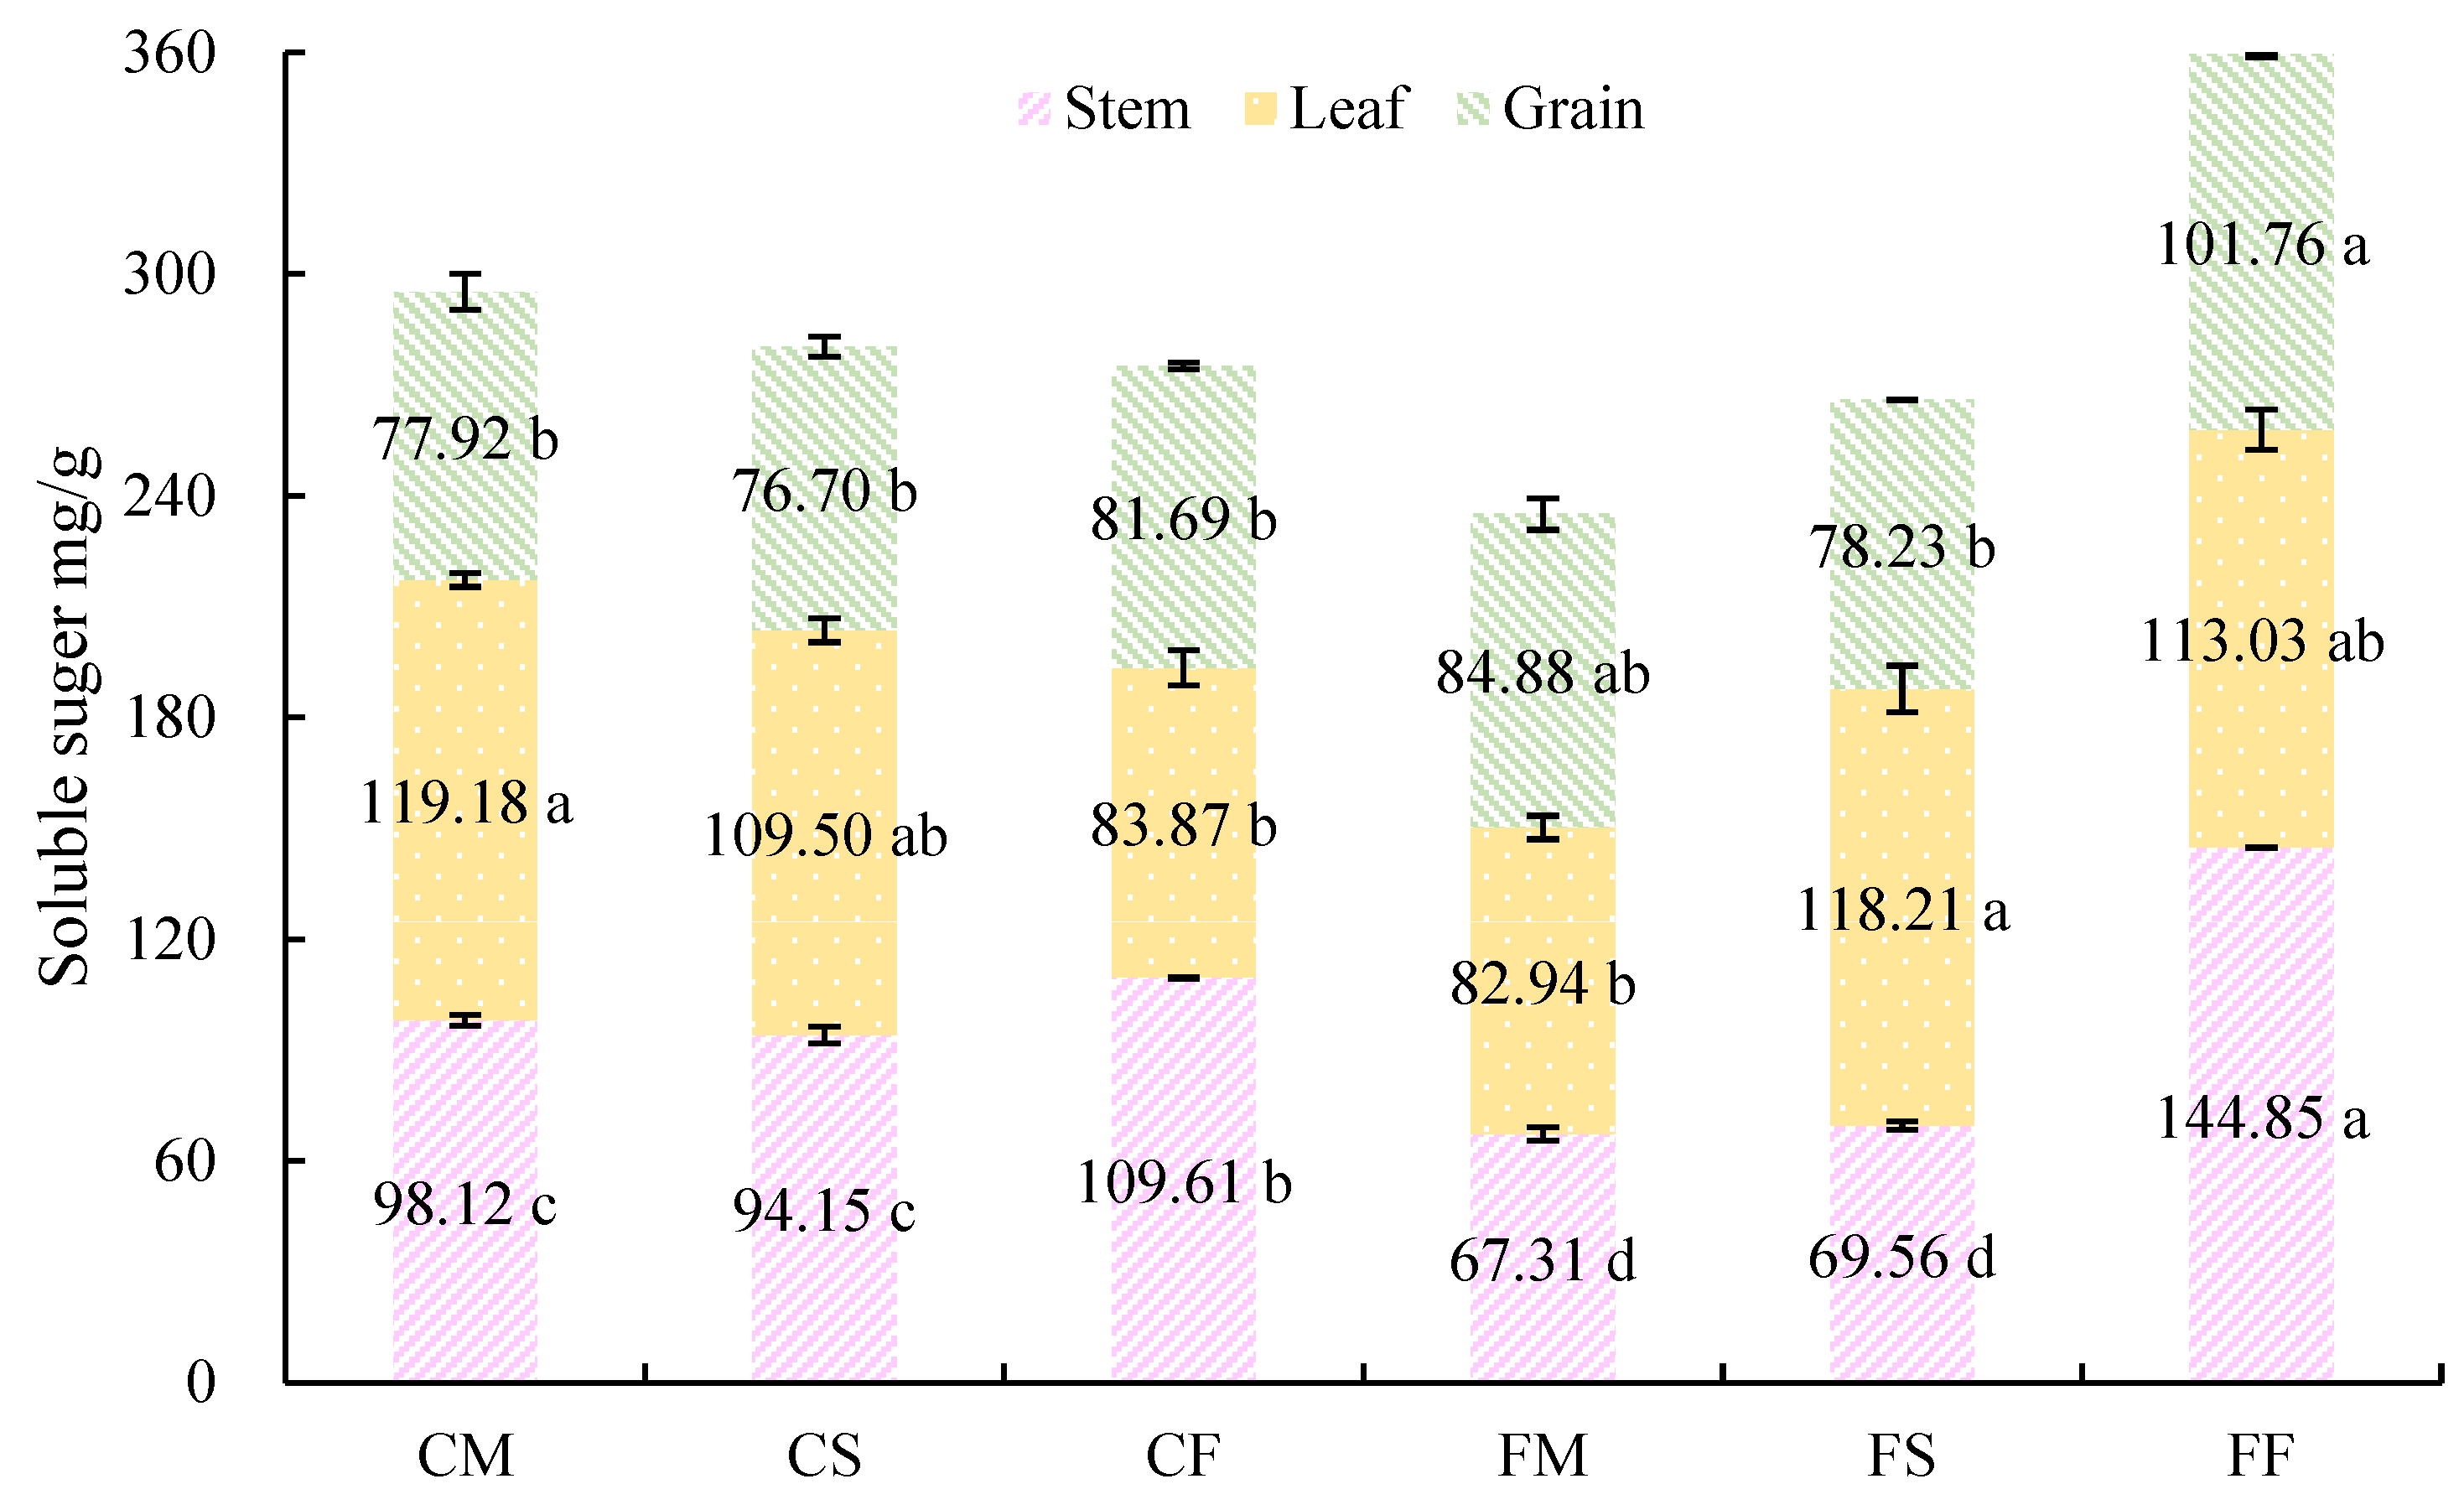
3.3. Enzyme Activity and Soluble Sugar Content
3.4. Multiple Evaluation Models
4. Discussion
4.1. Effects of Irrigation and Fertilization Management on Yield
4.2. Effects of Irrigation and Fertilization Management on Quality
4.3. Multiple Evaluation Models of Rice Quality
5. Conclusions
Author Contributions
Funding
Data Availability Statement
Conflicts of Interest
References
- Hemmati, S.; Yaghmaeian, N.; Farhangi, M.B.; Sabouri, A. Soil quality assessment of paddy fields (in Northern Iran) with different productivities: Establishing the critical limits of minimum data set indicators. Environ. Sci. Pollut. Res. 2023, 30, 10286–10296. [Google Scholar] [CrossRef]
- Zheng, C.; Liu, C.T.; Liu, L.; Tan, Y.N.; Sheng, X.B.; Yu, D.; Sun, Z.Z.; Sun, X.W.; Chen, J.; Yuan, D.Y.; et al. Effect of salinity stress on rice yield and grain quality: A meta-analysis. Eur. J. Agron. 2023, 144, 126765. [Google Scholar] [CrossRef]
- Zhang, Y.J.; Zhang, W.; Wu, M.; Liu, G.S.; Zhang, Z.J.; Yang, J.C. Effects of irrigation schedules and phosphorus fertilizer rates on grain yield and quality of upland rice and paddy rice. Environ. Exp. Bot. 2021, 186, 104465. [Google Scholar] [CrossRef]
- Hu, X.Q.; Zhang, W.X.; Shao, Y.F.; Yu, Y.H.; Lu, L.; Chen, M.X. Analysis on high quality rate of rice in China during recent 20 years. China Rice 2021, 27, 84–87. [Google Scholar] [CrossRef]
- Jiang, Z.W.; Yang, S.H.; Pang, Q.Q.; Xu, Y.; Chen, X.; Sun, X.; Qi, S.T.; Yu, W.Q. Biochar improved soil health and mitigated greenhouse gas emission from controlled irrigation paddy field: Insights into microbial diversity. J. Clean. Prod. 2021, 318, 128595. [Google Scholar] [CrossRef]
- Hale, L.; Curtis, D.; Azeem, M.; Montgomery, J.; Crowley, D.E.; McGiffen, M.E. Influence of compost and biochar on soil biological properties under turfgrass supplied deficit irrigation. Appl. Soil Ecol. 2021, 168, 104134. [Google Scholar] [CrossRef]
- Sriphirom, P.; Chidthaisong, A.; Towprayoon, S. Effect of alternate wetting and drying water management on rice cultivation with low emissions and low water used during wet and dry season. J. Clean. Prod. 2019, 223, 980–988. [Google Scholar] [CrossRef]
- Chen, Y.; Wang, M.; Ouwerkerk, B.F.P. Molecular and environmental factors determining grain quality in rice. Food Energy Secur. 2012, 1, 111–132. [Google Scholar] [CrossRef]
- Dien, D.C.; Mochizuki, T.; Yamakawa, T. Effect of various drought stresses and subsequent recovery on proline, total soluble sugar and starch metabolisms in Rice (Oryza sativa L.) varieties. Plant Prod. Sci. 2019, 22, 530–545. [Google Scholar] [CrossRef] [Green Version]
- Zhao, C.; Chen, M.Y.; Li, X.F.; Dai, Q.G.; Xu, K.; Guo, B.W.; Hu, Y.J.; Wang, W.L.; Huo, Z.Y. Effects of Soil Types and Irrigation Modes on Rice Root Morphophysiological Traits and Grain Quality. Agronomy 2021, 11, 120. [Google Scholar] [CrossRef]
- Ahmed, N.; Tetlow, I.J.; Nawaz, S.; Iqbal, A.; Mubin, M.; ul Rehman, M.S.N.; Butt, A.; Lightfoot, D.A.; Maekawa, M. Effect of high temperature on grain filling period, yield, amylose content and activity of starch biosynthesis enzymes in endosperm of basmati rice. J. Sci. Food Agric. 2015, 95, 2237–2243. [Google Scholar] [CrossRef]
- Chen, J.; Huang, Y.; Tang, Y.H. Quantifying economically and ecologically optimum nitrogen rates for rice production in south-eastern China. Agric. Ecosyst. Environ. 2011, 142, 195–204. [Google Scholar] [CrossRef]
- Xu, F.Y.; Song, T.; Wang, K.; Xu, W.F.; Chen, G.L.; Xu, M.; Zhang, Q.; Liu, J.P.; Zhu, Y.Y.; Rensing, C.; et al. Frequent alternate wetting and drying irrigation mitigates the effect of low phosphorus on rice grain yield in a 4-year field trial by increasing soil phosphorus release and rice root growth. Food Energy Secur. 2020, 9, e206. [Google Scholar] [CrossRef]
- Zhu, Y.Y.; Song, B.X.; Yang, W.M.; Zhang, Y.P.; Gao, Z.H.; Chen, X.Y. Effects of Reduced Nitrogen Application on Rice Growth, Yield and Economy Profits under Dry Farming Conditions. Energy Env. Sci. 2021, 30, 2150–2156. [Google Scholar]
- Sfez, S.; De Meester, S.; Dewulf, J. Co-digestion of rice straw and cow dung to supply cooking fuel and fertilizers in rural India: Impact on human health, resource flows and climate change. Sci. Total Environ. 2017, 609, 1600–1615. [Google Scholar] [CrossRef]
- Amin, M.G.M.; Lima, L.A.; Rahman, A.; Liu, J.; Jahangir, M.M.R. Dairy Manure Application Effects on Water Percolation, Nutrient Leaching and Rice Yield Under Alternate Wetting and Drying Irrigation. Int. J. Plant Prod. 2022, 17, 95–107. [Google Scholar] [CrossRef]
- Zahra, N.; Hafeez, M.B.; Nawaz, A.; Farooq, M. Rice production systems and grain quality. J. Cereal Sci. 2022, 105, 103463. [Google Scholar] [CrossRef]
- Zhang, W.Y.; Zhu, L.Q.; Wang, W.; Zhang, Z.W.; Bian, X.M. Effect of wheat straw returning under different irrigation methods on rice growth. Crops 2014, 2, 113–118. [Google Scholar]
- Hu, T.T.; He, Q.; Hong, X.; Liu, J.; Li, H.X.; Feng, P.Y.; Wang, L.; Yang, S.H. Response of tomato yield-quality evaluated by fuzzy Borda combined model to irrigation and fertilization supply. Trans. Chin. Soc. Agric. Eng. 2019, 35, 142–151. [Google Scholar]
- Shi, S.J.; Wang, E.T.; Li, C.X.; Zhou, H.; Cai, M.L.; Cao, C.G.; Jiang, Y. Comprehensive Evaluation of 17 Qualities of 84 Types of Rice Based on Principal Component Analysis. Foods 2021, 10, 2883. [Google Scholar] [CrossRef]
- Fei, L.W.; Guo, J.J.; Liu, W.B.; Ma, A.L.Y.; Wang, M.; Ling, N.; Guo, S.W. Determining optimal nitrogen management to improve rice yield, quality and nitrogen use efficiency based on multi-index decision analysis method. J. Sci. Food Agric. 2023, 103, 2357–2366. [Google Scholar] [CrossRef] [PubMed]
- Zheng, E.N.; Zhu, Y.H.; Hu, J.Y.; Zhang, Z.X.; Xu, T.Y. Effects of humic acid on japonica rice production under different irrigation practices and a TOPSIS-based assessment on the Songnen Plain, China. Irrig. Sci. 2022, 40, 87–101. [Google Scholar] [CrossRef]
- Zhu, K.Y.; Zhao, Y.H.; Ma, Y.B.; Zhang, Q.; Kang, Z.; Hu, X.H. Drip irrigation strategy for tomatoes grown in greenhouse on the basis of fuzzy Borda and K-means analysis method. Agric. Water Manag. 2022, 267, 107598. [Google Scholar] [CrossRef]
- Du, L.B.; Gao, J. Risk and income evaluation decision model of PPP project based on fuzzy borda method. Math. Probl. Eng. 2021, 2021, 6615593. [Google Scholar] [CrossRef]
- Sun, M.J.; Kang, X.R.; Wang, T.T.; Fan, L.R.; Wang, H.; Pan, H.; Yang, Q.G.; Liu, H.M.; Lou, Y.H.; Zhuge, Y.P. Genotypic diversity of quality traits in Chinese foxtail millet (Setaria italica L.) and the establishment of a quality evaluation system. Food Chem. 2021, 353, 129421. [Google Scholar] [CrossRef]
- Yang, J.C.; Zhang, J.H.; Wang, Z.Q.; Zhu, Q.S. Activities of starch hydrolytic enzymes and sucrose-phosphate synthase in the stems of rice subjected to water stress during grain filling. J. Exp. Bot. 2001, 52, 2169–2179. [Google Scholar] [CrossRef]
- Chen, G.Y.; Peng, L.G.; Gong, J.; Wang, J.; Wu, C.Y.; Sui, X.D.; Tian, Y.F.; Hu, M.M.; Li, C.M.; He, X.M.; et al. Effects of water stress on starch synthesis and accumulation of two rice cultivars at different growth stages. Front. Plant Sci. 2023, 14, 1133524. [Google Scholar] [CrossRef]
- Hou, X.H.; Fan, J.L.; Hu, W.H.; Zhang, F.C.; Yan, F.L.; Xiao, C.; Li, Y.P.; Cheng, H.L. Optimal irrigation amount and nitrogen rate improved seed cotton yield while maintaining fiber quality of drip-fertigated cotton in northwest China. Ind. Crops Prod. 2021, 170, 113710. [Google Scholar] [CrossRef]
- Liu, X.G.; Peng, Y.L.; Yang, Q.L.; Wang, X.K.; Cui, N.B. Determining optimal deficit irrigation and fertilization to increase mango yield, quality, and WUE in a dry hot environment based on TOPSIS. Agric. Water Manag. 2021, 245, 106650. [Google Scholar] [CrossRef]
- Arif, C.; Setiawan, B.I.; Saputra, S.F.D.; Mizoguchi, M. Water balance analysis in water management in the System of Rice Intensification-Organic (SRI-Organic) in West Java, Indonesia. J. Irig. 2019, 14, 17–24. [Google Scholar] [CrossRef]
- Zhou, T.Y.; Chen, L.; Wang, W.L.; Xu, Y.J.; Zhang, W.Y.; Zhang, H.; Liu, L.J.; Wang, Z.Q.; Gu, J.F.; Yang, J.C. Effects of application of rapeseed cake as organic fertilizer on rice quality at high yield level. J. Sci. Food Agric. 2022, 102, 1832–1841. [Google Scholar] [CrossRef]
- Tang, J.C.; Zhang, R.Y.; Li, H.C.; Zhang, J.; Chen, S.Q.; Lu, B.L. Effect of the Applied Fertilization Method under Full Straw Return on the Growth of Mechanically Transplanted Rice. Plants 2020, 9, 399. [Google Scholar] [CrossRef] [Green Version]
- Xu, Y.; Sun, L.J.; Du, L.Y.; Jiang, M.H.; Zhu, S.W.; Guo, K.; Meng, Z. Influencing factors on soil nitrogen leaching under traditional managements of dry farmland. Chin. J. Soil Sci. 2020, 51, 1246–1254. [Google Scholar] [CrossRef]
- Guo, Y.X.; Li, S.; Zhang, Z.G.; Li, Y.; Hu, Z.B.; Xin, D.W.; Chen, Q.S.; Wang, J.G.; Zhu, R.S. Automatic and Accurate Calculation of Rice Seed Setting Rate Based on Image Segmentation and Deep Learning. Front. Plant Sci. 2021, 12, 770916. [Google Scholar] [CrossRef]
- Custodio, M.C.; Cuevas, R.P.; Ynion, J.; Laborte, A.G.; Velasco, M.L.; Demont, M. Rice quality: How is it defined by consumers, industry, food scientists, and geneticists? Trends Food Sci. Technol. 2019, 92, 122–137. [Google Scholar] [CrossRef]
- Tian, J.Y.; Xing, Z.P.; Li, S.P.; Cheng, S.; Guo, B.W.; Hu, Y.J.; Wei, H.Y.; Gao, H.; Zhang, Z.Z.; Fan, P.; et al. Influence of Wheat Straw Return on Yield and Grain Quality in Different Direct-Seeding Rice Production Systems. Agronomy 2022, 12, 3180. [Google Scholar] [CrossRef]
- Ishfaq, M.; Akbar, N.; Zulfiqar, U.; Ali, N.; Ahmad, M.; Anjum, S.A.; Farooq, M. Influence of water management techniques on milling recovery, grain quality and mercury uptake in different rice production systems. Agric. Water Manag. 2021, 243, 106500. [Google Scholar] [CrossRef]
- Xiong, R.Y.; Xie, J.X.; Chen, L.M.; Yang, T.T.; Tan, X.M.; Zhou, Y.J.; Pan, X.H.; Zeng, Y.J.; Shi, Q.H.; Zhang, J.; et al. Water irrigation management affects starch structure and physicochemical properties of indica rice with different grain quality. Food Chem. 2021, 347, 129045. [Google Scholar] [CrossRef]
- Fageria, N.K.; Santos, A.B.; Filho, M.P.B.; Guimarães, C.M. Iron Toxicity in Lowland Rice. J. Plant Nutr. 2008, 31, 1676–1697. [Google Scholar] [CrossRef]
- Shi, S.J.; Wang, E.T.; Li, C.X.; Cai, M.L.; Cheng, B.; Cao, C.G.; Jiang, Y. Use of Protein Content, Amylose Content, and RVA Parameters to Evaluate the Taste Quality of Rice. Front. Nutr. 2022, 8, 758547. [Google Scholar] [CrossRef]
- Nayak, D.K.; Sahoo, S.; Barik, S.R.; Sanghamitra, P.; Sangeeta, S.; Pandit, E.; Raj, K.R.R.; Basak, N.; Pradhan, S.K. Association mapping for protein, total soluble sugars, starch, amylose and chlorophyll content in rice. BMC Plant Biol. 2022, 22, 620. [Google Scholar] [CrossRef] [PubMed]


| Fertilizer | Base Fertilizer (BF) | Tillering Fertilizer (TF) | Panicle Fertilizer (PF) | Total | |
|---|---|---|---|---|---|
| Type | Compound fertilizer N: P2O5: K2O = 19%: 9%: 17% | Urea: TN ≥ 46.0% | Urea: TN ≥ 46.0% | Urea: TN ≥ 46.0% | |
| Date | 3 July | 11 July | 16 August | ||
| N (kg/hm2) | 84.00 | 103.95 | 69.30 | 55.44 | 312.69 |
| P2O5 (kg/hm2) | 47.25 | 47.25 | |||
| K2O (kg/hm2) | 89.25 | 89.25 | |||
| Treatments | Panicle Number (PN) | Effective Panicle Number (EPN)/m−2 | Number of Grains per Panicle (NGPP) | Seed Setting Rate (SR)/% | Thousand Seed Weight (TSW)/g | Yield/kg·hm−2 | Irrigation Water Use (IWU)/mm | Irrigation Water Use Efficiency (IWUE)/kg·m−3 |
|---|---|---|---|---|---|---|---|---|
| CM | 13 ± 3 b | 480 ± 40.5 a | 157 ± 10.75 c | 0.79 ± 0.1 ab | 24.3 ± 0.86 ab | 12247.98 ± 2091.28 ab | 652.35 ± 5.26 bc | 1.88 ± 0.31 b |
| CS | 15 ± 2.08 ab | 444 ± 7.09 ab | 160 ± 3.22 c | 0.81 ± 0.13 a | 24.17 ± 0.46 ab | 11787.15 ± 1547.26 ab | 487.16 ± 176.09 c | 2.42 ± 0.3 a |
| CF | 16 ± 0 ab | 448 ± 3.41 ab | 174 ± 1.52 b | 0.62 ± 0 b | 23.29 ± 0.92 b | 9594.76 ± 357.18 b | 422.38 ± 13.88 c | 2.27 ± 0.01 a |
| FM | 18 ± 3.61 a | 420 ± 10.5 b | 196 ± 1.15 a | 0.73 ± 0.05 ab | 24.4 ± 0.21 ab | 12459.37 ± 817.19 a | 966.53 ± 44.88 ab | 1.29 ± 0.03 c |
| FS | 13 ± 1.53 b | 420 ± 21.22 b | 189 ± 9.05 a | 0.71 ± 0.04 ab | 24.89 ± 0.59 a | 11903.38 ± 972.55 ab | 935.25 ± 354.72 ab | 1.27 ± 0.15 c |
| FF | 17 ± 1 ab | 476 ± 0 a | 155 ± 1.01 c | 0.69 ± 0.07 ab | 24.27 ± 0.24 ab | 10570.11 ± 1275.13 ab | 1157.88 ± 233.05 a | 0.91 ± 0.08 c |
| Significance test | ||||||||
| Irrigation level | NS | NS | ** | NS | NS | NS | ** | ** |
| Fertilizer level | NS | NS | * | NS | NS | * | NS | NS |
| Irrigation level ×Fertilizer level | * | ** | ** | NS | NS | NS | NS | * |
| Treatments | CM | CS | CF | FM | FS | FF | |
|---|---|---|---|---|---|---|---|
| Milling quality | Brown rice rate/% | 82.43 ± 0.12 a | 82.93 ± 0.45 a | 82.5 ± 0.17 a | 82.43 ± 0.47 a | 82.67 ± 0.23 a | 83 ± 1 a |
| Polished rice rate/% | 54.2 ± 3.05 ab | 57.23 ± 2.25 a | 51.6 ± 0.36 b | 54.97 ± 3.73 ab | 57.3 ± 1.39 a | 53.4 ± 0.35 ab | |
| Head milled rice rate/% | 68.37 ± 1.06 ab | 69.7 ± 1.35 a | 67.8 ± 0.4 bc | 66.23 ± 1.16 c | 67.87 ± 0.38 bc | 68.1 ± 0.1 ab | |
| Appearance quality | Chalky grain rate/% | 24.67 ± 2.31 a | 28.67 ± 6.81 a | 19 ± 1.91 a | 21.33 ± 4.51 a | 25.33 ± 7.64 a | 20 ± 0.69 a |
| Chalkiness/% | 4.43 ± 0.64 a | 5.03 ± 2.1 a | 3.2 ± 0.36 a | 4 ± 0.98 a | 4.37 ± 1.63 a | 3 ± 0.17 a | |
| Transparency/level | 1 ± 0 a | 1 ± 0 a | 1 ± 0 a | 1.33 ± 0.58 a | 1 ± 0 a | 1 ± 0 a | |
| Grain length/mm | 5.03 ± 0.06 a | 5.07 ± 0.06 a | 5 ± 0 a | 5.03 ± 0.06 a | 5.03 ± 0.06 a | 5 ± 0 a | |
| Length-to-width ratio | 1.8 ± 0 a | 1.77 ± 0.06 a | 1.8 ± 0 a | 1.73 ± 0.06 a | 1.77 ± 0.06 a | 1.8 ± 0 a | |
| Cooking quality | Adhesive strength/mm | 78 ± 5.29 ab | 69.67 ± 2.52 b | 80 ± 5.29 a | 70.67 ± 6.43 b | 69 ± 7 b | 86 ± 5.29 a |
| Amylose content/% | 9.03 ± 0.06 a | 8.93 ± 0.57 a | 8.6 ± 0.2 a | 8.83 ± 0.9 a | 8.87 ± 0.61 a | 9 ± 0.17 a | |
| Alkali spreading value/level | 6.5 ± 0.1 a | 6.37 ± 0.06 a | 6.4 ± 0.1 a | 6.43 ± 0.15 a | 6.63 ± 0.06 a | 6.6 ± 0.26 a | |
| Protein | 7.86 ± 0.17 a | 8.39 ± 0.82 a | 8.03 ± 0.04 a | 8.5 ± 0.85 a | 8.71 ± 0.33 a | 8.3 ± 0.22 a | |
| Taste value | 83.67 ± 0.58 a | 82.33 ± 1.53 a | 82 ± 1 a | 81.33 ± 2.52 a | 82 ± 1.73 a | 84 ± 1.73 a | |
| RVA | Breakdown value/BDV | 67 ± 3.87 a | 62.63 ± 1.22 ab | 63.9 ± 1.11 ab | 56.33 ± 7 b | 55.7 ± 2.02 b | 61.5 ± 5.89 ab |
| Peak viscosity value/PKV | 209.33 ± 6.51 a | 192.33 ± 7.23 b | 202 ± 4.36 ab | 195 ± 10.15 ab | 187.67 ± 6.43 b | 197 ± 6.08 ab | |
| Recooling value/RCV | 45.3 ± 1.31 a | 44.33 ± 0.81 a | 45.8 ± 0.53 a | 45.17 ± 2.04 a | 45.07 ± 0.74 a | 45 ± 1.8 a | |
| Cool paste viscosity/CPV | 187.33 ± 10.41 a | 173.67 ± 6.81 b | 184 ± 2.65 ab | 183.67 ± 4.93 ab | 176.67 ± 3.79 ab | 180 ± 5 ab | |
| Hot paste viscosity/HPV | 142 ± 10.15 a | 129.33 ± 6.43 a | 139 ± 2 a | 138.67 ± 4.51 a | 131.67 ± 4.73 a | 135 ± 3.61 a | |
| Setback value/SBV | −21.7 ± 4.36 b | −18.3 ± 1.59 b | −18.1 ± 0.1 b | −11.17 ± 5.15 a | −10.59 ± 2.67 a | −16.5 ± 0.5 ab | |
| Treatments | Alpha-Amylase | ADP-Glucose Pyrophosphorylase (ADPG) | Granule-Bound Starch Synthase (GBSS) |
|---|---|---|---|
| CM | 2.06 ± 0.12 bc | 6.95 ± 0.78 a | 0.61 ± 0.01 ab |
| CS | 2.37 ± 0 a | 7.39 ± 0.84 a | 0.62 ± 0.02 a |
| CF | 2.04 ± 0.07 bc | 6.44 ± 0.06 a | 0.56 ± 0.01 bc |
| FM | 1.89 ± 0.04 c | 6.91 ± 0.54 a | 0.56 ± 0.03 bc |
| FS | 2.21 ± 0.19 ab | 7.38 ± 0.45 a | 0.59 ± 0.04 abc |
| FF | 2.11 ± 0.09 b | 7.42 ± 0.81 a | 0.54 ± 0.01 c |
| Significance test | |||
| Irrigation level | NS | NS | * |
| Fertilizer level | ** | NS | * |
| Irrigation level × Fertilizer level | NS | NS | NS |
| Treatments | Grey Relational Degree Analysis | Entropy Method | TOPSIS | Fuzzy Borda | ||||
|---|---|---|---|---|---|---|---|---|
| Values | Rank | Values | Rank | Values | Rank | Values | Rank | |
| CM | 0.961 | 2 | 0.537 | 2 | 0.500 | 2 | 10.000 | 2 |
| CS | 0.969 | 1 | 0.655 | 1 | 0.578 | 1 | 15.000 | 1 |
| CF | 0.949 | 5 | 0.324 | 6 | 0.354 | 6 | 0.725 | 6 |
| FM | 0.950 | 4 | 0.391 | 5 | 0.443 | 4 | 2.562 | 4 |
| FS | 0.961 | 3 | 0.498 | 3 | 0.466 | 3 | 6.000 | 3 |
| FF | 0.931 | 6 | 0.400 | 4 | 0.409 | 5 | 1.705 | 5 |
| Correlation Coefficient | Grey Relational Degree Analysis | Entropy Method | TOPSIS | Average |
|---|---|---|---|---|
| Grey relational degree analysis | 0.690 | 0.828 * | 0.759 | |
| Entropy method | 0.690 | 0.867 * | 0.779 | |
| TOPSIS | 0.828 * | 0.867 * | 0.848 |
| Treatments | 2020 | 2021 | ||||||
|---|---|---|---|---|---|---|---|---|
| D+ | D− | Score | Ranking | D+ | D− | Score | Ranking | |
| CM | 0.465 | 0.625 | 0.574 | 2 | 0.288 | 0.44 | 0.604 | 2 |
| CS | 0.413 | 0.738 | 0.641 | 1 | 0.309 | 0.573 | 0.649 | 1 |
| CF | 0.754 | 0.648 | 0.462 | 4 | 0.504 | 0.324 | 0.391 | 5 |
| FM | 0.787 | 0.394 | 0.334 | 5 | 0.344 | 0.433 | 0.557 | 3 |
| FS | 0.623 | 0.633 | 0.504 | 3 | 0.362 | 0.326 | 0.474 | 4 |
| FF | 0.748 | 0.280 | 0.273 | 6 | 0.495 | 0.284 | 0.364 | 6 |
Disclaimer/Publisher’s Note: The statements, opinions and data contained in all publications are solely those of the individual author(s) and contributor(s) and not of MDPI and/or the editor(s). MDPI and/or the editor(s) disclaim responsibility for any injury to people or property resulting from any ideas, methods, instructions or products referred to in the content. |
© 2023 by the authors. Licensee MDPI, Basel, Switzerland. This article is an open access article distributed under the terms and conditions of the Creative Commons Attribution (CC BY) license (https://creativecommons.org/licenses/by/4.0/).
Share and Cite
Hu, J.; Zhang, S.; Yang, S.; Zhou, J.; Jiang, Z.; Qi, S.; Xu, Y. Effects of Irrigation and Fertilization Management on Yield and Quality of Rice and the Establishment of a Quality Evaluation System. Agronomy 2023, 13, 2034. https://doi.org/10.3390/agronomy13082034
Hu J, Zhang S, Yang S, Zhou J, Jiang Z, Qi S, Xu Y. Effects of Irrigation and Fertilization Management on Yield and Quality of Rice and the Establishment of a Quality Evaluation System. Agronomy. 2023; 13(8):2034. https://doi.org/10.3390/agronomy13082034
Chicago/Turabian StyleHu, Jiazhen, Shuna Zhang, Shihong Yang, Jiaoyan Zhou, Zewei Jiang, Suting Qi, and Yi Xu. 2023. "Effects of Irrigation and Fertilization Management on Yield and Quality of Rice and the Establishment of a Quality Evaluation System" Agronomy 13, no. 8: 2034. https://doi.org/10.3390/agronomy13082034