Article

Refined Evaluation of Soil Quality Sustainability in the Main Grain-Producing Areas of Heilongjiang Province

1
School of Water Conservancy & Civil Engineering, Northeast Agricultural University, Harbin 150030, China
2
Key Laboratory of Effective Utilization of Agricultural Water Resources of Ministry of Agriculture, Northeast Agricultural University, Harbin 150030, China
3
College of Engineering, Northeast Agricultural University, Harbin 150030, China
4
Heilongjiang Provincial Key Laboratory of Water Resources and Water Conservancy Engineering in Cold Region, Northeast Agricultural University, Harbin 150030, China
5
National Key Laboratory of Smart Technology and System, Harbin 150030, China
*
Authors to whom correspondence should be addressed.
Agronomy 2023, 13(8), 2072; https://doi.org/10.3390/agronomy13082072
Submission received: 27 June 2023 / Revised: 3 August 2023 / Accepted: 4 August 2023 / Published: 7 August 2023

Abstract

:
An evaluation of soil quality sustainability can support decision making for the sustainable use of land resources. However, certain current problems associated with these evaluations remain unaddressed, e.g., the evaluation indicators do not fully reflect soil quality risks and the evaluation scale is not sufficiently small. In this study, 25,000 spatial grids of dimensions 3 km × 3 km are used to divide the major grain-producing regions in China, namely, the Sanjiang Plain and the Songnen Plain of Heilongjiang. Then, the soil erosion modulus, nutrient balance index, soil organic carbon (SOC) storage, heavy metal soil pollution index and crop productivity are calculated for each grid using the RULSE model, nutrient balance index model, soil type method, geoaccumulation index method and mechanism method, respectively. A spatial grid cluster analysis method is used to thoroughly evaluate and analyze the sustainability of soil quality in each grid. The results show that the overall soil status of the study area is good. The soil and water conservation levels are high, the soils show low levels of contamination, the crop production potential is high and the ratio of highly sustainable to moderately sustainable soils is approximately 2:1. Only 2.74% of the land is rated extremely unsustainable and needs to be restored to a basic level of productivity before subsequent functional restoration can be carried out. This study provides a new method for the fine-scale evaluation of soil quality and contributes to the management of land resources.

1. Introduction

Soil serves as the material basis for land resource functions. It is a finite resource, and its maintenance is necessary for sustainable land use and management. Furthermore, it serves as a vehicle for the multifunctional roles played by arable land [1]. However, most of the world’s soil resources are depleted, and one-third of arable land is in a moderately or highly degraded state [2]. The results of the Third National Land Survey show that China’s total arable land resources consist of 1.91 billion mu, which amounts to only 1.39 mu of arable land per capita. This is lower than the worldwide value of 3.15 mu per capita, so China is faced with a substantial depletion of arable land [3]. Heilongjiang Province is China’s largest agricultural province and has ranked first in the country in grain production for 13 consecutive years. The existing arable lands containing black soil cover 156 million mu, accounting for 56.1% of the arable land in the typical black soil areas of China, and the growth potential of crops is extremely large. Soil is a major resource that ensures adequate grain production in Heilongjiang Province. However, Heilongjiang Province’s grain production and sustainable agricultural development capacity have been limited by long-term, high-intensity soil use, frequent soil heavy metal pollution, nutrient imbalances, declining carbon stocks, soil erosion and other threats that have degraded soil functions; this situation poses a serious threat to Chinese grain production [4]. Therefore, it is important to assess the sustainability of soil quality in Heilongjiang Province and clarify the spatial distribution and drivers for soil quality sustainability (SQS) to ensure stability in national food production.
Many researchers are currently conducting studies to evaluate SQS. A prerequisite for the evaluation of SQS is the establishment of a sound indicator system; however, there is no unified system of indicators to characterize SQS. Duan considered soil quality in terms of soil type and soil physical properties for a sustainability assessment of land productivity [5]; Zhang evaluated the SQS through soil physical and chemical properties such as soil nutrients, soil water content, soil organic matter and soil salinity [6]; He developed a system of indicators that takes into account economic, social, urban and ecological factors [7]; Ibrahim and Valbon evaluated three factors, namely, agricultural land quality, agricultural land production potential and food security [8]; Fu established a system of indicators based on three types of land use: productive land, living land and ecological land [9]; and Nziguheba developed a system of indicators that included soil erosion, soil acidification, crop productivity, nutrient balance and SOC [10]. For evaluating soil quality in Heilongjiang Province, Li developed a system of indicators in terms of soil physical properties and soil nutrients [11], to which Zhao added biodiversity, carbon sequestration and water use [12]. However, previous studies have not delved into the quality conditions necessary for soils to function as arable land, and there is a lack of research on evaluating soil quality in terms of soil water and soil conservation capacity, soil pollution, soil fertility, soil carbon pool and the productive potential of soils when they are used as arable land.
Numerous methods exist for assessing the sustainability of soil quality. Geng used principal component analysis combined with the entropy weight method [13]; Xie used a minimum dataset combined with the TOPSIS method [14]; Ouyang used the projection pursuit method; and Santos used this method to evaluate soil quality [15]. In addition, Pang established a novel system for evaluating soil and water quality based on the integrated evaluation method of the IOWA operator [16]. However, the scale of evaluation in these studies was not sufficiently refined, and the evaluation was highly subjective. Soil environmental systems are highly dynamic, and the distribution of factors affecting soil quality is typically complex [17]. Land degradation and sustainable land management (SLM) monitoring and assessment systems must be highly accurate to support SLM decision making [18]. The grid fuzzy clustering method combines the advantages of grid-based evaluation and fuzzy evaluation and can obtain the fine distribution characteristics of evaluation factors while unifying evaluation criteria on a large scale to obtain final evaluation results for each spatial grid, and the subjective impact of the human operator is reduced by soft segmentation of evaluation indicators. Shao used a fuzzy grid clustering method to classify potential groundwater zones [19], Chen first defined different carbon-landscape zones via Gaussian mixture models [20] and Liang formulated groundwater resource and land use management policies via CA methods [21], demonstrating the theoretical feasibility of this method. However, few studies have been carried out to fine-tune the evaluation of SQS within a grid while accounting for the multidimensional functions of soil within the fields of production, ecology and socioeconomics, and even fewer studies have been carried out within the main grain-producing areas of Heilongjiang Province.
To address the above problems, the main purpose of this paper is to propose corresponding land resource management decisions for different areas based on the evaluation results and the actual land use situation. To achieve this purpose, the Sanjiang Plain and the Songnen Plain are adopted as the research objects. They are divided into 25,000 3 km × 3 km networks, and the soil erosion modulus, soil heavy metal pollution index, SOC storage, soil nutrient balance index and soil crop production potential index in each grid of the two plains are calculated after meteorological factors, topographical conditions, fertilizer use and soil physical properties are established for each grid in the study area. The fuzzy cluster analysis method is used for the network to assess the sustainability of soil quality on a fine scale in the Sanjiang Plain and the Songnen Plain of Heilongjiang Province.

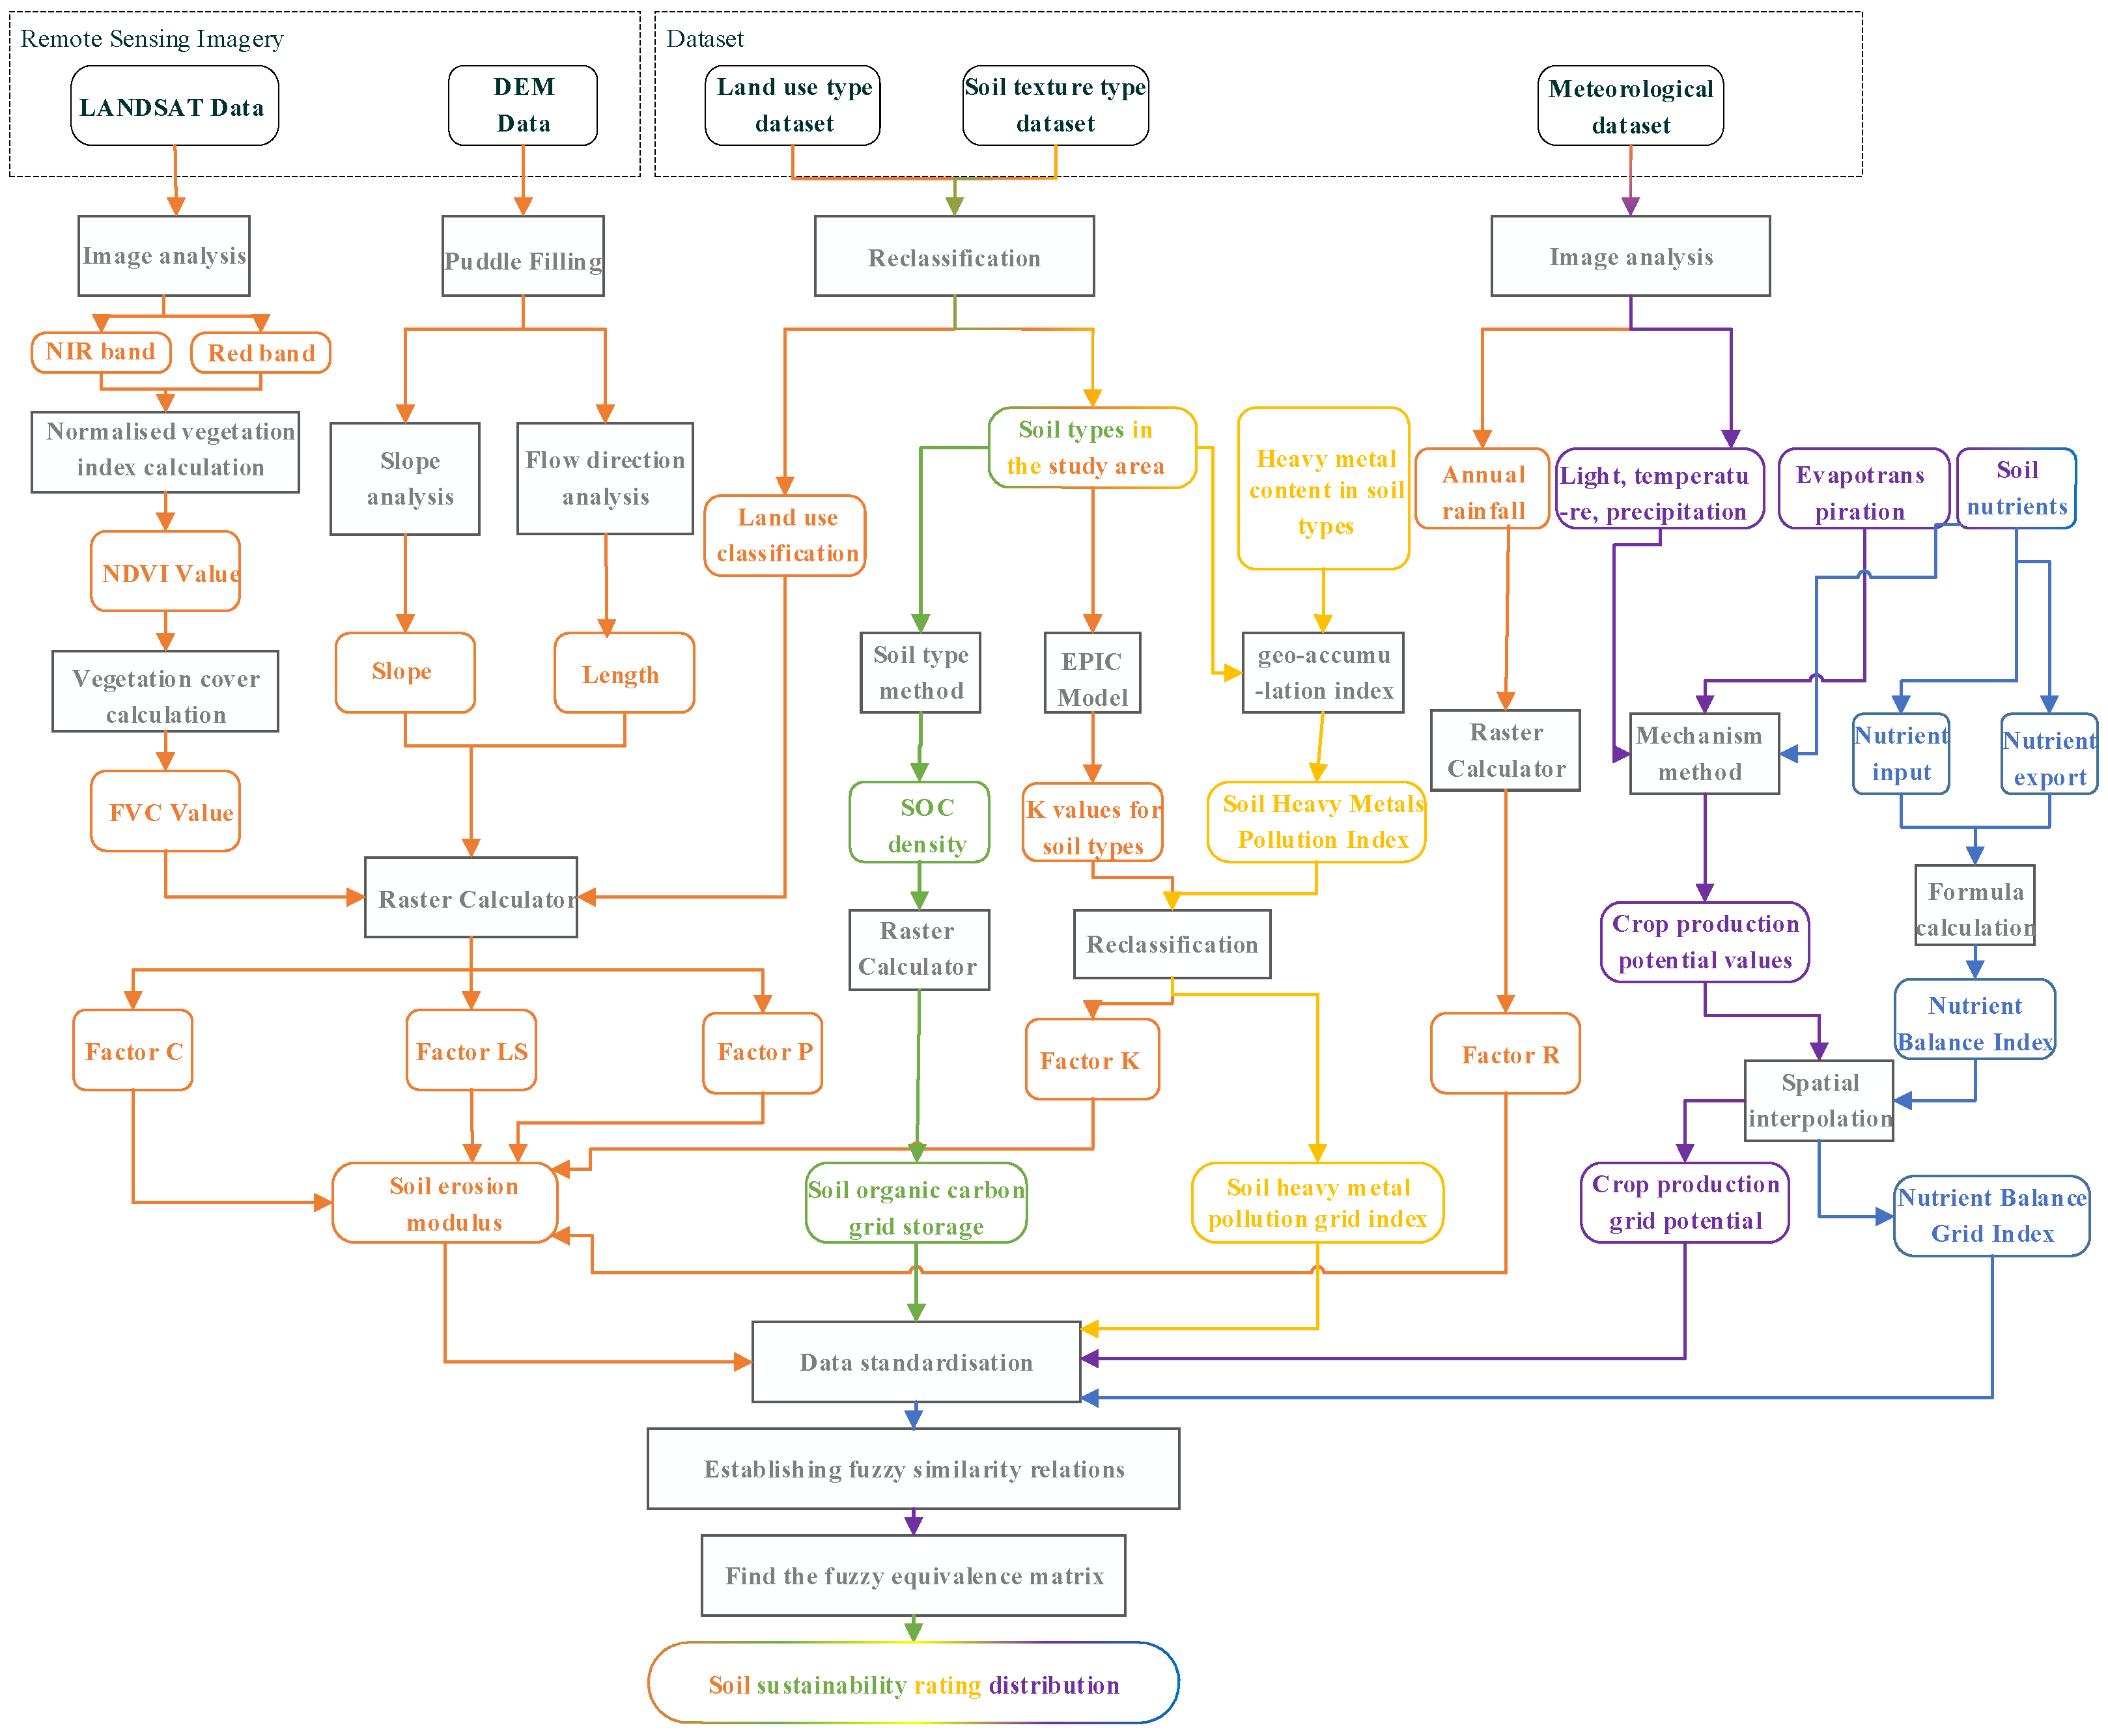
2. Materials and Methods

2.1. Indicators for Evaluating Soil Quality Sustainability

2.1.1. Soil Erosion

Soil erosion reflects soil and water conservation status [22]. As an important regulation service, SC indicates the capacity for reducing soil erosion and maintaining soil fertility [23]. Severe soil erosion can lead to problems such as loose soil and reduced biodiversity [24]. It was quantified in this study through the commonly used soil erosion equation (RUSLE), an empirical model developed by American researchers through experiments and adopted by Chinese and international researchers to estimate the soil erosion modulus. The model accounts for the dynamics of soil erosion, receptor protection, soil properties, topography and other erosion-related environmental factors [25]. The soil erosion modulus is described in Equation (1):
A = R K L S C P
where A is the annual soil erosion, R is the rainfall erosion force, K is the soil erodibility, the slope factor S and the slope length factor L are collectively referred to as the topography factors, C is the vegetation measurement factor and P is the soil conservation factor, and the calculation method for each factor is given in Appendix A.

2.1.2. Land Crop Production Potential

Crop production potential is estimated in terms of light, temperature, irrigation and soil; it also integrates the effects of climatic and hydric soil conditions on crop growth and is important in determining whether soils are sustainable for use as cropland [26]. In this study, the mechanism method was used to characterize the productive potential of land. The method involves a stepwise revision of the photosynthetic production potential to determine the land production potential, which is summarized in Equation (2):
Y S = Q f ( Q ) f ( T ) f ( W ) f ( S )
where Y S is the grain production potential; Q is the total solar radiation; f ( Q ) is the photosynthetic efficiency factor; f ( T ) is the temperature efficiency factor; f ( W ) is the moisture efficiency factor; and f ( S ) is the soil efficiency factor. The calculation of each factor in the formula is given in Appendix B.

2.1.3. Soil Nutrient Balance

In this study, the soil nutrient balance characterizes the fertility of farmland soils [27]. The nutrient balance index I is calculated using the nutrient balance index model by employing the following formula.
I = N i n + P i n + K i n N o u t P o u t K o u t N i n + P i n + K i n
In the nutrient input section, the nutrient input pathways for agricultural soils include chemical fertilizer input, organic fertilizer input, seeds, irrigation water, straw return, nutrient input from wet and dry atmospheric deposition, and biological nitrogen fixation, and the nutrient input equation is calculated as follows:
{ P i n = P c f e r + P o f e r + P s e e d + P i r r + P s t r + P d e p N i n = N c f e r + N o f e r + N s e e d + N i r r + N s t r + N d e p K i n = K c f e r + K o f e r + K s e e d + K i r r + K s t r + K d e p + N b n f
where N i n is the total nitrogen input to the agricultural soil, kg; and N c f e r , N o f e r , N s e e d , N i r r , N s t r , N d e p and N b n f are the nitrogen inputs from chemical nitrogen fertilizers, organic fertilizers, seeds, irrigation water, straw return, dry and wet atmospheric deposition, and biological nitrogen fixation, respectively. P i n is the total input of phosphorus to the agricultural soil, kg; and P c f e r , P o f e r , P s e e d , P i r r , P s t r and P d e p are the inputs of phosphorus from chemical phosphate fertilizers, organic fertilizers, seeds, irrigation water, straw return, and dry and wet atmospheric deposition, respectively. K i n is the total potassium input to agricultural soils, kg; and K c f e r , Kofer, Kseed, K i r r , K s t r and K d e p are the potassium inputs from chemical potash, organic fertilizers, seeds, irrigation water, straw return, and dry and wet atmospheric deposition, respectively. The formulae for calculating the inputs of N, P and K are shown in Appendix C.
In the nutrient export section, the agricultural soil nutrient export pathways include crop seed export, crop straw export, nitrogen loss due to ammonia volatilization, loss due to surface runoff, loss due to subsurface leaching and nitrogen loss due to nitrification denitrification, and the nutrient export equation is calculated as follows:
{ P o u t = P o u t g r a i n + P o u t s t r a w + P s u r N o u t = N o u t g r a i n + N o u t s t r a w + N N H 3 + N s u r + N s u b + N d e n K o u t = K o u t g r a i n + K o u t s t r a w + K s u r
where N o u t is the total nitrogen output from agricultural soils, kg; and N o u t g r a i n , N o u t s t r a w , N N H 3 , N s u r , N s u b and N d e n are the nitrogen output from crop seeds, nitrogen output from crop residues, nitrogen losses from ammonia volatilization, nitrogen losses from surface runoff, nitrogen losses from subsurface leaching and nitrogen losses from nitrification denitrification, respectively. P o u t is the total phosphorus output from agricultural soils, kg; P o u t g r a i n and P o u t s t r a w are the phosphorus output from crop seeds, phosphorus output from crop residues and phosphorus losses from surface runoff. K o u t is the total potassium output from agricultural soils, kg; and K o u t g r a i n , K o u t s t r a w and K s u r are the potassium output from crop seeds, the potassium output from crop residues and the potassium losses from surface runoff, respectively. The specific details of the nutrient output calculation are given in Appendix C.

2.1.4. Heavy Metal Contamination of Soils

Soil heavy metals are biotoxic, nondegradable and persistent, and they pose substantial threats to the soil environment [28]. In this study, the geoaccumulation index method and the potential ecological hazard index method were used for calculating the soil heavy metal pollution index, and the ground accumulation index was calculated as follows.
I g e o = log 2 ( C n K B n )
where C n is the elemental content of a particular heavy metal, B n is the geochemical background value of the element measured, and K is a factor with a value of 1.5 and represents the variation in the background value.
The potential ecological hazard index method uses quantitative methods to classify the level of potential ecological risk. Equations (7) and (8) were used to calculate the potential ecological hazard factor ( E i ) for stress induced by a single heavy metal and the potential ecological hazard index ( R I ) for the cumulative stress due to the effect of multiple heavy metals, respectively.
E i = T i C i C 0
R I = i = 1 n E i
where n is the total number of heavy metal species (i = 1,2,3,…, n); C i is the content of heavy metals in the environment; C 0 is the calculated reference value; and T i is the toxicity factor for an element, based on values from [29] (see Supplementary Materials).

2.1.5. SOC Storage

SOC stock reduction is a key generic indicator of land and soil degradation and is inextricably linked to soil quality elements such as food, health, water, climate and land management [30]. In this study, by employing available data from a soil census conducted in China and the current soil classification system, the soil type method was used to calculate the density and storage of SOC in China’s soils.
M = j m A j T j
where A j is the area of a soil subclass and T j is the average SOC density of the subclass, i.e., the mass of SOC per unit area of 1 m depth, and m is the total number of soil subclasses included in the area ( j = 1   ,   2   ,   ,   m ) .
SOC density is determined by a combination of SOC content, gravel (particle size > 2 mm) content and bulk weight.
T 0 = k h ( 1 δ % ) ρ k c k d k 100
where for a soil profile divided into h layers, if the average SOC content in the kth layer of the profile is c k ( g kg - 1 ) , the average capacity is ρ k ( g cm - 3 ) , the volume fraction of the gravel is δ % and the thickness is d k ( cm ) ; then, the SOC density at this profile depth is T 0 ( kg m - 3 ) .
In most studies conducted in China and other countries, a 1 m depth has been used as a reference for calculations, which facilitates comparisons between results. For soils where the depth of the profile is generally less than 1 m, the original profile data should be used as a basis for calculating the SOC density at a depth of 1 m (the values for some soils cannot be calculated to a 1 m depth, because the soil layer is thin; the values for these soils should be calculated at the actual depth). The average SOC content of each soil layer is used as the horizontal coordinate ( c k ) , and the depth at the midpoint of each layer is used as the vertical coordinate ( y j ) . A nonlinear regression c = c ( y ) of the SOC content against the depth of the soil can be obtained by using the points ( c k , y k ) . The integration values are then solved for the required depth range using numerical calculation methods. Thus, the SOC density of the soil at a depth of 1 m T 1 m is
T 1 m = T 0 + y b 1 m ( 1 δ % ) ρ ( y ) c ( y ) 100 d y
where T 0 is the SOC density at the depth of the original profile, y is the depth coordinate, ρ ( y ) is the capacity function obtained by regression analysis of the average capacity of each soil layer and y b is the depth coordinate of the bottom edge of the original soil profile.

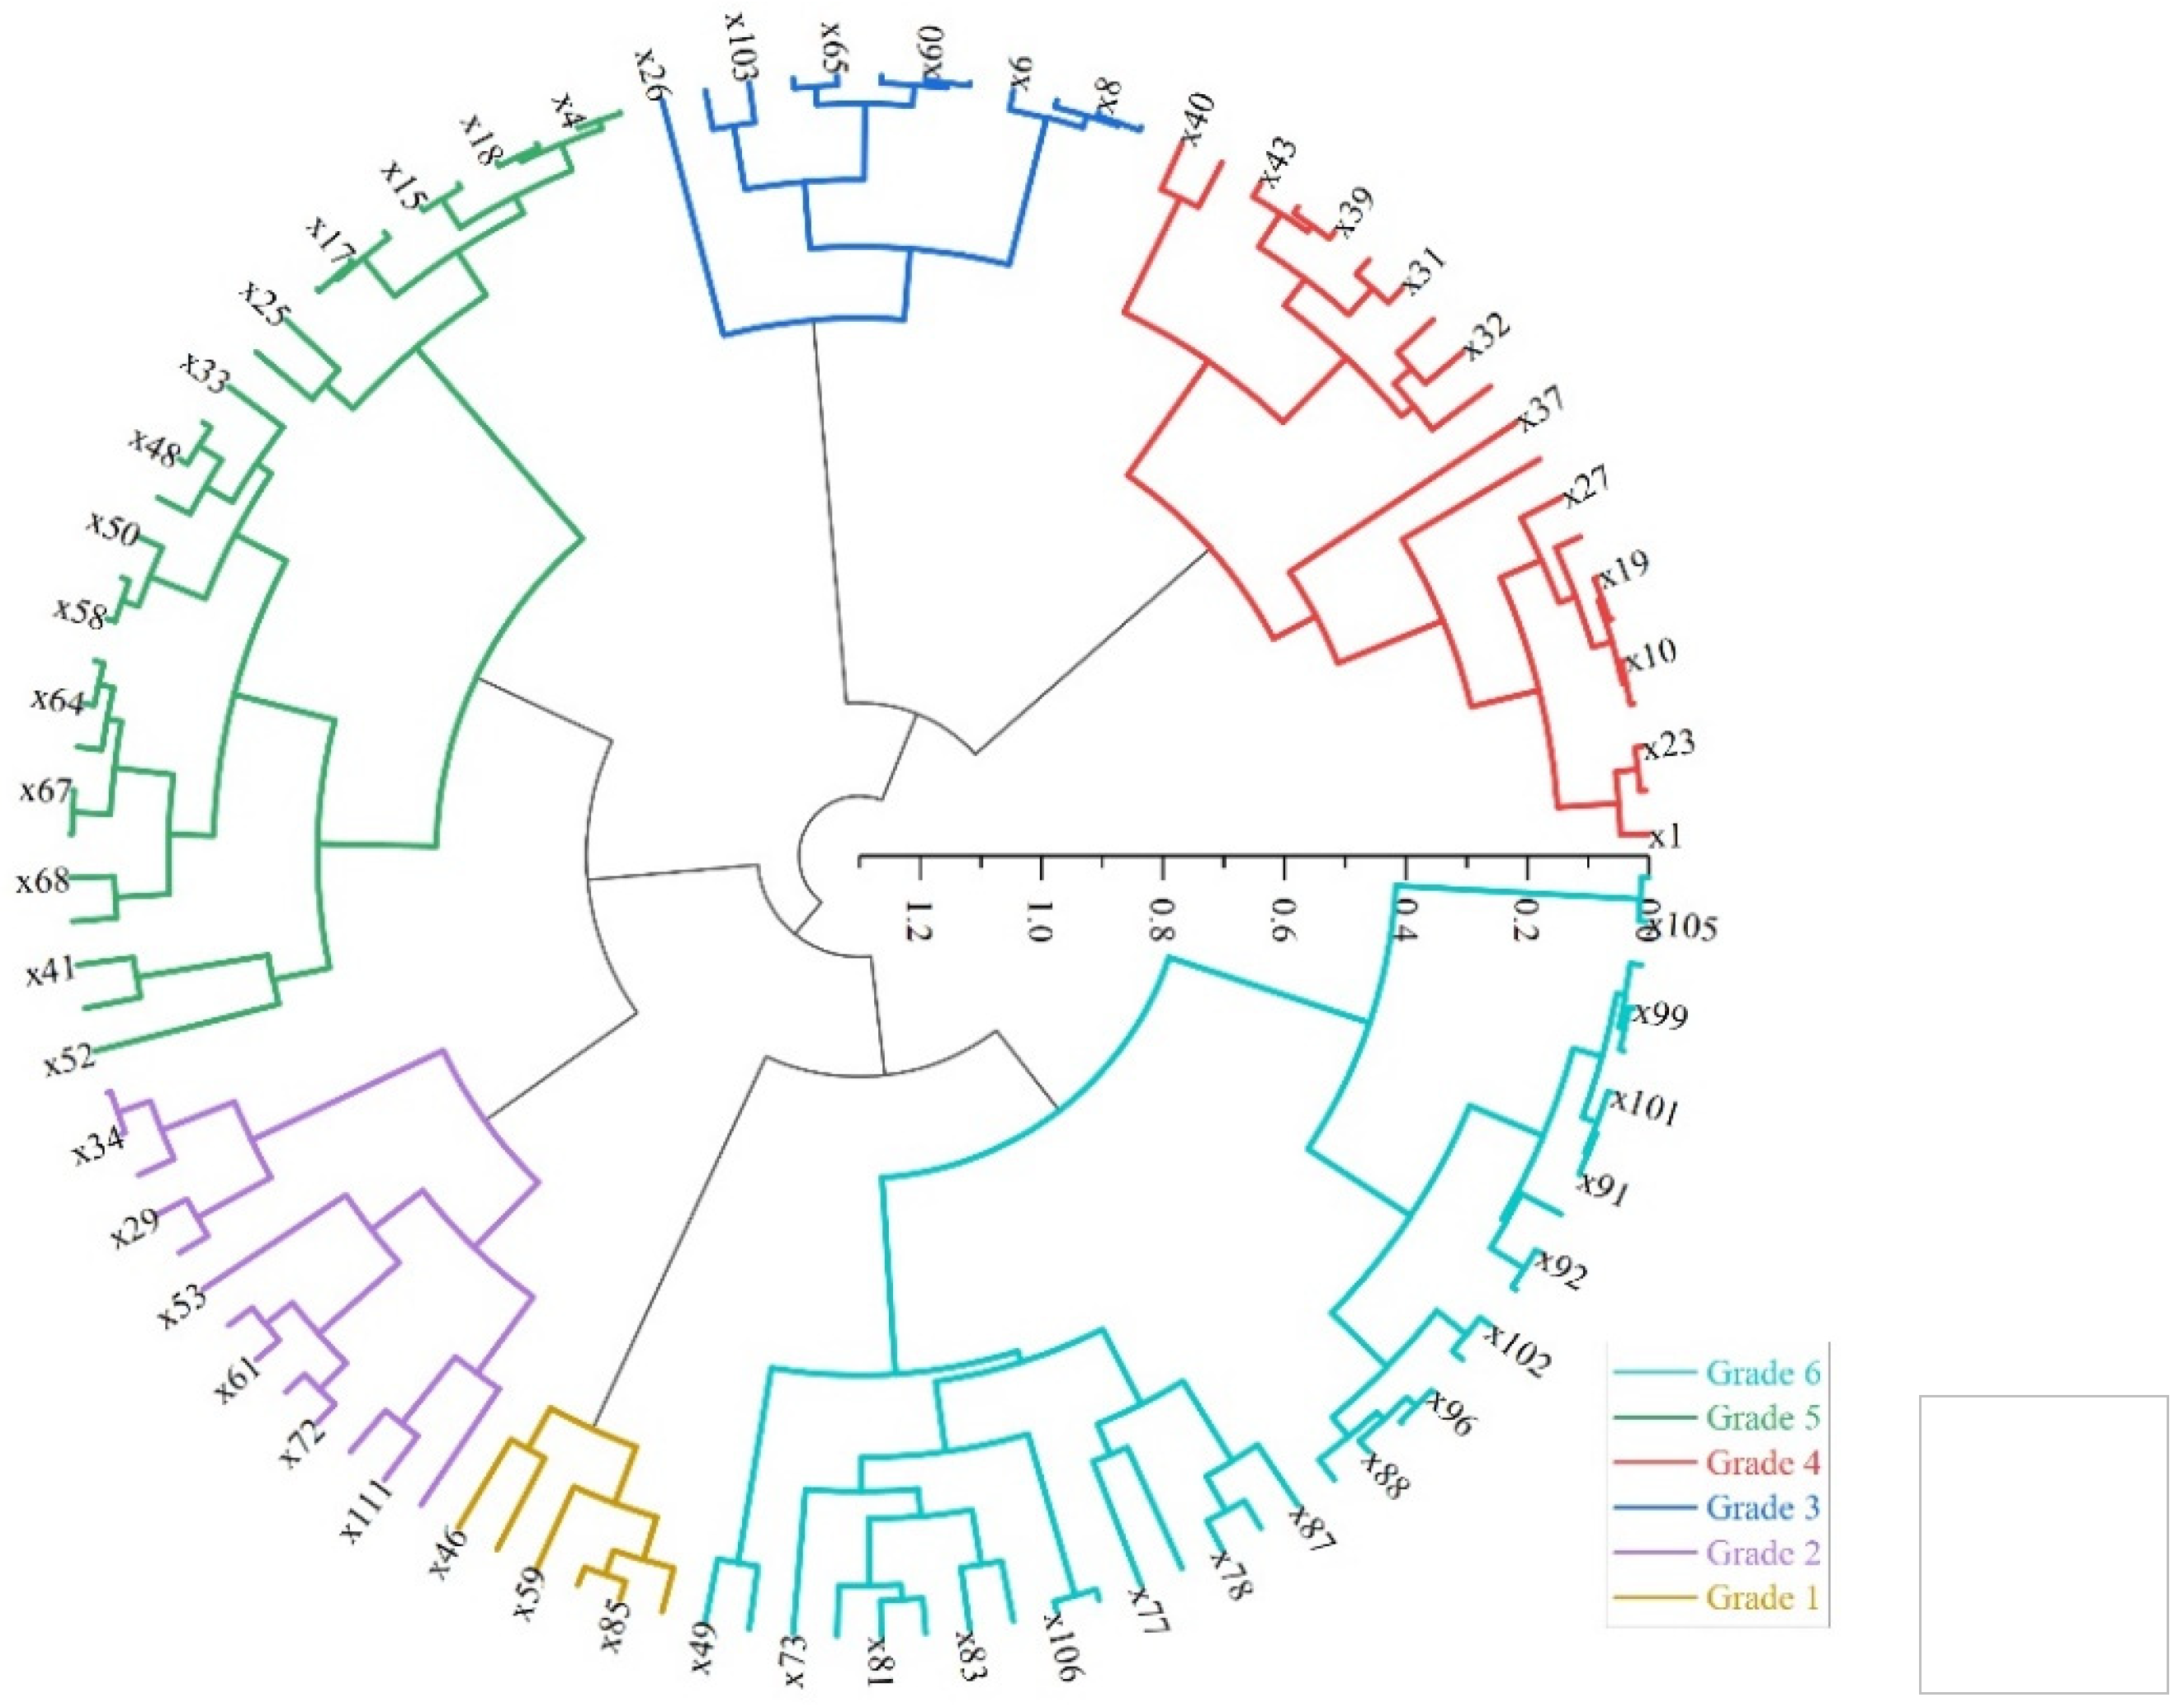
2.2. Fuzzy Clustering Analysis

In this study, fuzzy cluster analysis was used to combine the above five indicators to derive a rating for SQS. Soil quality sustainability is mediated by both state and category attributes and lends itself to soft classification. Fuzzy clustering analysis based on fuzzy set theory provides a powerful analytical tool for this soft division [31].
The data are first standardized. Let the thesis domain U = { x 1 , x 2 , , x n } be the object being classified. Each object is further characterized by m indicators: x i = { x i 1 , x i 2 , , x i m } , i = 1, 2,…, n. A raw data matrix is obtained.
To eliminate the effects of dimensionality on cluster analysis, the data need to be standardized before cluster analysis is used so that each indicator value is unified within a common range of data characteristics. The data in this study are standardized using the advection-standard deviation transformation method.
x i j = x i j x j s j ( i = 1 , 2 n , j = 1 , 2 m )
x j ¯ = 1 n i = 1 n X i j , s j = 1 n i = 1 n ( x i j x i j ¯ ) 2
Fuzzy similarity relationships are then established. Let U = { U 1 , U 2 , , U n } be the entire population to be classified, where each object to be classified is characterized by a set of data. Using the quantitative product method, similarity relationships are established.
r i j = { 1 M k = 1 m x i k x j k , i j 1 , i = j
where M is a suitably chosen positive number, M max i , j ( k = 1 m x i k x j k ) .
Then, the fuzzy equivalence matrix is established. The matrix R, obtained from the established fuzzy similarity relationships, is only a fuzzy similarity matrix. It does not necessarily have transferability and needs to be transformed into an equivalence matrix for the purpose of classification. Therefore, the transfer closure t(R) of R is found using the least squares method, and t(R) is then the equivalence matrix of the solution.
Finally, fuzzy clustering is performed. For the equivalence matrix t(R), an appropriate threshold λ [ 0 , 1 ] is chosen, and dynamic clustering is performed by the λ-truncation relationship.

2.3. Refined Evaluation
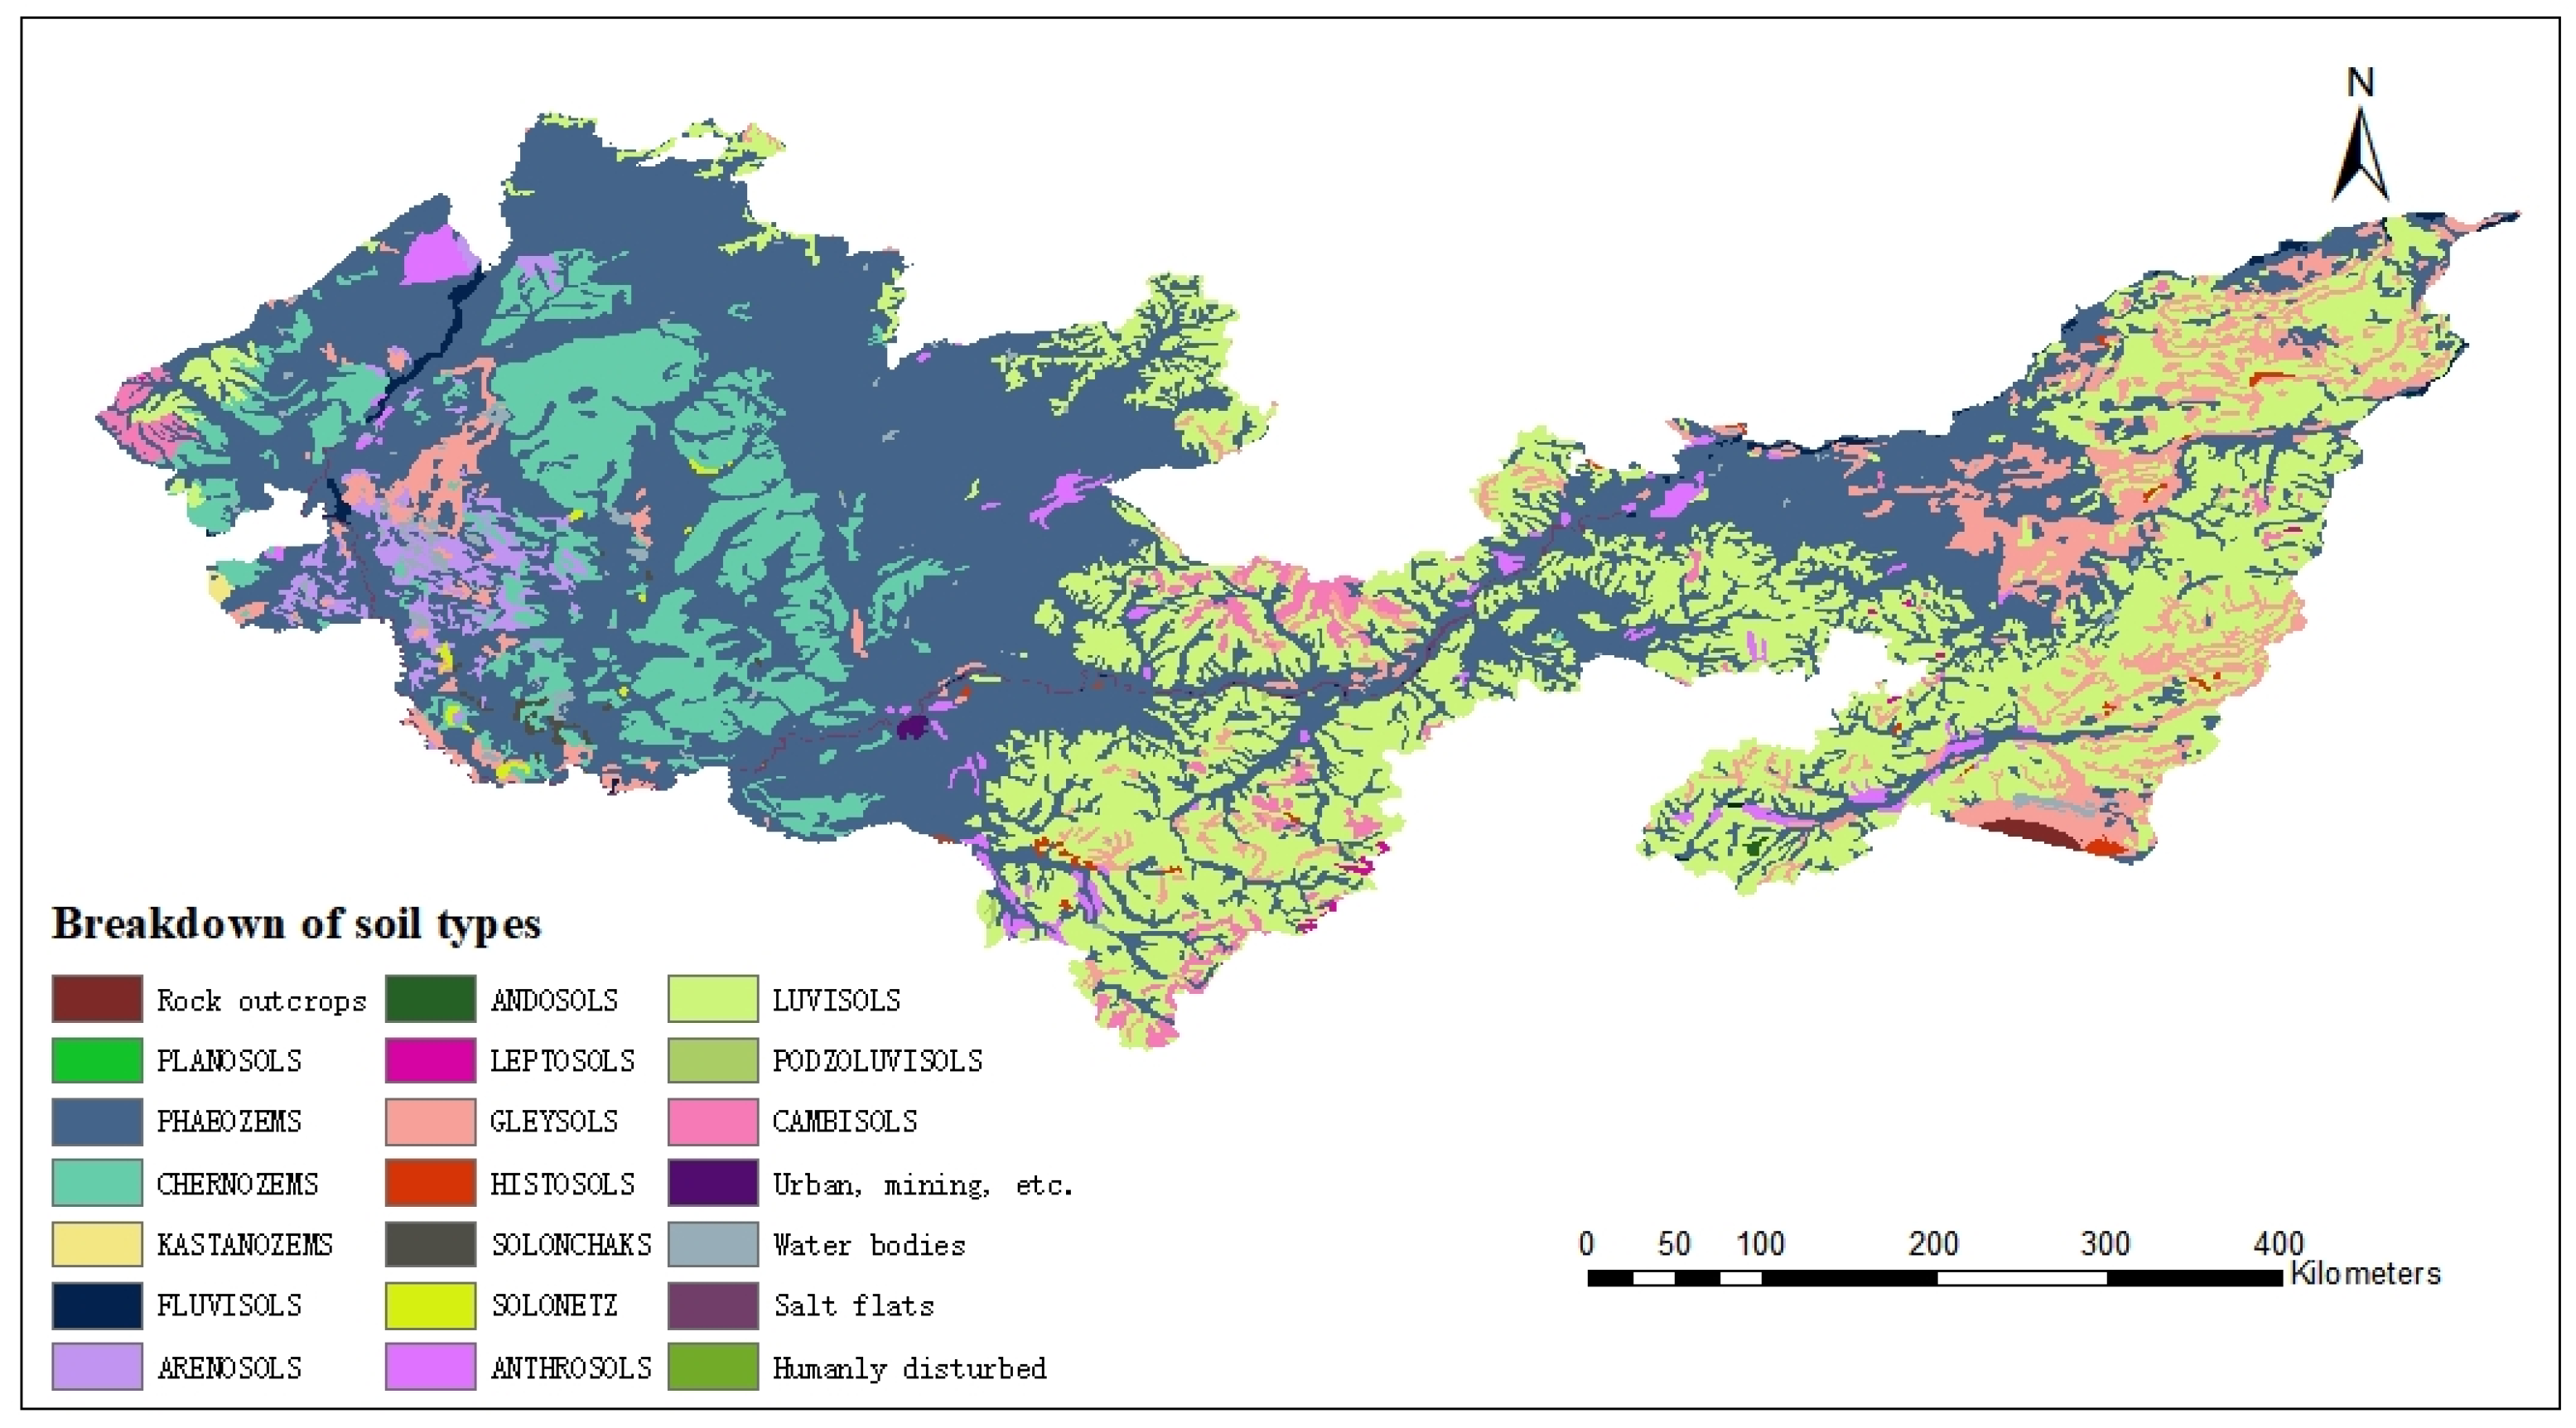
Refined evaluation can present a sustainable distribution of soil quality with exact calculations of indicators within each spatial grid, helping to seek common ground while preserving differences in land resource management. The fine-scale evaluation conducted in this study was achieved by means of a raster calculator and spatial interpolation methods. The soil erosion modulus, nutrient balance index, SOC stock, soil heavy metal contamination index and crop production potential were calculated for each grid according to the method in Section 2.1, and the five indicators were evaluated in a comprehensive manner according to fuzzy cluster analysis using the process shown in Figure 1 below.

2.4. Study Area

Heilongjiang Province is located in the northernmost part of China. It has the highest latitude in the country, vast territory and a variety of landscape types. The province has a total land area of 47.07 million hectares, accounting for 4.9% of China, and is the sixth largest province in the country. It has a large area of fertile black soil, and nearly 30% of the high-quality arable land in the country is located in this region. Heilongjiang Province has ranked first in the country in terms of grain production for thirteen consecutive years and has yielded eighteen consecutive bumper crops due to its large per capita arable land area. The area is mainly covered by black soils, meadow soils and swampy soils. Black soil has a loose texture and high organic matter content, making it suitable for cultivation. However, the rapid urbanization of Heilongjiang Province in recent years has had a negative impact on the land in the area and has led to severe soil erosion and salinization. In addition, the vast arable land area is unsystematically structured, and the arable land use patterns need to be optimized. Soil quality assessment in the Sanjiang Plain and Songnen Plain areas of Heilongjiang Province can help improve farming patterns in the area and further promote increased grain production. The terrain of these regions is flat and open, the soil has high nutrient contents, the agricultural farming conditions are good and the area has a high density of arable land. Therefore, in this study, the Sanjiang Plain and the Songnen Plain were selected as the study areas. These span the seven cities of Qiqihaer, Daqing, Suihua, Haerbin, Jixi, Jiamusi and Shuangyashan from west to east and constitute approximately 33% of the black soil area (Figure 2).

2.5. Data Collection and Processing

In this study, the investigated area was divided into 25,000 spatial grids of 3 km × 3 km after we assessed the spacing between contours and the complexity of the terrain [32]. The following indicators were calculated in these grids.

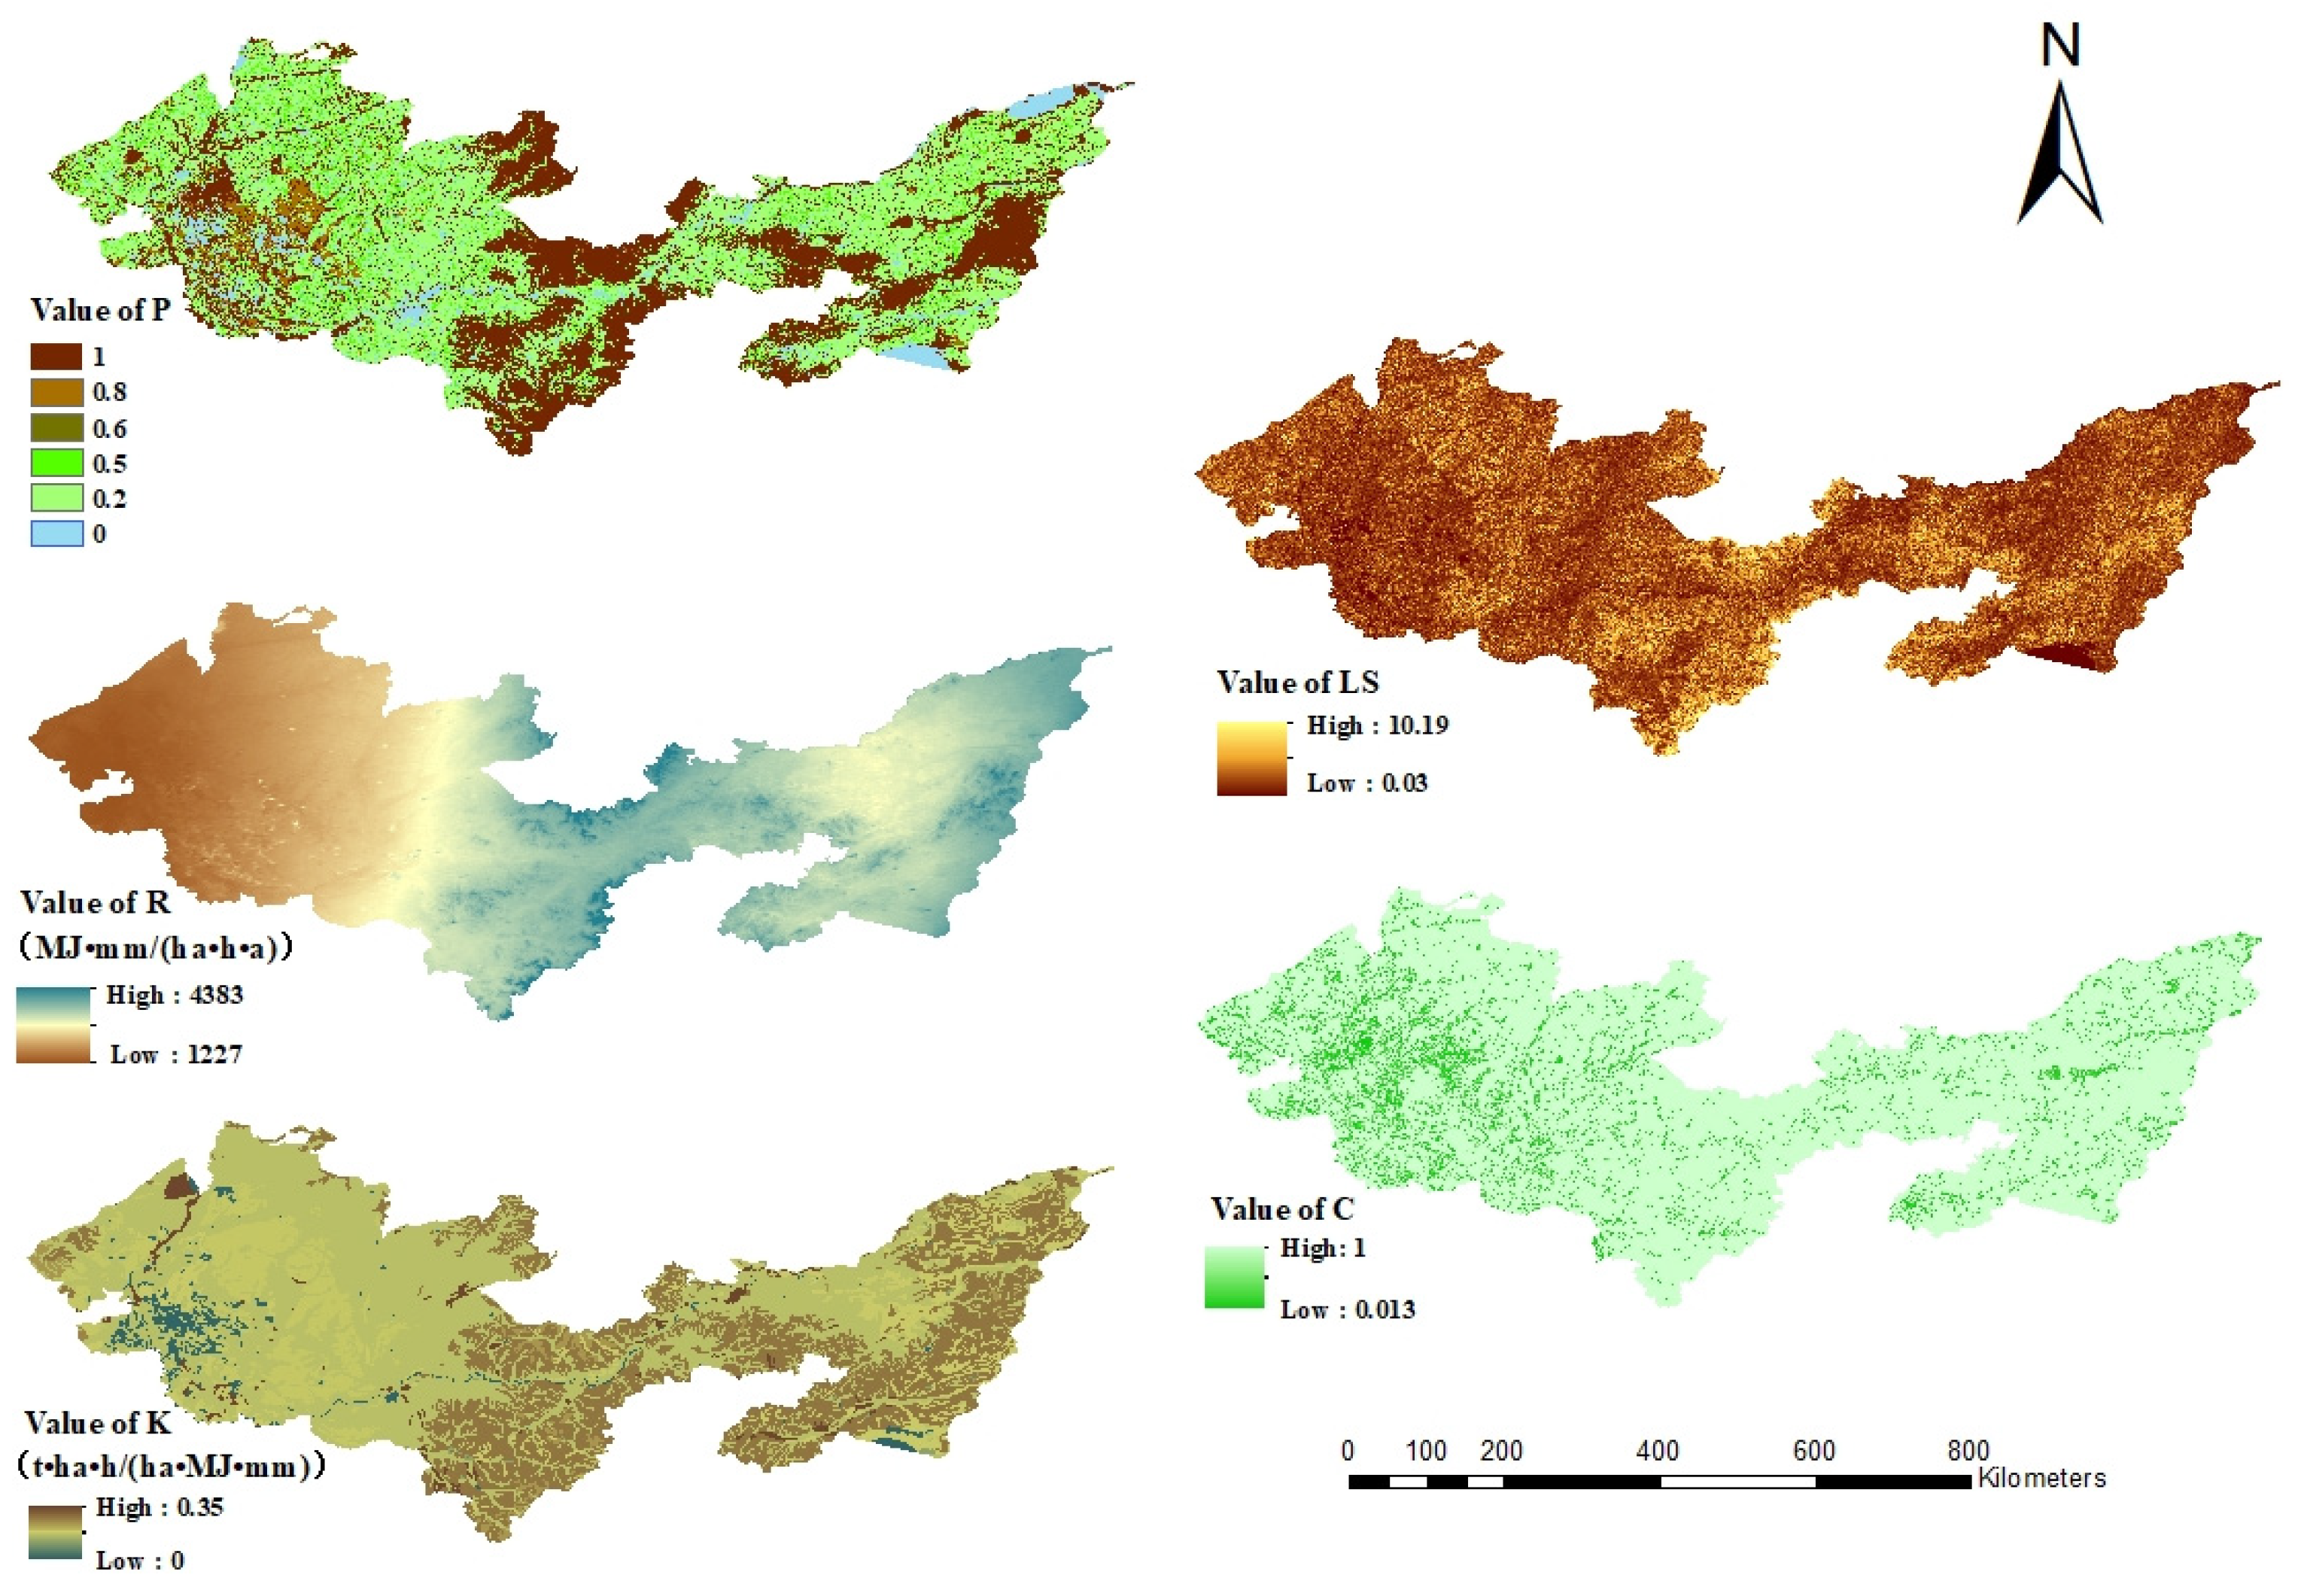
2.5.1. Soil Erosion Modulus

The data used to calculate soil erosion using the RULSE model were mainly annual rainfall data, soil composition data, DEM elevation data, vegetation cover data and land use data for the study area. Among them, the rainfall data, elevation data, vegetation data and land use data were obtained from the Resource and Environment Data Centre of the Chinese Academy of Sciences, and soil data were obtained from the Harmonized World Soil Database (HWSD v1.2). The value for each factor calculated according to the RULSE model is shown in Figure 3.

2.5.2. Land Crop Production Potential

The meteorological information required to calculate the land crop production potential using the mechanism method included daily solar radiation, daily maximum temperature, daily minimum temperature and daily precipitation. Meteorological information was obtained from relevant meteorological stations and the World Meteorological Organization computer website, but daily solar radiation information was difficult to obtain. Therefore, a Kriging interpolation of the monthly average solar radiation values over many years was used. Although this introduced errors, the values obtained were more accurate than those from the usual formula estimation method. The soil information required for the model was obtained from the Chinese Soil Species Journal and from other relevant soil census information. The temperature, moisture, light and fertility conditions required for crop fertility were obtained from the Heilongjiang Reclamation Yearbook and other literature related to crop production. The values of the effective coefficient for farm crops are detailed in the Supplementary Materials.

2.5.3. Soil Nutrient Balance Index

The primary data used to calculate the soil nutrient balance, such as fertilizer application, total crop yield, crop acreage, crop yield and total output value of the cultivation industry, were obtained from the Heilongjiang Reclamation Statistical Yearbook 2001–2021. In addition, the data on fertilizer nutrients, irrigation water nutrients, dry and wet atmospheric deposition [33], biological nitrogen fixation, seed dry matter ratio, seed nutrients, straw utilization ratio, grass-to-grain ratio, straw nutrients and nutrient loss factors were mainly compiled from the literature. The main data used in the calculations are shown in Table 1, Table 2 and Table 3. The inputs and outputs of soil nutrients in the study area are described in detail in the Supplementary Materials.
In addition, the fertilizer phosphorus surface runoff coefficient was 0.1618%; the phosphorus surface runoff loss coefficient from paddy fields was 0.135 kg/ha; the phosphorus surface runoff loss coefficient from drylands was 0.12 kg/ha; and the potassium loss coefficient from surface runoff was 5.1 kg/ha.

2.5.4. Soil Heavy Metal Contamination and SOC Storage

The main data used to calculate soil heavy metal contamination were the levels of six heavy metals—As, Cd, Cr, Hg, Ni and Pb—in the soil and the background values for these heavy metals, as well as the toxicity factors for these elements, which were obtained from recent, relevant literature (see Supplementary Materials Table S5). The background values and toxicity factors for heavy metals are shown in Table 4.
The soil type raster dataset used to calculate the SOC stocks using the soil type method was also obtained from the Natural Resources and Environment Data Centre of the Chinese Academy of Sciences, and the soil types in the study area are shown in Figure 4.
The specific gravity of SOC for each soil type, the soil capacity and the mass fraction composition of sand, clay and gravel are shown in the Supplementary Materials. SOC storage was not calculated for residential building sites, water bodies and bare rock areas where the terrain was fragmented and not suitable for use as arable land.

3. Results

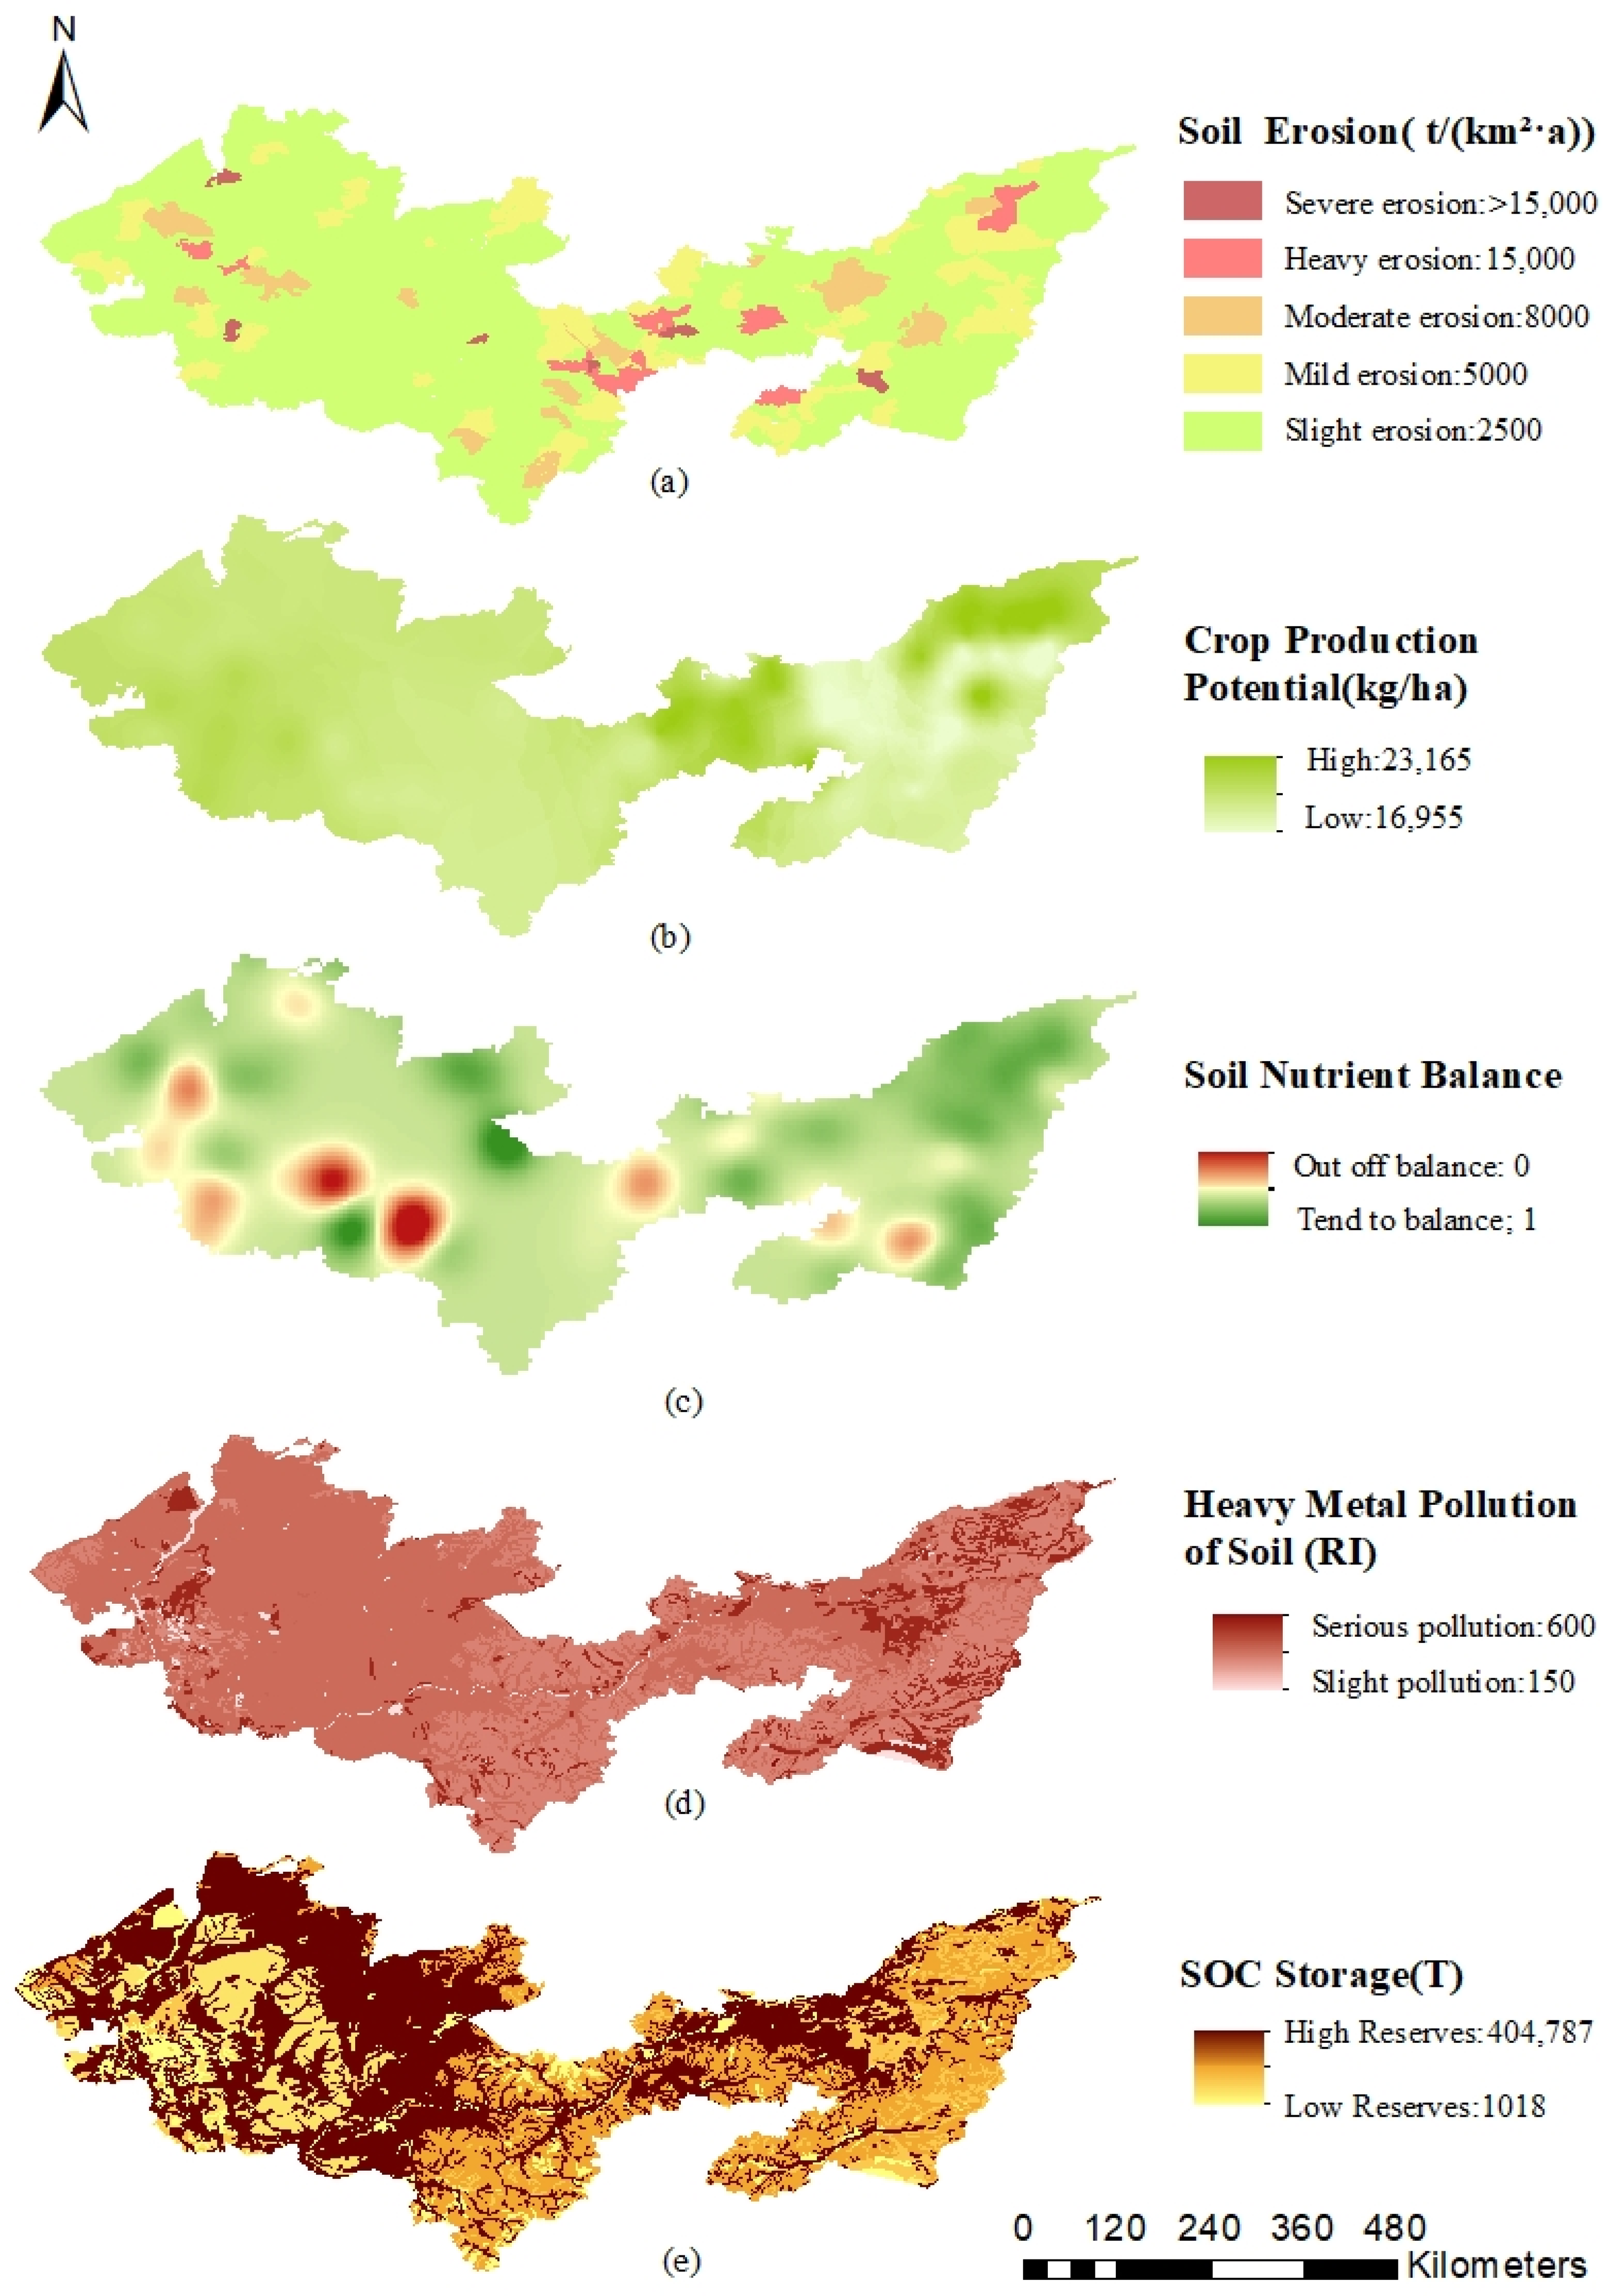
3.1. Changes in Soil Quality Indicators

The results of the calculation of all indicators in the land sustainability evaluation model for the main grain-producing areas in Heilongjiang Province are shown in Figure 5.
As shown in Figure 5a, the intensity of soil erosion in most areas of the study area is in the slightly eroded class, followed by the mildly eroded and moderately eroded classes. The heavily and severely eroded classes are distributed over a small area, with a general trend that is high in the east and low in the west. The criteria for determining the degree of soil erosion are shown in Table 5. Moderate and severe erosion is concentrated in the Songnen Plain and its surrounding terraces, the low hills and the western part of the Sanjiang Plain, where human activities are more intense, while soil erosion does not easily occur in the forest and grassland in the central and western parts of the study area, where human activities are limited.
Figure 5b shows that the average agricultural production potential of the Three Rivers Plain is 12,905.03 kg/ha, with a general distribution that is high in the east and west and low in the central region. A low crop production potential occurs in the north-central region due to the low temperatures that prevail during the growing season, while the low crop production potential observed in the south-central region is due to poor growing conditions in the mountainous and hilly terrain in the southern part of the Sanjiang Plain. The average agricultural production potential of the Songnen Plain is 13,361.35 kg/ha, and it shows no noticeable distinctions in distribution.
Figure 5c shows that in the study area, a soil nutrient imbalance mainly occurs in the main urban area of Harbin City, Yilan County, and Zhaodong City within Suihua City. In these areas, there is a significant surplus of nutrients, and the overapplication of compound fertilizers is one of the main reasons for the surplus of nitrogen and phosphorus. The shallow application of fertilizers by farmers in black soil areas reduces the efficiency of fertilizer use, and residual fertilizers in the soil can have an impact on land quality. The use of machinery for deep fertilizer application can prevent problems associated with shallow fertilizer application and improve the utilization rate of fertilizers, thereby reducing the amount of fertilizer applied. In addition, agricultural irrigation with water containing high levels of phosphorus can also lead to nutrient surpluses, and phosphorus accumulation not only prevents crops from absorbing silicon but can also lead to alkalinization of the soil.
Figure 5d clearly shows that metal pollution in the study area is generally high in the west and low in the east, but a large area with severe heavy metal pollution exists in the eastern part of Shuangyashan city, Baoqing County, Jixi city, Missan city, Tongjiang city and Jiamusi city. Harbin, Qiqihar and Suihua, the most economically developed regions of Heilongjiang Province, have begun to focus their development on economic–ecological synergy, but due to the severe state of pollution, the pollution index in the region remains high, even though strong and effective treatment measures have been carried out in recent years. The heavy industrial base in the eastern region is more dispersed, and economic development is slow; therefore, it is difficult to balance the tradeoffs between economic development and ecological protection, and the heavy metal pollution index remains high near large industrial sites. However, due to the sparse population density in the area, heavy metal pollution is extremely light in areas that are farther away from the industrial base, which results in a staggered distribution of high- and low-pollution areas in the eastern region.
As shown in Figure 5e, the overall SOC storage in the study area is moderately high. A large woodland area is located in the central part of the study area, which is not substantially affected by industries, construction activities and excessive human activities, and this facilitates SOC enrichment. In the western plains, which mainly consist of dry crop-growing areas, the mechanical action of tilling destroys the structure of soil aggregates and removes the physical protections for the preservation of soil organic matter. Protected organic matter becomes exposed, which in turn increases soil erosion and microbial activity, leading to a decrease in SOC content. The southern part of Qiqihar and the southern part of Suihua and Daqing have large amounts of land devoted to construction and industry and contain high concentrations of towns and cities. Oil fields and heavy industrial parks have long supported economic development in this area, and the land environment has been severely damaged, which has caused a significant decline in SOC stocks in the region. SOC stocks in the eastern plains are below the national background values, with SOC densities below 4.0 kg/m2 in most areas, while surface SOC densities are above background values in areas where the eastern swamps have been converted to paddy fields. The SOC density of the surface soils in the low floodplain areas on both sides of the river in the study area is also higher than the background value. The average is above 8.0 kg/m2, and the values above reach 13 kg/m2 in this region. The early land cover of these areas was dominated by swampy wetlands, which contained a wide variety of vegetation and lush growth. This provided good physical conditions for the accumulation of SOC in the soils of the area. The area was later extensively developed as agricultural land, and the carbon sequestration capacity and SOC content of the paddy soils were stronger than those of dryland soils.

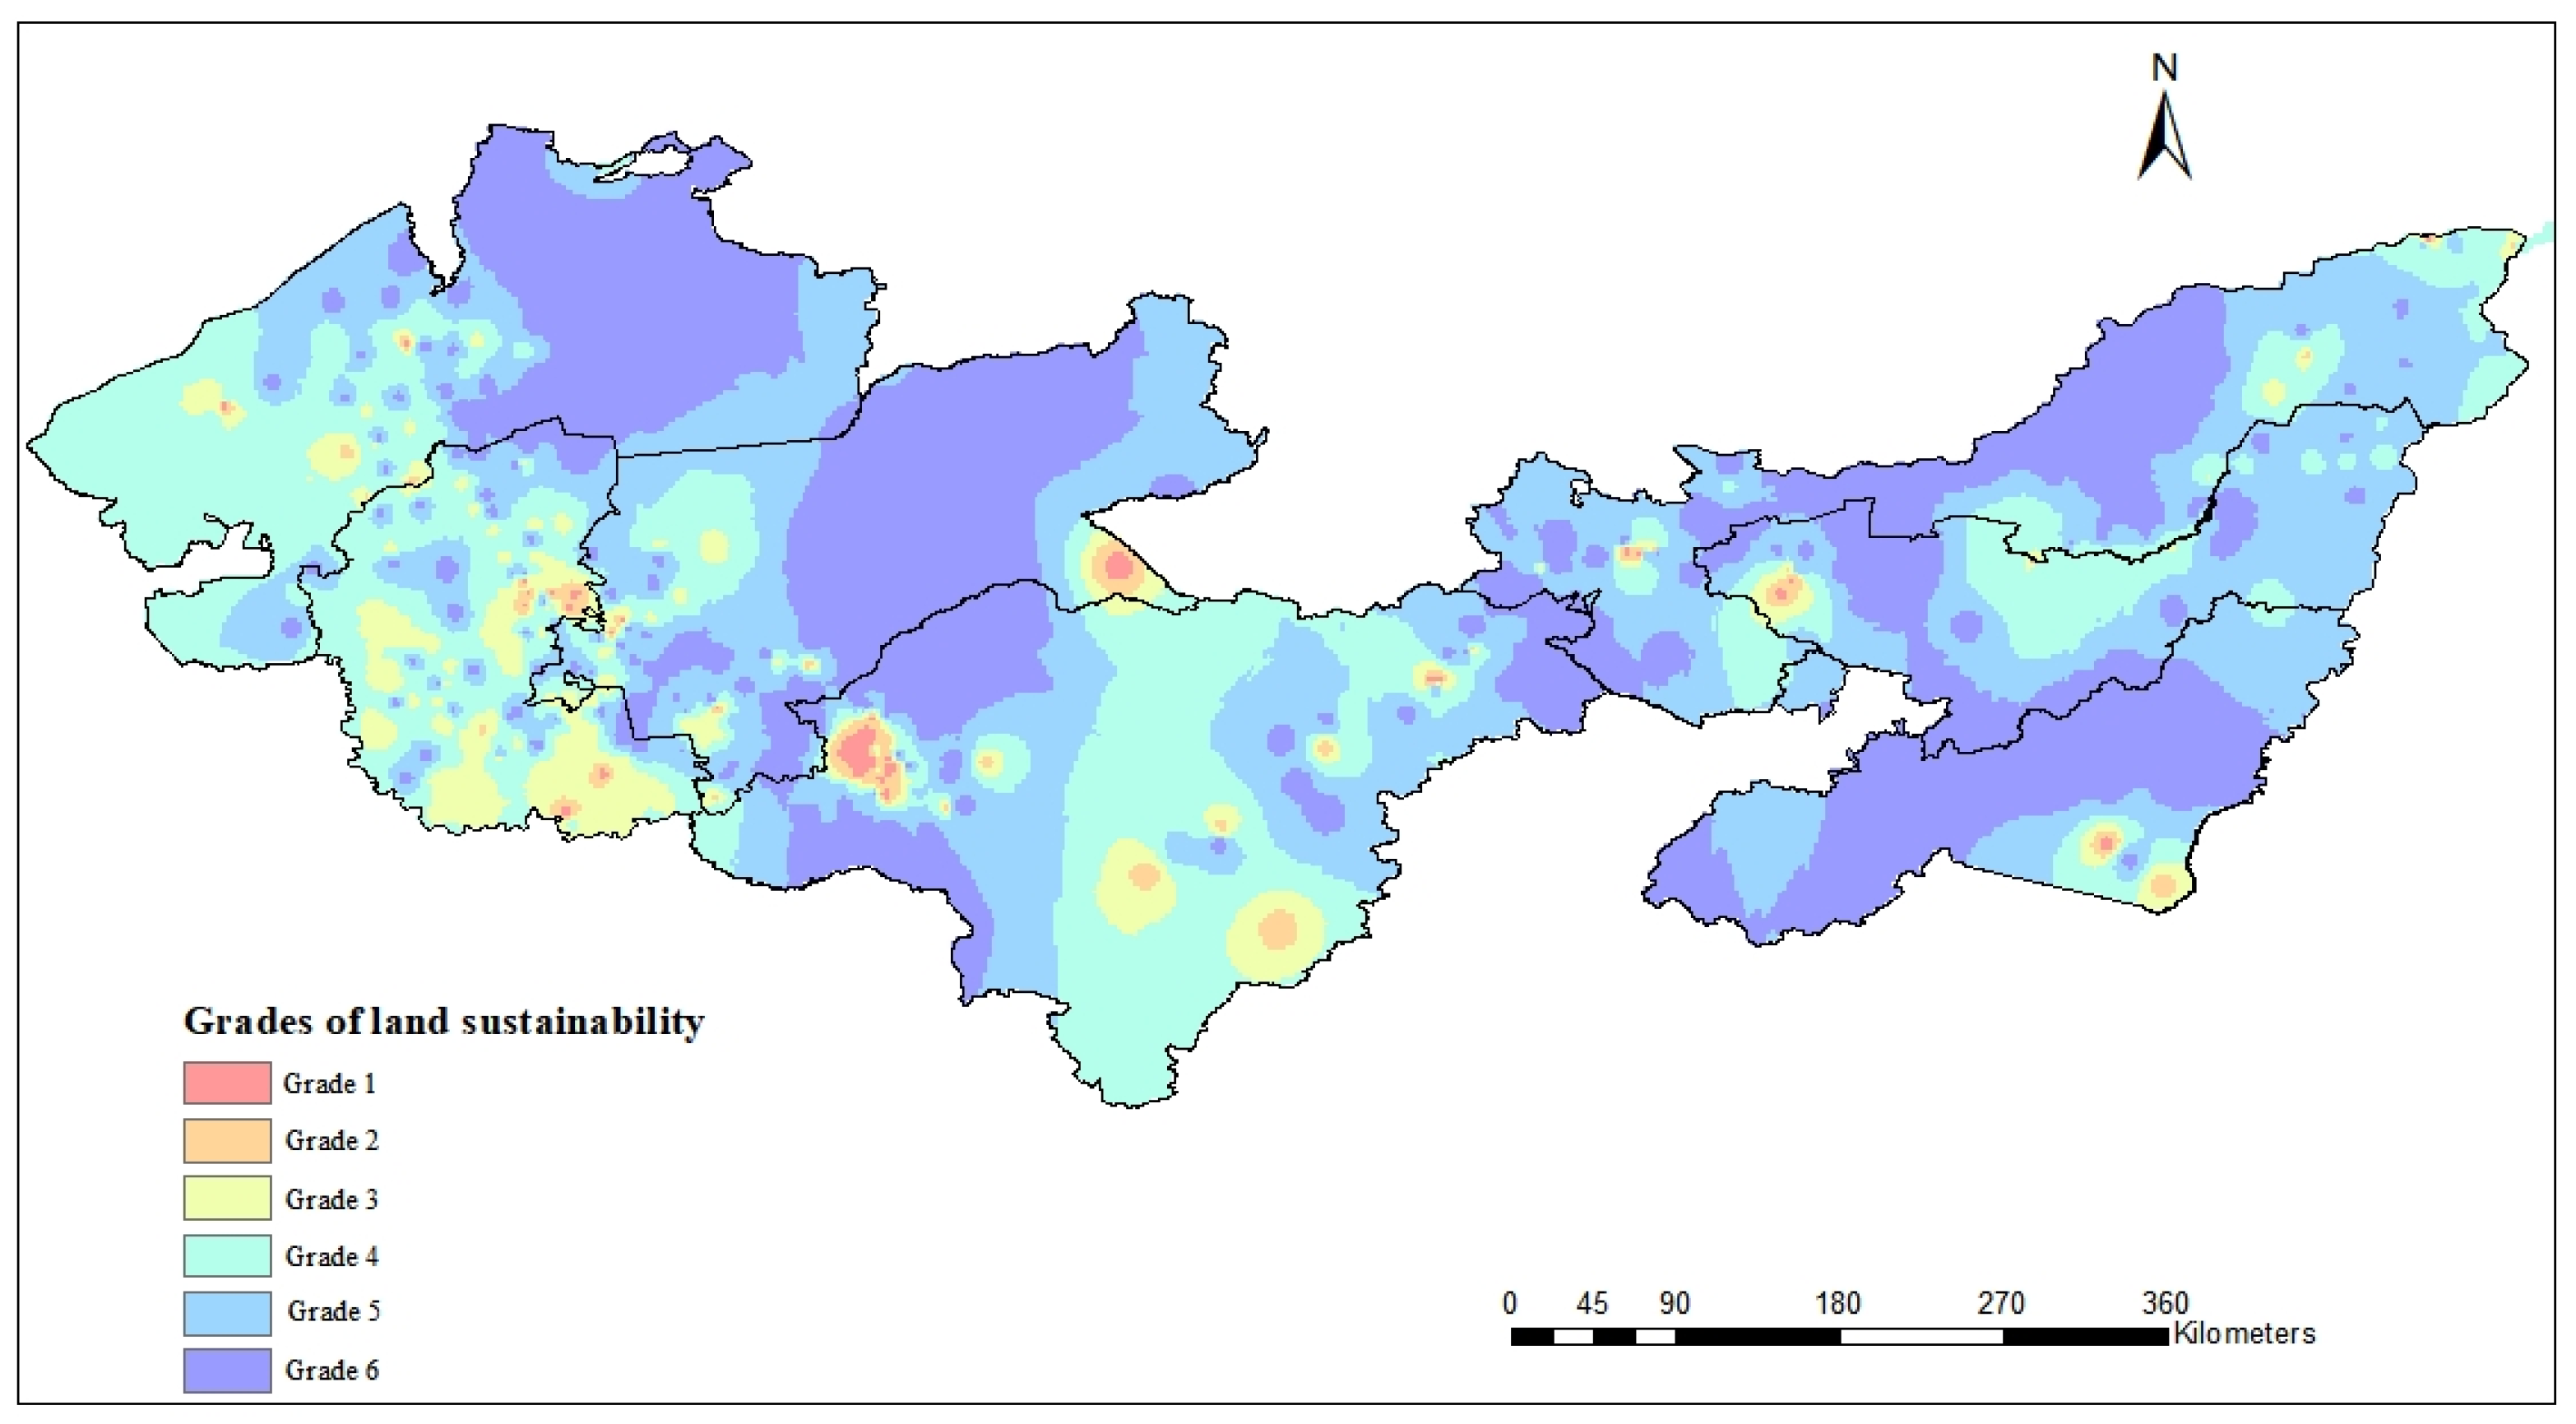
3.2. Soil Quality Sustainability

A fuzzy cluster analysis was conducted on five indicators for farms in the study area, and the land in southern Heilongjiang Province was divided into six classes (see Figure 6) based on the six-class classification of land sustainability evaluation systems in the literature (see Table 6).
The fuzzy clustering diagram is shown in Figure 6, with 6 farms at sustainability level 1, 13 farms at sustainability level 2, 12 farms at sustainability level 3, 21 farms at sustainability level 4, 28 farms at sustainability level 5 and the remaining farms at a land sustainability rating of 6. The threshold λ = 0.6951; low levels indicate weak SQS and high levels represent strong SQS.
The clustering results were interpolated and analyzed in the GIS platform to obtain a spatial distribution map of the gridded land sustainability of the Three River Plain and the Songnen Plain, as shown in Figure 7.
Land sustainability in the study area was dominated by Grades 5 and 6, accounting for approximately 66.8% of the total area of the study area, which shows that the overall land sustainability in the study area is high. Areas with soil sustainability ratings of 5 and 6 are mainly located in the hinterland of the Sanjiang Plain and the Songnen Plain, which are generally covered by black soils with sufficient soil nutrients, are less affected by soil heavy metal pollution and have land-use types that are dominated by paddy fields, followed by forested land and dry fields, with very high soil organic carbon storage. The land in Grade 5 is closer to industrial land and urban agglomerations and has been affected by human activities, which have increased the level of soil contamination and loss of organic carbon. Land of Grades 3 and 4 accounted for approximately 30.5% and was concentrated in Daqing city, the central part of Harbin city and the southern part of Qiqihar city, which is dominated by river valley plains, hilly plains and slightly sloping high plains. These areas have abundant surface water resources, fertile black soils with high natural fertility, abundant mineral nutrients, moderate soil texture, good conditions for agricultural land use, large and concentrated areas of arable land and high land productivity. However, these regions are densely populated, have limited amounts of arable land and are subject to urban construction, overexploitation of resources and intense human production activities; the innate advantages of the land are lost in the pursuit of economic development [34]. Of these, Grade 3 lands are mainly towns and cities, and the quality of the soil in these areas is not as good as that of the naturally developed forested and agricultural lands; it has been improved with artificial practices. The use of fertilizers to improve soil quality has also led to a serious imbalance of soil nutrients in these areas due to the lack of scientific knowledge of soil in earlier years. Lands rated as Grade 1 or Grade 2 accounted for approximately 2.74% and were concentrated in the western part of Qiqihar city, Suihua city, the northeastern part of Suihua city and the central part of Shuangyashan city. Areas with soil sustainability ratings of 1 and 2 are mainly found in counties and cities in the southwest, which are characterized by low-lying terrain, poor drainage and poor climatic conditions. These areas border Inner Mongolia and are affected by the dry Siberian monsoon. The climate is characterized by low precipitation and high evaporation. In these areas, the soils have poor productivity, are heavily salinized and show declining soil fertility, clayey compositions and compaction; therefore, they are barely sustainable. These areas have also long been subjected to misguided production activities such as indiscriminate land clearing, inappropriate drainage and irrigation practices, and overgrazing, resulting in severe desertification of the soil and fragile soil base functions. Among them, the utilization type of Grade 1 land is mainly sandy and bare rock, with only a few areas of loss of productive capacity due to acquired impacts, leaving little room for improvement and making arable land use almost impossible.

4. Discussion

4.1. Analyses of Differences in the Spatial Distribution of SQS

The results of the study show that the overall distribution of soil erosion in the study area is more in the east and less in the west. The conversion of natural vegetation to arable land can directly reduce the vegetation cover and make the soil more susceptible to rain splash erosion; on the other hand, this conversion can affect the soil quality, destabilize soil aggregates and ultimately lead to soil erosion [35]. Composite ecosystems can reduce raindrop splash erosion by increasing different vegetation canopy structures and improve soil retention by increasing root biomass and apoplastic matter [36]. There were two differences in the distribution of crop growth potential in the study area: high in the east and west, low in the center, and slightly higher in the Songnen Plain than in the Sanjiang Plain. The first difference is mainly due to topographical factors, as the area connecting the two plains is dominated by cold forests and hills with low temperatures and poor growing conditions during the growing season. The second is the wide distribution of black soil in the Songnen Plain. The fertile black soil belt running north–south in the Songnen Plain is one of the world’s three major black soil zones, rich in light and heat resources and river transit, providing favorable natural conditions for crop growth. Nutrient imbalances are distributed across all counties and cities, and nutrient surpluses are common. According to statistics, China’s nitrogen fertilizer, phosphate fertilizer and potassium fertilizer utilization rates are less than 50%, at 30~35%, 10~25% and 35~50%, respectively [37]. In addition, livestock manure contributes to significant nitrogen and phosphorus surpluses, and the effective use of manure and the scientific implementation of crop husbandry are important ways to reduce nutrient surpluses [38]. Heavy metal pollution is more serious in the study area. Numerous studies have confirmed that industrial, agricultural, transport and mining activities are the main sources of heavy metal contamination in soils [39]. The pursuit of yield leads to the application of large quantities of fertilizers and pesticides. Organic fertilizers, chemical fertilizers and pesticides are an important source of heavy metals in the soil, and the extensive use of agricultural machinery and agricultural irrigation draws on the poor quality of water stored on both sides of the highway, which is also an important reason for the high content of heavy metals in paddy fields [40]. Soil organic carbon stocks were generally high in the study area, with only some parts of the western part below the background value. In addition to farming activities, soil erosion and the frequent freezing and thawing of soils in cold regions are the main factors contributing to soil carbon loss [41].
For areas with soil sustainability ratings of 5 and 6, the five soil sustainability indicators have developed in a balanced manner, and the comprehensive use of soil functions is high. Soils with high ratings reflect good functional soil conditions, and it is essential to strictly protect and expand arable lands that have high and stable yields. To maintain the functions of existing arable soils, deep ploughing can be used to address deep soil quality, to increase the permeability of the soil, to improve the water storage capacity and water retention capacity of the soil and to promote increased crop yields. At the same time, farmland layouts should be optimized to promote the development of ecologically sound agricultural practices, and appropriate conversions to forests and wetlands should be carried out to safeguard the sequestration of SOC, increase soil fertility and protect environmental health within the soil ecosystem. To prevent soil damage, ecologically fertile land development should be carried out in a manner that accounts for the complex tradeoffs among agricultural production, soil environmental protection and the maintenance of agricultural soil biodiversity [42]. In addition, the development of agroecological leisure and tourism complexes is proposed to achieve the comprehensive use of agricultural lands and provide more possibilities for synergistic economic and ecological development.
For areas with soil sustainability ratings of 3 and 4, the irrigation patterns of the arable land in this region should be optimized to use natural water to the extent possible to meet the growing needs of crops. The use of natural water can reduce the negative impacts of excessive nitrogen and phosphorus land inputs from secondary water use. Furthermore, farming conditions should be improved through measures such as land preparation and land development. During future development, more attention should be given to measures that improve the ecological structure, ecological safety and sustainable development of the land. Such an approach could consistently balance tradeoffs between ecological development and ecological protection and apply the concept of “green water and green mountains are the silver mountain of gold”. These are key areas for the construction of high-quality farmlands. In these areas, it is important to promote measures such as returning straw to fields, increasing soil aggregates, improving soil porosity and reducing soil compaction [43]. At the same time, land managers in these regions can take measures to modernize agricultural management, improve comprehensive agricultural efficiency, promote the mechanization and industrialization of agricultural production, improve farming techniques, strengthen agricultural training and support for farmers, and introduce special economic crops according to regional characteristics. Based on the original characteristics of the land, we recommend the implementation of arable land use and protection measures, the promotion of biological control measures, the optimization of farming methods and the promotion of crop rotation on arable land while avoiding long-term nutrient overloads. Finally, the soil can be improved by using various measures, such as crop rotation, allowing fields to lie fallow and alternating planting. Resource use is necessary for human development, and the economic and ecological value of land comes from the use of the land. Previously, economic growth had a significant negative impact on soil quality due to a lack of awareness and the use of poorly developed technology. It is time to seek more intensive forms of economic growth that increase efficiency and reduce resource input and consumption.
For areas with soil sustainability ratings of 1 and 2, land managers in these areas should focus on soil improvement. Advanced irrigation and drainage techniques should be introduced and used to promote soil desalination [44]. In addition, the water table should be adjusted to a critical depth to prevent salt backflow. It is also necessary to select salt-tolerant crops, promote the planting of salt-tolerant or salt-resistant crops, encourage the return of straw to fields, increase the application of organic fertilizers and soil nutrients, improve the physical and chemical properties of the soil, reduce soil water evaporation and promote soil aggregation. In areas with dense industrial complexes, the discharge of pollutants should be strictly controlled first, and then the degree of heavy metal pollution in the soil should be gradually reduced by physical methods such as soil exchange and thermal treatment or chemical techniques such as chemical drenching techniques and chemical passivation techniques. Moreover, vegetation, such as shrubs that can survive in saline areas, can be planted on a large scale to increase SOC sequestration. For areas with desertified soils, ecological protection can be carried out; first, the land eco-system should be protected, and then the structure and layout of the cultivated land can be gradually adjusted. Soil productivity must first be established, and then soil fertility and sustainability can gradually be restored by means of proper fertilization, irrigation and drainage, consolidation of fragmented land and the development of innovative agricultural techniques that help overcome climate and water resource constraints [45].

4.2. Limitations and Perspectives

In this study, the sustainability of soil quality was evaluated by calculating five indicators: soil erosion modulus, SOC stock, soil heavy metal contamination index, soil nutrient balance index and land crop production potential. In contrast with the indicators selected in previous land sustainability evaluations, the focus of this study was on the detailed factors that influence the suitability of the soil environment for farming. For example, Ristić considered geomorphologic, climatic and hydrologic influences in the evaluation process [46], and Fu considered indicators of production, life and ecology [9], but neither applied the hazards of heavy metal contamination to the evaluation of the soil quality of arable land. Appropriate soil and water conservation measures can reduce the rate of decomposition of soil organic matter and enhance microbial activity [47]. The nutrient balance of arable land and SOC are core components of soil fertility and are decisive factors in ensuring crop yield [48]. Soil heavy metal contamination is a major factor in soil fertility decline, and heavy metals can be harmful to humans when ingested through food [49]. The production potential of land is an important indicator for assessing the suitability of an environment for crop growth [50]. Another evaluation improvement made in this study is that the evaluation was carried out using a spatial grid. Generose used an indicator system similar to the one in this paper in constructing the evaluation model and used hierarchical analysis to evaluate the soil quality of arable land in a region of Tanzania as a whole, without refining the evaluation to a spatial grid [51]. We assumed that soil properties are undifferentiated across each 3 km × 3 km spatial grid and that the refinement of the evaluation eliminates errors introduced by the data to the greatest extent possible. For example, for the calculation of soil nutrient balances, the data were obtained from farms and populated by geostatistical methods for a grid across the study area, rather than being generalized from municipal data from compiled materials such as yearbooks, which do not reflect the variability in nutrient balances within municipal administrative districts. For calculating SOC stocks and soil heavy metal pollution indices, we assumed that the physical properties of each soil species were the same, but in fact, there are certain differences in soil properties within the same soil types in different areas due to their geographic locations and the types of surrounding industries, and further exploration is needed to quantify these differences in depth in the model.
In terms of research methodology, a refined fuzzy cluster analysis method was used to combine the indicators. The degree of land quality sustainability is asymptotic, in line with the characteristics of fuzzy mathematics, and a refined fuzzy cluster analysis model can better solve the problem of fuzzy attribution of land quality grades and improve the accuracy of SQS evaluation, avoiding problems associated with evaluation roughness and subjectivity to a certain extent. Zou used the methodology to evaluate the quality of cropland in Heilongjiang Province and obtained similar results [52]. Meanwhile, Zhao compared the fuzzy clustering algorithm with the other three algorithms in terms of soil environment zoning in China and proved that the fuzzy clustering algorithm can be effectively classified according to the soil quality [53], and Tripathi used the fuzzy clustering approach to delineate the management zones of paddy rice based on the soil fertility [54], which proved that the method has universality in terms of soil quality assessment. Fuzzy clustering is based on cluster analysis, and the ratings are also based on the data for the indicators. An important future research direction involves the use of mathematical methods to more objectively rate indicators during consolidation.

5. Conclusions

In this study, we developed a refined approach to the evaluation of land sustainability and came to the following conclusions: (i) The ratio of strongly sustainable land to weakly sustainable land in the main crop-producing areas of Heilongjiang Province is approximately 2:1, the five soil sustainability indicators are balanced and the comprehensive use of soil functions is high. (ii) More than half of the land in the main grain-producing areas of Heilongjiang Province has good soil and water conservation, a high balance of nutrient inputs and outputs, minor soil pollution, high SOC reserves and high crop production potential, and these conditions are suitable for simultaneously meeting agricultural and ecological–environmental objectives. (iii) Land areas with weak SQS are concentrated in the southwest region and on the border with Inner Mongolia. For these lands, reasonable vegetation planting and advanced irrigation and drainage techniques should be used to promote soil desalination and restore the basic ecological functions of the soil before further developing their production or commercial values.
This study provides a new framework for the evaluation of sustainable soil quality from a microscopic perspective. Soil erosion, SOC storage, heavy metal contamination and soil nutrients are important indicators of soil quality, especially with respect to the quality of arable land, while land production potential reflects the potential cultivation value of arable soils. This addresses a vital problem associated with current soil evaluation methods: they do not thoroughly explore the factors influencing soil quality. The use of refined fuzzy evaluation methods allows land resource managers to establish uniform global standards while optimizing and adjusting decision making to account for the variability in small-scale areas, solving problems associated with the current lack of fine-scale soil quality evaluations. We used this method to evaluate the sustainability of soil quality in the Sanjiang and Songnen plains of Heilongjiang Province, but the method is equally applicable to land in other regions. Future improvements to soil evaluation will involve refining the accuracy of the data and achieving a more objective and efficient grading approach to soil quality.

Supplementary Materials

The following supporting information can be downloaded at https://www.mdpi.com/article/10.3390/agronomy13082072/s1, Table S1: Summary table of the effective coefficients for each of the mechanism methods for calculating the productive potential of land-(1); Table S2: Summary table of the effective coefficients for each of the mechanism methods for calculating the productive potential of land-(2); Table S3: Farm nutrient inputs; Table S4: Nutrient output from the farm; Table S5: Potential hazard factor (Ei) and ecological hazard index (RI) grading criteria; Table S6: Soil physical properties breakdown.

Author Contributions

Conceptualization, Methodology, Project Administration, Y.Z.; Data Curation, Writing—Original Draft Preparation, J.L.; Validation, Writing—Review and Editing, H.L. and N.S.; Supervision, Writing—Review and Editing, Methodology, M.L. All authors have read and agreed to the published version of the manuscript.

Funding

This research was funded by the National Natural Science Foundation of China, 52079029; and Humanity and Social Science general project of Ministry of Education of China, 18YJAZH147.

Data Availability Statement

The data used to support the findings of this study area are available from the corresponding author upon request via email.

Conflicts of Interest

The authors declare that they have no known competing financial interest or personal relationship that could have appeared to influence the work reported in this paper.

Appendix A. RULSE Model (Section 2.1.1)

Table A1. RULSE model calculation details.
FactorUnitCalculation MethodDescription of Parameters
R MJ mm ha - 1 h - 1 a - 1 R = 0.053 P n 6.665 P—annual rainfall, mm.
K t ha h / ( ha MJ mm ) K = { 0.2 + 0.3 exp [ 0.0256 S a ( 1 S i / 100 ) ] } ( S i C l + S i ) 0.3 ( 1.0 0.25 C C + exp ( 3.72 2.95 C ) ) ( 1.0 0.7 S n S n + exp ( 5.51 + 22.9 S n ) ) Sa—sand content, Si—chalk content, Cl—clay content and C—organic carbon content.
LSDimensionless L = ( λ / 22.13 ) m = { m = 0.2 m = 0.3 m = 0.4 m = 0.5 θ < 0.5 ° 0.5 ° θ < 1.5 ° 1.5 ° θ < 3 ° θ 3 ° θ—slope of the corresponding raster point (°), λ—slope length of the corresponding raster point (m).
S = { 10.8 sin ( θ ) + 0.03 16.8 sin ( θ ) + 0.5 21.9 sin ( θ ) + 0.03 θ 5 ° 5 ° θ < 10 ° θ 10 °
CDimensionless N D V I = ( ρ n i r ρ r e d ) / ( ρ n i r + ρ r e d )
c = ( N D V I N D V I min ) / ( N D V I max N D V I min )
C = { 1 , c = 0 0.6508 0.3436 lg c , 0.001 , c > 78.3 % 0 < c 78.3 %
ρ r e d —surface reflectance in the near-infrared band, ρ n i r —surface reflectance in the visible band.
PDimensionlessSee table belowThe value of P ranges from 0 to 1, with 0 representing an area free of erosion after water conservation measures, and 1 being used to indicate an area without any water conservation measures.
Note: Sn = 1 − Sa/100.
Table A2. Calculation of P-factor.
Slope
(%)
Arable LandWood
Land
Grass
Land
Water AreaSettlements and CitiesUnused Land
0–1111001
1–90.30.8
9–180.5
18–210.6
>2111

Appendix B. Production Potential (Section 2.1.2)

Table A3. Calculation of each factor of land production potential.
ParametersCalculation FormulaFormula Parameter Breakdown
Photosynthetic production potential f ( Q ) = Q × ε × α × ( 1 β ) × ( 1 γ ) × ( 1 ω ) × ϕ × ( 1 X ) 1 × H 1 ε—physiological radiation coefficient, α—radiation absorption rate, β—radiation leakage rate, γ—light saturation limitation rate; ω—respiration consumption rate, Φ—quantum conversion efficiency, X—plant water content, H—mass–energy conversion coefficient, Q—total solar radiation intensity reaching the ground (J·cm−2).
Light and temperature production potential f ( T ) = e a ( T T 0 10 ) 2 (cool-loving crops)
f ( T ) = { 0.027 T 0.162 0.086 T 1.14 1.0 0.083 T + 3.67 6   T < 21   21   T < 28   28   T < 32   32   T < 44   (heat-loving crops)
T0—the optimum temperature for crop growth (taken as 20 °C), T—the actual temperature for crop growth (°C); a—the temperature-related parameters are as follows: when T < T0, a = −1; and when TT0, a = −2.
Climate production potential f ( W ) = { 0.8 R / E 0 1.0 0 < R < 1.25 E 0 1.25 E 0 R R—precipitation (mm), E0—maximum evaporation when soil moisture supply is adequate (mm).
Land production potential f ( S ) = a M + b N + c P + d K M, N, P and K are the affiliation values of each fertility factor of soil organic matter, fast-acting nitrogen, fast-acting pity and fast-acting potassium available to crops in the arable layer, and a, b, c and d are the relative weight coefficients of the contribution of these four factors to crop yield, respectively.
Note: ε—0.49; α—0.10; β—0.07; γ—0; ω—0.3; Φ—0.224; X—0.14; H—1.78 × 10⁷ J·kg−1; Q = 348.75 + 627.75 × n/N, where N can be calculated using the formula proposed by Goudriaan and van Laar [54]. The formula is as follows: (1) N = 12 × [1 + (2/π) × a × sin(a/b)]; (2) a = sinλ × sinδ; b = cosλ × cosδ; and (3) sinδ = −sin(π × 23.45/180) × cos [2π × (td + 10)/365], where td—day sequence (d), λ—latitude and δ—inclination of the sun with respect to the equator.

Appendix C. Soil Nutrient Balance (Section 2.1.3)

Equations for calculating the input N i n and output of nitrogen, phosphorus and potassium are calculated as follows:
{ N c f e r = N n f e r + A D c f T N c f N o f e r = A D o n T N o n N s e e d = S U D R Y T N N i r r = S V ρ T N i r r × 10 6 N s t r = Y D R Y R S / G T N s A r N d e p = S A n d e p N b n f = S B
where N n f e r is N fertilizer application (converted amount), kg; A D c f is compound fertilizer application rate (converted amount), kg; T N c f is the mass fraction of nitrogen in the compound fertilizer, %; A D o n is the amount of organic fertilizer applied, kg; T N o n is the nitrogen mass fraction of the organic fertilizer; S is the area under the crop, ha; U is the amount of crop sown, kg/ha; D R Y is the dry matter percentage of the crop seeds; T N is the mass fraction of nitrogen in the crop seeds; V is the amount of irrigation water for the crop, m3/ha, calculated using FAO’s recommended CropWat model; ρ is the irrigation water density; T N i r r is the mass fraction of nitrogen in the irrigation water; Y is crop yield, kg; RS/G is the grass-to-grain ratio of the crop; A r is the straw return rate; A n d e p is the dry and wet deposition of atmospheric nitrogen per unit area, kg/ha; and B is the amount of (non-)symbiotic nitrogen fixation by crops, kg/ha.
The input of phosphorus P i n is calculated as follows:
{ P c f e r = 0.44 ( P p f e r + A D c f T P c f ) P o f e r = 0.44 A D o n T P o n P s e e d = S U D R Y T P P i r r = S V ρ T P i r r 10 6 P s t r = Y D R Y R S / G T P S A r P d e p = 0.44 S A p d e p
where 0.44 is the mass fraction of phosphorus (P) in phosphorus pentoxide (P2O5); P p f e r is the amount of phosphate fertilizer applied (discounted amount), kg; T P c f is the mass fraction of phosphorus in the compound fertilizer; T P o n is the mass fraction of phosphorus in the organic fertilizer; T P and T P s are the mass fractions of phosphorus in crop seeds and straw, respectively; T P i r r is the mass fraction of phosphorus in the irrigation water; and A p d e p is the amount of dry and wet atmospheric phosphorus deposition per unit area.
The input of potassium K i n is calculated as follows:
{ K c f e r = 0.83 ( K k f e r + A D c f T K c f ) K o f e r = 0.83 A D o n T K o n K s e e d = S U D R Y T K K i r r = S V ρ T K i r r 10 6 K s t r = Y D R Y R S / G T P s ( A r + A f ) K d e p = 0.83 S A k d e p
where 0.83 is the mass fraction of potassium (K) in potassium oxide (K2O); K k f e r is the amount of potash applied (discounted amount), kg; T K c f is the mass fraction of potassium in the compound fertilizer; T K o n is the mass fraction of potassium in the organic fertilizer; T K and T K s are the mass fractions of potassium in the seeds and straw of the crop, respectively; T K i r r is the mass fraction of potassium in the irrigation water; A f is the straw burning rate; and A k d e p is the dry and wet deposition of potassium per unit area of atmosphere.
The output of nitrogen N o u t is calculated as follows:
{ N o u t g r a i n = Y D R Y T N N o u t s t r a w = Y D R Y R S / G T N s N N H 3 = ( N n f e r + A D c f T N c f ) N N H 3 c f e r + ( A D o n T N o n ) N N H 3 o f e r N s u r = ( N n f e r + A D c f T N c f + A D o n T N o n ) A n f s u r + S r i c e A n p s u r + ( S S r i c e ) A n d s u r N s u b = ( N n f e r + A D c f T N c f + A D o n T N o n ) A n f s u b + S A n s u b N d e n = ( N n f e r + A D c f T N c f ) A d e n c f e r + ( A D o n T N o n ) A d e n o f e r
where N N H 3 c f e r is the ammonia volatilization loss factor for chemical nitrogen fertilizers; N N H 3 o f e r is the ammonia volatilization loss factor for organic fertilizers; A n f s u r is the fertilizer N surface runoff loss factor; A n p s u r is the coefficient of loss of surface runoff of soil nitrogen from paddy fields; S r i c e is the area under rice cultivation; A n d s u r is the dryland soil N surface runoff loss factor; A n f s u b is the coefficient of subsurface leaching losses of fertilizer nitrogen; A n s u b is the loss factor for subsurface leaching of soil N; A d e n c f e r is the coefficient of nitrogen loss due to nitrification–denitrification of chemical nitrogen fertilizers; and A d e n o f e r is the coefficient of nitrogen loss due to nitrification–denitrification of organic fertilizers.
The output of phosphorus P o u t is calculated as follows:
{ P o u t g r a i n = Y D R Y T P P o u t s t r a w = Y D R Y R S / G T P s P s u r = ( P p f e r + A D c f T P c f + A D o n T P o n ) A p f s u r + S r i c e A p p s u r + ( S S r i c e ) A p d s u r
where A p f s u r is the fertilizer phosphorus surface runoff coefficient; A p p s u r is the coefficient of loss of phosphorus surface runoff from paddy fields; and A p d s u r is the dryland phosphorus surface runoff loss factor.
The output of potassium K o u t is calculated as follows:
{ K o u t g r a i n = Y D R Y T K K o u t s t r a w = Y D R Y R S / G T K s K s u r = S r i c e A s u r
where Asur is the coefficient of potassium loss due to surface runoff.

References

  1. Robinson, D.A.; Fraser, I.; Dominati, E.J.; Davidsdottir, B.; Jonsson, J.O.G.; Jones, L.; Jones, S.B.; Tuller, M.; Lebron, I.; Bristow, K.L.; et al. On the Value of Soil Resources in the Context of Natural Capital and Ecosystem Service Delivery. Soil Sci. Soc. Am. J. 2014, 78, 685–700. [Google Scholar] [CrossRef] [Green Version]
  2. Brevik, E.C.; Sauer, T.J. The past, present, and future of soils and human health studies. Soil 2015, 1, 35–46. [Google Scholar] [CrossRef]
  3. Ji, X.; Han, M.; Ulgiati, S. Optimal allocation of direct and embodied arable land associated to urban economy: Understanding the options deriving from economic globalization. Land Use Policy 2020, 91, 104392. [Google Scholar] [CrossRef]
  4. Wang, J.; Xu, X.; Pei, J.; Li, S. Current Situations of Black Soil Quality and Facing Opportunities and Challenges in Northeast China. Chin. J. Soil Sci. 2021, 52, 695–701. [Google Scholar]
  5. Xingwu, D.; Li, R.; Guangli, Z.; Jinming, H.; Haiyan, F. Soil productivity in the Yunnan province: Spatial distribution and sustainable utilization. Soil Tillage Res. 2015, 147, 10–19. [Google Scholar] [CrossRef]
  6. Zhang, G.; Bai, J.; Xi, M.; Zhao, Q.; Lu, Q.; Jia, J. Soil quality assessment of coastal wetlands in the Yellow River Delta of China based on the minimum data set. Ecol. Indic. 2016, 66, 458–466. [Google Scholar] [CrossRef]
  7. He, C.; Han, Q.; de Vries, B.; Wang, X.; Guochao, Z. Evaluation of sustainable land management in urban area: A case study of Shanghai, China. Ecol. Indic. 2017, 80, 106–113. [Google Scholar] [CrossRef]
  8. Ramadani, I.; Bytyqi, V. Processes Affecting Sustainable Use of Agricultural Land in Kosovo. Quaest. Geogr. 2018, 37, 53–66. [Google Scholar] [CrossRef] [Green Version]
  9. Fu, J.; Bu, Z.; Jiang, D.; Lin, G.; Li, X. Sustainable land use diagnosis based on the perspective of production–living–ecological spaces in China. Land Use Policy 2022, 122, 106386. [Google Scholar] [CrossRef]
  10. Nziguheba, G.; Adewopo, J.; Masso, C.; Nabahungu, N.L.; Six, J.; Sseguya, H.; Taulya, G.; Vanlauwe, B. Assessment of sustainable land use: Linking land management practices to sustainable land use indicators. Int. J. Agric. Sustain. 2022, 20, 265–288. [Google Scholar] [CrossRef]
  11. Li, X.; Li, H.; Yang, L.; Ren, Y. Assessment of Soil Quality of Croplands in the Corn Belt of Northeast China. Sustainability 2018, 10, 248. [Google Scholar] [CrossRef] [Green Version]
  12. Zhao, R.; Li, J.; Wu, K.; Kang, L. Cultivated Land Use Zoning Based on Soil Function Evaluation from the Perspective of Black Soil Protection. Land 2021, 10, 605. [Google Scholar] [CrossRef]
  13. Geng, S.B.; Shi, P.L.; Zong, N.; Zhu, W.R. Using Soil Survey Database to Assess Soil Quality in the Heterogeneous Taihang Mountains, North China. Sustainability 2018, 10, 3443. [Google Scholar] [CrossRef] [Green Version]
  14. Xie, X.-F.; Pu, L.-J.; Zhu, M.; Wu, T.; Xu, Y. Assessment of Soil Quality in Coastal Tidal Flat Reclamation Areas Based on MDS-TOPSIS Model. Huanjing Kexue 2019, 40, 5484–5492. [Google Scholar]
  15. Ouyang, X.; Wang, J.; Chen, X.; Zhao, X.; Ye, H.; Watson, A.E.; Wang, S. Applying a projection pursuit model for evaluation of ecological quality in Jiangxi Province, China. Ecol. Indic. 2021, 133, 108414. [Google Scholar] [CrossRef]
  16. Pang, J.; Liu, X.; Huang, Q. A new quality evaluation system of soil and water conservation for sustainable agricultural development. Agric. Water Manag. 2020, 240, 106235. [Google Scholar] [CrossRef]
  17. Khan, J.; Singh, R.; Upreti, P.; Yadav, R.K. Geo-statistical assessment of soil quality and identification of Heavy metal contamination using Integrated GIS and Multivariate statistical analysis in Industrial region of Western India. Environ. Technol. Innov. 2022, 28, 102646. [Google Scholar] [CrossRef]
  18. Tengberg, A.; Radstake, F.; Zhang, K.; Dunn, B. Scaling up of Sustainable Land Management in the Western People’s Republic of China: Evaluation of a 10-Year Partnership. Land Degrad. Dev. 2016, 27, 134–144. [Google Scholar] [CrossRef]
  19. Shao, Z.; Huq, M.E.; Cai, B.; Altan, O.; Li, Y. Integrated remote sensing and GIS approach using Fuzzy-AHP to delineate and identify groundwater potential zones in semi-arid Shanxi Province, China. Environ. Model. Softw. 2020, 134, 104868. [Google Scholar] [CrossRef]
  20. Chen, S.; Arrouays, D.; Angers, D.A.; Chenu, C.; Barré, P.; Martin, M.P.; Saby, N.P.A.; Walter, C. National estimation of soil organic carbon storage potential for arable soils: A data-driven approach coupled with carbon-landscape zones. Sci. Total Environ. 2019, 666, 355–367. [Google Scholar] [CrossRef]
  21. Liang, C.-P.; Lin, T.-C.; Suk, H.; Wang, C.-H.; Liu, C.-W.; Chang, T.-W.; Chen, J.-S. Comprehensive assessment of the impact of land use and hydrogeological properties on the groundwater quality in Taiwan using factor and cluster analyses. Sci. Total Environ. 2022, 851, 158135. [Google Scholar] [CrossRef] [PubMed]
  22. Zhang, Q.; Qin, W.; Cao, W.; Jiao, J.; Yin, Z.; Xu, H. Response of erosion reduction effect of typical soil and water conservation measures in cropland to rainfall and slope gradient changes and their applicable range in the Chinese Mollisols Region, Northeast China. Int. Soil Water Conserv. Res. 2022, 11, 251–262. [Google Scholar] [CrossRef]
  23. Li, S.; Zhao, Y.; Xiao, W.; Yellishetty, M.; Yang, D. Identifying ecosystem service bundles and the spatiotemporal characteristics of trade-offs and synergies in coal mining areas with a high groundwater table. Sci. Total Environ. 2022, 807, 151036. [Google Scholar] [CrossRef]
  24. Yang, J.; Xie, B.; Tao, W.; Zhang, D. Ecosystem Services Assessment, Trade-off, and Bundles in the Yellow River Basin, China. Diversity 2021, 13, 308. [Google Scholar] [CrossRef]
  25. Kumar, N.; Singh, S.K. Soil erosion assessment using earth observation data in a trans-boundary river basin. Nat. Hazards 2021, 107, 1–34. [Google Scholar] [CrossRef]
  26. Chen, Y.; Donohue, R.J.; McVicar, T.R.; Waldner, F.; Mata, G.; Ota, N.; Houshmandfar, A.; Dayal, K.; Lawes, R.A. Nationwide crop yield estimation based on photosynthesis and meteorological stress indices. Agric. For. Meteorol. 2020, 284, 107872. [Google Scholar] [CrossRef]
  27. Das, P.P.; Singh, K.R.B.; Nagpure, G.; Mansoori, A.; Singh, R.P.; Ghazi, I.A.; Kumar, A.; Singh, J. Plant-soil-microbes: A tripartite interaction for nutrient acquisition and better plant growth for sustainable agricultural practices. Environ. Res. 2022, 214, 113821. [Google Scholar] [CrossRef]
  28. Gujre, N.; Rangan, L.; Mitra, S. Occurrence, geochemical fraction, ecological and health risk assessment of cadmium, copper and nickel in soils contaminated with municipal solid wastes. Chemosphere 2021, 271, 129573. [Google Scholar] [CrossRef]
  29. Hakanson, L. An ecological risk index for aquatic pollution control.a sedimentological approach. Water Res. 1980, 14, 975–1001. [Google Scholar] [CrossRef]
  30. Lorenz, K.; Lal, R.; Ehlers, K. Soil organic carbon stock as an indicator for monitoring land and soil degradation in relation to United Nations’ Sustainable Development Goals. Land Degrad. Dev. 2019, 30, 824–838. [Google Scholar] [CrossRef]
  31. Horáček, M.; Samec, P.; Minár, J. The mapping of soil taxonomic units via fuzzy clustering—A case study from the Outer Carpathians, Czechia. Geoderma 2018, 326, 111–122. [Google Scholar] [CrossRef]
  32. Hengl, T. Finding the right pixel size. Comput. Geosci. 2006, 32, 1283–1298. [Google Scholar] [CrossRef]
  33. IPCC. Intergovernmental Panel on Climate Change—2019 Refinement to the 2006 IPCC Guidelines for National Greenhouse Gas Inventory; IPCC: Kyoto, Japan, 2019. [Google Scholar]
  34. Li, M.; Cao, X.; Liu, D.; Fu, Q.; Li, T.; Shang, R. Sustainable management of agricultural water and land resources under changing climate and socio-economic conditions: A multi-dimensional optimization approach. Agric. Water Manag. 2022, 259, 107235. [Google Scholar]
  35. Schweizer, S.A.; Fischer, H.; Häring, V.; Stahr, K. Soil structure breakdown following land use change from forest to maize in Northwest Vietnam. Soil Tillage Res. 2017, 166, 10–17. [Google Scholar] [CrossRef]
  36. Zheng, H.; Wang, L.; Peng, W.; Zhang, C.; Li, C.; Robinson, B.E.; Wu, X.; Kong, L.; Li, R.; Xiao, Y.; et al. Realizing the values of natural capital for inclusive, sustainable development: Informing China’s new ecological development strategy. Proc. Natl. Acad. Sci. USA 2019, 116, 8623–8628. [Google Scholar] [CrossRef] [Green Version]
  37. Sapkota, T.B.; Bijay, S.; Takele, R. Chapter Five—Improving nitrogen use efficiency and reducing nitrogen surplus through best fertilizer nitrogen management in cereal production: The case of India and China. In Advances in Agronomy; Sparks, D.L., Ed.; Academic Press: Cambridge, MA, USA, 2023; pp. 233–294. [Google Scholar]
  38. Svanbäck, A.; McCrackin, M.L.; Swaney, D.P.; Linefur, H.; Gustafsson, B.G.; Howarth, R.W.; Humborg, C. Reducing agricultural nutrient surpluses in a large catchment—Links to livestock density. Sci. Total Environ. 2019, 648, 1549–1559. [Google Scholar] [CrossRef]
  39. Hu, B.; Shao, S.; Ni, H.; Fu, Z.; Hu, L.; Zhou, Y.; Min, X.; She, S.; Chen, S.; Huang, M.; et al. Current status, spatial features, health risks, and potential driving factors of soil heavy metal pollution in China at province level. Environ. Pollut. 2020, 266, 114961. [Google Scholar] [CrossRef] [PubMed]
  40. Hu, W.; Wang, H.; Dong, L.; Huang, B.; Borggaard, O.K.; Hansen, H.C.B.; He, Y.; Holm, P.E. Source identification of heavy metals in peri-urban agricultural soils of southeast China: An integrated approach. Environ. Pollut. 2018, 237, 650–661. [Google Scholar]
  41. Cheng, Y.; Li, P.; Xu, G.; Wang, X.; Li, Z.; Cheng, S.; Huang, M. Effects of dynamic factors of erosion on soil nitrogen and phosphorus loss under freeze-thaw conditions. Geoderma 2021, 390, 114972. [Google Scholar] [CrossRef]
  42. Schneider, F.; Don, A.; Hennings, I.; Schmittmann, O.; Seidel, S.J. The effect of deep tillage on crop yield—What do we really know? Soil Tillage Res. 2017, 174, 193–204. [Google Scholar] [CrossRef]
  43. Tian, P.; Lian, H.; Wang, Z.; Jiang, Y.; Li, C.-F.; Sui, P.; Qi, H. Effects of Deep and Shallow Tillage with Straw Incorporation on Soil Organic Carbon, Total Nitrogen and Enzyme Activities in Northeast China. Sustainability 2020, 12, 8679. [Google Scholar] [CrossRef]
  44. Severini, S.; Castellari, M.; Cavalli, D.; Pecetti, L. Economic Sustainability and Riskiness of Cover Crop Adoption for Organic Production of Corn and Soybean in Northern Italy. Agronomy 2021, 11, 766. [Google Scholar] [CrossRef]
  45. Han, C.; Chen, S.; Yu, Y.; Xu, Z.; Zhu, B.; Xu, X.; Wang, Z. Evaluation of Agricultural Land Suitability Based on RS, AHP, and MEA: A Case Study in Jilin Province, China. Agriculture 2021, 11, 370. [Google Scholar] [CrossRef]
  46. Ristić, V.; Maksin, M.; Nenković-Riznić, M.; Basarić, J. Land-use evaluation for sustainable construction in a protected area: A case of Sara mountain national park. J. Environ. Manag. 2018, 206, 430–445. [Google Scholar] [CrossRef] [PubMed]
  47. Liu, X.; Xin, L.; Lu, Y. National scale assessment of the soil erosion and conservation function of terraces in China. Ecol. Indic. 2021, 129, 107940. [Google Scholar] [CrossRef]
  48. Filho, J.D.S.O.; Vieira, J.N.; da Silva, E.M.R.; de Oliveira, J.G.B.; Pereira, M.G.; Brasileiro, F.G. Assessing the effects of 17 years of grazing exclusion in degraded semi-arid soils: Evaluation of soil fertility, nutrients pools and stoichiometry. J. Arid. Environ. 2019, 166, 1–10. [Google Scholar] [CrossRef]
  49. Xiao, R.; Wang, S.; Li, R.; Wang, J.J.; Zhang, Z. Soil heavy metal contamination and health risks associated with artisanal gold mining in Tongguan, Shaanxi, China. Ecotoxicol. Environ. Saf. 2017, 141, 17–24. [Google Scholar] [CrossRef]
  50. Harris, S.; McDowell, R.W.; Lilburne, L.; Laurenson, S.; Dowling, L.; Guo, J.; Pletnyakov, P.; Beare, M.; Palmer, D. Developing an indicator of productive potential to assess land use suitability in New Zealand. Environ. Sustain. Indic. 2021, 11, 100128. [Google Scholar] [CrossRef]
  51. Zou, S.; Zhang, L.; Huang, X.; Osei, F.B.; Ou, G. Early ecological security warning of cultivated lands using RF-MLP integration model: A case study on China’s main grain-producing areas. Ecol. Indic. 2022, 141, 109059. [Google Scholar] [CrossRef]
  52. Zhao, W.; Ma, J.; Liu, Q.; Song, J.; Tysklind, M.; Liu, C.; Wang, D.; Qu, Y.; Wu, Y.; Wu, F. Comparison and application of SOFM, fuzzy c-means and k-means clustering algorithms for natural soil environment regionalization in China. Environ. Res. 2023, 216, 114519. [Google Scholar] [CrossRef]
  53. Tripathi, R.; Nayak, A.K.; Shahid, M.; Lal, B.; Gautam, P.; Raja, R.; Mohanty, S.; Kumar, A.; Panda, B.B.; Sahoo, R.N. Delineation of soil management zones for a rice cultivated area in eastern India using fuzzy clustering. Catena 2015, 133, 128–136. [Google Scholar] [CrossRef]
  54. Goudriaan, J.; Laar, H.H.V. Modelling Potential Crop Growth Processes. In Current Issues in Production Ecology; Kluwer Academic Publishers: Dordrecht, The Netherlands, 1994. [Google Scholar]
Figure 1. Flow chart of refined evaluation. (Note: For the EPIC model, see the formula for the soil erosion K-factor in Appendix.)
Agronomy 13 02072 g001
Figure 2. Study area.
Agronomy 13 02072 g002
Figure 3. Calculated results for each factor of the RULSE model.
Agronomy 13 02072 g003
Figure 4. Soil types and their distribution in the study area.
Agronomy 13 02072 g004
Figure 5. Calculated results for each indicator of soil quality sustainability in the study area: (a) Soil erosion levels; (b) Potential crop production capacity; (c) Nutrient balance; (d) Potential ecological hazard index; (e) Soil organic carbon stocks.
Agronomy 13 02072 g005
Figure 6. Clustering dynamics of soil sustainability assessment in the Three Rivers Plain and Songnen Plain, Heilongjiang Province. Note: ×i denotes the i-th farm.
Agronomy 13 02072 g006
Figure 7. Soil sustainability classes.
Agronomy 13 02072 g007
Table 1. Mass fractions of elemental nitrogen, phosphorus and potassium in fertilizer, irrigation water, and wet and dry atmospheric deposition.
ElementMass Fraction of Elements in FertilizerMass Fraction of Elements in Organic FertilizerMass Fraction of Elements in Irrigation Water (mg/kg)Elements in Atmospheric Dry and Wet Deposition (kg/ha)
N1.00%1.78%1.8227.6
P2.05%0.77%1.4971.52
K0.49%0.78%2.2458.3
Table 2. Area, yield, grass-to-grain ratio and nitrogen fixation in major crops.
CropCrop Acreage (ha)Grass Valley RatioCrop Yield (t)Dry Matter RatioNitrogen Fixation (kg/ha)
Wheat36810.63215,77289%15
Rice1,530,1400.57013,864,71489%30
Corn523,5600.5595,235,38887%15
Soybeans801,9421.2952,063,29991%126.83
Note: Grass valley ratio = Crop straw weight/Crop seed weight.
Table 3. Factors influencing the output of elemental nitrogen and their values.
Influencing FactorsValueUnit
Ammonia volatilization loss factor for chemical nitrogen fertilizers21.30%
Ammonia volatilization loss factor for organic fertilizers23.01%
Fertilizer N surface runoff loss factor0.343%
Surface runoff loss factor for soil nitrogen from paddy fields3.225kg/ha
Loss factor for surface runoff of nitrogen from dryland soils2.345kg/ha
Subsurface leaching loss factor for fertilizer N0.528%
Loss factor for subsurface leaching of soil N3.161kg/ha
Nitrogen loss factor due to nitrification/denitrification of chemical nitrogen fertilizers1.103%
Nitrogen loss factor due to nitrification/denitrification of organic fertilizers1.000%
Table 4. Background values for each heavy metal element and their toxicity factors.
ElementCdHgAsPbCrNi
Background values Bn (mg·kg−1)0.0790.0169.3322.750.8224.16
Toxicity factor Ti304010525
Table 5. The criteria for determining the degree of soil erosion.
Soil Erosion Modulus (t·km−2·a−1)Degree of Soil ErosionRatio of Area (%)
0–2500Slight erosion89.65
2500–5000Mild erosion5.09
5000–8000Moderate erosion3.11
8000–15,000Heavy erosion1.67
>15,000Severe erosion0.48
Table 6. Grading criteria for land sustainability assessment.
Land Quality Sustainability GradeEvaluation Factors
Soil ErosionSOC StorageSoil Nutrient BalanceHeavy Metal Contamination of SoilsCrop Production Potential
Grade 10–25 pointsSevere erosionLowSevere imbalanceSevere pollutionLow
Grade 225–40 pointsSevere erosionRelatively lowheavy pollutionLow
Grade 340–55 pointsHeavy erosionModerateSlight imbalanceModerate pollutionRelatively low
Grade 455–70 pointsModerate erosionModerateModerate pollutionModerate
Grade 570–85 pointsMild erosionRelatively HighMore balancedMild pollutionRelatively High
Grade 685–100 pointsSlight erosionHighSlight pollutionHigh
Disclaimer/Publisher’s Note: The statements, opinions and data contained in all publications are solely those of the individual author(s) and contributor(s) and not of MDPI and/or the editor(s). MDPI and/or the editor(s) disclaim responsibility for any injury to people or property resulting from any ideas, methods, instructions or products referred to in the content.

