Article

Using Plasma-Activated Water Generated by an Air Gliding Arc as a Nitrogen Source for Rice Seed Germination

by
Siraporn Chuea-uan
1,
Dheerawan Boonyawan
2,
Choncharoen Sawangrat
3 and
Sa-nguansak Thanapornpoonpong
1,*
1
Department of Plant and Soil Science, Faculty of Agriculture, Chiang Mai University, Chiang Mai 50200, Thailand
2
Plasma and Beam Physics Research Facility, Faculty of Science, Chiang Mai University, Chiang Mai 50200, Thailand
3
Department of Industrial Engineering, Faculty of Engineering, Chiang Mai University, Chiang Mai 50200, Thailand
*
Author to whom correspondence should be addressed.
Agronomy 2024, 14(1), 15; https://doi.org/10.3390/agronomy14010015
Submission received: 27 November 2023 / Revised: 15 December 2023 / Accepted: 19 December 2023 / Published: 20 December 2023
(This article belongs to the Section Farming Sustainability)

Abstract

:
This research aimed to understand the use of air gliding arc (GA) plasma to generate plasma-activated water (PAW) for fixing nitrogen in water and the chemical properties of PAW on the germination of rice seeds. The N2, NO, and OH molecules in GA plasma led to NO3, NO2, and H2O2 formation in the PAW. The NO3, NO2, and H2O2 contents in PAW rapidly decreased after 5 days of storage. The experiment was arranged in a completely randomised design using GA plasma discharged above the surface of deionised (DI) water with different airflow rates (2, 3, 4, 5, and 6 L/min) compared to the control (DI water). The NO3 and NO2 contents increased, resulting in an increase in total nitrogen (N) and gibberellic acid (GA3) accumulation in rice seeds. The PAW at an airflow rate of 5 L/min was optimal for enhancing radicle emergence at 48 and 72 h, germination, germination index, shoot length, fresh weight, and dry weight of seedlings. Therefore, air GA plasma to generate PAW is an efficient method for producing nitrogen in a soluble form, which can support the germination processes and early growth of rice seedlings.

1. Introduction

Nitrogen (N2) fixation is the process by which atmospheric N2 is converted into chemically accessible forms, such as ammonia (NH3) and nitrate (NO3). This process is essential for producing proteins, certain types of hormones, and other compounds in plants. N2 is the most abundant element in the Earth’s atmosphere, making up 78% of its composition [1]. However, in its gaseous state, N2 is relatively unreactive and not readily available to most organisms. N2 fixation transforms this plentiful resource into a form that organisms can use. There are two main types of N2 fixation: biological and industrial. Biological N2 fixation involves bacteria converting N2 into NH3, a process that requires a significant amount of energy. However, industrial N2 fixation involves converting N2 into NH3 using high temperature and high pressure in the Haber–Bosch (H-B) process. However, the H-B process is energy intensive and results in the release of significant amounts of carbon dioxide (CO2) into the environment [2,3].
At present, there are modern techniques and technologies that can fix N2 directly from N2 gas in the ambient air that is ionised by an electric field discharge called “plasma”, often referred to as the fourth state of matter, which is an ionised gas comprising a dynamic ensemble of free radicals, electrons, ions, and excited particles [4]. Plasma is typically classified into two main types: cold plasma (low temperature or non-thermal) and hot plasma (high temperature or thermal) based on the temperature level of its components [4,5]. The main biologically active component of plasma is reactive oxygen and nitrogen species (RONS), such as an oxygen atom (O), ozone (O3), superoxide anion (O2•−), hydroxyl radical (OH), nitrogen oxides (NO), or nitrogen dioxide (NO2). RONS radicals produced from these plasmas induce a variety of beneficial effects [5,6].
Plasma N2 fixation is generated from cold plasma in the air and manifests in the form of plasma-activated water (PAW). Plasma breakdown produces a variety of active species from RONS [7]. When these species contact the water surface, they dissolve and instigate various chemical reactions in the water. Ultimately, long-lived radicals, such as NO3, NH3, nitrite (NO2), ammonium (NH4), and hydrogen peroxide (H2O2), emerge in the PAW. However, the concentration of N2 species dissolved and stabilised in PAW depends on numerous factors, such as the plasma device, the power of the plasma system, the duration and proximity of plasma to the water surface, and the water volume. Furthermore, the storage period of PAW before its use also impacts the concentration of dissolved N2 species and the reactions that occur in PAW [7,8,9,10].
Several plasma devices discharge air to immobilise N2 species in water, such as pinhole plasma jets [11], plasma jets [12,13], and dielectric barrier plasmas [14]. A recently advanced and efficient plasma discharge technique is gliding arc (GA) plasma, which increases the discharge volume and leads to the separation and formation of high-density N2 ions, in which the obtained concentrations of NO3 and NO2 are higher than those of earlier techniques [15].
GA plasma is a type of hybrid plasma in which discharge occurs when a high-voltage electric field crosses a pair of electrodes in the gas. This electric field ionises molecules, turning them into plasma that conducts electricity. GA plasma is generated by heating an arc in a low-resistance gap. The convective plasma moves and forms a glowing arc that ‘glides’ between the electrodes following the path of least resistance [15]. As the convection gas flow pushes the plasma column down the length of the electrode, the plasma cools down at the column end because of the lack of the capability of the high voltage to continue further breakdown. Accordingly, the primary plasma column goes away, and the travel cycle for the new plasma column is repeated [16]. Therefore, in this experiment, the GA plasma device was selected to produce inorganic N2 species in the form of a plasma solution, known as PAW, that plants can immediately utilise as a source of nutrients for germination and early growth.
The properties of PAW, which generate RONS, also change in both physical and chemical reactions during its formation, such as acid–base balance (pH), oxidation–reduction potential (ORP), and electrical conductivity (EC). These changes result from the effects of plasma activation [7,10,17]. The application of PAW in agriculture has arisen with various uses such as seed treatment [18,19,20,21], crop growth improvement [11,22,23,24,25], and disease management [26,27,28]. In the plant growth process, the uptake of N2 in the form of NO3 or NH4+ is facilitated by the transport of specific proteins to the cell plasma membrane. In plants, NO3 is first reduced by NO3 reductase (NR) to NO2, and then, NO2 is further reduced by NO2 reductase (NiR) to NH4+. This NH4+ can be combined with amino acids, serving both as nutrients and signalling molecules that stimulate germination and plant growth [29].
The cultivation of rice holds exceptional significance, providing sustenance to billions of people worldwide [30]. To ensure the prosperity and sustenance of this staple crop, a comprehensive understanding of the key macronutrients governing rice seed growth and development is fundamental [31]. Among these essential nutrients, nitrogen (N) is a primary factor that significantly influences rice quality and productivity [32,33]. N serves as a fundamental macronutrient for rice, playing a pivotal role in various critical physiological processes. It actively participates in the synthesis of amino acids, proteins, and enzymes essential for cell division, photosynthesis, and energy metabolism [33,34,35]. As a result, the availability of N governs critical aspects of rice development, such as germination, leaf expansion, panicle formation, and grain yield [32,34,35].
The concentrations of NO3 and NO2 in PAW are believed to be major factors contributing to the improvement of plant germination and growth, as they can act as substitutes for traditional N sources [11].
This study aimed to understand the characteristics of air GA plasma in water by investigating the chemical properties of PAW on rice seed germination, radicle emergence, germination index, fresh weight, dry weight, and shoot and root lengths. It also included measurements of total N and gibberellic acid (GA3) accumulation. The storage period of PAW determines the viability of long-lived RONS as a stable and effective N source for evaluating their feasibility for future use in agriculture.

2. Materials and Methods

2.1. Gliding Arc Plasma Device and PAW Generation

The GA plasma device was created by the Plasma and Beam Physics Research Facility and Department of Chemistry, Faculty of Science, Chiang Mai, Thailand. The GA plasma array device consisted of four GA plasma units fixed at the top of an aluminium frame. Each GA plasma unit was equipped with a curved-sharp copper electrode, which served as the high-voltage electrode for a 20-watt radio frequency (RF) self-resonance power supply, and the power supply was measured using an oscilloscope. The power supply was capable of delivering a sinusoidal alternating current (AC) output at a frequency of 700–900 kHz, with a peak voltage (Vp) ranging from 6 to 10 kV (Figure 1a,b).
In these experiments, PAW was generated using a GA plasma discharge at ambient air above the surface of deionised (DI) water at a volume of 50 mL. The airflow rates were fixed at five levels (2, 3, 4, 5, and 6 L/min) for 15 min. The distance between the plasma tip and the DI water was maintained at 5 mm. A schematic diagram of PAW using air GA plasma discharge is shown in Figure 1c,d.

2.2. Optical Emission Spectra (OES) Measurement and Vibrational Temperature of N2

OES was a useful tool for investigating the type of reactive species generated in plasma. The OES was measured using a wide-spectrum spectrometer (Exemplar-LS Spectrometer, B&W Tek, Newark, DE, USA), which covers the range between 200 and 900 nm, and a short-range spectrometer (Avaspec-ULS3648 Starline Spectrometer, Avantes, The Netherlands), which covers the range between 265 and 430 nm. The entrance and exit spectrometer slits were set to 100 μm, and the grating had a value of 1200 g/mm. The integration time and resolution of the spectrometer were 500 ms and 0.1 nm, respectively. The OES measurements were performed three times at each airflow rate and averaged to ensure stable plasma and consistent free radical emissions.
The vibrational temperature (Tvib) of N2. It was assumed that part of the electron temperature (Te). The calculation was based on the light emission spectrum from the intensities of the lines at 370.9 and 380.4 nm [36], as follows:
I 370.9   nm I 380.4   nm = 1.126 e   0.465 / T vib
where I370.9 nm and I380.4 nm are the measured intensities of the emission lines at 370.9 and 380.4 nm, respectively.

2.3. Analysis of PAW Chemical Properties

2.3.1. The NO3 and NO2 Concentrations

The concentrations of NO3 and NO2 were determined using the colourimetric method with a nitrate test kit (HI3874-0, weight 156 g, cadmium, potassium disulphate, and sulphanilic acid) and nitrite test kit (HI3873-0, weight 169 g, potassium disulphate) (HANNA Instruments Inc., Smithfield, RI, USA) and measured using a UV/Vis spectrophotometer (Shimadzu UV–1800, Kyoto, Japan). Absorbance peaks were detected at wavelengths of 372 and 507 nm to determine the concentration of NO3and NO2, respectively, in the solution.
To create a standard curve for NO3, DI water treated with a nitrate test kit of the solution in the concentration range of 0 to 100 mg/L was used. The relationship of the absorbance value with the NO3 concentration was as follows:
Y = 0.0082X + 0.137    (R2 = 0.998)
where Y is the absorbance of NO3 at 372 nm, and X is the NO3 concentration in mg/L.
To create a standard curve for NO2, the same steps were taken as for the NO3 standard curve. However, for NO2, a solution with a concentration range of 0 to 1 mg/L was used. The relationship of the absorbance value with the NO2 concentration was as follows:
Y = 0.5165X − 0.0091    (R2 = 0.997)
where Y is the absorbance of NO2 at 507 nm, and X is the NO2 concentration in mg/L.
The PAW sample was 10 mL and was combined with a nitrate or nitrite test kit. They were mixed using a vortex mixer and left at room temperature for 10 min. Subsequently, their absorbance was measured at a wavelength of NO3 at 372 nm and NO2 at 507 nm. The recorded absorbance was substituted into the Y variable of the standard in Equations (2) and (3) to determine the NO3 and NO2 concentrations (mg/L), respectively.

2.3.2. The H2O2 Concentration

The concentration of H2O2 was measured using the iodometric titration method [37] with slight modification. First, a 3 mL PAW sample was combined with 1 mL of 2% potassium iodide (KI) solution and 1 mL of 2 M hydrogen chloride (HCl) in a tube. The mixture was shaken vigorously using a vortex until a yellow colour was observed. Then, it was kept in the dark for 15 min. After 15 min, 0.1 M sodium thiosulphate (Na2S2O3H2O) solution was added until the solution turned lighter yellow, and 30 µL of a starch indicator was added to the solution, which turned blue in colour. Finally, the solution was titrated with 0.1 M of Na2S2O3H2O with a drop of 10 µL until the solution turned from blue to clear, and the volume of 0.1 M of Na2S2O3H2O used in the titration was recorded.

2.3.3. The pH Level, EC and ORP Value

The pH level and EC value were measured using a pH/conductivity metre (SevenCompactTM Duo S213, Mettler Toledo International Inc., Greifensee, Switzerland). The ORP value was measured using an ORP metre (Mettler Toledo International Inc., Switzerland).

2.4. Storage Period of PAW

The GA plasma was discharged at an airflow rate of 5 L/min above the surface of the DI water in a volume of 50 mL for 20 min. The PAW chemical properties were then immediately analysed (Section 2.3). The samples were stored in an ambient room in clear plastic tubes, which were then capped for storage. The temperature and relative humidity (RH) were monitored using a datalogger (Testo 174H, Testo, Guangzhou, China) for a 20-day storage period. The chemical properties of PAW were analysed every 5 days on days 0, 5, 10, 15, and 20.

2.5. Rice Seed Sample

Rice seed (Oryza sativa L.) cv. San-pah-tawng 1 variety belonged to the indica type and a kind of glutinous rice. Rice seed sample was obtained from the Chiang Mai Rice Seed Center, Chiang Mai province, Thailand. The rice seed had germination of 95%, purity of 98%, and initial seed moisture content of 11%.

2.6. PAW Treatment of Rice Seed

PAW was generated using GA plasma, as detailed in Section 2.2. The PAW airflow rates were 2, 3, 4, 5, and 6 L/min, and the pH was optimised for rice seed growth using potassium hydroxide (KOH). The three replications in each treatment used 3 g of rice seed (100 seeds) soaked in 5 mL PAW for 24 h, and untreated seed was used as a control (soaked in DI water) at an ambient room (temperature of 29 ± 1 °C with an RH of 66 ± 3%). Thus, in this experiment, there were a total of 6 treatments, namely:
Treatment 1 (T1) = Control (DI water);
Treatment 2 (T2) = PAW at an airflow rate of 2 L/min;
Treatment 3 (T3) = PAW at an airflow rate of 3 L/min;
Treatment 4 (T4) = PAW at an airflow rate of 4 L/min;
Treatment 5 (T5) = PAW at an airflow rate of 5 L/min;
Treatment 6 (T6) = PAW at an airflow rate of 6 L/min.
Rice seed germination characteristics were measured using the standard between-paper germination method [38]. Each treatment used 100 rice seeds per replicate with 20 × 35 cm paper and 30 mL of each PAW treatment and DI water for the control. The papers were rolled up and placed in an incubator at 25 °C. After 5 days of planting, 10 mL of each treatment was added to the paper and returned to the incubator for 14 days. For FW and DW, as well as SL and RL, 25 rice seeds per replicate were used in each treatment. Using the standard between-paper germination method, rice seed characteristics were evaluated, as detailed in Section 2.7 and Section 2.8.

2.7. Determination of Total N and GA3 in Rice Seed

2.7.1. Total N Accumulation

The total N accumulation was determined using the combustion method [39] with slight modifications. After 14 days of planting, the samples were dried in a hot air oven at 55 °C for 48 h. Subsequently, the rice seedlings were crushed in an electric blade mill until fine, and 0.1400 ± 0.0009 g was weighed in a 502-186 tin foil cup. These samples were analysed using a nitrogen combustion device (FP-828 model, LECO®, St. Joseph, MI, USA). The principle behind this method is to burn the sample at high temperatures to convert the substance into a gaseous state and then measure the N signal using a thermal conductivity detector. The total N accumulation derived from the analysis was then represented as a percentage.

2.7.2. GA3 Concentration

The GA3 concentration was evaluated using the chromatographic analysis method [40] with slight modifications. After the rice seed was soaked in each treatment for 24 h, they were placed on paper (10 × 20 cm). Each PAW treatment and control added a volume of 7 mL to the paper. The samples were kept in an incubator at a temperature of 25 °C for 48 h (rice seed began to germinate) and ground into a fine powder, with each sample weighing 1 ± 0.004 g. The ground samples were placed in plastic tubes and extracted with 10 mL of a solvent mixture of methanol and formic acid 5.0% (80:20). These samples were sonicated using an ultrasonic processor, maintaining a temperature of 29 ± 1 °C. The sonication process consisted of 10 min of sonication, a 5 min break, followed by 10 min of sonication.
The extracted solutions were then filtered through Whatman™ No. 1 filter paper with a size of 11 µm. The filtered solution was evaporated using a rotary evaporator (Hei-Vap Precision, Heidolph, Germany). The evaporated samples were reconstituted in 2 mL of methanol and subsequently filtered through a 0.2 µm nylon membrane filter syringe into a sample tube. The samples were analysed using high-performance liquid chromatography (HPLC-SPD-10A, Shimadzu, Japan) equipped with a symmetry reverse-phase C18 column (5 μm; 3.9 × 150 mm). The column temperature was maintained at 40 °C, and the mobile phase used was a 0.01% formic acid solution prepared by mixing 1000 mL of pure water (18 MΩ) with 0.1 mL of formic acid. A flow rate of 1 mL/min was set for the analysis, and 10 µL of each sample was injected. The presence of GA3 was detected at a wavelength of 195 nm. The GA3 concentration results from the HPLC analysis were compared based on retention time and the standard curve of the GA3 solution with the area under the curve. In the concentration range of 0 to 10 µL/mL, the area under the graph is replaced with the value Y. The relationship was described by the following equation:
Y = 27,785X − 1874.1    (R2 = 0.997)
where Y is the area under the graph of GA3 at 195 nm, and X is the GA3 concentration in µg/mL.

2.8. Evaluation of Rice Seed Germination Characteristics

2.8.1. Germination (G)

G was counted on day 5 (first counted) and day 14 (final counted). The assessments for normal seedlings, abnormal seedlings, hard seeds, and dead seeds were recorded. The G percentage was calculated as follows:
G   ( % ) = n u m b e r     o f     n o r m a l     s e e d l i n g s t o t a l     n u m b e r     o f     s e e d s     p l a n t e d   ×   100

2.8.2. Germination Index (GI)

The normal seedlings were counted daily until day 14. The GI was calculated as follows:
GI = n u m b e r     o f     n o r m a l     s e e d l i n g s     g e r m i n a t e d     o n     d a y n u m b e r     o f     d a y s

2.8.3. Radicle Emergence (RE)

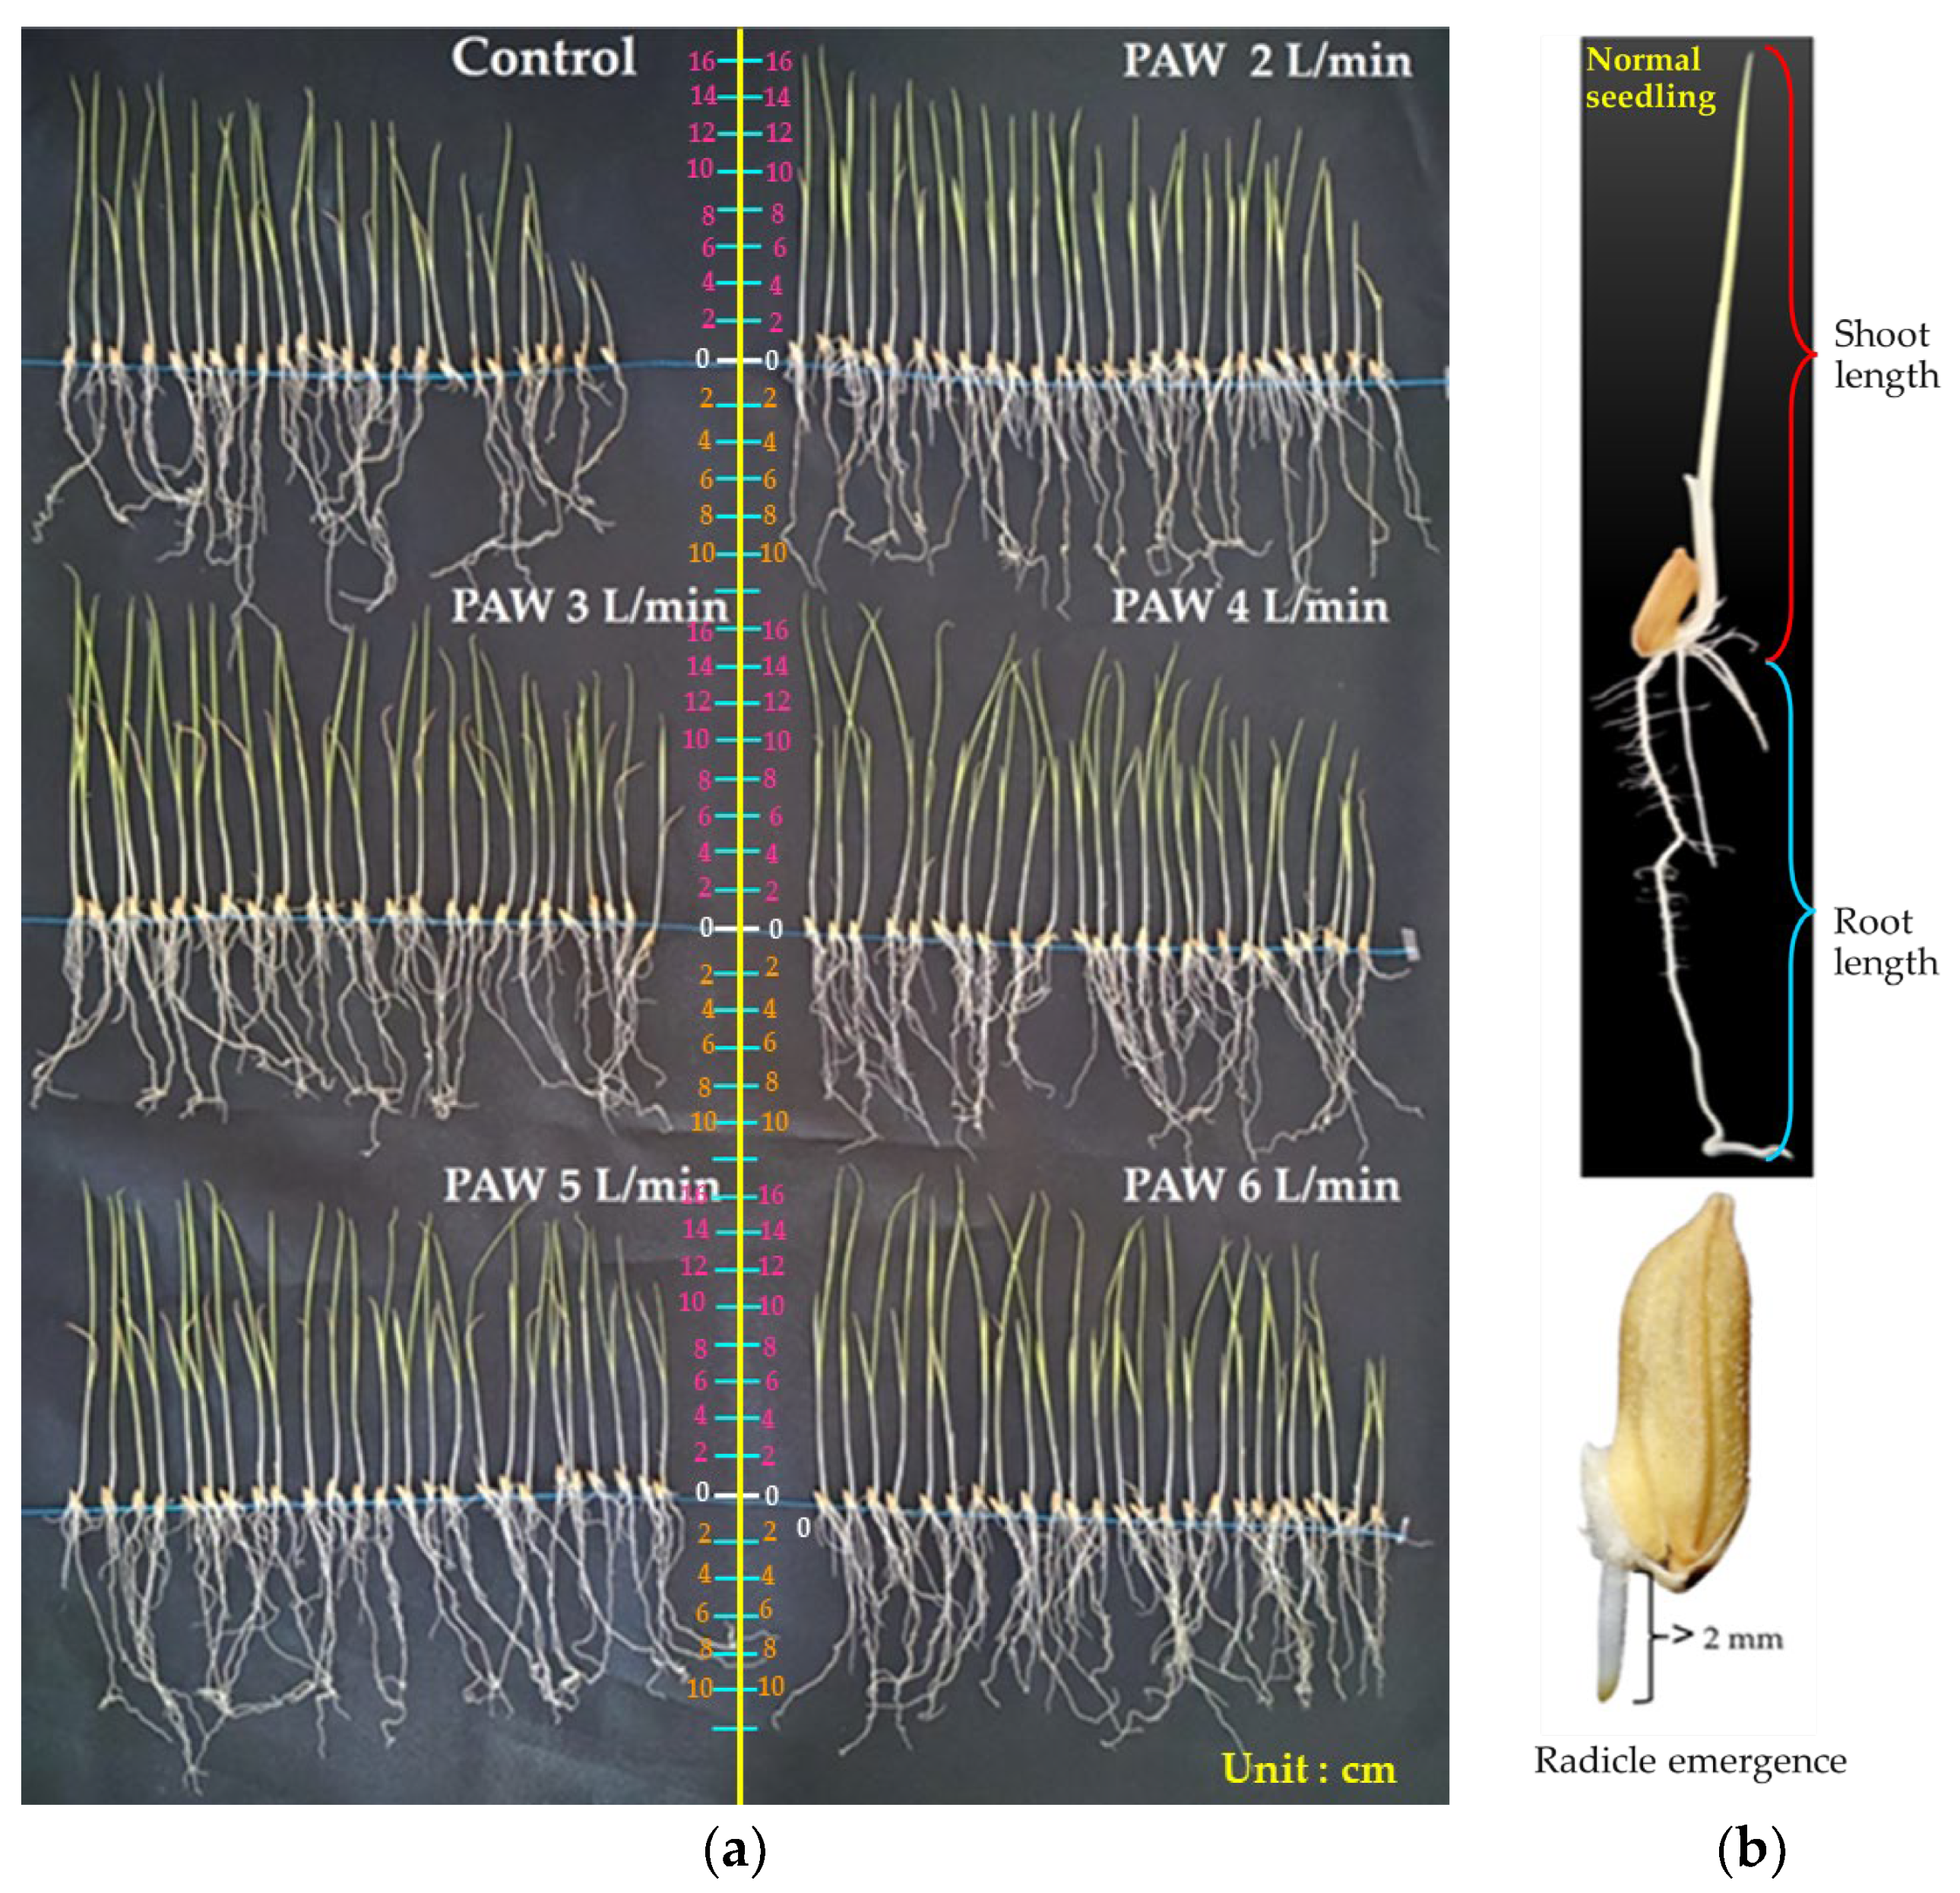
After 24, 48, and 72 h of planting, the length of the RE that exceeded 2 mm was measured and recorded. The percentage of RE was calculated as follows:
RE   ( % ) = n u m b e r     o f     s e e d s     w i t h     a     r a d i c l e     l e n g t h     o f     m o r e     t h a n     2     m m t o t a l     n u m b e r     o f     p l a n t e d     s e e d s   ×   100

2.8.4. Fresh Weight (FW) and Dry Weight (DW) of Seedling

Fourteen days after planting, seedlings that germinated normally were counted. Subsequently, the shoots and roots were cut from the seed. They were then immediately weighed as FW. For DW, the cut shoots and roots were packed in paper bags and dried in a hot air oven at 80 °C for 24 h. Subsequently, they were weighed to determine the DW. The unit of seedling weight was measured in mg/seedling and calculated as follows:
FW   and   DW   of   seedling = F W     o r     D W     o f     s h o o t s     a n d     r o o t s t o t a l     n o r m a l     s e e d l i n g s ( m g / s e e d l i n g )

2.8.5. Seedling Moisture Content (SMC)

The SMC was measured as the amount of water removed from the seedlings by taking the weight of the seedlings from Section 2.8.4. The percentage of SMC was calculated as follows:
SMC   ( % ) = F W D W F W   ×   100

2.8.6. Shoot Length (SL) and Root Length (RL)

SL was evaluated by measuring from the base of the shoot to the tip of the leaf. RL was measured from the base of the taproot to the tip of the root, determined after 14 days of planting, and using a ruler with units of centimetres (cm).

2.9. Statistical Analysis

The experiment was arranged in a completely randomised design (CRD). Data were analysed using a one-way analysis of variance (ANOVA). The means were compared using the least significant difference (LSD) test, and the data were expressed as means. Statistical significance was determined at p < 0.05 (*). In terms of data on the chemical properties in PAW and pH-adjusted PAW were examined for statistical significance using a two-sample t-test at p < 0.01 (**). Statistical analysis was performed using Statistix 8 (Analytical Software, Tallahassee, FL, USA).

3. Results

3.1. Plasma Optical Emission Spectra (OES) Characteristics and Vibrational Temperature of N2

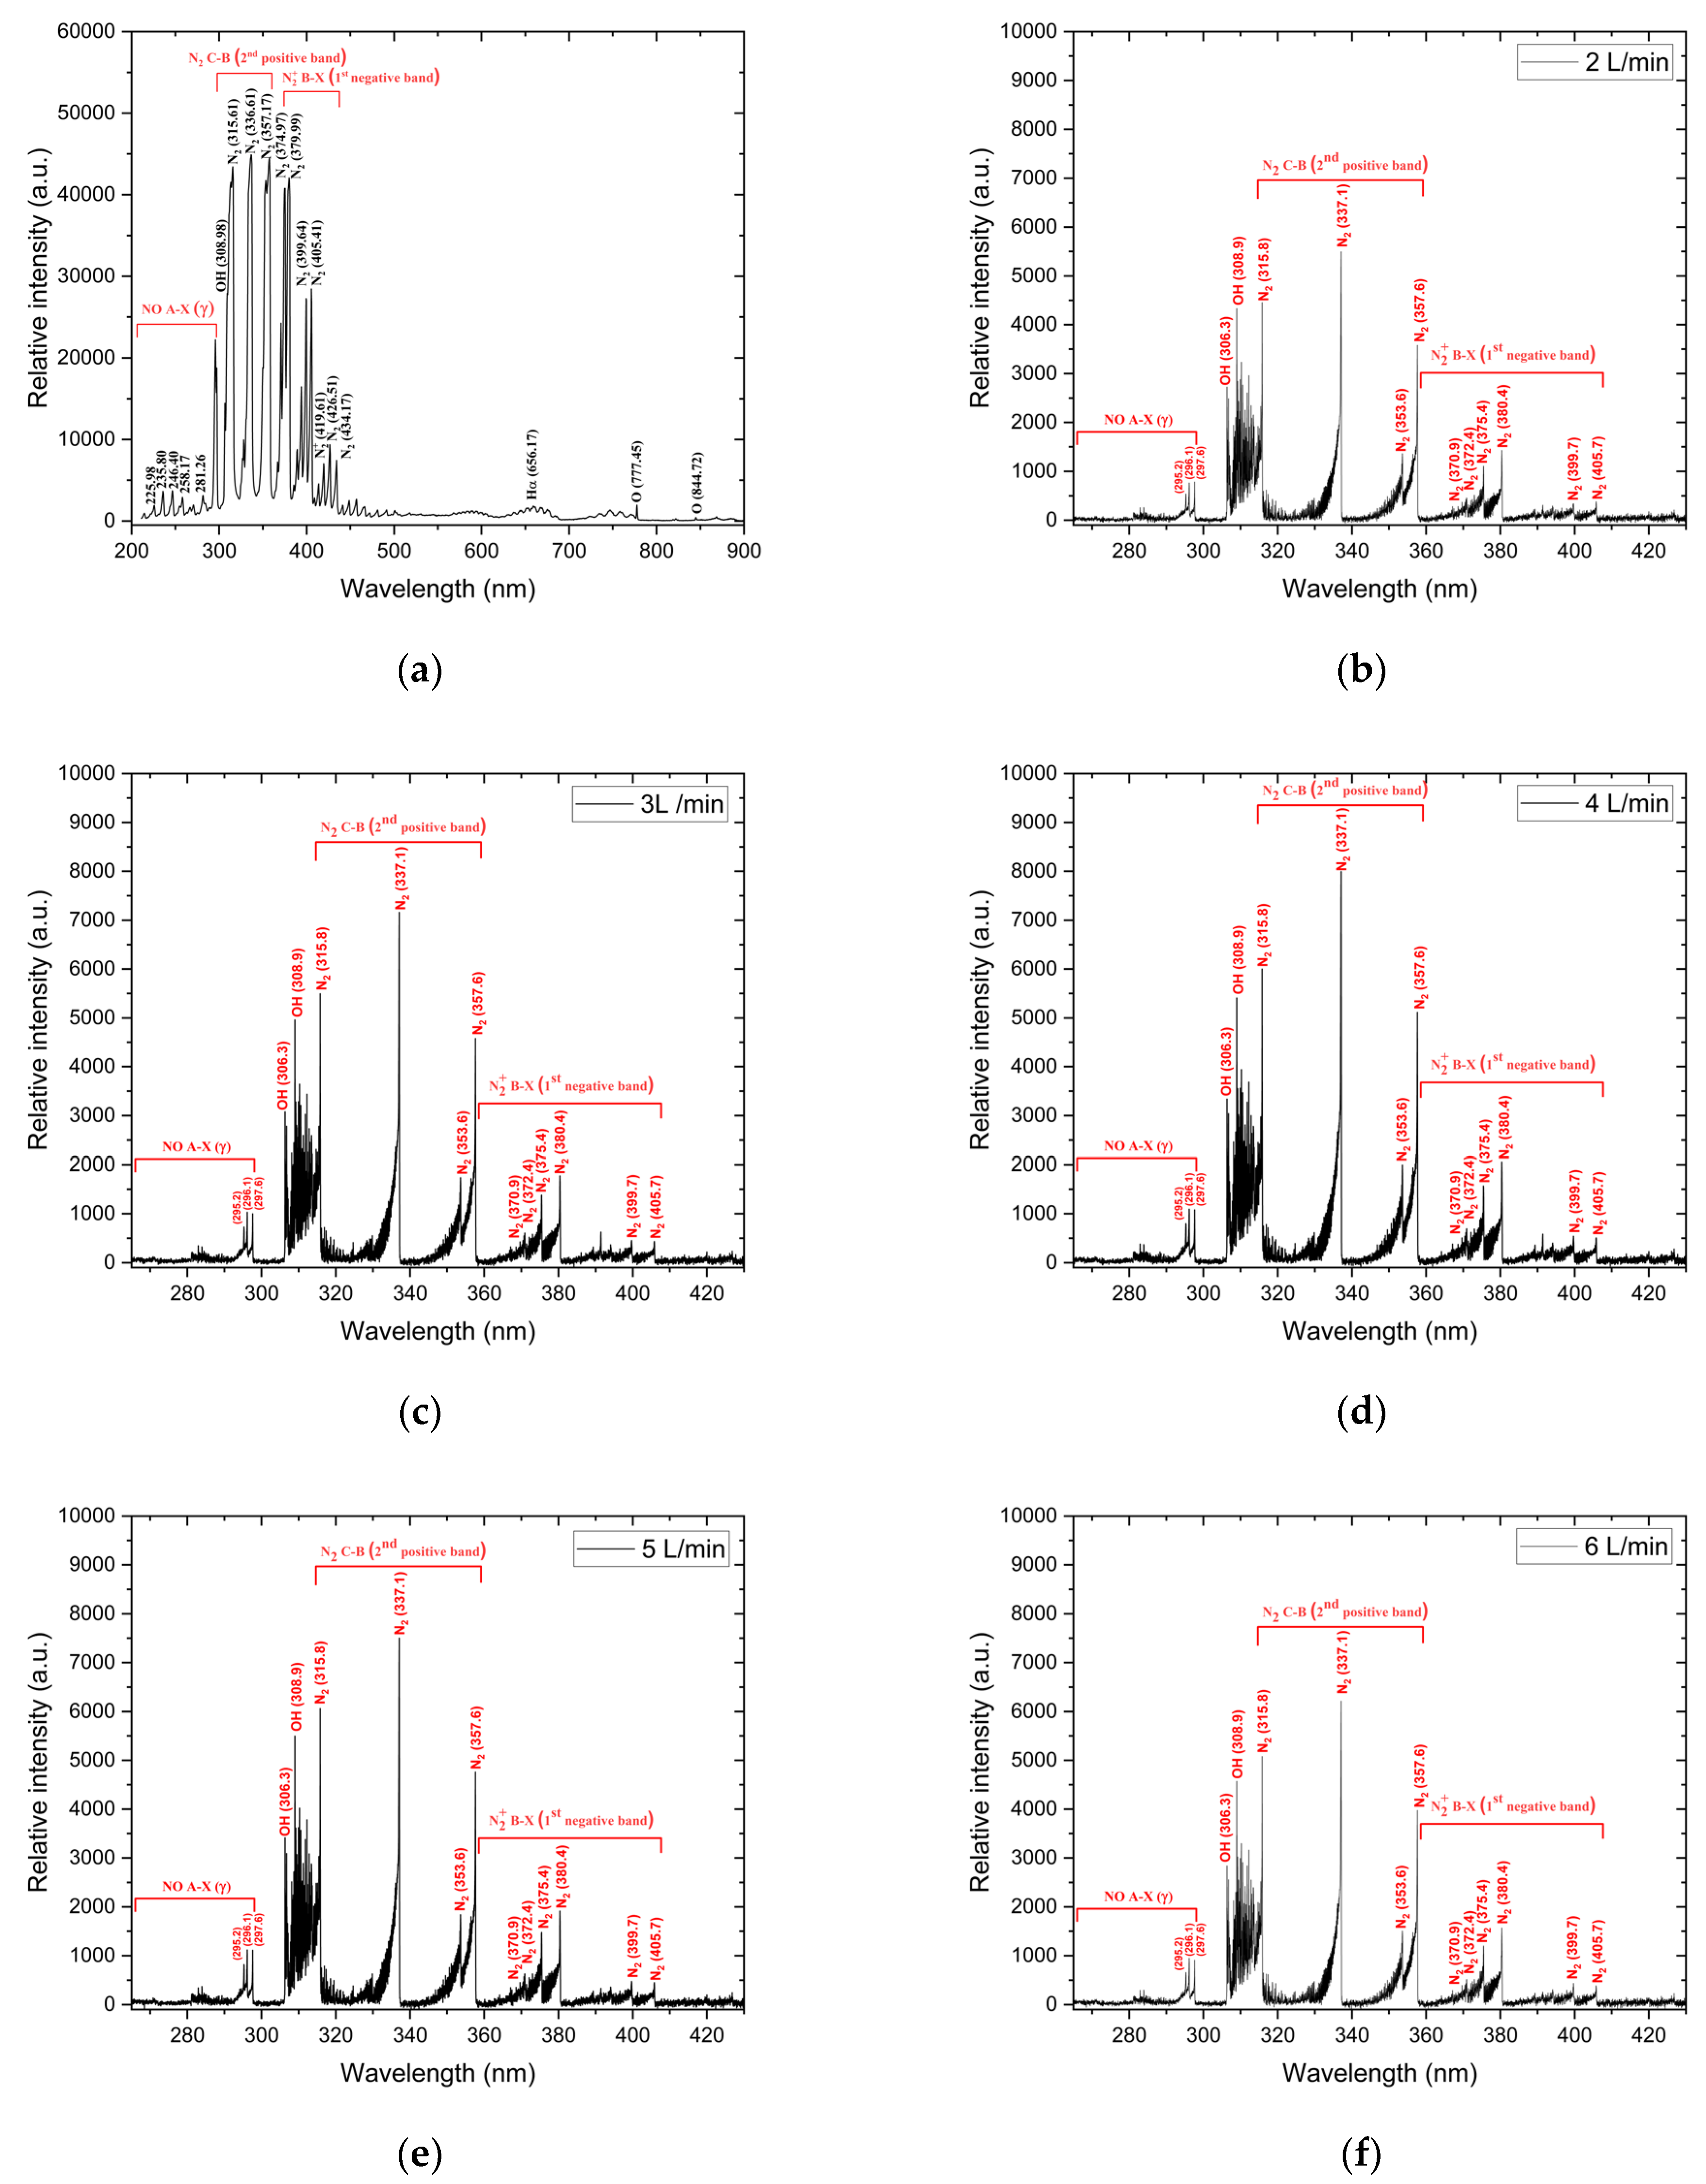
The OES measurements were conducted at long wavelengths from 200 to 900 nm for air GA plasma discharge in an ambient room at 25 °C with an RH of 60% (Figure 2a). The emission spectrum mainly consisted of N2, NO, OH, hydrogen atoms (Hα), and O. The N2 molecules were identified in the range of 315–450 nm. The NO molecule bands were observed in the range of 200–300 nm. There was a peak at 308.9 nm for the OH molecules. Additionally, low intensities were observed at 656.1 nm for Hα and at 777.4 and 844.7 nm for O peaks [41,42,43].
This confirmed the generation of reactive nitrogen species (RNS) within a short wavelength from 265 to 430 nm by GA plasma at airflow rates of 2, 3, 4, 5, and 6 L/min (Figure 2b–f). The findings showed that GA plasma at all airflow rates exhibited an emission spectrum consisting of N2 NO, and OH molecules. In particular, N2 (second positive system; SPS and first negative system; FNS) appeared in the range of 315–410 nm [42]. The dominant peaks corresponding to N2 (SPS) were displayed at 315.8, 337.1, and 357.6 nm. Additionally, N2 (FNS) showed peaks at 375.4 and 380.4 nm [43]. Furthermore, NO molecules showed a low-intensity band (256–300 nm) [42], and the OH molecules had peaks at 306.3 and 308.9 nm [41]. Based on the results from the emission spectrum intensity of GA plasma at all airflow rates, significant gas phase reactions were detected, especially involving N2 molecules. Therefore, GA plasma can effectively fix N2 from the air into water.
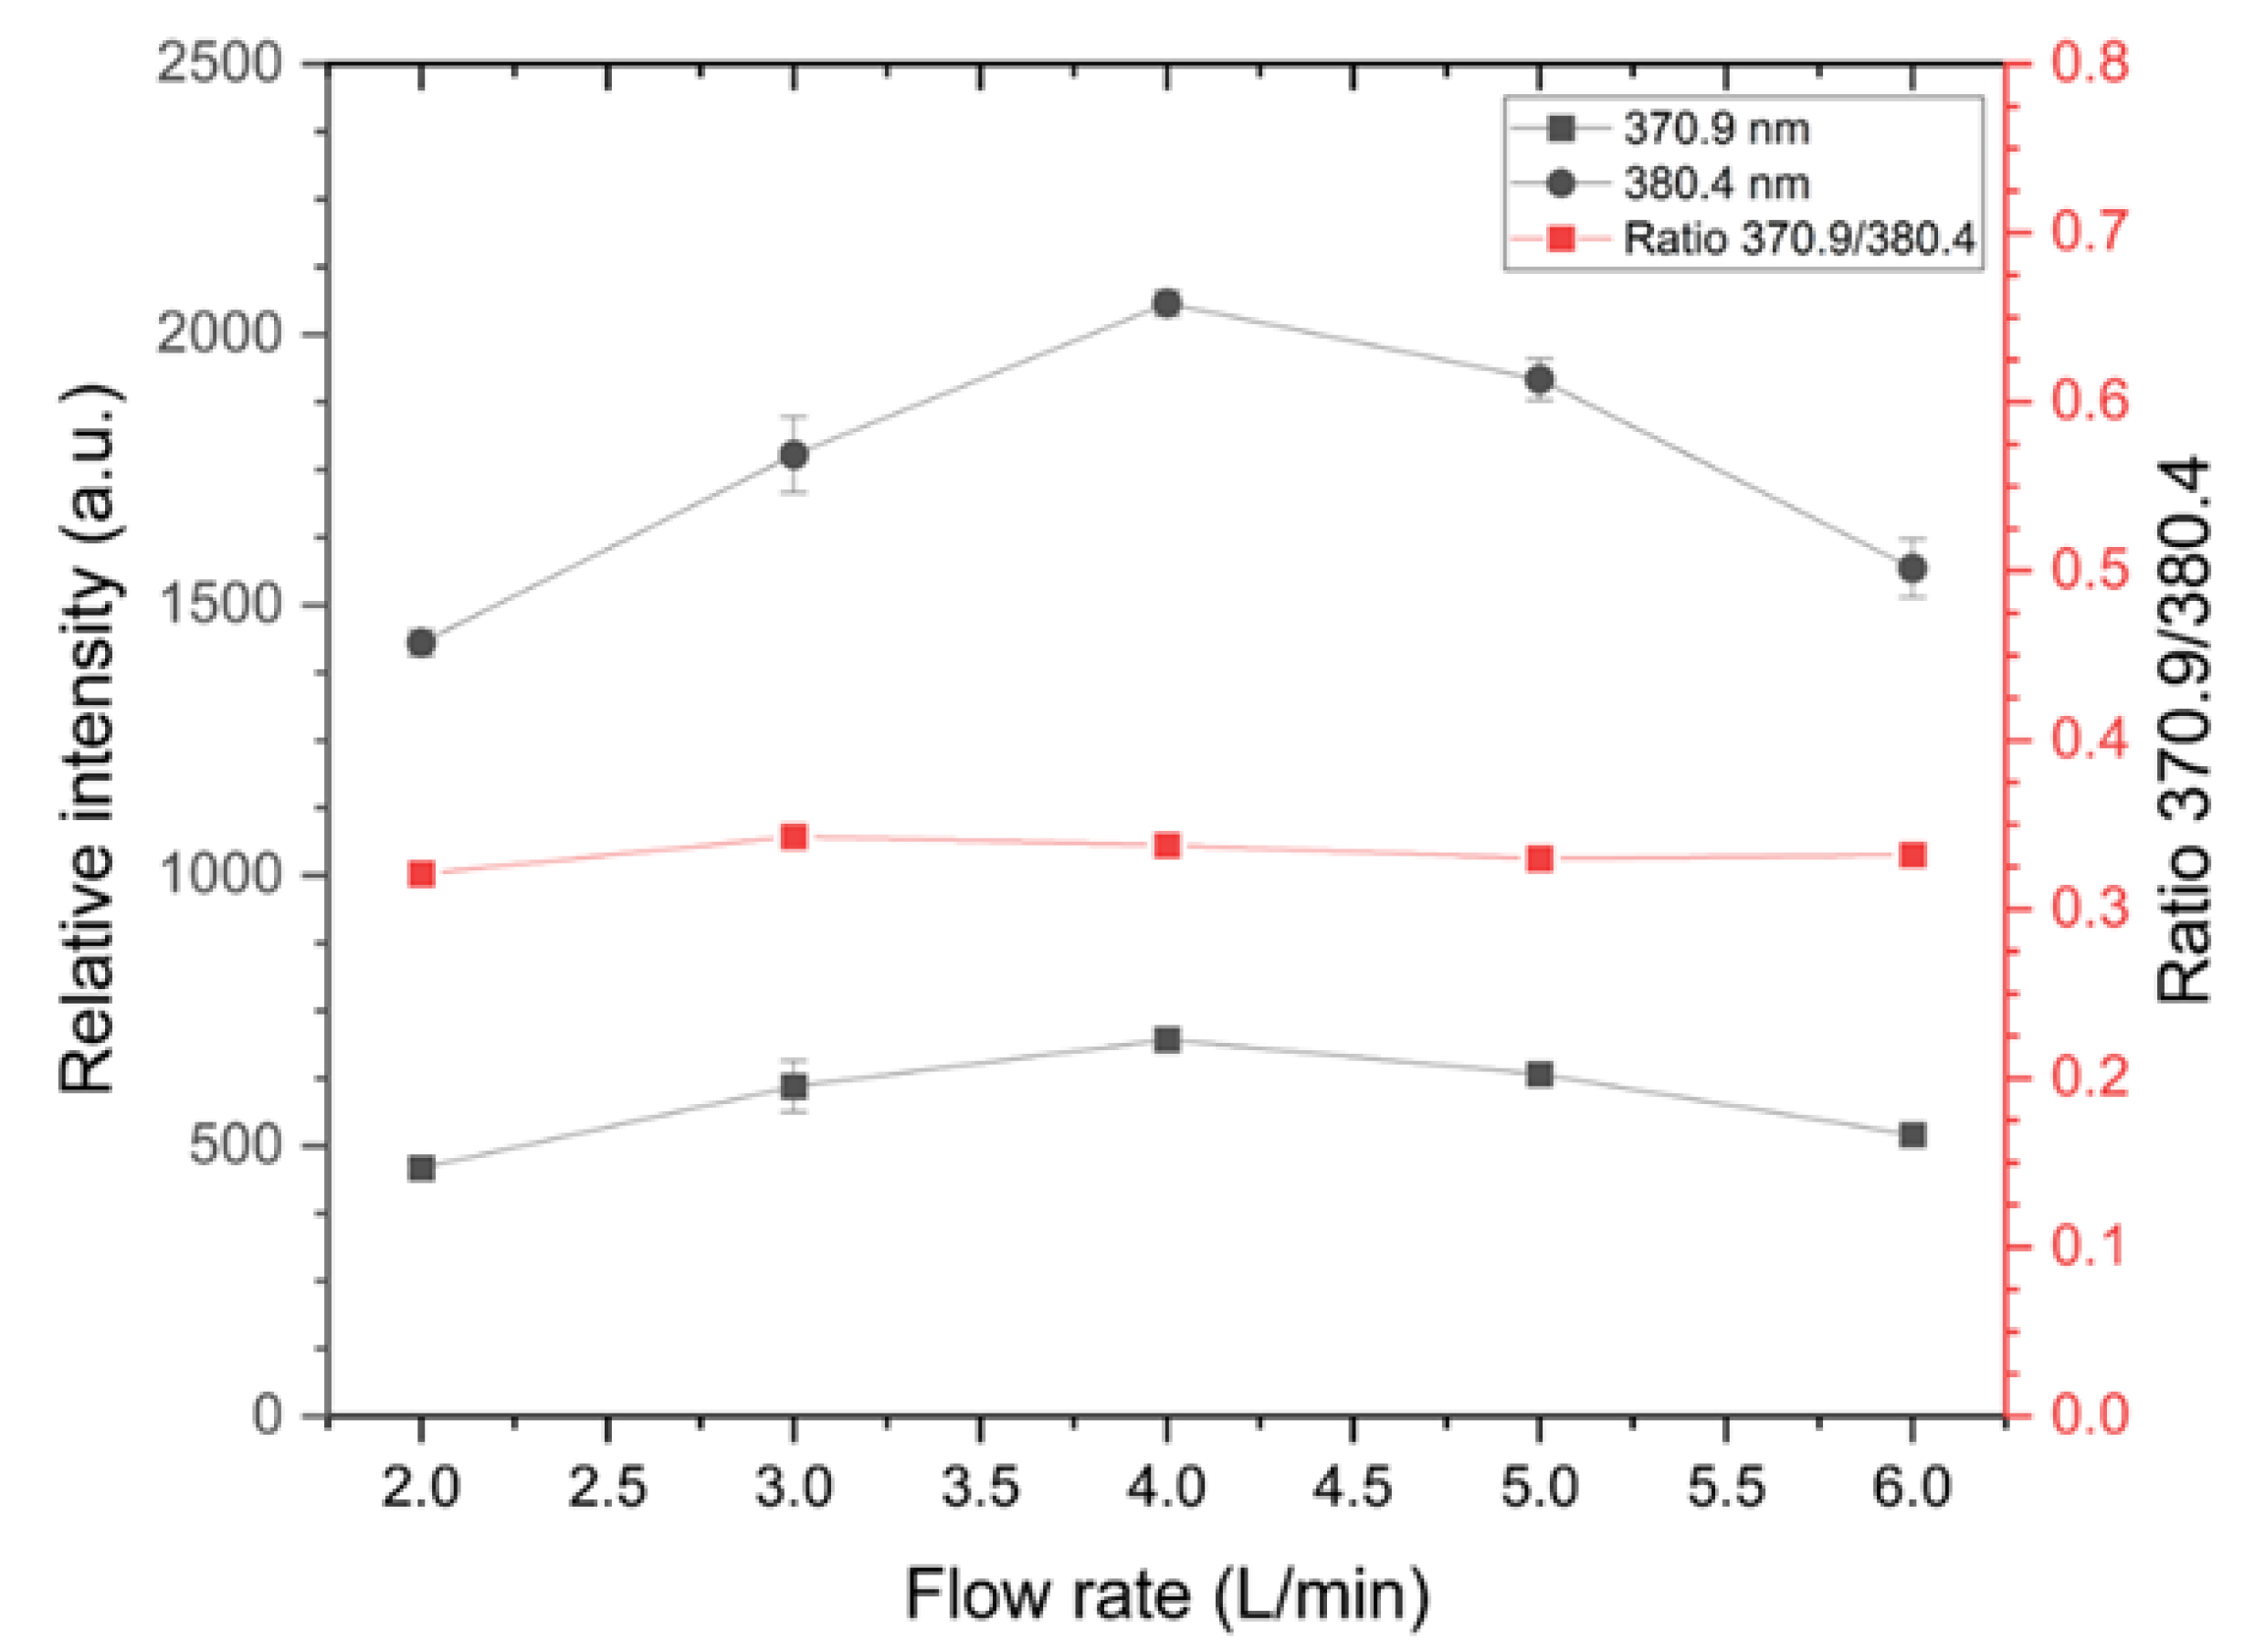
The emission spectral intensity of N2 (FNS) was given to the emission spectra derived from the line intensities at I370.9 and I380.4 nm of the GA plasma (Figure 3). The vibrational temperature (Tvib) of N2 was in the range of 2800 to 3200 K. This energy value could be utilised to determine the efficiency of air GA plasma in generating plasma radicals across various species.

3.2. PAW Characteristics

3.2.1. Effect of Storage Period on PAW Chemical Properties

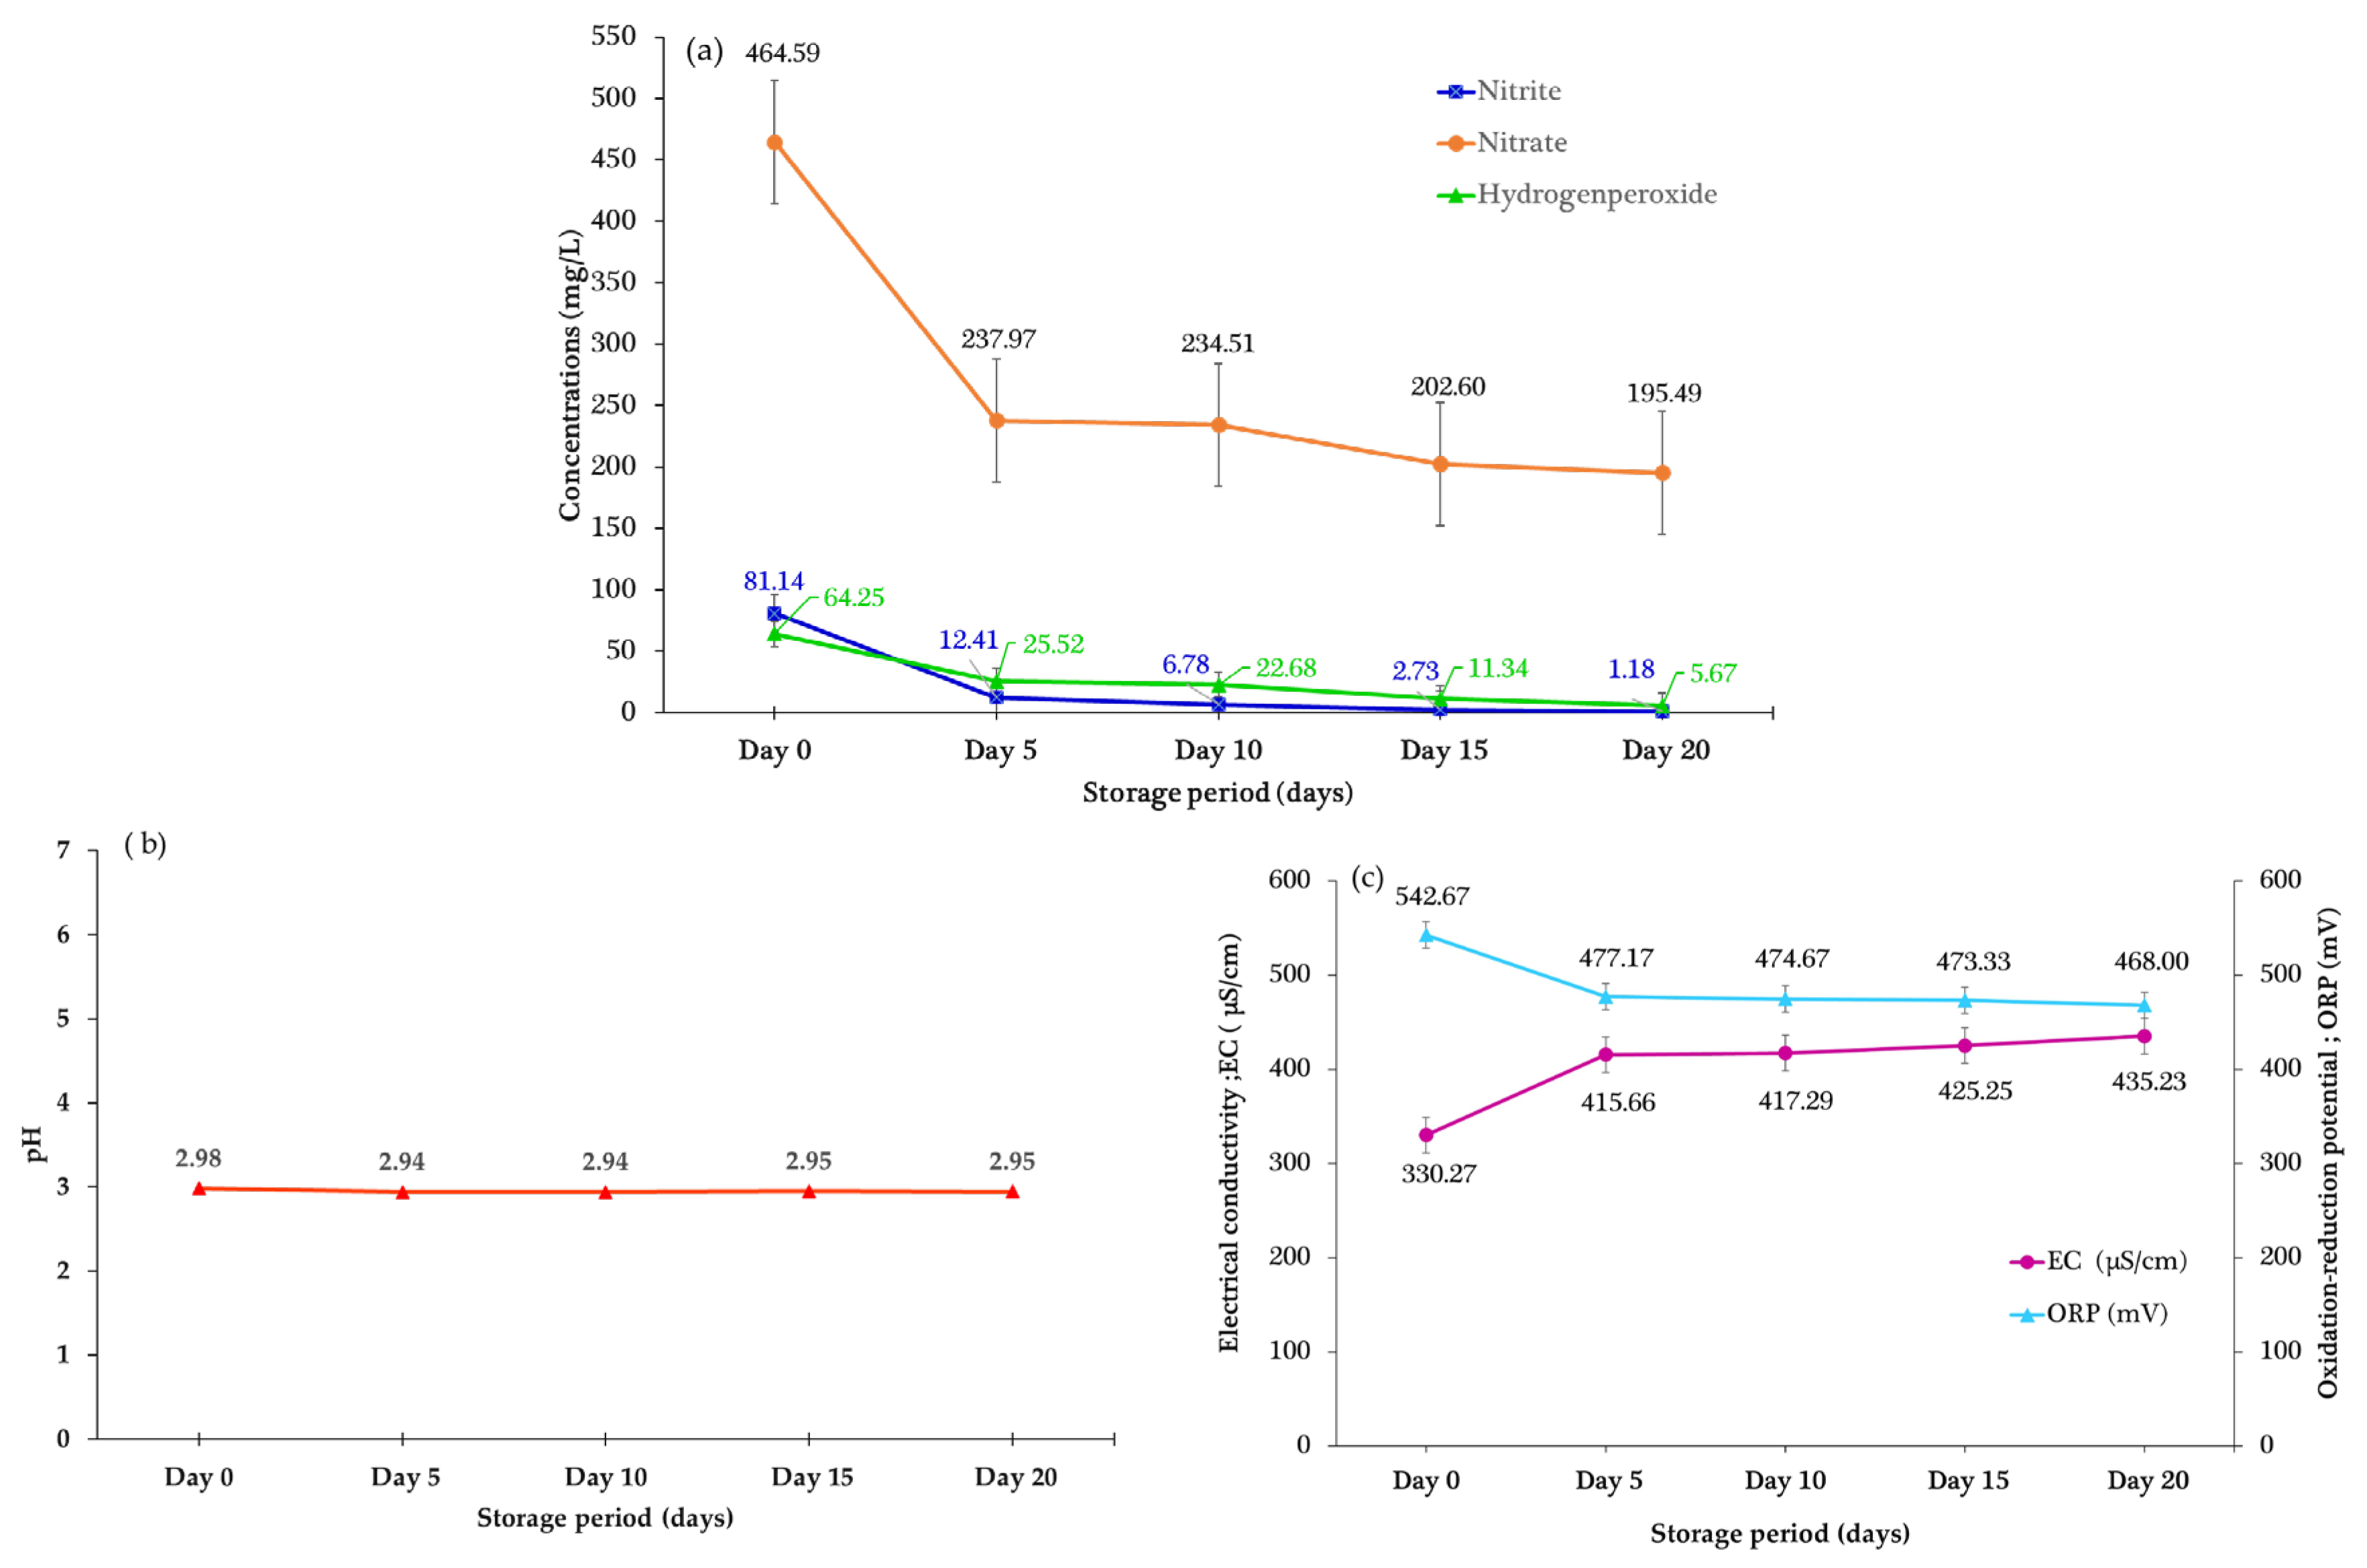
The DI water had a pH level of 6.04, EC value of 1.47 µS/cm, ORP value of 263 mV, NO2 content of 0.07 mg/L, and no detected content of NO3 or H2O2. Consequently, GA plasma was discharged at an airflow rate of 5 L/min for 20 min. The results indicated that PAW had a significantly increased NO3 (464.59 mg/L), NO2 (81.14 mg/L), and H2O2 content (64.25 mg/L), ORP value (542.67 mV), and EC value (330.27 µS/cm) but a decreased pH level (2.98) (Figure 4).
PAW storage at 26.5 ± 2 °C and 62.5 ± 8% RH showed a significant decrease in the content of NO3 from 464.59 to 237.97 mg/L, NO2 from 81.14 to 12.41 mg/L, and H2O2 from 64.25 to 25.52 mg/L from day 0 to 5 of storage. Afterwards, the contents of NO3, NO2, and H2O2 continued to decrease throughout the 20-day storage period (Figure 4a). However, the pH level ranged from 2.94 to 2.98, the EC value ranged from 330.27 to 435.23 µS/cm, and ORP ranged from 468.00 to 542.67 mV in PAW, with no significant differences (Figure 4b,c).

3.2.2. Effect of Different Plasma Airflow Rates on PAW Chemical Properties

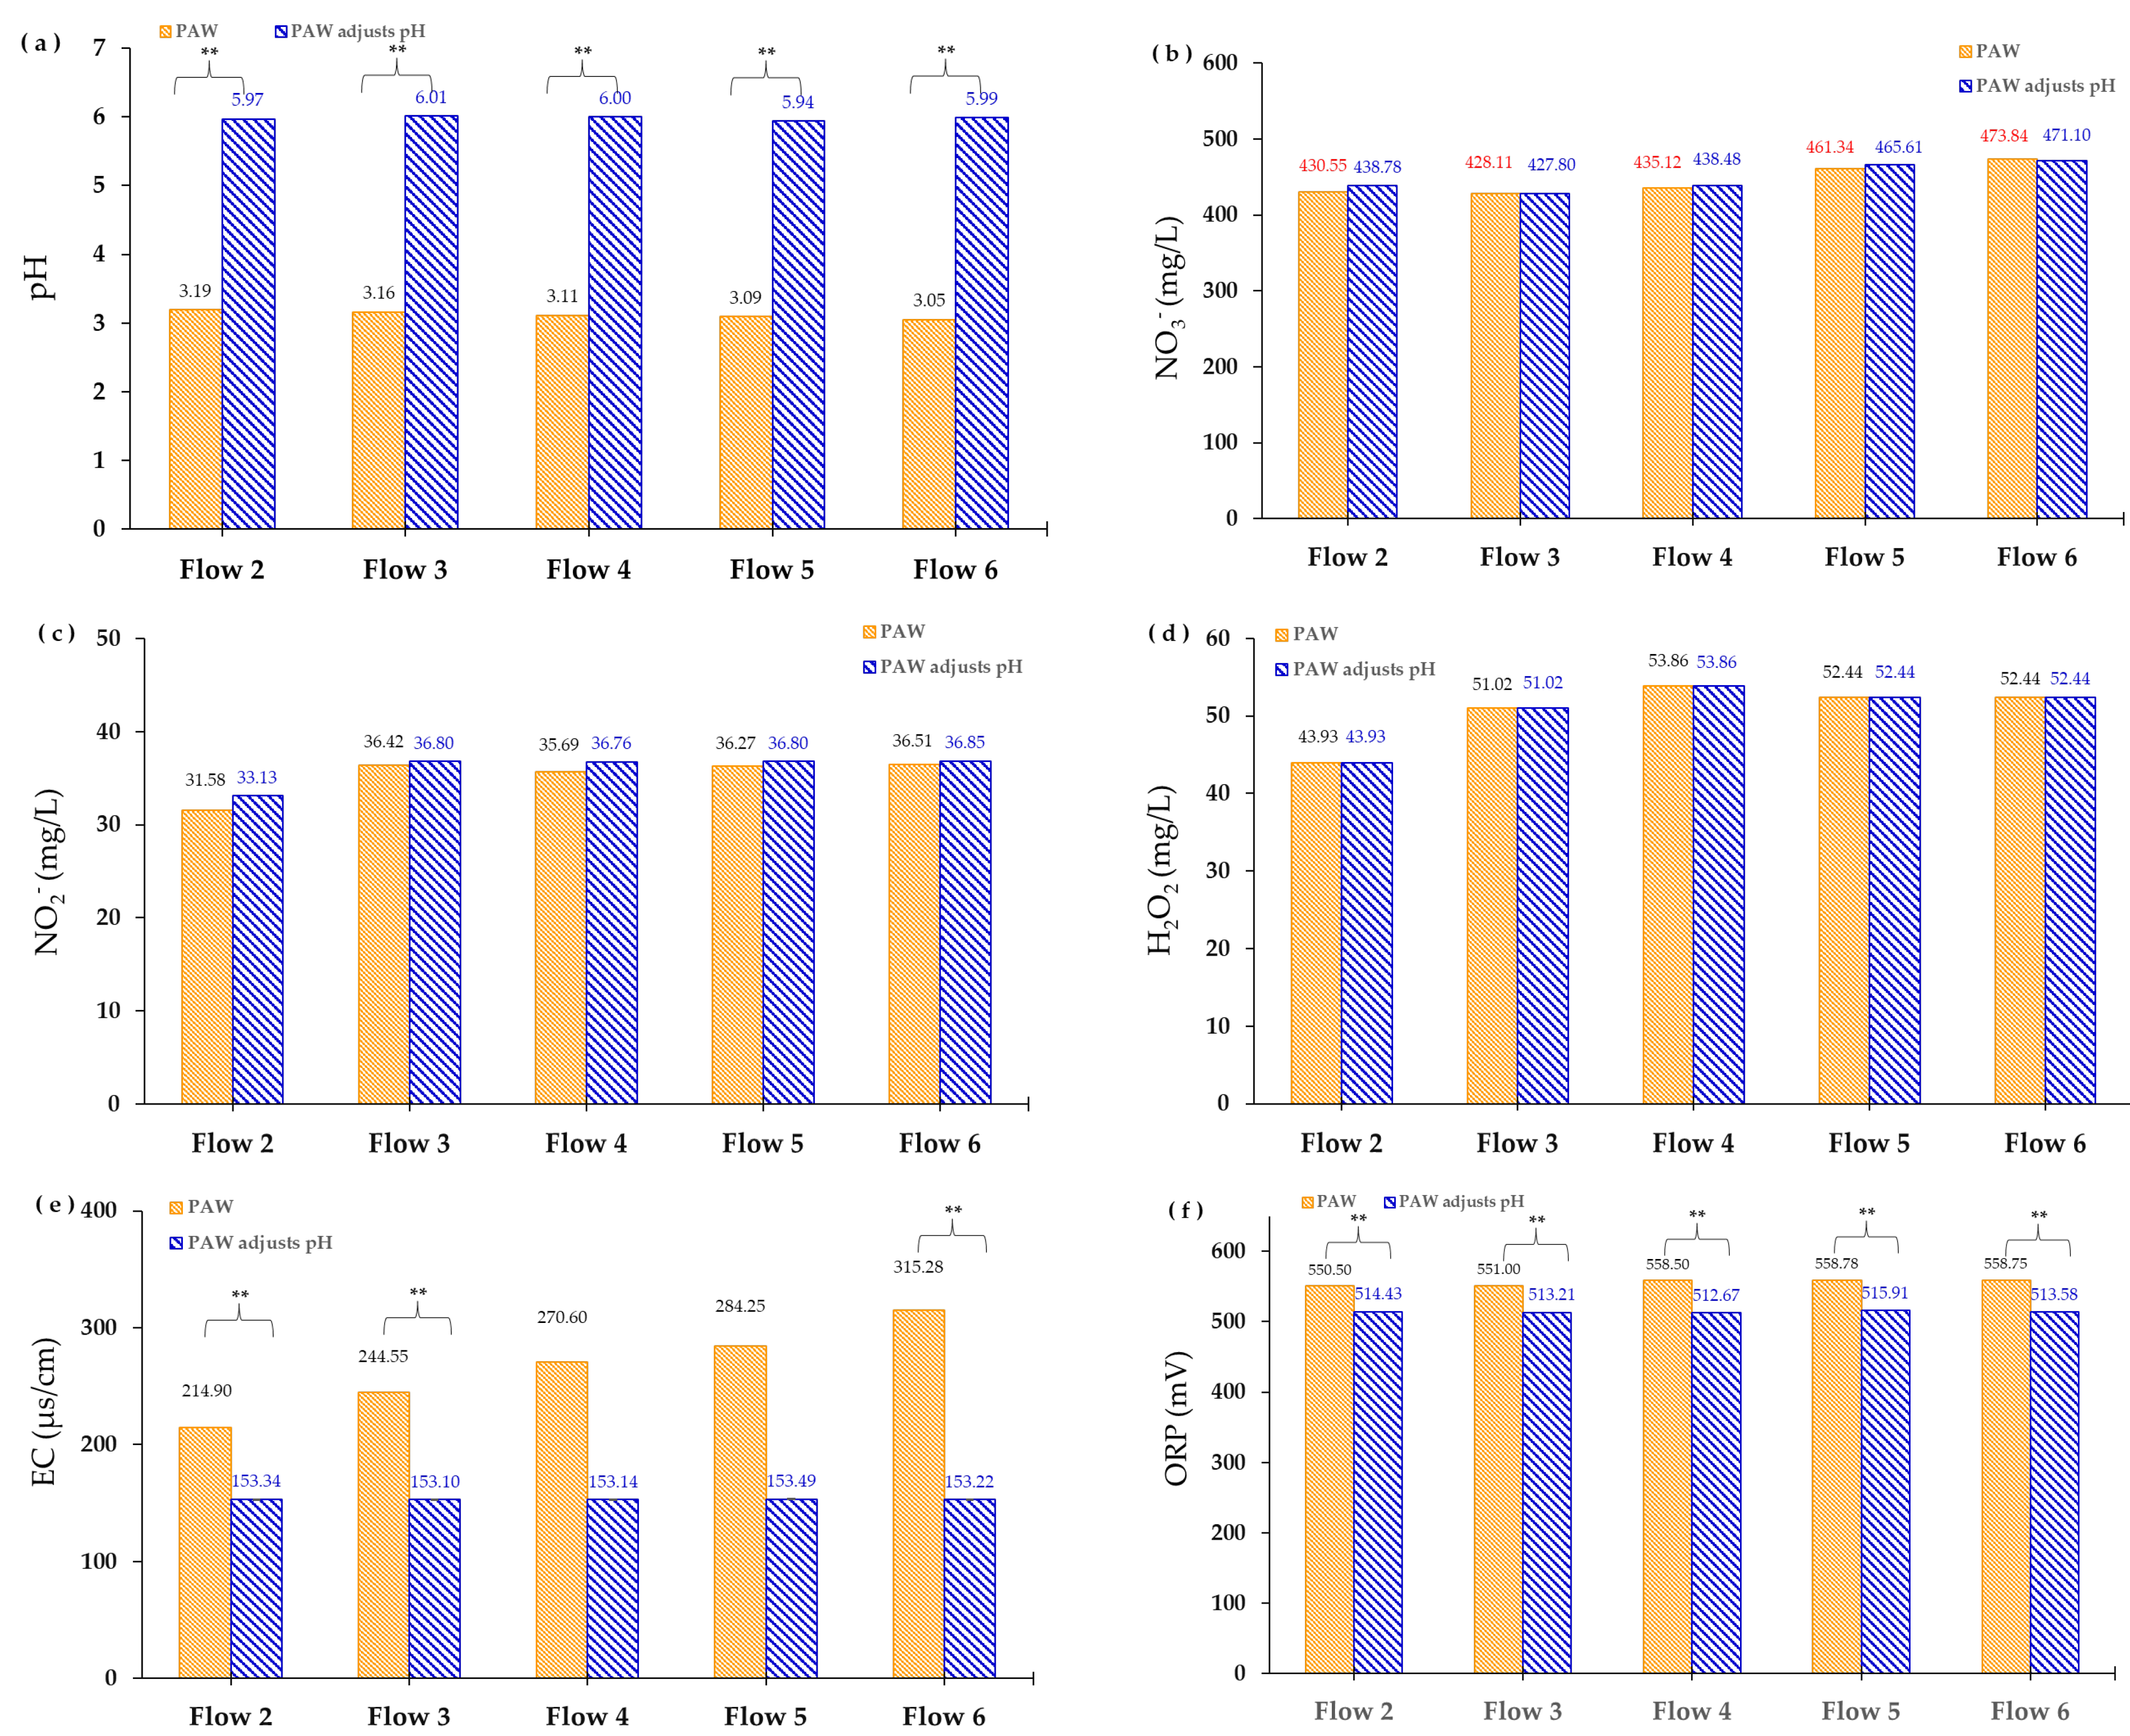
GA plasma was discharged into DI water for 15 min at airflow rates of 2, 3, 4, 5, and 6 L/min, resulting in a significant decrease in the pH level of the control, from 6.04 to 3.05–3.19. In the preliminary experiment, PAW with a pH < 3.00 was used on rice seedlings that were 5 days after planting. The developing roots became shorter and had burn marks at the tips, resulting in stunted root growth. The appropriate pH range for rice growth is 5.5–6.5 [44]. Therefore, the pH of PAW at each airflow rate was adjusted using KOH, leading to an increase in the pH level to 5.97–6.01 in PAW at airflow rates of 2 to 6 L/min (Figure 5a).
The NO3, NO2, and H2O2 contents of PAW at the different airflow rates were not significantly different compared with the pH-adjusted PAW (Figure 5b–d). However, the EC and ORP values of PAW at all airflow rates were significantly decreased compared to the pH-adjusted PAW. The EC value decreased from 214.90–315.28 to 153.10–153.49 µS/cm, and the ORP value decreased from 550.50–558.78 to 512.67–515.91 mV (Figure 5e,f). Thus, adjusting the pH with KOH might lead to a decrease in the EC and ORP values but does not necessarily affect the NO3, NO2, and H2O2 contents in the PAW.
The PAW used in the germination seed experiment used pH-adjusted PAW, with a value of 5.94–6.04 in PAW airflow rates of 2 to 6 L/min. The PAW at all airflow rates significantly affected the NO3, NO2, and H2O2 content, EC value, and ORP value compared to T1 (Figure 6).
The NO3 content in T5 (465.61 mg/L) and T6 (471.10 mg/L) showed higher content compared to the other treatments (Figure 6b). In addition, the NO2 and H2O2 contents in T3, T4, T5, and T6 increased compared to T1 and T2 (Figure 6c,d). The values of EC and ORP in PAW at all airflow rates increased compared to T1 (Figure 6e,f).
When considering the chemical properties, specifically at T2, T3, T4, T5, and T6 in PAW, it was found that the NO3 content in T5 and T6 significantly increased compared to T2, T3, and T4. PAW at T3, T4, T5, and T6 showed a significant increase in the NO2 and H2O2 contents compared to T2. However, there were no significant differences in the pH, ORP, or EC values (Figure 6).

3.3. Effect of PAW Treatment on Total N and GA3 Concentration in Rice Seed

3.3.1. Total N Accumulation

Fourteen-day rice seedlings after planting treated with the T2, T4, T5, and T6 in PAW treatments exhibited a significant increase in total N accumulation of 1.751%, 1.797%, 1.751%, and 1.806%, respectively, compared to T1 (1.1519%) and T3 (1.616%) (Table 1). This is related to the NO3 and NO2 contents in PAW provided during rice cultivation, resulting in increased total N accumulation in rice seedlings.

3.3.2. GA3 Concentration

The PAW at T5 and T6 demonstrated a significant increase in the GA3 concentration of rice seeds compared to the other treatments, with values of 10.855 and 11.327 µg/g, respectively. Moreover, T1, T2, T3, and T4 displayed a GA3 concentration range of 0.708–7.047 µg/g (Table 1). The GA3 concentration in rice seeds increased with higher airflow rates of PAW.

3.4. Effect of PAW Treatment on Rice Seed Germination Characteristics

T5 had a significant increase in RE at 48 h, G, and GI compared to T1, with values of 94.33%, 97.00%, and 22.89, respectively. Additionally, in T3, T5, and T6, the RE at 72 h was 97.00, 97.00, and 97.67%, respectively, which were significantly increased compared to T1. Similarly, SL increased in T3, T4, T5, and T6 compared to T1 and T2. Moreover, the seedling FW and DW significantly increased at all airflow rates for PAW compared to T1. However, RE at 24 h (9.33–13.00%), RL (12.38–13.26 cm), and SMC (87.11–87.94%) showed no significant differences (Table 2).
The seedling growth rate was assessed by measuring SL and RL 5, 7, 9, 11, and 13 days after planting (Figure 7). The shoot growth rates 5 to 13 days after planting were significantly higher in T3, T4, T5, and T6 than in T1 and T2. Concurrently, the root growth rate in T2, T3, and T5 was significantly greater than that in T1, T4, and T6 on days 5 and 7 after planting. However, the root growth rate showed no significant difference 9 days after planting. Figure 8 illustrates the growth characteristics of rice seeds at 14 days after treatment with PAW compared to the control and the measurement of RE, SL, and RL.

4. Discussion

The investigation into emission spectral intensity detected various RONS, short-lived species, such as NO (few s) and OH (10−9–10−10 s), and longer-lived species. N2 had stable half-lives [7]. The N2 molecules appeared at wavelengths from 290 to 430 nm, with notable peaks for N2 and an additional peak at 336 nm, which corresponds to NH formation [42,45]. Moreover, there was a low-emission spectral intensity band for NO molecules, as NO is rapidly converted to NO2 through three-body reactions with O2 in air plasma [46].
These species play a crucial role in PAW. The RONS from the air plasma contacted the water surface and dissolved in the water, leading to reactions of NO2, NO3, and H2O2 in PAW following the chemical reaction [47,48].
NO + NO2 + H2O → 2NO2 + 2H+(aq)
NO2 + NO2 + H2O → NO2 + NO3 + 2H+(aq)
OH(aq) + OH(aq) → H2O2 (aq)
The occurrence of H+ causes the water to display acidity (a decrease in pH level), which can serve as an indicator of the accumulation of NO2 and NO3 contents in the water. The formation of NO2 and NO3 not only leads to a decrease in the pH level but also increases in the EC and ORP values [7,49]. They produced PAW with a distinctly low pH level. This is an important parameter in controlling the solubility of nutrients beneficial to plants. The low pH prevents the absorption of nutrients, which affects plant growth [9].
An increase in the airflow rate enhanced GA plasma discharge, resulting in longer plasma. This interacted more with the water surface, generating more bubbles, dissolving more plasma radicals in the water, and initiating various reactions [47,50].
The storage period of PAW reduced the contents of NO3, NO2, and H2O2 with changes in the EC and ORP values. However, the pH level remained relatively stable [7,51]. During extended storage periods, the NO3, NO2, and H2O2 contents may become unstable and degrade due to exposure to light, temperature fluctuations, or other environmental factors. This degradation can result in a decrease in the RONS concentration [7,10].
The seed germination process can begin when essential factors, such as moisture (water), are present in the PAW. This initiates the reaction of RONS having good solubility in water at appropriate concentrations. This results in the removal of wax and the etching of the seed coat, reducing its thickness [52,53,54,55]. Consequently, the seeds can absorb PAW-containing N2 species more rapidly. In particular, NO3 is absorbed through NO2 into NH4+, which can combine with amino acids. These compounds serve as both nutrients and signalling molecules that stimulate the embryo, affecting germination and plant growth processes [29]. Furthermore, NO3 in PAW is rapidly absorbed by free amino acids [11]. This causes an increase in the accumulation of total N and GA3 in rice, which affects the germination process.
Seeds transport water and various nutrients through the chloroplast membrane. NO3 and NH4+ can either be stored in vacuoles or transported further into the roots for distribution within the plant [56]. This process demonstrates that the accumulation of FW and DW in rice seedlings involves not only water but also the accumulation of N in cell vacuoles.
N has a clear effect on stimulating germination, leading to an increase in the concentration of the hormone GA3 when rice seeds receive appropriate conditions for germination. It permeates into the seed, causing the embryo to signal GA3 to stimulate the cells in the aleurone layer to synthesise hydrolytic enzymes. In particular, alpha-amylase decomposes starch or protein in the endosperm into food molecules, serving as a nutrient source for subsequent embryonic development [57,58]. When external inputs, such as PAW-containing NO3 and NO2, are received, they may be involved in signalling the embryo to stimulate GA3 synthesis [59].

5. Conclusions

Air GA plasma consists of N2, NO, and OH molecules, resulting in the formation of NO3, NO2, and H2O2 in PAW. Notably, NO3, NO2, and H2O2 contents in PAW decreased significantly after 5 days of storage.
The PAW at an airflow rate of 5 L/min enhanced the RE at 48 and 72 h, G, GI, SL, FW, and DW of seedlings. However, there were no significant differences in RE at 24 h, RL, and SMC. The NO3 and NO2 contents in PAW had a positive effect on the total N and GA3 accumulation in rice seeds.
Therefore, the utilisation of air GA plasma to generate PAW is an effective method for producing a nitrogen source. Rice seeds receive the appropriate nitrogen content to stimulate and support the germination process. This can be used to prepare rice seedlings for cultivation.

Author Contributions

Conceptualisation, S.C.-u., D.B. and S.-n.T.; methodology, S.C.-u., D.B. and S.-n.T.; validation, S.C.-u., D.B. and S.-n.T.; formal analysis, S.C.-u.; investigation, S.C.-u., D.B. and S.-n.T.; resources, S.C.-u., D.B., C.S. and S.-n.T.; data curation, S.C.-u.; writing—original draft preparation, S.C.-u.; writing—review and editing, D.B., C.S. and S.-n.T.; visualisation, S.C.-u.; supervision, S.-n.T., D.B. and C.S.; project administration, S.-n.T. All authors have read and agreed to the published version of the manuscript.

Funding

This research was funded by the Agricultural Research Development Agency (Public Organization), Thailand, grant number HRD6501033.

Data Availability Statement

No new data were created or analyzed in this study. Data sharing is not applicable to this article.

Acknowledgments

Authors thank the IRN Project, NRCT funding no. 186711/2023 for the GA plasma system, the Agriculture and Bio Plasma Technology Center (ABPlas), Science and Technology Park, for providing equipment to analyse the chemical composition of PAW, and the Central Laboratory, Faculty of Agriculture, for their assistance in evaluating rice seed germination characteristics. Furthermore, the authors would like to express our thanks to the Chiang Mai Rice Seed Center, Rice Department, Thailand, for their support in providing rice seed samples.

Conflicts of Interest

The authors declare no conflict of interest.

References

  1. Ohyama, T. Nitrogen as a Major Essential Element of Plants. Nitrogen Assim. Plants 2010, 37, 1–17. [Google Scholar]
  2. Cherkasov, N.; Ibhadon, A.O.; Fitzpatrick, P. A Review of the Existing and Alternative Methods for Greener Nitrogen Fixation. Chem. Eng. Process. Process Intensif. 2015, 90, 24–33. [Google Scholar] [CrossRef]
  3. Chen, J.G.; Crooks, R.M.; Seefeldt, L.C.; Bren, K.L.; Bullock, R.M.; Darensbourg, M.Y.; Holland, P.L.; Hoffman, B.; Janik, M.J.; Jones, A.K.; et al. Beyond Fossil Fuel–Driven Nitrogen Transformations. Science 2018, 360, eaar6611. [Google Scholar] [CrossRef] [PubMed]
  4. Fridman, A. Plasma Chemistry; Cambridge University Press: Cambridge, UK, 2008; ISBN 1-139-47173-2. [Google Scholar]
  5. Bhullar, M.; Gavahian, M.; Misra, N. Cold Plasma Processing: Methods and Applications in Study of Food Decontamination. In Emerging Food Processing Technologies; Springer: Berlin/Heidelberg, Germany, 2022; pp. 31–45. [Google Scholar]
  6. Priatama, R.A.; Pervitasari, A.N.; Park, S.; Park, S.J.; Lee, Y.K. Current Advancements in the Molecular Mechanism of Plasma Treatment for Seed Germination and Plant Growth. Int. J. Mol. Sci. 2022, 23, 4609. [Google Scholar] [CrossRef] [PubMed]
  7. Gao, Y.; Francis, K.; Zhang, X. Review on Formation of Cold Plasma Activated Water (PAW) and the Applications in Food and Agriculture. Food Res. Int. 2022, 157, 111246. [Google Scholar] [CrossRef] [PubMed]
  8. Zhou, R.; Zhou, R.; Wang, P.; Xian, Y.; Mai-Prochnow, A.; Lu, X.; Cullen, P.; Ostrikov, K.K.; Bazaka, K. Plasma-Activated Water: Generation, Origin of Reactive Species and Biological Applications. J. Phys. D Appl. Phys. 2020, 53, 303001. [Google Scholar] [CrossRef]
  9. Ranieri, P.; Sponsel, N.; Kizer, J.; Rojas-Pierce, M.; Hernández, R.; Gatiboni, L.; Grunden, A.; Stapelmann, K. Plasma Agriculture: Review from the Perspective of the Plant and Its Ecosystem. Plasma Process. Polym. 2021, 18, 2000162. [Google Scholar] [CrossRef]
  10. Guo, D.; Liu, H.; Zhou, L.; Xie, J.; He, C. Plasma-Activated Water Production and Its Application in Agriculture. J. Sci. Food Agric. 2021, 101, 4891–4899. [Google Scholar] [CrossRef]
  11. Ruamrungsri, S.; Sawangrat, C.; Panjama, K.; Sojithamporn, P.; Jaipinta, S.; Srisuwan, W.; Intanoo, M.; Inkham, C.; Thanapornpoonpong, S. Effects of Using Plasma-Activated Water as a Nitrate Source on the Growth and Nutritional Quality of Hydroponically Grown Green Oak Lettuces. Horticulturae 2023, 9, 248. [Google Scholar] [CrossRef]
  12. Lamichhane, P.; Veerana, M.; Lim, J.S.; Mumtaz, S.; Shrestha, B.; Kaushik, N.K.; Park, G.; Choi, E.H. Low-Temperature Plasma-Assisted Nitrogen Fixation for Corn Plant Growth and Development. Int. J. Mol. Sci. 2021, 22, 5360. [Google Scholar] [CrossRef]
  13. Zhang, S.; Rousseau, A.; Dufour, T. Promoting Lentil Germination and Stem Growth by Plasma Activated Tap Water, Demineralized Water and Liquid Fertilizer. RSC Adv. 2017, 7, 31244–31251. [Google Scholar] [CrossRef]
  14. Guragain, R.P.; Pradhan, S.P.; Baniya, H.B.; Pandey, B.P.; Basnet, N.; Sedhai, B.; Dhungana, S.; Chhetri, G.K.; Joshi, U.M.; Subedi, D.P. Impact of Plasma-Activated Water (PAW) on Seed Germination of Soybean. J. Chem. 2021, 2021, 7517052. [Google Scholar] [CrossRef]
  15. Pawłat, J.; Terebun, P.; Kwiatkowski, M.; Tarabová, B.; Kovaľová, Z.; Kučerová, K.; Machala, Z.; Janda, M.; Hensel, K. Evaluation of Oxidative Species in Gaseous and Liquid Phase Generated by Mini-Gliding Arc Discharge. Plasma Chem. Plasma Process. 2019, 39, 627–642. [Google Scholar] [CrossRef]
  16. Darvish, F.; Sarkari, N.M.; Khani, M.; Eslami, E.; Shokri, B.; Mohseni, M.; Ebrahimi, M.; Alizadeh, M.; Dee, C.F. Direct Plasma Treatment Approach Based on Non-Thermal Gliding Arc for Surface Modification of Biaxially-Oriented Polypropylene with Post-Exposure Hydrophilicity Improvement and Minus Aging Effects. Appl. Surf. Sci. 2020, 509, 144815. [Google Scholar] [CrossRef]
  17. Thirumdas, R.; Kothakota, A.; Annapure, U.; Siliveru, K.; Blundell, R.; Gatt, R.; Valdramidis, V.P. Plasma Activated Water (PAW): Chemistry, Physico-Chemical Properties, Applications in Food and Agriculture. Trends Food Sci. Technol. 2018, 77, 21–31. [Google Scholar] [CrossRef]
  18. Sivachandiran, L.; Khacef, A. Enhanced Seed Germination and Plant Growth by Atmospheric Pressure Cold Air Plasma: Combined Effect of Seed and Water Treatment. RSC Adv. 2017, 7, 1822–1832. [Google Scholar] [CrossRef]
  19. Sajib, S.A.; Billah, M.; Mahmud, S.; Miah, M.; Hossain, F.; Omar, F.B.; Roy, N.C.; Hoque, K.M.F.; Talukder, M.R.; Kabir, A.H. Plasma Activated Water: The Next Generation Eco-Friendly Stimulant for Enhancing Plant Seed Germination, Vigor and Increased Enzyme Activity, a Study on Black Gram (Vigna mungo L.). Plasma Chem. Plasma Process. 2020, 40, 119–143. [Google Scholar] [CrossRef]
  20. Ndiffo Yemeli, G.B.; Švubová, R.; Kostolani, D.; Kyzek, S.; Machala, Z. The Effect of Water Activated by Nonthermal Air Plasma on the Growth of Farm Plants: Case of Maize and Barley. Plasma Process. Polym. 2021, 18, 2000205. [Google Scholar] [CrossRef]
  21. Kostoláni, D.; Ndiffo Yemeli, G.B.; Švubová, R.; Kyzek, S.; Machala, Z. Physiological Responses of Young Pea and Barley Seedlings to Plasma-Activated Water. Plants 2021, 10, 1750. [Google Scholar] [CrossRef]
  22. Šerá, B.; Vanková, R.; Roháček, K.; Šerý, M. Gliding Arc Plasma Treatment of Maize (Zea mays L.) Grains Promotes Seed Germination and Early Growth, Affecting Hormone Pools, but Not Significantly Photosynthetic Parameters. Agronomy 2021, 11, 2066. [Google Scholar] [CrossRef]
  23. Škarpa, P.; Klofáč, D.; Krčma, F.; Šimečková, J.; Kozáková, Z. Effect of Plasma Activated Water Foliar Application on Selected Growth Parameters of Maize (Zea mays L.). Water 2020, 12, 3545. [Google Scholar] [CrossRef]
  24. Rashid, M.; Reza, M.; Talukder, M. Combined Effects of Air Plasma Seed Treatment and Foliar Application of Plasma Activated Water on Enhanced Paddy Plant Growth and Yield. Plasma Chem. Plasma Process. 2021, 41, 1081–1099. [Google Scholar] [CrossRef]
  25. Hashizume, H.; Kitano, H.; Mizuno, H.; Abe, A.; Yuasa, G.; Tohno, S.; Tanaka, H.; Ishikawa, K.; Matsumoto, S.; Sakakibara, H. Improvement of Yield and Grain Quality by Periodic Cold Plasma Treatment with Rice Plants in a Paddy Field. Plasma Process. Polym. 2021, 18, 2000181. [Google Scholar] [CrossRef]
  26. Carter, L.; Leslie, J.; Webster, R. Population Structure of Fusarium fujikuroi from California Rice and Water Grass. Phytopathology 2008, 98, 992–998. [Google Scholar] [CrossRef] [PubMed]
  27. Kang, M.-H.; Veerana, M.; Eom, S.; Uhm, H.-S.; Ryu, S.; Park, G. Plasma Mediated Disinfection of Rice Seeds in Water and Air. J. Phys. D Appl. Phys. 2020, 53, 214001. [Google Scholar] [CrossRef]
  28. Takashima, K.; Hu, Y.; Goto, T.; Sasaki, S.; Kaneko, T. Liquid Spray Transport of Air–Plasma-Generated Reactive Species toward Plant Disease Management. J. Phys. D Appl. Phys. 2020, 53, 354004. [Google Scholar] [CrossRef]
  29. Duermeyer, L.; Khodapanahi, E.; Yan, D.; Krapp, A.; Rothstein, S.J.; Nambara, E. Regulation of Seed Dormancy and Germination by Nitrate. Seed Sci. Res. 2018, 28, 150–157. [Google Scholar] [CrossRef]
  30. Gnanamanickam, S.S.; Gnanamanickam, S.S. Rice and Its Importance to Human Life. Biol. Control Rice Dis. 2009, 8, 1–11. [Google Scholar]
  31. Deepika; Singh, A. Expression Dynamics Indicate the Role of Jasmonic Acid Biosynthesis Pathway in Regulating Macronutrient (N, P and K+) Deficiency Tolerance in Rice (Oryza sativa L.). Plant Cell Rep. 2021, 40, 1495–1512. [Google Scholar] [CrossRef]
  32. Shin, S.-Y.; Jeong, J.S.; Lim, J.Y.; Kim, T.; Park, J.H.; Kim, J.-K.; Shin, C. Transcriptomic Analyses of Rice (Oryza sativa) Genes and Non-Coding RNAs under Nitrogen Starvation Using Multiple Omics Technologies. BMC Genom. 2018, 19, 532. [Google Scholar] [CrossRef]
  33. Wu, J.; Zhang, Z.; Xia, J.; Alfatih, A.; Song, Y.; Huang, Y.; Wan, G.; Sun, L.; Tang, H.; Liu, Y.; et al. Rice NIN-LIKE PROTEIN 4 Plays a Pivotal Role in Nitrogen Use Efficiency. Plant Biotechnol. J. 2021, 19, 448–461. [Google Scholar] [CrossRef] [PubMed]
  34. Crawford, N.M.; Forde, B.G. Molecular and Developmental Biology of Inorganic Nitrogen Nutrition. Arab. Book Am. Soc. Plant Biol. 2002, 1, e0011. [Google Scholar] [CrossRef] [PubMed]
  35. Bi, Y.-M.; Kant, S.; Clark, J.; Gidda, S.; Ming, F.; Xu, J.; Rochon, A.; Shelp, B.J.; Hao, L.; Zhao, R.; et al. Increased Nitrogen-Use Efficiency in Transgenic Rice Plants Over-Expressing a Nitrogen-Responsive Early Nodulin Gene Identified from Rice Expression Profiling. Plant Cell Environ. 2009, 32, 1749–1760. [Google Scholar] [CrossRef] [PubMed]
  36. Fatima, H.; Ullah, M.U.; Ahmad, S.; Imran, M.; Sajjad, S.; Hussain, S.; Qayyum, A. Spectroscopic Evaluation of Vibrational Temperature and Electron Density in Reduced Pressure Radio Frequency Nitrogen Plasma. SN Appl. Sci. 2021, 3, 1–11. [Google Scholar] [CrossRef]
  37. Phan, K.T.K.; Phan, H.T.; Brennan, C.S.; Regenstein, J.M.; Jantanasakulwong, K.; Boonyawan, D.; Phimolsiripol, Y. Gliding Arc Discharge Non-Thermal Plasma for Retardation of Mango Anthracnose. LWT 2019, 105, 142–148. [Google Scholar] [CrossRef]
  38. International Seed Testing Association (ISTA). International Rules for Seed Testing, 2019th ed.; The International Seed Testing Association: Wallisellen, Switzerland, 2019. [Google Scholar]
  39. AOAC International. Protein (Crude) in Animal Feed, Combustion Method, 18th ed.; Official Methods of Analysis: Gaithersburg, MD, USA, 2006. [Google Scholar]
  40. Rivera, J.D.; Ocampo-Serna, D.M.; Martínez-Rubio, R.A.; Correa-Navarro, Y.M. Determination of Gibberellic Acid and Abscisic Acid in (Zea mays L.) (ICA-V305) Seeds Germinated Using Dynamic Sonication Assisted Solvent Extraction and Maceration. MethodsX 2022, 9, 101821. [Google Scholar] [CrossRef] [PubMed]
  41. Dechthummarong, C. Characterizations of Electrical Discharge Plasma in Air Micro/Nano-Bubbles Water Mixture. J. Plasma Environ. Sci. Technol 2019, 12, 64–68. [Google Scholar]
  42. Dong, F.; Zhang, J.; Wang, K.; Liu, Z.; Guo, J.; Zhang, J. Cold Plasma Gas Loaded Microbubbles as a Novel Ultrasound Contrast Agent. Nanoscale 2019, 11, 1123–1130. [Google Scholar] [CrossRef]
  43. Mai-Prochnow, A.; Zhou, R.; Zhang, T.; Ostrikov, K.; Mugunthan, S.; Rice, S.A.; Cullen, P.J. Interactions of Plasma-Activated Water with Biofilms: Inactivation, Dispersal Effects and Mechanisms of Action. NPJ Biofilms Microbiomes 2021, 7, 11. [Google Scholar] [CrossRef]
  44. Fageria, N.; Baligar, V. Growth and Nutrient Concentrations of Common Bean, Lowland Rice, Corn, Soybean, and Wheat at Different Soil pH on an Inceptisol. J. Plant Nutr. 1999, 22, 1495–1507. [Google Scholar] [CrossRef]
  45. Kosumsupamala, K.; Thana, P.; Palee, N.; Lamasai, K.; Kuensaen, C.; Ngamjarurojana, A.; Yangkhamman, P.; Boonyawan, D. Air to H2-N2 Pulse Plasma Jet for in-Vitro Plant Tissue Culture Process: Source Characteristics. Plasma Chem. Plasma Process. 2022, 42, 535–559. [Google Scholar] [CrossRef]
  46. Laux, C.O.; Spence, T.G.; Kruger, C.H.; Zare, R.N. Optical Diagnostics of Atmospheric Pressure Air Plasmas. Plasma Sources Sci. Technol. 2003, 12, 125–138. [Google Scholar] [CrossRef]
  47. Hong, J.; Zhang, T.; Zhou, R.; Zhou, R.; Ostikov, K.; Rezaeimotlagh, A.; Cullen, P.J. Plasma Bubbles: A Route to Sustainable Chemistry. AAPPS Bull. 2021, 31, 26. [Google Scholar] [CrossRef]
  48. Kaushik, N.K.; Ghimire, B.; Li, Y.; Adhikari, M.; Veerana, M.; Kaushik, N.; Jha, N.; Adhikari, B.; Lee, S.-J.; Masur, K.; et al. Biological and Medical Applications of Plasma-Activated Media, Water and Solutions. Biol. Chem. 2018, 400, 39–62. [Google Scholar] [CrossRef] [PubMed]
  49. Anderson, C.E.; Cha, N.R.; Lindsay, A.D.; Clark, D.S.; Graves, D.B. The Role of Interfacial Reactions in Determining Plasma–Liquid Chemistry. Plasma Chem. Plasma Process. 2016, 36, 1393–1415. [Google Scholar] [CrossRef]
  50. Burlica, R.; Shih, K.-Y.; Locke, B. Formation of H2 and H2O2 in a Water-Spray Gliding Arc Nonthermal Plasma Reactor. Ind. Eng. Chem. Res. 2010, 49, 6342–6349. [Google Scholar] [CrossRef]
  51. Shen, J.; Tian, Y.; Li, Y.; Ma, R.; Zhang, Q.; Zhang, J.; Fang, J. Bactericidal Effects against S. aureus and Physicochemical Properties of Plasma Activated Water Stored at Different Temperatures. Sci. Rep. 2016, 6, 28505. [Google Scholar] [CrossRef]
  52. Fan, L.; Liu, X.; Ma, Y.; Xiang, Q. Effects of Plasma-Activated Water Treatment on Seed Germination and Growth of Mung Bean Sprouts. J. Taibah Univ. Sci. 2020, 14, 823–830. [Google Scholar] [CrossRef]
  53. Zhou, R.; Zhou, R.; Prasad, K.; Fang, Z.; Speight, R.; Bazaka, K.; Ostrikov, K. Cold Atmospheric Plasma Activated Water as a Prospective Disinfectant: The Crucial Role of Peroxynitrite. Green Chem. 2018, 20, 5276–5284. [Google Scholar] [CrossRef]
  54. Rashid, M.; Rashid, M.M.; Alam, M.S.; Talukder, M.R. Enhancement of Growth, Enzymes, Nutrition and Yield of Eggplant: Combined Effects of Plasma Treatments. Plasma Chem. Plasma Process. 2023, 43, 163–181. [Google Scholar] [CrossRef]
  55. Terebun, P.; Kwiatkowski, M.; Hensel, K.; Kopacki, M.; Pawłat, J. Influence of Plasma Activated Water Generated in a Gliding Arc Discharge Reactor on Germination of Beetroot and Carrot Seeds. Appl. Sci. 2021, 11, 6164. [Google Scholar] [CrossRef]
  56. Herman, E.M.; Larkins, B.A. Protein Storage Bodies and Vacuoles. Plant Cell 1999, 11, 601–613. [Google Scholar] [CrossRef] [PubMed]
  57. Akazawa, T.; Yamaguchi, J.; Hayashi, M. Rice α-Amylase and Gibberellin Action—A Personal View. In Gibberellins; Springer: Berlin/Heidelberg, Germany, 1990; pp. 114–124. [Google Scholar]
  58. Woodger, F.; Jacobsen, J.V.; Gubler, F. Gibberellin Action in Germinated Cereal Grains. In Plant Hormones: Biosynthesis, Signal Transduction, Action! Springer: Berlin/Heidelberg, Germany, 2004; pp. 221–240. [Google Scholar]
  59. Mildaziene, V.; Ivankov, A.; Sera, B.; Baniulis, D. Biochemical and Physiological Plant Processes Affected by Seed Treatment with Non-Thermal Plasma. Plants 2022, 11, 856. [Google Scholar] [CrossRef] [PubMed]
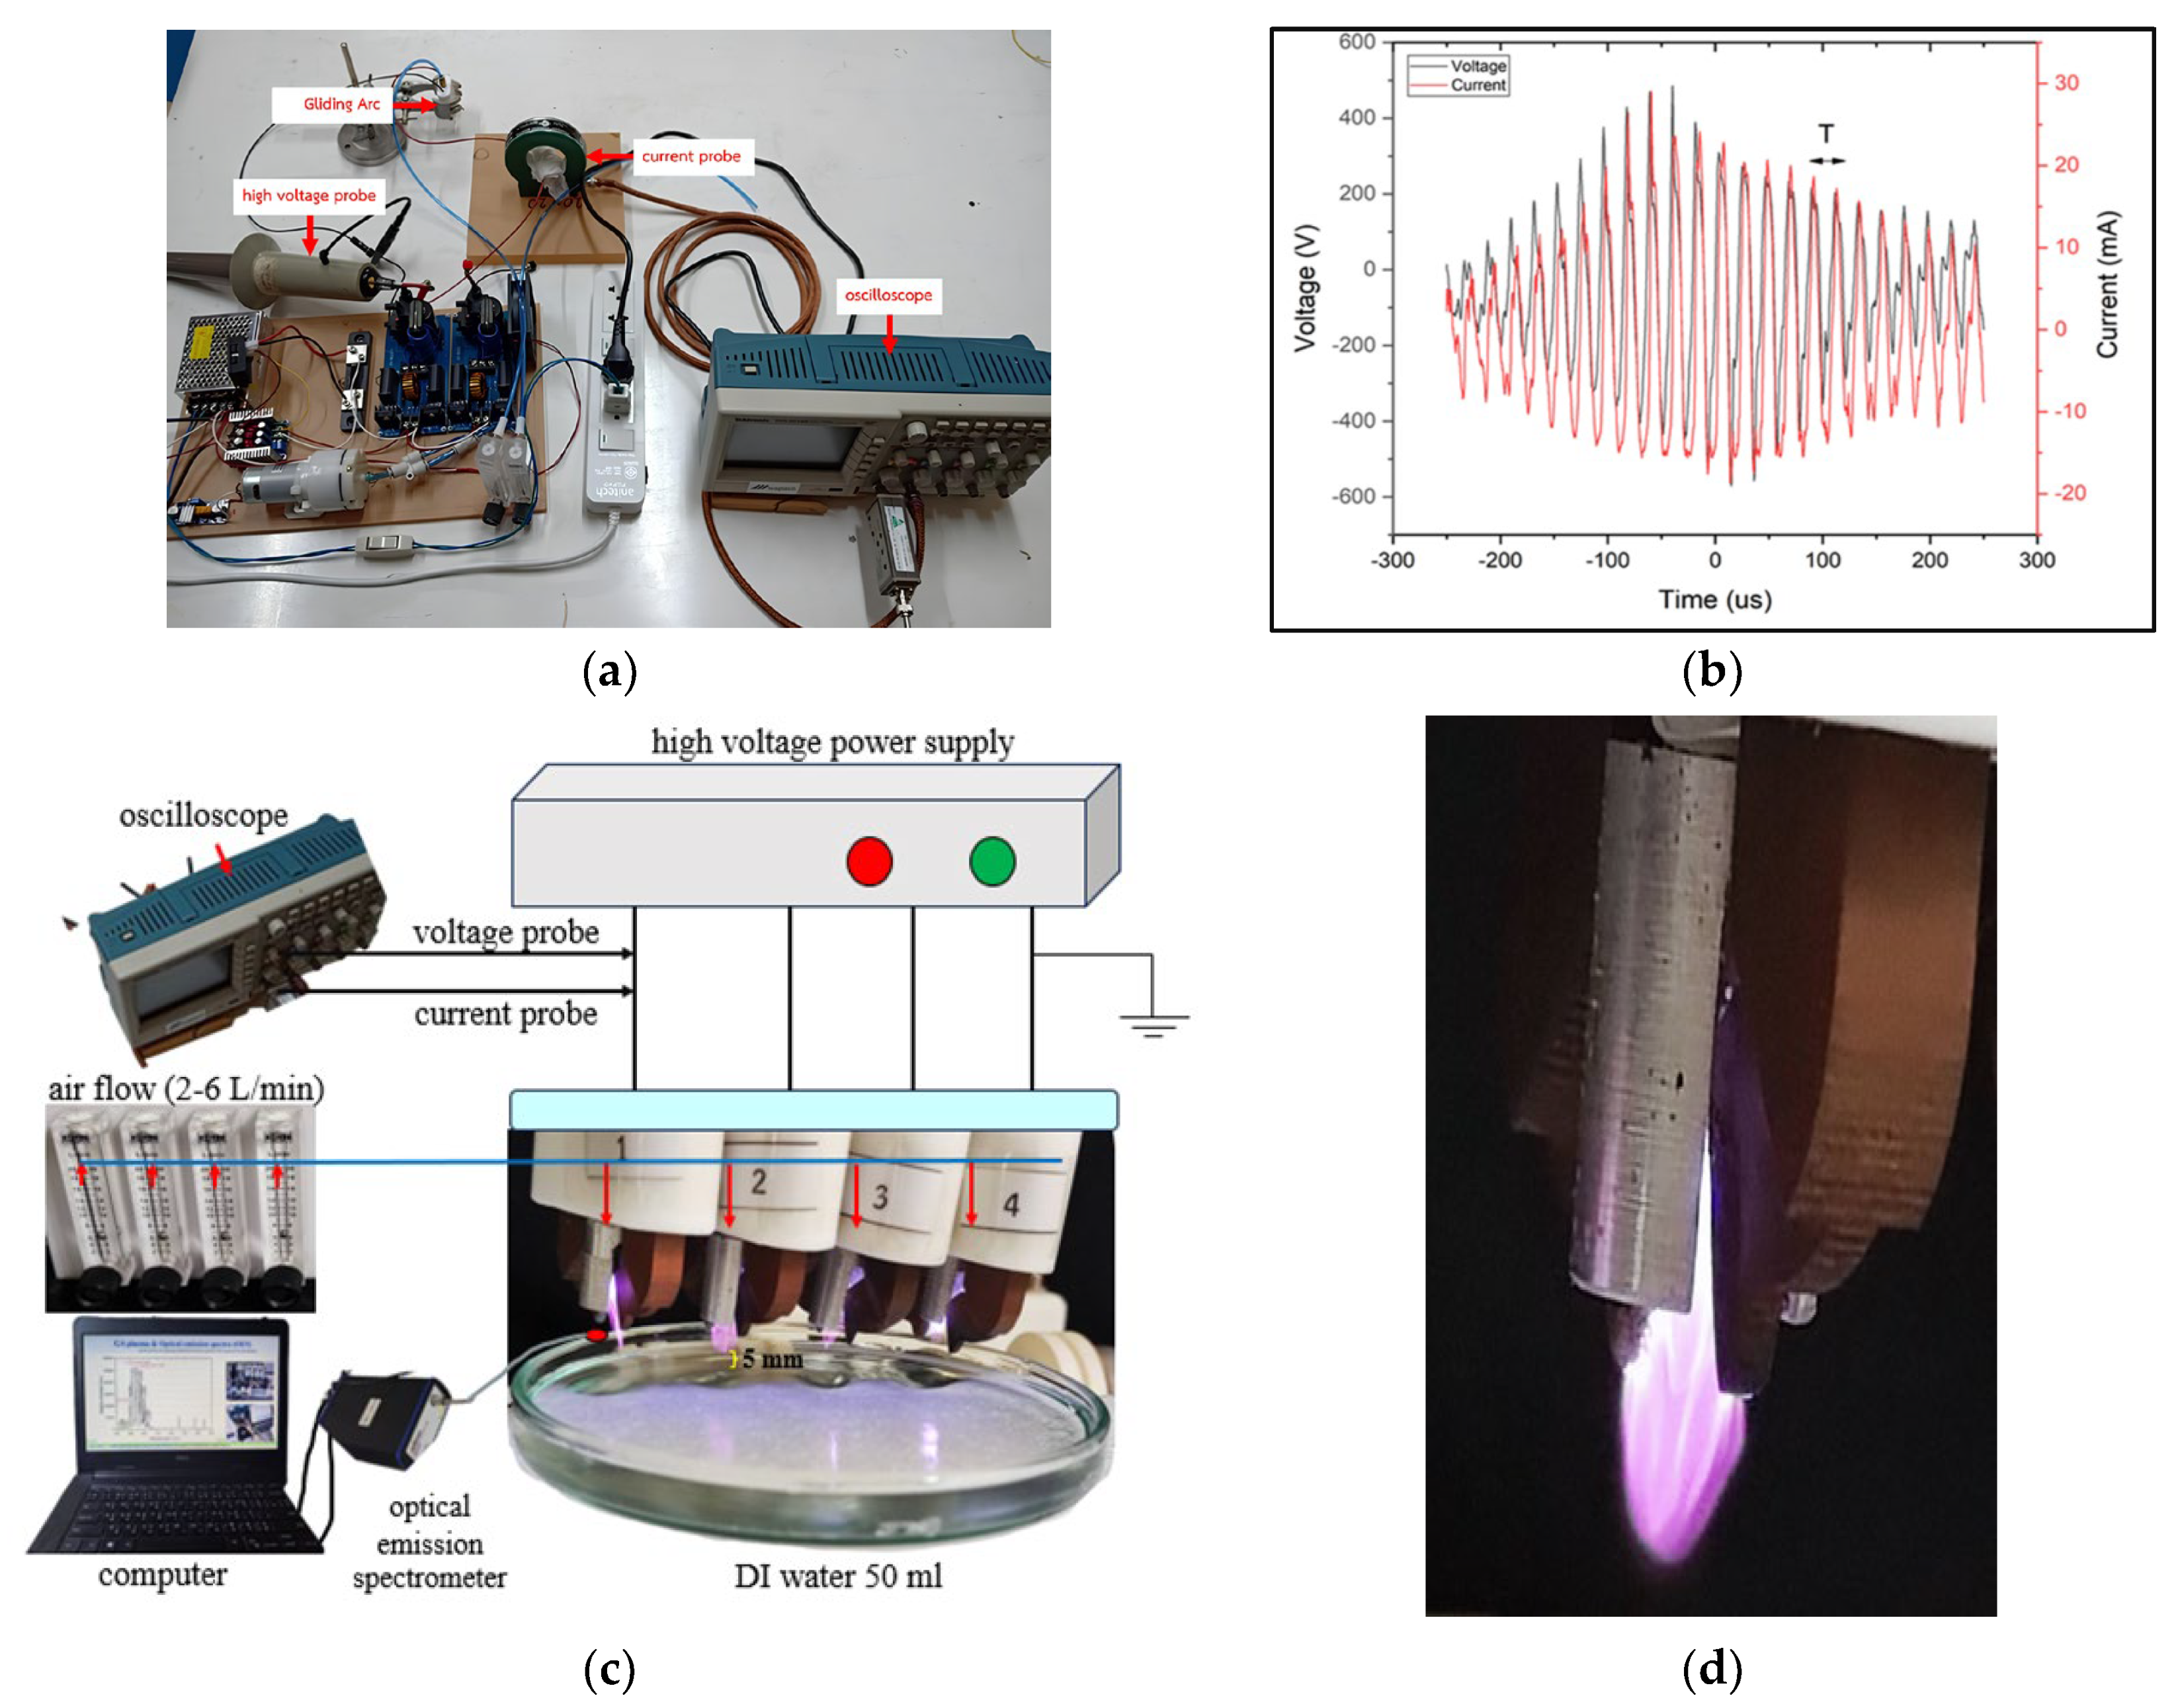
Figure 1. (a) Measuring the power supply using an oscilloscope; (b) electrical signal of the GA plasma system plotted between the electric potential and the current for one complete cycle; (c) schematic diagram of PAW using GA discharge with ambient air; and (d) plasma light from GA discharge.
Agronomy 14 00015 g001
Figure 2. The optical emission spectra (OES), including (a) long wavelengths from 200 to 900 nm, and (bf) short wavelengths from 265 to 430 nm of GA plasma at airflow rates of 2, 3, 4, 5, and 6 L/min, respectively.
Agronomy 14 00015 g002
Figure 3. Ratio between I370.9 nm and I380.4 nm of the GA plasma at airflow rates of 2, 3, 4, 5, and 6 L/min.
Agronomy 14 00015 g003
Figure 4. Changes in the chemical properties of PAW during the 20-day storage period: (a) the concentrations of NO3, NO2, and H2O2, (b) pH levels, and (c) EC and ORP values.
Agronomy 14 00015 g004
Figure 5. Comparison of the chemical properties of PAW with pH-adjusted PAW at airflow rates of 2, 3, 4, 5, and 6 L/min. Means with ** are significantly different between groups (p < 0.01), according to a two-sample t-test.
Agronomy 14 00015 g005
Figure 6. Chemical characteristics of PAW at airflow rates of 2, 3, 4, 5, and 6 L/min and the control: (a) pH level, (b) NO3 content, (c) NO2 content, (d) H2O2 content, (e) EC value, and (f) ORP value. Means with different letters indicate a significant difference between groups (p < 0.01), according to the least significant difference (LSD) test.
Agronomy 14 00015 g006
Figure 7. Seedling growth rate of rice seed assessed by (a) shoot and (b) root lengths after treatment with PAW at airflow rates of 2, 3, 4, 5, and 6 L/min compared to the control.
Agronomy 14 00015 g007
Figure 8. (a) Growth characteristics of rice seeds 14 days after treatment with PAW at airflow rates of 2, 3, 4, 5, and 6 L/min and the control, and (b) measurement of radicle emergence, shoot and root lengths.
Agronomy 14 00015 g008
Table 1. Concentration of total nitrogen (N) and gibberellic acid (GA3) in rice seeds after treatment with PAW and the control.
TreatmentTotal Nitrogen (%)Gibberellic Acid (µg/g)
T11.519 c0.708 d
T21.751 a0.995 cd
T31.616 b1.467 c
T4 1.797 a7.047 b
T51.751 a10.855 a
T61.806 a11.327 a
F-test****
CV (%)2.296.79
LSD 0.050.0280.544
Data are expressed as means, and different letters within a column indicate a significant difference according to the least significant difference (LSD) test. ** significantly different at p < 0.01 probability level.
Table 2. Rice seed characteristics after treatment with PAW and the control.
TreatmentRadicle Emergence (%)Germination (%)Germination
Index
24 h48 h72 h
T19.3385.00 c94.00 b94.00 c19.81 c
T213.0091.67 b95.67 ab96.67 ab22.19 b
T312.0093.33 ab97.00 a96.67 ab22.13 b
T413.0092.00 b95.67 ab96.00 b21.86 b
T511.3394.33 a97.00 a98.33 a22.89 a
T611.3391.67 b97.67 a97.33 ab21.60 b
F-testns******
CV (%)11.611.2112.71.151.77
LSD 0.05-1.972.181.970.68
TreatmentLength (cm)Seedling Weight
(mg/Seedling)
Seedling
Moisture
Content (%)
ShootRootFreshDry
T113.44 b12.38 76.70 b9.89 b87.11
T213.54 b13.01 88.79 a10.78 a87.86
T314.60 a13.02 89.51 a10.78 a87.94
T414.34 a12.45 85.33 a10.40 a87.80
T514.76 a13.26 87.08 a10.80 a87.56
T614.35 a12.91 86.65 a10.83 a87.49
F-test*ns**ns
CV (%)2.786.434.272.290.49
LSD 0.050.70-6.510.43-
Data are expressed as means, and different letters within a column indicate a significant difference according to the least significant difference (LSD) test. ns = not significant; * significantly different at p < 0.05, and ** significantly different at p < 0.01.
Disclaimer/Publisher’s Note: The statements, opinions and data contained in all publications are solely those of the individual author(s) and contributor(s) and not of MDPI and/or the editor(s). MDPI and/or the editor(s) disclaim responsibility for any injury to people or property resulting from any ideas, methods, instructions or products referred to in the content.