Article

Genetic Improvements in the Root Traits and Fertilizer Tolerance of Soybean Varieties Released during Different Decades

1
Agricultural School, Inner Mongolia Minzu University, Tongliao 028000, China
2
Agricultural School, Shenyang Agricultural University, Shenyang 110866, China
*
Author to whom correspondence should be addressed.
Agronomy 2024, 14(1), 2; https://doi.org/10.3390/agronomy14010002
Submission received: 22 October 2023 / Revised: 11 December 2023 / Accepted: 17 December 2023 / Published: 19 December 2023

Abstract

:
Root traits (RTs) of soybean (Glycine max (L.) Merr.) that can be improved through long-term genetic breeding have been identified. However, whether resistance to environmental stresses can be enhanced and more detailed information on the relationships between RTs and seed yield remain unclear. Here, we used a pot-culture experiment with 13 varieties released in different years to investigate the changes in some RTs resulting from genetic breeding-based improvements. We determined whether RTs in different varieties respond to increasing fertilization rates (FRs) differently and quantified the contributions of RTs to seed yield variation among varieties. Decades of genetic selection have resulted in significant desired changes in RTs as well as the seed yield (per plant) under different FR conditions. The RT values of soybean receiving the 1.1 g pot−1 FR treatment increased significantly by 8.20%, 8.75% and 8.68%, whereas those receiving the 2.2 g pot−1 FR treatment decreased by 14.31%, 13.28% and 5.52%, for old, middle and new variety groups, respectively, compared with the no fertilizer treatment, indicating that the tolerance of root to fertilizer stress was enhanced. The results of artificial interference analysis showed that root length at the full bloom stage, root-to-shoot ratio at the full seed stage and root activity at the beginning maturity stage were the most important factors affecting seed yield, contributing approximately 54%, 58% and 59%, respectively, to seed yield variation. Overall, our work provides a theoretical basis for future breeding, suggesting a direct selection of soybean RTs to improve soybean yield.

1. Introduction

Over the past 60 years, the global average soybean (Glycine max (L.) Merr.) yield has improved from approximately 1128 to 2769 kg ha−1 [1]. The continuous enhancement in soybean yield can be largely attributed to genetic improvement [2]. During decades of genetic breeding aimed at increasing yield, a series of soybean traits have changed due to direct or indirect selection. Increases have been recorded in many agronomic traits of soybean, such as pod number, seed number, seed mass and lodging resistance during the genetic breeding process [3,4,5]. Additionally, leaf-scale physiological improvements have occurred, including leaf area index, greenness, lifespan, photosynthetic rate and dry matter accumulation and partitioning [6,7,8], as have some canopy-scale traits, such as temperature and light interception efficiency [9,10], along with a reduction in vegetative period [5]. However, studies have mainly focused on the trends in the above-ground traits of soybeans released in different years.
The growth and development of crops result from interactions between above-ground physiological processes and root absorption [11]. Roots play important roles in many physiological and biochemical processes, such as the initial uptake and subsequent transport of water or nutrients, the formation of stress-response signals, the secretion of bioactive molecules and the establishment of a microbiological population in the rhizosphere [12]. Modern crop models that predict crop productivity and biogeochemical cycling from field to global scales have considered root traits (RTs) as crucial inputs [13]. Thus, investigating the changes in RTs during the long-term genetic breeding process may help investigate the influence of breeding on variety development and assist breeders in designing future breeding strategies [10]. However, due to the buried nature of roots and limitations in effectively measuring them under field conditions [14], studies on root system improvement are limited. The RTs of soybean, such as root length, root surface area and root activity, have been shown to increase along with the year of variety release [15,16,17], but there have not been studies on changes in RTs after different fertilizer application rates.
As a legume, soybean is capable of biological N2 fixation, but this pathway alone generally only produces approximately half of the plant’s total N (nitrogen) requirement for maximizing yield [18], and applying N fertilizer has been proposed as an aid for increasing available N in the soil [19]. The soybean root system is sensitive to changes in the amount of N fertilizer. Root morphological or physiological traits generally increase significantly under moderate N conditions [20,21], but as the N fertilizer application rate (FR) increases, soybean RTs are inhibited compared with no fertilizer conditions [22,23,24]. In general, very limited soybean genotypes have been used as experimental materials, leading to the lack of a comparative study on the responses of RTs of varieties having varied yield potentials to increasing N fertilizer levels. The photosynthetic traits of older soybean genotypes (low-yielding) generally decrease under high levels of N, whereas the same treatment basically has no effects on the traits of modern genotypes (high-yielding) compared with a mid-range N application rate [8]. Because plants allocate photoassimilates to roots and roots are important sinks for dry matter [25], the decline in leaf assimilates may result in reductions in the partitioning of dry matter to root systems. Thus, the RTs of modern varieties are expected to be inhibited less than those of earlier varieties, and the tolerance to fertilizer-related stress is expected to improve.
There is often a close positive linkage between soybean yield and RTs [21,26], mainly because the root’s ability to acquire water and ions is vital for physiological and biochemical reactions involved in the synthesis of dry matter. This is also why RTs are frequently discussed in the literature. However, there are no reported studies in which a more precise and quantitative analysis has been conducted to determine which RT is most important for yield variations. Such research is important because it will help optimize crop production and ecosystem biochemical cycle models.
Here, soybean varieties released in different years were studied under different FR conditions. We aimed to (1) detect whether RTs have been enhanced after decades of genetic breeding, (2) explore whether the responses of RTs of different varieties to increasing FRs differ, and (3) quantify the contributions of RTs to seed yield variation among varieties.

2. Materials and Methods

2.1. Test Varieties and Experimental Design

A set of 13 representative soybean varieties (11 varieties that share common ancestors and two newly bred high-yielding varieties, Liaodou 11 and Zhonghuang 35) released in different decades in Liaoning Province (38.55°~42.32° N), China and Ohio (38.45°~41.22° N), USA, were applied in this study. These varieties are all semi-determinate types with similar growth periods (belonging to maturity group III, with a growth period of 121–134 days). The varieties were classified into three groups according to release year: old variety group (OV) (released before 1980), middle variety group (MV) (released 1980–2000) and new variety group (NV) (released after 2000). More information on the test varieties is listed in Table S1.
Sampling plant roots in a field experiment is problematic because it is difficult to take a soil core in the relatively small area around a plant [27]. Therefore, a pot-culture experiment was conducted in this study to retrieve roots easily and ensure root integrity. The experiment was conducted under outdoor conditions without insect, disease or water stress at the experimental farmland of Shenyang Agricultural University (41°82′ N, 123°57′ E) in 2013 and 2014. The soil used per pot was brown loam containing 70.2 mg kg−1 alkali-hydrolyzed N, 21.5 mg kg−1 available phosphorus and 138 mg kg−1 available potassium. Each pot measured 25 cm × 20 cm × 30 cm (height × bottom diameter × top diameter) in size and contained 12.5 kg of soil. N was supplied as urea and was added once at the seedling stage at three different application concentrations: 0, medium rate 1.1 g pot−1 and high rate 2.2 g pot−1. Drip irrigation was used to maintain the soil moisture content at approximately 70% of the field water-holding capacity. There were three N fertilizer treatments: The experiments were arranged in a completely randomized block design with 12 replicates (pots) per fertilizer treatment, and each pot contained two plants.

2.2. Measurements of RTs

The growth stage of soybean was determined in accordance with Fehr and Caviness (1977) [28]. Root morphological traits (root length, root surface area, root hair number and root–shoot ratio) and root activity were measured at the full bloom (R2), full seed (R6) and beginning maturity (R7) stages. For root sampling, each potted plant’s soil was soaked fully with water. Then, the soil–water mixture was gently poured out, and the roots were rinsed slowly with running water until no soil remained. The aerial part of each soybean plant was cut at the cotyledon phloem node. Cleaned root samples were scanned using a WinRhizo2012 root-scanning image analysis system (Regent Instruments, Inc., Quebec, QC, Canada) to determine root length, root surface area and number of root hairs. After scanning, samples of the aerial parts, i.e., shoots (stems, leaves, leafstalks, podwalls and/or seeds), and roots were immediately oven-dried for 30 min at 105 °C and then at 80 °C until reaching a constant weight (root nodules removed before drying) to calculate the ratio of root to shoot (R:S) dry weight ratios. Root activity was measured using the triphenyl tetrazolium chloride method [17]).
At the full maturity stage (R8 stage), three soybean plants (in three independent pots not subjected to root sampling) were selected per fertilizer treatment, and the seeds of each plant were oven-dried at 80 °C and weighed to determine the seed yield per plant (g/plant).

2.3. Statistical Analysis

We used SPSS 19.0 (SPSS, Inc., Chicago, IL, USA) to analyze the experimental data. The FR, variety, sampling date and interactions among FR, variety and sampling date were considered as fixed effects. The replications per year were considered random effects. Probability values of less than 0.05 were considered significant.
To determine the contributions of different RTs to seed yield variation among different varieties, an artificial interference analysis method based on a multiple stepwise regression was used. First, the values for root length, root surface area, root hair number, R:S and root activity for each growth stage under three FRs for all the test varieties were considered to be the potential affecting variables (independent variables) and were inputted. Second, multiple stepwise regression models were established using SPSS 19.0 to select seed yield-affecting variables. The variables entered into the statistical regression equations were considered to have significant influences on seed yield. Then, for a certain input variable containing N (108 in this study) groups of data, the corresponding output value was y(n). When adding 1% interference to the ith variable (i = 1, 2, 3…), the corresponding output value was yi (n). If a variable has a large influence on seed yield, then the output’s simulated values after a small interference will deviate more from those without interference. We used Si to indicate the effect of each variable as follows:
S i = 1 N n = 1 N | y i n y ( n ) | | y ( n ) |
The contribution of each variable to seed yield was estimated as follows:
Q i = S i n = 1 i S i × 100 % .

3. Results

3.1. Analysis of Variance

The results of the variance analyses for RTs and seed yield per plant across study years, FRs, varieties and sampling dates are shown in Table 1. The RTs of soybean significantly differed among FRs, varieties and sampling dates. The RTs did not differ among years, and there were no significant differences among Y (year) × FR, Y × variety and Y × sampling date interactions. Some of the RTs were significantly affected by the FR × variety, FR × sampling date and variety × sampling date interactions. In addition, the FR × variety × sampling date interaction was significant for all the RTs. Seed yield was significantly affected by FRs and the FR × variety interaction.

3.2. Genetic Improvement in RTs

Root length, root surface area, root hair number and root activity of soybean increased along with the plant growth and development, and they generally peaked at the R6 stage under no fertilization conditions, except for R:S, which had its greatest value at the R2 stage and then decreased (Figure 1a–e). Root length, root surface area, root hair number and root activity at the R6 stage and R:S at the R2 stage under different FRs increased significantly along with release year in a linear or exponential increase pattern, with determination coefficients ranging from 0.65 to 0.87 (Table 2). These relationships indicated that the RTs of soybean had improved after long-term genetic selection.

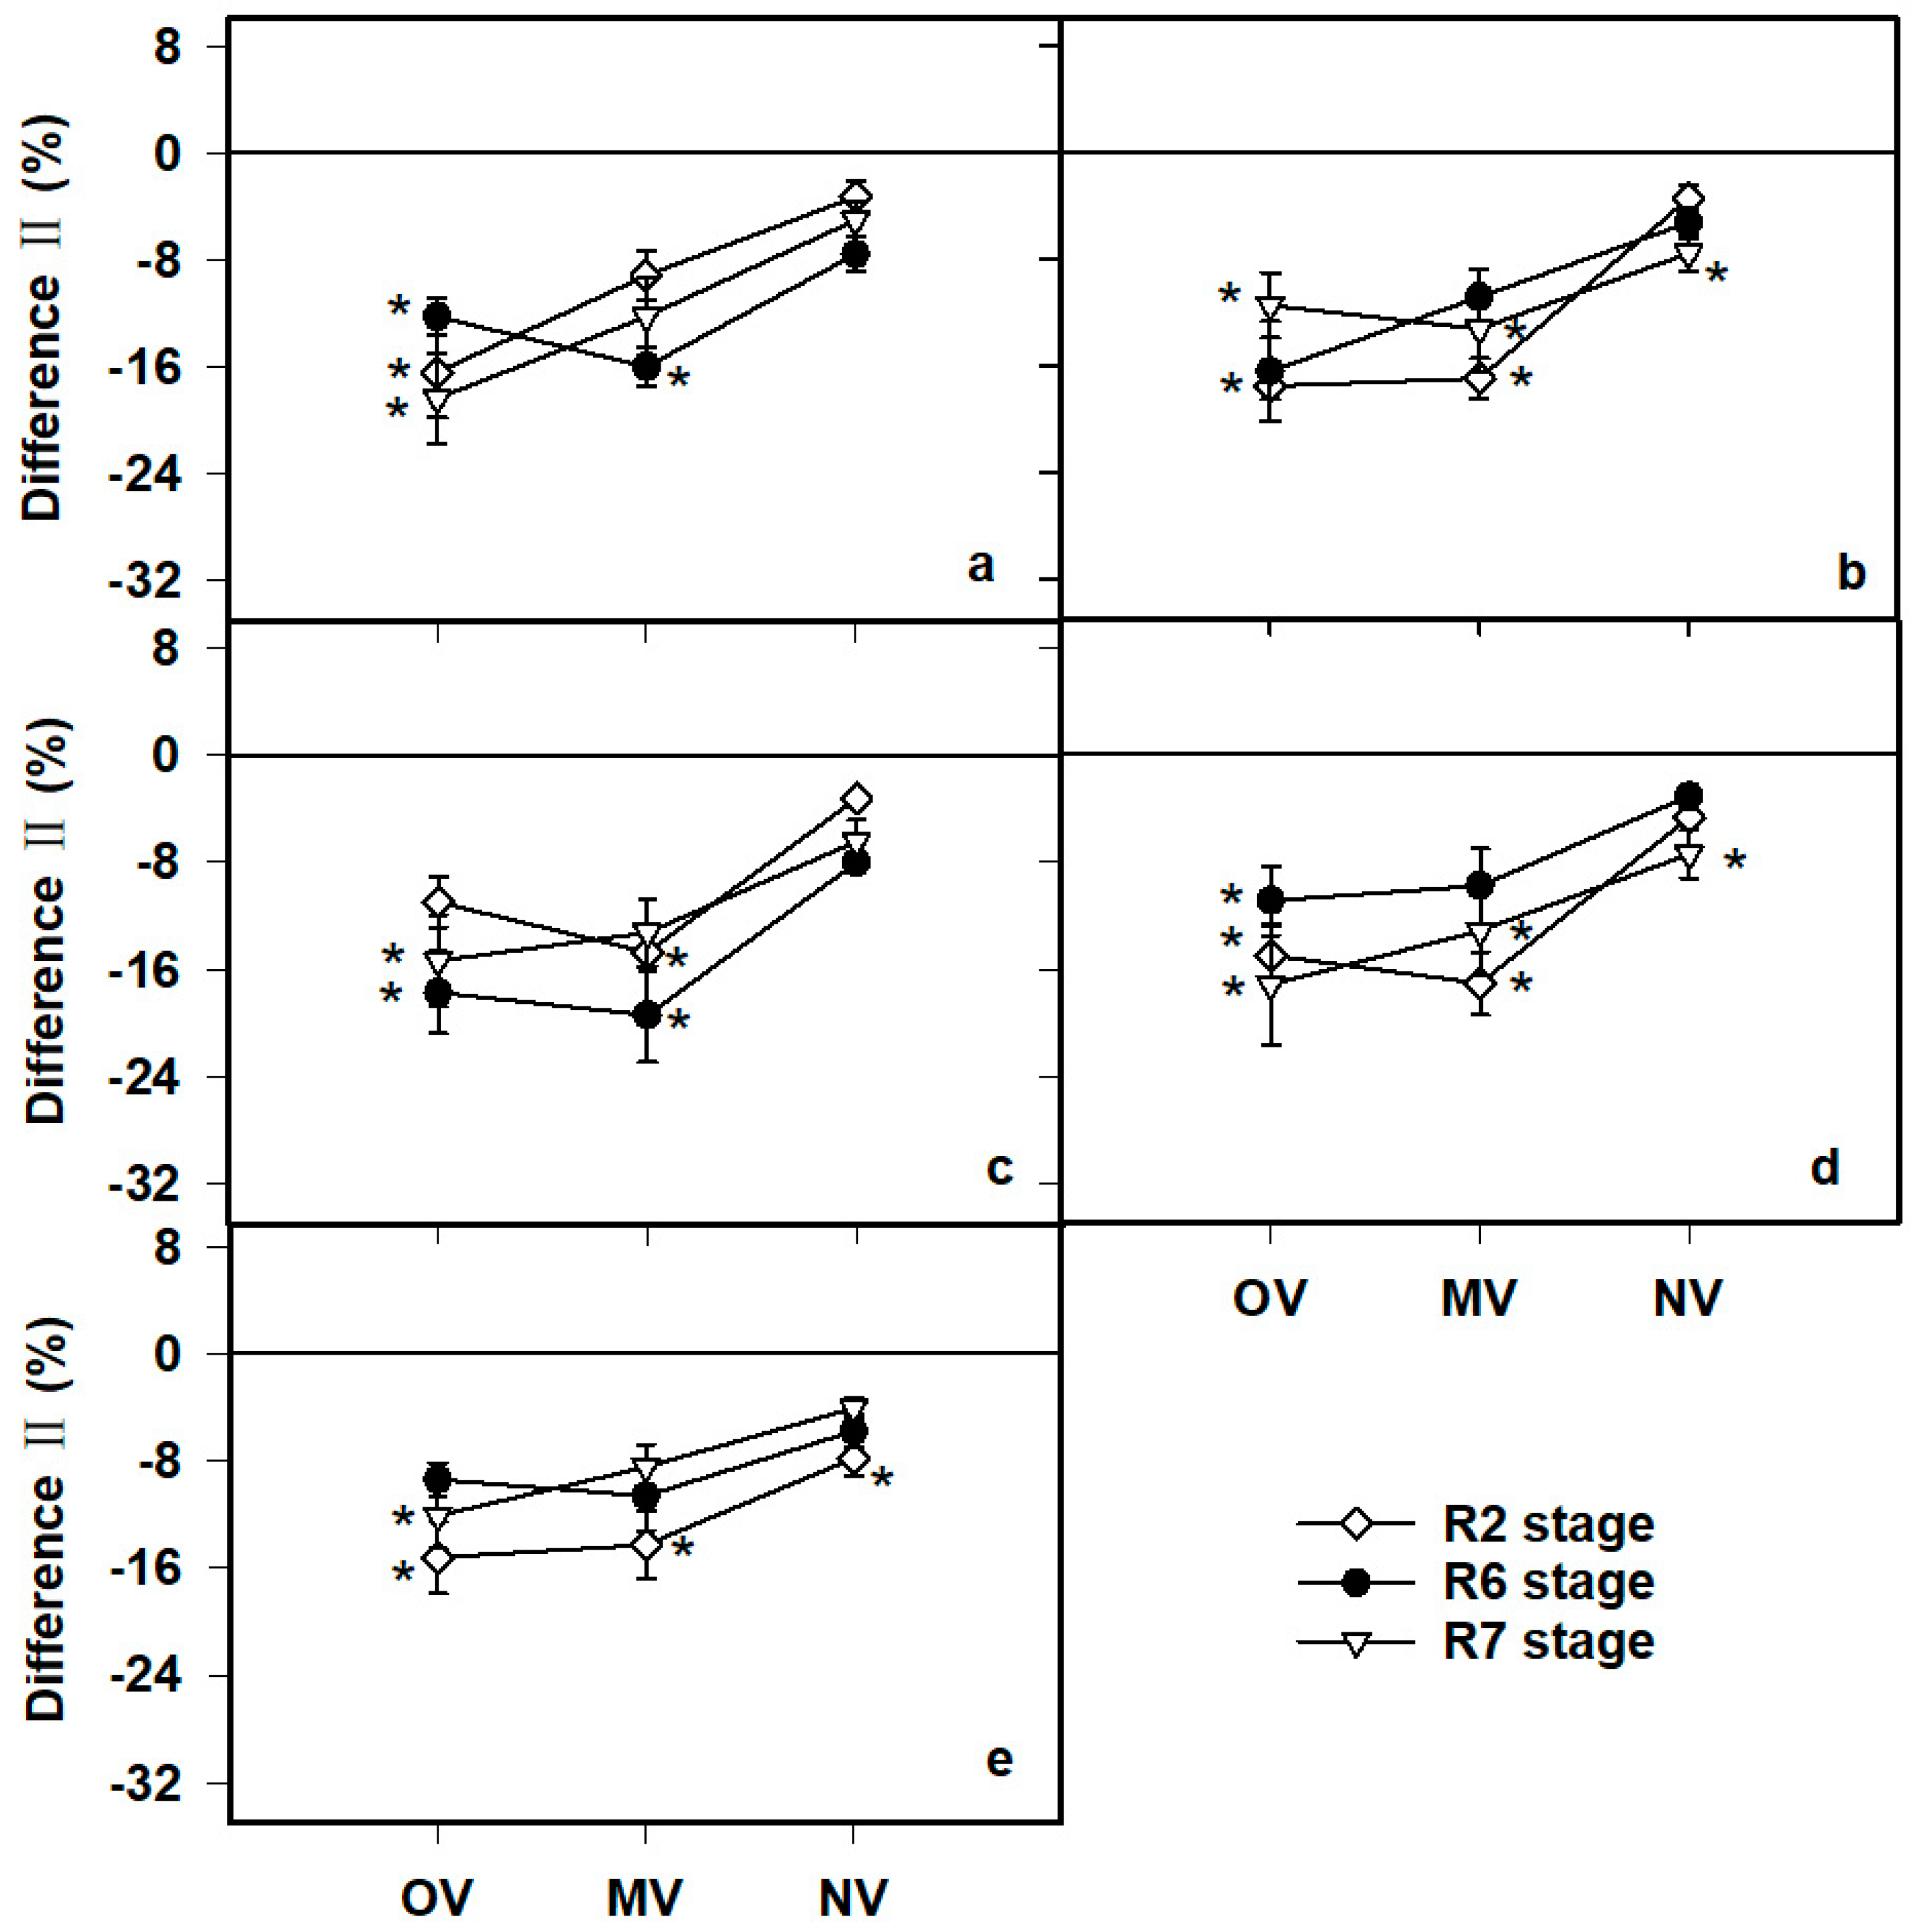
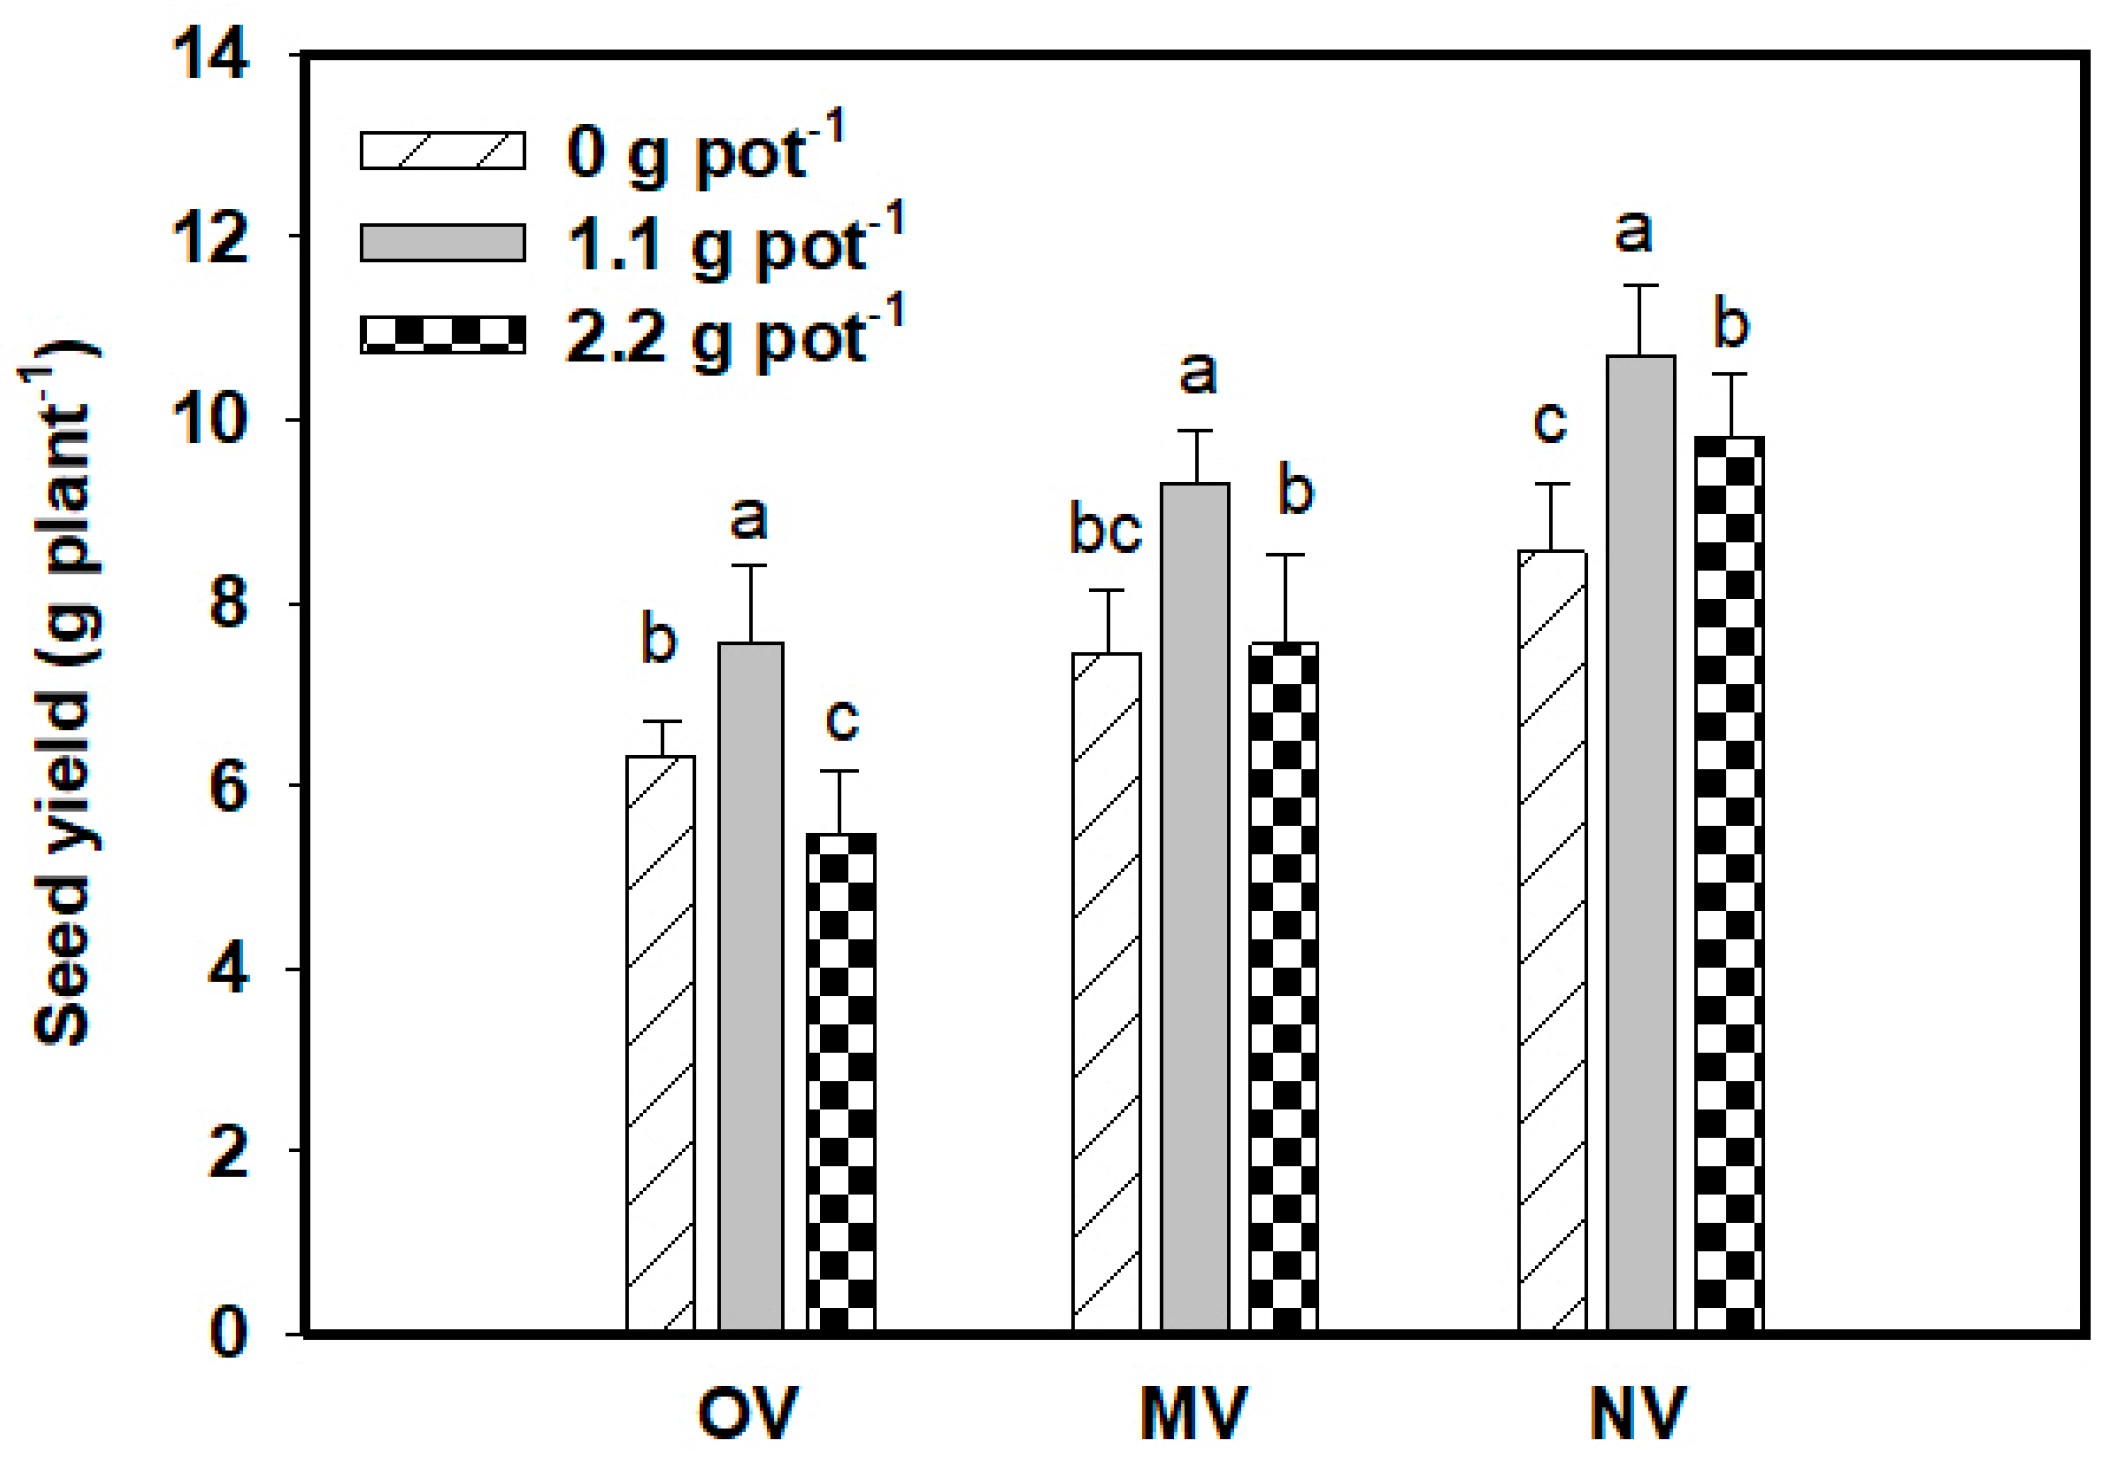
3.3. Effects of N Fertilizer on RTs

The effects of different fertilizer levels on the RTs of different soybean variety groups are shown in Figure 2a–e. The medium FR treatment of 1.1 g pot−1 increased RT values significantly at all the investigated growth stages by an average of 8.20%, 8.75% and 8.68% for OV, MV and NV, respectively. The RTs of soybean were generally inhibited significantly under the high FR treatment of 2.2 g pot−1 compared with the no fertilizer treatment but with varied levels of decrease for different variety groups (Figure 3a–e). At the three study growth stages, RTs decreased by 9.40–18.63% (mean = 14.31%) for OV, by 8.47–19.51% (mean = 13.28%) for MV and by 3.10–7.57% (mean = 5.52%) for NV under high FR treatment conditions compared with the no fertilizer treatment. These results indicated that the high FR treatment resulted in fertilizer-related environmental stress for soybean root growth, and the lower decrease in NV roots compared with those of OV and MV revealed a greater tolerance of NVs to high FR stress compared OVs and MVs. Thus, the fertilizer tolerance of soybean roots has improved with time.

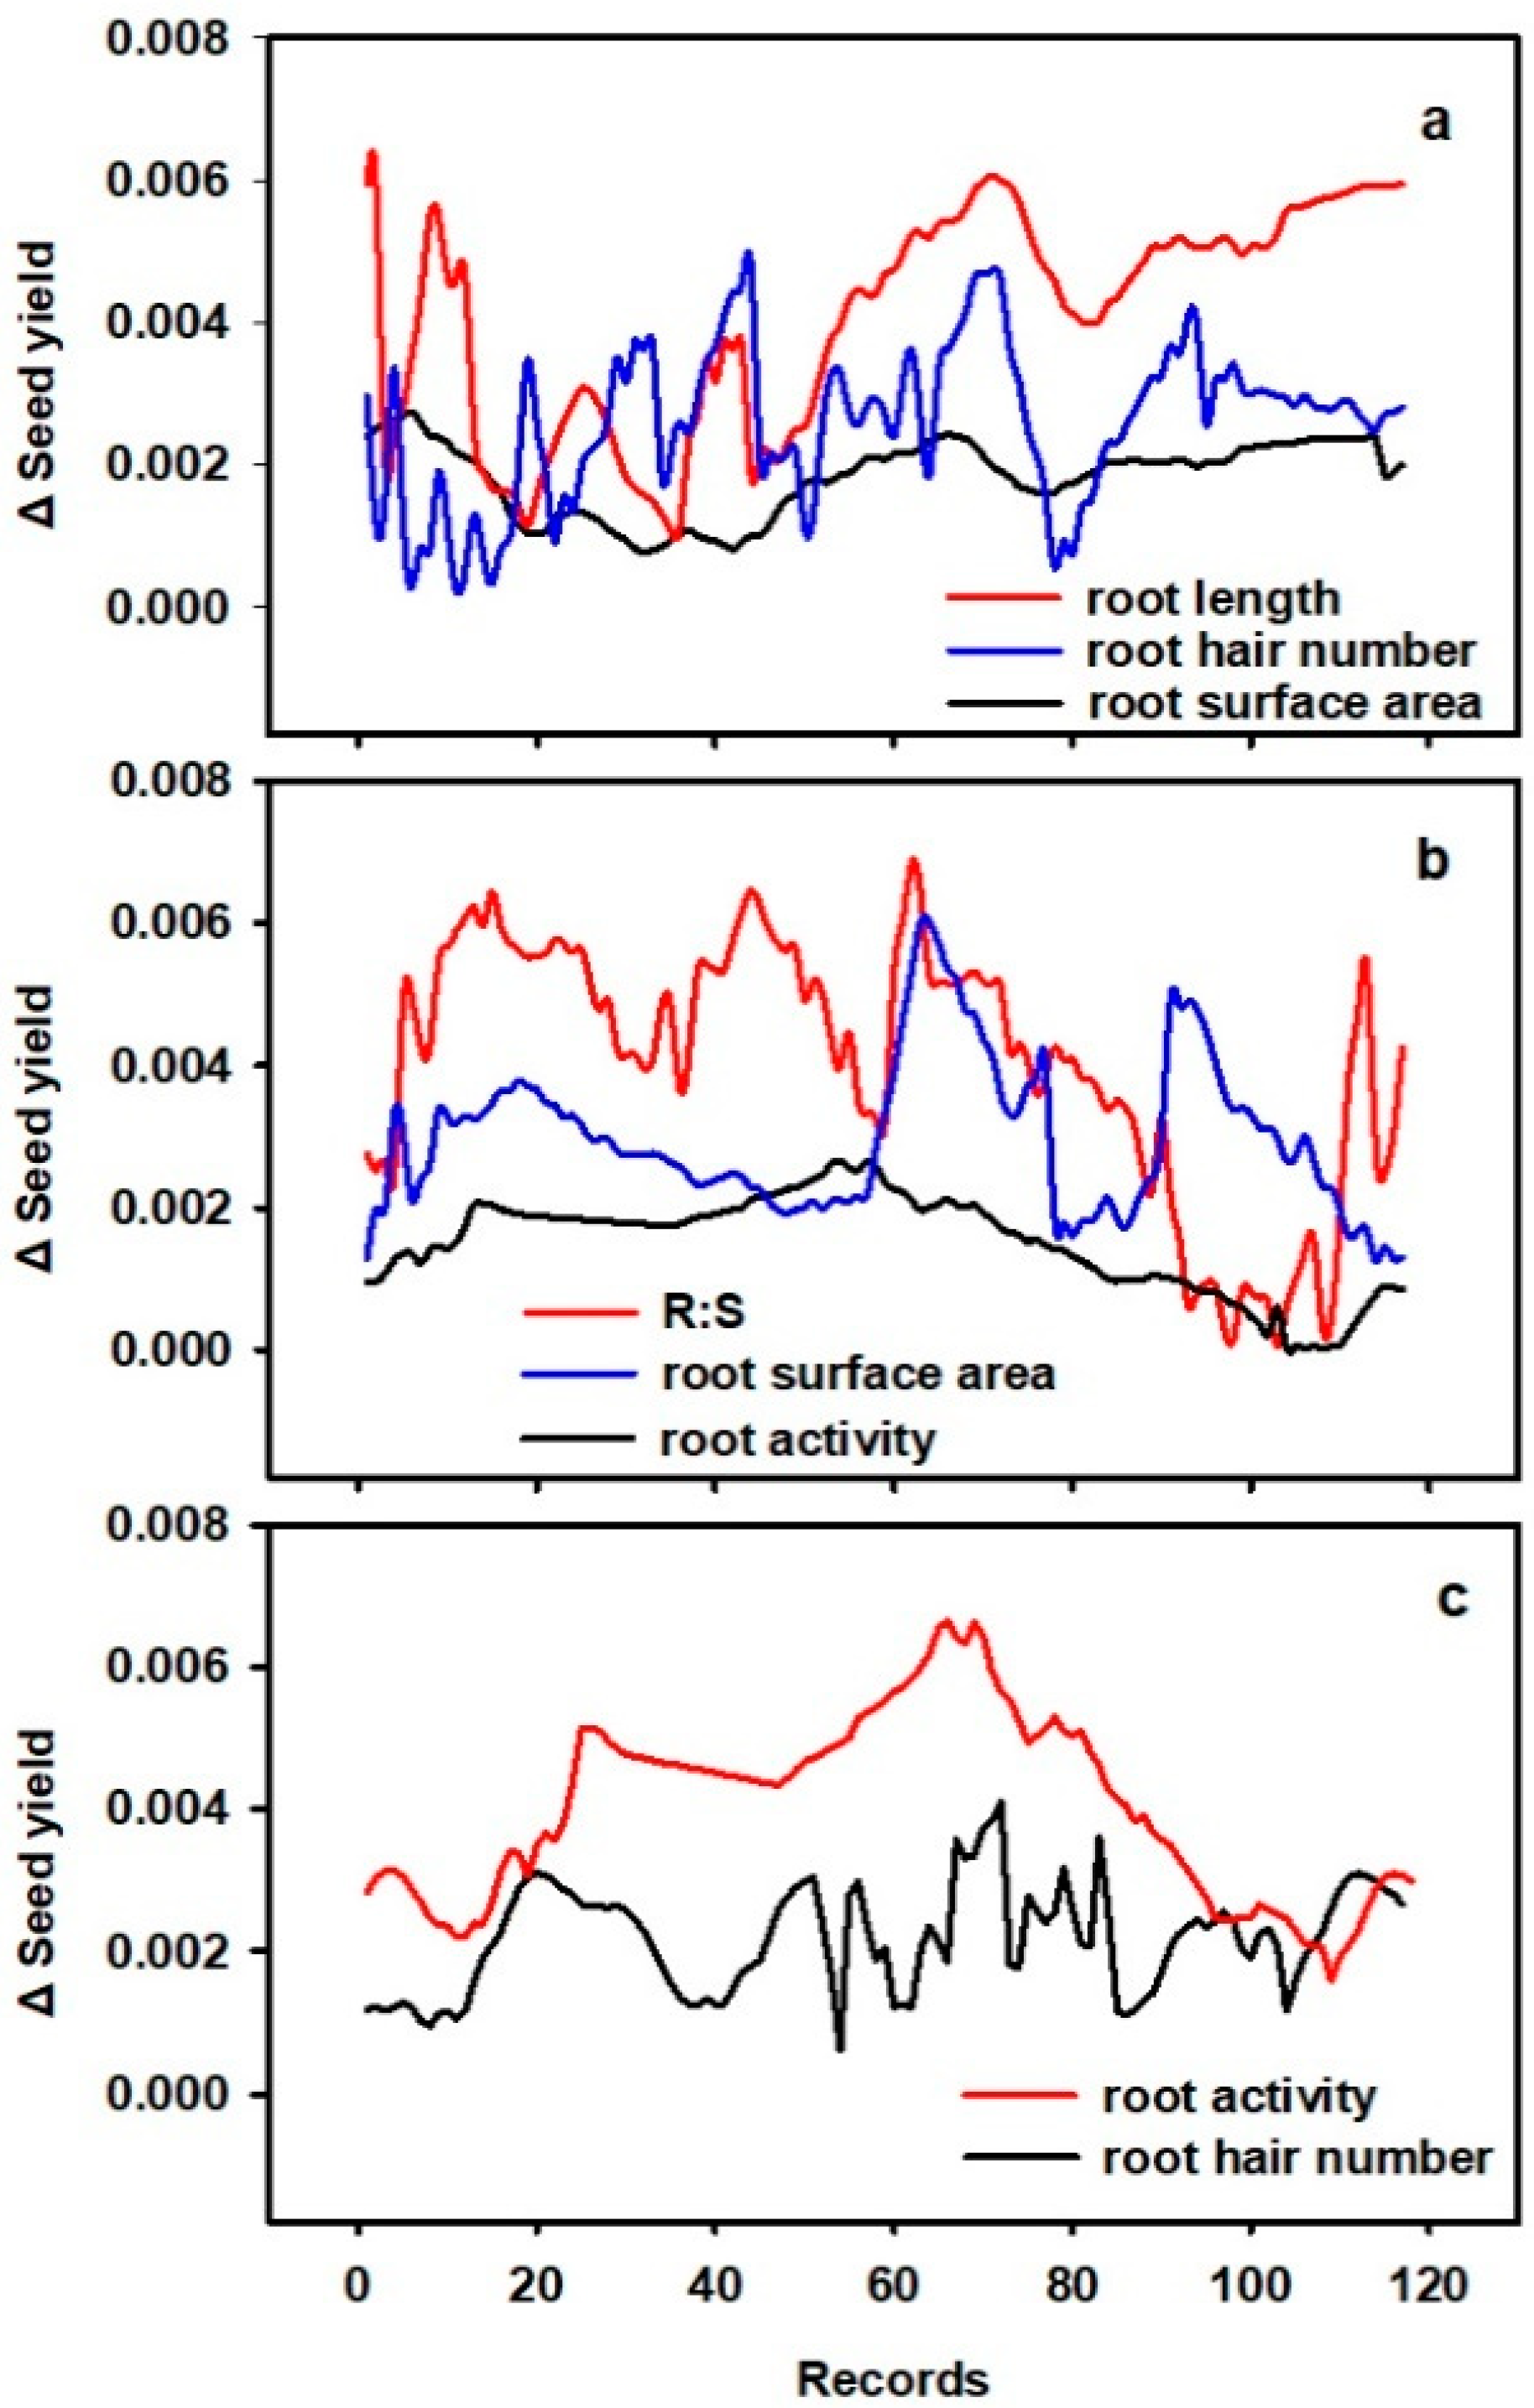
3.4. Relationship between Seed Yield and RTs

Improving seed yield is a major objective of genetic breeding. This study confirmed that seed yield was enhanced after decades of variety alternation. Additionally, similar to RT performance under different FR treatments, soybean seed yield also increased significantly with the medium FR treatment but was inhibited by the high FR treatment (p < 0.05), with larger decreases in the OV and MV compared with the NV (Figure 4).
Seed yield was closely correlated with RT values. The fitted multiple linear regression analysis indicated that the seed yield was not affected by only one RT but jointly affected by many RTs (Figure 5a–c). Seed yield was significantly and jointly impacted by root length, root surface area and root hair number in the R2 stage, by root activity, root surface area and R:S at the R6 stage, and by root hair number and root activity at the R7 stage. To distinguish their respective contributions to seed yield and to determine which was the most important, an interference analysis method was used. The simulated seed yield values deviated by different magnitudes from those without interference (Figure 5a–c). The integration of the magnitudes based on Equations (1) and (2) indicated that root length, root surface area and root hair number at the R6 stage contributed approximately 58%, 35% and 7%, respectively, to seed yield, root activity, root surface area and length and R:S at the R2 stage contributed approximately 34%, 12% and 54%, respectively, to seed yield, and root hairs and root activity in the R7 stage contributed approximately 41% and 59%, respectively, to seed yield (Figure 6a–c). Therefore, root length in the R2 stage, R:S in the R6 stage and root activity in the R7 stage were the most important RTs affecting seed yield.

4. Discussion

4.1. Changes in RTs

Root length is a widely used parameter for describing plant root systems and is important for root growth because it is associated with the absorption of water and nutrients [29]. Root length is a component for determining root surface area [30,31]. Consequently, the two traits are commonly described together in the studies on soybean root systems. Because the observed value of root length is the cumulative length of the vertical root, lateral root and root hair, the number of root hairs can also reflect the root length and was examined in this study. Root activity is an important physiological index that reflects the root’s ability to absorb and transport nutrients to shoots [17]. Our study showed that root length, root surface area, root hair number and root activity generally peaked at the R6 stage. The soybean pod-filling stage is crucial for yield formation. The dense canopy during this stage may lead to limited light on the middle and lower leaves, and if the root system has a poor absorptive ability, then the senescence of bottom leaves will increase, which can hinder the transportation of assimilates to seed sinks, thereby directly affecting the yield [32]. However, Jin et al. (2010b) [16] and Yang et al. (2001) [15] indicated that the root lengths of two soybean varieties with different yield levels reached their maxima at the R5 stage (initial pod filling), and another study indicated that the maximal values of root length and root surface area of soybean occurred at the flowering stage [20]. Determinations of the root activity’s variation as growth proceeds have also been inconsistent. For example, Cui et al. (2016) [17] reported that root activity peaks at the R4 stage (podding) and then declines gradually. Apart from the varied soybean varieties used in different studies, different experimental environmental conditions may also account for these inconsistent conclusions because soybean RTs are strongly influenced by soil type, texture, water, nutrient and microorganism activity [24,33,34].
Root traits have improved as a result of decades of genetic breeding, as indicated by the significant positive relationship between RT values and the release year (Table 2). Our result is consistent with that of Yang et al. (2001) [15], who found that root length, volume and surface were significantly enhanced during decades of genetic improvement, mainly at the full-seed stage. Cui et al. (2016) [17] also showed that soybean root activity is markedly improved in more recent varieties at the pod pod-filling stage. However, our results contradict those of Gao et al. (2020) [35], who reported that new soybean varieties producing higher-than-average yields have smaller root sizes than old varieties producing lower yields. It was argued that root morphology has evolved water-saving mechanisms, and thus, the varieties with shorter root lengths and smaller surface areas use water more slowly [36]. In the current study, the tested varieties came from Liaoning Province in China and Ohio in the USA, which both have continental humid climates, meaning that drought stress rarely occurs. Therefore, local breeders may not have focused on breeding more efficient water-using varieties with smaller root sizes.

4.2. Root Traits and Fertilization

Root traits have been shown to be enhanced under medium FR conditions. Gai et al. (2017) [21] found that an intermediate level of N fertilizer produced the greatest dry root weight and root activity. Wang et al. (2009) [20] also reported that a certain amount of N fertilizer helps increase root weight. Our study, despite being focused on different RTs, also indicated superior root length, root surface area, root hair number, R:S and root activity values for soybean grown under moderate FR conditions compared with non-fertilized conditions. This may be because plant growth and development are associated with the levels of protein, nucleic acids, chlorophyll and growth hormones, of which N is an essential constituent [37]. Additionally, the N absorbed by plants mainly exists in leaves in the form of ribulose-1,5-biphosphate carboxylase, and there is generally a strong positive correlation between leaf N concertation and photosynthetic rate [19]. A sufficient N supply may promote plant photosynthesis, thereby increasing the supply of photoassimilates to belowground plant parts, resulting in increased root growth.
Excessive N fertilizer applications inhibit soybean growth. Soybean leaf photosynthesis [38,39] and seed yield [21,40] are likely to be inhibited under high FR conditions. Similar effects on root growth parameters have been identified. For example, Delfim et al. (2018) [23] reported that a high level of fertilization results in significant decreases in soybean root length, root surface area, root volume and root diameter compared with soybean receiving no N application. Saito et al. (2014) [22] also found decreases in root length when soybean was supplied with additional N compared with no fertilizer. The negative effects of excessive N applications on root growth have also been observed in other crops, such as corn [41]. The current study also revealed a reduction in root growth due to a high FR, but the level of the decrease differed among the variety groups, i.e., the RTs of the OV and MV after high FR treatments generally declined significantly at most of the studied growth stages compared with the no fertilizer treatment, whereas those of the NV usually did not change obviously or decreased slightly when FR increased. Thus, the high FR treatment in this study acted as an adverse environmental condition. Members of the NV were more tolerant to fertilization stress, and their adaptability to environmental changes improved. It is not clear why the NV are more tolerant to high FR, but the inhibition of RTs in the MV and OV by a high FR may be related to the reduced above-ground photosynthesis resulting from the high N level. A large amount of fertilizer in soil inhibits root nodule numbers and nodule mass, thereby reducing N2 fixation [23,42]. Gibson and Harper (1985) [43] pointed out that this inhibition is a homeostatic mechanism that may allow the plant to balance the cost of N2 fixation with the need for N. The diminished ability to fix N2 may result in the plant being N deficient [19], which would further impede leaf photosynthesis and the supply of photosynthetic products to belowground parts, ultimately impacting root growth. Our previous study on the improvement of photosynthetic parameters using the same varieties carried out under field conditions confirmed the inhibition of the leaf photosynthetic rate in the OV after a high FR treatment [8], which supports the above hypothesis.

4.3. R:S

In plants, R:S is an indicator that reveals the allocation of photoassimilates and is the most commonly used index to measure dry matter allocation [27]. Our study showed that the R:S values of OV, MV and NV across growth stages varied from ~0.10 to ~0.27, which were within the previously reported range (0.08–0.31) [13]. Unlike other RTs, the highest value of R:S occurred in the R2 stage and then steadily declined, indicating that the major portion of the assimilates went to the shoots. This corroborated the results of Jin et al. (2010a) [7], who reported that the highest R:S values occur during the initial flowering stage (R1). With genetic breeding, the R:S value has shown an increasing trend (Table 2), indicating that the modification of shoots and roots was not synchronous and that the NV tend to allocate greater portions of dry matter to roots. Jin et al. (2010b) [16], through studies on eight soybean genotypes with varying yield potentials released in different decades, also indicated that high-yielding soybean varieties have higher R:S values than low-yield varieties. The R:S value likely impacts the lodging behaviors of crops. Those genotypes with high R:S values are more likely to resist lodging, thereby increasing biomass and seed yield [44]. Similar to the decreases in other RTs, R:S decreased after the high FR treatment (Figure 3d). This may be associated with the source and sink relationship in plants. In this study, the N availability in soil under high FR conditions was greater than that after no fertilizer addition. Under limited resource conditions (no N fertilizer addition), the leaf source is likely to allocate more assimilates to belowground parts because the root has the greatest need for acquiring more resources from a limited pool. This ensures survival and results in a higher root mass and higher R:S when there is no fertilizer application compared with after an excessive N application [13,45].

4.4. RTs and Seed Yield

This study found that the root length in the R2 stage, R:S in the R6 stage and root activity in the R7 stage were the most important RTs affecting seed yield. Soybean often has reached approximately 50% of its mature height and has approximately 50% of its total mature node number by the R2 stage [46], which generally marks the beginning of the very rapid accumulation of dry matter that continues until the seed-filling stage [46]. Thus, during this period, the plant has a strong requirement for nutrients. However, the root length at this stage is not the maximal value (Figure 1a), indicating that the root length may not be able to absorb sufficient nutrients for plant growth. Therefore, at this stage, a short root may constrain physiological processes, and plants tend to be more sensitive to the limitations. The R6 stage is when the roots have the greatest ability to absorb water and nutrients (Figure 1a–c,e), but the seed yield is most susceptive to lodging. Soybean yields decrease when lodging occurs prior to physiological maturity. Cooper (1971) [47] reported that soybean yield decreases by approximately 22% when natural lodging occurs at the pod-filling stage. Woods and Swearingin (1977) [48] also concluded that soybean seed yields are lowest when lodging occurs at the R5 stage. Thus, lodging at the pod-filling stage has a significant impact on seed yield. Lodging-resistant crop varieties commonly have higher R:S values [44,49], reflecting the close relationship between lodging resistance and R:S. Because lodging has important effects on yield, R:S becomes an important factor affecting seed yield. At the R7 stage, soybean plants begin to senesce, and almost all green color is lost from the seeds and pods. Soybean no longer needs to absorb more water and nutrients; therefore, root length and surface area are no longer important. In addition, soybean begins to enter the physiological maturity stage during this period [46], and lodging has little effect on yield, leading to the R:S value having little effect on the ultimate seed yield.

5. Conclusions

In this study, we analyzed the changes in some RTs of soybean varieties of different decades resulting from genetic breeding. Specifically, we first compared the differences in responses of RTs to increasing N fertilizer application levels among varieties and quantified the contributions of RTs to seed yield variation. A simple relationship between the investigated RTs and the release year showed that the size and function of the soybean root system have improved after decades of genetic selection. A medium FR resulted in stronger soybean variety root systems compared with those grown without fertilizer, and a higher FR generally inhibited the RTs of soybean from different decades. However, different varieties responded to high FR differently: the level of decrease in NV was less than in OV and MV, indicating that the tolerance to fertilizer stress of soybean RTs has improved. Seed yield increased due to long-term genetic improvement, and this enhancement was closely related to RT improvement. Root length at the R2 stage, R:S ratio at the R6 stage and root activity at the R7 stage were the most important factors controlling seed yield, contributing more than half of the seed yield variation among varieties. These contributions, however, are relative values because increased leaf photosynthesis also results in increased seed yield. Our conclusion provides new evidence for the close relationship between soybean yield and root traits and the different dependence extent of seed yield formation on root traits during different growth stages, thus having certain guiding significance for implementing targeted farmland management in different growth stages of soybean and more efficient genetic breeding in the future.

Supplementary Materials

The following supporting information can be downloaded at: https://www.mdpi.com/article/10.3390/agronomy14010002/s1, Figure S1: The genetic relationship of soybean cultivars test in this study. (The test cultivars are presented in bold type); Table S1: Information of soybean cultivars test in this study.

Author Contributions

Conceptualization, X.B.; Methodology, X.Y. All authors have read and agreed to the published version of the manuscript.

Funding

This study was funded by the Doctor Start-up Fund of Inner Mongolia Minzu University, China (BS495).

Data Availability Statement

The datasets generated during and/or analysed during the currentstudy are available from the corresponding author on reasonable request.

Conflicts of Interest

The authors declare no conflict of interest.

References

  1. Vogel, J.T.; Liu, W.; Olhoft, P.; Crafts-Brandner, S.J.; Pennycooke, J.C.; Christiansen, N. Soybean Yield Formation Physiology—A Foundation for Precision Breeding Based Improvement. Front. Plant Sci. 2021, 12, 719706. [Google Scholar] [CrossRef] [PubMed]
  2. Rincker, K.; Nelson, R.; Specht, J.; Sleper, D.; Cary, T.; Cianzio, S.R.; Casteel, S.; Conley, S.; Chen, P.; Davis, V.; et al. Genetic Improvement of U.S. Soybean in Maturity Groups II, III, and IV. Crop Sci. 2014, 54, 1419–1432. [Google Scholar] [CrossRef]
  3. Kahlon, C.S.; Board, J.E.; Kang, M.S. An Analysis of Yield Component Changes for New vs. Old Soybean Cultivars. Agron. J. 2011, 103, 13–22. [Google Scholar] [CrossRef]
  4. Qin, X.; Feng, F.; Li, D.; Herbert, S.J.; Liao, Y.; Siddique, K.H.M. Changes in yield and agronomic traits of soybean cultivars released in China in the last 60 years. Crop Pasture Sci. 2017, 68, 973–984. [Google Scholar] [CrossRef]
  5. Todeschini, M.H.; Milioli, A.S.; Rosa, A.C.; Dallacorte, L.V.; Panho, M.C.; Marchese, J.A.; Benin, G. Soybean genetic progress in South Brazil: Physiological, phenological and agronomic traits. Euphytica 2019, 215, 124. [Google Scholar] [CrossRef]
  6. Kumudini, S.; Hume, D.J.; Chu, G. Genetic Improvement in Short Season Soybeans: I. Dry Matter Accumulation, Partitioning, and Leaf Area Duration. Crop Sci. 2001, 41, 391–398. [Google Scholar] [CrossRef]
  7. Jin, J.; Liu, X.; Wang, G.; Mi, L.; Shen, Z.; Chen, X.; Herbert, S.J. Agronomic and physiological contributions to the yield improvement of soybean cultivars released from 1950 to 2006 in Northeast China. Field Crops Res. 2010, 115, 116–123. [Google Scholar] [CrossRef]
  8. Bao, X.; Li, Z.; Yao, X. Changes in photosynthetic traits and their responses to increasing fertilization rates in soybean (Glycine max (L.) Merr.) during decades of genetic improvement. J. Sci. Food Agric. 2021, 101, 4715–4723. [Google Scholar] [CrossRef]
  9. Koester, R.P.; Skoneczka, J.A.; Cary, T.R.; Diers, B.W.; Ainsworth, E.A. Historical gains in soybean (Glycine max Merr.) seed yield are driven by linear increases in light interception, energy conversion, and partitioning efficiencies. J. Exp. Bot. 2014, 65, 3311–3321. [Google Scholar] [CrossRef]
  10. Keep, N.; Schapaugh, W.; Prasad, P.; Boyer, J. Changes in Physiological Traits in Soybean with Breeding Advancements. Crop Sci. 2016, 56, 122–131. [Google Scholar] [CrossRef]
  11. Somerville, C.; Briscoe, J. Genetic Engineering and Water. Science 2001, 292, 2217. [Google Scholar] [CrossRef] [PubMed]
  12. Wasaya, A.; Zhang, X.; Fang, Q.; Yan, Z. Root Phenotyping for Drought Tolerance: A Review. Agronomy 2018, 8, 241. [Google Scholar] [CrossRef]
  13. Ordóñez, R.A.; Archontoulis, S.V.; Martinez-Feria, R.; Hatfield, J.L.; Wright, E.E.; Castellano, M.J. Root to shoot and carbon to nitrogen ratios of maize and soybean crops in the US Midwest. Eur. J. Agron. 2020, 120, 126130. [Google Scholar] [CrossRef]
  14. Fenta, B.A.; Beebe, S.E.; Kunert, K.J.; Burridge, J.D.; Barlow, K.M.; Lynch, J.P.; Foyer, C.H. Field Phenotyping of Soybean Roots for Drought Stress Tolerance. Agronomy 2014, 4, 418–435. [Google Scholar] [CrossRef]
  15. Yang, X.H.; Zhong, W.; Zhang, G. Evolution of root characters of soybean varieties of different ages. Sci. Agric. Sin. 2001, 34, 292–295, (In Chinese with English abstract). [Google Scholar]
  16. Jin, J.; Wang, G.; Liu, X.; Mi, L.; Li, Y.; Xu, Y.; Herbert, S.J. Genetic improvement of yield shapes the temporal and spatial root morphology of soybean (Glycine max) grown in north-east China. N. Z. J. Crop Hortic. Sci. 2010, 38, 177–188. [Google Scholar] [CrossRef]
  17. Cui, X.; Dong, Y.; Gi, P.; Wang, H.; Xu, K.; Zhang, Z. Relationship between root vigour, photosynthesis and biomass in soybean cultivars during 87 years of genetic improvement in the northern China. Photosynthetica 2016, 54, 81–86. [Google Scholar] [CrossRef]
  18. Caliskan, S.; Ozkaya, I.; Caliskan, M.; Arslan, M. The effects of nitrogen and iron fertilization on growth, yield and fertilizer use efficiency of soybean in a Mediterranean-type soil. Field Crops Res. 2008, 108, 126–132. [Google Scholar] [CrossRef]
  19. Salvagiotti, F.; Cassman, K.; Specht, J.; Walters, D.; Weiss, A.; Dobermann, A. Nitrogen uptake, fixation and response to fertilizer N in soybeans: A review. Field Crops Res. 2008, 108, 1–13. [Google Scholar] [CrossRef]
  20. Wang, S.Q.; Han, X.Z.; Qiao, Y.F.; Yan, J.; Xiao-Hui, L.I. Root morphology and nitrogen accumulation in soybean (Glycine max L.) under different nitrogen application levels: Root morphology and nitrogen accumulation in soybean (Glycine max L.) under different nitrogen application levels. Chin. J. Eco-Agric. 2009, 17, 1069–1073, (In Chinese with English abstract). [Google Scholar] [CrossRef]
  21. Gai, Z.; Zhang, J.; Li, C. Effects of starter nitrogen fertilizer on soybean root activity, leaf photosynthesis and grain yield. PLoS ONE 2017, 12, e0174841. [Google Scholar] [CrossRef] [PubMed]
  22. Saito, A.; Tanabata, S.; Tanabata, T.; Tajima, S.; Ueno, M.; Ishikawa, S.; Ohtake, N.; Sueyoshi, K.; Ohyama, T. Effect of Nitrate on Nodule and Root Growth of Soybean (Glycine max (L.) Merr.). Int. J. Mol. Sci. 2014, 15, 4464–4480. [Google Scholar] [CrossRef] [PubMed]
  23. Delfim, J.; Dameto, L.S.; Moraes, L.A.C.; Moreira, A. Nitrogen and Nickel Foliar Application on Grain yield, Yield Components, and Quality of Soybean. Commun. Soil Sci. Plant Anal. 2018, 53, 1226–1234. [Google Scholar] [CrossRef]
  24. McCoy, J.M.; Kaur, G.; Golden, B.R.; Orlowski, J.M.; Cook, D.R.; Bond, J.A.; Cox, M.S. Nitrogen Fertilization of Soybean Affects Root Growth and Nodulation on Two Soil Types in Mississippi. Commun. Soil Sci. Plant Anal. 2018, 49, 181–187. [Google Scholar] [CrossRef]
  25. Passioura, J.B. Roots and Drought Resistance. Dev. Agric. Manag. For. Ecol. 1983, 12, 265–280. [Google Scholar]
  26. Zhang, X.; Huang, G.; Bian, X.; Zhao, Q. Effects of root interaction and nitrogen fertilization on the chlorophyll content, root activity, photosynthetic characteristics of intercropped soybean and microbial quantity in the rhizosphere. Plant Soil Environ. 2013, 59, 80–88. [Google Scholar] [CrossRef]
  27. Poorter, H.; Niklas, K.J.; Reich, P.B.; Oleksyn, J.; Poot, P.; Mommer, L. Biomass allocation to leaves, stems and roots: Meta-analyses of interspecific variation and environmental control. New Phytol. 2012, 193, 30–50. [Google Scholar] [CrossRef]
  28. Fehr, W.R.; Caviness, C.E. Stages of Soybean Development; Iowa State University: Ames, IA, USA, 1977. [Google Scholar]
  29. Wang, H.; Inukai, Y.; Yamauchi, A. Root Development and Nutrient Uptake. Crit. Rev. Plant Sci. 2006, 25, 279–301. [Google Scholar] [CrossRef]
  30. Eissenstat, D.M. Costs and benefits of constructing roots of small diameter. J. Plant Nutr. 1992, 15, 763–782. [Google Scholar] [CrossRef]
  31. Noulas, C.; Liedgens, M.; Stamp, P.; Alexiou, I.; Herrera, J.M. Subsoil root growth of field grown spring wheat genotypes (Triticum aestivum L.) differing in nitrogen use efficiency parameters. J. Plant Nutr. 2010, 33, 1887–1903. [Google Scholar] [CrossRef]
  32. Tian, P.Z. Ecotypes of root system in soybean cultivars. Acta Agron. Sin. 1984, 10, 173–177, (In Chinese with English abstract). [Google Scholar]
  33. Robinson, D. Root proliferation, nitrate inflow and their carbon costs during nitrogen capture by competing plants in patchy soil. Plant Soil 2001, 232, 41–50. [Google Scholar] [CrossRef]
  34. Fan, Y.; Miguez-Macho, G.; Jobbágy, E.G.; Jackson, R.B.; Otero-Casal, C. Hydrologic regulation of plant rooting depth. Proc. Natl. Acad. Sci. USA 2017, 114, 10572–10577. [Google Scholar] [CrossRef] [PubMed]
  35. Gao, X.-B.; Guo, C.; Li, F.-M.; Li, M.; He, J. High Soybean Yield and Drought Adaptation Being Associated with Canopy Architecture, Water Uptake, and Root Traits. Agronomy 2020, 10, 608. [Google Scholar] [CrossRef]
  36. He, J.; Du, Y.-L.; Wang, T.; Turner, N.C.; Yang, R.-P.; Jin, Y.; Xi, Y.; Zhang, C.; Cui, T.; Fang, X.-W.; et al. Conserved water use improves the yield performance of soybean (Glycine max (L.) Merr.) under drought. Agric. Water Manag. 2017, 179, 236–245. [Google Scholar] [CrossRef]
  37. Leghari, S.J.; Wahocho, N.A.; Laghari, G.M.; Laghari, A.H.; Lashari, A.A. Role of Nitrogen for Plant Growth and Development: A review. Adv. Environ. Biol. 2016, 10, 209–218. [Google Scholar]
  38. Wang, X.W.; Yan, C.; Wan, T.; Ma, C.M.; Gong, Z.P.; Dong, S.K. Effects of nitrogen application on yield and photosynthesis in soybean. Crops 2011, 141, 49–52, (In Chinese with English abstract). [Google Scholar]
  39. Kubar, M.S.; Shar, A.H.; Kubar, K.A.; Rind, N.A.; Ullah, H.; Kalhoro, S.A.; Wang, C.; Feng, M.; Gujar, A.; Sun, H.; et al. Optimizing nitrogen supply promotes biomass, physiological characteristics and yield components of soybean (Glycine max L. Merr.). Saudi J. Biol. Sci. 2021, 28, 6209–6217. [Google Scholar] [CrossRef]
  40. Sinclair, T. Water and nitrogen limitations in soybean grain production I. Model development. Field Crops Res. 1986, 15, 125–141. [Google Scholar] [CrossRef]
  41. Bonifas, K.D.; Lindquist, J.L. Effects of Nitrogen Supply on the Root Morphology of Corn and Velvetleaf. J. Plant Nutr. 2009, 32, 1371–1382. [Google Scholar] [CrossRef]
  42. Streeter, J.; Wong, P.P. Inhibition of legume nodule formation and N2 fixation by nitrate. Crit. Rev. Plant Sci. 1988, 7, 1–23. [Google Scholar] [CrossRef]
  43. Gibson, A.H.; Harper, J.E. Nitrate Effect on Nodulation of Soybean by Bradyrhizobium japonicum. Crop Sci. 1985, 25, 497–501. [Google Scholar] [CrossRef]
  44. Hébert, Y.; Guingo, E.; Loudet, O. The Response of Root/Shoot Partitioning and Root Morphology to Light Reduction in Maize Genotypes. Crop Sci. 2001, 41, 363–371. [Google Scholar] [CrossRef]
  45. Rogers, H.H.; Prior, S.A.; Runion, G.B.; Mitchell, R.J. Root to shoot ratio of crops as influenced by CO2. Plant Soil 1995, 187, 229–248. [Google Scholar] [CrossRef]
  46. Nleya, T.; Sexton, P.; Gustafson, K.; Miller, J.M. Soybean growth stages. In IGrow Soybean: Best Management Practices for Soybean Production; Clay, D.E., Carlson, C.G., Clay, S.A., Wagner, L., Deneke, D., Hay, C., Eds.; South Dakota State University, SDSU Extension: Brookings, SD, USA, 2013. [Google Scholar]
  47. Cooper, R.L. Influence of Early Lodging on Yield of Soybean [Glycine max (L.) Merr.]. Agron. J. 1971, 63, 449–450. [Google Scholar] [CrossRef]
  48. Woods, S.J.; Swearingin, M.L. Influence of Simulated Early Lodging upon Soybean Seed Yield and its Components1. Agron. J. 1977, 69, 239–242. [Google Scholar] [CrossRef]
  49. Stoffella, P.J.; Kahn, B.A. Root System Effects on Lodging of Vegetable Crops. HortScience 1986, 21, 960–963. [Google Scholar] [CrossRef]
Figure 1. Comparisons of soybean root traits (a), root length; (b), root surface area; (c), root hair number; (d), R:S; and (e), root activity at different growth stages under no fertilization condition. R:S, root−to−shoot ratio. OV, old variety group, MV, middle variety group, NV, new variety group. Mean values of 2 years are presented.
Agronomy 14 00002 g001
Figure 2. The effects of N fertilizer on RTs of soybean (a), root length; (b), root surface area; (c), root hair number; (d), R:S; and (e), root activity at different growth stages. Difference I indicates the change rate (%) in RTs under the medium FR (1.1 g pot−1) treatment compared with the no fertilizer treatment. All the differences were significant at the 0.05 level. OV, old variety group, MV, middle variety group, NV, new variety group. Mean values of 2 years are presented.
Agronomy 14 00002 g002
Figure 3. The effects of N fertilizer on RTs of soybean (a), root length; (b), root surface area; (c), root hair number; (d), R:S; and (e), root activity, at different growth stages. Difference II indicates the change rate (%) in RTs under the high FR (2.2 g pot−1) treatment compared with the no fertilizer treatment. * indicates the difference in an RT value between the two FRs was significant at the 0.05 level. OV, old variety group, MV, middle variety group, NV, new variety group. Mean values of 2 years are presented.
Agronomy 14 00002 g003
Figure 4. Responses of seed yield to fertilization rates (FRs) for soybean varieties released in different years.OV, old variety group, MV, middle variety group, NV, new variety group. Mean values of 2 years are presented. Different letters above the columns indicate significant differences among the three FR treatments at the p < 0.05 level.
Agronomy 14 00002 g004
Figure 5. Changes in simulated seed yield (per plant) values with and without artificial interference on the affecting variables (root traits). The interference analysis was based on multiple linear regression models: seed yield = 5.23 × 10⁻⁵ root length + 0.002 root surface area + 0.0001 root hair number–1.17 (r2 = 0.90), seed yield = 0.027 root activity + 0.002 root surface area + 8.3 R:S–0.38 (r2 = 0.92), and seed yield = 0.001 root hair number + 0.069 root activity–1.16 (r2 = 0.91) in the R2 (a), R6 (b) and R7 (c) stages, respectively. Records indicate a random series of samples. Mean values of 2 years are presented.
Agronomy 14 00002 g005
Figure 6. Contributions of different root traits during different growth stages to variations in seed yield (per plant) of the test soybean varieties. (a), R2 stage, (b), R6 stage, (c), R7 stage. R:S, root-to-shoot ratio. Mean values of 2 years are presented.
Agronomy 14 00002 g006
Table 1. Analyses of variance of root traits (RTs), maturity and seed yields of soybean evaluated in 2013 and 2014.
Source of
Variations
Root TraitsYFR VDY × FRY × VY × DFR × V
Root length612.38 ns1352.39 **169.99 **408.09 **55.54 ns194.36 ns56.73 ns111.5 **
Root surface area435.68 ns663.14 **309.13 *159.30 **39.3 ns64.29 ns13.42 ns62.15 *
Root hair number1008.43 ns853.21 **324.18 **1664.35 *141.08 ns17.5 ns74.48 ns5.95 **
R:S464.3 ns647.57 **402.1 **253.15 *19.8 ns120.1 ns29.43 ns51.5 **
Root activity618.37 ns205.31 ***1113.3 *398.38 *69.41 ns79.12 ns51.39 ns184.75 *
Seed yield per plant1065.22 ns282.49 **439.09 **/57.13 ns112.12 ns/37.10 **
FR × DV × DY × FR × VY × FR × DY × V × DFR × V × DY × FR × V × DError
Root length12.89 ns109.42 *198.35 ns92.42 *108.37 *57.37 **90.36 ns27.86
Root area83.24 *57.63 **38.30 **62.38 ns106.39 *78.43 *46.54 *20.47
Root hair number47.54 ns18.45 ns174.34 **74.38 ns87.53 ns55.32 **22.54 ns15.24
R:S17.54 **197.47 ***21.64 ns83.73 *93.4 *28.49 *79.21 *11.42
Root activity30.26 *102.02 ns15.37 ns33.2 ns6.44 ns84.12 **32.37 ns27.6
Seed yield per plant//45.64 ns////16.73
*, ** and *** indicate significance at the 0.05, 0.01 and 0.001 level, respectively; ns, not significant at the p < 0.05 level; RT, root trait; FR, N fertilization rate; R:S, root–shoot ratio; Y, year; V, variety; D, sampling date.
Table 2. Statistic characteristics of the relationships between RTs of soybean and the year of variety release under three FRs.
Root TraitsFR
0 (g pot−1) 1.1 (g pot−1) 2.2 (g pot−1)
Regression EquationR2Regression EquationR2Regression EquationR2
Root length (cm)y = 250.65x − 485,1270.80 **y = 241.95x − 465,234.60.76 **y = 261.35x − 435,009.190.71 **
Root surface area (cm2)y = 23.05x − 43,542.270.75 **y = 21.52x − 40,241.340.70 **y = 27.54x − 52,422.230.69 **
Root hair numbery = 0.0548 exp (0.0066x)0.65 **y = 183.43x − 335,951.430.67 **y = 0.0049 exp (0.0078x)0.87 **
R:Sy = 0.0016x − 2.94320.78 **y = 10−8 exp 0.0083x0.69 **y = 0.0026x − 4.97680.76 **
Root activity (μg TTF·g−1 FW·h−1)y = 0.7589x − 1434.30.67 **y = 10−3 exp 0.0132x0.75 **y = 1.6165x − 3139.50.85 **
** indicates significance at the 0.01 level. R2, determination coefficient; FR, fertilization application rate. R:S, root–shoot ratio. The analysis data were the averaged values of R2 to R7 growth stages. The relationships of values of root length, root surface area, root hair numbers, root activity at the full seed stage and R:S at the initial flowering stage are presented. Mean values from 2 years were used to construct the equations.
Disclaimer/Publisher’s Note: The statements, opinions and data contained in all publications are solely those of the individual author(s) and contributor(s) and not of MDPI and/or the editor(s). MDPI and/or the editor(s) disclaim responsibility for any injury to people or property resulting from any ideas, methods, instructions or products referred to in the content.

