Article

Early Detection of Potential Infestation by Capnodis tenebrionis (L.) (Coleoptera: Buprestidae), in Stone and Pome Fruit Orchards, Using Multispectral Data from a UAV

by
Evaggelia Arapostathi
1,
Christina Panopoulou
1,
Athanasios Antonopoulos
2,
Anastasios Katsileros
3,
Konstantinos Karellas
1,
Christos Dimopoulos
4 and
Antonios Tsagkarakis
1,2,4,*
1
Laboratory of Agricultural Zoology and Entomology, Agricultural University of Athens, 118 55 Athina, Greece
2
Laboratory of Sericulture and Apiculture, Agricultural University of Athens, 118 55 Athina, Greece
3
Laboratory of Plant Breeding and Biometry, Agricultural University of Athens, 118 55 Athina, Greece
4
Department of Computer Science and Engineering, European University of Cyprus, Nicosia 2404, Cyprus
*
Author to whom correspondence should be addressed.
Agronomy 2024, 14(1), 20; https://doi.org/10.3390/agronomy14010020
Submission received: 4 December 2023 / Revised: 15 December 2023 / Accepted: 19 December 2023 / Published: 21 December 2023
(This article belongs to the Section Precision and Digital Agriculture)

Abstract

:
Wood-boring insect pests pose a significant threat to orchards, potentially leading to tree mortality. In the initial stages of infestation, no visible symptoms are apparent, but as infestations progress, rapid and widespread symptoms emerge, resulting in accelerated tree decline. Therefore, the timely detection of early wood-boring insect symptoms is critical for effective pest control, necessitating advanced methods such as remote sensing. In this study, remote sensing is utilized to identify the early symptoms of peach flatheaded root borer (PFRB) infestation in trees. A multispectral sensor attached to a UAV captures aerial imagery data from stone fruit and pome fruit orchards. These data undergo processing in photogrammetric and GIS programs, where NDVI, NDRE, and the tree crown area are computed. On-site observations confirm PFRB infestations. Various machine-learning models, including logistic regression (LR), artificial neural network (NN), random forest (RF), and extreme gradient boosting (XGBoost), are compared using mean NDVI values, mean NDRE values, crown area, mean temperature, and mean relative humidity. Mean NDVI values emerge as the most crucial factor for predicting PFRB infestation across all machine-learning models. The XGBoost model proves the most effective, achieving an accuracy of 0.85, with marginal variations from the other tested models.

1. Introduction

Buprestidae is a family within the order of Coleoptera that includes mainly wood-boring species, which feed on the vascular bundles of the plants. Some species feed on the phloem, while others on the xylem of the plants; either way, their eating habits result in blocking the transportation of plants’ nutrients and water, leading to the withering and death of the infested trees [1,2]. Young trees in the nursery are more susceptible to attacks by these pests as well as the weakened or already diseased trees [2,3,4]. The peach flatheaded root borer (PFRB), Capnodis tenebrionis Linnaeus (Coleoptera: Buprestidae), is one of the main representatives of this family, which prefer to attack cultivated trees, such as stone fruit and pome fruit trees [4]. This pest is present in Central Europe, the Mediterranean region, and the Middle East [4,5,6]. It overwinters as larva inside the tree, and emerges as an adult in spring, feeding on the buds, the stalk of the leaves, and the bark of the small branches. The adults lay eggs in soil cracks, under stones close to the trunk, or in bark crevices [4,5], and the newly hatched larvae immediately bore through the bark to feed on the phloem layer [3,4,5]. When larvae complete their development, they pupate in the tunnels. Usually, the life cycle of the insect lasts from one to two years [2].
The damage to the vascular bundles of the trees by the activity of the larvae causes a decrease in photosynthetic capacity, which gradually leads to decline and in many cases, the death of the trees. Even the death of an adult tree may occur within two years [4,5,7]. Yellow leaves, dry branches, bark injuries produced by the activity of the larvae, expulsion of sap oozes and larval frass from the produced cracks, and adult emergence holes on the trunk and the branches of the tree during spring are only a few of the symptoms that indicate the presence of this kind of pest [2]. Unlike more apparent harm caused by other tree pests, the effects of PFRB presence are manifested as delayed symptoms, becoming evident in the middle and late stages of infestation. Consequently, there is a critical necessity for early detection tools for PFRB damage. Detecting the infestation early enhances the efficacy of treatment, as highlighted by [8]. In this context, remote sensing has emerged as a viable option for both small- and large-scale monitoring. Monitoring a crop remotely has some noteworthy advantages. First of all, a map of the area of interest can be generated with remote sensing data, easily giving the agronomist a view of the orchard and in a short period of time. This map helps the expert to choose candidate zones or plants of the orchard that need to be visited for more thorough inspection [9,10,11]. Furthermore, depending on the sensor that is used, it is feasible to detect the infestation in early stages, even before the occurrence of visible symptoms, such as in the case of wood-eating pests [9,10]. Last but not least, according to the report of the United Nations, remote sensing secures food safety, and therefore consumers’ safety, as well as the protection of the environment, because the use of plant protection products is significantly reduced due to more targeted treatment of the infested plants [9].
Remote sensing is the detection and measurement of the electromagnetic radiation of the sun, which is reflected by objects—such as plants, soil, and buildings—from a distance (by a satellite or a UAS) [9,12]. A few of its applications in agriculture include crop health monitoring, soil fertility monitoring, estimation of crop yield, irrigation equipment monitoring, and identification of invasive species of weed [10,13]. Crop health monitoring is based on the fact that stressed plants have a different spectral signature than healthy ones [14]. Normally, healthy vegetation absorbs 70–90% of the radiation of the visible spectrum (400–700 nm, or photosynthetic active radiation, PAR) [9,14]. More specifically, radiation of the blue and red bands of the visible spectrum is used in photosynthesis by the leaves, while radiation of the green band is mostly reflected by chlorophylls of the leaves. The large amount of NIR (near-infrared) radiation is also reflected by the healthy leaves (Figure 1). On the contrary, stressed vegetation absorbs a smaller amount of blue and red radiation and at the same time, the reflection of green and NIR radiation is lower, mainly due to the fact that chlorophylls and many cell structures of the leaves have been destroyed. Vegetation indices combine the reflectance of the spectral bands; thus, they provide information on the health of crops [14].
The most common index used to detect plant stress is the Normalized Difference Vegetation Index (NDVI) which combines the reflectance in the NIR and red bands of radiation but presents some limitations [9,10,13,15]. More specifically, at very high concentrations of chlorophyll, this index saturates so that its value does not change with subtle changes in its concentration. Another important index that was used in this study is the Normalized Difference Red Edge Index (NDRE), which combines the reflectance in the NIR and the red edge bands of the spectrum. The red edge band is a particularly important region of the spectrum around 700 nm (690–740 nm), between the red band of the spectrum (660–680 nm) and the NIR band (700–1400 nm), which is associated with the concentration of chlorophyll [9,15]. It is a zone of high interest for detecting plant stress at an early stage because it is part of the spectrum where the reflectance increases sharply from the strong red absorption zone to the strong near-infrared (NIR) reflection zone. For this reason, the NDRE index is very sensitive to changes that occur in chlorophyll concentration [15].
In the current study, airborne data were collected from the orchards of the Agricultural University of Athens with a multispectral camera, which was attached to a UAV, and they were validated with the data that were collected in the field. The main purpose of this study was to determine whether remote sensing imagery data could detect infestations of PFRB early in stone and pome fruit trees through a machine-learning model in the R programming language.

2. Materials and Methods

The flights took place during 2021, 2022, and 2023 in the orchards of the Agricultural University of Athens, with simultaneous on-site observations on the same dates.

2.1. Flight Schedule

Six UAV flights were conducted in total in stone fruit and pome fruit orchards during May and September of 2021, July and September of 2022, as well as June and September of 2023.
These dates were selected based on the biological cycle of C. tenebrionis. Specifically, these flights were scheduled to coincide with the beginning of summer, a period when the insect has completed its adulthood and the adults are very active. During this time, the infested trees typically do not exhibit severe stress symptoms. During the summer, while the wood-boring larvae are active, there is a gradual interruption in the flow of the ascending and descending sap. Consequently, at the beginning of autumn, the trees tend to exhibit more pronounced weakening and potential drying symptoms. The collection of multispectral data during these critical stages of the growing season allows for the monitoring of the distribution of the pest in the field and the assessment of the severity of the infestation.
All flights were conducted around 13:00, when the sun is directly above the trees, ensuring optimal lighting conditions while minimizing unwanted shadows that could potentially corrupt the data. This approach guarantees maximum accuracy and reliability in the acquisition of multispectral information. Furthermore, scheduling flights during midday hours is advantageous as this timeframe aligns with the heat peak of the day, thereby enhancing the exhibition of stress symptoms on the trees.

2.2. Flight Materials

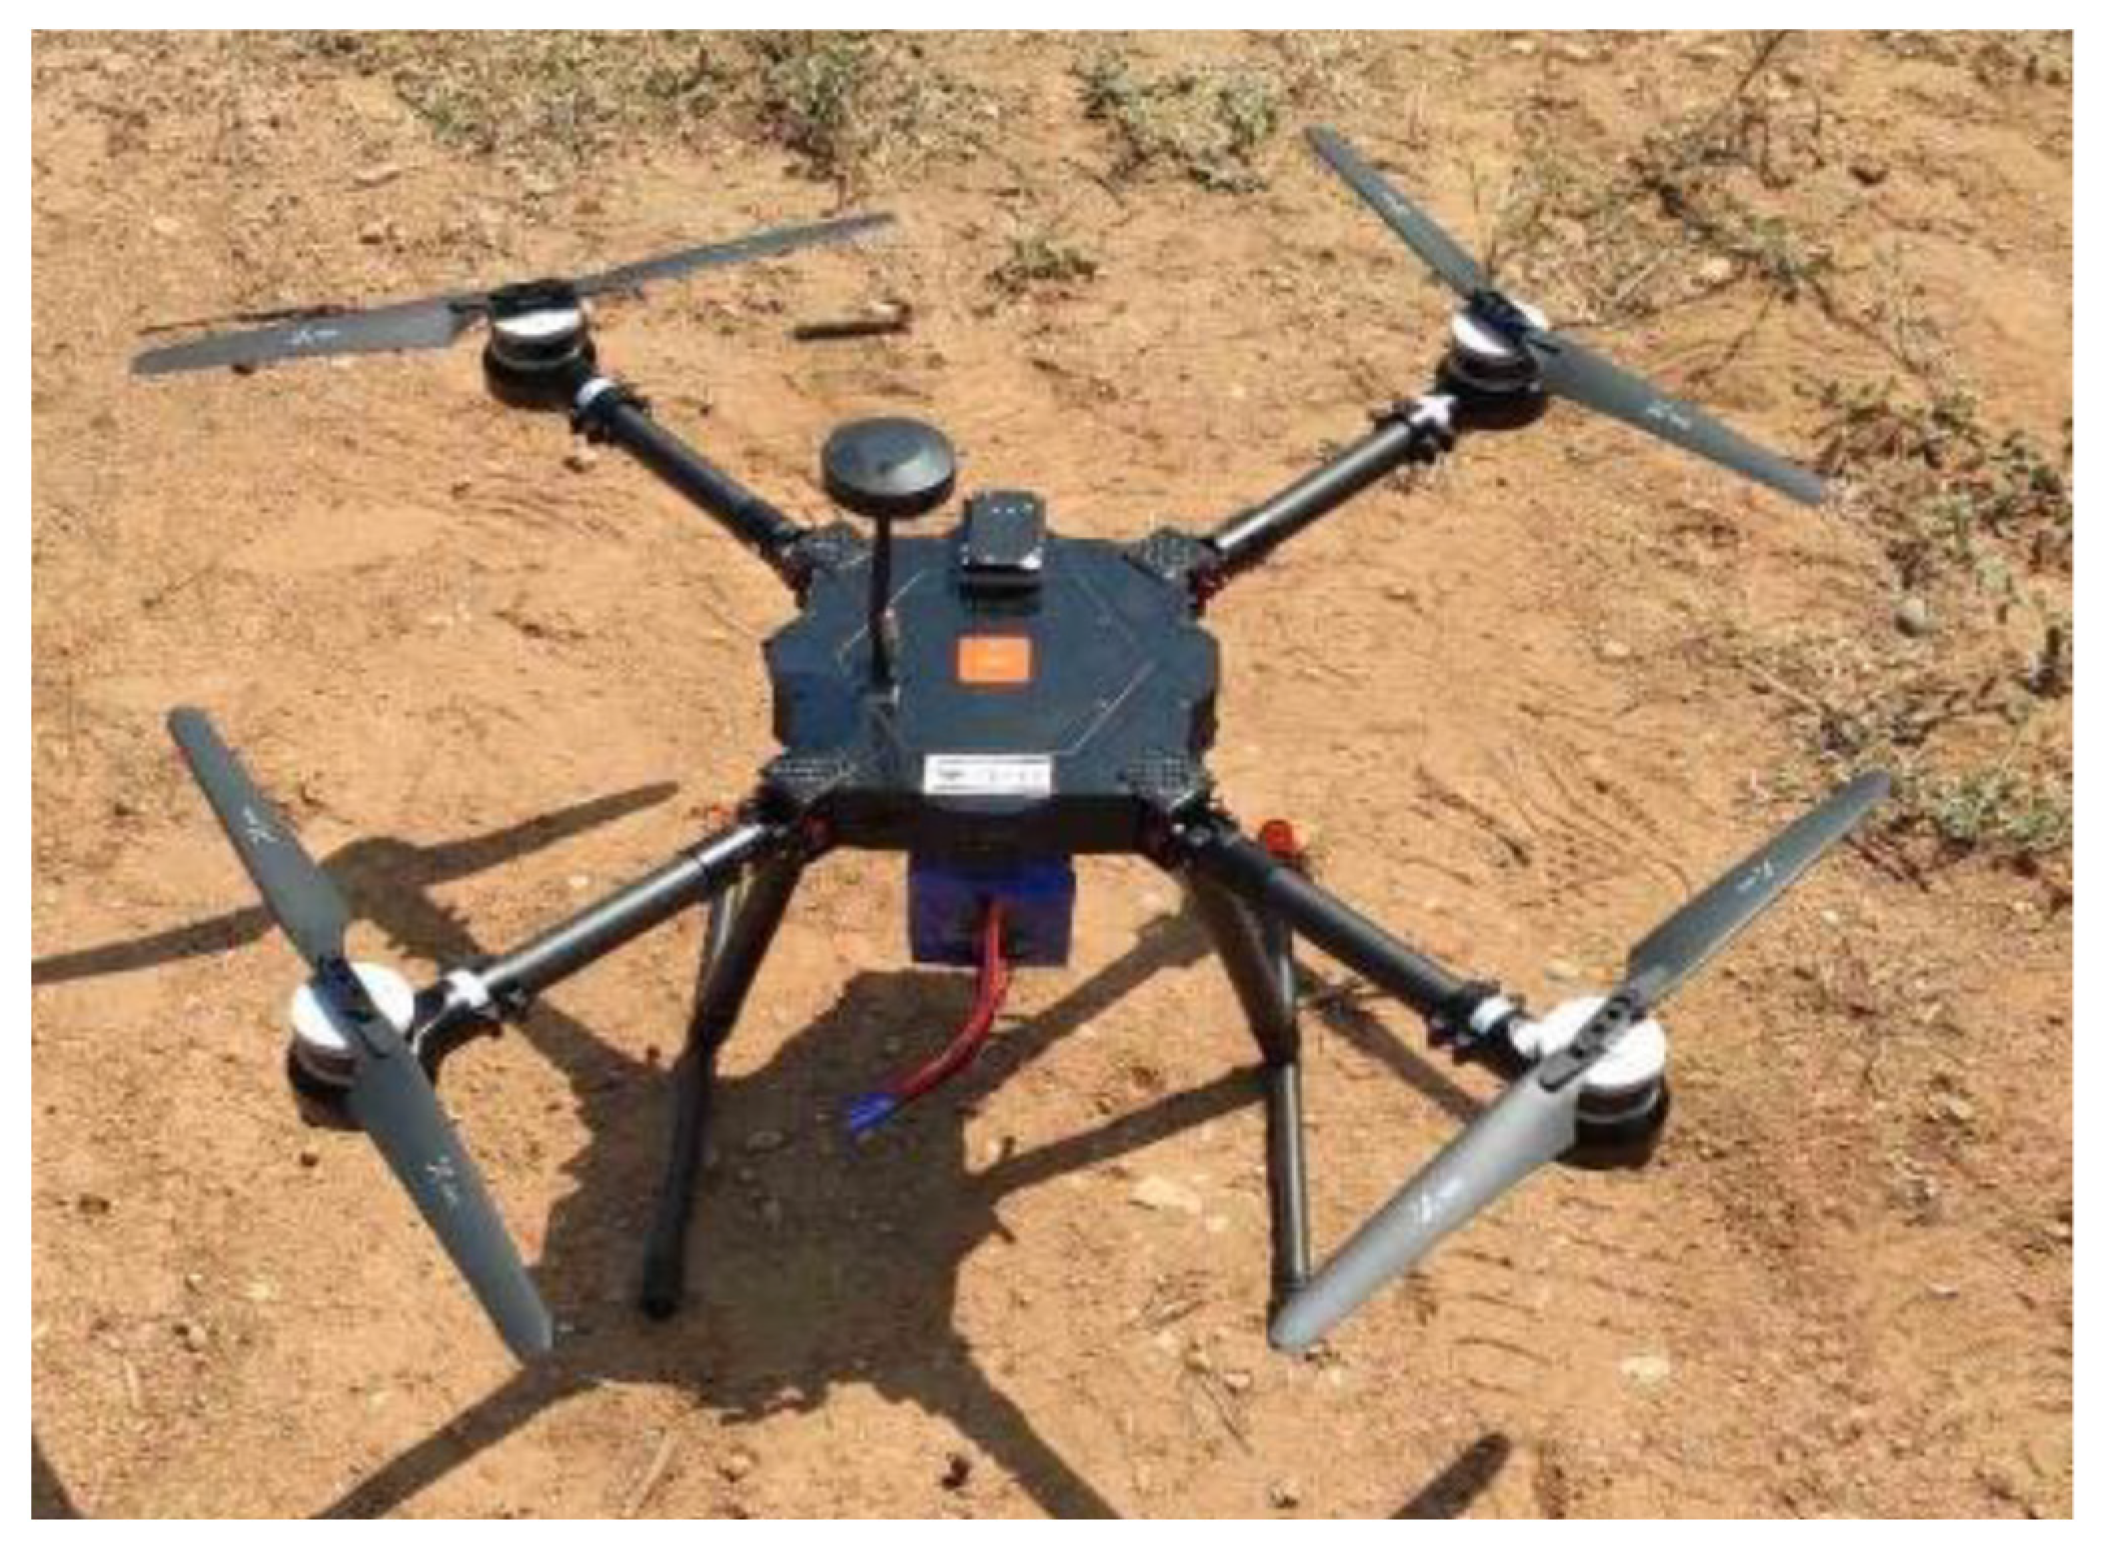
The flights were performed with Mera quadcopter (UcanDrone S.A., Koropi Attica, Greece), an EASA flying Class C2 drone (Figure 2). All the flight missions were designed and executed in the Mission Planner program (Version 1.3.76) (ArduPilot Development Team, New York, NY, USA).
The multispectral RedEdge MX camera (AgEagle Aerial Systems Inc., Wichita, KS, USA) was attached to the Mera UAV. This camera has a weight of 231.9 g and is equipped with a Downwelling Light Sensor 2 (DLS 2). The DLS 2 sensor enhances the reflectance calibration under varying lighting conditions during the flights. The RedEdge MX camera is equipped with a Global Shutter System, allowing all pixels of the multispectral sensor to be simultaneously exposed to light. This camera utilizes five distinct spectral bands: blue (centered at 475 nm), green (centered at 560 nm), red (centered at 668 nm), red edge (centered at 717 nm), and near-infrared (NIR, centered at 842 nm). Additionally, the RedEdge MX camera offers a high spatial resolution, with a ground sampling distance (GSD) of 8 cm per side of a pixel, when operated at a height of 120 m above the ground level.

2.3. Flight Parameters

Utilizing the Mission Planner program (Version 1.3.76), the flight parameters were configured for all of the flights. The parameters of the flight were the following: flight altitude of 70 m, flight speed of 5 m/s, and image forward and side overlap of 80% [16,17]. This percentage of overlap was chosen in order to minimize potential data loss during the image acquisition. The RedEdge MX camera was programmed to capture multispectral images every 2 s. The flight path for these missions was precisely delineated by establishing concrete waypoints on the map, with the corresponding data being transmitted to the UAV autopilot. All of the flights were executed by a certified pilot of the A2 category, under the prevailing legislation; thus, the flight operations were meticulously executed in strict accordance with the regulatory guidelines.

2.4. Multispectral Data Processing

For the processing of the image data, Metashape (Version 1.7.3) (Agisoft LLC., St. Petersburg, Russia) and QGIS (Version 3.32.0) (QGIS Development Team, London, UK) software were used.
The first step of the image processing was the alignment of the photos. During this step, the software automatically identifies common features among the images, allowing for the precise calculation of their relative positions and orientations both in relation to one another and within the spatial context, generating a sparse point cloud. The aligned images serve as the fundamental dataset for generating the dense point cloud, which is the second stage of image processing. The dense point cloud essentially represents the spatial information of the target area in three dimensions, denoted by X, Y, and Z coordinates of the individual points.
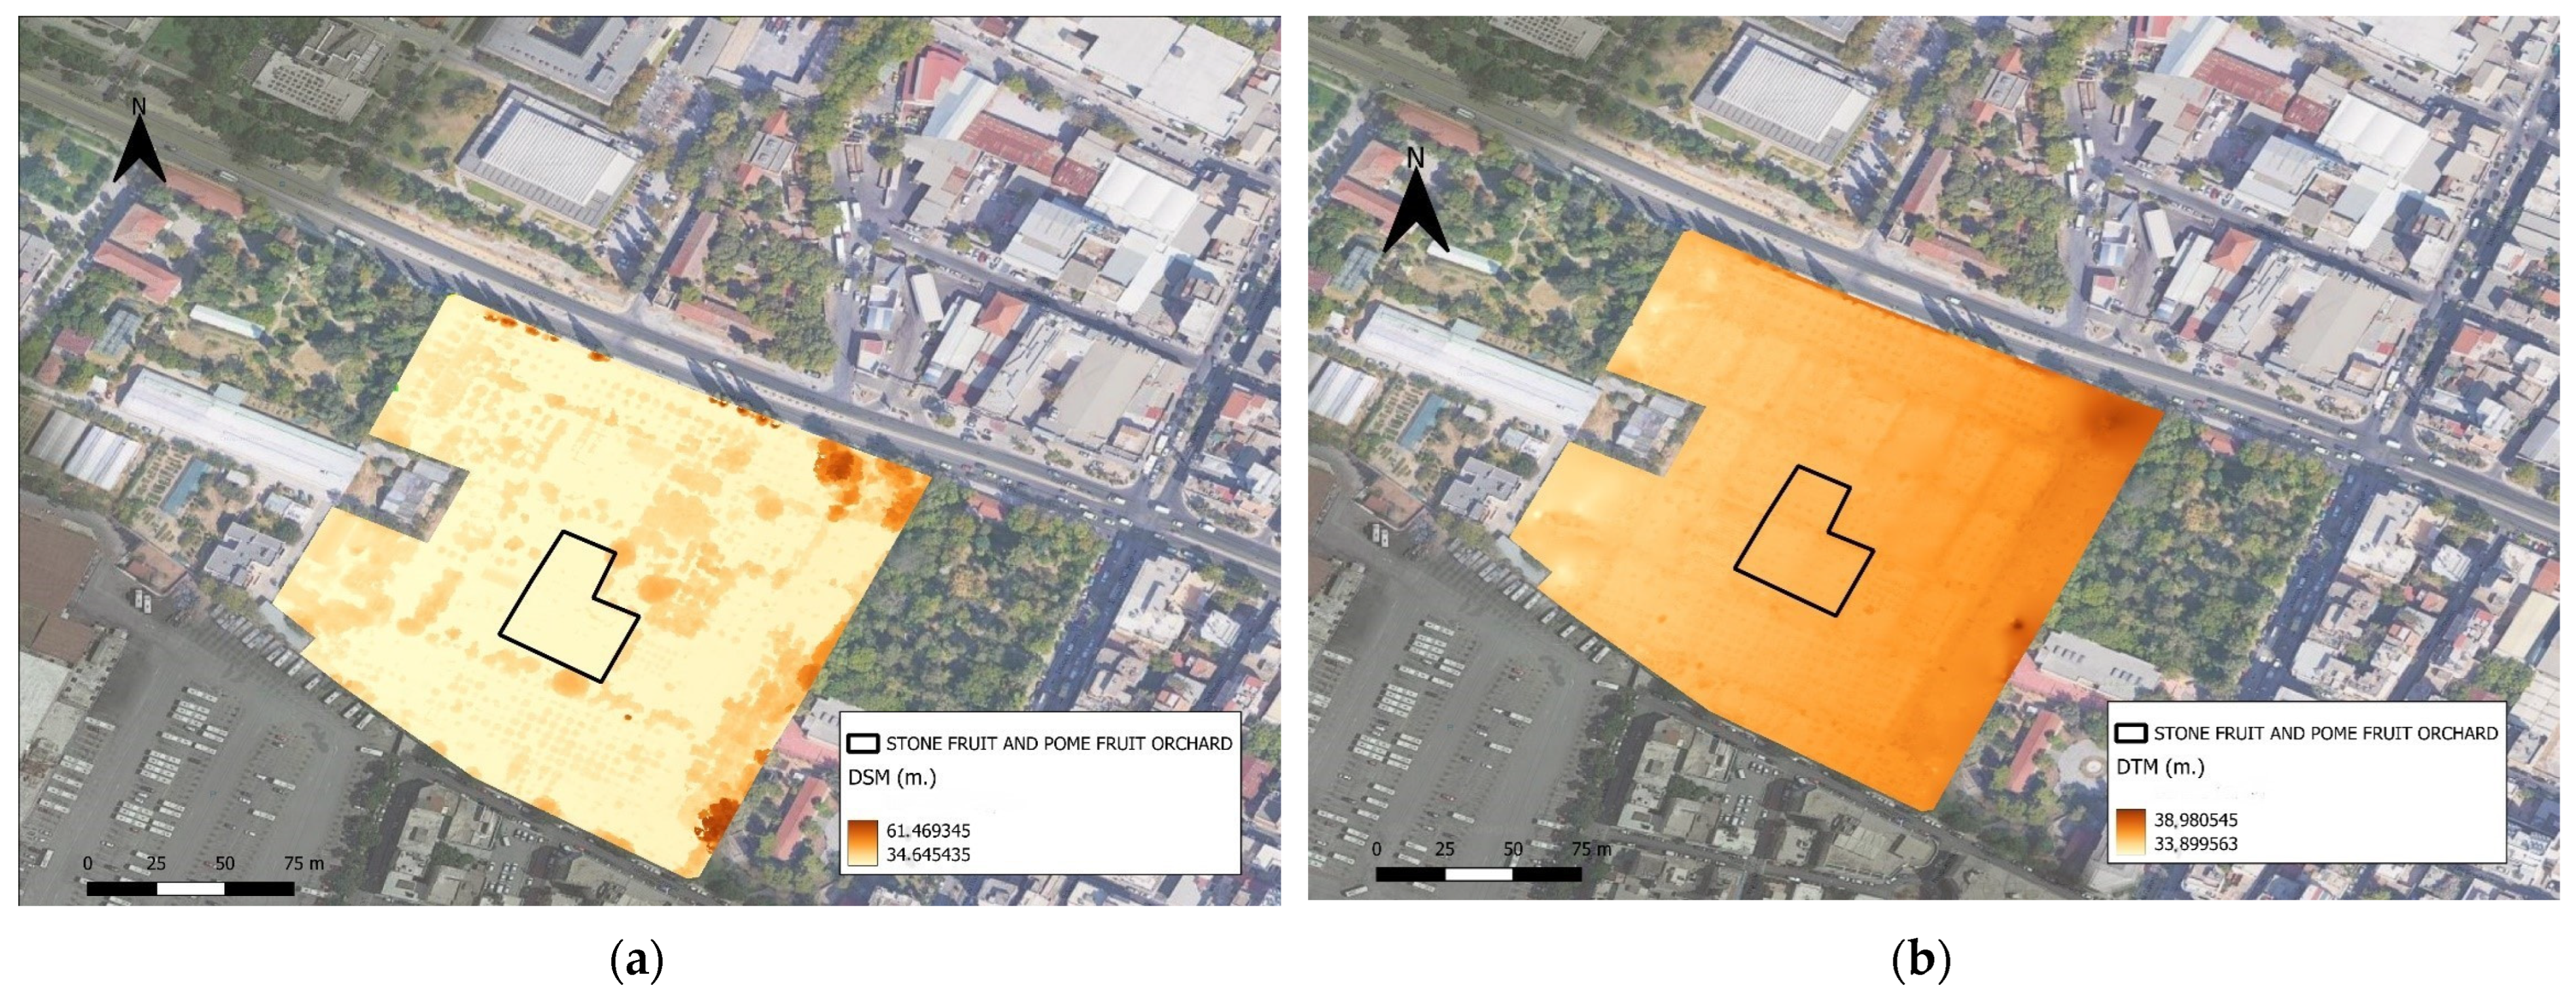
Generated from the dense point cloud, the next phase involved the creation of the digital surface model (DSM). The DSM is a comprehensive representation of the Earth’s surface, encompassing all reflective elements, whether natural or man-made. These elements include vegetation, water bodies, buildings, roads, bridges, and more. The DSM serves as a depiction of the Earth’s topography, providing elevation data for both terrestrial and aquatic features, as well as vegetative and man-made components. Additionally, each pixel of the DSM is embedded with georeferencing, enhancing its geographical and spatial accuracy.
Utilizing the dense point cloud once more, the digital terrain model (DTM) was generated, which delineates the Earth’s surface, providing elevation information pertaining to the topographic features, excluding both natural vegetation and man-made structures. This model represents the elevation characteristics of the bare terrain while imparting additional topographical information, including slope, orientation, and both the horizontal and vertical curvature of the terrain.
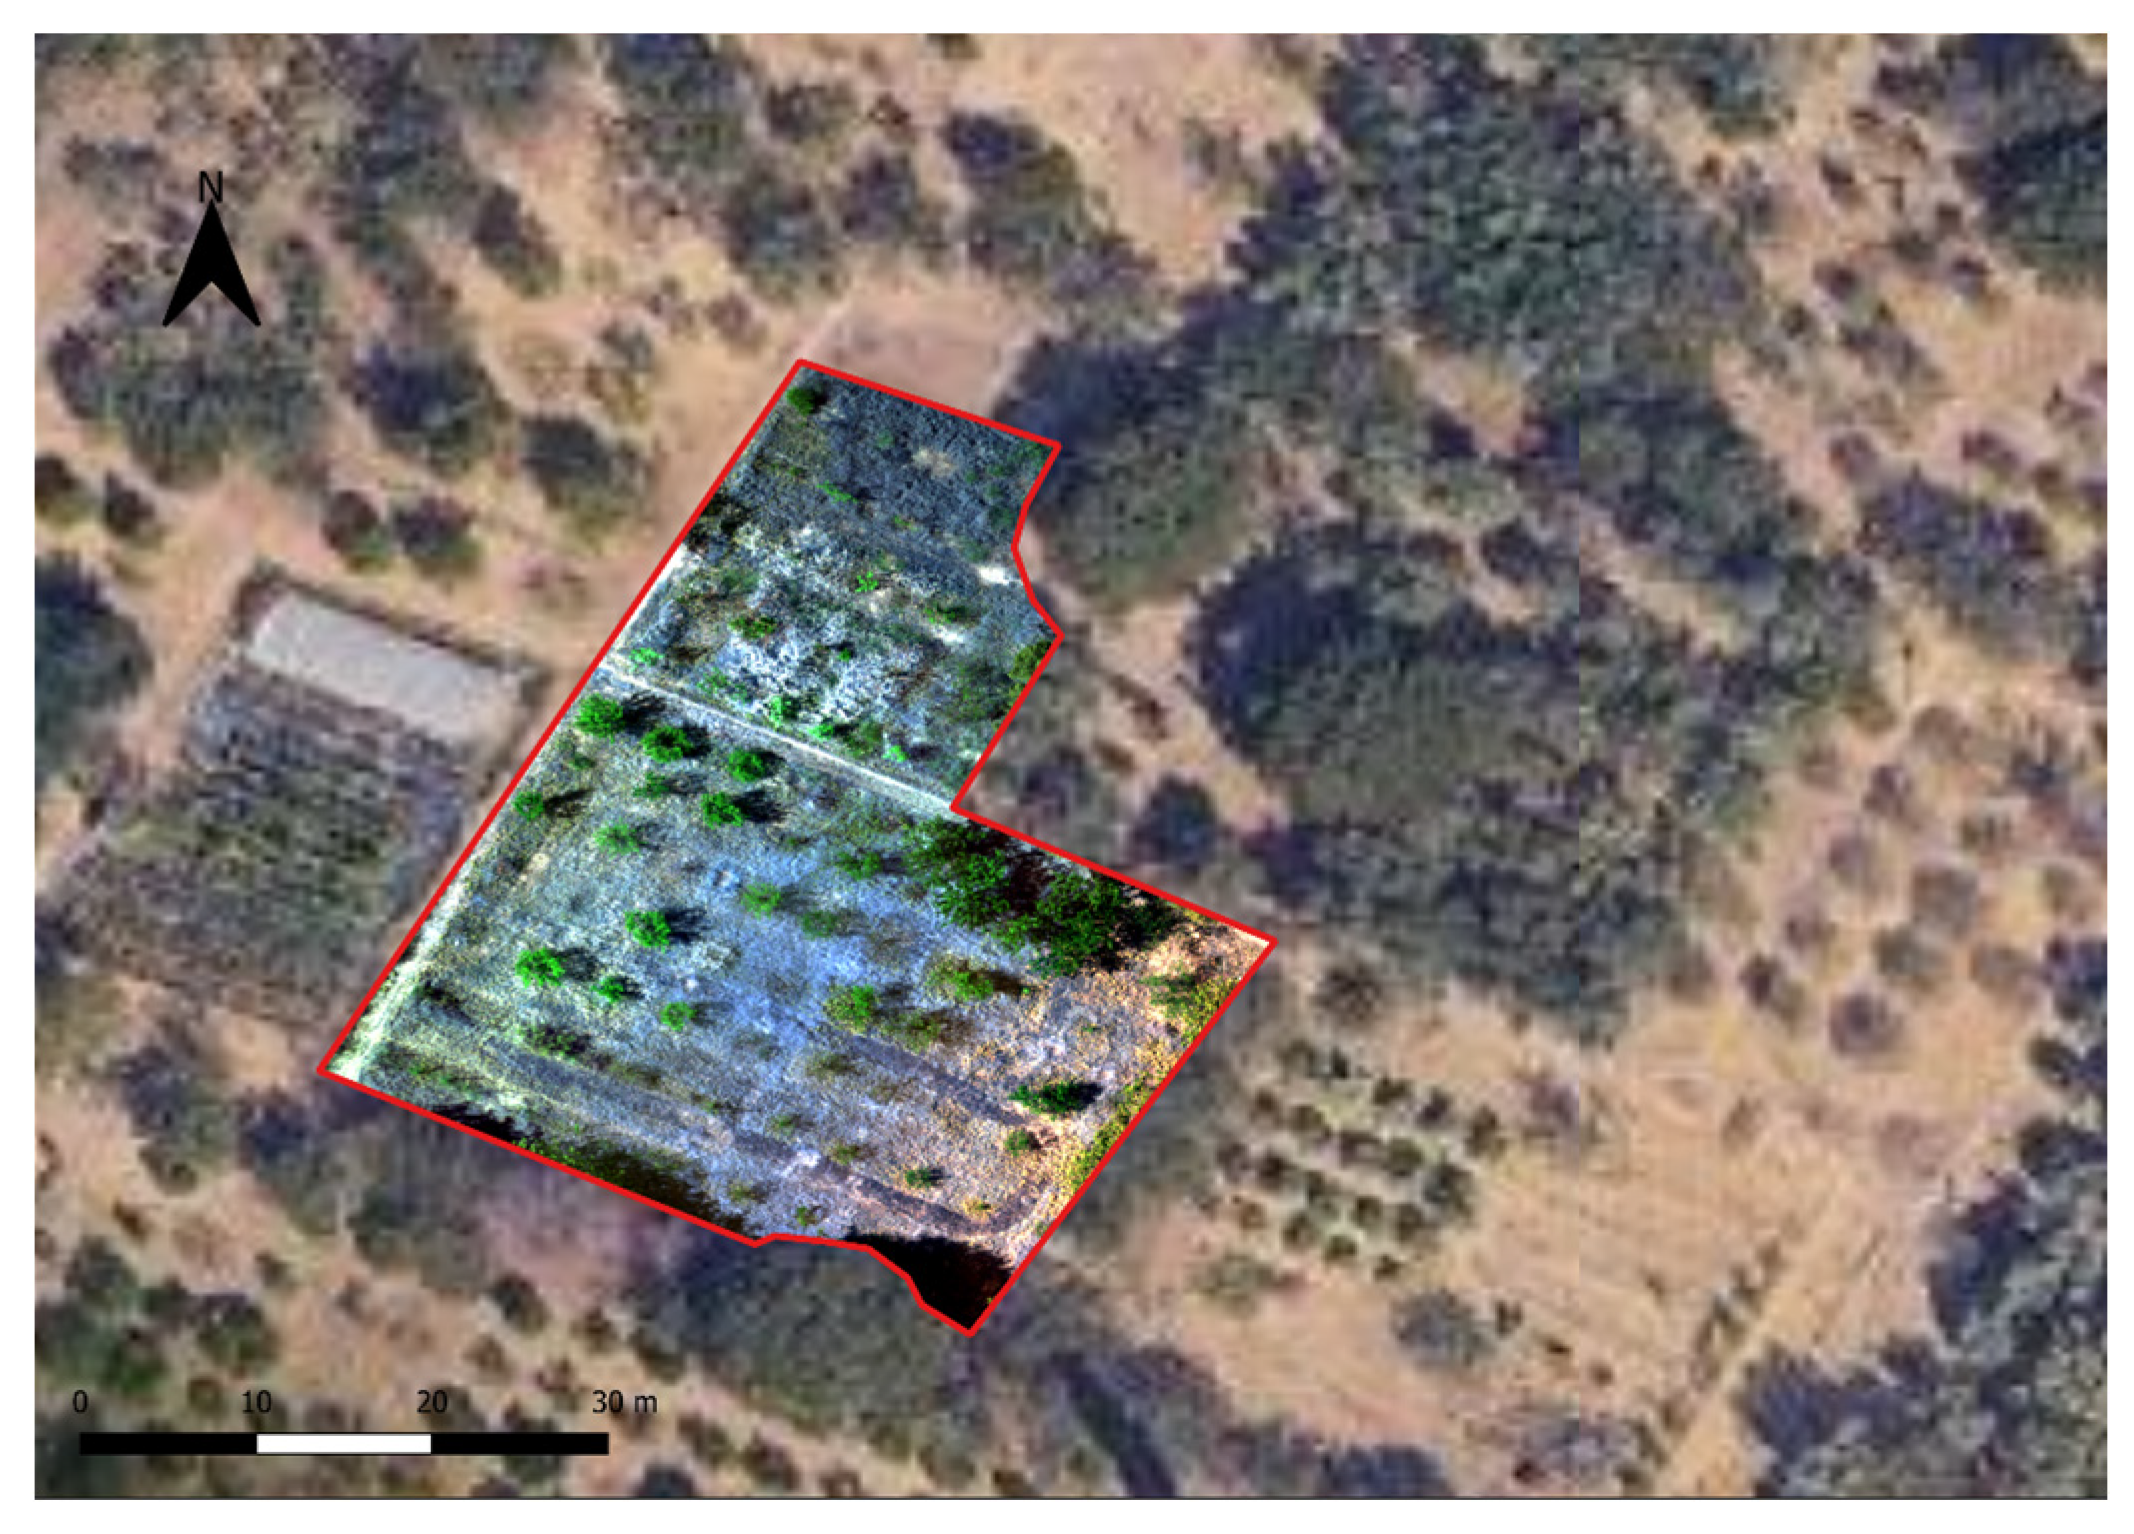
The last step in the multispectral data processing was the generation of the orthomosaic map, which can be generated from either the DSM or DTM. This map is composed of smaller orthophotos and was constructed utilizing the spectral bands of the visible spectrum of electromagnetic radiation, specifically the red, green, and blue (RGB). Each small orthophoto is precisely georeferenced, resulting in each pixel in the final map corresponding to a specific geographic point on the Earth’s surface with well-defined coordinates (X, Y, Z). The orthophotos essentially represent aerial images that have undergone correction processes to eliminate distortions induced by various factors, including lens characteristics, capture angles, and the Earth’s topographical variations. Therefore, the orthomosaic map provides a highly detailed and accurate representation of the Earth’s surface, encompassing both natural and man-made features, all presented with high spatial resolution. Subsequently, the multitemporal creation of orthomosaic maps from the target area can facilitate the extraction of valuable insights regarding the temporal and spatial changes evolving over time (Figure 3).
The digital surface and terrain models (DSM, DTM), as well as the orthomosaic map, were exported for subsequent processing within the GIS program, QGIS. This program is open-source software that provides the necessary tools for geospatial information processing, analysis, and map creation (Figure 4).
Utilizing the QGIS tools, the DSM and DTM were employed to generate the final surface and topography maps, respectively. These maps provide important elevation data for the target area, in this case for the stone fruit and pome fruit orchards.
Upon importing the orthomosaic map into QGIS, the essential vegetation indices (VIs) for assessing tree health were calculated. In this experiment, two vegetation indices, the NDVI (Normalized Difference Vegetation Index) and NDRE (Normalized Difference Red Edge Index), were computed. The NDVI was calculated according to the following expression [15,18,19]:
NDVI = (RNIR − RRED)/(RNIR + RRED)
where “RNIR” is the reflection of solar radiation within the near-infrared band, specifically at 842 nm, and “RRED” denotes the reflection within the red band, at 668 nm. The NDVI values range from −1 to +1, with the negative values signifying surfaces devoid of vegetation, such as bare terrain, rocky or sandy areas, water bodies, and urban areas. A value of zero signifies very sparse or stressed vegetation, as well as desiccated or senescent plant cover. Within the positive range of the index, values approaching the value +1 indicate increasingly robust and healthy vegetation, whereas low positive values indicate sparse or weakened vegetation.
For the NDRE index (Normalized Difference Red Edge Index), the mathematical expression is [15,20,21]:
NDRE = (RNIR − RRED EDGE)/(RNIR + RRED EDGE)
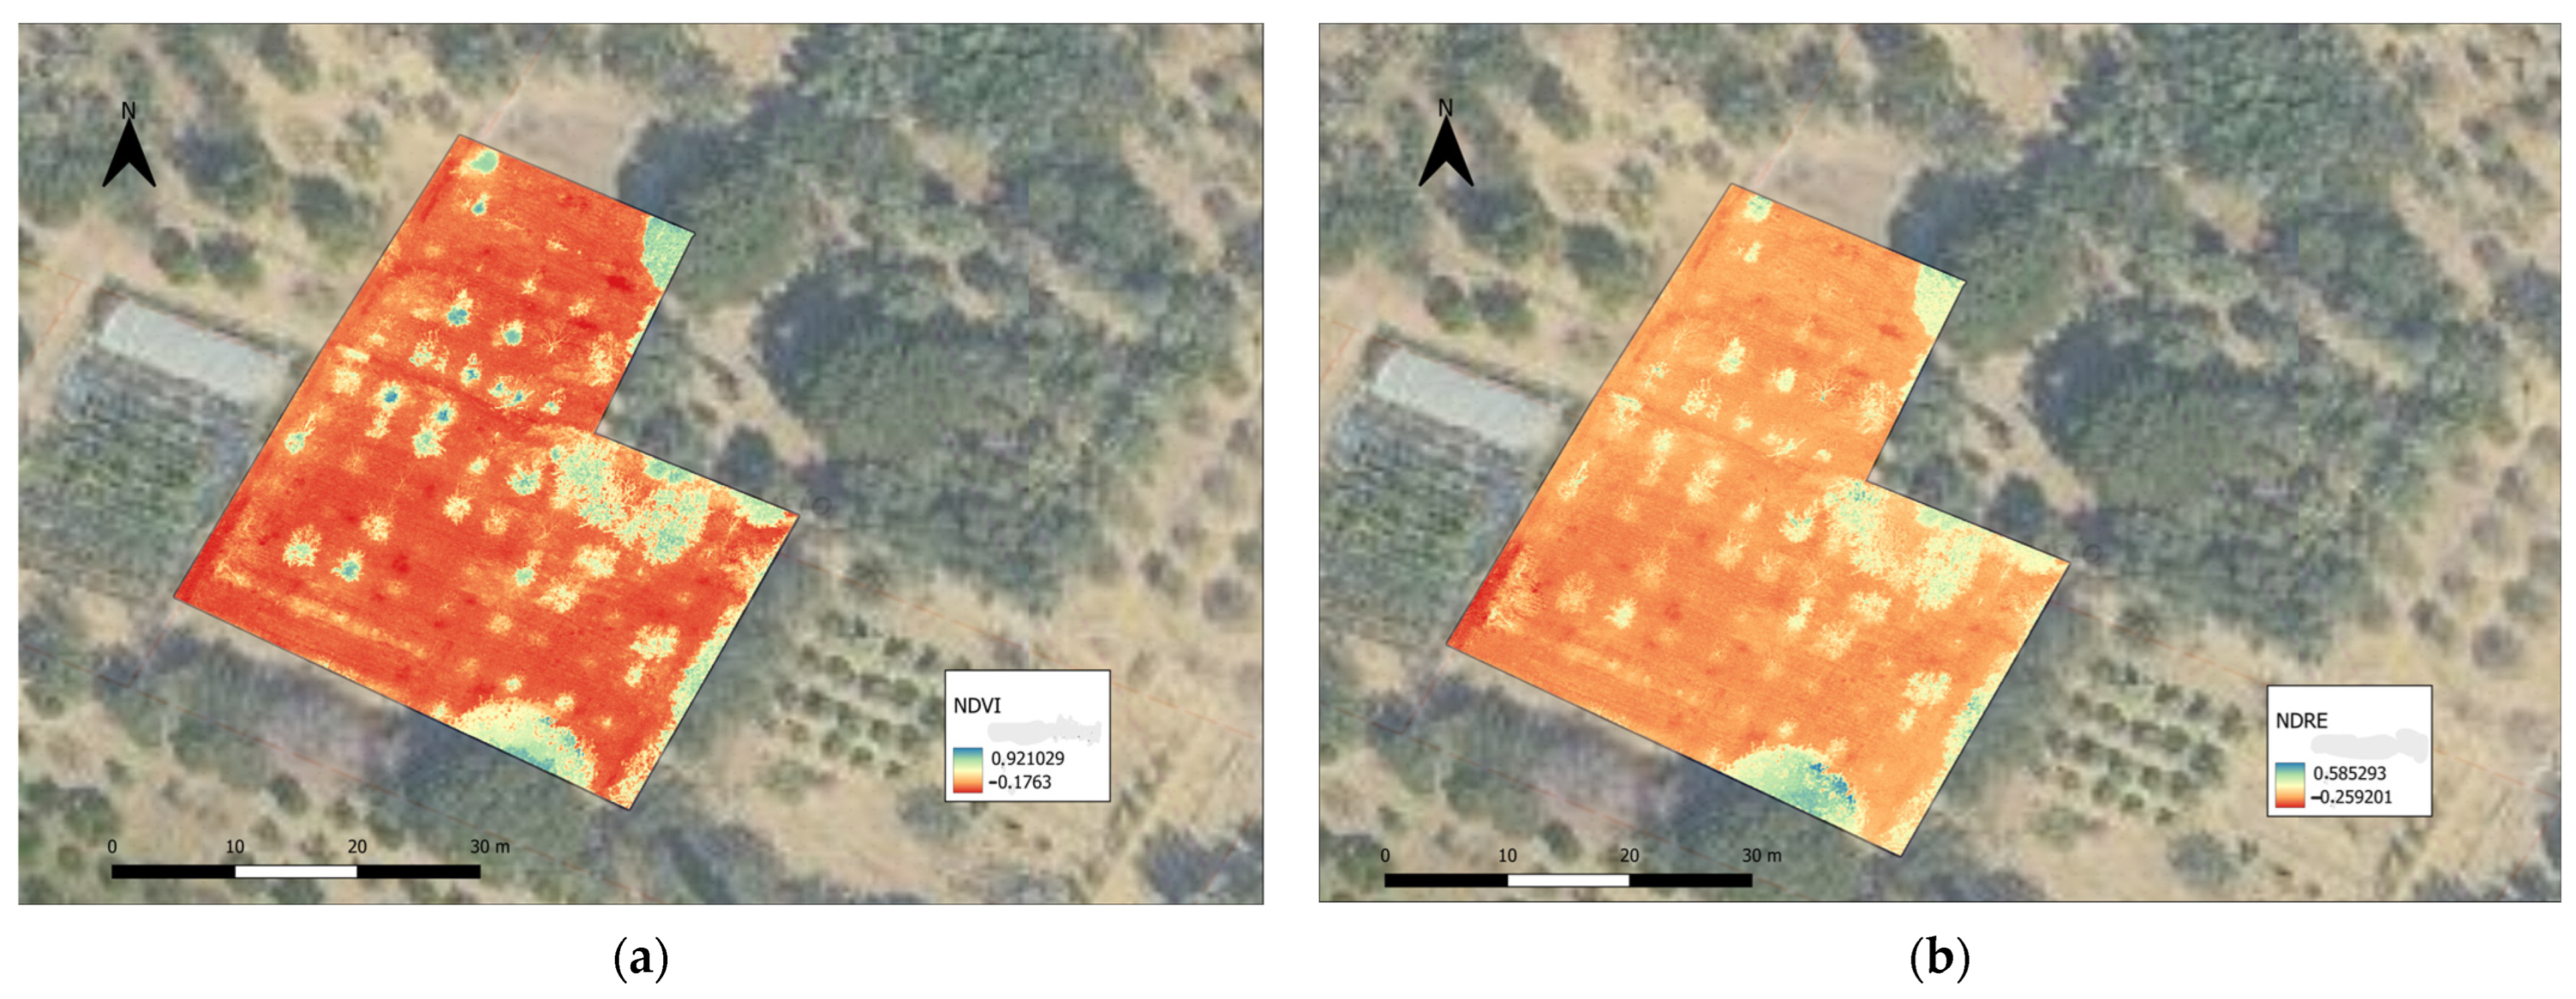
where “RNIR” represents the reflection of solar radiation in the NIR zone, at 842 nm, while “RRED EDGE” signifies the reflection of solar radiation in the red edge band, at 717 nm. Like NDVI, the NDRE index values have the same range, between −1 and +1. Elevated index values on a map are indicative of healthier vegetation, characterized by higher chlorophyll content. Conversely, lower index values reflect weakened or stressed vegetation, associated with lower chlorophyll content (Figure 5).
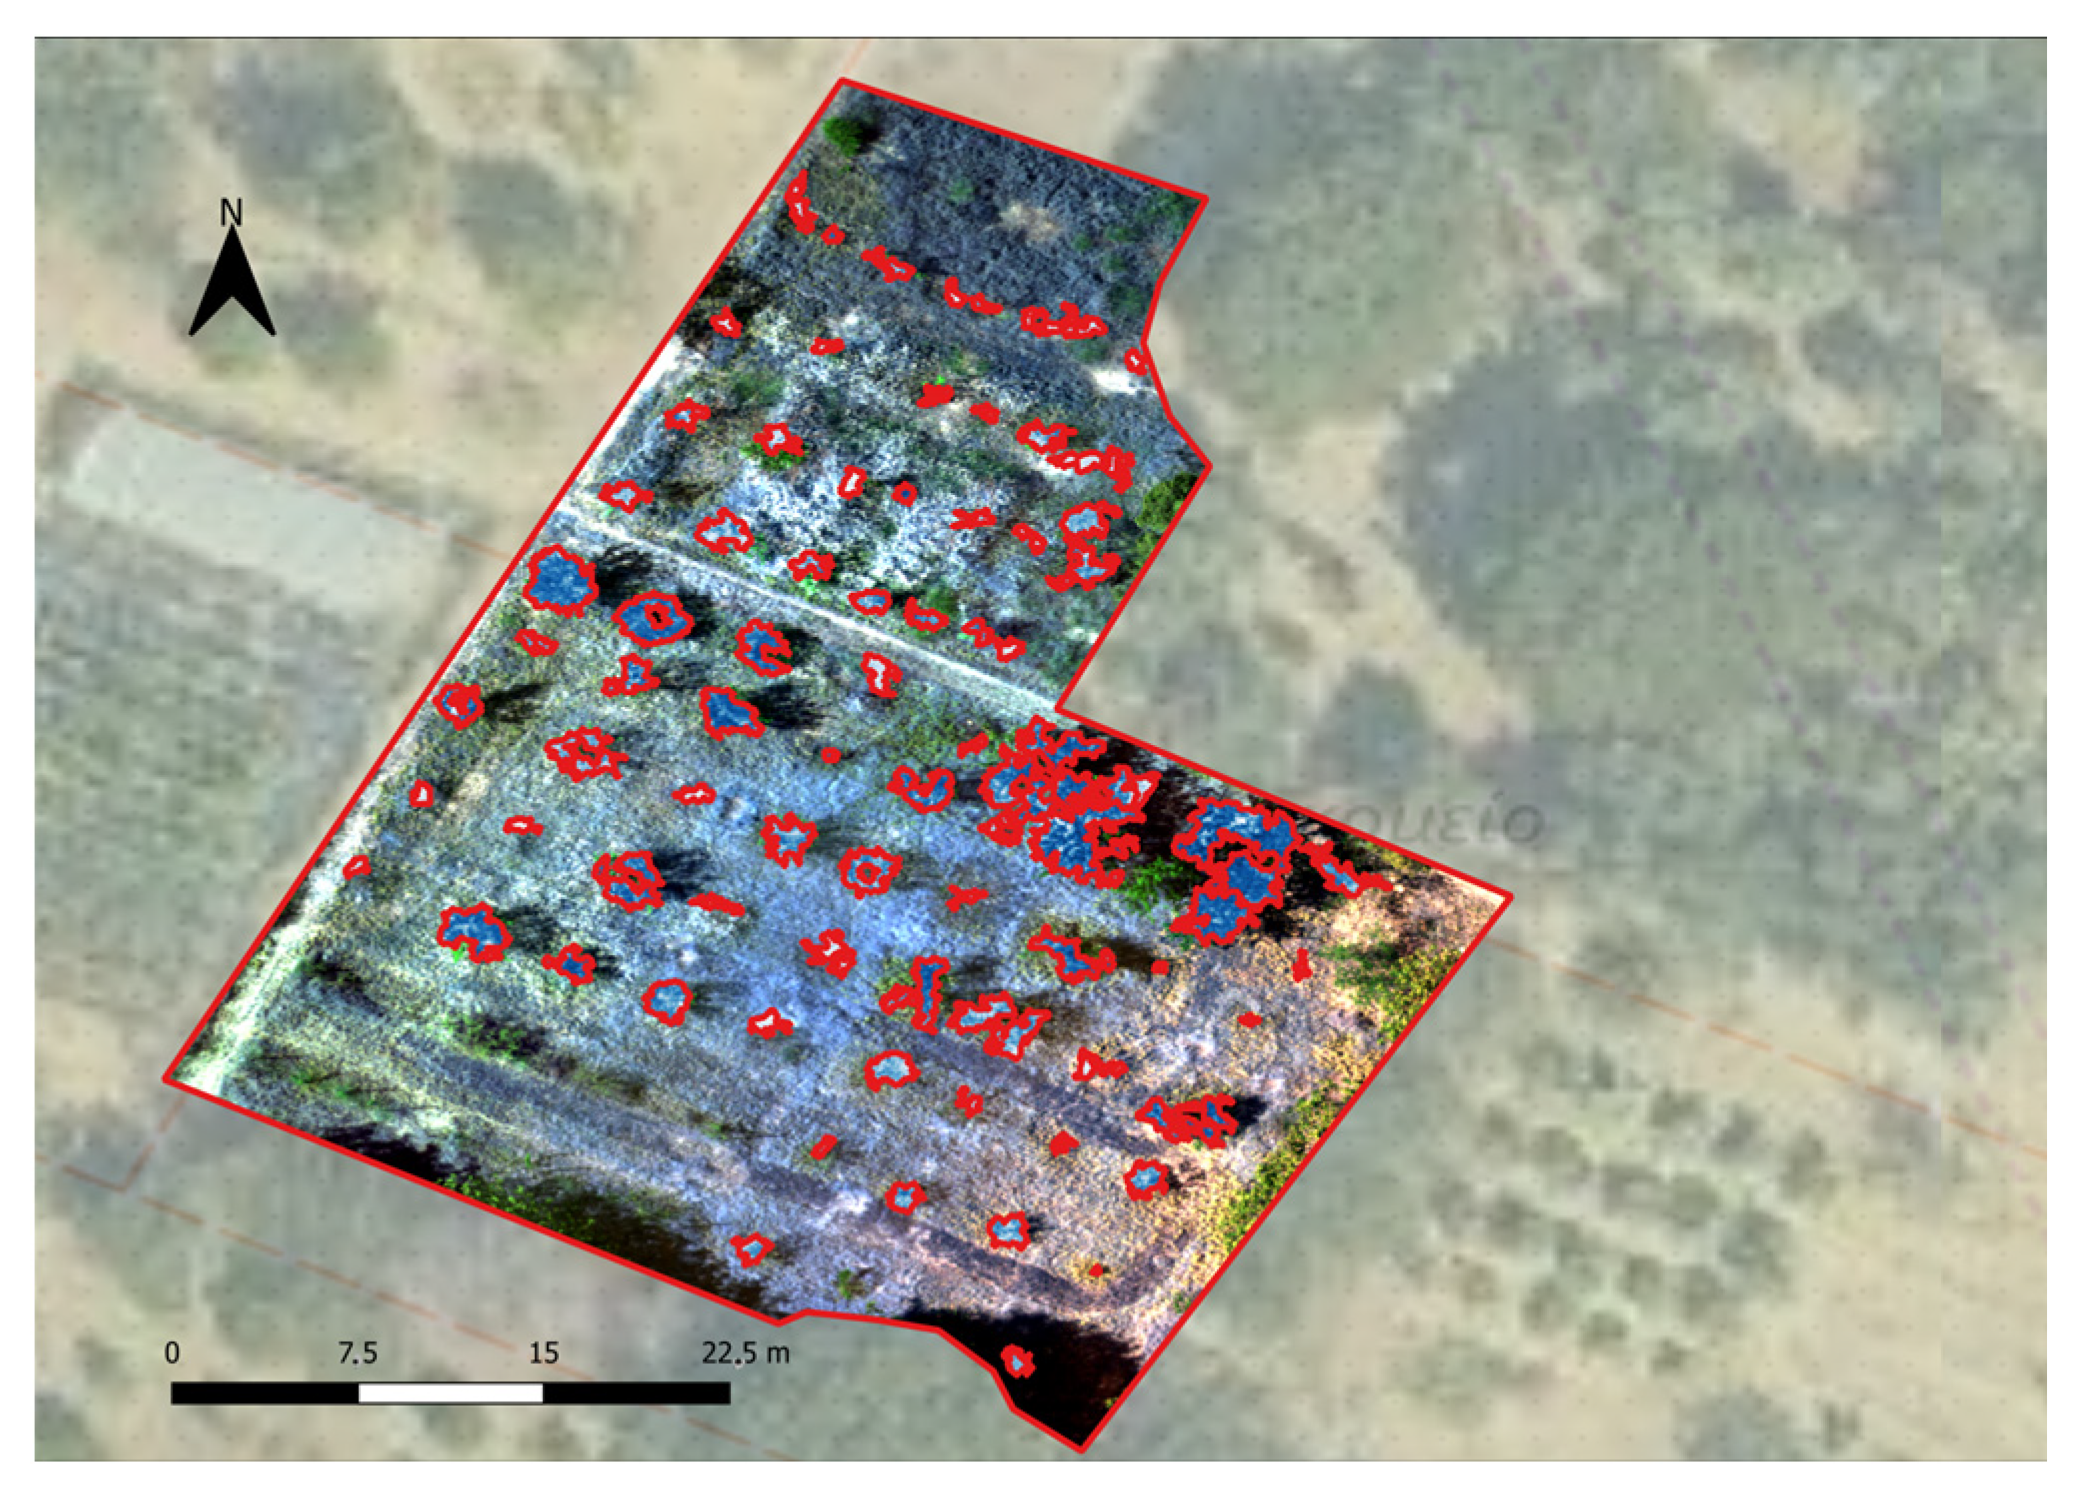
With the help of Orfeo Toolbox Plugin of QGIS, the trees were digitized and finally, the mean NDVI and mean NDRE values were calculated through QGIS and then exported for each tree (Figure 6). The area of the crown of each tree was also calculated and exported.

2.5. On-Site Observations

On the day of the airborne data acquisition, extensive on-site observations were conducted in both stone fruit and pome fruit orchards by an agronomist. The primary objectives were to document the health condition of each individual tree, record possible symptoms, and scrutinize stress factors that could have affected the health of the trees. These stressors include nutrient deficiencies, symptoms indicative of fungal diseases, insect infestations, weeds, and other pertinent factors.
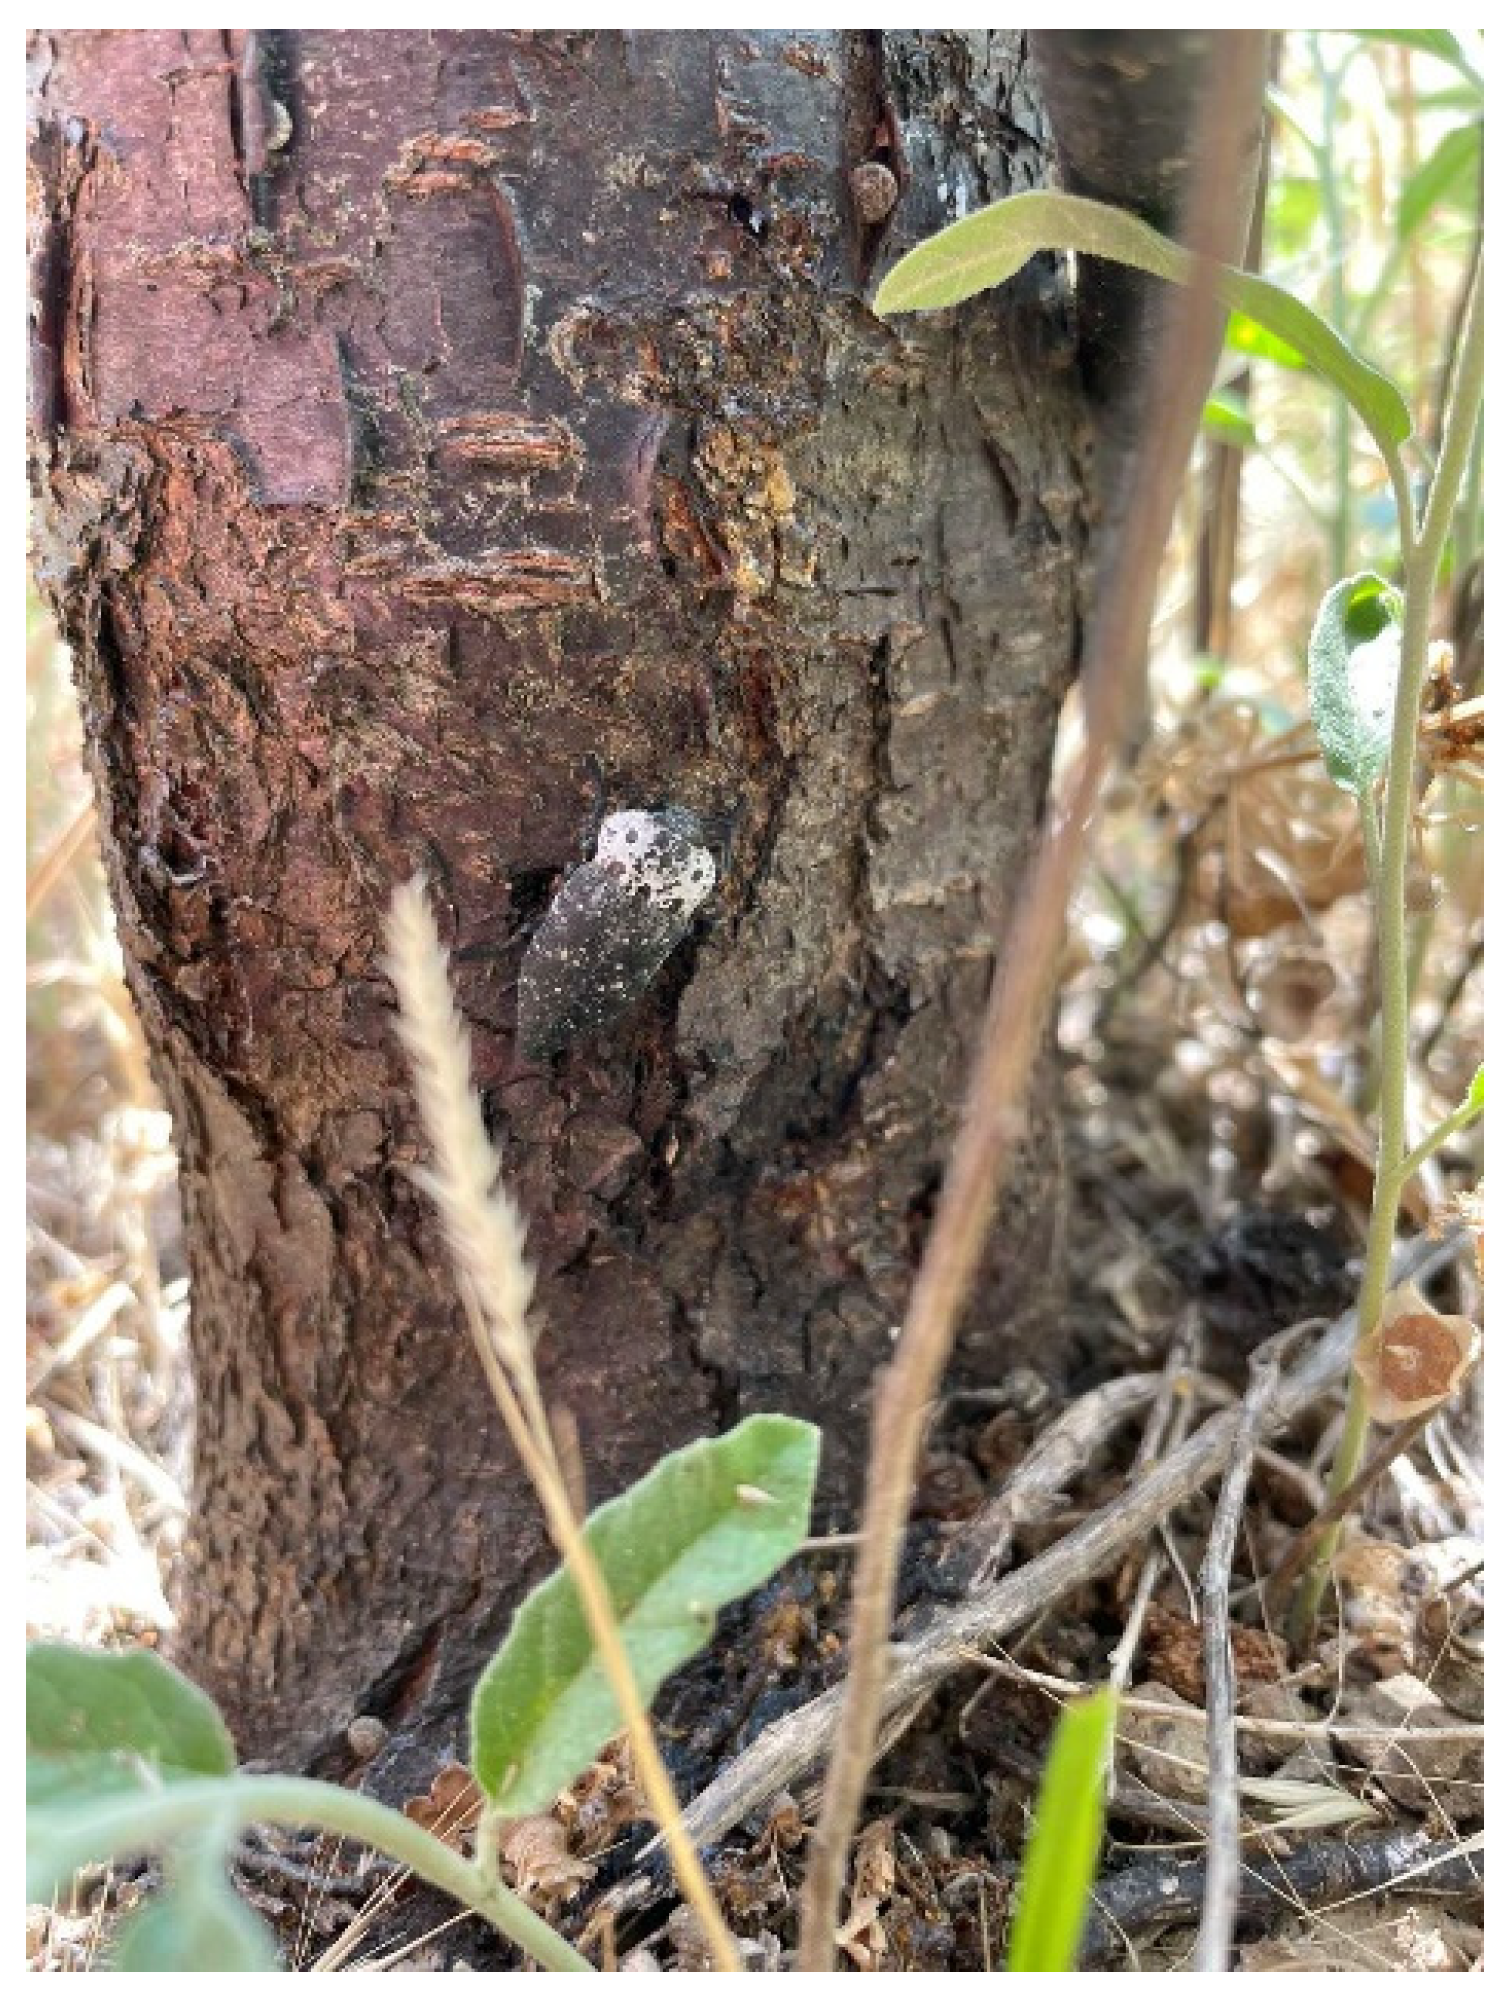
During the on-site observations, infestations from PFRB were detected in the orchards, something that was reinforced by the presence of adult pests on the trunks of the trees (Figure 7). The trees were classified as infested (category 1, presence of infestation) or healthy (category 0, absence of infestation).

2.6. Statistical Analysis

Machine-learning algorithms were employed to construct a predictive model for the identification of the infestation by PFRB, by considering variables such as mean NDVI, mean NDRE, mean temperature, mean relative humidity, and the tree crown area. Initially, preprocessing steps such as cleaning and scaling were performed on the variable data, followed by separation into training and testing sets to evaluate the model’s performance on independent data. The evaluated models were the following: logistic regression (LR), neural network (NN), random forest (RF), and extreme gradient boosting (XGBoost). Every model underwent training on 70% of the observations, utilizing the remaining 30% of the observations for validation purposes. To assess the performance of the models, four different evaluation metrics were employed: accuracy, precision, recall, and F-measure.
Accuracy was calculated to determine which model was the most appropriate for utilization in the present study and is defined as follows [22,23,24]:
Accuracy = (TP + TN)/(TP + TN + FP + FN)
where TP = true positive, TN = true negative, FP = false positive, and FN = false negative.
Precision measures the accuracy of positive predictions made by a model and is defined as [22,23,24]:
Precision = TP/(TP + FP)
Recall is a metric that measures the ability of a model to capture all the relevant instances of a particular class and is defined as [22,23,24]:
Recall = TP/(TP + FN)
F-measure is a metric that combines both precision and recall and is defined as [22,23,24]:
F-measure = 2 × ((Precision × Recall)/(Precision + Recall))
For the construction and evaluation of the models, the R programming language and the packages caret, VGAM, RF, and XGBoost were used [25].
Logistic regression (LR) is a statistical model that describes the relationship between a categorical and one or more independent variables. The independent variables are considered the predictor factor. LR is used when the effect of the predictor variables on the outcome of the categorical variable needs to be studied; therefore, it is widely used in binary classification studies [26].
The artificial neural network (ANN or just NN) is a deep-learning algorithm that resembles the neural system of humans and the way that neurons transmit a signal to one another [27]. Neural networks have many applications, and classification tasks are one of them. Neural networks have many different layers, and if the data do not fulfill the requirements of the layer, then the information does not pass on to the next layer of the network. Neutral networks can identify patterns in data and classify them, which is why they are used for classification and forecasting [28].
Random forest (RF) is a supervised machine-learning classifier. Supervised learning refers to the building of a prediction model from a set of labeled training data and the subsequent application of this model to new, unseen data. It uses multiple decision trees to end up at a prediction. Lately, it is widely used in pest and disease prediction due to excellent classification results and fast implementation [27,29].
Extreme gradient boosting (XGBoost) is a supervised decision tree algorithm. It is a tree-boosting model that can be used for both regression and classification [30].

3. Results

Table 1 provides a summary of the descriptive statistics for the predictor variables in the study: meanNDVI, meanNDRE, Tmean, RHmean, and tree crown area. The initial examination of variable values through both graphical and statistical tests revealed the absence of missing, duplicate, and extreme outlier values.
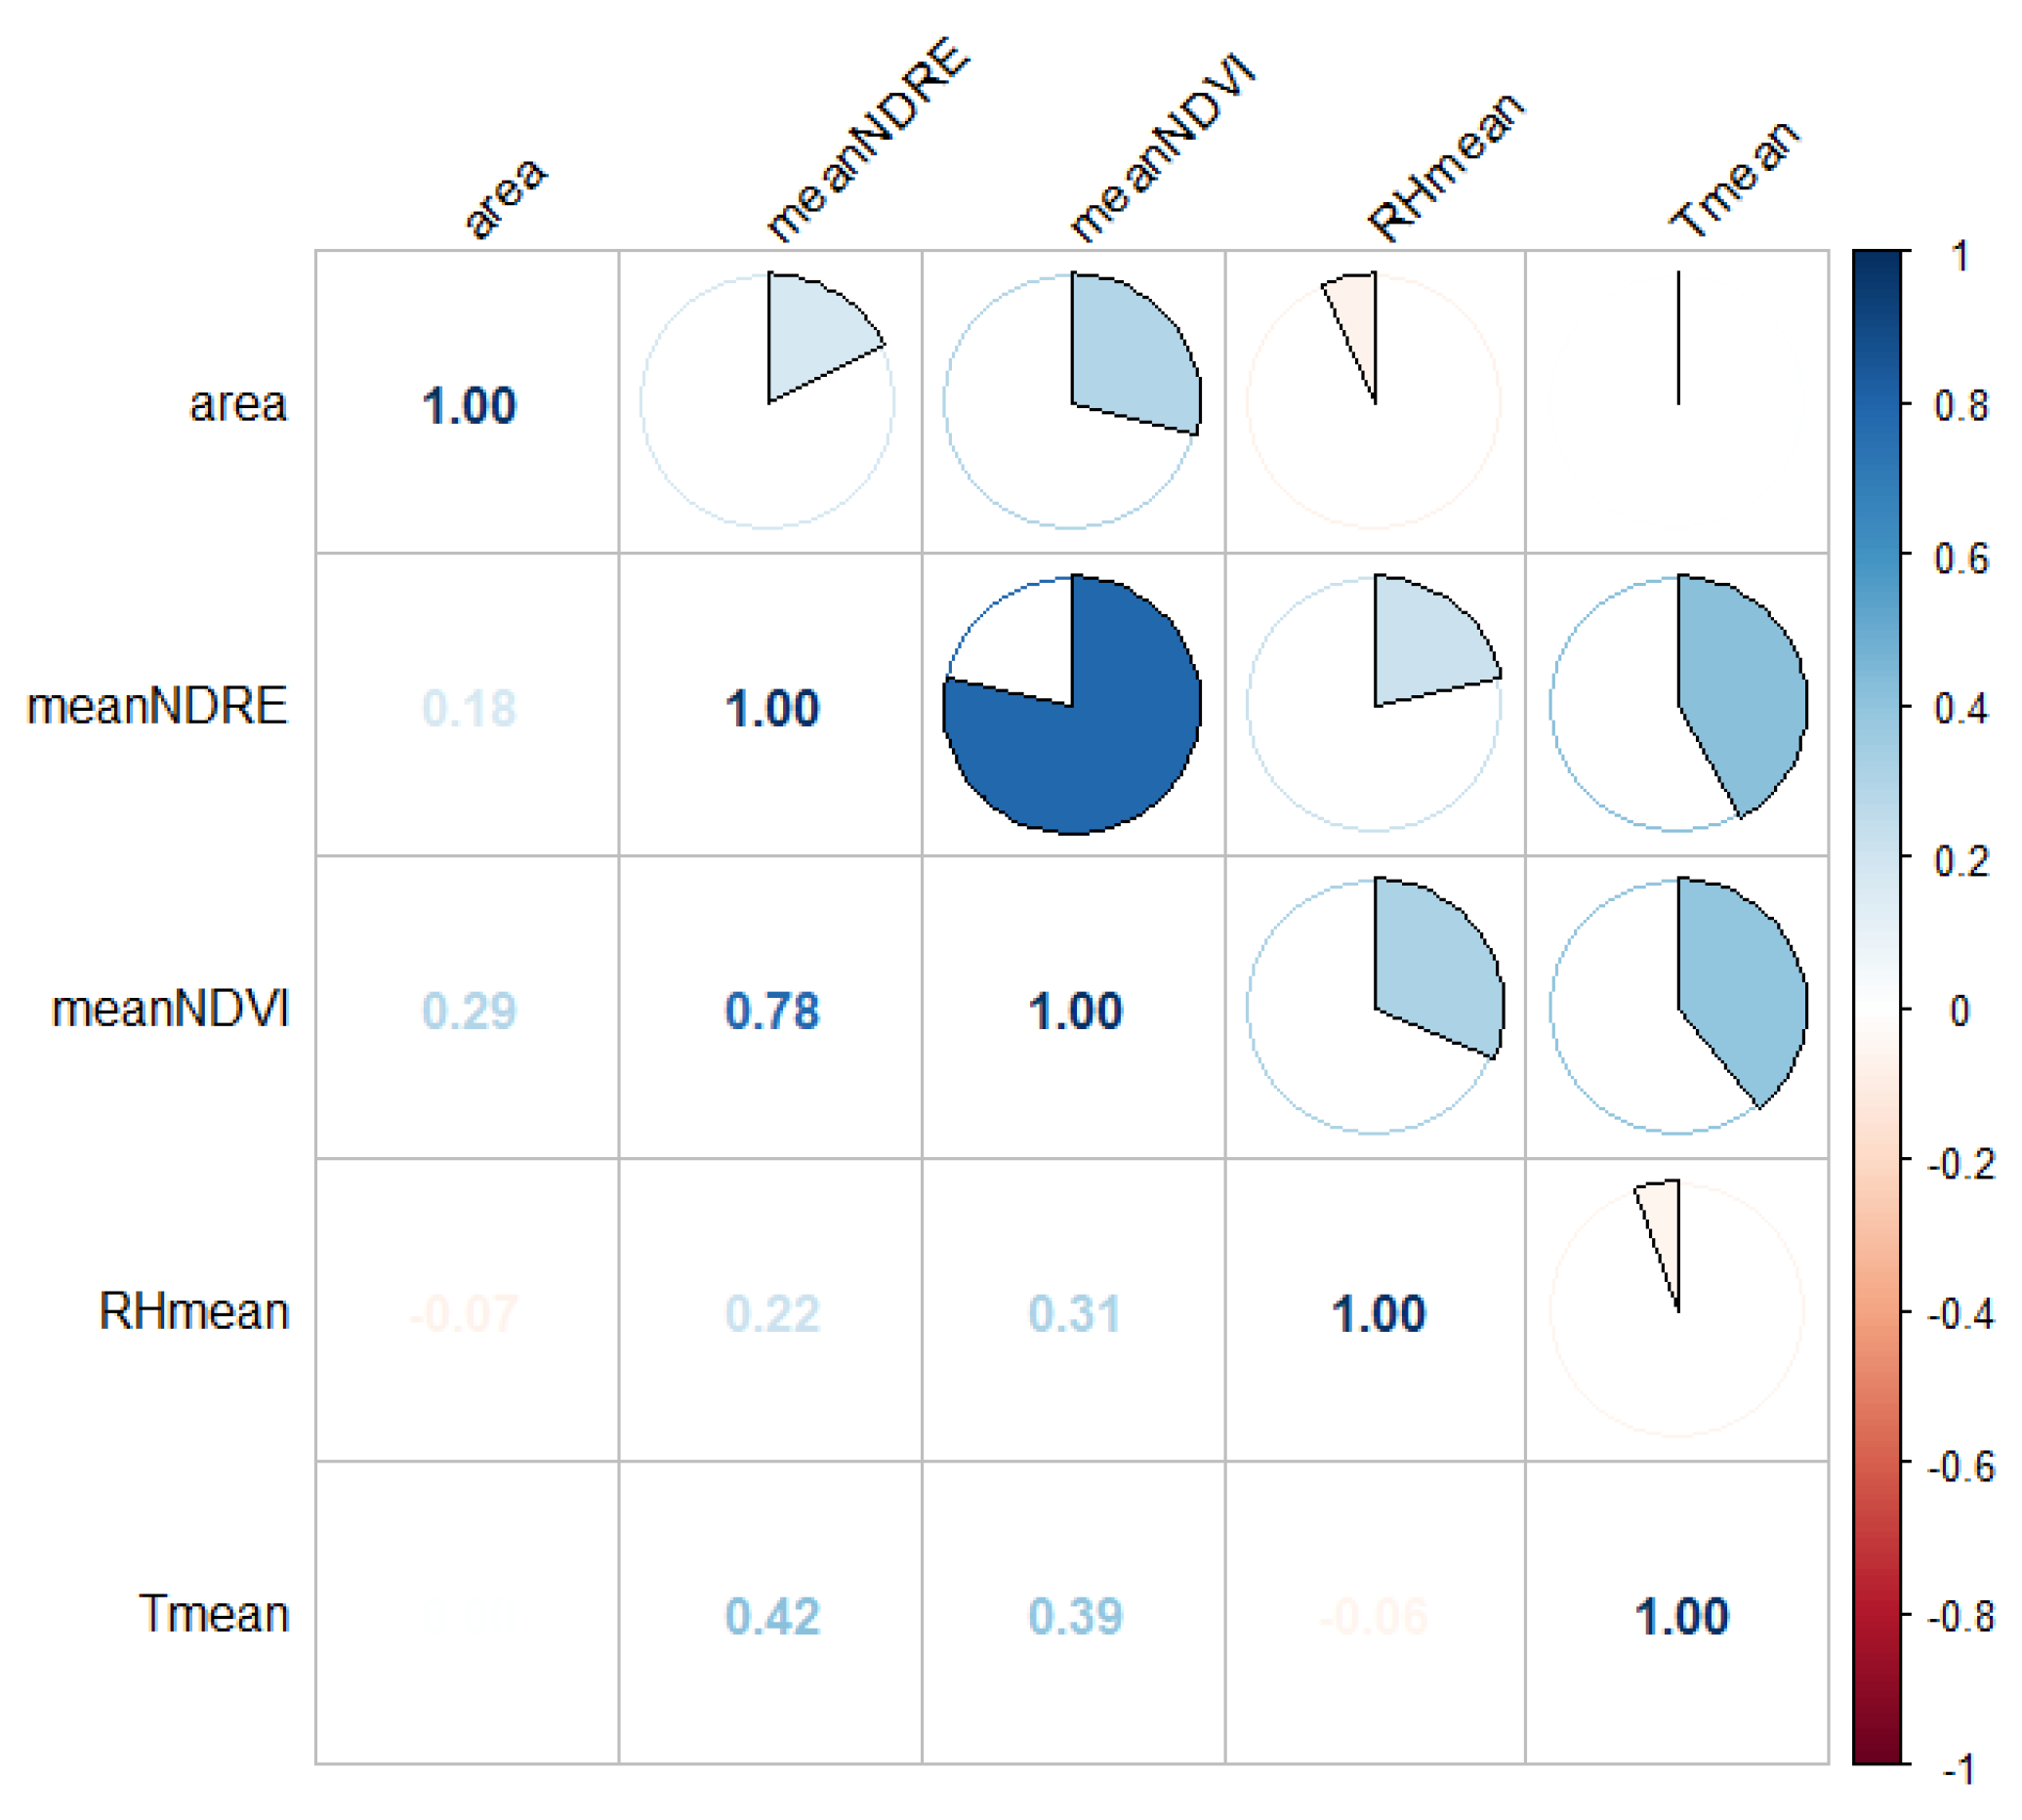
Figure 8 displays the correlation matrix depicting relationships among the variables. The most noteworthy statistically significant correlation was found between the variables meanNDVI and meanNDRE (r = 0.78, p-value < 0.001), followed by the Pearson correlation coefficients between the temperature and mean NDRE, as well as mean NDVI, which were 0.42 and 0.39, respectively, and both exhibited statistical significance (p-value < 0.001). The correlation matrix suggests that there were no significantly strong correlations among our predictors (greater than 0.9) that might have influenced the employed machine-learning algorithms.
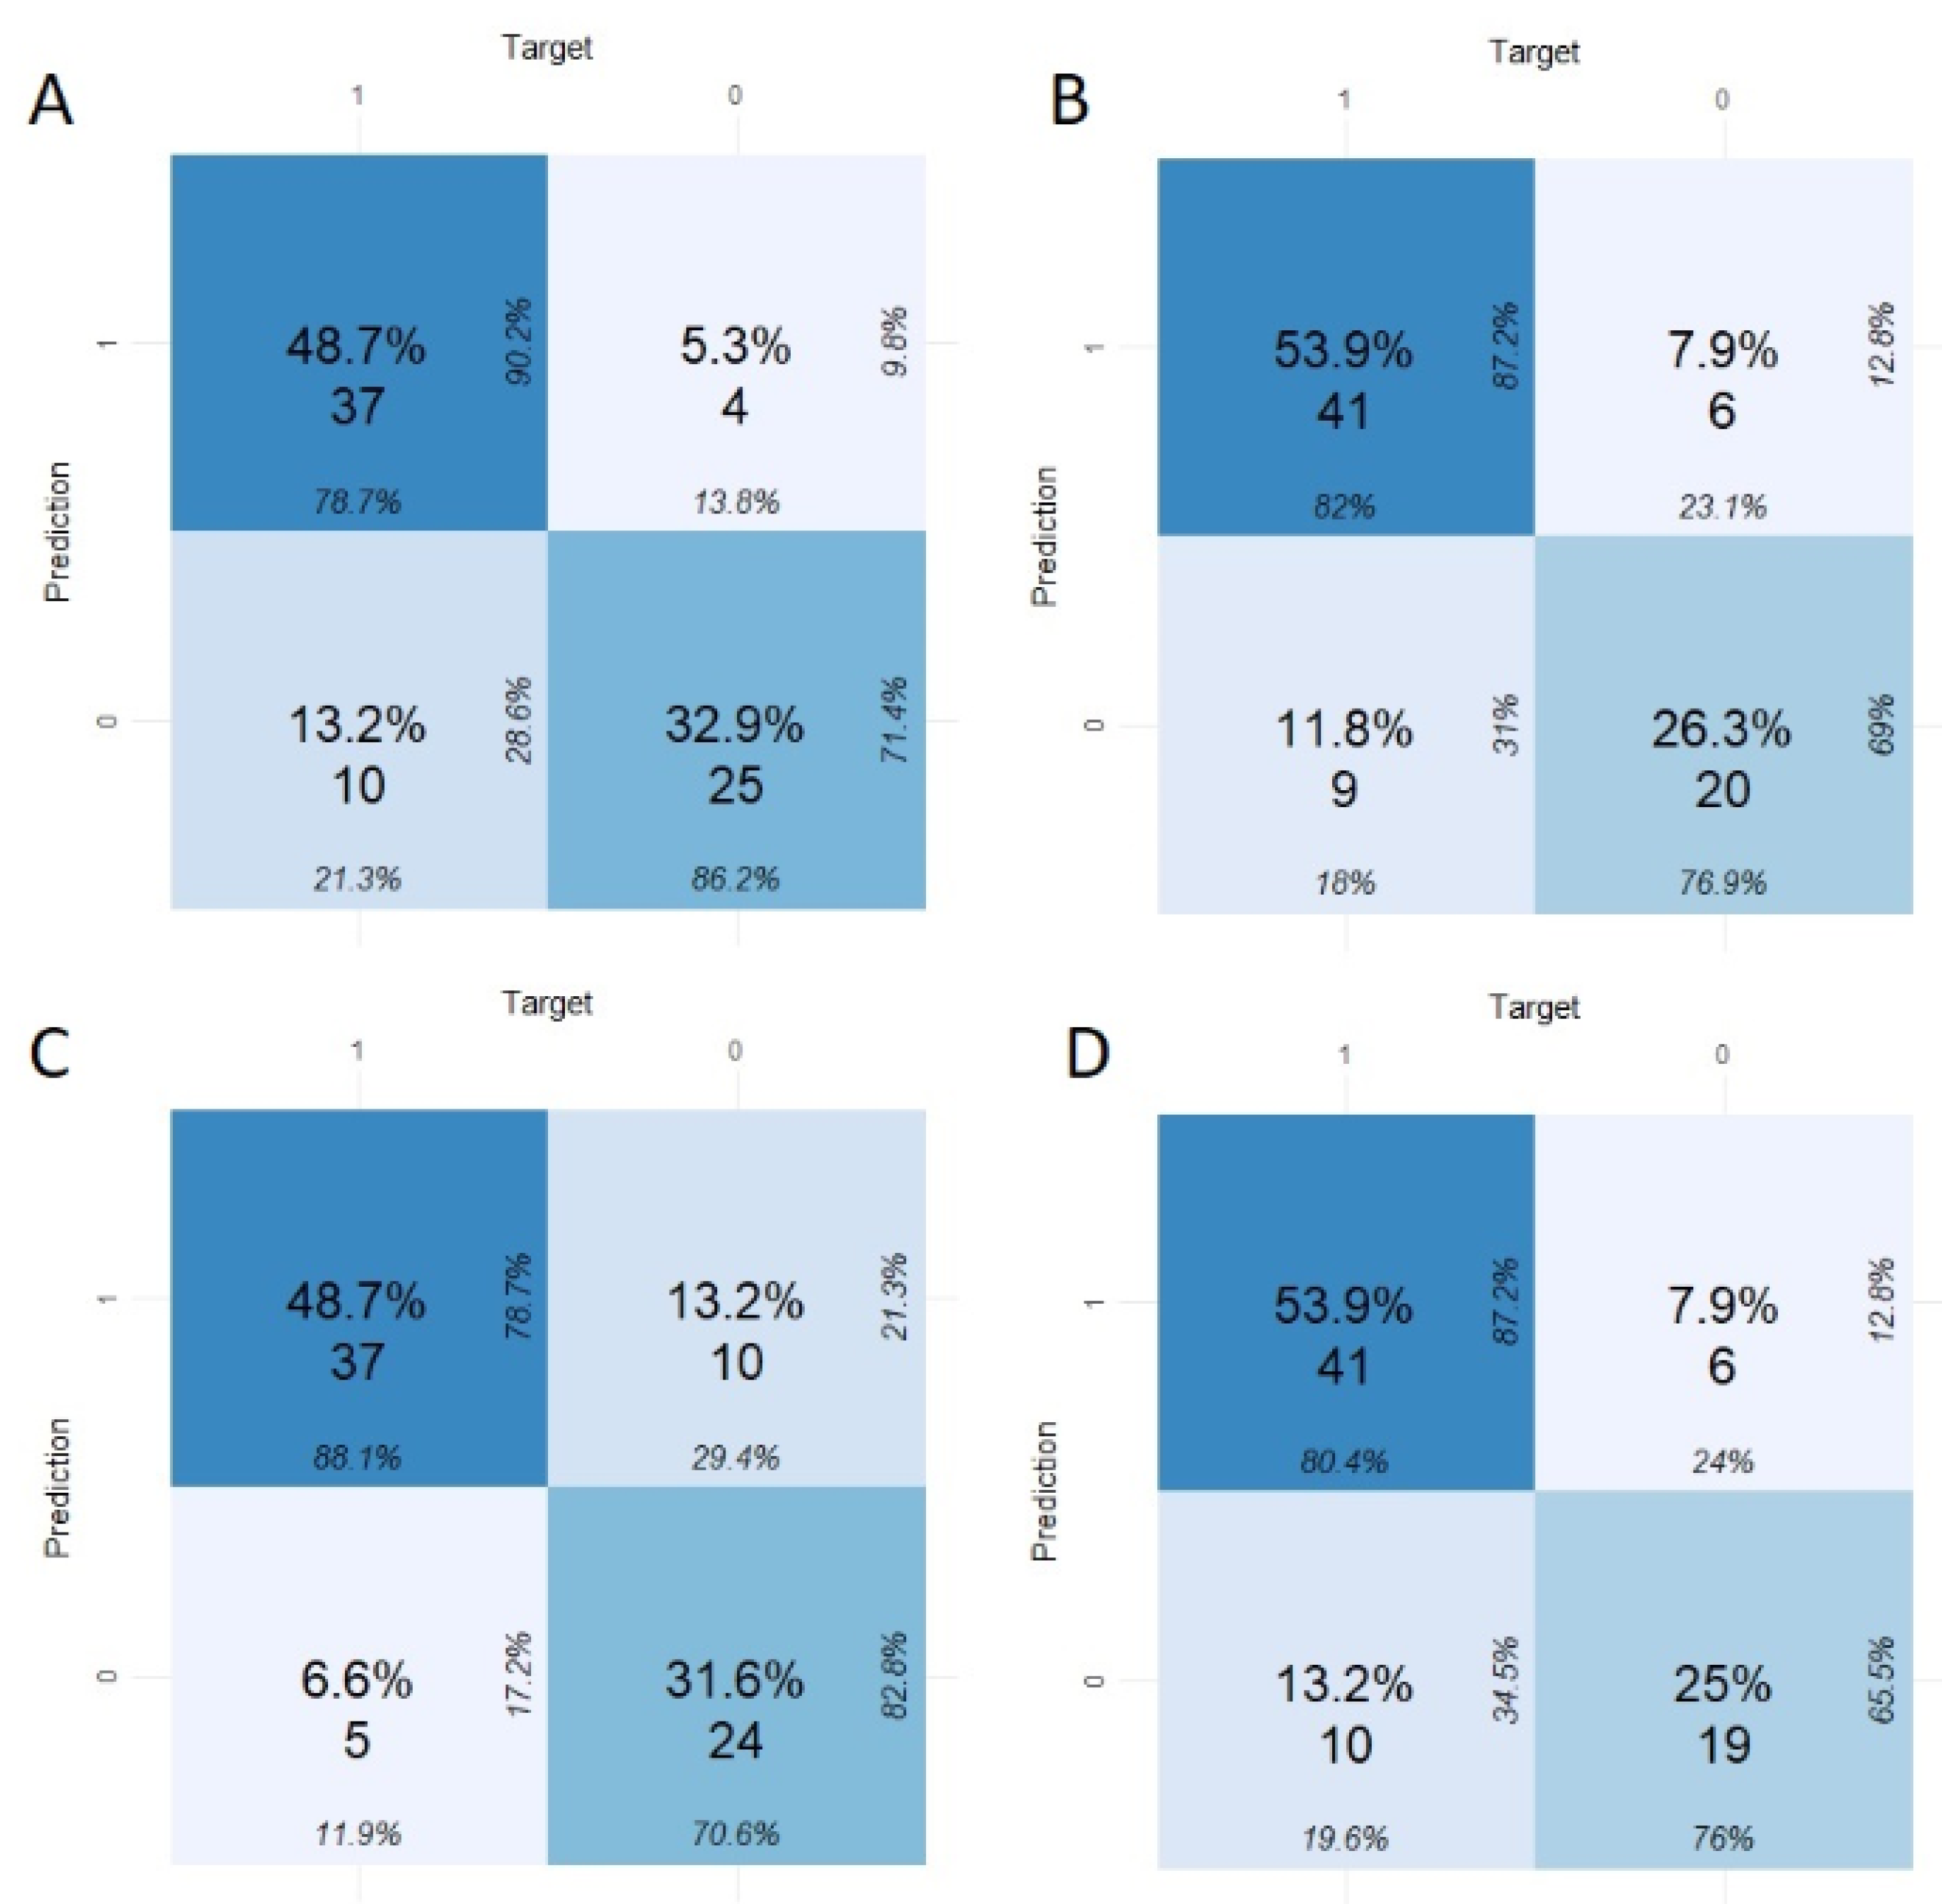
Figure 9 illustrates the variables that significantly influenced the prediction in each model. The prediction models indicated that the most crucial variables were the mean NDVI, the mean NDRE, and the crown area. In contrast, the meteorological data utilized in the models, including mean temperature and mean relative humidity, did not have a significant impact. Based on importance, the variable mean NDVI ranked first, followed by the crown area and the mean NDRE. Figure 10 displays the confusion matrix for the machine-learning algorithms.
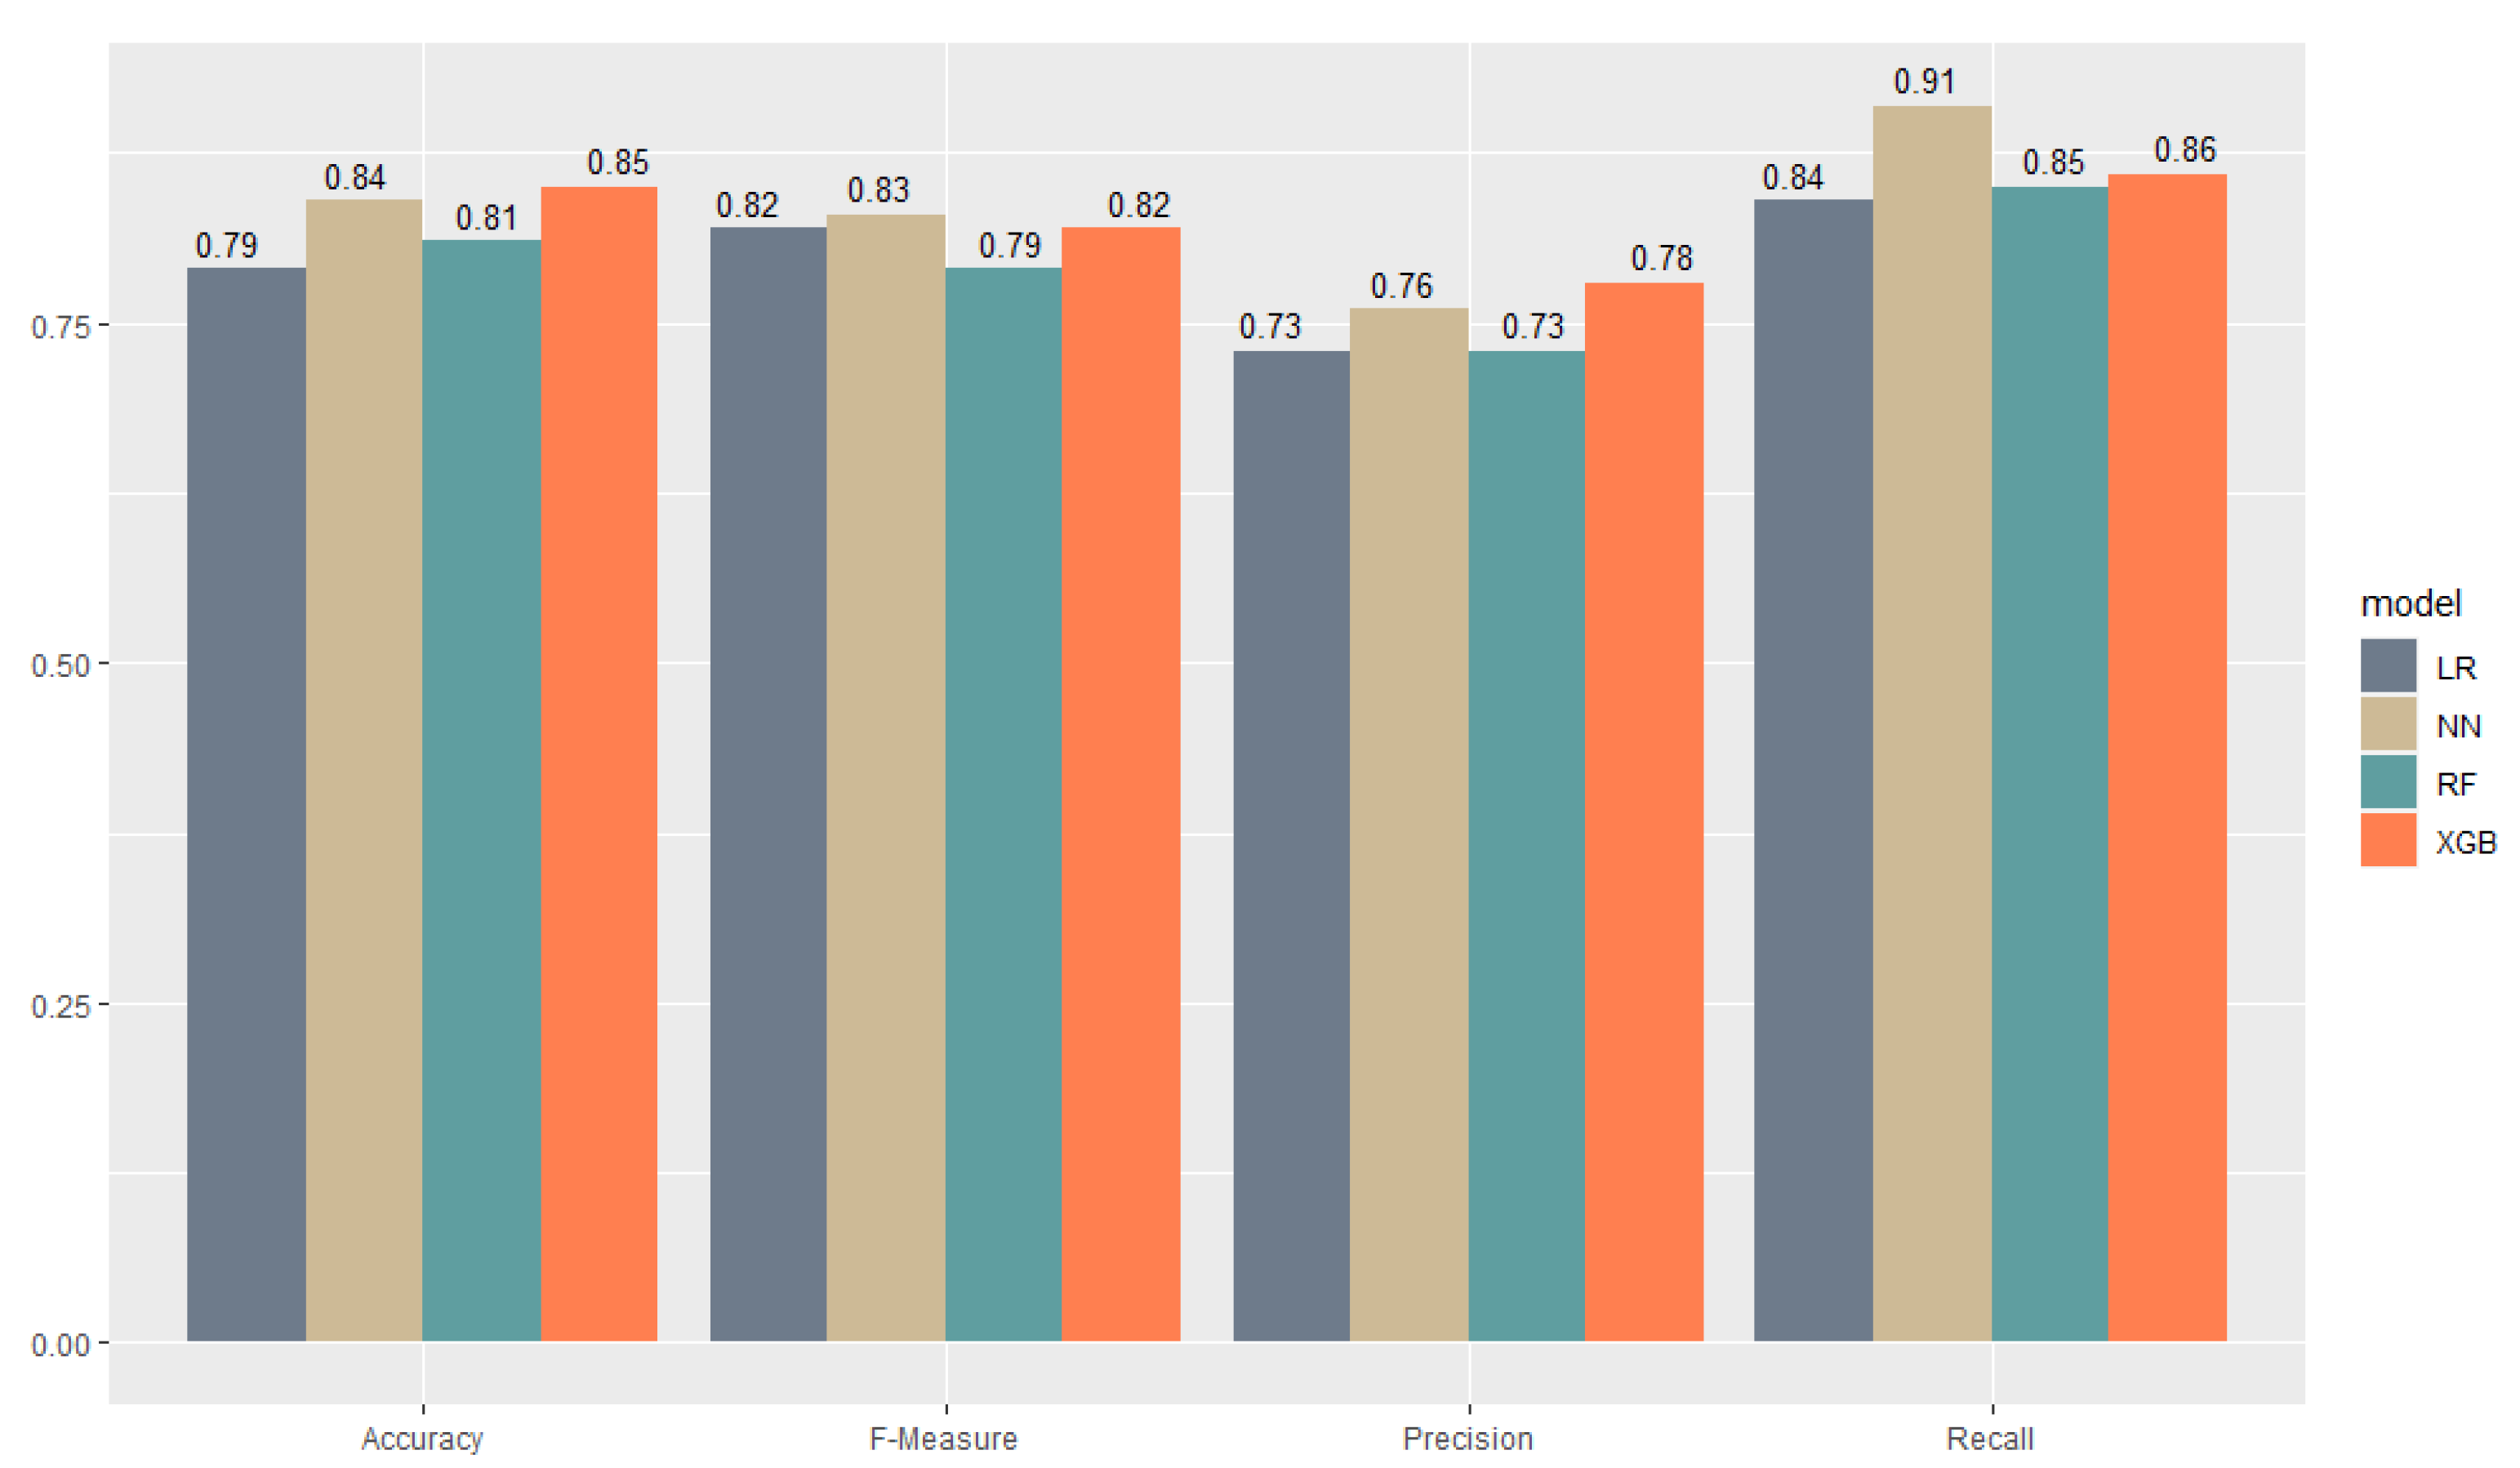
The metrics of the different algorithms used are shown in Figure 11. In terms of accuracy, the XGBoost model exhibited the highest performance, registering a value of 0.85, followed closely by the NN model, with an accuracy of 0.84. The RF and LR models yielded accuracy values of 0.81 and 0.79, respectively. Concerning the F-measure, the NN model achieved the highest score at 0.83, while both the XGBoost and LR models scored 0.82. The RF model exhibited the lowest F-measure with a value of 0.79. Regarding precision, the XGBoost model led with the highest value of 0.78, followed by the NN model at 0.76. The RF and LR models both had a precision value of 0.72. In terms of recall, the NN model attained the highest value of 0.91. The XGBoost, RF, and LR models achieved recall values of 0.86, 0.85, and 0.84, respectively.

4. Discussion

Wood borers play a significant role as pests in global agro- and forest ecosystems. The early stage of their infestation often exhibits no visible symptoms, posing a threat that can escalate into widespread infestations and eventual tree mortality. Remote sensing has emerged as a potent technology for monitoring various stages of pest infestation on both large and small scales, offering a continuous and timely assessment. When coupled with expert on-site confirmation, this technology becomes a reliable means of accurately determining infestation occurrence. Thus, it establishes a scientific approach for effective wood borer insect management. The results of our study show that multispectral remote sensing can provide accurate early detection of PFRB infestation in stone and pome fruit trees. This study represents the inaugural exploration of early wood-boring insect detection in cultivated trees utilizing remote sensing. While prior research has delved into the early monitoring of wood-boring insect pests in forests, employing airborne data collection as the primary technology, the focus has been on gathering single-date airborne hyperspectral data [31,32,33,34,35,36,37,38,39]. While these data offer highly accurate detection with flexible and efficient acquisition, expanding the study area increases the number of bands and images to be scanned in airborne hyperspectral data acquisition, thereby escalating the costs and complexity of image processing. Additionally, geographic registration and image stitching become necessary [39].
Contrary to these approaches, previous studies [40,41] utilizing UAV-based multispectral data to identify pine trees with early-stage damage caused by the pine wood nematode, Bursaphelenchus xylophilus (Steiner & Bührer) Nickle (Nematoda: Aphelenchoididae), yielded less promising results. These studies noted that, despite the utility of near-infrared (NIR) or red edge bands, the bandwidth of multispectral bands was too broad for successful application in early monitoring.
In this current study, even when utilizing a multispectral sensor, the accuracy of the data collected for the early detection of PFRB reached 0.85. To assess whether remote sensing data could serve as a predictor for early pest infestation detection, four machine-learning models were employed. Among these, the XGBoost prediction model demonstrated the highest effectiveness, followed by the NN model. XGBoost, since its inception, has consistently proven to be a superior classifier compared to many other machine-learning models, outperforming the majority. Notably, XGBoost exhibits strong performance with less data in comparison to NN, and its incorporation of regularization techniques helps to prevent overfitting, enhancing its robustness when dealing with limited datasets [42,43].
Two types of models are employed in the early monitoring of wood-boring pests: parametric and nonparametric models. In the context of the present study, the NN model falls within the category of parametric models, alongside linear regression. Parametric models, including the NN model, are characterized by robust mathematical and statistical foundations, facilitating the fitting of practical data with ease. However, these models necessitate that the input data adhere to specific prerequisites, such as the homogeneity of variance, which may not always be achievable.
On the flip side, XGBoost belongs to the category of nonparametric models, alongside random forest and support vector machine. Nonparametric models, including XGBoost, exhibit minimal dependence on data distribution and types. This characteristic makes them versatile and adaptable to various datasets without strict adherence to specific distribution assumptions. While there are existing studies exploring the correlation between remote sensing data and disease detection in crops, insufficient research has been conducted on the relationship between remote sensing data and the identification of pest damage in crops using machine-learning techniques. Moreover, in the majority of these studies, regression stands out as the predominant model employed [44,45,46]. The current study highlights XGBoost as a highly promising machine-learning model for predicting pest infestation in crops, but further investigation is warranted. Since its inception, XGBoost has consistently proven itself as a superior classifier compared to many other machine-learning models, surpassing most of them, with the NN model following closely behind. Notably, XGBoost exhibits strong performance even with limited data, outperforming NN, and incorporates regularization techniques to prevent overfitting, thereby enhancing its robustness in dealing with constrained datasets [42,43]. In all of the four models that were performed, the mean NDVI, mean NDRE, and crown area of the tree were the most important factors in the prediction of the infestation. Even though meteorological data affect the biological cycle of the insects and they are essential for the infestation, they seem to have no impact on the models. This is likely due to the volume of the study data. If there was a greater dispersion of the studied data over time, which would mean a greater variation in the meteorological data, then temperature and relative humidity may have played a more important role in the models. NDVI is an index of the biomass of the plants; therefore, NDVI values and crown area are two interconnected variables, which explains the fact that in all of the models, the crown area was the second most crucial factor for the prediction of the infestation. Damaging the vascular bundles of the trees, PFRB causes a great reduction in the photosynthetic capacity of the host, so the decrease in biomass results in lower NDVI values. Since NDVI is the most important predictor of the infestation, it stands to reason that the crown area is just as important [47,48,49].
Moreover, it is crucial to note that obtaining ground truth data through independent site measurements is essential for constructing a wood-boring pest detection model. The quantity and quality of such ground truth data play a pivotal role in determining the model’s generalization and accuracy. However, acquiring these data can be costly, leading to their absence in previous studies. In contrast, our study addressed this gap by collecting ground truth data from both pear and stone fruit orchards, confirming tree infestations through the presence of pest larvae in the trunks.
In conclusion, the spread of PFRB typically extends from a single tree to a vast area. Swiftly removing individual infested trees in the early stages can effectively curtail its propagation. The timely detection of PFRB holds paramount importance for orchard management, and remote sensing proves instrumental in achieving this. The present study demonstrated that utilizing multispectral data collected by a UAV with an attached XGBoost sensor holds promise as a machine-learning model for predicting pest infestation in crops. However, further research is needed to explore and refine its potential. Nevertheless, current remote sensing technology can monitor tree symptoms but falls short in precisely identifying the specific causal agent—whether it is an insect, another agent, or the exact wood-boring insect species. Establishing a clear link between tree symptoms and wood-boring insect species necessitates additional research. This involves developing detailed databases through high-resolution mapping of tree species, documenting the seasonal and historical occurrences of damage, and consistently gathering ground truth and laboratory observations.

5. Conclusions

The aim of this study was to explore the potential for the early detection of C. tenebrionis infestations in stone and pome fruit trees using remote sensing imagery data through a machine-learning model in the R programming language. To the best of our knowledge, this is the inaugural investigation utilizing remote sensing for the early identification of peach flatheaded root borer infestations in an orchard, and one of the few studies employing multispectral imaging to detect the early stages of wood-boring insect infestations in trees. The crucial variables identified included the mean NDVI, mean NDRE, and crown area. Notably, the XGBoost model demonstrated superior performance in terms of accuracy and precision, closely followed by NN. In terms of F-measure and recall, NN led, followed by XGBoost. Our findings indicated that multispectral remote sensing achieved discrimination between healthy and damaged trees with 85% accuracy, establishing it as a reliable method for the swift and accurate prediction of PFRB infestations in stone and pome fruit orchards. While the study unveiled promising applications, several future challenges, such as distinguishing wood-boring insect infestations in different cultivations, need attention. Despite the necessity for further validation, this research provides compelling evidence that multispectral imaging holds potential for integrated pest management (IPM) strategies targeting wood-boring insects, contributing to a reduction in pesticide use.

Author Contributions

Conceptualization, A.T.; methodology, E.A., C.P. and A.A.; software, E.A., C.P. and A.A.; validation, E.A. and C.P.; formal analysis, A.K., A.A. and E.A.; investigation, E.A., K.K. and C.P.; data curation, E.A., C.P. and A.A.; writing—original draft preparation, E.A., A.A., C.D., C.P. and A.T.; writing—review and editing, E.A., A.A., C.D. and A.T.; visualization, E.A.; supervision, A.T.; project administration, A.T. and E.A.; funding acquisition, C.D. All authors have read and agreed to the published version of the manuscript.

Funding

This research was funded by THE RESEARCH AND INNOVATION FOUNDATION OF CYPRUS, grant number INTEGRATED/0918/0074, ‘OENOWATCH’.

Data Availability Statement

The data presented in this study are available on request from the corresponding author. The data are not publicly available due to also forming part of an ongoing study.

Acknowledgments

The authors would like to thank Petros Roussos from Labortory of Pomology of the Agricultural Univesrity of Athens, for the permission to use the experimental orchard.

Conflicts of Interest

The authors declare no conflict of interest.

References

  1. Nowak, D.J.; Pasek, J.E.; Sequeira, R.A.; Crane, D.E.; Mastro, V.C. Potential Effect of Anoplophora glabripennis (Coleoptera: Cerambycidae) on Urban Trees in the United States. J. Econ. Entomol. 2001, 94, 116–122. [Google Scholar] [CrossRef]
  2. Evans, H.F.; Moraal, L.G.; Pajares, J.A. Biology, Ecology and Economic Importance of Buprestidae and Cerambycidae. In Bark and Wood Boring Insects in Living Trees in Europe, a Synthesis; Springer: Berlin/Heidelberg, Germany, 2004; pp. 447–474. [Google Scholar]
  3. Mendel, Z.; Assael, F.; Ben-Yehuda, S. Host Selection and Root Colonization of Cyanogenic Stonefruit Species by Capnodis spp. (Coleoptera: Buprestidae). Ann. Entomol. Soc. Am. 2003, 96, 127–134. [Google Scholar] [CrossRef]
  4. Mfarrej, M.F.B.; Sharaf, N.I.S.I. Life Cycle of Peach Rootborer Capnodis tenebrionis L. (Coleoptera: Buprestidae) on Stone-Fruit Trees. Jordan J. Agric. Sci. 2010, 6, 579–589. [Google Scholar]
  5. Bari, G.; Scala, A.; Garzone, V.; Salvia, R.; Yalcin, C.; Vernile, P.; Aresta, A.M.; Facini, O.; Baraldi, R.; Bufo, S.A.; et al. Chemical Ecology of Capnodis tenebrionis (L.) (Coleoptera: Buprestidae): Behavioral and Biochemical Strategies for Intraspecific and Host Interactions. Front. Physiol. 2019, 10, 604. [Google Scholar] [CrossRef]
  6. Bonsignore, C.P.; Bellamy, C. Daily Activity and Flight Behaviour of Adults of Capnodis tenebrionis (Coleoptera: Buprestidae). Eur. J. Entomol. 2007, 104, 425–431. [Google Scholar] [CrossRef]
  7. Garcia del Pino, F.; Morton, A. Efficacy of Entomopathogenic Nematodes against Neonate Larvae of Capnodis tenebrionis (L.) (Coleoptera: Buprestidae) in Laboratory Trials. BioControl 2005, 50, 307–316. [Google Scholar] [CrossRef]
  8. Lehmann, J.; Nieberding, F.; Prinz, T.; Knoth, C. Analysis of unmanned aerial system-based cir images in forestry—A new perspective to monitor pest infestation levels. Forests 2015, 6, 594–612. [Google Scholar] [CrossRef]
  9. Iost Filho, F.H.; Heldens, W.B.; Kong, Z.; De Lange, E.S. Drones: Innovative Technology for Use in Precision Pest Management. J. Econ. Entomol. 2020, 113, 1–25. [Google Scholar] [CrossRef]
  10. Maes, W.H.; Steppe, K. Perspectives for Remote Sensing with Unamanned Aerial Vehicles in Precision Agriculture. Trends Plant Sci. 2019, 24, 152–164. [Google Scholar] [CrossRef]
  11. Vanegas, F.; Bratanov, D.; Powell, K.; Weiss, J.; Gonzalez, F. A novel methodology for improving plant pest surveillance in vineyards and crops using uav-based hyperspectral and spatial data. Sensors 2018, 18, 260. [Google Scholar] [CrossRef]
  12. Acharya, M.C.; Thapa, R.B. Remote sensing and its applications in agricultural pest management. J. Agric. Environ. 2015, 16, 43–61. [Google Scholar] [CrossRef]
  13. Lum, C.; Mackenzie, M.; Shaw-Feather, C.; Luker, E.; Dunbabin, M. Multispectral imaging and elevation mapping from an unmanned aerial system for precision agriculture applications. In Proceedings of the 13th International Conference on Precision Agriculture, St. Louis, MO, USA, 18–22 July 2016; Volume 31, pp. 4–10. [Google Scholar]
  14. Roman, A.; Ursu, T. Multispectral Satellite Imagery and Airborne Laser Scanning Techniques for the Detection of Archaeological Vegetation Marks. In Landscape Archaeology on the Northern Frontier of the Roman Empire at Porolissum: An Interdisciplinary Research Project; Mega Publishing House: Cluj-Napoca, Romania, 2016; pp. 141–152. [Google Scholar]
  15. Dash, J.P.; Watt, M.S.; Pearse, G.D.; Heaphy, M.; Dungey, H.S. Assessing very high resolution uav imagery for monitoring forest health during a simulated disease outbreak. ISPRS J. Photogramm. Remote Sens. 2017, 131, 1–14. [Google Scholar] [CrossRef]
  16. Johari, S.N.A.M.; Khairunniza-Bejo, S.; Shariff, A.R.M.; Husin, N.A.; Masri, M.M.M.; Kamarudin, N. Detection of bagworm infestation area in oil palm plantation based on uav remote sensing using machine learning approach. Agriculture 2023, 13, 1886. [Google Scholar] [CrossRef]
  17. Maes, W.H.; Huete, A.R.; Steppe, K. Optimizing the processing of uav-based thermal imagery. Remote Sens. 2017, 9, 476. [Google Scholar] [CrossRef]
  18. Bannari, A.; Morin, D.; Bonn, F.; Huete, A. A review of vegetation indices. Remote Sens. Revies 1995, 13, 95–120. [Google Scholar] [CrossRef]
  19. Rouse, J.W.; Haas, R.H.; Schell, J.A.; Deering, D.W. Monitoring vegetation systems in the great plains with erts. NASA Spec. Publ. 1974, 351, 309. [Google Scholar]
  20. Gitelson, A.; Merzlyak, M.N. Spectral reflectance changes associated with autumn senescence of aesculus hippocastanum l. and acer platanoides l. leaves. J. Plant Physiol. 1994, 143, 286–292. [Google Scholar] [CrossRef]
  21. Sims, D.A.; Gamon, J.A. Relationships between leaf pigment content and spectral reflectance across a wide range of species, leaf structures and developmental stages. Remote Sens. Environ. 2002, 81, 337–354. [Google Scholar] [CrossRef]
  22. Altman, D.G.; Bland, J.M. Diagnostic tests 1: Sensitivity and specificity. BMJ Br. Med. J. 1994, 308, 1552. [Google Scholar] [CrossRef]
  23. Altman, D.G.; Bland, J.M. Diagnostic tests 2: Predictive values. BMJ Br. Med. J. 1994, 309, 102. [Google Scholar] [CrossRef]
  24. Velez, D.R.; White, B.C.; Motsinger, A.A.; Bush, W.S.; Ritchie, M.D.; Williams, S.M.; Moore, J.H. A balanced accuracy function for epistasis modeling in imbalanced datasets using multifactor dimensionality reduction. Genet. Epidemiol. Off. Public Int. Genet. Epidemiol. Soc. 2007, 31, 306–315. [Google Scholar] [CrossRef] [PubMed]
  25. Kuhn, M. Building Predictive Models in R Using Caret Package. J. Stat. Softw. 2008, 28, 1–26. [Google Scholar] [CrossRef]
  26. Nick, T.G.; Campbell, K.M. Logistic Regression. In Topics in Biostatistics; Methods in Molecular BiologyTM; Humana Press: Totowa, NJ, USA, 2007; Volume 404, pp. 273–301. [Google Scholar]
  27. Skawsang, S.; Nagai, M.K.; Tripathi, N.; Soni, P. Predicting rice pest population occurence with satellite-derived crop phenology, ground meterological observation, and machine learning: A case study for the central plain of thailand. Appl. Sci. 2019, 9, 4846. [Google Scholar] [CrossRef]
  28. Abiodun, O.I.; Jantan, A.; Omolara, A.E.; Dada, K.V.; Mohamed, N.A.; Arshad, H. State-of-the-art in artificial neural network applications: A survey. Heliyon 2018, 4, e00938. [Google Scholar] [CrossRef] [PubMed]
  29. Belgiu, M.; Drăguţ, L. Random Forest in Remote Sensing: A Review of Applications and Future Directions. ISPRS J. Photogramm. Remote Sens. 2016, 114, 24–31. [Google Scholar] [CrossRef]
  30. Fauzan, M.A.; Murfi, H. The accuracy of xgboost for insurance claim prediction. Int. J. Adv. Soft Compu. Appl. 2018, 10, 159–171. [Google Scholar]
  31. Fassnacht, F.E.; Latifi, H.; Ghosh, A.; Joshi, P.K.; Koch, B. Assessing the potential of hyperspectral imagery to map bark beetle-induced tree mortality. Remote Sens. Environ. 2014, 140, 533–548. [Google Scholar] [CrossRef]
  32. Lausch, A.; Heurich, M.; Gordalla, D.; Dobner, H.-J.; Gwillym-Margianto, S.; Salbach, C. Forecasting potential bark beetle outbreaks based on spruce forest vitality using hyperspectral remote-sensing techniques at different scales. For. Ecol. Manag. 2013, 308, 76–89. [Google Scholar] [CrossRef]
  33. Lin, Q.; Huang, H.; Wang, J.; Huang, K.; Liu, Y. Detection of pine shoot beetle (psb) stress on pine forests at individual tree level using uav-based hyperspectral imagery and lidar. Remote Sens. 2019, 11, 2540. [Google Scholar] [CrossRef]
  34. Pontius, J.; Hanavan, R.P.; Hallett, R.A.; Cook, B.D.; Corp, L.A. High spatial resolution spectral unmixing for mapping ash species across a complex urban environment. Remote Sens. Environ. 2017, 199, 360–369. [Google Scholar] [CrossRef]
  35. Pontius, J.; Martin, M.; Plourde, L.; Hallett, R. Ash decline assessment in emerald ash borer-infested regions: A test of tree-level, hyperspectral technologies. Remote Sens. Environ. 2008, 112, 2665–2676. [Google Scholar] [CrossRef]
  36. Yu, R.; Luo, Y.; Li, H.; Yang, L.; Huang, H.; Yu, L.; Ren, L. Three-dimensional convolutional neural network model for early detection of pine wilt disease using uav-based hyperspectral images. Remote Sens. 2021, 13, 4065. [Google Scholar] [CrossRef]
  37. Yu, R.; Luo, Y.; Zhou, Q.; Zhang, X.; Wu, D.; Ren, L. A machine learning algorithm to detect pine wilt disease using uav-based hyperspectral imagery and lidar data at the tree level. Int. J. Appl. Earth Obs. Geoinf. 2021, 101, 102363. [Google Scholar] [CrossRef]
  38. Yu, R.; Ren, L.; Luo, Y. Early detection of pine wilt disease in pinus tabuliformis in north china using a field portable spectrometer and uav-based hyperspectral imagery. For. Ecosyst. 2021, 8, 44. [Google Scholar] [CrossRef]
  39. Luo, Y.; Huang, H.; Roques, A. Early monitoring of forest wood-boring pests with remote sensing. Annu. Rev. Entomol. 2023, 68, 277–298. [Google Scholar] [CrossRef]
  40. Iordache, M.-D.; Mantas, V.; Baltazar, E.; Pauly, K.; Lewyckyj, N. A machine learning approach to detecting pine wilt disease using airborne spectral imagery. Remote Sens. 2020, 12, 2280. [Google Scholar] [CrossRef]
  41. Yu, R.; Luo, Y.; Zhou, Q.; Zhang, X.; Wu, D.; Ren, L. Early detection of pine wilt disease using deep learning algorithms and uav-based multispectral imagery. For. Ecol. Manag. 2021, 497, 119493. [Google Scholar] [CrossRef]
  42. Chen, T.; Guestrin, C. XGBoost: A Scalable Tree Boosting System. In Proceedings of the 22nd ACM Sigkdd International Conference on Knowledge Discovery and Data Mining, San Francisco, CA, USA, 13–17 August 2016; pp. 785–794. [Google Scholar]
  43. LeCun, Y.; Bengio, Y.; Hinton, G. Deep Learning. Nature 2015, 521, 436–444. [Google Scholar] [CrossRef]
  44. Esquivel, I.L.; Starek, M.J.; Popescu, S.; Brewer, M.J.; Coulson, R.N. Preliminary approach in detecting cotton fleahopper induced damage via unmanned aerial systems and normalized difference vegetation indices. J. Cotton Sci. 2021, 25, 79–90. [Google Scholar] [CrossRef]
  45. Kim, Y.H.; Yoo, S.J.; Gu, Y.H.; Lim, J.H.; Han, D.; Baik, S.W. Crop pests prediction method using regression and machine learning technology: Survey. IERI Procedia 2014, 6, 52–56. [Google Scholar] [CrossRef]
  46. Severtson, D.; Callow, N.; Flower, K.; Neuhaus, A.; Olejnik, M.; Nansen, C. Unmanned aerial vehicle canopy reflectance data detects potassium deficiency and green peach aphid susceptibility in canola. Precis. Agric. 2016, 17, 659–677. [Google Scholar] [CrossRef]
  47. Avtar, R.; Watanabe, T. Unmanned Aerial Vehicle: Applications in Agriculture and Environment; Springer International Publishing: Cham, Switzerland, 2020. [Google Scholar]
  48. Carlson, T.N.; Ripley, D.A. On the relation between ndvi, fractional vegetation cover, and leaf area index. Remote Sens. Environ. 1997, 62, 241–252. [Google Scholar] [CrossRef]
  49. Wójtowicz, M.; Wójtowicz, A.; Piekarczyk, J. Application in remote sensing methods in agriculture. Commun. Biometry Crop Sci. 2016, 11, 31–50. [Google Scholar]
Figure 1. The structure of a healthy leaf and the part of the radiation it absorbs and reflects. As the figure shows, red and blue radiation of the visible spectrum is mostly absorbed by the mesophyll of the leaf while the NIR (near-infrared) and green radiation (visible spectrum) is reflected [14].
Agronomy 14 00020 g001
Figure 2. Mera quadcopter (UcanDrone S.A., Koropi Attica, Greece) which was used in the flights.
Agronomy 14 00020 g002
Figure 3. Orthomosaic map of the stone fruit and pome fruit orchard of the Agricultural University of Athens, as it was generated in Metashape program and visualized in QGIS.
Agronomy 14 00020 g003
Figure 4. (a) Digital surface model (DSM) and (b) digital terrain model (DTM) of the orchard of Agricultural University of Athens. The stone and pome fruit orchards can be seen with a black border.
Agronomy 14 00020 g004
Figure 5. Map of the area of the study with the calculated NDVI (a) and NDRE (b) for the flight of 24 September 2021. Similarly, the same maps were generated for all of the flights. On this date, NDVI values ranged from −0.17 to 0.92 while NDRE values ranged from −0.25 to 0.58.
Agronomy 14 00020 g005
Figure 6. Digitization map of the trees in the orchard of the study for the flight of 28 May 2021, having calculated mean NDVI values for every tree. The same method was used in all of the flight dates so as to calculate the mean NDVI and mean NDRE values, as well as the area of the trees.
Agronomy 14 00020 g006
Figure 7. Adults of C. tenebrionis on the trunk of a stone fruit tree in Agricultural University of Athens.
Agronomy 14 00020 g007
Figure 8. The correlation matrix of the predictor variables.
Agronomy 14 00020 g008
Figure 9. The importance of variables per learning algorithm on the training data. In this input contribution figure, it seems that mean NDVI is the most crucial factor for all the learning algorithms, closely followed by tree crown area and mean NDRE.
Agronomy 14 00020 g009
Figure 10. The confusion matrix for the following machine-learning algorithms: (A) Random Forest, (Β) Neural Network, (C) XGBoost, and (D) Logistic Regression.
Agronomy 14 00020 g010
Figure 11. Comparison of four algorithms in accuracy, F-measure, precision, and recall.
Agronomy 14 00020 g011
Table 1. The descriptive statistics of the predictor variables (mean NDVI, mean NDRE, Tmean, RHmean, and tree crown area).
Mean NDVIMean NDRETmean (°C)RHmean (%)Area (m2)
mean0.530.2224.4655.002.15
std0.220.262.606.763.00
median0.570.08624.0552.871.11
min−0.02−0.1520.0947.560.01
max0.880.7427.9465.9419.75
N252252252252252
Disclaimer/Publisher’s Note: The statements, opinions and data contained in all publications are solely those of the individual author(s) and contributor(s) and not of MDPI and/or the editor(s). MDPI and/or the editor(s) disclaim responsibility for any injury to people or property resulting from any ideas, methods, instructions or products referred to in the content.