Review

Phosphorus HotSpots in Crop Plants Production on the Farm—Mitigating Critical Factors

by
Witold Grzebisz
1,*,
Alicja Niewiadomska
2,
Jarosław Potarzycki
1 and
Agnieszka Andrzejewska
1
1
Department of Agricultural Chemistry and Environmental Biogeochemistry, Poznan University of Life Sciences, Wojska Polskiego 28, 60-637 Poznan, Poland
2
Department of Soil Sciences and Microbiology, Poznan University of Life Sciences, Wojska Polskiego 28, 60-637 Poznan, Poland
*
Author to whom correspondence should be addressed.
Agronomy 2024, 14(1), 200; https://doi.org/10.3390/agronomy14010200
Submission received: 18 December 2023 / Revised: 11 January 2024 / Accepted: 12 January 2024 / Published: 16 January 2024
(This article belongs to the Section Soil and Plant Nutrition)

Abstract

:
Phosphorus resources, both in phosphate rocks and in the soil, are limited. However, effective food production is not possible without the use of P fertilizers. Recognizing and eliminating or at least ameliorating factors (hot spots) that interfere with the uptake and use of phosphorus (P) by crop plants is of key importance for effective use of both P and nitrogen (N) on the farm. Plants have developed many adaptation mechanisms to their environment, i.e., soil low in available phosphorus. The most important ones include the secretion of organic compounds into the rhizosphere and the association of plant roots with microorganisms. A classic example is mycorrhiza. These mechanisms can be used by the farmer to sequentially select plants in the crop rotation. The uptake of inorganic P (Pi) by plants from the soil is reduced by environmental (temperature and water) and soil factors (low content of available phosphorus, soil acidity, soil compaction). These factors are responsible for the growth and size of the root system. Mitigating these negative effects improves the efficiency of phosphorus uptake from the soil. The second group of critical factors, limiting both root growth and availability of phosphorus, can be effectively controlled using simple measures (for example, lime). Knowing this, the farmer must first control the level of soil fertility in the plant’s effective rooting zone and not only in the topsoil. Secondly, the farmer must multiply the productivity of applied mineral fertilizers used through targeted recycling: crop rotation, crop residues, and manure.

1. Introduction

The human population is constantly growing, which consequently increases the demand for food. In 2050, according to current forecasts, the necessary increase in food production compared with 2010 will increase by 35% to 56% [1]. The order of crop plants contributing to global food security is (in %): cereals (49) > oils (12.5) > meat and eggs (9.5) ≥ sugar (9.0) > rubber crops (5.4) > fruits (3) [2]. In recent years, many concepts and even strategies have emerged to solve the problem of the continuously growing food gap, including a reduction in people’s demand for energy and protein, such as the concept of a “healthy diet” and “artificial meat”. However, the most realistic challenge for humanity is to reduce the amount of food waste [3,4].
Given the current conditions of life on Earth, attention needs to be focused on two realistic strategies to increase food production. The first, known from the beginning of human agricultural activity, comes down to an increase in the area of arable land. This strategy, seemingly simple, is difficult to implement because the potentially productive soils are in the tropics. The limitation in the use of rainforest soils, which occurs anyway, will be real and drastic climate change. Secondly, these soils require large investment, mainly due to a naturally low pH and high capacity to fix inorganic phosphorus (Pi) [5,6,7]. On such soils, in the second year after clearing the forest, 90% of the harvested yield depends on the use of mineral fertilizer and lime [8]. The second strategy, essentially intensive, assumes an increase in the yield of key crops that determine the global production of energy and protein. This set of crops includes mainly cereals (wheat, rice, and maize), legumes (soybean), and oil crops (oilseed rape, sunflower) [9]. The real yield increase for maize, wheat, rice, and soybean is much below target of 2.4% annually, currently reaching 1.6%, 0.9%, 1.0%, and 1.3%. For these values, global production would increase by 67%, 38%, 42%, and 55%, respectively, i.e., well below what is required to cover the food gap in 2050 [10].
The expected increase in plant production requires maintaining an appropriately high level of soil fertility. Phosphorus is the basis of soil fertility, being considered as a “Bottleneck of Life” in the food security strategy [11]. The yield-forming effect of P results from its metabolic and physiological functions in the plant. P is a component of several nucleotides and carriers of metabolic energy, e.g., DNA (deoxyribonucleic acid), RNA (ribonucleic acid), FMN (flavin mononucleotide), FAD (flavin adenine dinucleotide), CoA (coenzyme A), ATP (adenosine triphosphate), ADP (adenosine diphosphate), NAD (nicotinamide adenine dinucleotide), and NADP (nicotinamide adenine dinucleotide phosphate) [12]. The primary function of P is its presence in organic particles that are carriers of genetic information, i.e., DNA. Without this particle, the organism could not reproduce, and therefore the plant would not produce fruits, for example, grains, or seeds [13]. However, for DNA particles to use their reproductive effect, the plant must take up a certain amount of P from the soil. Moreover, this process must occur within a precisely defined phase of the seed plant’s growth [14]. Uptake of nutrients from the soil requires the input of metabolic energy, the carrier of which is ATP [15].
A farm is a production unit in which usually more than one crop is grown. Monocultures such as oil palm or sugar can dominate in the tropics and subtropics [16]. In a classic farm, crops are grown in the field in a specific time sequence (growing season), termed as crop rotation [17]. Plants cultivated on the farm have different demands for P, taking into account soil resources and the required P fertilizer doses. For this reason, P management varies between crops within the year (growing season) and in subsequent growing seasons [18,19]. The effective use of the soil P resources must be adjusted both to the requirement of the most sensitive crop in the fixed crop rotation for a given field and to the content of available P in the rooting zone of this crop. Only the farmer, i.e., his knowledge and acquired skills, determine the effective control of P management, both on the farm and in the field. The main purpose of the article is to identify those P hotspots on the farm that determine its availability and utilization by the cultivated crops.

2. Scientific Concept—Research Materials

This article in the form of a conceptual review was prepared based on strictly defined research assumptions. In this research methodology, each scientific assumption requires validation based on available scientific materials. In this type of study, the researcher interprets the data in the analyzed thematic set of articles from his viewpoint, based on the originally established assumptions [20].
Every farmer working on the farm recognizes the effect of P on the growth and yield of cultivated crops. However, P is often used routinely, not resulting from the realistically assessed needs of the cultivated crops in a well-defined crop rotation. This conclusion refers to the P fertilizer dose, choice of P fertilizer, and method of its application. The first, almost fundamental error in the management of P on the farm, even a certainty, perpetuated by fertilization recommendations” for almost 180 years, is the assumption that this nutrient applied in the fertilizer acts in the same way as nitrogen (N). On the other hand, plant production, which is the basis of food production, cannot occur without P. This basic relationship between N, in fact N–NO3 and other production factors, can be expressed by the following algorithm:
E N =   N N O 3   E n v i r o n m e n t a l   f a c t o r s , s o i l   f a c t o r s ,   N N H 4 ,   P ,   K ,   M o ,   a g r o n o m i c   f a c t o r s
The key limitation of the yield-forming efficiency of N (EN) is the amount of N–NO3 in the rooting zone of the currently grown crop [14,21,22]. The presence of P and other nutrients in the denominator clearly defines their role both in the processes of N uptake and its transformation in the plant. There is a strong molecular and physiological interaction between N and P, decisive for the rate of crop plant growth [23]. Therefore, the main goal of rational, sustainable management of P on the farm in the first place is the optimization of N management, to the extent that the production potential of the currently cultivated crop is maximally exploited. Secondly, the availability of soil P must not be a limiting factor for the target crop on the farm or alternatively for the most sensitive crop to P supply in the fixed crop rotation.
Based on the assumption, the main processes governing P management in plant production on the farm were discussed. At the same time, attention was paid to their complexity, including interactions taking place. The current state of the given processes is supported by documentary material, which includes simplified process models and photographic documentation. The material is presented in a way that allows the reader to draw his own conclusions.

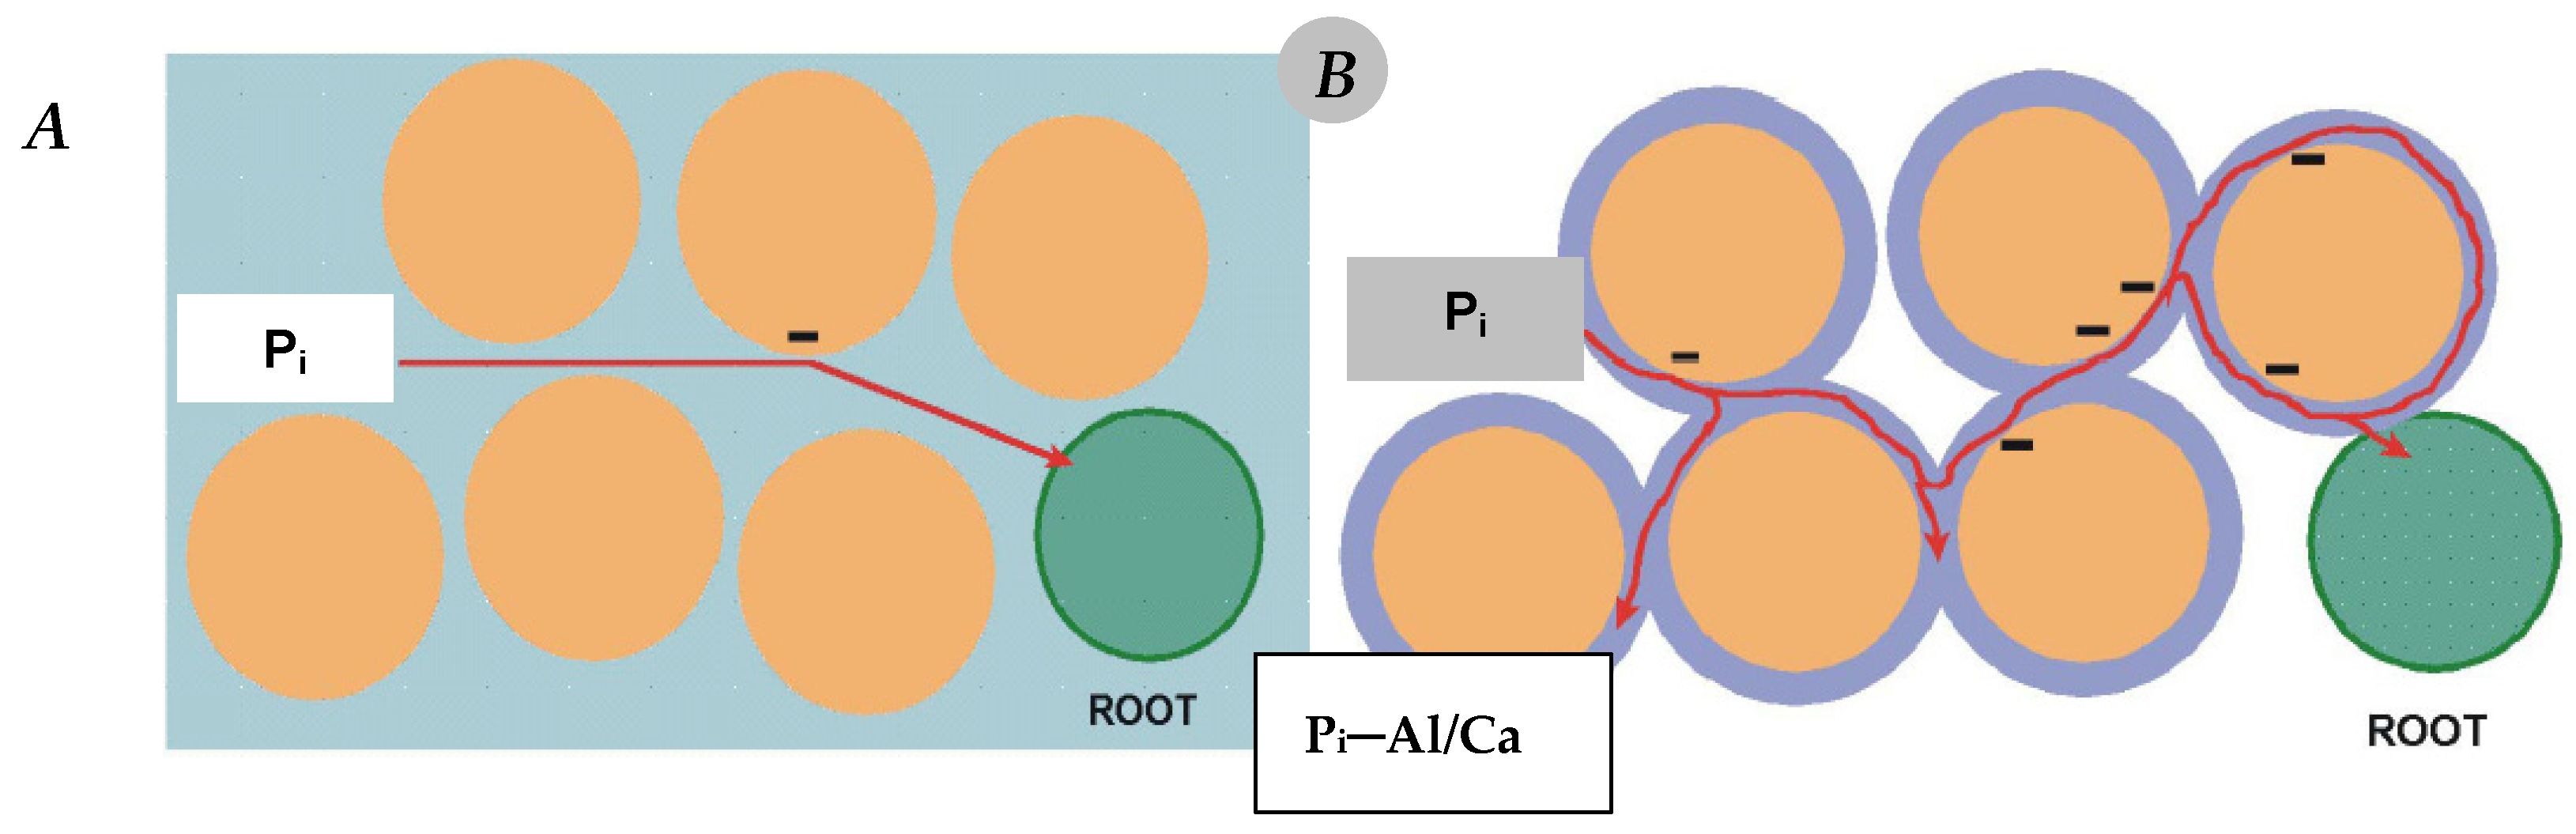
3. Mechanisms of Phosphorus Uptake

Phosphorus is taken up by plant roots from the soil solution in the form of H2PO4−1 ions (Pi), the concentration of which ranges from 1 to 100 µM. In the plant root tissues, its concentration is many times higher, ranging from 5 to 20 mM [24]. A Pi concentration below 10 µM in the growth medium is considered as critical for the growth of crop plants [25]. The uptake of Pi by a plant from the soil solution is a complex, multi-phase process. The two basic stages are:
(1)
Passive—flow of Pi anions in the soil solution towards the plant root surface;
(2)
Active—transfer of the Pi ions across the plasmalemma of the cortical root cell.
The potential of the soil to feed the crop plant with P results from:
(1)
Pi concentration in the soil solution;
(2)
Root absorption surface;
(3)
Transport rate of Pi ions from the soil solution to the root surface;
(4)
The rate of Pi ions’ incorporation into the plant’s metabolic processes.
The accumulation of Pi ions on the root surface depends on the rate of their diffusion (Id, µg cm−2 s−1) in the soil solution [26]. This process is subject to Fick’s law, according to which the rate of ions’ movement in the solution depends on both their concentration gradient (dc × dx−1, µg cm−3 cm−1) and the value of the diffusion coefficient (Deff, cm2 s−1):
I d = D e f f × ( d c × d x ) 1
A necessary condition for this process to occur is a plant, or more precisely, a plant root in the soil. The sufficient condition is the content of Pi ions in the appropriate concentration in the soil solution. The plant root is the factor that changes the initial concentration of ions in the soil solution, creating a concentration gradient toward the root and thus inducing their flow. According to the mechanistic model of P uptake by a plant root, the amount of the absorbed nutrient depends on the root surface area [27]. This plant’s characteristics are determined by the rate of root growth into the soil and its diameter. Therefore, one of the most important factors determining the P nutrition of a crop plant is the size of the root system, defined by the root density and the plant’s effective rooting depth [Table 1]. This trait of the crop plant is genetically determined, but at the same time, it shows a strong response to environmental (soil, water content, temperature) and physiological factors (nutritional state of the plant) [28,29]. Among the soil factors, the most important are the concentration of Pi in the soil solution and the value of its diffusion coefficient. The value of the Pi coefficient in the soil solution at field capacity is in the range of 10−9 cm2 s−1. For comparison, the N–NO3 coefficient is at least 1000 times greater and amounts to 1 × 10⁻⁶ cm2 s−1 [30].
Two aspects of Pi uptake by crop plants require special attention from the farmer. The first is the impact of soil moisture on the value of Pi coefficient. Variable water content during the growing season is a natural phenomenon. It affects most severely the topsoil, which is rich in P (at least compared with the subsoil). As a consequence, this soil layer becomes heavily overgrown with roots [33]. The decrease in water content in the soil, in turn, increases the contribution of capillary pores filled with air. These conditions lead to a decrease in the values of diffusion coefficients, the strongest for Pi. As a consequence, the amount of P reaching the plant root surface decreases (Figure 1).
The seemingly small reduction in the water content from 27% to 22% resulted in a drastic decrease in the length of maize roots, consequently leading to a significant reduction in P uptake by plants [34]. The negative impact of water shortage on P supply to the plant can be at least partially mitigated by maintaining a higher content of available P in the soil solution. Most crop plants take up and accumulate large amounts of P during the initial growth phase, usually in optimal soil water conditions [35,36]. The high P uptake by the plant during this period, which is only apparently luxurious, increases its tolerance to water stress in the later stages of growth, which are crucial for yield formation. A classic example is maize. Phosphorus deficiency in the fourth (fifth) leaf stage, in which the structure of generative organs is formed, is reflected in the flowering stage [37]. This state is manifested by poor development or even the complete disappearance of the cob (Figure 2).
The second aspect of supplying a plant with P is related to the supply of nitrate nitrogen (N–NO3). This molecule behaves like a plant morphogen [38]. The decreasing content of N–NO3 in the growth medium stimulates the growth of main roots (primary roots, seminal roots) into new areas of soil and an accompanying reduction in the growth of lateral roots. Opposite effects are observed when the content of N-NO3 increases in the growth medium [39]. N-NO3 ions are very labile in the soil solution, so these resources are quickly depleted, forcing the plant to penetrate new areas of the soil, rich in both water and nitrates. As a result of these processes, the plant abandons previously exploited soil. As a consequence of these processes, the use of freshly applied phosphorus does not exceed 5% (maximum 20%). However, the actual use of Pi from the soil solution can reach even 60% [40,41].
The process of P uptake from the soil solution requires the plant to use metabolic energy, the main source of which is the ATP (adenosine triphosphate) molecule. Its basic components are P and N, so there is a close interaction of both nutrients at the primary level for the functioning of a living organism [42]. The paradox of this process is that the plant efficiently takes up Pi from the soil solution, provided it is in a good nutritional P state (Figure 3). The ion H2PO4−1 that is to be transported across the cytoplasmatic membrane must first be protonated {[2H+ × H2PO4−1]+}. This process requires energy provided by ATP [43]. A necessary condition for the stabilization of these processes is a constant, stable content of P in the cell cytoplasm. The P content in other compartments of the cell and plant organs is variable. The greatest variability occurs in the vacuole [12].

4. Response Strategies of Crop Plants to Pi Deficiency

Plants usually show a high level of adaptation to changes in P supply, from the molecular, through physiological, and finally morphological levels. Root epidermal cells, induced by a signal from the shoot, synthesize and release acid phosphatases into the rhizosphere. Enzymes from the PAPS (3′-Phosphoadenosine-5′-phosphosulfate) family operate in the soil at pH of 4 to 7.7 and in a wide range of temperature of 25–60 °C [44]. The secretion of acid phosphatases by roots of P-deficient barley plants into the rhizosphere is in principle greater than the number of intracellular phosphatases produced in shoots [45]. These enzymes hydrolyze Pi from organic soil P compounds [46]. Plants deficient in P also excrete into the rhizosphere other organic compounds, which may constitute 10–25% of total fixed carbon. The synthesis of PAPs by soybean and common bean roots is considered to be a tolerance mechanism to the low Pi concentration in the soil Pi [47]. Some plants, mainly cereals, including maize, oil rapeseed, alfalfa, and chickpea secrete organic acids in response to two factors, i.e., P deficiency and Al toxicity [47]. It is well recognized that Al cations, depending on the oxidation state, are active in Pi absorption or fixation, lowering their concentration in the soil solution. The root’s secretions are dominated by organic acids, mainly citric, malate, and oxalate (Table 2). The main geochemical role of these compounds is to solubilize Pi from Ca, Al, and Fe phosphates. Citric acid has the highest efficiency in releasing Pi from organic-Pi-esters [46].
Another mechanism of plant response to moderate P deficiency is progressive infection and symbiosis with mycorrhizal fungi [51]. The latter phenomenon does not include plants from the Brassicaceae and Chenopodiacae families [52,53]. Therefore, for optimal growth, these plants require soil with a pH in the neutral range, at least. In soil solution with a pH on the neutral/alkaline border, the P mineral called brushite dominates [53]. The hypothetical effect of a rhizosphere acidifying plant (families Brassicaceae, Fabaceae) is as follows:
C a H P O 4 + H + = C a 2 + + H 2 P O 4 1
This equation unambiguously states that the main form of P taken up by plants from the soil solution is the H2PO4−1 ions and not HPO4−2, as it often appears in some academic textbooks and/or scientific articles.
Mycorrhiza is a common phenomenon occurring between two kingdoms, plants and fungi, involving mutual symbiosis. Both ectotrophic and endotrophic (arbuscular) mycorrhizal fungi (AMF) are important for plants’ growth and development [54]. This group of fungi belongs to the phylum Glomeromycota [55] and is present in over 90% of land plants [56]. AMF fungal hyphae germinating in the root cortex come into physical contact with the host plant. They elongate and grow intercellularly through appressoria, and penetrate the cortex root cells, where they form arbuscules [57]. At the same time, the fungus forms extracellular hyphae that grow into the soil, thereby increasing the root surface area. Their main function is the absorption of water and nutrients, mainly P and N [58]. The fungal hyphae are 100 times smaller in diameter than the smallest root and 10–20 times smaller than the diameter of the root hair. In drought conditions, when the hydraulic potential of the soil is very low, fungal hyphae participate in water uptake [59]. AMF have a key role in phosphate uptake particularly in P-deficient soils by mobilizing P from rock phosphate [60]. Hyphae exudates can decompose larger soil organic molecules, containing both N and P compounds [61]. The transfer of N from organic matter to plant tissues by AMF hyphae has been documented to increase plant biomass [62].
Severe P deficiency in a crop plant, i.e., P starvation, leads to a reduction in the total root system size [63]. However, it is assumed that in conditions of P deficiency below 1 µM in the growth medium, some plants form cluster roots (proteid roots), which are a specific superabundance of root hairs or a tertiary form of lateral roots. Moreover, most plants of these species do not form mycorrhizal associations. This type of adaptation mainly involves natural plants, and the classic examples are plants from the Proteaceae family. Among crop plants, cluster roots form on pumpkin, white lupine, yellow lupine, and macadamia. These roots excrete huge amounts of protons, carboxylates, and also acid phosphatases into the narrow zone around the root (around 1 mm). As a result of this dual root activity, Pi is released both from inorganic and organic P compounds [64,65].
Farmers should consider three practical solutions based on the P uptake characteristics of crops grown on the farm. The first concerns the type of plant’s response to P deficiency. Based on the response of crop plants to low P deficiency, it was found that in the group of plants with fibrous root systems, such as cereals, the morphological type of adaptation dominates. In contrast, legumes show a dominant physiological type of adaptation, involving the secretion of protons and organic acids into the rhizosphere [66]. In the case of cruciferous plants, three interacting types of adaptation should probably be considered. These plants can be classified as morphologically adapted as indicated by their large, extensive root systems [Table 1; [67]]. Moreover, the roots of these plants release organic compounds into the soil, in turn inducing the activity of soil microorganisms [68]. On the other hand, cruciferous plants are usually grown on neutral or alkaline soil. In such geochemical conditions, phosphorus is in forms unavailable to plants. To absorb P, a plant must acidify the rhizosphere [69]. As a consequence, legumes or cruciferous plants create a very favorable growth environment for the successor crop, which usually is cereal. Crop rotation, taking into account both groups of plants, is one of the most beneficial systemic solutions in P management on the farm.

5. Environmental Factors Controlling Phosphorus Uptake by Crop Plants

5.1. Temperature

The uptake of Pi from the soil solution and, thus, the growth and development of a crop plant are affected by many environmental factors [70]. Of these, the key ones are temperature and water. The soil temperature is usually lower than the air temperature, but its fluctuation has a significant impact on the content of water, which determines the supply of nutrients to the root surface [71]. Two temperature extrema are important to recognize the response of the plant’s root system, i.e., minimum and maximum. The root growth proceeds up to the optimal range of temperature for a given species [72]. As reported by Fonseca de Lima et al. [73], the optimum temperature for root growth of temperate cereals is in the range of 15–20 °C, for rice 25–28 °C, and tropical maize 25–35 °C. Extreme temperatures during the reproductive phase, i.e., during the final stages of yield formation, lead to a significant reduction in the grain weight [74].
Plants are most sensitive to temperature extremes during juvenile stages of growth because the root system is not well developed. Exposure of crop plants to low temperature stress (LTS: chilling temperature range of 0–15 °C) significantly reduces the main traits of the root system architecture (RSA). For example, wheat seedlings exposed for 14 days to a temperature of 4 ± 1 °C decrease their absorption potential for uptake of nutrients [75]. The key reason is the reduction in the root surface area. Tropical crops such as sugarcane are strongly sensitive to chilling stress. The drop in temperature below 4 °C results in root activity decrease in the range of 64–80% due to reductions in root length, root diameter, and root hair density, and also disturbance in root gravitropism [76]. The slowdown in the rate of root growth of plants exposed to low temperatures is due to the reduced accumulation of auxin in the root apex, in turn repressing the rate of meristematic cell division. At the same time, the increasing content of cytokinin suppresses the growth of roots. The root system for an optimum elongation rate requires high auxin transport to the root apex and at the same time, a low content of cytokinin [76,77].
The disturbance in both morphological and physiological traits of crop plants due to extreme soil temperatures results in significant reduction in water and nutrient uptake. The end effect is a drop in yield [78]. The impact of extremely high temperatures on the RSA results in (i) a reduction in the length of the primary root, (ii) reductions in the growth rate and the number of lateral roots, (iii) an increase in the number of the second-and third-order roots, which have also a larger diameter, (iv) a lower angle of new, emerging lateral roots, (v) inhibition of the number and length of shoot-borne roots (adventitious and nodal roots—maize for example), (vi) an increase in the number and length of root hairs [79]. The total reduction in the growth rate of the root system and its size results in a narrower root/shoot ratio, mainly due to a much stronger reduction in the shoot biomass compared with the root biomass. Moreover, every 10 °C increase in soil temperature results in the respiration rate doubling, leading to a strong loss of dry matter [80]. The increased temperature activates calcium channels in the cytoplasmatic membrane, in turn increasing the flow of Ca2+ ions into the cell and inducing heat shock transcription factors [81]. This is important information for farmers working with sandy soils, which are naturally poor in calcium. These negative effects of extreme temperatures can be counterbalanced by increasing the supply of water, including through irrigation and phosphorus fertilizer [82].

5.2. Water—Drought

In the classic hierarchy of yield-forming factors, water is considered the yield-limiting factor [83]. Water controls the plant’s life processes at various levels of its organization [84]:
(1)
Cells: (i) water photolysis—water acts as a nutrient; (ii) a component of spatial structures of organic compounds, including proteins, carbohydrates, and fats; (iii) a component of the osmotic sap of cells;
(2)
Tissues and organs: (i) connects cells to form tissues and then organs; (ii) determines the turgor of conducting cells (xylem); (iii) a critical component of assimilates transported in the phloem;
(3)
Plant: controls (i) the optimum level of temperature through transpiration of water and thus the rate of metabolic processes, (ii) the movement of stomata during the circadian cycle, and (iii) CO2 uptake from the atmosphere.
Water flows in the soil–plant–atmosphere continuum according to the principle of decreasing water potential: from the soil (−0.03 to −1.5 MPa megapascal), through the plant root (−0.3 to −2.0 MPa), then arriving at leaves (−1.5 to −3.0 MPa), and finally to the atmosphere (−50 MPa) [85]. The movement of water from the soil to the plant root is induced by hydrostatic root pressure, forcing water to move from the root pericycle to the xylem. Root pressure requires the expenditure of metabolic energy and therefore occurs only in the youngest, not finally formed tissues [86]. For this reason, the plant’s water uptake depends on the potential and the physical properties of the growing roots to penetrate the soil. On the other hand, the physical properties of the soil (texture, structure, penetrance resistance) determine both the amount of water available to the plant and the conditions of root growth [87]. During the growing season, under natural rainfall conditions, the amount of water available is variable, increasing its non-homogenous distribution in the soil profile. In conditions of increasing water shortage, intensified by drought, the growth of lateral roots takes place mainly in the water-rich soil paths [88,89]. The mechanism of active search by lateral roots for water, called hydrotropism or hydro-patterning, is controlled by auxins in response to the difference in water potential in the roots. As a consequence, in dry parts of the soil body, the growth of lateral roots is drastically reduced. This phenomenon is called xerobranching [90]. The response of the plant root morphological traits to drought is deeply associated with the type of root system. The rooting depth is the most conservative RSA trait because it does not undergo changes in response to drought [87]. The most sensitive traits, responding negatively to drought regardless of the plant species, are the root length and root dry weight, whereas root hair length and root hair density show the opposite trend. Differences between key types of roots refer mainly to the root diameter. Plants with a tap root system show a clear response to water stress. As a result of water stress, the root/shoot ratio decreases, because the shoot biomass shows a much stronger reduction than the root biomass [90,91,92].
In plant production, the expected yield is influenced not only by the plant’s total water demand and its efficiency (transpiration coefficient), but mainly due to its supply during the critical phases of yield formation [93]. Too little water supply to the plant during this period leads to disruption of the yield-forming processes. In cereals, the maximum water depletion in the rooting zone should not exceed 40 (60)% in the period extending from the beginning of shooting to the beginning of flowering, while during the grain-filling period, it can even reach 70% [94,95]. Maize, despite a relatively low value of transpiration coefficient compared with cereals (270–400 versus 500–600 dm3 H2O kg−1 DW), is most sensitive to reduction in water content in the period from silking to the watery stage of kernel development (maximum water drop is 50%) [96,97].
Reduction in the root system size of crop plants under conditions of water stress, which is frequently concomitant with the thermal stress, must therefore lead to disruption in Pi uptake by crop plants. The meta-analysis by He and Dijkstra [98] showed a significantly higher reduction in P (−9.18%) than N (−3.73%) uptake by plants. The authors emphasized the significant impact of the length of the drought period and the role of drying–rewetting periods on N and P uptake by crop plants. In the authors’ opinion, short-term drought (<90 d) reduces N and P uptake more strongly than C assimilation by plants. The reduction in P uptake is due to the disruption of P flow towards the root, as well as the decrease in the content of Pi in the soil solution due to its precipitation and the decreased activity of microbes in the root rhizosphere [99]. This situation is especially dangerous for short-growing crops, especially when drought occurs during the period of intensive P accumulation [100].
Effective management of nutrients in world regions under seasonally changing weather conditions, including in-seasonal and irregular drought sequences, is difficult. At least two aspects need to be considered. The first, strategic one assumes maintaining a high content of available P in the rooting zone of cultivated plants, especially those sensitive to P supply during the critical period of yield formation. The second, tactical one concerns fertilizer treatments, assuming lower P uptake by plants in a dry season. In light of the strategy of sustainable P management, the question arises here whether an increase in P doses or the level of the soil Pi content can alleviate, at least partly, the effect of water shortage on crop yield. As shown in Figure 4, increased doses of P under water stress in the critical period of wheat yield formation did not reduce but actually increased the yield gap, which doubled for the optimal P dose relative to the P control (0.81 → 1.65 g plant−1). However, the plant was sufficiently supplied with P, as evidenced by a linear increase in the P content in both shoots and grain (Figure 5). Wheat plants under water stress, regardless of the P dose, contained more P in both straw and grain. The key difference between well-watered and water-stressed plants was the number of grains per plant, which was lower in plants subjected to water stress [101]. This simple experiment allows us to formulate two general conclusions. The first is consistent with Körner’s hypothesis [102] that nutrient resources, in this case referring to P, accumulated in the pre-flowering period by the crop plant will not be used when the sink capacity is too low. The second conclusion indicates the need to create growth conditions for at least full exploitation of P resources in the plant. This is possible, provided the sink is large [41].
The long-term analysis of yields in temperate regions of the world indicates a specific year-to-year variability. After yield declines in a dry year, it is at least partially compensated in the subsequent year, provided that the weather conditions are better. The suggested yield compensation mechanism is quite evident in Poland [103]. For example, the potential yield of winter wheat in 2019–2021 was 9.71 t ha−1. In dry 2019, it decreased to 9.17 t ha−1, and in 2020, it increased to 10.19 t ha−1. In 2021, with standard weather conditions, it amounted to 9.77 t ha−1. Study on maize and soybean response to the severe drought in the Upper Mississippi River Basin (USA) during the period 1960–2006 showed yield reductions of 27% and 20%, respectively [104]. In the years with drought, the respective amounts of residual P were 11 ((ranging from 3 to 19) kg P ha−1) and 3 ((ranging from 0 to 9) kg P ha−1), for maize and soybean. The effect of land types, soil textural classes, and hydrologic groups was small. In normal years, the P carryover was much lower, amounting to 7 ± 1 kg P ha─1 for maize and 2 ± 1 kg P ha−1 for soybean.

6. Soil Factors Controlling Phosphorus Uptake by Crop Plants

6.1. Soil Acidity—Disturbances in P Uptake

Soil acidification is a natural phenomenon in areas of the world where rainfall exceeds evaporation or evapotranspiration. This process occurs in both tropical and temperate regions of the world [105]. A key reason for soil acidification is the net input of protons (H+), as the pH of rainwater is 5.6 [106]. The area of agricultural land sensitive to acidification is in the range of 40–50% [107]. The farmer has many tools to assess the state of soil reaction. The primary indicators of soil acidification are weeds. Field mustard, as shown in Figure 6A, signals both calcium and phosphorus deficiency. The causative factor is low pH of the soil concomitant with low content of Pi. Field sorrel, in rosette (Figure 6B) and maturity (Figure 6C), indicates strong soil acidity. In such conditions, maize is unable to absorb not only Pi, but also magnesium (Mg), as can be seen in Figure 6C.
The increased content of Al3+ ions in the growth medium competes with Ca2+ ions, which are necessary for the division of the root meristematic cells. In response to injuries caused by Al3+, the plant synthesizes callose, which cuts off healthy plant tissues from damaged ones [108]. Therefore, the main symptom of Al toxicity is a strong reduction in the length of the root, regardless of its type (primary, seminal, lateral), and in the formation of root hairs. The final effect of the plant’s RSA disturbance, disrupting the physiological functions of the root, including the uptake of water and nutrients, especially immobile ones, such as phosphorus, is yield decline [107,109]. Young plants are most sensitive to the toxic effects of Al. Yellow brightening of wheat leaves at the stage of the 2nd leaf is a symptom of Al toxicity or Ca deficiency (Figure 7A). Inhibition of root growth caused by Al3+ leads to plants falling out of the canopy and, consequently, to a decrease in yield (Figure 7B).
The farmer’s basic goal related to P management in acidic soils is to restore the soil pH to the range adequate to the type of soil. Soil pH determines the plant’s P nutritional status by:
(1)
Strong impact on the growth dynamics and the size of the root system of the cultivated plant. A drop in soil pH below 5.0 (1 M KCl extraction solution) leads to its drastic reduction, which ultimately results in a loss of yield [110].
(2)
Transformation—conversion of available Pi into P forms poorly available to plants [53,111]:
a.
adsorption by aluminum oxides,
b.
fixation by carbonates,
c.
forming highly inaccessible–insoluble P forms due to:
 i.
adsorption on iron oxides,
ii.
binding by aluminum and iron cations.
The relationships between soil pH and the amount of available P are quite complex [111]. The optimal pH range, defining the highest content of available P, is narrow. Plants take up P from the soil solution in the form of H2PO4−1. This form is present in the soil in a very wide range (pH 4–8). However, it reaches its maximum in pH ranging from 6.6 to 7.2 (neutral pH range). When the soil pH drops below 5.5, Pi ≈ Al complexes are formed, which precipitate in acid soil to form P–Al, and P–Fe compounds. Above the upper pH range, stable P–Ca compounds are formed [53]. However, already in the neutral pH range, brushite appears, a P mineral form that is inaccessible to plant roots:
H 2 P O 4 1 + O H H P O 4 2 + H 2 O
This form of P is not taken up directly by the plant root. The soil zone around the root must be acidified or enriched with Ca complexing agents, e.g., organic acids [112]. Legumes and cruciferous plants have the potential to release Pi from this P mineral. This regularity is a signal to the farmer that growing species from these plant families in rotation with cereals improves their P status, finally resulting in a higher yield [113].
At this point, the question is how to recover Pi from soil with a pH below 6.5? In slightly acidic and especially acidic soils, the basic agrochemical treatment is the use of lime. Hydroxide ions and calcium cations are released from the lime applied, as shown for two classical lime carriers:
1.
Calcium hydroxide C a O H 2     C a 2 + + 2 O H
2.
Calcium carbonate C a C O 3 + H 2 O   C a 2 + + 2 O H + C O 2
The hydroxide ion formed in the soil solution replaces the Pi ion in the Pi ≈ Al mineral complex, which is then released into the soil solution and thus becomes available to the plant:
A l H 2 P O 4 + O H   A l O H + H 2 P O 4 1
In acidic soil (pH < 5.5 in 1 M KCl solution) containing stable P–Al or P–Fe compounds, large doses of lime have to be applied to release Pi. In simple terms, the effect of lime can be presented as follows:
2 A l ( H 2 P O 4 ) 3 + 3 C a 2 + + 6 O H     2 A l O H 3 + 3 C a 2 + + 3 H 2 P O 4 1
An analogous scheme applies to P–Fe compounds. The effect expected by the farmer is the release of two nutrients, i.e., Ca and P, each of which plays an important role in plant growth. Aluminum precipitated in oxide form does not pose a threat to the plant’s root system [111].

6.2. Soil Compaction

The structure of soil pores plays a key role in three aspects of root growth and function in the soil: (i) total and field air capacity, (ii) oxygen flow in the soil, (iii) rate of root growth. According to Russel [114], the diameter of soil pores is a key factor determining the accessibility of plants’ roots to water and consequently to nutrients:
(1)
>30 µm; water content at soil matric potential above −10 kPa. This is the threshold value defining the field capacity (FC). At this level of water content in the soil, only pores (so-called non-capillary pores) are occupied by air. They are a natural route of transporting rainwater in the soil when the pores with a diameter less than 30 µm (so-called capillary pores) are saturated.
(2)
30–0.2 µm; water content at soil matric potential is in the range of −10 kPa –1500 kPa. These pores contain water available to plants.
(3)
<0.2 µm; water content at soil matric potential below –1500 kPa is not available to plants.
The question is, in what soil pores do plant roots grow? According to Hamblin’s classification [115], the non-capillary pores are a natural growth medium for the taproots of dicotyledonous plants and seminal and nodal roots of monocotyledonous plants. Lateral roots grow in pores in a wide range of 20–100 µm, occupying both non-capillary and capillary pores. Root hairs grow only in capillary pores of 5–10 µm. Fungi occur in pores of 0.5 to 2 µm and bacteria in pores with a diameter of 0.2–2 µm. The plant achieves the optimal growth rate when the soil matric potential is in the range of −5 to −50 kPa, which corresponds to a soil pore diameter of 6 to 60 µm.
Soil penetration resistance is the key physical factor limiting the growth rate of roots in the soil [116]. This soil characteristic is significantly related to the soil bulk density, which in turn is determined by soil compaction [117]. Soil compaction is defined as the physical action of external, mechanical forces, reducing the distance between soil particles [118]. Soil compaction in the topsoil is generally lower compared with the subsoil due to the content of organic matter and naturally increases with soil depth. Soil organic matter is the factor that reduces soil density. In modern agriculture, compacted soil layers are formed both in the topsoil and in the subsoil. A classic example is the plough pan caused by long-term soil plowing at the same depth and due to constant soil compaction in the so-called machine paths [119]. Currently, in the era of intensive industrialization of agriculture, soil compaction has become a global problem, leading to significant yield losses. The degree of yield loss depends on the plant species, soil texture class, and the method of soil tillage used. As reported by Correa et al. [120], the reduction in yield of maize grown on clay soil ranges from 75% in Argentina to about 45% or even 15% in the USA. For comparison, maize grown on coarse–silty soil loses only 25% of its yield.
A farmer has to be aware that there is a strong relationship between soil penetration resistance and RSA, as the key factor responsible for Pi uptake. Increased bulk density usually reduces the soil space occupied by non-capillary pores, larger than 300 µm in the first stage. At the same time, the share of pores below 6 µm increases [121]. As a consequence, the rate of root growth is disturbed. The main negative effect of increased soil penetration resistance is the reduction in the total root length. Root growth slows down when the bulk density of the soil exceeds 1.29–1.49 g cm−3 for clayey soil and 1.69 g cm−3 for sandy soil. Root growth stops when the bulk soil density reaches 1.47–1.58 g cm−3 and 1.85 g cm−3, respectively (120). Under such soil conditions, plant rooting depth is reduced and the main mass of roots develops in the surface soil layer. The second root characteristic, strongly sensitive to soil compaction, is the root growth angle, which increases in response to increasing soil strength [121].
Soil compaction affects the change in the physical properties of the plant growth environment, the conditions of nutrient uptake, and the activity of microorganisms in the rhizosphere. As reported by Shaheb et al. [122], the plough pan can reduce N uptake in the range of 12–35% and P uptake in the range of 17–27%. Of the five cereal crops grown in Poland, triticale and rye are the most sensitive to artificially induced compaction, and barley is less sensitive, regardless of soil bulk density [123]. The increase in the soil bulk density not only reduces the root surface area but also reduces the content of oxygen in the soil, a component required for all metabolic processes of the plant, including uptake of nutrients. The crucial aspects related to soil compaction are both the oxygen content and its flow towards the root. The structure of soil pores affects the total and field soil porosity and oxygen flow, which is four times lower in water compared to air. The optimal range of oxygen concentration in the soil atmosphere is 1–10% for maize, 10–15% for wheat and oats, and 15–20% for barley and sugar beets [115].

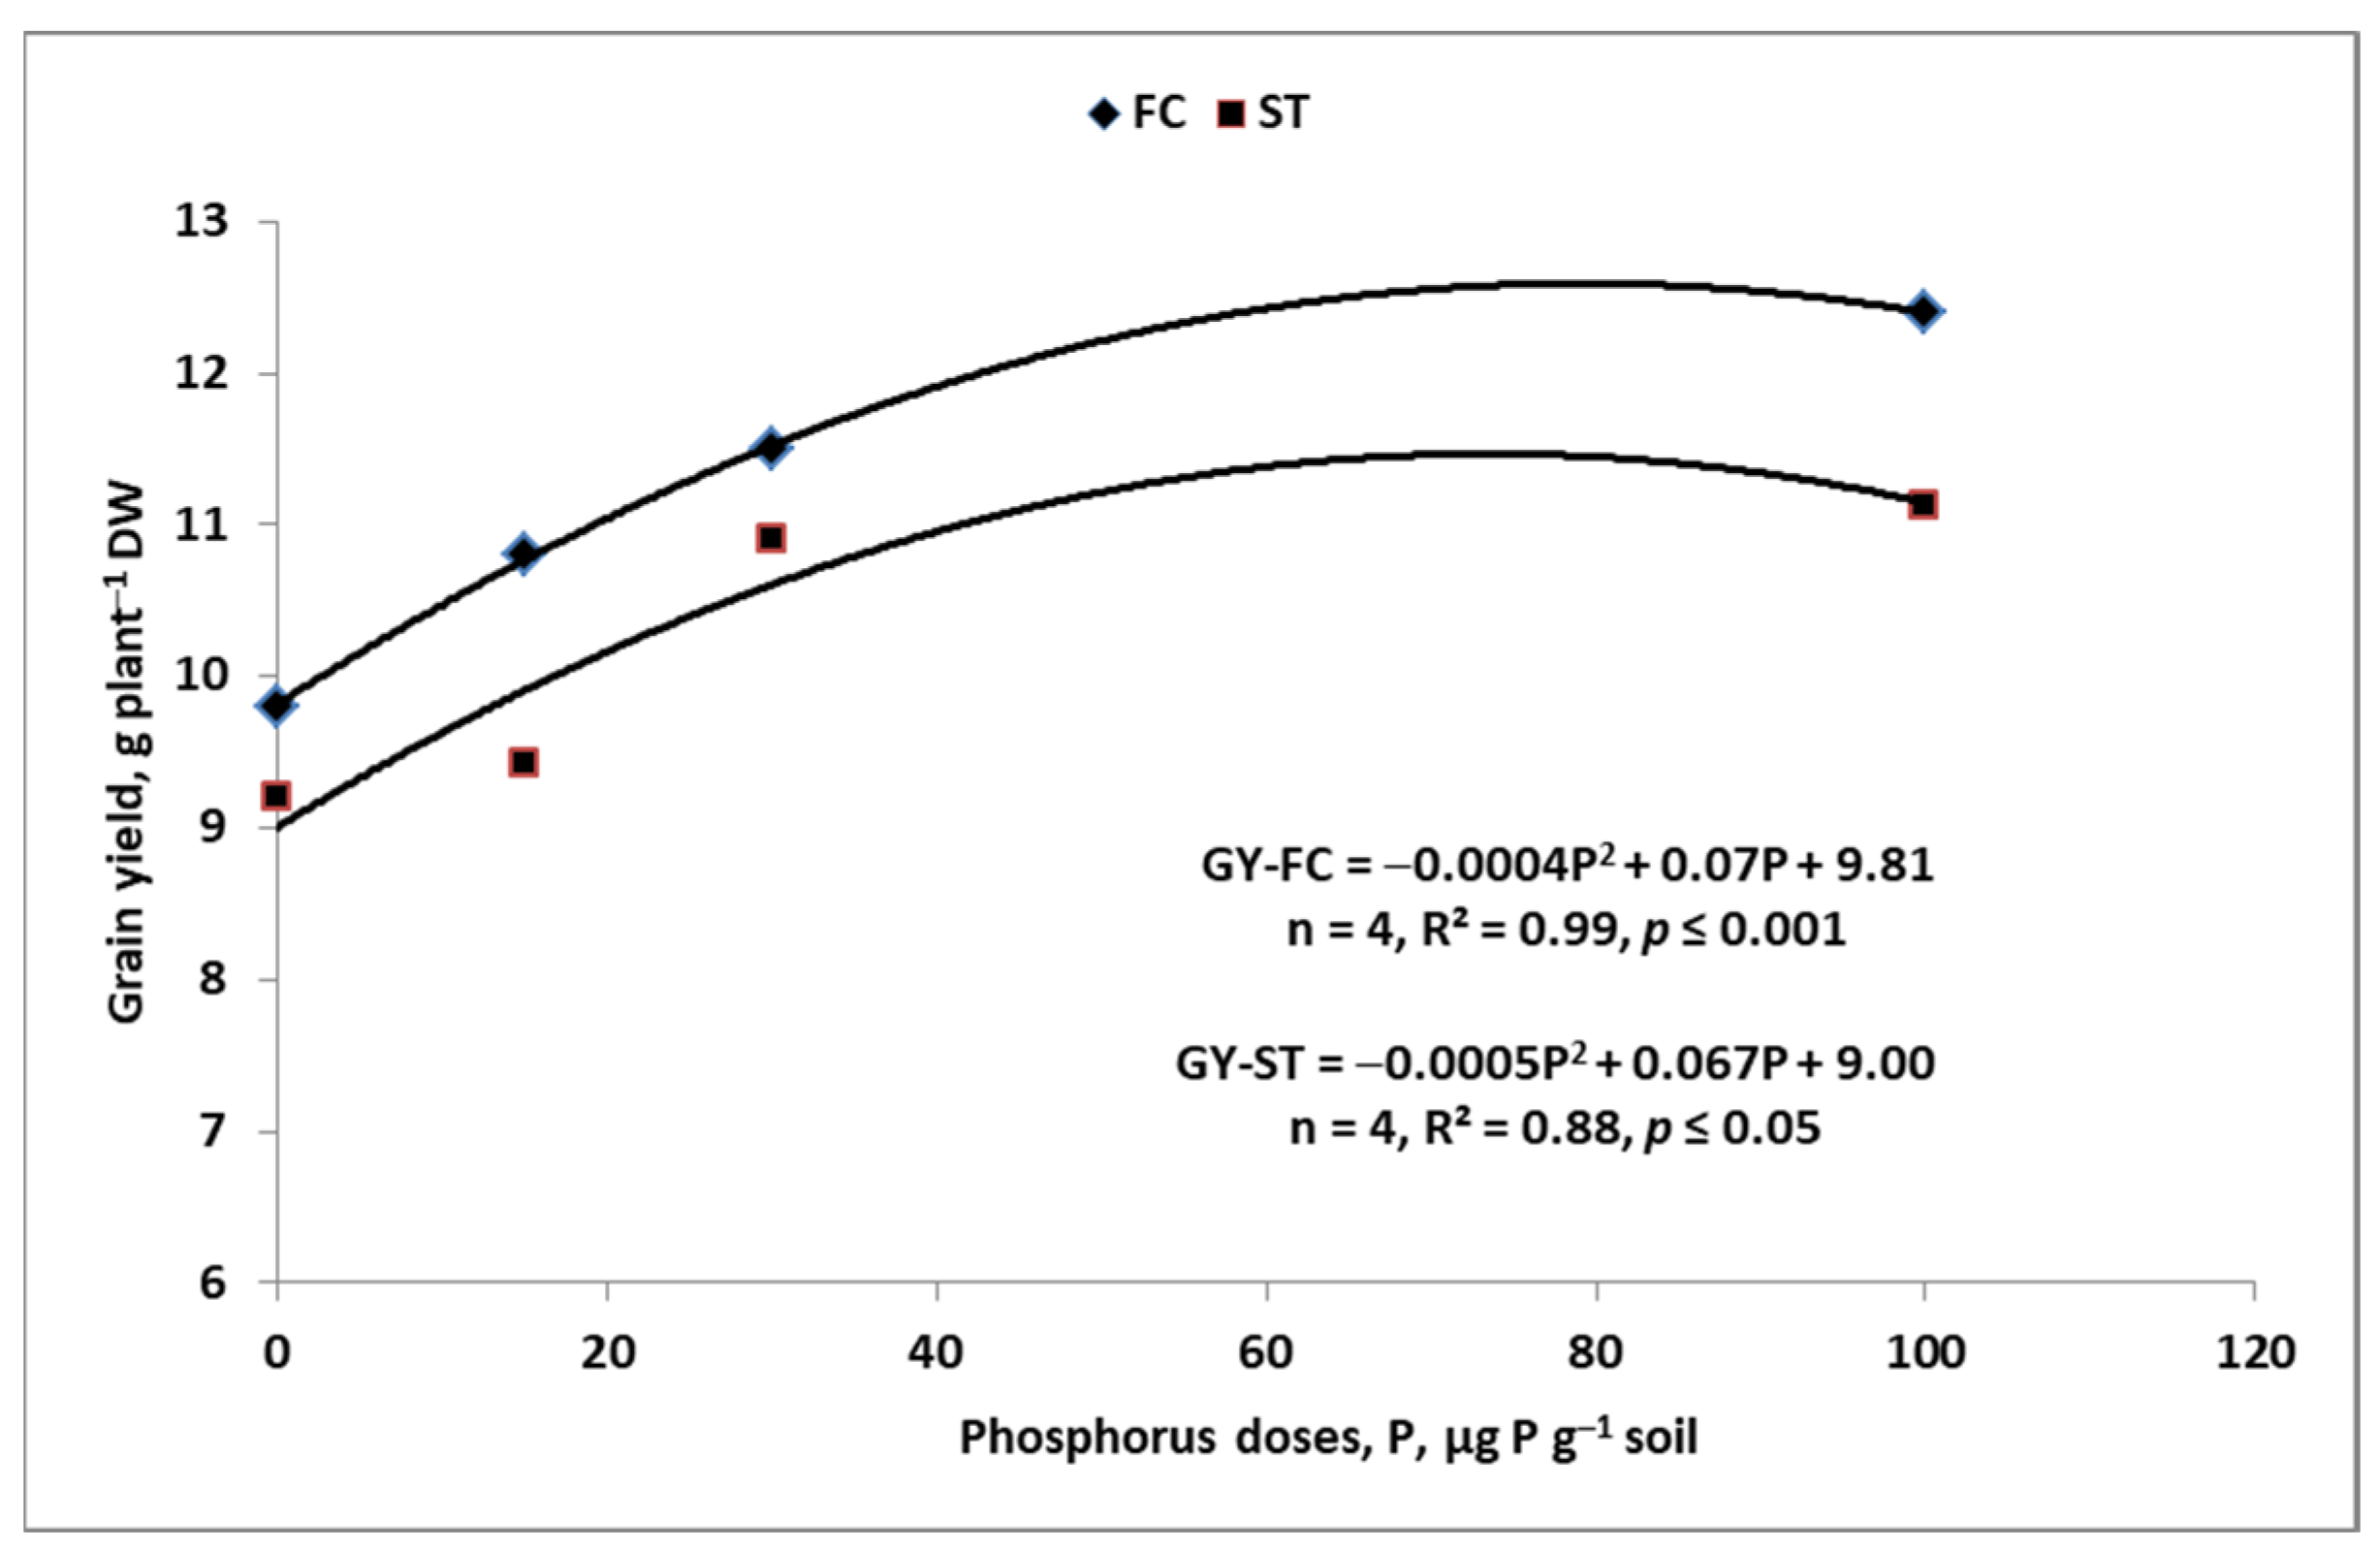
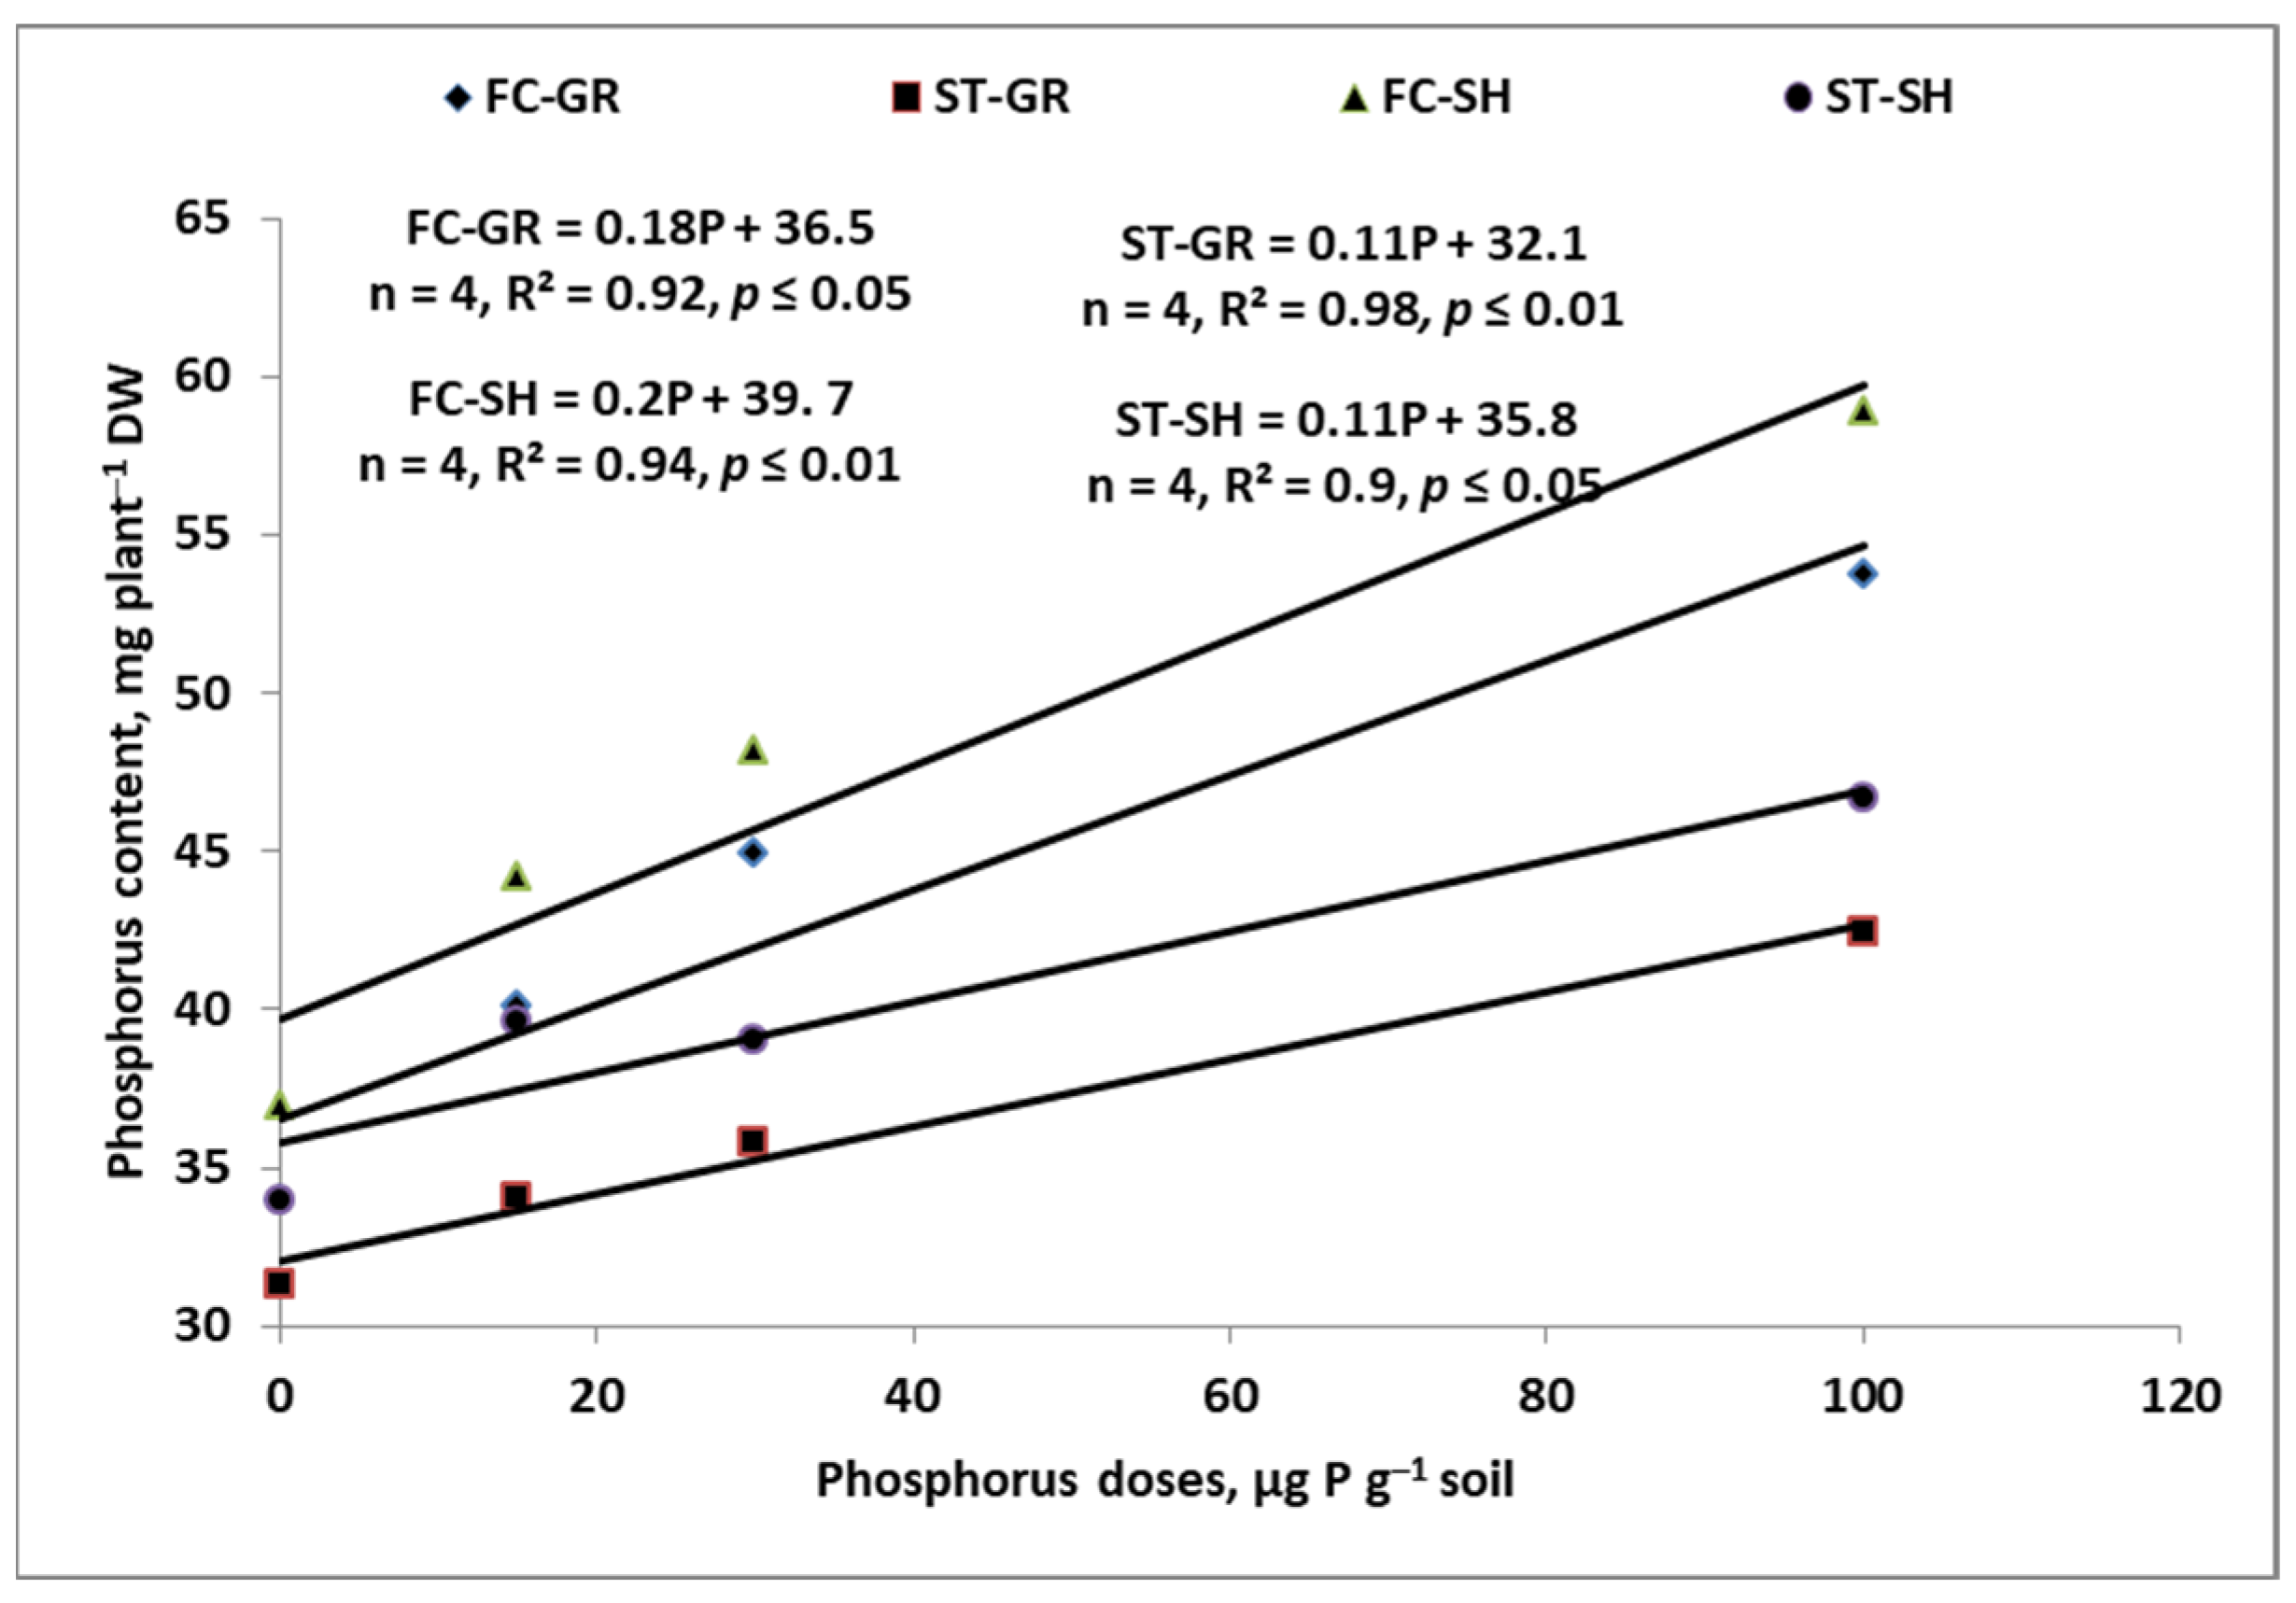
7. Sustainable Management of P Resources on the Farm

The modern history of P use dates back to the early 19th century. This nutrient was found to be the main limiting factor of plant growth and yield. Its deficiency became the root cause of the Law of Minimum, formulated first by Carl Sprengel (1826), next rediscovered and popularized by van Liebig (1840) [124]. However, as early as 2000 years ago, Chinese farmers fertilized fields with calcified bones as well as bones treated with lime. The same method of crop fertilizing with P was used by English farmers at the turn of the 18th and 19th centuries. The first inorganic phosphate fertilizer, single superphosphate, was produced in 1842 by John Bennet Laws in Deptford, England. This method involved treating bones, which contain calcium phosphate (Ca3(PO4)2, with sulfuric acid (H2SO4) [125].
The soil P resources in arable soils decline due to the uptake of Pi by crop plants. Therefore, the main goal of sustainable P management is the systematic restoration of the total P in the soil content using P carriers that are available to the farmer, such as: (i) mineral fertilizers; (ii) postharvest crop residues; (iii) manures; (iv) catch crops; (v) other secondary carriers of P. The main problem of agriculture is the fact that arable soils are naturally poor both in total and available P [126]. In modern agriculture, the primary external P carrier is P fertilizer, a non-renewable resource. According to various forecasts, the consumption of P fertilizers in the period 2020 to 2050 will increase from 33% to approximately 100% [127,128]. Moreover, crop residues are generally poor in P and, when added to the soil, may even induce Pi immobilization [129]. The remaining P carriers represent recycled forms of P used as P sources on the farm. Assuming a sustainable P economy, its cycle on the farm should take into account both current and potential sources (Figure 8).

7.1. Soil

The main source of P for crop plants is the soil. Soils formed from loams contain more total and available P than soils formed from sands [130]. In mineral soil, approximately 50% to 70% P of total P occurs in organic forms. However, the current amount of total P in a cultivated soil is deeply rooted in the history of its use in a given field [131]. The best example is the total P content in Chinese soils, with a positive P balance. On the opposite side is Ukrainian soil, where the P balance is negative due to intensive soil P mining in the past 30 years [18].
The basic tool for controlling the current status of P in arable soil is at least systematic testing of the content of available P. There are a huge number of soil P tests, more or less sophisticated. The most commonly used in agrochemical laboratories include Bray-1, Mehlich 1 and Mehlich 3, Olsen, and Egner–Riehm [132]. Most of these tests are well calibrated within well-defined ranges, allowing assessment of the current soil P status (Table 3). As discussed in Chapter 6.1, P is not evenly distributed among its forms or fractions. The basic factor is soil pH (Figure 9). The question is, which soil P form determines the content of available P? As shown in Figure 10, in typical Polish soil, the P–Al form of P is the main source of the P extracted by the DP Egner–Riehm method [133].
The production value of soil P resources cannot be limited to topsoil. Crop plants also intensively explore deeper soil layers [19]. The vertical distribution of the soil available P content can be described using an exponential regression model. However, its asymptotes are highly modified by the tillage method. The plough tillage system assures more or less the same level of P content in the topsoil, while in the reduced or non-tillage systems, most of the P accumulates in the surface layer (10 cm) [135]. So far, the productive role of nutrient resources, including P in the whole rooting zone of crop plants, has been emphasized, but only sporadically [19,136,137]. The increased difference in the content of P between the upper and deeper soil layers increases the risk of limited P supply to plants during the reproductive stages of growth [35,36]. Such a threat for crop production is highly likely not only in the tropics and subtropics but also in temperate regions of the world due to temporary periods of drought [138,139]. So far, these reports and concepts have had no impact on soil testing methods, or fertilization systems, except for mineral nitrogen, and therefore on crop production systems. Sustainable management of soil P resources requires quantitative data on the content of available P resources in the zone of optimal rooting depth of crops grown in the field. The study by Barłóg et al. [140] showed that it is technically possible to simultaneously determine the content of mineral N (Nmin) and the content of other nutrients, including P.

7.2. Mineral P Fertilizers

The production of P mineral fertilizers began in 1842, using bones as the raw material [125]. Currently, the primary source is phosphate rocks, including marine sedimentary deposits, which constitute 75% of the total raw material. The second source is igneous rocks, providing 15–20% of the processed raw material [141]. To release Pi from phosphate rocks, sulfuric acid, phosphoric acid (previously obtained from phosphate rocks), and nitric acid are used. Depending on the technology of the phosphate rocks processing, three key groups of P fertilizers are manufactured [142]:
  • Superphosphates: (i) single superphosphate (SSP), triple superphosphate (TSP);
  • Ammonium phosphate: (i) mono-ammonium phosphate (MAP), (ii) di-ammonium phosphate (DAP);
  • Nitro-phosphates (NP).
The chemical and agrochemical characteristics of P fertilizers are summarized in Table 4. The most important feature of the P fertilizer, regardless of its type, is the content of water-soluble P, i.e., Pi. Based on this criterion, P fertilizers may be classified in descending order from MAP, DAP, TST, SSP, to partially acidulated phosphate rocks. This set of P fertilizers is manufactured in solid form, mainly in the form of granules, therefore their actual solubility strongly depends on the content of water in the soil. However, during most of the growing season, soil water conditions are not favorable for rapid dissolution of P granules. As a result, most of the applied fertilizer P is almost directly incorporated into soil P pools with much lower availability rates (Figure 9). As a consequence, a significant part of the applied P is subjected to fixation and is available for subsequent plants in the crop rotation (Figure 11).
A completely different group is P fertilizers based on ammonium polyphosphate. The advantages of these P sources over solid, orthophosphate P fertilizers can be summarized as follows [142]:
1.
The liquid formulation of P fertilizer allows direct supplementation of the soil solution P pool; therefore, Pi ions are directly available to plant roots;
2.
The proportion of orthophosphate to polyphosphate is 30:70; this relationship allows for covering:
a.
current crop needs;
b.
upcoming needs, i.e., those occurring during the most critical stages of plant growth;
3.
Less fixation of polyphosphates than orthophosphates by soil particles.
Polyphosphates are applied directly to the soil and/or foliar to the plant [144]. The main P fertilizers applied to plant foliage are phosphoric acid and potassium, ammonium, and sodium orthophosphates (Table 4). The adsorption of Pi by the plant leaf is a very slow process, lasting up to several days. The leaf must have high turgor and the air humidity during liquid application should exceed 90%. The one-time P dose is low because the concentration of P fertilizer in the spray solution should not exceed 2%. However, the total, repeatedly applied P dose ranges widely from 1.5 to 4.0 kg P ha−1 [144,145]. The order of P compounds, based on the rate of P absorption by the leaf, is [146]:
NaH2PO4 > K2HPO4 > NH4H2PO4 = (NH4)2HPO4 = Na2HPO4 = K3PO4 > H3PO4 > Na3PO4.
An effective field-specific P fertilizer application strategy should be based on both soil and fertilizer P characteristics (Table 4, Figure 12). The use of P fertilizer must be strictly targeted, fulfilling a specific task in the production cycle for a given field.

7.3. Crop Residues, Manures—P Recycling

Crop residues (harvest residues) are the first organic P form recycled on the farm. The content of P in above-ground parts of the crop plant varies, strongly depending on the grown species and the plant part harvested. Harvest residues (stubble, straw) of high-yielding cereals and oilseed rape are extremely low in P content (below 0.15% DM). For maize, the lower P range is 0.15–0.20% and for seed legumes 0.1–0.3% DM. In the case of root crops, the content of P in leaves at harvest is higher. For sugar beets, it is in the range of 0.3–0.5% DM [147]. The content of P in farmyard manure depends on its type and form. In slurry, it is much higher than in solid manure (Table 5). The fertilizing value of manure as a source of P is well documented worldwide [148,149,150]. The direction of P transformation of organic P carriers in the soil depends on its P content [151]. The soil Pi will be immobilized when the P content in the organic P material is below 0.13% DM (C:P > 300). This is the case for cereals and high-yielding cruciferous plants. The release of Pi from the applied organic P carrier takes place provided the organic material contains P in the range of 0.13–0.4% DM (C:P ≈ 100–300). This process is preceded by temporary immobilization of soil Pi. The length of this period is variable, and it applies to maize straw and sugar beet leaves. Only when the P content in the organic material exceeds 0.4% DM, it undergoes direct mineralization (C:P < 100). This condition is met by manures, regardless of their type. The narrowest C:P ratio as shown in Table 5 is for pig slurry.
Phosphate rocks, as the main source of P, are a non-renewable resource whose exhaustion time is estimated at 60 to 120 years [128]. The efficiency of P in the food production system is low and accounts for only 17% of its input (mined P rock) [152]. Agricultural recycling, i.e., the flow of P through crop residues, but mainly through livestock on the farm (organic P fertilizers), allows multiplication of its use, increasing use efficiency [40,126]. The use of P from fertilizers can be increased by recycling bio-based products, from the processing industry, plants, and animals. A classic example is meat and bone meal (MBM), which contains N and especially P and Ca. The combustion of MBM produces ash, the dominant component of which is tri-calcium phosphate [Ca3(PO4)2]. The solubility of MBM in the soil is low, therefore this P carrier is indicated for use on acid soils, poor in available Pi [153].
The final place of P allocation in its anthropogenic cycle is sewage sludge and wastewater. Leading sources are human feces, food waste (24%), and detergents (10%), but the main source is farm livestock (34%) [154]. P is recovered from wastewater or sewage sludge using a range of techniques, including composting, fermentation, incineration, and sophisticated chemical technologies. Incineration is one of the basic methods of sewage sludge disposal. The obtained ash (sewage sludge ash—SSA) contains many elements, including P. The content of P in SSA is in the range of 5–11%. P in SSA most often occurs in the form of Fe4(P4O12)3 and Al(PO3)3 [155]. This P form is moderately available to plants. Its recovery compared with TSP is about 70% (Figure 13). Moreover, SSA contains, depending on the raw material being incinerated, undesirable, so-called potentially toxic elements (PTEs) [156]. Therefore, the use of such waste in agriculture is subject to legal regulations applicable in a given country [157,158].
The efforts of modern technologies have recently focused on the extraction/precipitation of struvite from various types of wastewater, even pig sewage and/or leachate municipal landfill [154]. The key component added to wastewater is magnesium (Mg). Struvite is a mineral containing equal molar concentrations of Mg, ammonium, and P, formed as a result of the reaction of these three components:
M g 2 + + N H 4 + + H 2 P O 4 1   M g N H 4 P O 4 × 6 H 2 O + 2 H +
The fertilizing value of recycled P fertilizers, related to the productive effect of TSP, is ambiguous. As shown in Figure 13, only struvite from veal manure showed a greater productive effect than TSP. A field study by Vogel et al. [159] showed the high effectiveness of struvite, equal to that of TSP. However, the value of these P carriers can be much higher in soils with low P content and acidic soils, provided that they are well supplied with N [160,161].

8. Challenges and Threats in Phosphorus Management in Plant Production

Feeding 10 billion people in 2050 will be based mainly on food production. The increase in yields depends on the main determinants, i.e., the supply of crop plants with water and nitrogen. These two factors, called yield limiting factors, are effective and yield-producing only when they are balanced by other growth factors, including nutrients.
Phosphorus is crucial for plant production because, unlike N, its resources in soils and phosphate rocks are limited. The farmer will not produce food without the appropriate level of P available in the soil.
The strategy of P management in the field, due to its low annual use from freshly applied fertilizer, must be synchronized in time, i.e., with crops grown in a given crop rotation. Plants have different nutritional requirements both in the current season and in subsequent seasons, and thus have different sensitivity to the supply of P from the soil. The level of soil fertility, and therefore the P fertilization strategy, must take these basic facts into account. Moreover, recognition of the critical phase of P demand by the currently grown crop is necessary to develop an effective foliar application system (time, dose, and P carrier), supporting soil P application.
Rational management of soil P resources will only be possible when effective methods for P resource diagnosing are developed and implemented into agricultural practice. These methods must cover the entire profile of the effective depth of crop plants, not just the topsoil. Scientific research in this area has already been carried out. A critical step is to develop critical ranges of soil available P, taking into account soil texture, content of organic matter, and soil reaction.
At least 50% of P in the soil is in organic compounds. Similarly to N, it is subjected to mineralization and immobilization processes. Therefore, extensive research is necessary on the potential and dynamics of the release of this nutrient from the soil during the growing season. Bio-fertilizers with different microbiological composition open a new front in soil P management. However, it should be borne in mind that these resources are limited. Excessive exploitation of soil P resources leads to state in which the Law of Minimum will apply. Under such conditions, N becomes unproductive.
The recycling of P, not only on the farm, is crucial, as it multiplies the effectiveness of the applied P fertilizer. The use of sewage sludge and wastewater as sources of P is possible, but there are two limitations. The first is the actual costs of recovering this nutrient, which are extremely high. The question is whether an ordinary farmer could afford to buy such fertilizer at the real production cost. The second that actually affects the cost of producing recycled P fertilizer is the content of potentially toxic elements (PTE).

Author Contributions

Conceptualization, W.G., A.N. and J.P.; software, W.G., A.N. and A.A.; validation, W.G., J.P. and A.N.; resources, W.G., A.N. and J.P.; data curation, J.P. and A.A.; writing—original draft preparation, A.N. and J.P.; writing—review and editing, W.G.; visualization, J.P. and A.A.; supervision, A.N.; project administration, J.P. All authors have read and agreed to the published version of the manuscript.

Funding

This research received no external funding.

Conflicts of Interest

The authors declare no conflicts of interest.

References

  1. Van Dijk, M.; Morley, T.; Rau, M.L.; Saghai, Y. A meta-analysis of projected global food demand and population at risk of hunger for the period 2010–2050. Nat. Food 2021, 2, 494–501. [Google Scholar] [CrossRef] [PubMed]
  2. Year Book for 2009; FAO: Rome, Italy, 2009.
  3. Alexander, P.; Brown, C.; Ameth, A.; Finnigan, J. Human appropriation for land and food: The role of diet. Glob. Environ. Chang. 2016, 41, 88–98. [Google Scholar] [CrossRef]
  4. Berners-Lee, M.; Kennelly, C.; Watson, R.; Hewitt, C.N. Current global food production is sufficient to meet human nutritional needs in 2050 provided there is radical societal adaptation. Elem. Sci. Anth. 2018, 5, 52. [Google Scholar] [CrossRef]
  5. Gomiero, T. Soil degradation, land scarcity and food security: Reviewing a complex challenge. Sustainability 2016, 8, 281. [Google Scholar] [CrossRef]
  6. Roy, E.D.; Richards, P.D.; Martinelli, L.A.; Coletta, L.D.; Machado Lins, S.R.; Vazquez, F.F.; Willing, E.; Spera, S.A.; Van Wey, L.L.K.; Porder, S. The phosphorus cost of agricultural intensification in the tropics. Nat. Plants 2016, 2, 16043. [Google Scholar] [CrossRef] [PubMed]
  7. Röös, E.; Bajželj, B.; Smith, P.; Patel, M.; Little, D.; Garnett, T. Greedy or needy? Land use and climate impacts of food in 2050 under different livestock futures. Glob. Environ. Chang. 2017, 47, 1–12. [Google Scholar] [CrossRef]
  8. Stewart, W.M.; Roberts, T.L. Food security and the role of fertilizers in supporting it. Procedia Eng. 2012, 46, 76–82. [Google Scholar] [CrossRef]
  9. Izumi, T.; Sakai, T. The global data set of historical yield of major crop 1981–2016. Sci. Data 2020, 7, 97. [Google Scholar] [CrossRef]
  10. Ray, D.K.; Mueller, N.D.; West, P.C.; Foley, J.A. Yield trends are insufficient to double global crop production by 2050. PLoS ONE 2013, 8, e66428. [Google Scholar] [CrossRef]
  11. Cordell, D.; White, S. Life’s Bottleneck: Sustaining the world’s phosphorus for a food secure future. Ann. Rev. Environ. Resour. 2014, 39, 161–168. [Google Scholar] [CrossRef]
  12. Marschner, P. Marchner’s Mineral Nutrition of Higher Plants, 3rd ed.; Elsevier Ltd.: London, UK, 2012; p. 649. [Google Scholar]
  13. Pereira, A.M.; Coimbra, S. Advances in plant reproduction: From gametes to seeds. J. Exp. Bot. 2019, 15, 2933–2936. [Google Scholar] [CrossRef] [PubMed]
  14. Grzebisz, W.; Diatta, J.; Barłóg, P.; Biber, M.; Potarzycki, J.; Łukowiak, R.; Przygocka-Cyna, K.; Szczepaniak, W. Soil Fertility Clock—Crop Rotation as a Paradigm in Nitrogen Fertilizer Productivity Control. Plants 2022, 11, 2841. [Google Scholar] [CrossRef]
  15. Nicholls, J.W.; Chin, J.P.; Williams, T.A.; Lenton, T.M.; O’Flaherty McGrath, J.W. On the potential roles of phosphorus in the early evolution of energy metabolism. Front. Microbiol. 2023, 14, 1239189. [Google Scholar] [CrossRef] [PubMed]
  16. Lima Viana, J.; Moretti de Souza, J.L.; Hoshide, A.K.; de Oliveira, R.A.; de Abreu, D.C.; da Silva, W.M. Estimating sugarcane yield in subtropical climate using climatic variable and soil water storage. Sustainability 2023, 15, 4360. [Google Scholar] [CrossRef]
  17. Tanveer, A.; Ikram, R.M.; Ali, H.H. Crop rotation: Principles and practices. In Agronomic Crops; Hasanuzzaman, M., Ed.; Springer: Singapore, 2019; pp. 1–13. [Google Scholar]
  18. MacDonald, G.K.; Bennett, E.M.; Potter, P.A.; Ramankutty, N. Agronomic phosphorus imbalances across the world’s croplands. Proc. Natl. Acad. Sci. USA 2011, 108, 3086–3091. [Google Scholar] [CrossRef] [PubMed]
  19. Łukowiak, R.; Grzebisz, W.; Sassenrath, G.F. New insights into phosphorus management in—A crop rotation approach. Sci. Tot. Environ. 2016, 542, 1062–1077. [Google Scholar] [CrossRef] [PubMed]
  20. Paluchowski, W.J. Methodological or theoretical framework controversy—Qualitative versus quantitative research. Rocz. Psychol. 2020, XIII, 7–22, (In Polish with English Summary). [Google Scholar]
  21. Olfs, H.-W.; Blankenau, K.; Brentrup, F.; Jasper, J.; Link, A.; Lammel, J. Soil- and plant-based nitrogen-fertilizer recommendations in arable farming. J. Plant Nutr. Soil Sci. 2005, 168, 414–431. [Google Scholar] [CrossRef]
  22. Grzebisz, W.; Łukowiak, R.; Sassenrath, G. Virtual nitrogen as a tool for assessment of nitrogen at the field scale. Field Crops Res. 2018, 218, 182–184. [Google Scholar] [CrossRef]
  23. Krouk, G.; Kiba, T. Nitrogen and phosphorus interactions in plants: From agronomic to physiological and molecular insights. Curr. Opin. Plant Biol. 2020, 57, 104–109. [Google Scholar] [CrossRef]
  24. Lambers, H. Phosphorus acquisition and utilization in plants. Ann. Rev. Plant Biol. 2022, 73, 17–42. [Google Scholar] [CrossRef] [PubMed]
  25. Wang, Y.; Wang, F.; Lu, H.; Mao, C. Phosphate uptake and transport in plants: An elaborate regulatory system. Plant Cell Physiol. 2021, 62, 564–572. [Google Scholar] [CrossRef] [PubMed]
  26. Barber, S.A. Soil Nutrient Bioavailability: A Mechanistic Approach, 2nd ed.; Wiley and Sons: New York, NY, USA, 1995; p. 432. [Google Scholar]
  27. McKay Fletecher, D.M.; Ruiz, S.; Dias, T.; Petroselli, C.; Roose, T. Linking root structure to functionality: The impact of root system architecture to citrate enhanced phosphate uptake. New Phytol. 2020, 227, 376–391. [Google Scholar] [CrossRef] [PubMed]
  28. Giehl, R.F.H.; Wiren, N. Root nutrient foraging. Plant Physiol. 2014, 166, 509–517. [Google Scholar] [CrossRef]
  29. Lynch, J.L. Root phenotypes for improved capture: An underexploited opportunity for global agriculture. New Phytol. 2019, 223, 548–564. [Google Scholar] [CrossRef] [PubMed]
  30. Nielsen, N.E. Nutrients: Bioavailability and plant uptake. In Managing Global Resources and Universal Processes; Fath, B.D., Jorgensen, S.E., Cole, M., Eds.; CRC Press: London, UK, 2020; pp. 501–509. [Google Scholar]
  31. Van Noordwijk, M.; Brouwer, G. Review of quantitative root length data in agriculture. In Plant Roots and Their Environment, 1st ed.; McMichael, B., Persson, H., Eds.; Elsevier: Amsterdam, The Netherlands, 1991; pp. 515–525. [Google Scholar]
  32. Haberle, J.; Svoboda, P. Calculation of available water supply in crop zone and the water balance. Plant Soil Environ. 2015, 45, 285–298. [Google Scholar]
  33. De Sousa Nunes, R.; Gones de Sousa, D.M.; Goedert, W.J.; Zancanaro de Oliveira, L.E.; Pinheiro, T.D. Vrops; yield and roots response to soil phosphorus distribution resulting from long-term soil and phosphate fertilization management strategies. Front. Agron. 2021, 3, 757100. [Google Scholar] [CrossRef]
  34. McKay, A.D.; Barber, S.A. Effect of soil moisture and phosphate level on root hair growth on corn roots. Plant Soil 1985, 86, 321–331. [Google Scholar] [CrossRef]
  35. Ciampitti, I.A.; Camberato, J.J.; Murrel, S.T.; Vyn, T.J. Maize nutrient accumulation and partitioning in response to plant density and nitrogen rate. I. Macronutrients. Agron. J. 2013, 10593, 7830. [Google Scholar] [CrossRef]
  36. Julia, C.; Wissuva, M.; Kretzschmar, T.; Jeong, K.; Rose, T. Phosphorus uptake, partitioning and redistribution during grain filling in rice. An. Bot. 2016, 118, 1151–1162. [Google Scholar] [CrossRef]
  37. Subedi, K.; Ma, B. Nitrogen uptake and partitioning in stay-green and leafy maize hybrids. Crops Sci. 2005, 45, 740–747. [Google Scholar] [CrossRef]
  38. Guan, P. Dancing with hormones: A current perspective of nitrate signaling and regulation in Arabidopsis. Front. Plant Sci. 2017, 8, 1697. [Google Scholar] [CrossRef] [PubMed]
  39. Luo, L.; Zhang, Y.; Xu, G. How does nitrogen shape plant architecture. J. Exp. Bot. 2020, 71, 4415–4427. [Google Scholar] [CrossRef] [PubMed]
  40. Cordell, D.; Drangert, J.-O.; White, S. The story pf phosphorus global food security and food for thought. Glob. Environ. Chang. 2009, 19, 292–305. [Google Scholar] [CrossRef]
  41. Grzebisz, W.; Szczepaniak, W.; Barłóg, P.; Przygocka-Cyna, K.; Potarzycki, J. Phosphorus sources for winter oilseed rape (Brassica napus L.) during reproductive growth—Magnesium sulfate management impact on P use efficiency. Arch. Agron. Soil Sci. 2018, 64, 1646–1662. [Google Scholar] [CrossRef]
  42. Hasan, M.M.; Hasan, M.M.; Texeira da Silva, J.A.; Li, X. Regulation of phosphorus uptake and utilization: Transitioning from current knowledge to practical strategies. Cell. Mol. Biol. Lett. 2016, 21, 7. [Google Scholar] [CrossRef] [PubMed]
  43. Maathuis, F.J.M. Physiological functions of mineral macronutrients. Curr. Opin. Plant Biol. 2009, 12, 250–258. [Google Scholar] [CrossRef]
  44. Bhadouria, J.; Giri, J. Purple acid phosphatases: Roles in phosphate utilization and new emerging functions. Plant Cell Rep. 2022, 41, 33–51. [Google Scholar] [CrossRef]
  45. Ciereszko, I.; Żebrowska, E.; Ruminowicz, M. Acid phosphatases and growth of barley (Hordeum vulgare L.) cultivars under diverse phosphorus nutrition. Acta Physiol. Plant. 2011, 33, 2355–2368. [Google Scholar] [CrossRef]
  46. Shen, Q.; Wen, Z.; Dong, Y.; Li, H.; Miao, Y.; Shin, J. The responses of root morphology and phosphorus-mobilizing exudations in wheat to increasing shoot phosphorus concentration. AoB Plants 2018, 10, ply054. [Google Scholar] [CrossRef]
  47. López-Arrendondo, D.L.; Leyva-González, M.A.; González-Morales, S.I.; López-Bucio, J.; Herrera-Estrella, L. Phosphate nutrition: Improving low-phosphate tolerance. Ann. Rev. Plant Biol. 2014, 65, 95–123. [Google Scholar] [CrossRef]
  48. Selvi, K.B.; Paul, J.J.A.; Vijaya, V.; Saraswathi, K. Analyzing the efficacy of phosphate solubilizing microorganisms by enrichment culture techniques. Bioch. Mol. Biol. J. 2017, 3, 1–7. [Google Scholar]
  49. Kumar, A.; Kumar, A.; Patel, H. Role of microbes in phosphorus availability and acquisition by plants. Inter. J. Curr. Microb. Appl. Sci. 2018, 7, 1344–1347. [Google Scholar] [CrossRef]
  50. Sane, S.A.; Mehta, S.K. Isolation and evaluation of rock phosphate solubilizing fungi as potential biofertilizer. J. Fertil Pestic. 2015, 6, 156–160. [Google Scholar] [CrossRef]
  51. Garg, N.; Chandel, S. Arbuscular mycorrhizal networks: Process and functions: A review. Agron. Sustain. Dev. 2010, 30, 581–599. [Google Scholar] [CrossRef]
  52. Vance, C.P. Plants without arbuscular mycorrhizae. In The Ecophysiology of Plant-Phosphorus Interactions; White, P.J., Hammond, J.P., Eds.; Springer Science + Business Media BV: Berlin/Heidelberg, Germany, 2008; pp. 117–142. [Google Scholar]
  53. Sharma, S.B.; Sayyed, R.Z.; Trivedi, M.H.; Gobi, T.A. Phosphate solubilizing microbes: Sustainable approach for managing phosphorus deficiency in agricultural soils. SpringerPlus 2013, 2, 587–600. [Google Scholar] [CrossRef] [PubMed]
  54. Spatafora, J.W.; Chang, Y.; Benny, G.L.; Lazarus, K.; Smith, M.E.; Berbee, M.L.; Stajich, J.E. A phylum-level phylogenetic classification of zygomycete fungi based on genome-scale data. Mycologia 2016, 108, 1028–1046. [Google Scholar] [CrossRef]
  55. Davison, J.; Moora, M.; Öpik, M.; Adholeya, A.; Ainsaar, L.; Bâ, A.; Zobel, M. Global assessment of arbuscular mycorrhizal fungus diversity reveals very low endemism. Science 2015, 349, 970–973. [Google Scholar] [CrossRef]
  56. Giovannini, L.; Palla, M.; Agnolucci, M.; Avio, L.; Sbrana, C.; Turrini, A.; Giovannetti, M. Arbuscular mycorrhizal fungi and associated microbiota as plant biostimulants: Research strategies for the selection of the best performing inoculate. Agronomy 2020, 10, 106. [Google Scholar] [CrossRef]
  57. Baum, C.; El-Tohamy, W.; Gruda, N. Increasing the productivity and product quality of vegetable crops using arbuscular mycorrhizal fungi: A review. Sci. Hort. 2015, 187, 131–141. [Google Scholar] [CrossRef]
  58. Augé, R.M.; Toler, H.D.; Saxton, A.M. Arbuscular mycorrhizal symbiosis alters stomatal conductance of host plants more under drought than under amply watered conditions: A meta-analysis. Mycorrhiza 2015, 25, 13–24. [Google Scholar] [CrossRef] [PubMed]
  59. Etesami, H.; Jeong, B.R.; Glick, B.R. Contribution of arbuscular mycorrhizal fungi, phosphate–solubilizing bacteria, and silicon to P uptake by plant. Front. Plant Sci. 2021, 12, 699618. [Google Scholar] [CrossRef]
  60. Begum, N.; Qin, C.; Ahanger, M.A.; Raza, S.; Khan, M.I.; Ashraf, M.; Zhang, L. Role of arbuscular mycorrhizal fungi in plant growth regulation: Implications in abiotic stress tolerance. Front. Plant Sci. 2019, 10, 1068. [Google Scholar] [CrossRef] [PubMed]
  61. Thirkell, T.J.; Cameron, D.D.; Hodge, A. Resolving the ‘nitrogen paradox’ of arbuscular mycorrhizas: Fertilization with organic matter brings considerable benefits for plant nutrition and growth. Plant Cell Environ. 2016, 39, 1683–1690. [Google Scholar] [CrossRef] [PubMed]
  62. Péret, B.; Clément, M.; Nussaume, L.; Desnos, T. Root developmental adaptation to phosphate starvation: Better safe than sorry. Trends Plant Sci. 2011, 16, 442–450. [Google Scholar] [CrossRef]
  63. Shane, M.W.; Lambers, H. Cluster roots: A curiosity in context. Plant Soil 2005, 27, 101–125. [Google Scholar] [CrossRef]
  64. Abdolzadeh, A.; Wang, X.; Veneklaas, E.J.; Lambers, H. Effects of phosphorus supply on growth, phosphate concentration and cluster-root formation in three Lupinus species. Ann. Bot. 2010, 105, 365–374. [Google Scholar] [CrossRef]
  65. Liu, D. Root developmental responses to phosphorus nutrition. J. Integr. Plant Biol. 2021, 63, 1065–1090. [Google Scholar] [CrossRef]
  66. White, C.; Sylvester-Bradley, R.; Berry, P.M. Root length densities of UK wheat and oilseed rape crops with implications for water capture and yield. J. Exp. Bot. 2015, 66, 2293–2303. [Google Scholar] [CrossRef]
  67. Remus, R.; Pandey, D.; Lüttschwager, D. What regulates the rhizodeposition of winter oilseed rape during growth. Plant Soil 2022, 478, 283–310. [Google Scholar] [CrossRef]
  68. Duan, X.; Jin, K.; Ding, G.; Wang, C.; Cai, H.; Wang, S.; White, P.J.; Xu, F.; Shi, L. The impact of different morphological and biochemical traits on phosphorus acquisition and seed yield of Brassica napus. Field Crops Res. 2020, 258, 107960. [Google Scholar] [CrossRef]
  69. Ziadi, N.; Whalen, J.K.; Messiga, A.J.; Morel, C. Assessment and modelling of soil available phosphorus in sustainable cropping systems. Adv. Agron. 2013, 122, 85–126. [Google Scholar]
  70. McMichael, B.L.; Burke, J.J. Soil temperature and root growth. HortScience 1998, 33, 947–951. [Google Scholar] [CrossRef]
  71. Kaspar, T.C.; Bland, W.L. Soil temperature and root growth. Soil Sci. 1992, 154, 290–299. [Google Scholar] [CrossRef]
  72. Fonseca de Lima, C.F.; Klein-Vehn, J.; De Smet, I.; Feraru, E. Getting to the root belowground high temperature responses in plants. J. Exp. Bot. 2021, 72, 7404–7413. [Google Scholar] [CrossRef] [PubMed]
  73. Hatfield, J.I.; Prueger, J.H. Temperature extremes: Effect on plant growth and development. Weather Clim. Extrem. 2015, 10, 4–10. [Google Scholar] [CrossRef]
  74. Xu, H.; Hassan, M.A.; Sun, D.; Wu, Z.; Jiang, G.; Liu, B.; Ni, Q.; Yang, W.; Fang, H.; Li, J.; et al. Effects of low temperature stress on source-sink organs in wheat and phosphorus mitigation strategies. Front. Plant Sci. 2022, 13, 807844. [Google Scholar] [CrossRef]
  75. Tiwari, M.; Kumar, R.; Subramanian, S.; Doherty, C.J.; Krishna Jagadish, S.V. Auxin-cytokinin interplay shapes root functionality under low-temperatures stress. Trends Plant Sci. 2023, 28, 447–459. [Google Scholar] [CrossRef]
  76. Zhu, J.; Zhang, K.-X.; Wang, W.-S.; Gong, W.; Liu, W.-C.; Chen, H.-G.; Xu, H.-H.; Lu, Y.-T. Low temperature inhibits root growth by reducing auxin accumulation via ARR1/12. Plant Cell Physiol. 2015, 56, 727–736. [Google Scholar] [CrossRef]
  77. Sadok, W.; Krishna Jagadish, S.V. The hidden cost of nighttime warming on yields. Trends Plant Sci. 2020, 25, 644–651. [Google Scholar] [CrossRef]
  78. Calleja-Cabrera, J.; Boter, M.; Onate-Sanchez, L.; Pernas, M. Root growth adaptation to climate change in crops. Front. Plant Sci. 2020, 11, 544. [Google Scholar] [CrossRef]
  79. Ben-Noach, I.; Friedman, S.P. Review and evaluation of root respiration and of natural and agricultural processes of soil respiration. Vadose Zone J. 2018, 17, 1–47. [Google Scholar] [CrossRef]
  80. Mittler, R.; Finka, A.; Goloubinoff, P. How do plants feel the heat? Trends Biochem. Sci. 2012, 37, 118–125. [Google Scholar] [CrossRef]
  81. Singh, S.K.; Reddy, V.R.; Fleisher, D.H.; Timlin, D.J. Phosphorus nutrition affects temperature response of soybean growth and canopy photosynthesis. Front. Plant Sci. 2018, 9, 1116. [Google Scholar] [CrossRef] [PubMed]
  82. Rabbinge, R. The ecological background of food production. In Crop Production and Sustainable Agriculture; Rabbinge, R., Ed.; John Wiley and Sons: New York, NY, USA, 1993; pp. 2–29. [Google Scholar]
  83. Ievinsh, G. Water content of plant tissues: So simple that almost forgotten. Plants 2023, 12, 1238. [Google Scholar] [CrossRef]
  84. Chavarria, G.; Pessoa des Santos, H. Plant water relations: Absorption, transport and control mechanisms. In Advances in Selected Plant Physiology Aspects; Montanaro, G., Ed.; Intech Europe: Rijeka, Croatia, 2012; pp. 105–133. [Google Scholar]
  85. Steudle, E. Water uptake by roots: Effects of water deficit. J. Exp. Bot. 2000, 51, 1531–1542. [Google Scholar] [CrossRef]
  86. Kou, X.; Han, W.; Kang, J. Responses of root system architecture to water stress at multiple levels: A meta-analysis of trials under controlled conditions. Front. Plant Sci. 2022, 13, 1085409. [Google Scholar] [CrossRef] [PubMed]
  87. Smucker, A.J.M.; Aiken, R.M. Dynamic root responses to water deficits. Soil Sci. 1992, 154, 281–289. [Google Scholar] [CrossRef]
  88. Fromm, H. Root plasticity in the pursuit of water. Plants 2019, 8, 236. [Google Scholar] [CrossRef]
  89. Cai, Q.; Zhang, Y.; Sun, Z.; Zheng, J.; Bai, W.; Zhang, Y.; Liu, Y.; Feng, L.; Feng, C.; Zhang, Z.; et al. Morphological plasticity of root growth under mild water stress increases water use efficiency without reducing yield on maize. Biogeosciences 2017, 14, 3851–3858. [Google Scholar] [CrossRef]
  90. Fry, E.L.; Evans, A.L.; Sturrock, C.J.; Bullock, J.M.; Bardgett, R.D. Root architecture governs plasticity in response to drought. Plant Soil 2018, 433, 189–200. [Google Scholar] [CrossRef] [PubMed]
  91. Luo, Y.-Z.; Li, G.; Yan, G.; Liu, H.; Turner, N.C. Morphological features and biomass partitioning of lucerne plants (Medicago sativa L.) subjected to water stress. Agronomy 2020, 10, 322. [Google Scholar] [CrossRef]
  92. Bodner, G.; Nakhforoosh, A.; Kaul, H.P. Management of crop water under drought: A review. Agron. Sustain. Dev. 2015, 35, 401–442. [Google Scholar] [CrossRef]
  93. Al-Kaisi, M.; Broner, I. Crop Water Use and Growth Stages; CSA, No. 4.715; Colorado State University Extension: Fort Collins, CO, USA, 2009; p. 4. [Google Scholar]
  94. Passioura, J. Increasing crop productivity when water is scarce—From breeding to field management. Agric. Water Manag. 2006, 80, 176–196. [Google Scholar] [CrossRef]
  95. Kang, S.; Gu, B.; Du, T.; Zhang, J. Crop coefficient and ration of transpiration to evapotranspiration of winter wheat and maize in a semi-humid region. Agric. Water Manag. 2003, 59, 239–254. [Google Scholar] [CrossRef]
  96. Sah, R.P.; Chacraborty, M.; Prasad, K.; Pandit, M.; Tudu, V.K.; Chakravarty, M.K.; Narayan, S.C.; Rana, M.; Moharana, D. Impact of water deficit stress in maize: Phenology and yield components. Sci. Rep. 2020, 10, 2944. [Google Scholar] [CrossRef]
  97. He, M.; Dijkstra, F.A. Drought effect on plant nitrogen and phosphorus: A meta-analysis. New Phytol. 2014, 204, 924–931. [Google Scholar] [CrossRef]
  98. Rouphael, Y.; Cardarelli, M.; Schwarz, D.; Franken, P.; Colla, G. Effects of drought on nutrient uptake and assimilation in vegetable crops. In Plant Responses to Drought Stress; Aroca, R., Ed.; Springer: Berlin/Heidelberg, Germany, 2012; pp. 171–195. [Google Scholar]
  99. Rodriguez, D.; Goudriaan, J. Effects of phosphorus and drought stress an dry matter and phosphorus allocation in wheat. J. Plant Nutr. 1995, 189, 2501–2517. [Google Scholar] [CrossRef]
  100. Dixon, M.; Simonne, E.; Obreza, T.; Liu, G. Crop response to low phosphorus bioavailability with focus on tomato. Agronomy 2020, 10, 617. [Google Scholar] [CrossRef]
  101. Körner, C. Paradigm shift in plant growth control. Curr. Opin. Plant Biol. 2015, 25, 107–114. [Google Scholar] [CrossRef]
  102. Najewski, A.; Madajska, K.; Skrzypek, A. Preliminary results of cultivar yield in post-registration experiments. In Winter Cereals; COBORU: Słupia Wielka, Poland, 2023; p. 18. [Google Scholar]
  103. Meki, M.N.; Osorio, J.M.; Steglich, E.M.; Kiniry, J.R. Drought-induced nitrogen and phosphorus carryover nutrients in corn/sybean rotations in the Upper Mississippi River Basin. Sustainability 2022, 14, 15108. [Google Scholar] [CrossRef]
  104. Garcia-Oliveira, A.L.; Chander, S.; Barcelo, J.; Poschenrieder, C. Aluminum stress in plants. In Recent Advances in Plant Stress Physiology; Yadav, P., Kumar, S., Jain, V., Eds.; Daya Publishing House: New Delhi, India, 2016; pp. 265–282. [Google Scholar]
  105. Prakash, J.; Agrawal, S.B.; Agrawal, M. Global trends of acidity in rainfall and its impact on plants and soil. J. Soil Sci. Plant Nutr. 2023, 23, 398–419. [Google Scholar] [CrossRef] [PubMed]
  106. Rahman, M.A.; Lee, S.H.; Ji, H.C.; Kabir, A.H.; Jones, C.S.; Lee, K.W. Importance of mineral nutrition for mitigating aluminum toxicity in plants on acidic soils: Current status and opportunities. Int. Mol. Sci. 2018, 19, 3083. [Google Scholar] [CrossRef]
  107. Kochian, L.V. Cellular mechanism of aluminum toxicity and resistance in plants. Ann. Rev. Plant Biol. 1995, 46, 237–260. [Google Scholar] [CrossRef]
  108. Rout, G.R.; Samantaray, S.; Das, P. Aluminum toxicity in plants: A review. Agronomie 2003, 21, 3–21. [Google Scholar] [CrossRef]
  109. Barłóg, P.; Grzebisz, W.; Łukowiak, R. Fertilizers and fertilization strategies mitigating soil factors constraining efficiency of nitrogen in plant Production. Plants 2022, 11, 1855. [Google Scholar] [CrossRef] [PubMed]
  110. Lindsay, W.L. Chemical Equilibria in Soils; John Wiley & Sons Ltd.: New York, NY, USA, 1979; p. 449. [Google Scholar]
  111. Gessa, C.E.; Mimmo, T.; Deiana, S.; Marzadori, C. Effect of aluminum and pH on the mobility of phosphate through a soil-root interface model. Plant Soil 2005, 272, 301–311. [Google Scholar] [CrossRef]
  112. Von Wandruszka, R. Phosphorus retention in calcareous soils and the effect of organic matter on its mobility. Geochemic. Trans. 2006, 7, 1–8. [Google Scholar] [CrossRef]
  113. Baccari, B.; Krouma, A. Rhizosphere acidification determines phosphorus availability in calcareous soil and influences faba bean (Vicia faba L.) tolerance to P deficiency. Sustainability 2022, 15, 6203. [Google Scholar] [CrossRef]
  114. Russell, R.S. The plant Root Systems: Their Functions and Interaction with Soil; MC Graw-Hill Book Company: Berkshire, UK, 1977; p. 298. [Google Scholar]
  115. Hamblin, A. The influence of soil structure on water movement, crop growth, and water uptake. Adv. Agron. 1985, 39, 95–157. [Google Scholar]
  116. Colombi, T.; Torres, L.C.; Walter, A.; Keller, T. Feedbacks between soil penetration resistance, root architecture and water uptake limit water accessibility and crop growth—A vicious circle. Sci. Total Environ. 2018, 626, 1026–1035. [Google Scholar] [CrossRef] [PubMed]
  117. Weber, R.; Zalewski, D.; Hryńczuk, B. Influence of the soil penetration resistance, bulk density and moisture on some components of winter wheat yield. Int. Agrophysics. 2004, 18, 91–96. [Google Scholar]
  118. Soil Science Society of America. Glossary of Soil Science Terms; Soil Science Society of America: Madison, WI, USA, 2008. [Google Scholar]
  119. Hamza, M.A.; Anderson, W.K. Soil compaction in cropping systems: A review of the nature, causes and possible solutions. Soil Tillage Res. 2005, 82, 121–145. [Google Scholar] [CrossRef]
  120. Correa, J.; Postma, J.A.; Watt, M.; Wojciechowski, T. Soil compaction and the architectural plasticity of root systems. J. Exp. Bot. 2019, 70, 6019–6034. [Google Scholar] [CrossRef] [PubMed]
  121. Unger, P.W.; Kaspar, T.C. Soil compaction and root growth: A review. Agron J. 1994, 86, 759–766. [Google Scholar] [CrossRef]
  122. Shaheb, M.R.; Venkatesh, R.; Shearer, S.A. A review on the effect of soil compaction and its management for sustainable crop production. J. Biosys. Eng. 2021, 46, 417–439. [Google Scholar] [CrossRef]
  123. Lipiec, J.; Horn, R.; Pietrusiewicz, J.; Siczek, A. Effects of soil compaction on root elongation and anatomy of different cereal plant species. Soil Tillage Res. 2012, 121, 74–81. [Google Scholar] [CrossRef]
  124. Claupen, W. Nitrogen fertilization and chemical plant protection in a long-term field experiment and the yield response laws of Liebig. Liescher. Wollny and Mitscherlich. J. Agron. Crop Sci. 1993, 171, 102–113. [Google Scholar]
  125. Chields, P.E. Irelands early chemical industry. Chem. Action 1998, 55, 10–20. [Google Scholar]
  126. He, X.; Augusto, L.; Goll, D.S.; Ringeval, B.; Wang, Y.; Helfenstein, J.; Huang, Y.; Yu, K.; Wang, Z.; Yang, Y.; et al. Global patterns and drivers of soil total phosphorus concentration. Earth Syst. Sci. Data 2021, 13, 5831–5846. [Google Scholar] [CrossRef]
  127. Conijn, J.G.; Bindraban, P.S.; Schroder, J.J.; Jongschaap, R.E.E. Can our global food system meet food demand within planetary boundaries? Agric. Ecosys. Environ. 2018, 252, 244–256. [Google Scholar] [CrossRef]
  128. Nedelciu, C.E.; Ragnarsdottir, K.V.; Schlyter, P.; Stjernquist, I. Global phosphorus supply chain dynamics: Assessing regional impact by 2050. Glob. Food Secur. 2020, 26, 100426. [Google Scholar] [CrossRef]
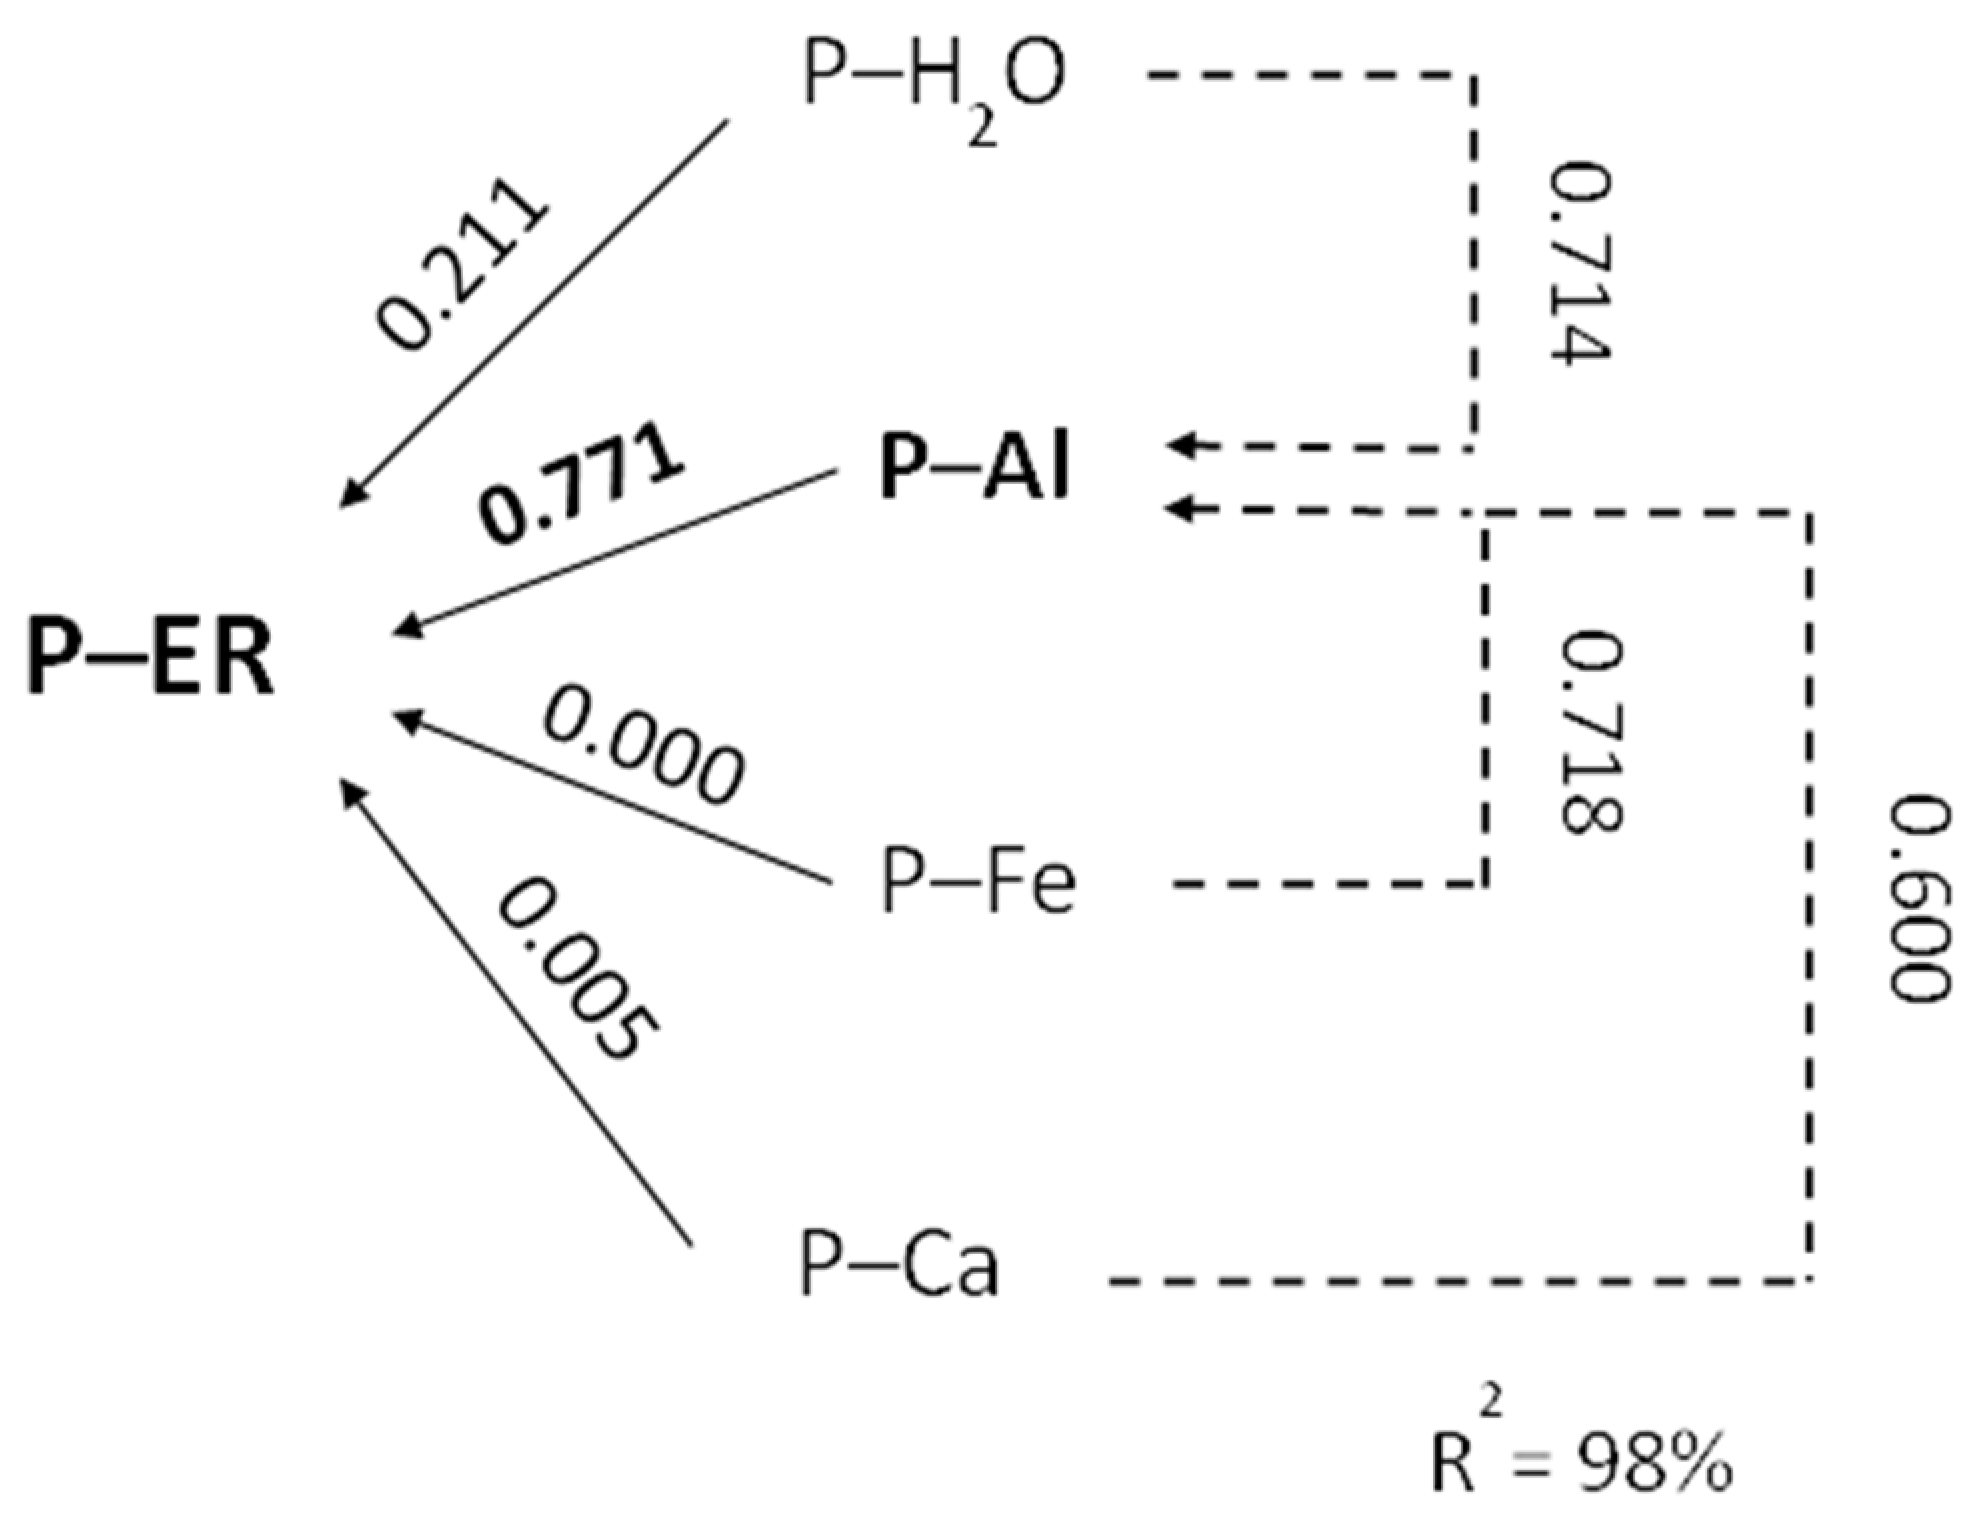
  129. Arenberg, M.R.; Arai, Y. Chapter three—Uncertainties in soil physicochemical factors controlling phosphorus mineralization and immobilization processes. Adv. Agron. 2019, 154, 153–200. [Google Scholar]
  130. Kabala, C.; Galka, B.; Labaz, B.; Anjos, L.; de Souza Cavassani, R. Towards more simple and coherent chemical criteria in a classification of anthropogenic soils: A comparison of phosphorus tests for diagnostic horizons and properties. Geoderma 2018, 320, 1–11. [Google Scholar] [CrossRef]
  131. Bon van der, E.J.T.; Mclaren, T.I.; Doolette, A.L.; Magid, J.; Frossard, E.; Oberson, A.; Jensen, L.S. Influence of long-term phosphorus fertilization history on the availability and chemical nature of soil phosphorus. Goederma 2019, 355, 113909. [Google Scholar] [CrossRef]
  132. Fixen, P.E.; Grove, J.H. testing soils for phosphorus. In Soil Testing and Plant Analysis, 3rd ed.; SSSA Book Series; Westerman, R.L., Ed.; John Wiley: Hoboken, NJ, USA, 1990; Volume 3, pp. 141–180. [Google Scholar]
  133. Potarzycki, J. Forms of phosphorus in long-lasting soils fertilization with mineral and organic fertilizers. In Science. Industry. Technology. Marketing. International Scientific-Research Seminar; Górecki, H., Dobrzański, Z., Kafarski, P., Eds.; Oficyna Wydawnicza Politechniki Wrocławskiej: Wrocław, Czech Republic, 2000; pp. 69–76. [Google Scholar]
  134. Kęsik, K. Application of the Mehlich 3 method in the fertilizer advisory system. Stud. I Rap. IUNG-PIB 2016, 48, 95–104, (In Polish with English Summary). [Google Scholar]
  135. Mallarino, A.P.; Borges, R. Phosphorus and potassium distribution in soil following long-term deep-band fertilization in different tillage systems. Soil Soc. Soc. Am. J. 2006, 70, 702–707. [Google Scholar] [CrossRef]
  136. Kautz, T.; Amelung, W.; Ewert, F.; Gaiser, T.; Horn, R.; Jahn, R.; Javaux, M.; Kemna, A.; Kuzyakova, Y.; Munch, J.-C.; et al. Nutrient acquisition from arable subsoils in temperate climates: A review. Soil Biol. Biochem. 2013, 57, 1003–1022. [Google Scholar] [CrossRef]
  137. Bauke, S.L.; von Sperber, C.; Tamburini, F.; Gocke, M.I.; Honermeier, B.; Schweitzer, K.; Baumecker, M.; Don, A.; Sandhage-Hofmann, A.; Amelung, W. Subsoil phosphorus is affected by fertilization regime in long-term agricultural experimental trials. Europ. J. Soil Sci. 2018, 69, 103–112. [Google Scholar] [CrossRef]
  138. Spinoni, J.; Naumann, G.; Voght, J.V. Pan-European seasonal trends and recent changes of drought frequency and severity. Glob. Planet. Chang. 2017, 148, 113–130. [Google Scholar] [CrossRef]
  139. Minea, I.; Iosub, M.; Boicu, D. Multi-scale approach for different type of drought in temperate climatic conditions. Nat. Hazards 2022, 110, 1153–1177. [Google Scholar] [CrossRef]
  140. Barłóg, P.; Łukowiak, R.; Grzebisz, W. Predicting the content of soil mineral nitrogen based on the content of calcium chloride-extractable nutrients. J. Plant Nutr. Soil Sci. 2017, 180, 624–635. [Google Scholar] [CrossRef]
  141. Samreen, S.; Kausar, S. Phosphorus fertilizer: The original and commercial sources. In Phosphorus; Zhang, T., Ed.; Intech Europe: Rijeka, Croatia, 2019; pp. 81–94. [Google Scholar]
  142. Mortvedt, J.; Murphy, L.; Follet, R. Fertilizer Technology and Application. Meister Pu. Co.: Madison, WI, USA, 1999; p. 199. [Google Scholar]
  143. Potarzycki, J.; Grzebisz, W. Dynamics of water-soluble phosphorus release from soils fertilized in the past with slurry and mineral fertilizers (incubation experiment). Pr. Nauk. Akad. Ekon. We Wrocławiu 2001, 888, 190–196, (In Polish with English summary). [Google Scholar]
  144. Fernández, V.; Sotiropoulus, T.; Brown, P. Foliar Fertilization: Scientific Principles and Field Practices, 1st ed.; IFA: Paris, France, 2013; p. 145. [Google Scholar]
  145. Singh, J.; Singh, M.; Jain, A.; Bhardway, S.; Singh, A.; Singh, D.K.; Bhushan, B.; Dubey, S.K. An introduction of plant nutrients and foliar fertilization: A review. In Precision Farming: A New Approach; Ram, T., Kumar Lohan, S., Singh, R., Singh, P., Eds.; Astral Inter. Pvt. Ltd.: New Delhi, India, 2014; pp. 258–320. [Google Scholar]
  146. Wójcik, P. Uptake of mineral nutrients from foliar fertilization (review). J. Fruit Ornam. Plant Res. 2004, 12, 201–208, (In Polish with English summary). [Google Scholar]
  147. Grzebisz, W. Part I. Oil crops, root and tuber crops, legumes. In Technology of Crop Plant Fertilization—Yielding Physiology; PWRiL: Poznań, Poland, 2009; p. 414. (In Polish) [Google Scholar]
  148. Almeida, R.F.; Queiroz, I.D.S.; Mikhael, J.E.R.; Oliveira, R.C.; Borges, E.N. Enriched animal manure as a source of phosphorus in agriculture. Inter. J. Rec. Org. Waste Agric. 2019, 8 (Suppl. S1), S203–S210. [Google Scholar] [CrossRef]
  149. Andriamananjara, A.; Rakotoson, T.; Razafimbelo, T.; Rabeharisoza, L.; Razafimanantsoa, M.-P.; Masse, D. Farmyard manure improves phosphorus use efficiency in weathered P deficient soil. Nutr. Cycl. Agroecosyst. 2019, 115, 407–425. [Google Scholar] [CrossRef]
  150. Pasket, A.; Zhang, H.; Raun, W.; Deng, S. Recovery of phosphorus in soil amended with manure for 119 years. Agronomy 2020, 10, 1947. [Google Scholar] [CrossRef]
  151. Stevenson, F.; Cole, M.A. Cycles of Soil, 2nd ed.; J. Wiley & Sons Inc.: New York, NY, USA, 1999; p. 427. [Google Scholar]
  152. Steiner, G.; Geissler, B.; Watson, I.; Mew, N.C. Efficiency developments in phosphate rock mining over the last three decades. Resour. Conserv. Recycl. 2015, 105, 235–245. [Google Scholar] [CrossRef]
  153. Nogalska, A.; Załuszniewska, A. The effect of meat and bone meal applied without or with mineral nitrogen on macronutrient content and uptake by winter oilseed rape. J. Elem. 2010, 25, 905–915. [Google Scholar] [CrossRef]
  154. Rahman, M.M.; Salleh, A.A.M.; Rahid, U.; Ahsan, A.; Hossain, M.M.; Ra, C.S. Production of slow release crystal fertilizer from wastewater through struvite crystallization—A review. Arabian J. Chem. 2014, 7, 139–155. [Google Scholar] [CrossRef]
  155. Tymchuk, I.; Shkvirko, O.; Sakalova, H.; Malovany, M.; Dabizhuk, T.; Shevchuck, O.; Matviichuk, O.; Vasylinych, T. Wastewater as a source of nutrients for crops growth and development. J. Ecol. Eng. 2020, 21, 88–96. [Google Scholar] [CrossRef] [PubMed]
  156. Herzel, H.; Krüger, O.; Hermann, L.; Adam, C. Sewage sludge ash—A promising secondary phosphorus source for fertilizer production. Sci. Total Environ. 2016, 542, 1136–1143. [Google Scholar] [CrossRef] [PubMed]
  157. EU. Regulation (EU) 2019/1009 of the European Parliament and of the Council of 5 June 2019 laying down rules on the making available on the market of EU fertilising products and amending Regulations (EC) No 1069/2009 and (EC) No 1107/2009 and repealing Regulation (EC) No 2003/2003 (Text with EEA relevance). Off. J. Eur. Union 2019, L170, 1–114. [Google Scholar]
  158. MARD-PL. Regulation of the Minister of Agriculture and Rural Development of 18 June 2008 regarding the implementation of certain provisions of the Act on fertilizers and fertilization. J. Laws 2008, 119, 765. [Google Scholar]
  159. Vogel, T.; Nells, M.; Eichler-Lobermann, B. Phosphorus effects recycled products from municipal wastewater on crop in a field experiment. Plant Soil Environ. 2017, 63, 475–482. [Google Scholar] [CrossRef]
  160. Oenema, O.; Chardon, W.; Ehlert, P.; van Dijk, K.; Dchoumana, O.; Rulkens, W. Phosphorus Fertilisers from by-Products and Wastes; IFS Proceedings No. 177; International Fertilizer Society: Staffordshire, UK, 2012; 56p. [Google Scholar]
  161. Hertzberger, A.J.; Cusik, R.D.; Margenot, A.J. A Review and meta-analysis of the agricultural potential of struvite as phosphorus fertilizer. Soil Sci. Soc. Am. J. 2020, 84, 653–671. [Google Scholar] [CrossRef]
Figure 1. Mobility and availability of inorganic phosphorus in the soil solution under optimal ((A) field capacity) and suboptimal water conditions ((B) water deficiency-induced precipitation by Al3+ or Ca2+); the red line indicates the direction of orthophosphate ion flow in the soil solution.
Agronomy 14 00200 g001
Figure 2. Drastic phosphorus deficiency in the early stage of maize development (A) leads to no or poor cob formation (B). (Source: Witold Grzebisz).
Agronomy 14 00200 g002
Figure 3. Hypothetical model of Pi ions uptake by a legume plant from soil, in a neutral soil reaction.
Agronomy 14 00200 g003
Figure 4. The effect of water conditions and phosphorus doses on wheat yield in a pot experiment (based on [101]). Legend: FC—field capacity; ST—water stress).
Agronomy 14 00200 g004
Figure 5. The effect of water conditions and phosphorus doses on phosphorus content in wheat parts in a pot experiment (based on [101]). Legend: FC—field capacity; ST—water stress; GR—grain; SH—shoot.
Agronomy 14 00200 g005
Figure 6. Weeds in the field—natural indicators of soil acidity and phosphorus and magnesium deficiency in maize. (Source: Witold Grzebisz).
Agronomy 14 00200 g006
Figure 7. Aluminum toxicity in winter wheat—the first symptoms are visible already at the two-leaf stage, leading to the loss of plants from the field (Source: Witold Grzebisz).
Agronomy 14 00200 g007
Figure 8. Simplified diagram of phosphorous resources and their flow on the farm.
Agronomy 14 00200 g008
Figure 9. A simplified diagram of the relative content and fractions of phosphorus against soil reaction. Legend: Pi—inorganic phosphorus; P ≈ Al—adsorbed P; P–Ca, P–Al, P–Fe–P fixed by Ca, Al, and Fe, respectively.
Agronomy 14 00200 g009
Figure 10. The path diagram of the Egner–Riehm available phosphorus—dependence of phosphorus fractions in typical Polish soils; letters and numbers in bold indicate the main P form and strength of the relationship (source: Potarzycki [133]).
Agronomy 14 00200 g010
Figure 11. The trend of inorganic phosphorus (Pi) content depends on the source. (Source: Ref. [143]).
Agronomy 14 00200 g011
Figure 12. A simplified diagram of the association between phosphorus fertilizers and soil phosphorus pools. Legend: PAPRs—partially acidulated phosphate rocks; SSP, TSP, MAP, DAP—single superphosphate, triple superphosphate; mono-ammonium phosphate; di-ammonium phosphate, respectively; APP—ammonium polyphosphate.
Agronomy 14 00200 g012
Figure 13. Apparent recovery of P applied in manures and non-agricultural sources of P against the background of recovery of triple phosphate considered as 100% (based on IFS proceeding No. 717; [159]). Legend: Maso—manure dairy solid; MAsl—dairy slurry; MaBm—meat and bone meal; SEsl—sewage sludge; STww—struvite from wastewater; Stvma—struvite from veal manure; DCPww—DCP di-calcium phosphate from waste water; Biochar—biochar from thick co-digested pig manure, 400 °C; TSP—triple superphosphate.
Agronomy 14 00200 g013
Table 1. Density of roots in the topsoil and the rooting depth of selected crop plants [31,32].
Crop PlantDensity of Roots in the SoilEffective Rooting Depth
cm cm−3cm
Potato1–240–50
Sugar beet1–2150
Pulses, pea0.2–240–60
Maize3–490–130
Winter wheat4–5 (8)80–100
Spring barley4–550–80
Grasses3–20100
Winter oilseed rape4–560–80
Table 2. Diversity of organic acid produced by PSMs (phosphate solubilizing microbes).
PSM IsolatesOrganic AcidsReferences
PseudomonasCitric acid, succinic acid, fumaric acid, gluconic acid, 2-ketogluconic acids[48,49]
Bacillus sp.Citric acid, malic acid, succinic acid, fumaric acid, tartaric acid, gluconic acid[48]
Proteus sp.Citric acid, succinic acid, fumaric acid, gluconic acid[48]
Azospirillum sp.Citric acid, succinic acid, fumaric acid, gluconic acid[48]
AspergillusCitric acid, gluconic acid, oxalic acid, succinic acid, malic acid, glycolic acid[50]
Penicillium sp.Gluconic acid, glycolic acid, succinic acid, malic acid, oxalic acid, citric acid[50]
Erwinia herbicolaGluconic acid, 2-ketogluconic acid[49]
Table 3. Classes of available phosphorus in the soil according to different P tests 1, mg P2O5 kg−1 soil.
Soil pH Range Soil Fertility Classes
Very LowLow MediumHighVery High
Egner–Riehm Doppel lactate method
-<5056–100101–150151–200>200
Mehlich 3 method
Very acid (<pH 4.5)<115115–252 254–426428–600 >600
Acid (pH (pH 4.6–5.5)<112112–236 238–362 364–493 >493
Slightly acid (pH 5.6–6.5)<108108–227 229–348 351–474 >474
Neutral (pH 6.6–7.2)<6262–124 126–172 174–227 >227
Alkaline (pH > 7.2)<6262–124 126–172 174–227 >227
1 Ref. [134].
Table 4. Phosphorus fertilizers’ main agrochemical properties 1.
Name Chemical FormulaP content, %
P2O5
Water Solubility, %Soil Acidifying Effect
Solid
Single superphosphate, SSPCa(H2PO4)2 · H2O
+ CaSO4 · 2H2O
16–2185Neutral
Triple superphosphate, (TSP)Ca(H2PO4)2 · 2H2O41–5085Neutral
Monoammonium phosphate (MAP)NH4H2PO4, 11%N5182Slightly
Diammonium phosphate (DAP)(NH4)2HPO4, 18% N4692Moderate
Partially acidulated phosphate rocks (PAPRs)Ca(H2PO4)2 · H2O
+ CaSO4 ·2H2O × Ca3PO4
23–26VariableNon-acidifying
Nitrophosphates, NP14–29%N22–35≥50Moderate
Liquid/foliar fertilizerSolution reaction
Ammonium polyphosphate, APPNH4P2O7; 10; 11% N34, 37100Slightly acid
Dipotassium phosphateK2 HPO440100Alkaline
Monosodium phosphateNaH2 HPO45387Acid
Phosphoric acidH3PO454100Acid
1 Miscellaneous sources.
Table 5. Chemical characteristic of manures 1.
Manure Dry Matter, %pHNorg, %C:NP, %C:P
Solid manures
Dairy 20–256.5–7.02.0–3.013–201.0–1.5025–40
Pig 20–257.0–7.52.0–3.511–201.0–2.020–40
Chicken 40–606.0–8.03.0–5.08–140.4–0.850–100
Liquid manures and digestate
Cattle slurry8–107.0–7.52.5–3.511–150.8–1.525–50
Pig slurry4–67.0–8.03.0–5.08–122.0–3.015–20
Digestate 5–87.0–8.04.0–6.07–100.6–1.525–65
1 based on various literature sources; the content of C was established at 40% DM.
Disclaimer/Publisher’s Note: The statements, opinions and data contained in all publications are solely those of the individual author(s) and contributor(s) and not of MDPI and/or the editor(s). MDPI and/or the editor(s) disclaim responsibility for any injury to people or property resulting from any ideas, methods, instructions or products referred to in the content.

