Article

Enhancing Resistance to Salinity in Wheat by Using Streptomyces sp. HU2014

1
School of Chemistry and Chemical Engineering, Henan Institute of Science and Technology, Xinxiang 453003, China
2
Plant Protection and Quarantine Department, Sumy National Agrarian University, 40021 Sumy, Ukraine
3
Department of General and Soil Microbiology, Institute of Microbiology and Virology Named after D.K. Zabolotny National Academy of Sciences of Ukraine, 03143 Kyiv, Ukraine
4
College of Life Sciences, Henan Agricultural University, Zhengzhou 450001, China
*
Authors to whom correspondence should be addressed.
Agronomy 2024, 14(1), 39; https://doi.org/10.3390/agronomy14010039
Submission received: 23 November 2023 / Revised: 16 December 2023 / Accepted: 19 December 2023 / Published: 22 December 2023

Abstract

:
Salt stress affects the growth and global production of wheat (Triticum aestivum L.). Plant growth-promoting microbes can enhance plant resistance to abiotic stresses. In this study, we aimed to assess the inoculation of soil with Streptomyces sp. HU2014 to improve wheat tolerance to salt stress from multiple perspectives, including the interaction of the strain, the addition of NaCl, the condition of the wheat, and rhizosphere microbial communities. The results showed that the strain promoted wheat growth under NaCl stress by increasing biomass by 19.8%, total chlorophyll content by 72.1%, proline content by 152.0%, and malondialdehyde content by 106.9%, and by decreasing catalase by 39.0%, peroxidase by 1.4%, and soluble sugar by 61.6% when compared to the control. With HU2014 soil inoculation, total nitrogen, nitrate nitrogen, total phosphorus, and Olsen phosphorus increased, whereas ammonium nitrogen and pH decreased. HU2014 inoculation and/or the addition of NaCl affected the diversity of rhizosphere bacteria, but not fungi. The structure of the microbial community differed after HU2014 inoculation, with Proteobacteria, Acidobacteriota, Bacteroidota, and unclassified fungi being the dominant phyla, and these taxa correlated with the above-mentioned soil parameters. Thus, this study provided a promising way to enhance wheat tolerance to salt stress and improve the agricultural ecological environment by using plant growth-promoting microbes.

1. Introduction

Saline land is distributed extensively worldwide. Globally, about 7% of the soil area in the world is endangered by salinization, and this abiotic stress limits plant growth and crop yield [1,2,3]. Concurrently, salinity affects the physicochemical properties and microbial structure of soil [4,5]. The serious consequences of salt deposition in planting soils cause environmental deterioration.
Wheat (Triticum aestivum L.) is an important cereal crop, mainly planted in northern China; its production occupies a crucial economic position [6]. However, wheat cultivation is confronted by various threats including biotic and abiotic stress. Salt stress can adversely impact the cultivation and yield of wheat, resulting in water loss, nutrient deficiency, cell membrane damage, and the obstruction of metabolic pathways [7,8,9]. The possible causes of the physiological response to salt in wheat are attributed to trophic ion imbalance, the disturbance of osmoregulation ability, and a dysfunctional antioxidant system [10,11]. Under salt conditions, plant tissues are mainly occupied by excessive Na+, which reduces photosynthesis by affecting stomatal conductance [12]. Additionally, plants are subjected to oxidative damage caused by the generation of reactive oxygen species (ROS) due to salt stress [13]. In response to these ROS, some antioxidant components are produced by the plants’ defense systems, such as superoxide (POD), superoxide dismutase (SOD), and catalase (CAT) [14,15]. Soluble sugar and proline contents are related to plant resistance. These can be used as useful indicators of plant resistance to abiotic stress [16,17]. To cope with salt stress, new ways need to be explored for the sustainability of agriculture [18]. The purpose of the amelioration of soil salinity is not only to remove salt but also to achieve a high and stable yield. Using the principle of ecological remediation to fully exploit the potential of microorganisms is worthy of exploration.
Specific microorganisms can enhance plant tolerance to abiotic stress through their colonization and interaction with plants [19,20]. Many studies have shown that Trichoderma spp., Bacillus spp., Pseudomonas spp., and Streptomyces spp. can protect plants against salt stress and promote plant growth [21,22,23,24]. The mechanisms of these microbes enhancing salt tolerance include producing bioactive metabolites, inducing plant system resistance, and enhancing microbial community structure in the plant rhizosphere. For example, Bacillus safensis PM22 produced auxins and induced changes in CAT and POD activities and in the malondialdehyde (MDA) content of maize plants under saline stress [25]. Streptomyces isolate (C) increased indole acetic acid production and the concentration of nitrogen and phosphorus in wheat shoots under salt stress [26]. Some oxidases induced by Cronobacter sakazakii KM042090, such as POD and SOD, were enhanced to assist wheat in saline conditions [27]. In addition, plants and rhizospheric microorganisms form a symbiotic system, which provides a suitable environment for plant growth. In view of their broad genetic diversity, microorganisms are vital in the coordination of plant diversity and ecological processes [28]. The structural changes in microorganisms follow the pattern of “as one falls, another rises”, based on the growth demands of plants in different environments. Berg et al. proposed that the pathogenic and beneficial microbes in the microbial community were interdependent and dynamically changing [29]. Bacillus amyloliquefaciens CZ-6 inoculation remarkably increased salt-tolerant Tausonia while decreasing Chaetomium and Gibberella pathogens in winter jujube rhizosphere soil [23]. The structural adjustment of rhizospheric microorganisms coexists harmoniously with the plants in salt conditions. Reports have shown that several salt-tolerating microbes have been developed for crop production in salt soil [30].
Streptomyces spp. as plant growth-promoting microorganisms have been widely reported, but research into the mechanism for inducing salt tolerance in wheat is lacking. Streptomyces sp. HU2014 (HU2014), a novel Streptomyces species, could promote wheat growth by producing plant auxins including indoleacetic acid and siderophores and extracellular enzymes, and by suppressing wheat sharp eyespot caused by Rhizoctonia spp. [31]. To investigate how microbes inoculated into the rhizosphere assist plants in coping with salt stress, the influences of HU2014 on wheat physiology under salt stress were examined. We also evaluated changes in soil parameters and wheat rhizosphere microbial communities after HU2014 inoculation and the addition of NaCl. This study provided theoretical support for the bioremediation of salt stress in the planting of wheat.

2. Materials and Methods

Wheat cultivar Zhoumai 22 (ZM22) and HU2014 were provide by the Henan Institute of Science and Technology in Xinxiang, China. ZM22 is a semi-winter variety with limited reports on tolerance to salt stress. The complete genome sequence of HU2014 is under the accession number CP097123 in GenBank.

2.1. Salt Stress and HU2014 Inoculation on Wheat

The first trial was conducted with wheat seeds growing in Hoagland substrate in the presence of NaCl. ZM22 seeds were pretreated following a method described previously [32]. The well-germinated seeds were distributed randomly in half-strength Hoagland cultivation solutions including 0, 200 mM, and 400 mM NaCl. Each treatment group contained five germinated seeds, and they were grown in a greenhouse at 25 °C. The whole culture solution was renewed every two days. After 7 days, the wheat seedlings in each group were dried at 75 °C to constant weight, and then the dry weight was measured.
Next, co-culture experiments were performed with wheat growing in nonsterile soil inoculated with HU2014 and the additive NaCl. In advance, HU2014 colonies cultured in Bennett liquid broth were separated and homogeneously mixed with none-sterile soil at a ratio of 10:1000 g in each PVC pot and then left in a greenhouse for 7 days. We designed four treatments: a soil control (CK), soil inoculated with HU2014 (S), soil treated with NaCl (CNa), and soil inoculated with HU2014 and treated with NaCl (SNa). Three replicates were made for each treatment. Twelve germinated seeds were planted randomly in each pot at 25 °C and cultured for 10 d. Then, the CNa and SNa treatments were irrigated with 200 mM NaCl solution every 2 d, whereas the CK and S treatments were treated with the same volume of distilled water. When the wheat leaves were etiolated, salt stress was terminated. Wheat leaves were sampled, and the surface rhizosphere soils were collected using a sterilized brush after 45 d growth. The soil samples were used in physicochemical analyses and soil biodiversity analysis.

2.2. Determination of Wheat Physiological Indicators

Wheat shoot height and dry weight were recorded as described above. The chlorophyll content of wheat leaves was determined using UV-vis spectrophotometry (SPECORD 200, Analytic Jena AG, Jena, Germany). Pre-treatments of CAT, POD, and MDA produced by wheat were conducted using test kits following the manufacturer’s instructions (Solarbio, Beijing, China). The analysis of these enzymes was performed using a Varioskan microplate reader (Thermo Fisher Scientific Inc., Waltham, MA, USA). Soluble sugar and proline content were determined as described by [33] and [34], respectively.

2.3. Soil Physiochemical Investigation

The analysis of soil parameters followed previous methods. Soil pH was measured following the report produced by [35]. Soil organic carbon (SOC) content was measured according to a method described by [36]. Total soluble salt (TSS) content measurement was used following a method reported by [37]. Soil total phosphorus (TP), Olsen phosphorus (Olsen-P), total nitrogen (TN), ammonium nitrogen (NH4+-N), and nitrate nitrogen (NO3-N), were all measured using assay kits according to the manufacturer’s instructions (Sinobestbio Technology Co., Ltd., Shanghai, China).

2.4. DNA Extraction and Sequencing, and Bioinformatics Analysis

Fungal and bacterial DNA was extracted from 0.3 g of each soil sample using a reagent kit (MP Biomedicals, Santa Ana, CA, USA). The quantification of DNA concentration was measured using a QuantiFluor dsDNA analysis kit (Promega, Madison, WI, USA). The quality of the DNA was verified using 1.5% agarose gel electrophoresis, and the quantity of it was measured using a Quantum Level 3.0 fluorometer (Thermo Fisher Scientific Inc., Waltham, MA, USA). Fungal communities were analyzed using the ITS region with the primers ITS1FI2 as described by [38]. PCR amplification and conditions were as described previously [35]. PCR amplification was mainly conducted based on 25 µL of reaction system: template DNA 50 ng, Phusion Hot start flex 2× Master Mix 12.5 µL, each primer 2.5 µL, and ddH2O water added to 25 µL. PCR conditions were in accordance with a determined program: 98 °C for 30 s followed by 32 cycles of 98 °C for 10 s, 54 °C for 30 s, and 72 °C for 45 s and then a final extension at 72 °C for 10 min. Each sample had three technical repetitions.
The V3–V4 region of bacterial 16s rRNA gene was amplified using the universal primers 341F-805R [39], and PCR amplification procedure was followed using the modified method as reported by [35]. Briefly, PCR amplification was conducted based on 25 µL of reaction system: template DNA 1 µL, PCR premix 12.5 µL, each primer 0.5 µL, bovine serum albumin 0.25 µL, and ddH2O water added to 25 µL. PCR conditions were in accordance with a determined program: 98 °C for 30 s followed by 32 cycles of 98 °C for 10 s, 54 °C for 30 s, and 72 °C for 45 s and then a final extension at 72 °C for 10 min. Each sample had three technical repetitions. Microbial gene sequencing was conducted using the NovaSeq PE250 platform in the laboratory (LC-BIO, Hangzhou, China). The sequence data were analyzed on the LC Cloud platform (www.omicstudio.cn, accessed on 5 May 2023). DNA sequences of bacteria with the accession number PRJNA871079 and those of fungi with the accession number PRJNA870704 were submitted to NCBI.

2.5. Statistical Analysis

The current study was conducted in four treatments with a randomized design. All raw data were managed using Microsoft Excel software Version 2016. An analysis of the differences in data was performed using SPSS Version 16.0 (SPSS Inc., Chicago, IL, USA), with p < 0.05 indicating a significant difference. A biodiversity analysis was conducted using the Chao 1, Simpson, and Shannon indices (vegan package, version 3.3.2). The relative abundance of bacteria and fungi is shown in the form of percentages. Principal component analysis (PCA) was determined using the R package Version 3.18 “phyloseq” [40]. Non-metric multidimensional scaling (NMDS) was used to visualize microbial community structure (vegan package, version 3.3.2). Redundancy analysis (RDA) is a tool for explaining the relationship between complex ecosystems and environmental factors, which was shown using the R package vegan (Version 2.3-5) [41]. The correlation heat map of microbial community and soil factors was visualized using “corrplot” with Spearman’s correlation analysis.

3. Results

3.1. NaCl Resistance of ZM22

The NaCl resistance of wheat cultivar ZM22 was determined in half-strength Hoagland cultivation solutions. The growth of wheat seedlings was inhibited by the gradual increase in NaCl (p < 0.05; Figure 1). The dry weight of wheat was reduced by 47.5% at 200 mM NaCl, followed by 82.0% at 400 mM NaCl when compared with the control (0 mM NaCl).
To investigate the effect of HU2014 inoculation and the additive NaCl on the growth of wheat seedlings, we conducted the experiments in pots. The results showed that the shoot height of wheat seedlings significantly decreased by 8.0% with the additive. However, all the treatments inoculated with HU2014 increased the shoot height by 1.0–14.0% compared to the control (p < 0.05; Figure 2A). A similar trend was found in the dry weight measurement. The dry weight of wheat seedlings remarkably decreased by 10.9% in the CNa treatment, while notably increasing by 19.8–40.8% in all the treatments treated by HU2014 compared to the CK (p < 0.05; Figure 2B). The total chlorophyll contents of wheat remarkably decreased by 5.4% in the SNa group, while significantly increasing by 37.4–72.1% in the S and SNa groups when compared to the CK (p < 0.05; Figure 2C). Moreover, CAT activities significantly increased by 27.6% in the S group, while notably decreasing by 27.6–39.0% in all the NaCl groups compared to the control (p < 0.05; Figure 2D). POD activities remarkably increased by 54.2% in the CNa group, whereas they decreased by 11.4–38.2% in the S and SNa groups compared to the control (Figure 2E). MDA activities significantly increased by 106.9–129.8% in the treatments with the addition of NaCl, whereas no significant change was observed in the S group compared to the CK (p < 0.05; Figure 2F). In addition, soluble sugar content significantly increased by 74.7% in the CNa group, whereas it remarkably decreased in all HU2014 inoculation groups when compared to the CK (p < 0.05; Figure 2G). Proline contents notably increased by 131.9–152.0% in all treatments with the addition of NaCl, whereas no remarkable change was observed in the S group when compared to the control (p < 0.05; Figure 2H).

3.2. Soil Physicochemical Properties in Rhizosphere

This experiment determined the effect of HU2014 inoculation and the additive NaCl on the soil parameters. Table S1 shows variations in soil factors. The S and SNa groups had significantly greater TN (p < 0.05) than the CK, whereas the CNa group had remarkably lower TN compared to the CK. TP significantly increased in the S and SNa groups, whereas there was no significant difference in the CNa group when compared to the CK (p < 0.05). However, SOC between all groups did not change significantly (p > 0.05). NH4+-N and soil pH content decreased remarkably (p < 0.05) in all treatments compared to the CK. Additionally, NO3-N, Olsen-P, and TSS contents significantly increased (p < 0.05) in all treatments compared to the CK.

3.3. Alpha Diversity of Bacteria and Fungi Communities

The analysis of microbial sequences showed that 1,319,251 sequences of bacteria were clustered into 11,067 ASVs (from 217 to 1840) and 1,267,823 sequences of fungi were clustered into 2173 ASVs (from 38 to 360) at the 97% similarity cut-off level.
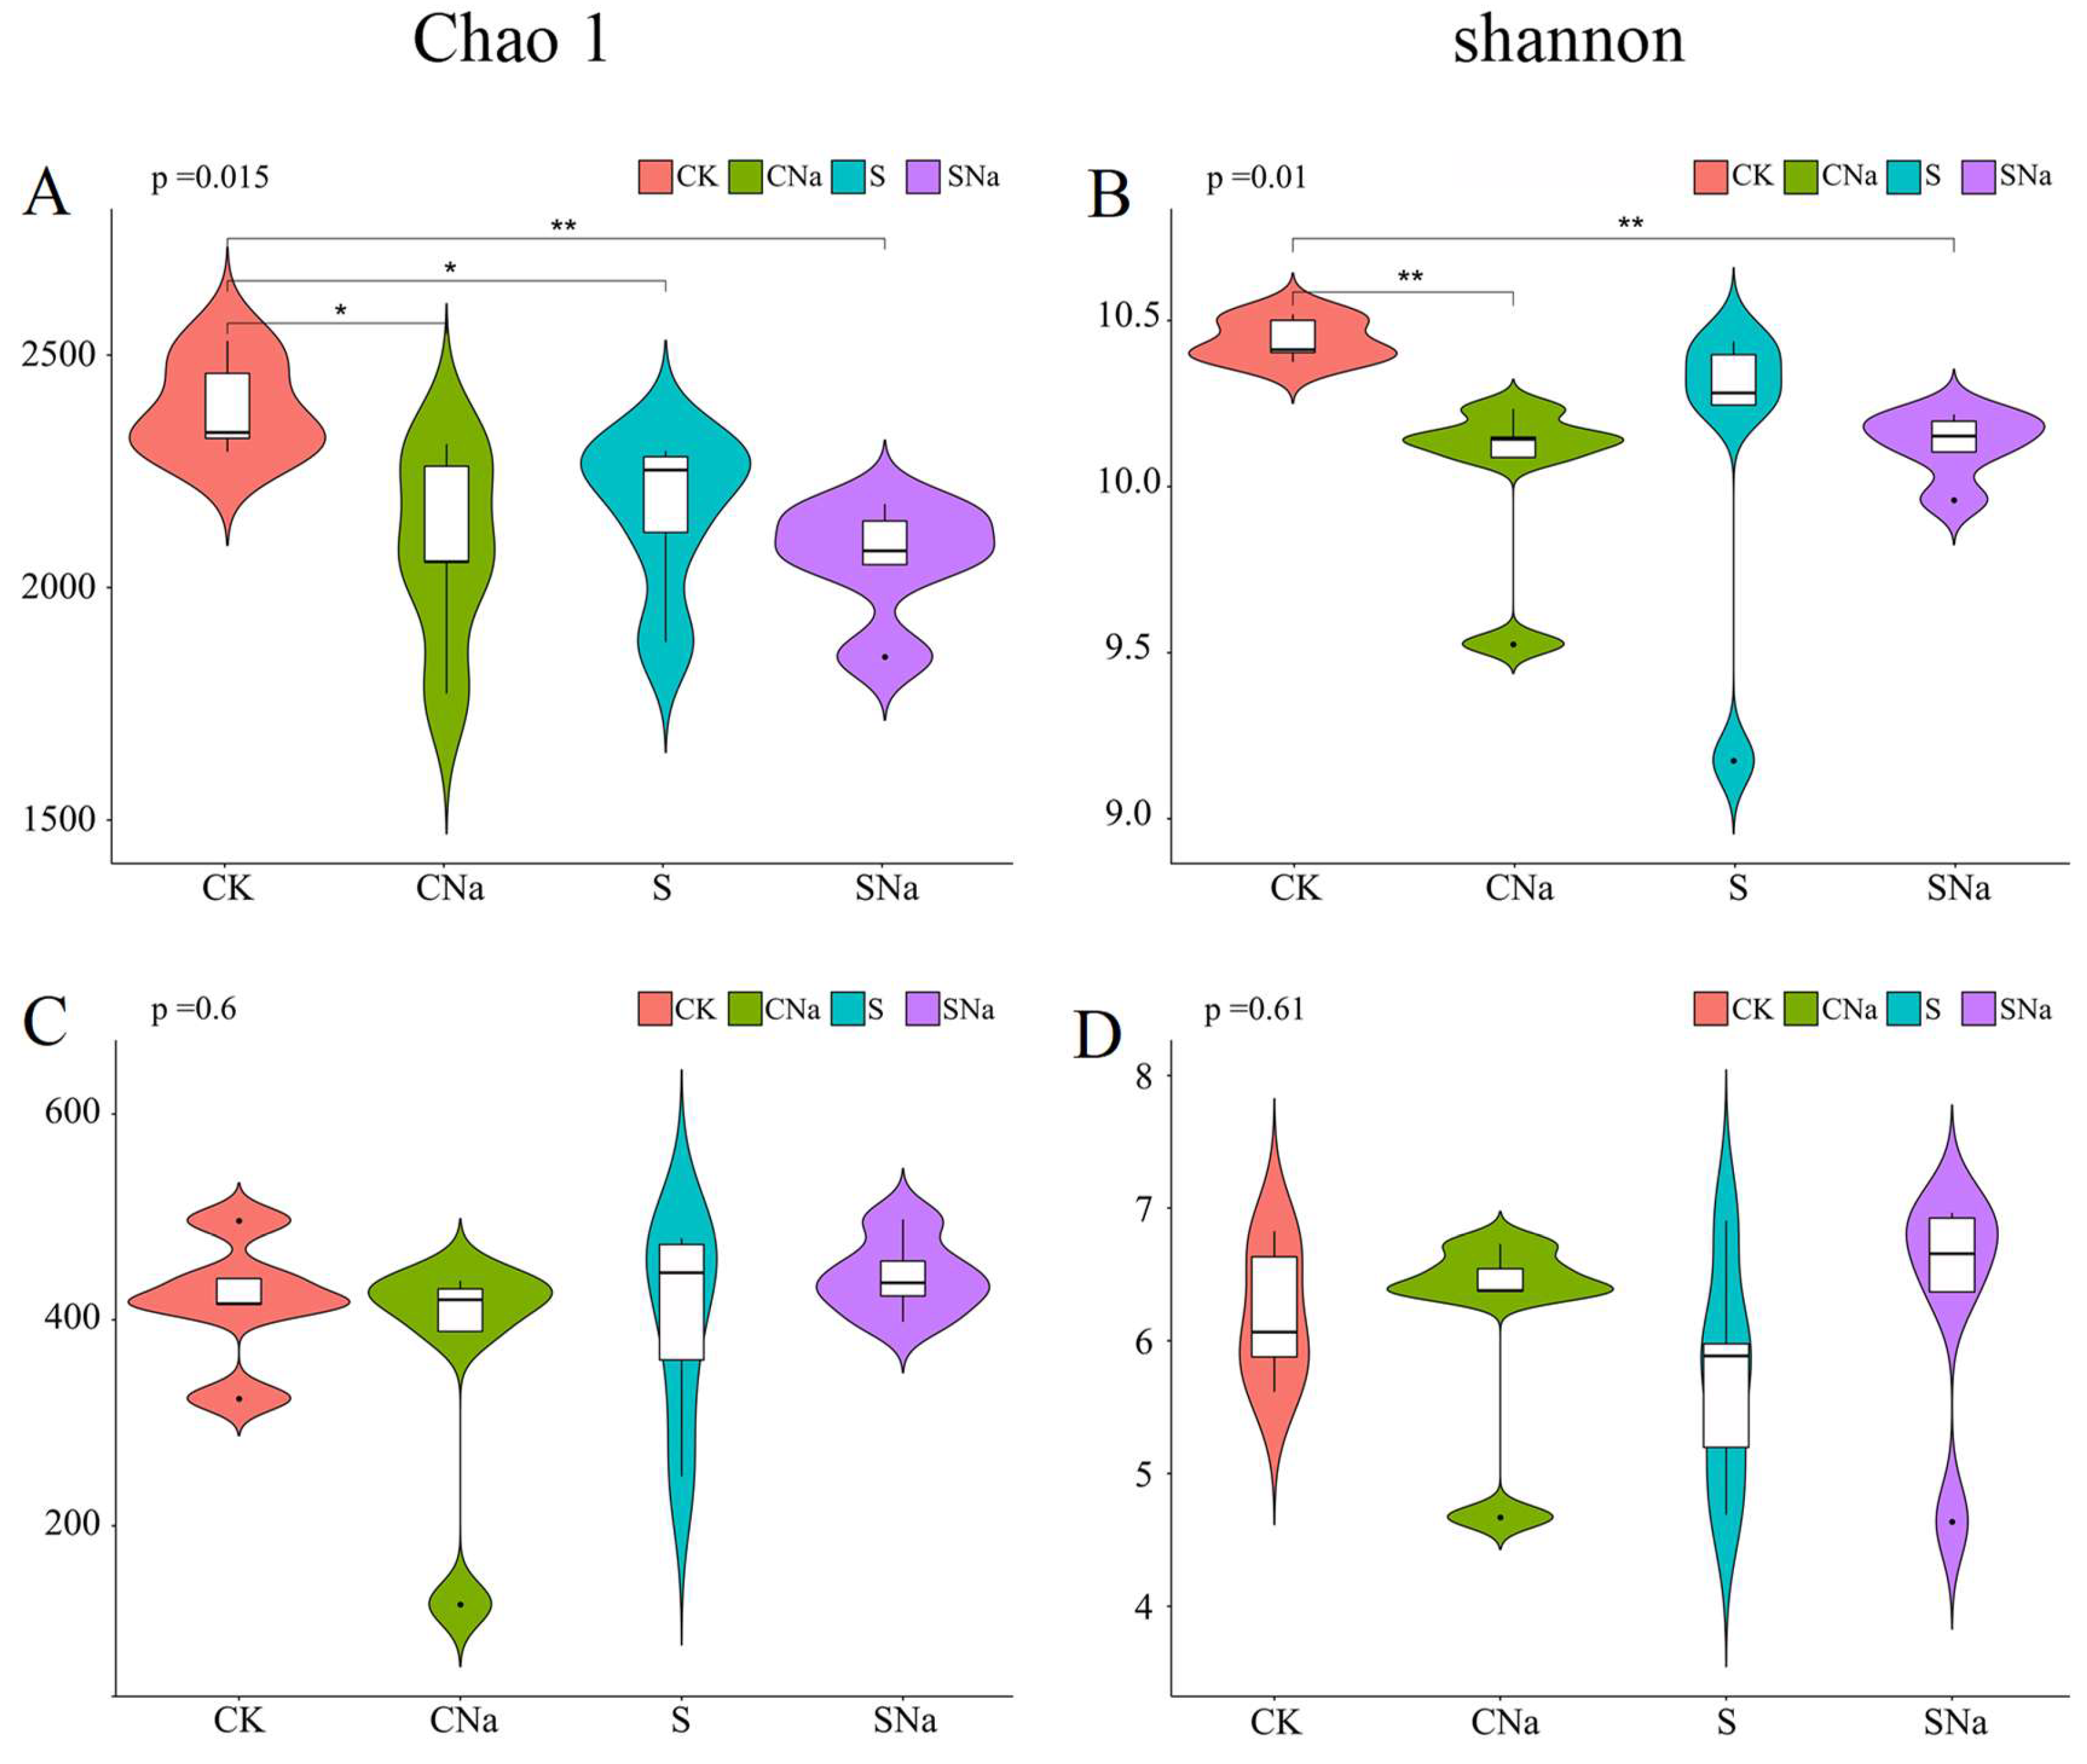
For bacteria, the Chao 1 index showed that the richness of bacterial communities was significantly affected by HU2014 inoculation and the addition of NaCl, whereas their uniformity did not change remarkably when estimated using the Shannon and Simpson indices (p < 0.05; Figure 3A,B, and Figure S1A). For fungal communities, there was no significant difference in fungal alpha indexes with the addition of NaCl and HU2014 inoculation (p > 0.05; Figure 3C,D, and Figure S1B).

3.4. Distribution of Bacteria and Fungi Community Structures

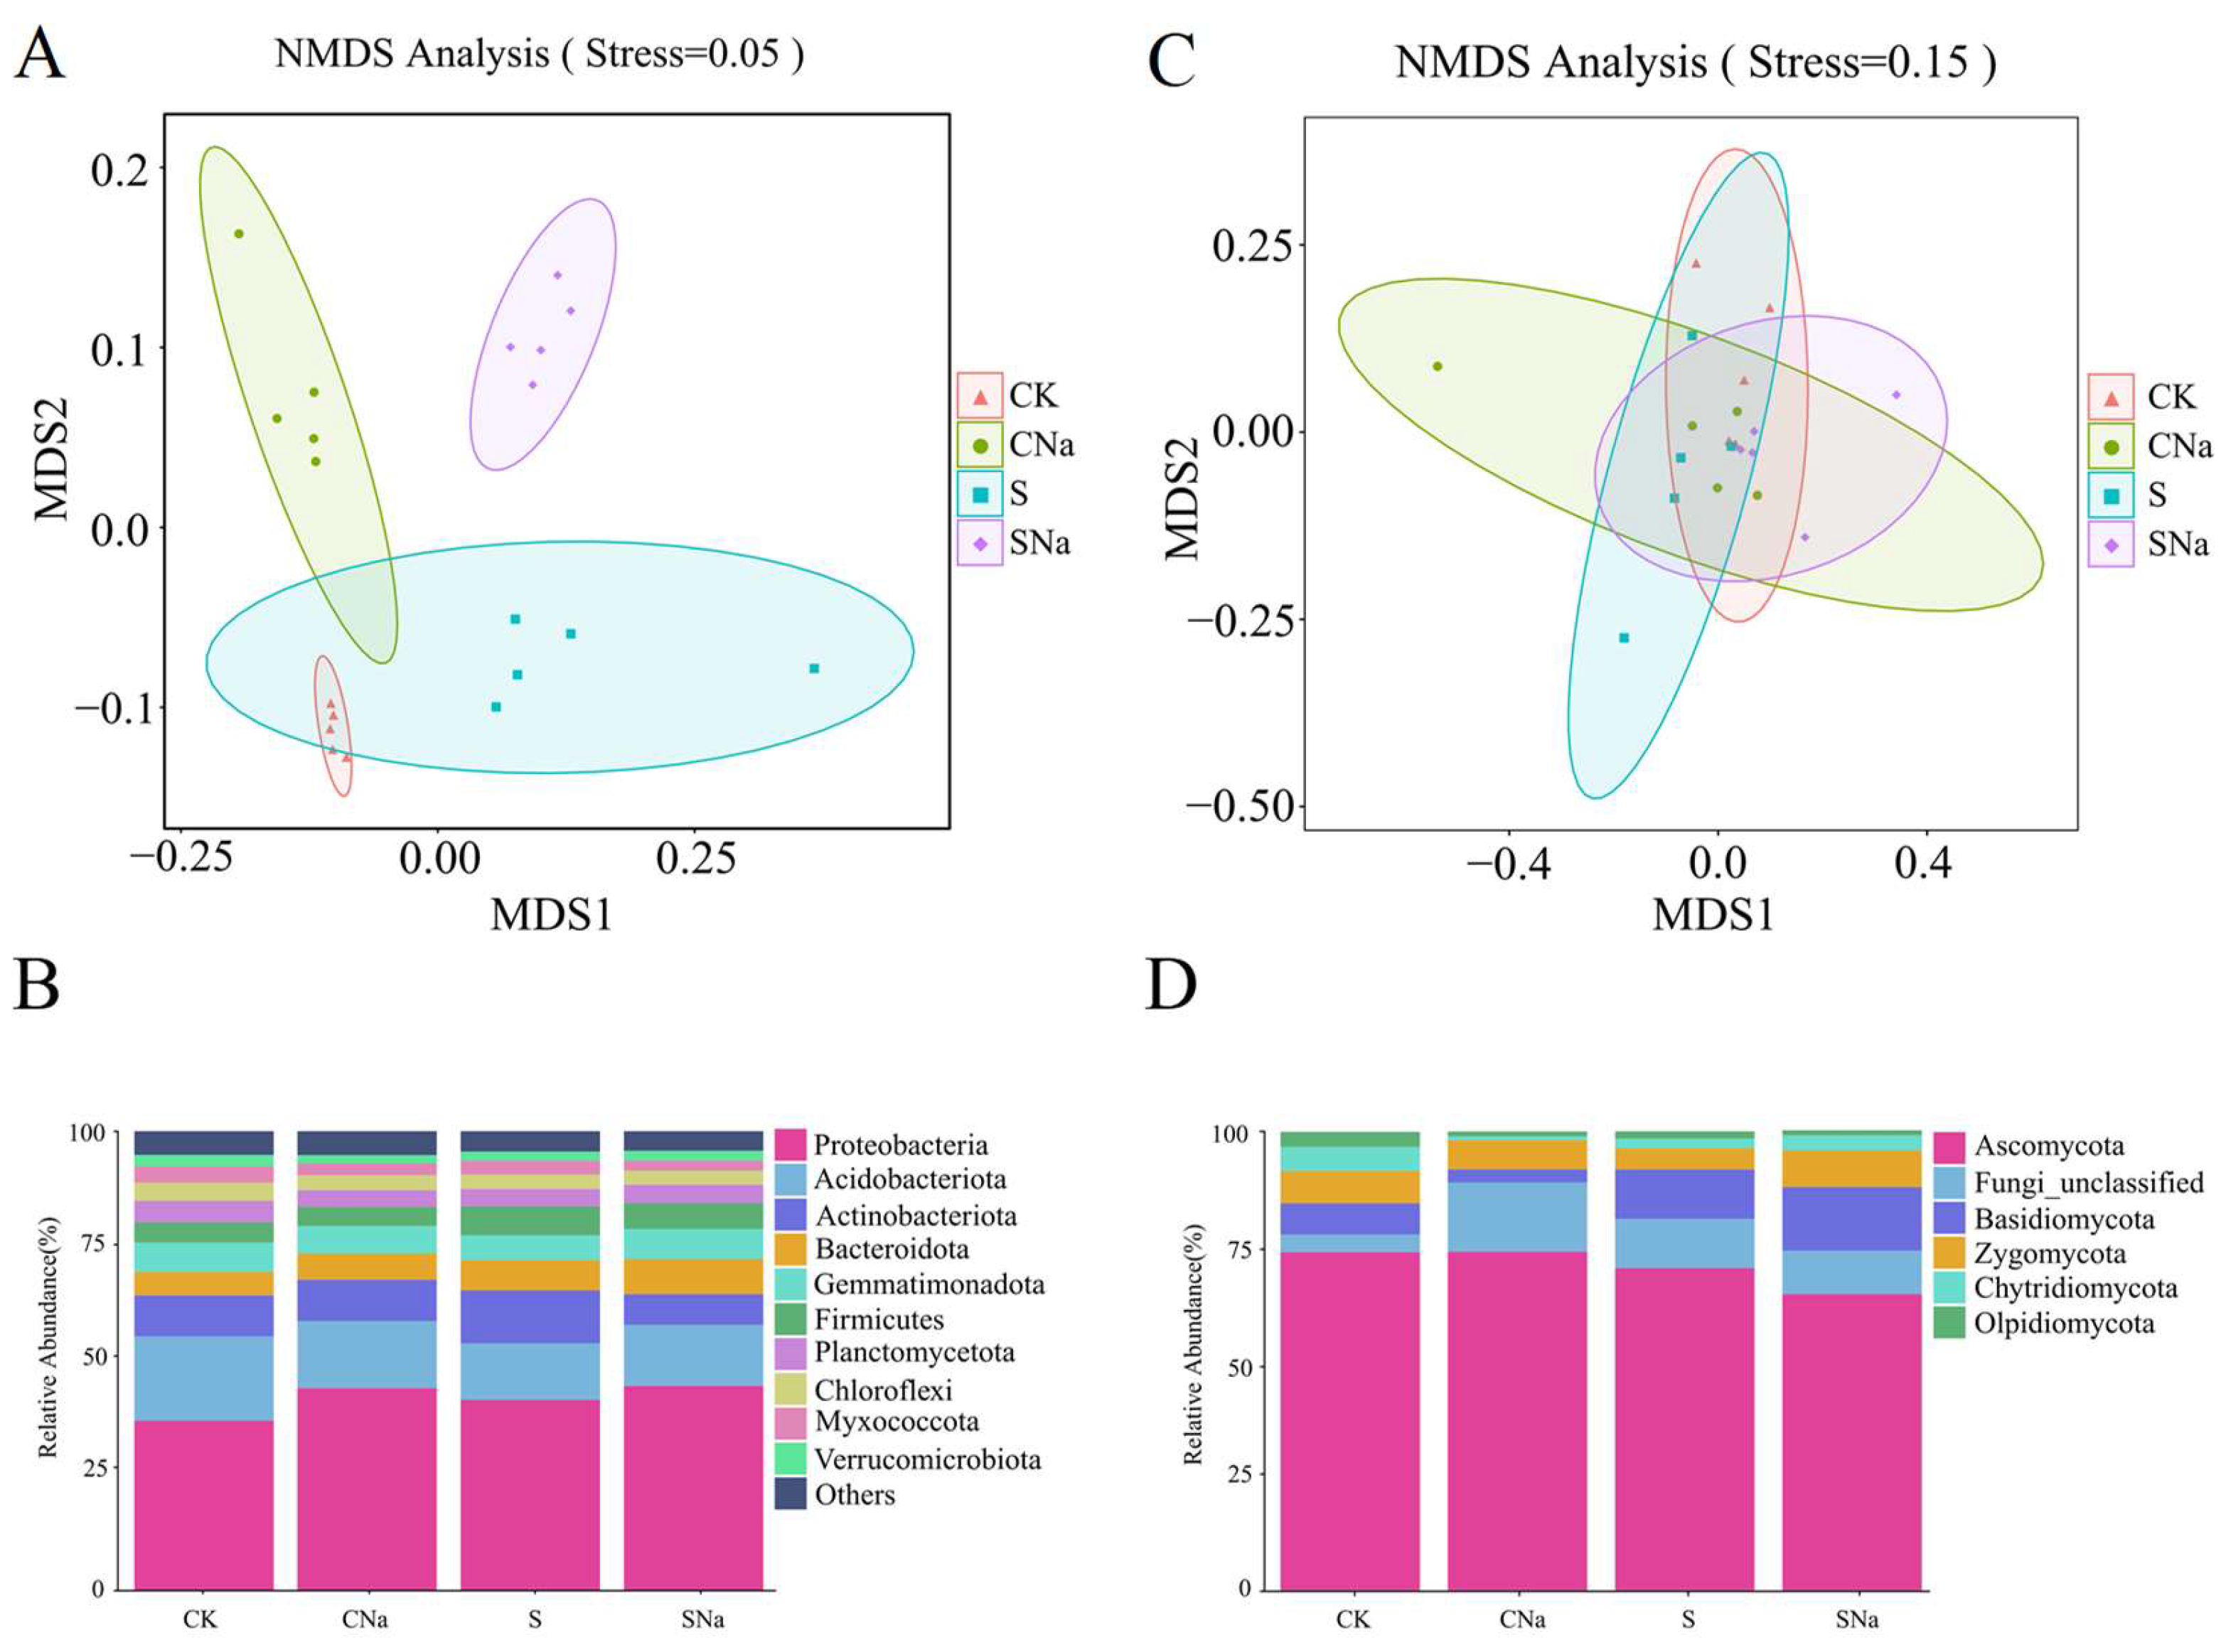
In this study, NMDS showed that bacterial community structures significantly differed in all treatments (p < 0.05; Figure 4A), whereas the fungal community structures were not remarkably different (p > 0.05; Figure 4C). The above results were confirmed in the PCA of the Bray–Curtis distance (Figure S2).
In all treatments, we assessed 10 bacterial phyla with a relative abundance > 1%. These phyla were Proteobacteria (41.71%), Acidobacteriota (14.66%), Actinobacteriota (9.03%), Bacteroidota (6.26%), Gemmatimonadota (6.11%), Firmicutes (5.12%), Planctomycetota (4.04%), Chloroflexi (3.36%), Myxococcota (2.80%), and Verrucomicrobiota (2.13%) (Figure 4B and Table S2). Other phyla, named “others”, had less than 1% relative abundance. Proteobacteria and Bacteroidota significantly increased, whereas Acidobacteriota, Chloroflexi, and Myxococcota significantly decreased (p < 0.05) in the CNa, S, and SNa groups compared with the CK. In particular, Bacteroidota notably increased (p < 0.05) in the S and SNa groups, but without a significant difference (p > 0.05) in the CNa group compared with the CK; Planctomycetota significantly decreased (p < 0.05) in the CNa treatment, but no remarkable difference (p > 0.05) was found in the HU2014 inoculated soil.
Among six fungal phyla of four treatments with a relative abundance > 1%, the taxa in proper sequence were Ascomycota (70.36%), unclassified fungi (9.79%), Basidiomycota (8.52%), Zygomycota (6.47%), Chytridiomycota (2.89%), and Olpidiomycota (1.74%) (Figure 4D and Table S3). Only the relative abundance of unclassified fungi significantly increased (p < 0.05) in the CNa group when compared to the CK.

3.5. Relationship between Soil Properties and Microbial Communities

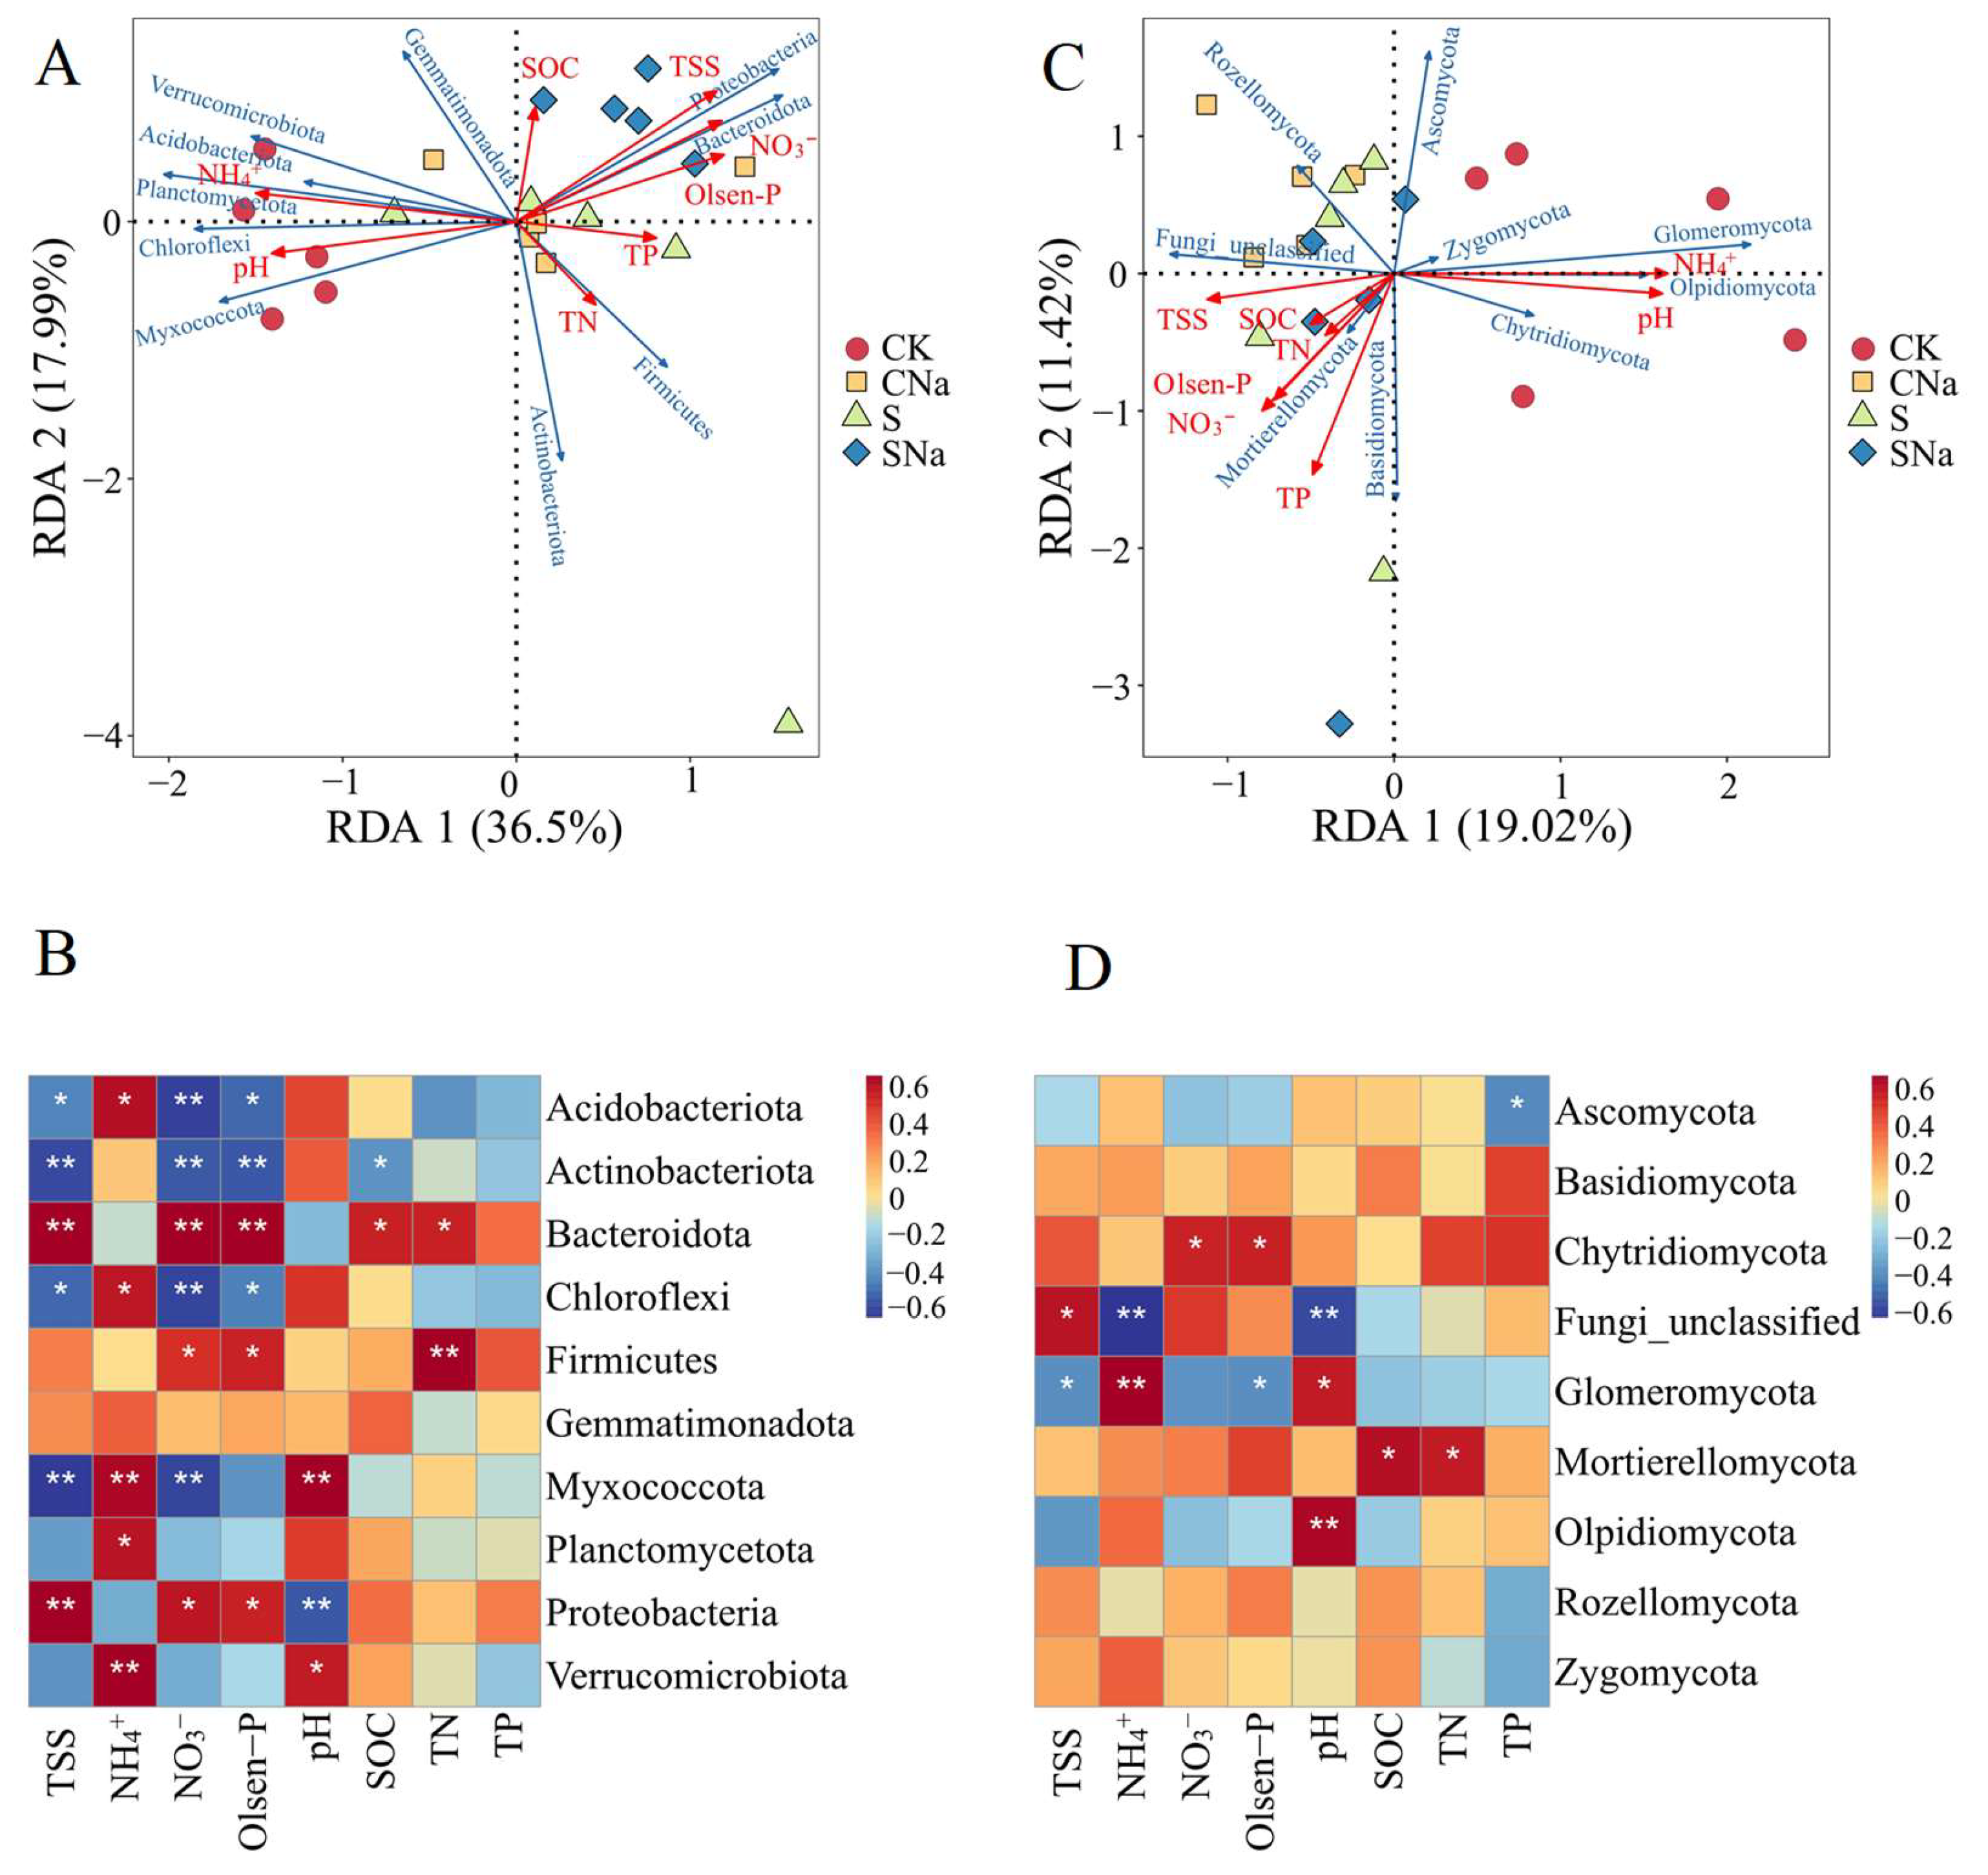
We conducted an RDA to find the potential relationships between microbial communities and soil parameters after HU2014 inoculation. The RDA coordinate axis explained 54.49% of the variance in bacterial communities and 30.44% of the variance in fungal communities. From the charts, Proteobacteria, Bacteroidota, and Acidobacteriota in bacterial taxa correlated with TSS, TN, NH4+-N, NO3-N, Olsen-P, and SOC (except for TP) (p < 0.05; Figure 5A,B). For fungi, however, only Glomeromycota and unclassified fungi significantly correlated to part of the soil parameters (p < 0.05; Figure 5C,D). These findings appear to confirm the function of HU2014 as a bioindicator under salt stress.

4. Discussion

Salinity can reduce mineral utilization and induce toxicity mediated by ions, osmotic stress, and the generation of ROS [42]. This study found that the growth of wheat seedlings was clearly inhibited by a gradual increase in NaCl concentration under the half-strength Hoagland cultivation solutions (Figure 1). However, in the following trials, we found that the supplement of HU2014 significantly enhanced the biomass of wheat seedlings in the presence of salt (Figure 2A,B). Compared to normal conditions, Streptomyces strain C-2012 inoculation positively affected the biomass of Gonbad wheat cultivars in salt conditions [43]. From the perspective of biomass alone, we could conclude that the mentioned Streptomyces spp. had the property of salt tolerance.
Microbes are enormously useful in offsetting the toxicity of soil salinity [35]. They possess growth-promoting properties that enhance plant resistance to salt stress [44,45]. Many studies have reported the salt-tolerance mechanisms of microbes assisting plants at the physiological and genetic levels. These microbes regulate the antioxidant activity of active enzymes by inducing plant defense systems. The performance of antioxidants plays a key role in plant resistance to biotic or abiotic stress [27]. Trichoderma longibrachiatum (TG1) increased SOD, POD, and CAT activities and decreased MDA content in wheat seedlings under salt stress [46]. Streptomyces griseus, as a bio-elicitor, assisted wheat to cope with salt tolerance by increasing proline and chlorophyll contents [47]. Proline contributes to osmotic regulation, and its cell structure remains stable. Our results showed that HU2014 inoculation weakened the production of strong oxides (Figure 2), which suggests that this strain can assist plants to cope with salt tolerance by eliminating ROS and reducing lipid peroxidation. Although there are few reports about the mechanism of Streptomyces on salt tolerance in wheat, we can draw some inspiration from other research on abiotic stress. For example, Streptomyces pactum Act12 affected the contents of total soluble sugar and MDA, and upregulated the expression levels of EXPA2, EXPA6, P5CS, and SnRK2 in wheat leaves under drought stress [48]. The Streptomyces isolate C-2012 increased MDA, decreased CAT activity, and modulated the expression of ERF1 and WRKY70 genes in tomato plants under stress conditions [49]. Stress-responsive and ion-transport-related gene responses were induced under abiotic conditions.
Studies using biodiversity analysis have reported that salinity in soil had an adverse effect on microbial communities [50,51]. In this study, a biodiversity investigation revealed that soil bacterial Chao 1 and Shannon and Simpson indices had significant negative correlations with the addition of NaCl, but soil fungi showed no significant changes (Figure 3). Thus, NaCl likely affected soil microbial diversity, a finding that corresponds to previous studies [50]. However, HU2014 inoculation decreased the richness of bacteria, which could be due to the generation of the active metabolites produced by it. We also found that the microorganisms from different salt zones regulated salt stress through synergistic and antagonistic interactions [52]. Further study needs to focus on the effect of active metabolites produced by HU2014 on wheat rhizospheric microorganisms.
Many Streptomyces spp. can improve soil nutritional conditions through their function of promoting plant growth [53,54]. We investigated the effects of HU2014 inoculation and the addition of NaCl on soil physicochemical properties and rhizosphere microbial communities. In the S and SNa treatments, TN, NO3-N, TP, and Olsen-P significantly increased, whereas in the CNa treatment, only NO3-N and Olsen-P increased, which indicated that HU2014 inoculation increased soil nutrients (Table S1). We know that soil parameters have correlations with rhizosphere soil microorganisms. For example, the TN and TP of soil affected the most dominant phyla, such as Firmicutes, Proteobacteria, Actinobacteria, and Bacteroidetes among halophytes [55]. TP negatively correlated with Gematimonadetes under salt conditions [56]. In this study, the dominant Proteobacteria and Bacteroidota with a total abundance of 47.89% significantly increased in the S and SNa treatments (Figure 4B and Table S2). This finding was consistent with the study reported by Shi et al. [57]. Simultaneously, RDA and heat map analysis confirmed that TSS, TN, Olsen-P, and NO3-N were positively correlated with the two above-mentioned bacterial phyla (Figure 5A,B). However, Acidobacteriota was negatively correlated with the four soil parameters. Consistent with the results above, this strain can regulate soil factors and soil microbial structures, resulting in a positive interaction between them, which is to synergistically respond to salt stress in wheat. For fungal communities, we found that the relative abundance of unclassified fungi significantly increased and had a negative correlation with NH4+-N in soil. This result suggested that the decrease in soil NH4+-N after the inoculation of HU2014 and the addition of NaCl affected the abundance of unclassified fungi. Although the abundance of other fungal phyla was not significantly different in all the HU2014 inoculation and/or NaCl addition treatments, Ascomycota was dominant (Figure 4D and Table S3). As an important driver, this phylum of fungi plays a key role in C and N cycling [58]. The fungal taxa Ascomycota and unclassified fungi are the main contributors to microbial restructuring mediated by HU2014 inoculation and NaCl addition. In summary, we explored the relationship between wheat growth, the microbial communities in wheat rhizosphere, and HU2014 under salt stress.

5. Conclusions

Wheat growth was affected by salt stress, and the attempt to enhance plant resistance to salinity was conducted with the application of the beneficial microbe Streptomyces sp. HU2014. In this study, we firstly explored the salt-tolerance mechanism between this strain, wheat, and the rhizosphere microbe under saline stress. We found that HU2014 inoculation promoted wheat growth by inducing defensive resistance in the wheat and improving the levels of TN, TP, Olsen-P, and NO3-N in soil with added salt. The analysis of soil biodiversity suggested that TN, TSS, Olsen-P, and NO3-N significantly affected the bacterial taxa (Proteobacteria, Acidobacteriota, and Bacteroidota). As a result, these bacterial taxa collaborated with HU2014 by assisting wheat to utilize soil nutrients under salt stress. Future studies will aim to determine the molecular mechanisms through which HU2014 assists in wheat tolerance to salt stress and the promotion of plant growth. In summary, this research into the HU2014 strain contributed to an increase in crop yield and promoted the sustainable development of agriculture.

Supplementary Materials

The following supporting information can be downloaded at https://www.mdpi.com/article/10.3390/agronomy14010039/s1. Figure S1. Difference in bacterial, fungal alpha diversity (Simpson analysis) among the treatments. (The data are presented as the mean ± SD of three independent replicates. CK, CNa, S, and SNa represent control check soil, additive NaCl soil, HU2014 soil, and inoculating HU2014 soil with the addition of NaCl, respectively.) Asterisk indicates significant differences (p < 0.05) between treatments. Figure S2. Principal component analysis of the Bray-Curtis distance for soil bacterial and fungal communities. CK, CNa, S, and SNa represent control check soil, additive NaCl soil, HU2014 soil, and inoculating HU2014 soil with the addition of NaCl, respectively. Table S1. The results of showing the effects of additive NaCl, inoculation, and their interactions on soil properties. Table S2. The effects of HU2014 inoculation and NaCl addition on relative abundances of bacterial taxa of top 10 (phylum level). Table S3. The effects of HU2014 inoculation and NaCl addition on relative abundances of fungal taxa of top 6 (phylum level).

Author Contributions

Conception and design, C.L.; conducting the experiments and writing the manuscript, H.Z.; experimental guidance and revising the manuscript, L.H.; supervision and guidance, T.R. All authors have read and agreed to the published version of the manuscript.

Funding

The work was supported by the Henan Provincial Science and Technology Research Project, China (Grant Number 232102111015).

Data Availability Statement

Publicly available datasets were analyzed in this study. These data can be found in the NCBI database under accession numbers PRJNA871079 and PRJNA870704.

Conflicts of Interest

The authors declare no conflict of interest.

References

  1. Wu, H.F.; Liu, X.L.; You, L.P.; Zhang, L.B.; Zhou, D.; Feng, J.H.; Zhao, J.M.; Yu, J.B. Effects of salinity on metabolic profiles, gene expressions, and antioxidant enzymes in halophyte. J. Plant Growth Regul. 2012, 31, 332–341. [Google Scholar] [CrossRef]
  2. Shabala, S. Learning from halophytes: Physiological basis and strategies to improve abiotic stress tolerance in crops. Ann. Bot. 2013, 112, 1209–1221. [Google Scholar] [CrossRef] [PubMed]
  3. Li, J.G.; Pu, L.J.; Han, M.F.; Zhu, M.; Zhang, R.S.; Xiang, Y.Z. Soil salinization research in China: Advances and prospects. J. Geogr. Sci. 2014, 24, 943–960. [Google Scholar] [CrossRef]
  4. Sairam, R.K.; Rao, K.V.; Srivastava, G.C. Differential response of wheat genotypes to long term salinity stress in relation to oxidative stress, antioxidant activity and osmolyte concentration. Plant Sci. 2002, 163, 1037–1046. [Google Scholar] [CrossRef]
  5. Hou, Y.L.; Zeng, W.Z.; Hou, M.L.; Wang, Z.; Luo, Y.; Lei, G.Q.; Zhou, B.; Huang, J.S. Responses of the soil microbial community to salinity stress in maize fields. Biology 2021, 10, 1114. [Google Scholar] [CrossRef]
  6. Wang, L.; Seki, K.; Miyazaki, T.; Ishihama, Y. The causes of soil alkalinization in the Songnen Plain of Northeast China. Paddy Water Environ. 2009, 7, 259–270. [Google Scholar] [CrossRef]
  7. Hanin, M.; Ebel, C.; Ngom, M.; Laplaze, L.; Masmoudi, K. New insights on plant salt tolerance mechanisms and their potential use for breeding. Front. Plant Sci. 2016, 7, 1787. [Google Scholar] [CrossRef]
  8. Song, Y.S.; Yang, W.J.; Fan, H.; Zhang, X.S.; Sui, N. TaMYB86B encodes a R2R3-type MYB transcription factor and enhances salt tolerance in wheat. Plant Sci. 2020, 300, 110624. [Google Scholar] [CrossRef]
  9. Anwar, A.; Zhang, S.; He, L.L.; Gao, J.W. Understanding the physiological and molecular mechanism of salinity stress tolerance in plants. Not. Bot. Horti. Agrobo. 2022, 50, 12595. [Google Scholar] [CrossRef]
  10. Wang, J.; Zhang, Y.X.; Yan, X.R.; Guo, J.P. Physiological and transcriptomic analyses of yellow horn (Xanthoceras sorbifolia) provide important insights into salt and saline-alkali stress tolerance. PLoS ONE 2020, 15, e0244365. [Google Scholar] [CrossRef]
  11. Guo, M.; Wang, X.S.; Guo, H.D.; Bai, S.Y.; Khan, A.; Wang, X.M.; Gao, Y.M.; Li, J.S. Tomato salt tolerance mechanisms and their potential applications for fighting salinity: A review. Front. Plant Sci. 2022, 13, 949541. [Google Scholar] [CrossRef] [PubMed]
  12. Tavakkoli, E.; Fatehi, F.; Coventry, S.; Rengasamy, P.; McDonald, G.K. Additive effects of Na+ and Cl ions on barley growth under salinity stress. J. Exp. Bot. 2011, 62, 2189–2203. [Google Scholar] [CrossRef] [PubMed]
  13. Reginato, M.A.; Castagna, A.; Furlán, A.; Castro, S.; Ranieri, A.; Luna, V. Physiological responses of a halophytic shrub to salt stress by Na2SO4 and NaCl: Oxidative damage and the role of polyphenols in antioxidant protection. AoB Plants 2014, 6, plu042. [Google Scholar] [CrossRef] [PubMed]
  14. Ferreira-Silva, S.L.; Voigt, E.L.; Silva, E.N.; Maia, J.M.; Aragao, T.C.R.; Silveira, J.A.G. Partial oxidative protection by enzymatic and non-enzymatic components in cashew leaves under high salinity. Biol. Plant. 2012, 56, 172–176. [Google Scholar] [CrossRef]
  15. Sorkheh, K.; Shiran, B.; Rouhi, V.; Khodambashi, M.; Sofo, A. Salt stress induction of some key antioxidant enzymes and metabolites in eight Iranian wild almond species. Acta Physiol. Plant. 2012, 34, 203–213. [Google Scholar] [CrossRef]
  16. Dien, D.C.; Mochizuki, T.; Yamakawa, T. Effect of various drought stresses and subsequent recovery on proline, total soluble sugar and starch metabolisms in rice (Oryza sativa L.) varieties. Plant Prod. Sci. 2019, 22, 530–545. [Google Scholar] [CrossRef]
  17. Moghaddam, M.; Farhadi, N.; Panjtandoust, M.; Ghanati, F. Seed germination, antioxidant enzymes activity and proline content in medicinal plant Tagetes minuta under salinity stress. Plant Biosyst. 2020, 154, 835–842. [Google Scholar] [CrossRef]
  18. Fang, S.M.; Hou, X.; Liang, X.L. Response mechanisms of plants under saline-alkali stress. Front. Plant Sci. 2021, 12, 667458. [Google Scholar] [CrossRef]
  19. Omae, N.; Tsuda, K. Plant-microbiota interactions in abiotic stress environments. Mol. Plant Microbe Interact. 2022, 35, 511–526. [Google Scholar] [CrossRef]
  20. Meena, K.K.; Sorty, A.M.; Bitla, U.M.; Choudhary, K.; Gupta, P.; Pareek, A.; Singh, D.P.; Prabha, R.; Sahu, P.K.; Gupta, V.K.; et al. Abiotic stress responses and microbe-mediated mitigation in plants: The omics strategies. Front. Plant Sci. 2017, 8, 172. [Google Scholar] [CrossRef]
  21. Zhang, Y.Q.; Yang, F.; Ren, H.J.; Liu, J.L.; Mu, W.Y.; Wang, Y. Pseudomonas monteilii PN1: A great potential P-nitrophenol degrader with plant growth promoting traits under drought and saline-alkali stresses. Biotechnol. Lett. 2019, 41, 801–811. [Google Scholar] [CrossRef] [PubMed]
  22. Yang, Y.J.; Liu, L.; Singh, R.P.; Meng, C.; Ma, S.Q.; Jing, C.L.; Li, Y.Q.; Zhang, C.S. Nodule and root zone microbiota of salt-tolerant wild soybean in coastal sand and saline-alkali soil. Front. Microbiol. 2020, 11, 523142. [Google Scholar] [CrossRef] [PubMed]
  23. Zhou, Y.Y.; Hao, L.P.; Ji, C.; Zhou, Q.S.; Song, X.; Liu, Y.; Li, H.Y.; Li, C.H.; Gao, Q.X.; Li, J.T.; et al. The effect of salt-tolerant antagonistic bacteria CZ-6 on the rhizosphere microbial community of winter jujube (Ziziphus jujuba Mill. “Dongzao”) in saline-alkali land. Biomed Res. Int. 2021, 2021, 5171086. [Google Scholar]
  24. Pang, F.; Solanki, M.K.; Wang, Z. Streptomyces can be an excellent plant growth manager. World J. Microbiol. Biotechnol. 2022, 38, 193. [Google Scholar] [CrossRef] [PubMed]
  25. Azeem, M.A.; Shah, F.H.; Ullah, A.; Ali, K.; Jones, D.A.; Khan, M.E.H.; Ashraf, A. Biochemical Characterization of Halotolerant Bacillus safensis PM22 and Its Potential to Enhance Growth of Maize under Salinity Stress. Plants 2022, 11, 1721. [Google Scholar] [CrossRef] [PubMed]
  26. Sadeghi, A.; Karimi, E.; Dahaji, P.A.; Javid, M.G.; Dalvand, Y.; Askari, H. Plant growth promoting activity of an auxin and siderophore producing isolate of Streptomyces under saline soil conditions. World J. Microbiol. Biotechnol. 2012, 28, 1503–1509. [Google Scholar] [CrossRef] [PubMed]
  27. Afridi, M.S.; Mahmoode, T.; Salam, A.; Mukhtar, T.; Mehmood, S.; Ali, J.; Khatoon, Z.; Bibi, M.; Javed, T.; Sultan, T.; et al. Induction of tolerance to salinity in wheat genotypes by plant growth promoting endophytes: Involvement of ACC deaminase and antioxidant enzymes. Plant Physiol. Biochem. 2019, 139, 569–577. [Google Scholar] [CrossRef]
  28. Delgado-Baquerizo, M.; Reich, P.B.; Trivedi, C.; Eldridge, D.J.; Abades, S.; Alfaro, F.D.; Bastida, F.; Berhe, A.A.; Cutler, N.A.; Gallardo, A.; et al. Multiple elements of soil biodiversity drive ecosystem functions across biomes. Nat. Ecol. Evol. 2020, 4, 210–220. [Google Scholar] [CrossRef]
  29. Berg, G.; Rybakova, D.; Fischer, D.; Cernava, T.; Vergès, M.C.C.; Charles, T.; Chen, X.Y.L.; Cocolin, L.; Eversole, K.; Corral, G.H.; et al. Microbiome definition re-visited: Old concepts and new challenges. Microbiome 2020, 8, 103. [Google Scholar]
  30. Kumawat, K.C.; Nagpal, S.; Sharma, P. Potential of plant growth-promoting rhizobacteria-plant interactions in mitigating salt stress for sustainable agriculture: A review. Pedosphere 2022, 32, 223–245. [Google Scholar] [CrossRef]
  31. Zhu, H.-X.; Hu, L.-F.; Hu, H.-Y.; Zhou, F.; Wu, L.-L.; Wang, S.-W.; Rozhkova, T.; Li, C.-W. Identification of a novel Streptomyces sp. Strain HU2014 showing growth promotion and biocontrol effect against Rhizoctonia spp. in wheat. Plant Dis. 2023, 107, 1139–1150. [Google Scholar] [CrossRef] [PubMed]
  32. Zhang, S.W.; Gan, Y.T.; Xu, B.L. Mechanisms of the IAA and ACC-deaminase producing strain of Trichoderma longibrachiatum T6 in enhancing wheat seedling tolerance to NaCl stress. BMC Plant Biol. 2019, 19, 18. [Google Scholar] [CrossRef] [PubMed]
  33. Cao, W.-H.; Liu, J.; He, X.-J.; Mu, R.-L.; Zhou, H.-L.; Chen, S.-Y.; Zhang, J.-S. Modulation of ethylene responses affects plant salt-stress responses. Plant Physiol. 2007, 143, 707–719. [Google Scholar] [CrossRef] [PubMed]
  34. Zhang, L.C.; Zhao, G.Y.; Xia, C.; Jia, J.Z.; Liu, X.; Kong, X.Y. Overexpression of a wheat MYB transcription factor gene, TaMYB56-B, enhances tolerances to freezing and salt stresses in transgenic Arabidopsis. Gene 2012, 505, 100–107. [Google Scholar] [CrossRef]
  35. Yang, L.Y.; Zhou, S.Y.D.; Lin, C.S.; Huang, X.R.; Neilson, R.; Yang, X.R. Effects of biofertilizer on soil microbial diversity and antibiotic resistance genes. Sci. Total Environ. 2022, 820, 153170. [Google Scholar] [CrossRef] [PubMed]
  36. Fang, L.C.; Wang, M.K.; Cai, L.; Cang, L. Deciphering biodegradable chelant-enhanced phytoremediation through microbes and nitrogen transformation in contaminated soils. Environ. Sci. Pollut. Res. 2017, 24, 14627–14636. [Google Scholar] [CrossRef] [PubMed]
  37. Lu, R.K. Methods for Agricultural Chemical Analysis of Soil; China Agricultural Science and Technology Press: Beijing, China, 2000; pp. 50–95. ISBN 7-80119-925-1. [Google Scholar]
  38. Karlsson, I.; Friberg, H.; Steinberg, C.; Persson, P. Fungicide effects on fungal community composition in the wheat phyllosphere. PLoS ONE 2014, 9, e111786. [Google Scholar] [CrossRef]
  39. Logue, J.B.; Stedmon, C.A.; Kellerman, A.M.; Nielsen, N.J.; Andersson, A.F.; Laudon, H.; Lindström, E.S.; Kritzberg, E.S. Experimental insights into the importance of aquatic bacterial community composition to the degradation of dissolved organic matter. Isme J. 2016, 10, 533–545. [Google Scholar] [CrossRef]
  40. McMurdie, P.J.; Holmes, S. Phyloseq: An R package for reproducible interactive analysis and graphics of microbiome census data. PLoS ONE 2013, 8, e61217. [Google Scholar] [CrossRef]
  41. Oksanen, J.; Blanchet, F.; Kindt, R.; Legendre, P.; Wagner, H. Vegan: Community Ecology Package, R Package Version 2.3-5; R Foundation: Vienna, Austria, 2016. [Google Scholar]
  42. Salwan, R.; Sharma, A.; Sharma, V. Microbes mediated plant stress tolerance in saline agricultural ecosystem. Plant Soil 2019, 442, 1–22. [Google Scholar] [CrossRef]
  43. Akbari, A.; Gharanjik, S.; Koobaz, P.; Sadeghi, A. Plant growth promoting Streptomyces strains are selectively interacting with the wheat cultivars especially in saline conditions. Heliyon 2020, 6, e03445. [Google Scholar] [CrossRef] [PubMed]
  44. Choudhary, M.; Chandra, P.; Dixit, B.; Nehra, V.; Choudhary, U.; Choudhary, S. Plant growth-promoting microbes: Role and prospective in amelioration of salt stress. Commun. Soil Sci. Plant Anal. 2022, 53, 1692–1711. [Google Scholar] [CrossRef]
  45. Liu, H.Q.; Lu, X.B.; Li, Z.H.; Tian, C.Y.; Song, J. The role of root-associated microbes in growth stimulation of plants under saline conditions. Land Degrad. Dev. 2021, 32, 3471–3486. [Google Scholar] [CrossRef]
  46. Boamah, S.; Zhang, S.W.; Xu, B.L.; Li, T.; Calderón-Urrea, A. Trichoderma longibrachiatum (TG1) enhances wheat seedlings tolerance to salt stress and resistance to Fusarium pseudograminearum. Front. Plant Sci. 2021, 12, 741231. [Google Scholar] [CrossRef] [PubMed]
  47. Wafaa, M.H.; Tawfik, M.M.; Abouziena, H.F.; Abd El Wahed, M.S.; Ali, R.R. Enhancing wheat production under arid climate stresses using bio-elicitors. Gesunde Pflanz. 2017, 69, 149–158. [Google Scholar] [CrossRef]
  48. Li, H.Y.; Guo, Q.; Jing, Y.X.; Liu, Z.; Zheng, Z.H.; Sun, Y.F.; Xue, Q.H.; Lai, H.X. Application of Streptomyces pactum Act12 enhances drought resistance in wheat. J. Plant Growth Regul. 2020, 39, 122–132. [Google Scholar] [CrossRef]
  49. Abbasi, S.; Sadeghi, A.; Safaie, N. Streptomyces alleviate drought stress in tomato plants and modulate the expression of transcription factors ERF1 and WRKY70 genes. Sci. Hortic. 2020, 265, 109206. [Google Scholar] [CrossRef]
  50. Bharti, N.; Barnawal, D.; Maji, D.; Kalra, A. Halotolerant PGPRs prevent major shifts in indigenous microbial community structure under salinity stress. Microb. Ecol. 2015, 70, 196–208. [Google Scholar] [CrossRef]
  51. Liang, X.L.; Wang, X.Y.; Zhang, N.; Li, B.X. Biogeographical patterns and assembly of bacterial communities in saline soils of Northeast China. Microorganisms 2022, 10, 1787. [Google Scholar] [CrossRef]
  52. Luo, J.Q.; Zhang, Z.C.; Hou, Y.Z.; Diao, F.W.; Hao, B.H.; Bao, Z.H.; Wang, L.X.; Guo, W. Exploring microbial resource of different rhizocompartments of dominant plants along the salinity gradient around the hypersaline lake Ejinur. Front. Microbiol. 2021, 12, 698479. [Google Scholar] [CrossRef]
  53. Barnawal, D.; Bharti, N.; Pandey, S.S.; Pandey, A.; Chanotiya, C.S.; Kalra, A. Plant growth-promoting rhizobacteria enhance wheat salt and drought stress tolerance by altering endogenous phytohormone levels and TaCTR1/TaDREB2 expression. Physiol. Plant. 2017, 161, 502–514. [Google Scholar] [CrossRef] [PubMed]
  54. Ren, H.; Lv, C.Q.; Fernández-García, V.; Huang, B.L.; Yao, J.M.; Ding, W. Biochar and PGPR amendments influence soil enzyme activities and nutrient concentrations in a eucalyptus seedling plantation. Biomass Convers. Biorefinery 2021, 11, 1865–1874. [Google Scholar] [CrossRef]
  55. Li, M.Y.; Wang, J.L.; Yao, T.; Zhang, T.; Zhou, Q.; Mutallip, M. Bacterial diversity and community structure in the rhizosphere of four halophytes. Curr. Microbiol. 2021, 78, 2720–2732. [Google Scholar] [CrossRef] [PubMed]
  56. Soothar, M.K.; Hamani, A.K.M.; Sardar, M.F.; Sootahar, M.K.; Fu, Y.Y.; Rahim, R.; Soothar, J.K.; Bhatti, S.M.; Abubakar, S.A.; Gao, Y.; et al. Maize (Zea mays L.) seedlings rhizosphere microbial community as responded to acidic biochar amendment under saline conditions. Front. Microbiol. 2021, 12, 789235. [Google Scholar] [CrossRef]
  57. Shi, X.L.; Zhao, X.H.; Ren, J.Y.; Dong, J.L.; Zhang, H.; Dong, Q.Q.; Jiang, C.J.; Zhong, C.; Zhou, Y.F.; Yu, H.Q. Influence of peanut, sorghum, and soil salinity on microbial community composition in interspecific interaction zone. Front. Microbiol. 2021, 12, 678250. [Google Scholar] [CrossRef]
  58. Green, L.E.; Porras-Alfaro, A.; Sinsabaugh, R.L. Translocation of nitrogen and carbon integrates biotic crust and grass production in desert grassland. J. Ecol. 2008, 96, 1076–1085. [Google Scholar] [CrossRef]
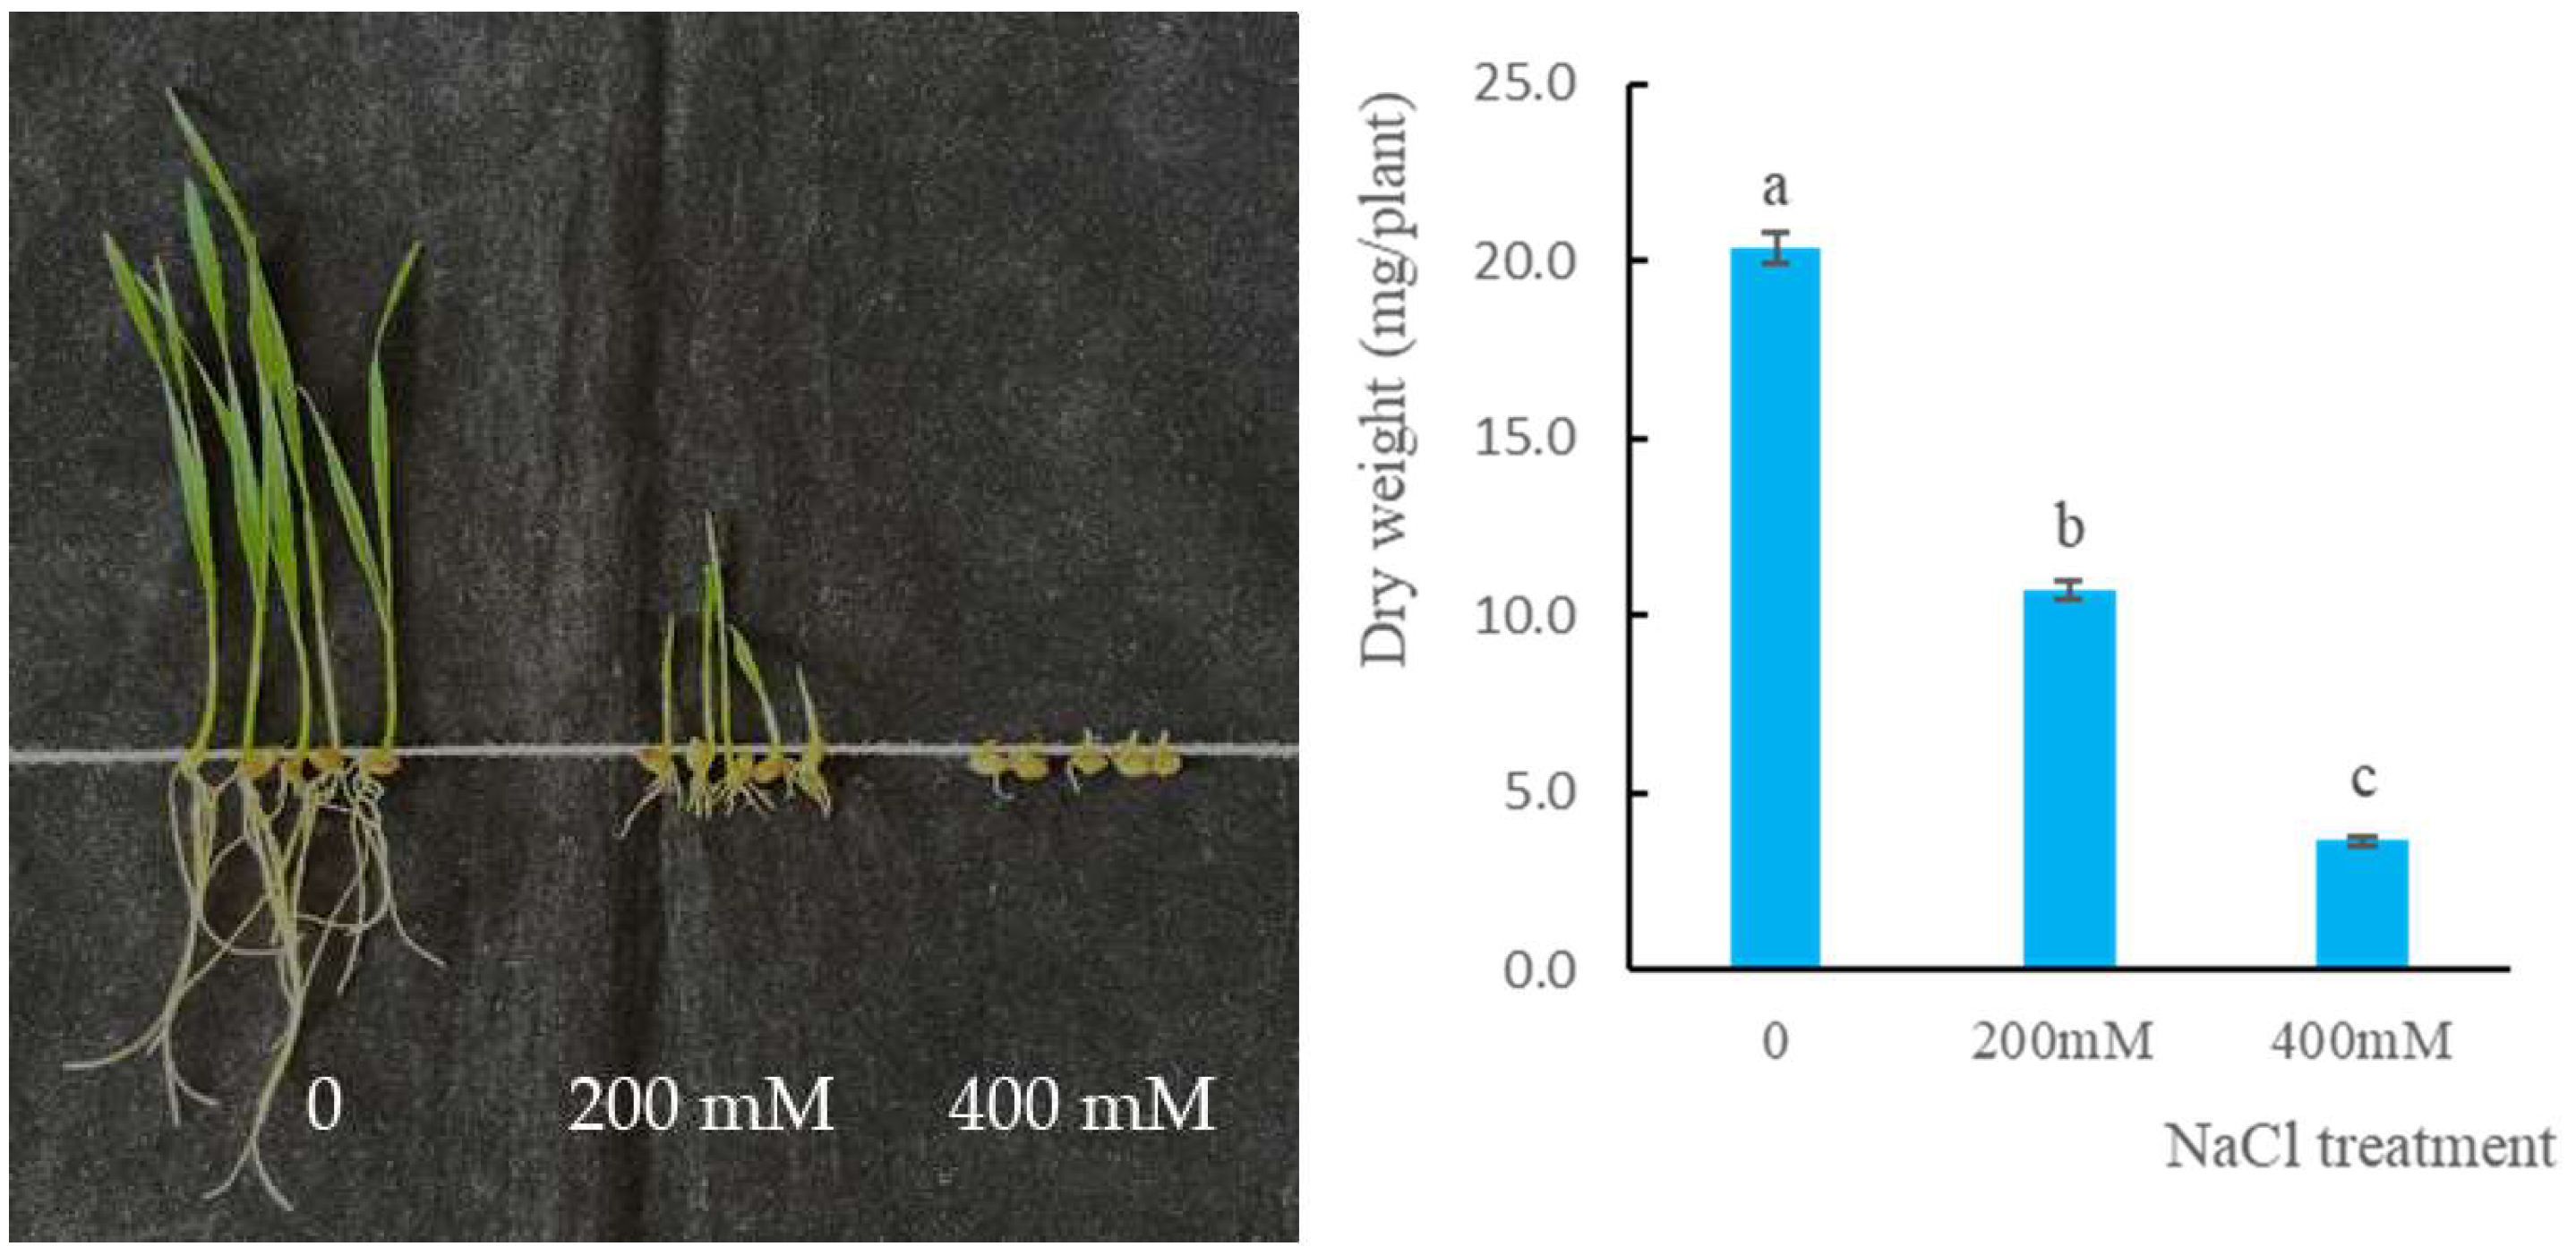
Figure 1. Wheat growth and dry weight under different concentrations of NaCl. The data are presented as the mean ± SD of three independent replicates. Lowercase letters indicate significance (p < 0.05) among different treatments.
Agronomy 14 00039 g001
Figure 2. Wheat physicochemical properties (AH). CK, CNa, S, and SNa represent control soil, NaCl soil, HU2014 soil, and inoculated HU2014 soil with the addition of NaCl, respectively. CAT represents catalase. POD represents peroxidase. MDA represents malondialdehyde. The data are presented as the mean ± SD of three independent replicates. Lowercase letters indicate significance (p < 0.05) among different treatments.
Agronomy 14 00039 g002
Figure 3. Difference in bacterial (A,B) and fungal (C,D) alpha diversity among the treatments. (The data are presented as the mean ± SD of three independent replicates. CK, CNa, S, and SNa represent control soil, NaCl soil, HU2014 soil, and inoculated HU2014 soil with the addition of NaCl, respectively.) Asterisks indicate significant differences (p < 0.05) between treatments.
Agronomy 14 00039 g003
Figure 4. Non-metric multidimensional scaling ordination plots derived from the Bray–Curtis distance matrix (A,C) and relative abundance of the dominant bacterial (B) and fungal (D) taxa in different treatments. CK, CNa, S, and SNa represent control soil, NaCl soil, HU2014 soil, and inoculated HU2014 soil with the addition of NaCl, respectively. The configuration stresses were bacteria 0.05 and fungi 0.15. Samples are clustered together by different treatments.
Agronomy 14 00039 g004
Figure 5. Redundancy analysis (A,C) and correlation heat map of microbial taxa with soil properties (B,D). TSS: total soluble salt; NH4+: NH4+-N content; NO3: NO3-N content; Olsen-P: Olsen-P content; SOC: soil organic carbon content; TN: total nitrogen content; and TP: total phosphorus content. * Correlation is significant at p < 0.05 (two tailed); ** Correlation is significant at p < 0.01 (two tailed).
Agronomy 14 00039 g005
Disclaimer/Publisher’s Note: The statements, opinions and data contained in all publications are solely those of the individual author(s) and contributor(s) and not of MDPI and/or the editor(s). MDPI and/or the editor(s) disclaim responsibility for any injury to people or property resulting from any ideas, methods, instructions or products referred to in the content.