
Establishment of the Interaction Simulation Model between Plug Seedlings and Soil


Abstract
:1. Introduction
2. Materials and Methods
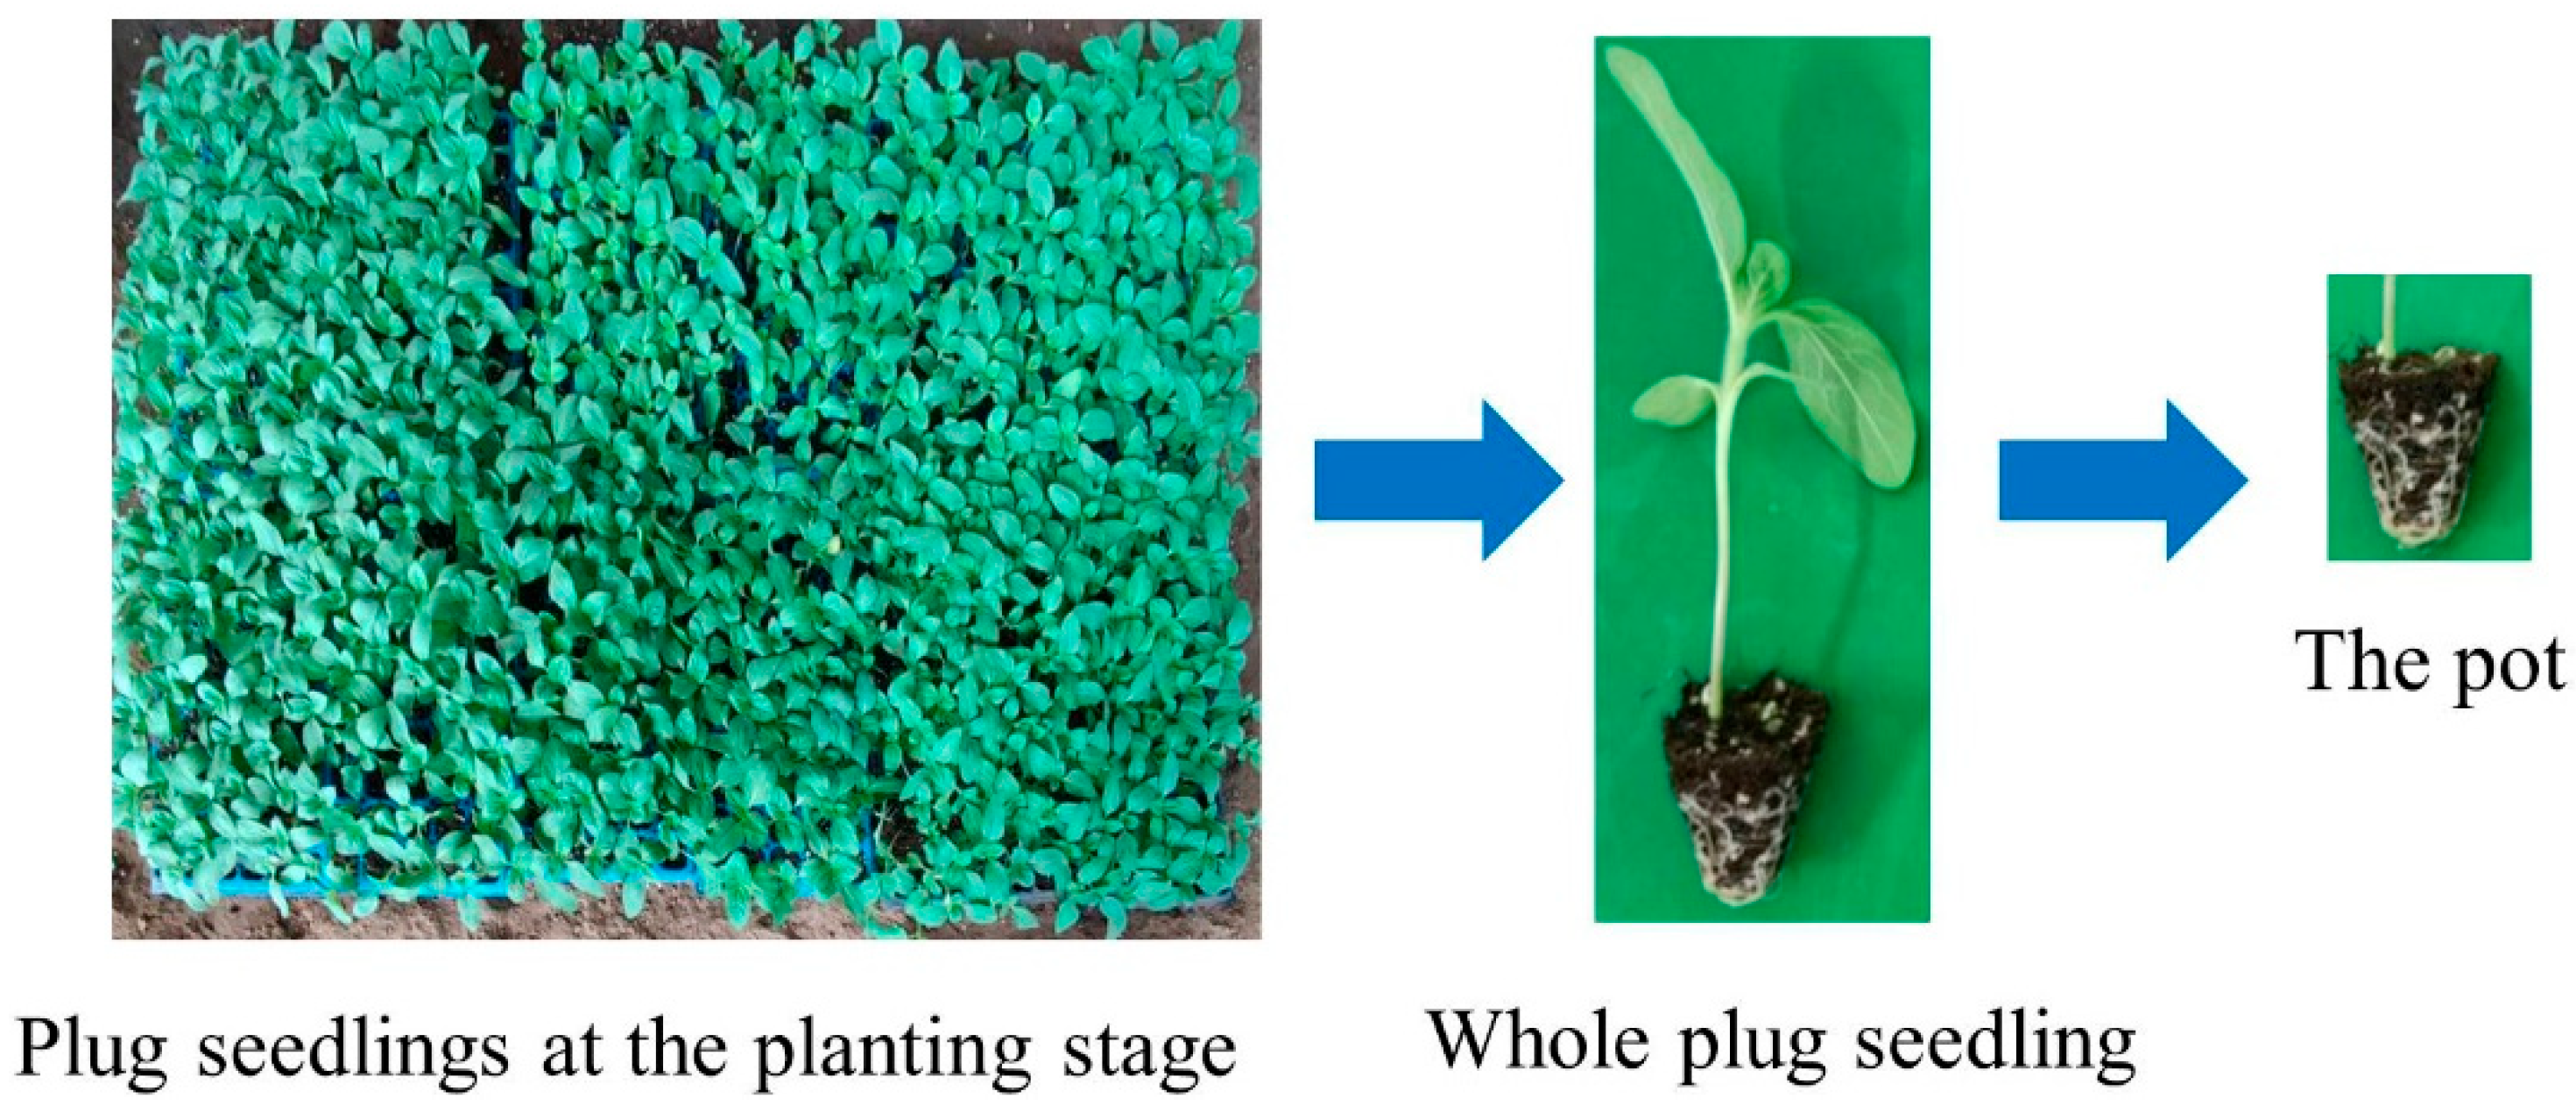
2.1. Test Material
2.2. Free-Drop Impact Test
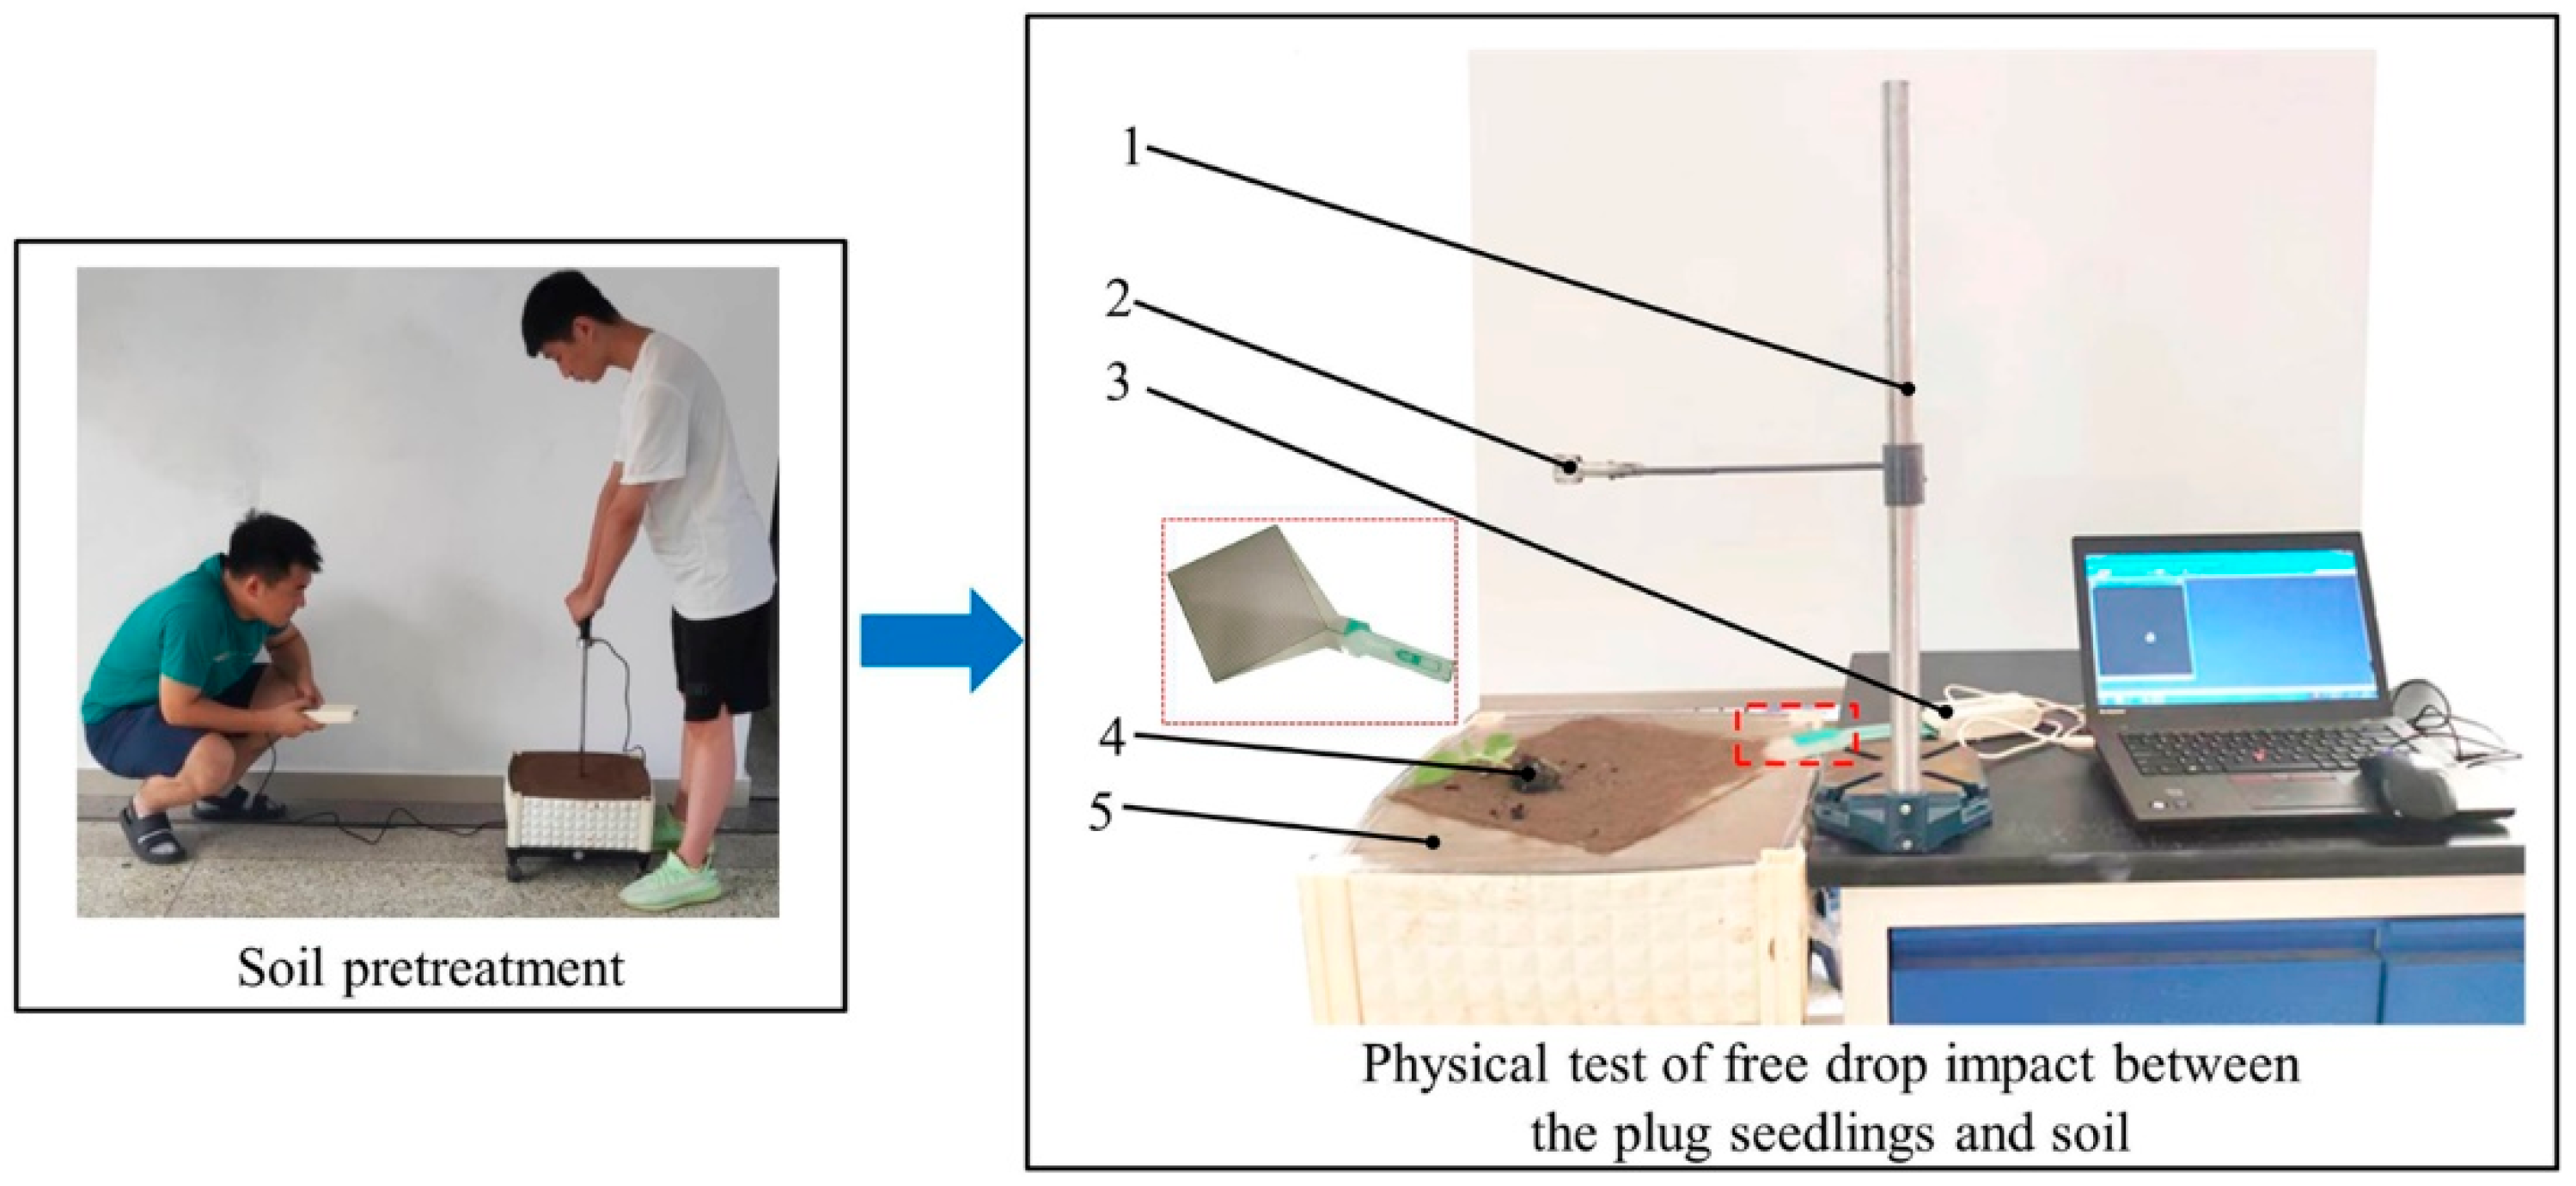
2.2.1. Physical Test of the Free-Drop Impact
2.2.2. Pot Damage Measurement Method
2.3. Determination of the Contact Parameters of the Pot
2.3.1. Determination of the Restitution Coefficient
2.3.2. Static Friction Coefficient Test
2.4. Determination of the Contact Model
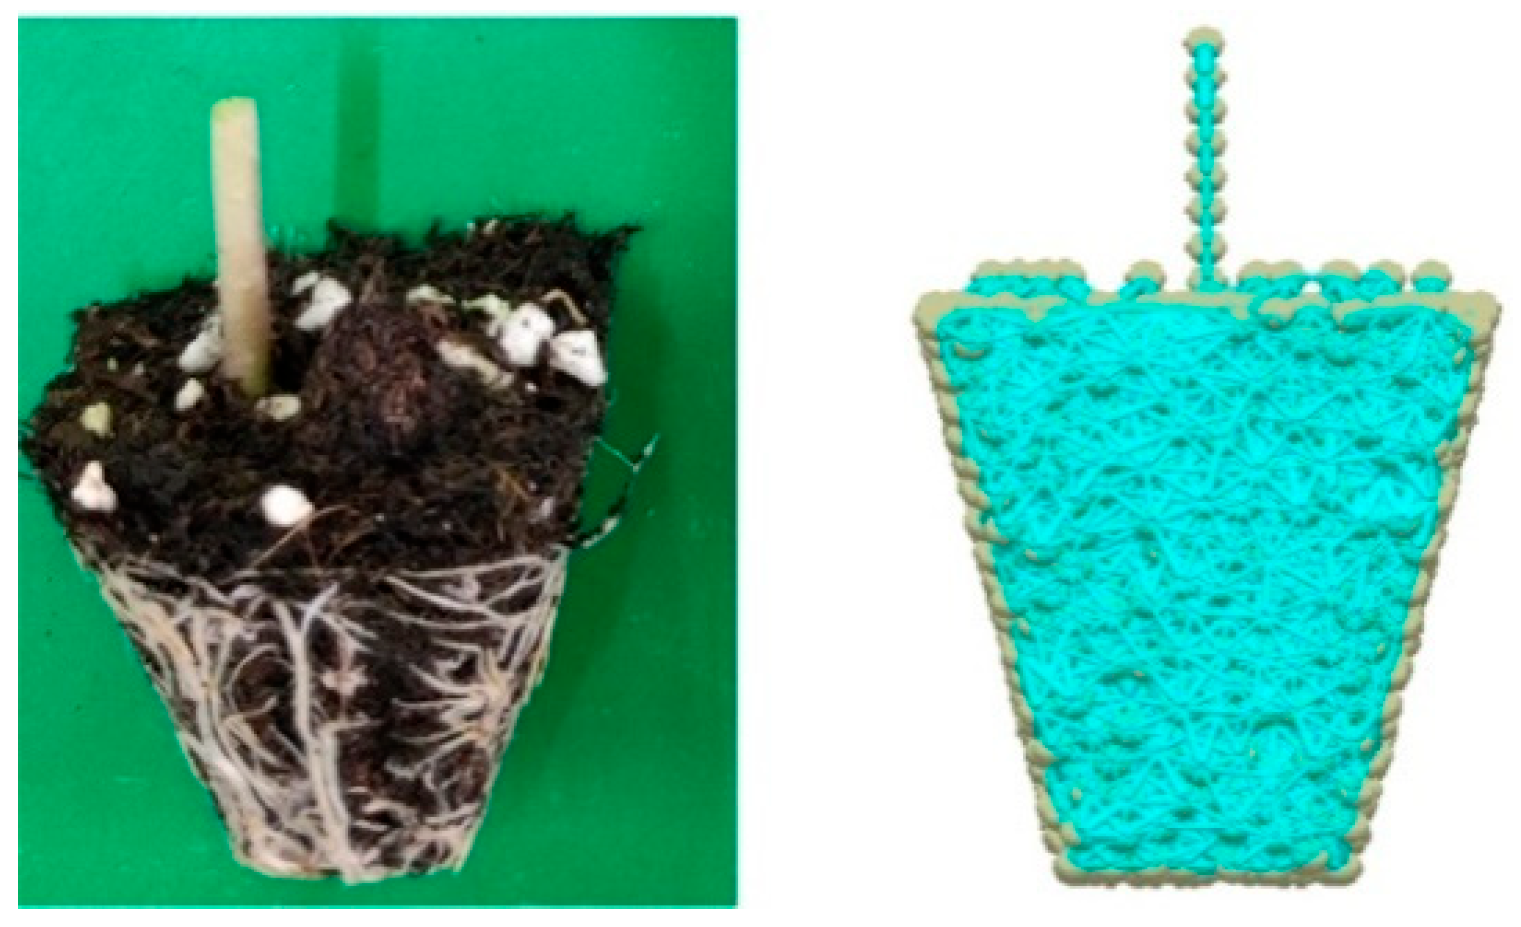
2.5. Establishment of the Drop Impact Model between the Pot and the Soil
2.6. Simulation Test Design of the Pot–Soil Parameter Calibration
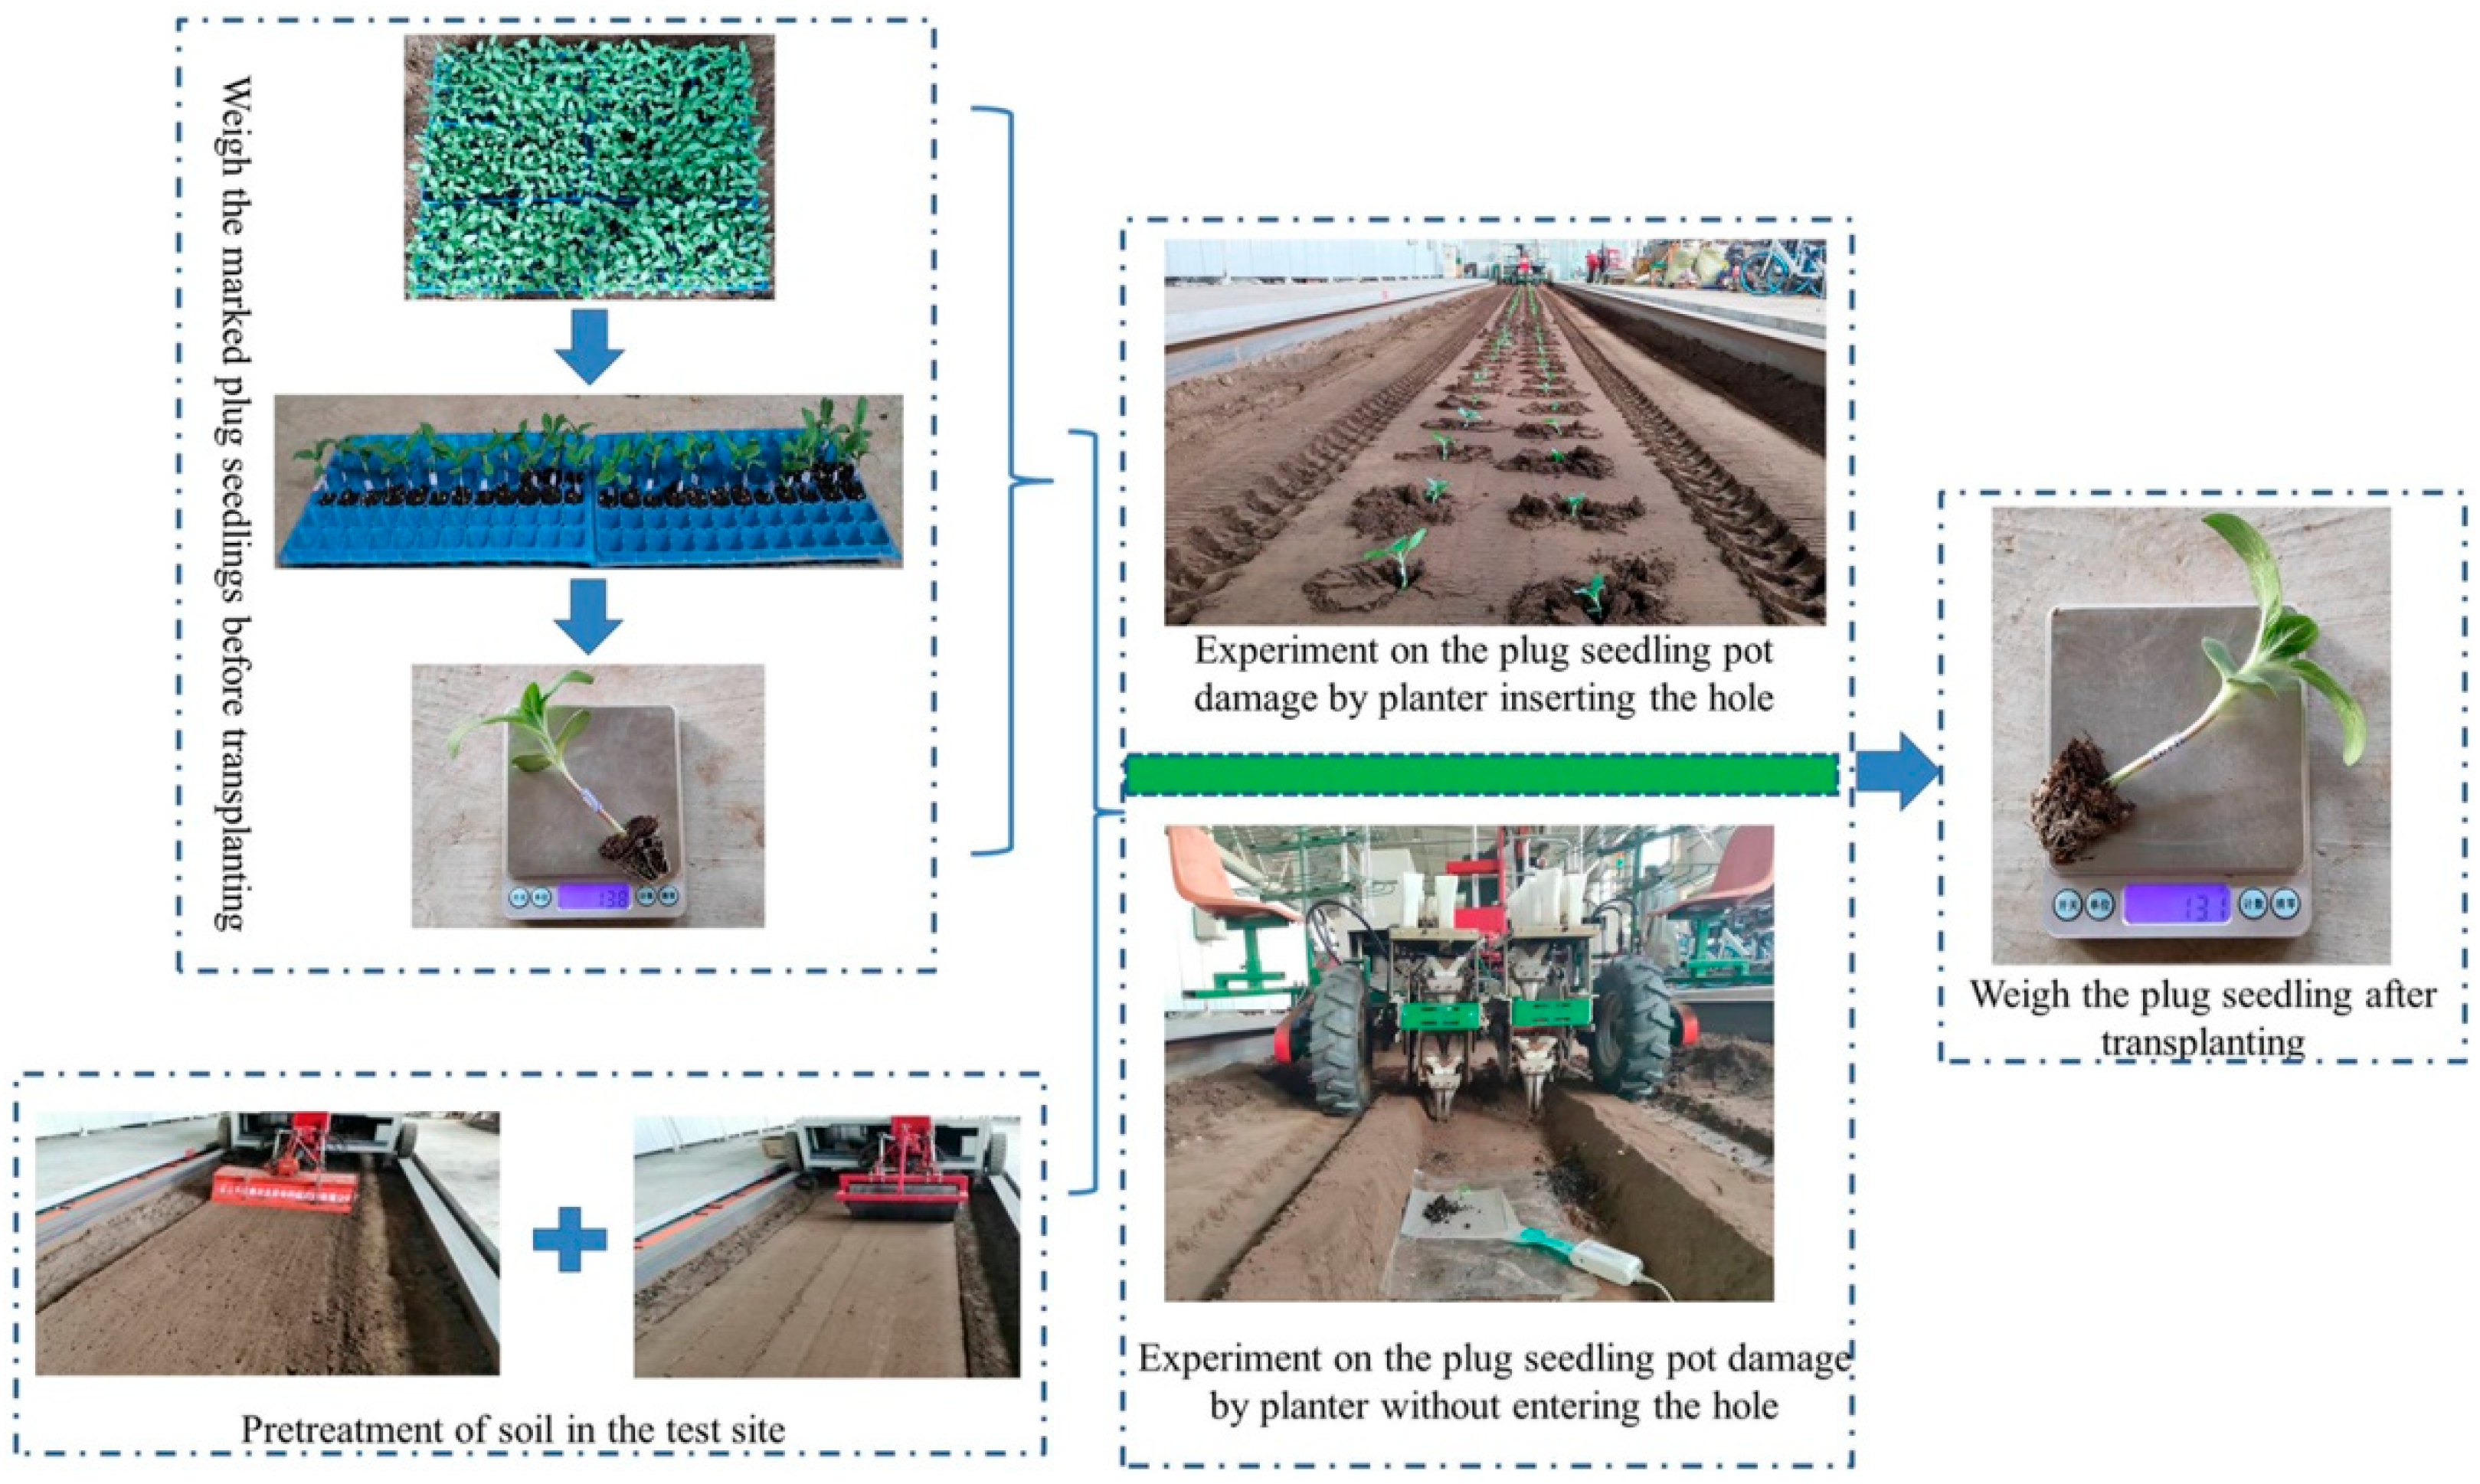
2.7. Comparative Analysis of the Pot Damage during the Transplanting Process
3. Results and Analysis
3.1. Result and Analysis of the Contact Stress Distribution
3.2. Simulation Parameter Regression Model Establishment and Variance Analysis
3.3. Parameter Optimization and Test Verification
3.4. Analysis of the Movement Process of the Plug Seedlings
3.5. Experimental Study on the Pot Damage during Transplantation
4. Conclusions
- (1)
- The simulation parameters of the pot and soil were calibrated based on the pressure distribution measurement technology. With the actual collision impact force and matrix loss rate as the target, a four-factor, three-level orthogonal test was designed to obtain the optimal parameters. Through the optimization analysis of the experimental results, it could be concluded that the pot–soil restitution coefficient, the pot–soil static friction coefficient, the pot–soil rolling friction coefficient, and the surface energy were 0.31, 0.88, 0.35, and 1.07 J/m2, respectively. The experimental verification of the optimal parameter combination showed that the relative error of the collision impact force was 1.65% and that the relative error of the matrix loss rate was 2.32%, which verified the model’s reliability.
- (2)
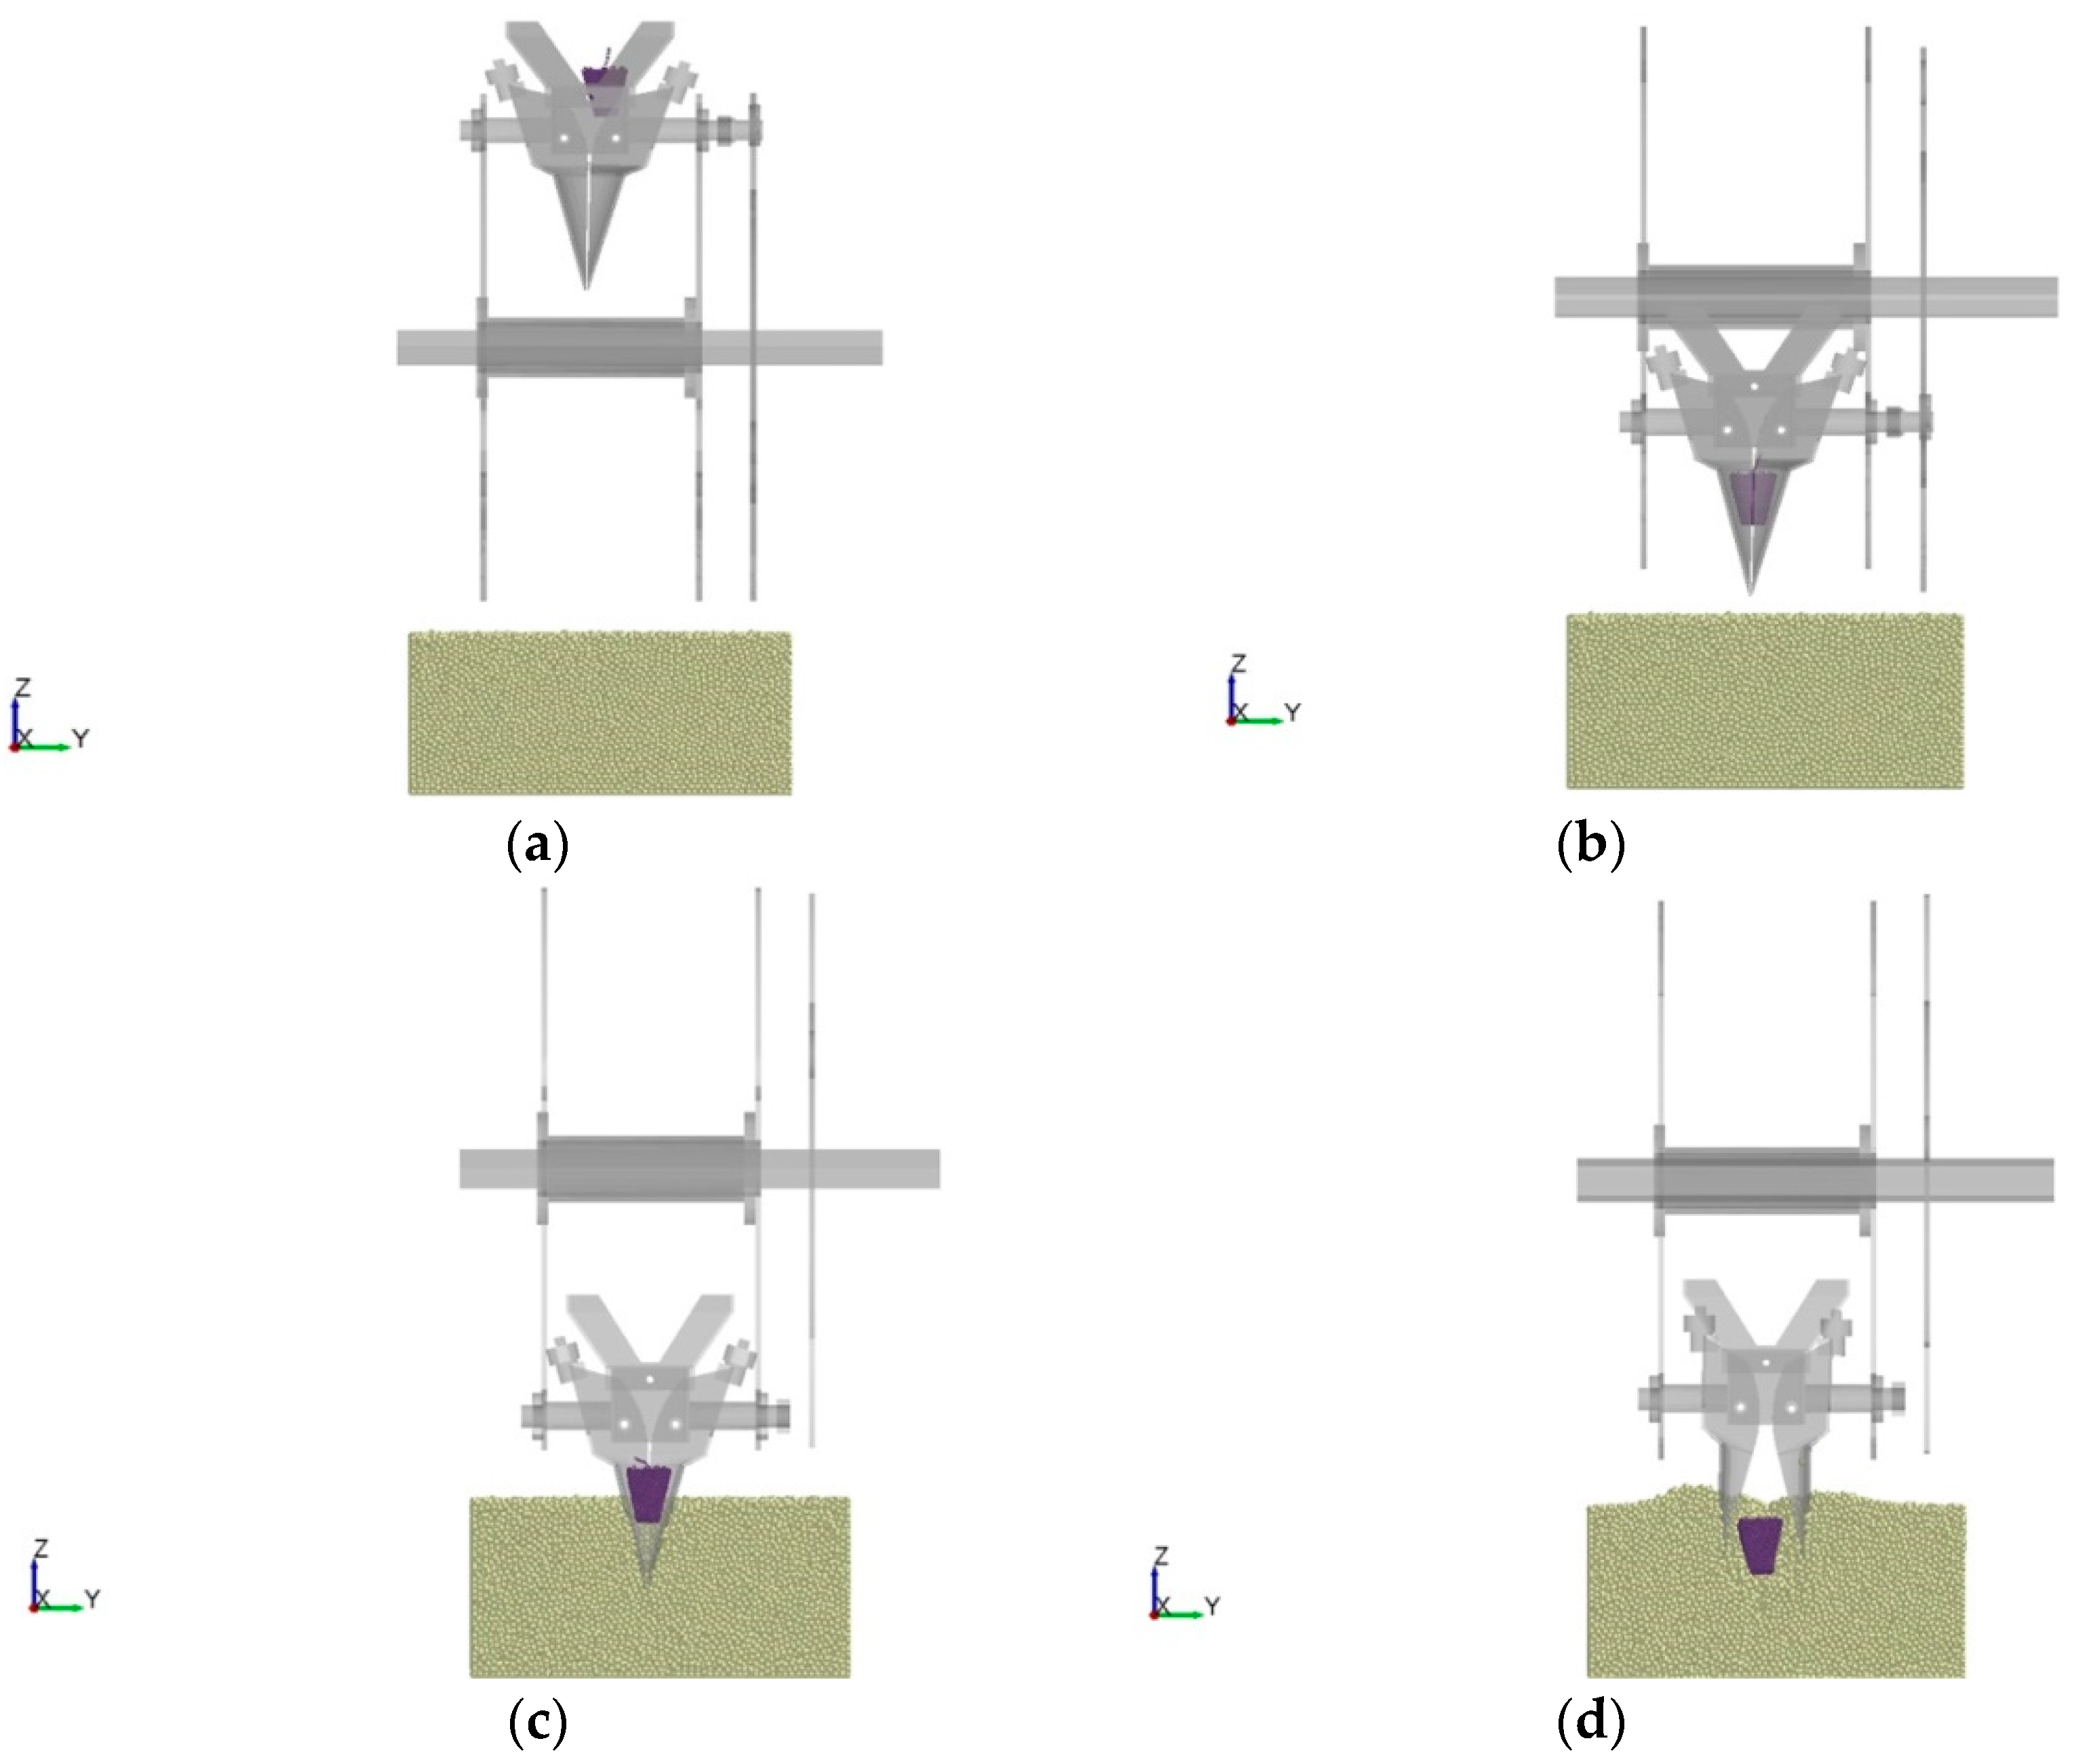
- Based on the optimal parameters, the movement law of the hole tray seedlings was studied at different positions during the transplanting process. The plug seedlings collided not only with the planter but also with the soil, which led to the breakage and looseness of the pot structure. The relative error between the matrix loss rate of the transplanter inserting soil, the matrix loss rate of the transplanter that did not enter the soil, and the simulated matrix loss rate was less than 10%, which further proved the accuracy of the simulation model.
Author Contributions
Funding
Data Availability Statement
Acknowledgments
Conflicts of Interest
References
- Han, L.H.; Francis, K.; Mao, H.P.; Hu, J.P. Design and tests of a multi-pin flexible seedling pick-up gripper for automatic transplanting. Appl. Eng. Agric. 2019, 35, 949–957. [Google Scholar] [CrossRef]
- Jin, X.; Cheng, Q.; Zhao, B.; Ji, J.T.; Li, M. Design and test of 2ZYM-2 potted vegetable seedlings transplanting machine. Int. J. Agric. Biol. Eng. 2020, 13, 101–110. [Google Scholar] [CrossRef]
- Markumningsih, S.; Seok-Joon, H.; Ju-Seok, N. Experimental safety analysis for transplanting device of the 4-bar link type semi-automatic vegetable transplanter. Agronomy 2022, 12, 1890. [Google Scholar]
- Markumningsih, S.; Seok-Joon, H.; Ju-Seok, N. Experimental safety analysis of transplanting device of the cam-type semi-automatic vegetable transplanter. J. Terramechanics 2022, 103, 19–32. [Google Scholar]
- Wen, Y.S.; Zhang, L.A.; Huang, X.M.; Yuan, T.; Zhang, J.; Tan, Y.; Feng, Z. Design of and experiment with seedling selection system for automatic transplanter for vegetable plug seedlings. Agronomy 2021, 11, 2031. [Google Scholar] [CrossRef]
- Yan, D.X.; Yu, J.Q.; Wang, Y.; Zhou, L.; Tian, Y.; Zhang, N. Soil particle modeling and parameter calibration based on discrete element method. Agriculture 2022, 12, 1421. [Google Scholar] [CrossRef]
- Wang, J.W.; Xu, C.S.; Xu, W.L.; Fu, Z.D.; Wang, Q.; Tang, H. Discrete element method simulation of rice grain motion during discharge with an auger operated at various inclinations. Biosyst. Eng. 2022, 223, 97–115. [Google Scholar] [CrossRef]
- Tian, Z.W.; Ma, W.; Yang, Q.C.; Yao, S.; Guo, X.Y.; Duan, F.M. Design and experiment of gripper for greenhouse plug seedling transplanting based on EDM. Agronomy 2022, 12, 1487. [Google Scholar] [CrossRef]
- Hu, J.P.; Pan, J.; Chen, F.; Yue, R.C.; Yao, M.J.; Li, J. Simulation and optimization design of finger-clamping seedling picking claw based on EDEM-RecurDyn. Trans. CSAM 2022, 53, 75–85, 301. [Google Scholar]
- Cui, Y.J.; Wei, Y.Z.; Ding, X.T.; Cui, G.P.; He, Z.; Wang, M.H. Design and experiment of adjustable spacing end-effector based on cylindrical cam. Trans. CSAM 2022, 53, 104–114, 122. [Google Scholar]
- Gao, G.H.; Wang, K.; Sun, X.N. Verification for EDEM simulation of process of jacking tray-seedling by steel needle in grafting machine and parameter optimization. Trans. CSAE 2017, 33, 29–35. [Google Scholar]
- Wu, D.D. Design and Experiment of Small Electric Strawberry Directional Transplanter Machine. Master’s Thesis, Jiangsu University, Zhenjiang, China, 2021. [Google Scholar]
- Feng, S.J. Study on Pick-Up System and Pot Body Damage Mechanism of Rape Pot Seedling Based on Movable Tray. Ph.D. Thesis, Hunan Agricultural University, Changsha, China, 2020. [Google Scholar]
- Huangfu, K. Design of Pyrus Betulaefolia Seedling Plug-and-Pot Transplanting Machine. Master’s Thesis, Hebei Agricultural University, Baoding, China, 2020. [Google Scholar]
- Li, X. Based on the High-Speed Photography Technique, the Motion Analysis and Experiment of the Seedling Feeding Mechanism for Casting Holes and Discs. Master’s Thesis, Inner Mongolia Agricultural University, Hohhot, China, 2020. [Google Scholar]
- Athlani, L.; Bergere, M.; Motte, D.; Prandi, B.; Beaulieu, J.-Y.; Moissenet, F. Trapeziometacarpal joint loading during key pinch grip: A cadaver study. Hand Surg. Rehabil. 2022, 41, 204–209. [Google Scholar] [CrossRef] [PubMed]
- Fukagai, S.; Toyama, T.; Tanaka, T.; Kuzuta, M.; Doi, H. Visualization of wheel-rail contact area of running vehicle using film sensor. Proc. Inst. Mech. Eng. Part F J. Rail Rapid Transit 2022, 236, 745–755. [Google Scholar] [CrossRef]
- Huang, W.H.; Zeng, X.L.; Man, G.C.W.; Yang, L.; Zhang, Y. Simultaneous measurement of patellofemoral joint kinematics and contact mechanics in intact knees: A cadaveric study. Orthop. Surg. 2022, 14, 2317–2329. [Google Scholar] [CrossRef] [PubMed]
- Floriani, F.; Sabatini, G.P.; Dos Santos, T.T.O.; Philippi, A.G.; Gonzaga, L.H.; Mezzomo, L.A. Digital and analog analysis of occlusion in conventional and implant-retained complete dentures: Preliminary results of a prospective clinical trial. Int. J. Prosthodont. 2022, 35, 27–36. [Google Scholar] [CrossRef] [PubMed]
- Yang, L.J.; Zhang, Y.; Liu, D.H.; Xu, B.P.; Liu, C.X. Early recognition for dairy cow lameness based on pressure distribution measurement system. Trans. CSAM 2016, 47, 426–432. [Google Scholar]
- Tang, Y.H. Reaserch on Parameters Optimization and Performance Test for the Dibble-Type Planting Apparatus of Vegetable Pot Seedling Transplanter. Master’s Thesis, Zhejiang University, Hangzhou, China, 2016. [Google Scholar]
- Ma, Y.H.; Song, C.D.; Xuan, C.Z.; Wang, H.Y.; Yang, S.; Wu, P. Parameters calibration of discrete element model for alfalfa straw compression simulation. Trans. CSAE 2020, 36, 22–30. [Google Scholar]
- Li, B.; Liu, F.Y.; Mu, J.Y.; Chen, J.; Han, W.T. Distinct element method analysis and field experiment of soil resistance applied on the subsoiler. Int. J. Agric. Biol. Eng. 2014, 7, 54–59. [Google Scholar]
- Morrissey, J.P.; Thakur, S.C.; Ooi, J. EDEM contact model: Adhesive elasto-plastic model. Granul. Matter 2014, 16, 383–400. [Google Scholar]
- Cheng, K.W.; Zhu, J.J.; Qian, F.P.; Cao, B.W.; Lu, J.L.; Han, Y.L. CFD–DEM simulation of particle deposition characteristics of pleated air filter media based on porous media model. Particuology 2023, 72, 37–48. [Google Scholar] [CrossRef]
- Luo, S.; Yuan, Q.X.; GOUDA, S.; Yang, L.Y. Parameters calibration of vermicomposting nursery substrate with discrete element method based on JKR contact model. Trans. CSAM 2018, 49, 343–350. [Google Scholar]
- Wu, T.; Huang, W.F.; Chen, X.S.; Ma, X.; Han, Z.Q.; Pan, T. Calibration of discrete element model parameters for cohesive soil considering the cohesion between particles. J. South China Agric. Univ. 2017, 38, 93–98. [Google Scholar]
- Fan, G.J.; Wang, S.Y.; Shi, W.J.; Gong, Z.F.; Gao, M. Simulation parameter calibration and test of typical pear varieties based on discrete element method. Agronomy 2022, 12, 1720. [Google Scholar] [CrossRef]
- Fang, W.Q.; Wang, X.Z.; Han, D.L.; Chen, X.G. Review of material parameter calibration method. Agriculture 2022, 12, 706. [Google Scholar] [CrossRef]
- Hang, C.G.; Gao, X.J.; Yuan, M.C.; Huang, Y.X.; Zhu, R.X. Discrete element simulations and experiments of soil disturbance as affected by the tine spacing of subsoiler. Biosyst. Eng. 2018, 168, 73–82. [Google Scholar] [CrossRef]
- Zeng, F.D.; Li, X.Y.; Bai, H.B.; Cui, J.; Liu, X.N.; Zhang, Y.Z. Experimental Research and Analysis of Soil Disturbance Behavior during the Hole Drilling Process of a Hanging-Cup Transplanter by DEM. Processes 2023, 11, 600. [Google Scholar] [CrossRef]
- Zeng, F.D.; Li, X.Y.; Bai, H.B.; Cui, J.; Liu, X.N.; Zhang, Y.Z. Calibration of the discrete element parameters and experimental verification of the oil sunflower plug seedling pots. INMATEH-Agric. Eng. 2022, 68, 629–640. [Google Scholar] [CrossRef]
- Huang, Y.X.; Hang, C.G.; Yuan, M.C.; Wang, B.T.; Zhu, R.X. Discrete element simulation and experiment on disturbance behavior of subsoiling. Trans. Chin. Soc. Agric. Mach. 2016, 47, 80–88. [Google Scholar]
- Yan, D.X. Particle Modelling of Soybean Seeds and the Simulation Analysis and Experimental Study of the Seed-Throwing and Pressing. Ph.D. Thesis, Jilin University, Changchun, China, 2021. [Google Scholar]


| Simulation Parameters | Value |
|---|---|
| Soil density/(kg/m3) | 1452 |
| Poisson’s ratio of soil | 0.42 |
| Shear modulus of soil/Pa | 1 × 10⁶ |
| Soil–soil restitution coefficient | 0.45 |
| Soil–soil static friction coefficient | 0.4 |
| Soil–soil rolling friction coefficient | 0.3 |
| The normal stiffness coefficient/(N/m3) | 24,000,000 |
| The tangential stiffness coefficient/(N/m3) | 17,000,000 |
| The critical normal stress/Pa | 235,000 |
| The tangential critical stress/Pa | 186,000 |
| The particle bonding radius/mm | 3.5 |
| Variable | Factors | Low Level (−1) | Middle Level (0) | High Level (+1) |
|---|---|---|---|---|
| A | Pot–soil restitution coefficient | 0.26 | 0.37 | 0.48 |
| B | Pot–soil static friction coefficient | 0.75 | 0.84 | 0.92 |
| C | Pot–soil rolling friction coefficient | 0.35 | 0.39 | 0.43 |
| D | Surface energy/(J/m2) | 1 | 1.5 | 2 |
| No. | Factors | Collision Impact Force/N | Matrix Loss Rate/% | |||
|---|---|---|---|---|---|---|
| A | B | C | D | |||
| 1 | −1 | −1 | 0 | 0 | 7.01 | 4.98 |
| 2 | 1 | −1 | 0 | 0 | 5.53 | 3.5 |
| 3 | −1 | 1 | 0 | 0 | 5.43 | 3.43 |
| 4 | 1 | 1 | 0 | 0 | 4.28 | 2.65 |
| 5 | 0 | 0 | −1 | −1 | 8.23 | 5.82 |
| 6 | 0 | 0 | 1 | −1 | 7.15 | 5.12 |
| 7 | 0 | 0 | −1 | 1 | 2.93 | 0.9 |
| 8 | 0 | 0 | 1 | 1 | 4.75 | 2.72 |
| 9 | −1 | 0 | 0 | −1 | 11.63 | 6.6 |
| 10 | 1 | 0 | 0 | −1 | 7.31 | 5.28 |
| 11 | −1 | 0 | 0 | 1 | 3.98 | 2.95 |
| 12 | 1 | 0 | 0 | 1 | 5.98 | 3.95 |
| 13 | 0 | −1 | −1 | 0 | 6.27 | 4.24 |
| 14 | 0 | 1 | −1 | 0 | 2.84 | 0.91 |
| 15 | 0 | −1 | 1 | 0 | 5.11 | 3.08 |
| 16 | 0 | 1 | 1 | 0 | 4.86 | 2.83 |
| 17 | −1 | 0 | −1 | 0 | 4.81 | 2.68 |
| 18 | 1 | 0 | −1 | 0 | 5.74 | 3.71 |
| 19 | −1 | 0 | 1 | 0 | 7.32 | 5.29 |
| 20 | 1 | 0 | 1 | 0 | 3.79 | 2.36 |
| 21 | 0 | −1 | 0 | −1 | 9.71 | 7.68 |
| 22 | 0 | 1 | 0 | −1 | 7.06 | 5.43 |
| 23 | 0 | −1 | 0 | 1 | 5.19 | 3.76 |
| 24 | 0 | 1 | 0 | 1 | 4.46 | 2.43 |
| 25 | 0 | 0 | 0 | 0 | 4.59 | 3.16 |
| 26 | 0 | 0 | 0 | 0 | 4.23 | 2.59 |
| 27 | 0 | 0 | 0 | 0 | 4.67 | 2.64 |
| 28 | 0 | 0 | 0 | 0 | 4.54 | 2.56 |
| 29 | 0 | 0 | 0 | 0 | 5.62 | 2.59 |
| Type | Dropping Height/mm | |||
|---|---|---|---|---|
| 50 mm | 150 mm | 250 mm | 350 mm | |
| Collision impact force of the whole seedlings/N | 5.08 | 6.08 | 7.41 | 8.99 |
| Collision impact force of the pots/N | 4.37 | 5.30 | 6.52 | 7.87 |
| Relative error/% | 13.98 | 12.83 | 12.01 | 12.46 |
| Source | Equation of Squares | Degrees of Freedom | Mean Square | F-Value | p-Value |
|---|---|---|---|---|---|
| Model | 101.57 | 14 | 7.26 | 44.35 | <0.0001 ** |
| A | 4.75 | 1 | 4.75 | 29.04 | <0.0001 ** |
| B | 8.15 | 1 | 8.15 | 49.82 | <0.0001 ** |
| C | 0.39 | 1 | 0.39 | 2.38 | 0.1455 |
| D | 47.20 | 1 | 47.20 | 288.53 | <0.0001 ** |
| AB | 0.03 | 1 | 0.03 | 0.17 | 0.6895 |
| AC | 4.97 | 1 | 4.97 | 30.40 | <0.0001 ** |
| AD | 9.99 | 1 | 9.99 | 61.04 | <0.0001 ** |
| BC | 2.53 | 1 | 2.53 | 15.45 | 0.0015 ** |
| BD | 0.92 | 1 | 0.92 | 5.63 | 0.0325 * |
| CD | 2.10 | 1 | 2.10 | 12.85 | 0.003 ** |
| A2 | 4.64 | 1 | 4.64 | 28.37 | 0.0001 ** |
| B2 | 0.30 | 1 | 0.30 | 1.80 | 0.2005 |
| C2 | 0.51 | 1 | 0.51 | 3.12 | 0.0992 |
| D2 | 15.43 | 1 | 15.43 | 94.29 | <0.0001 ** |
| Residual | 2.29 | 14 | 0.16 | ||
| Lack-of-Fit | 1.19 | 10 | 0.12 | 0.43 | 0.8717 |
| Pure Error | 1.10 | 4 | 0.28 | ||
| Cor Total | 103.86 | 28 | |||
| R2 | 0.9779 | ||||
| Source | Equation of Squares | Degrees of Freedom | Mean Square | F-Value | p-Value |
|---|---|---|---|---|---|
| Model | 66.72 | 14 | 4.77 | 21.43 | <0.0001 ** |
| A | 1.67 | 1 | 1.67 | 7.52 | 0.0159 * |
| B | 7.62 | 1 | 7.62 | 34.24 | <0.0001 ** |
| C | 0.82 | 1 | 0.82 | 3.69 | 0.0752 |
| D | 30.78 | 1 | 30.78 | 138.41 | <0.0001 ** |
| AB | 0.12 | 1 | 0.12 | 0.55 | 0.4703 |
| AC | 3.92 | 1 | 3.92 | 17.63 | 0.0009 ** |
| AD | 1.35 | 1 | 1.35 | 6.05 | 0.0275 * |
| BC | 2.37 | 1 | 2.37 | 10.66 | 0.0056 ** |
| BD | 0.21 | 1 | 0.21 | 0.95 | 0.3459 |
| CD | 1.59 | 1 | 1.59 | 7.14 | 0.0182 * |
| A2 | 3.39 | 1 | 3.39 | 15.23 | 0.0016 ** |
| B2 | 1.12 | 1 | 1.12 | 5.03 | 0.0417 * |
| C2 | 0.38 | 1 | 0.38 | 1.71 | 0.2117 |
| D2 | 12.36 | 1 | 12.36 | 55.55 | <0.0001 ** |
| Residual | 3.11 | 14 | 0.22 | ||
| Lack-of-Fit | 2.86 | 10 | 0.29 | 4.41 | 0.0826 |
| Pure Error | 0.26 | 4 | 0.065 | ||
| Cor Total | 69.83 | 28 | |||
| R2 | 0.9554 | ||||
| Type | Matrix Loss Rate of the Planter Inserting the Hole | Matrix Loss Rate of the Planter Not Entering the Hole |
|---|---|---|
| Test value (%) | 14.87 | 13.86 |
| Simulation value (%) | 14.08 | 12.91 |
| Relative error (%) | 5.31 | 6.85 |
Disclaimer/Publisher’s Note: The statements, opinions and data contained in all publications are solely those of the individual author(s) and contributor(s) and not of MDPI and/or the editor(s). MDPI and/or the editor(s) disclaim responsibility for any injury to people or property resulting from any ideas, methods, instructions or products referred to in the content. |
© 2023 by the authors. Licensee MDPI, Basel, Switzerland. This article is an open access article distributed under the terms and conditions of the Creative Commons Attribution (CC BY) license (https://creativecommons.org/licenses/by/4.0/).
Share and Cite
Zeng, F.; Cui, J.; Li, X.; Bai, H. Establishment of the Interaction Simulation Model between Plug Seedlings and Soil. Agronomy 2024, 14, 4. https://doi.org/10.3390/agronomy14010004
Zeng F, Cui J, Li X, Bai H. Establishment of the Interaction Simulation Model between Plug Seedlings and Soil. Agronomy. 2024; 14(1):4. https://doi.org/10.3390/agronomy14010004
Chicago/Turabian StyleZeng, Fandi, Ji Cui, Xuying Li, and Hongbin Bai. 2024. "Establishment of the Interaction Simulation Model between Plug Seedlings and Soil" Agronomy 14, no. 1: 4. https://doi.org/10.3390/agronomy14010004
APA StyleZeng, F., Cui, J., Li, X., & Bai, H. (2024). Establishment of the Interaction Simulation Model between Plug Seedlings and Soil. Agronomy, 14(1), 4. https://doi.org/10.3390/agronomy14010004