Article

The Impact of Shale Oil Residue on the Growth and Physiological Characteristics of Corn Seedlings under Saline Soil Conditions

1
Institute of Soil Fertilizer, Agricultural Water Saving, Xinjiang Academy of Agricultural Sciences, Urumqi 830091, China
2
Key Laboratory of Saline-Alkali Soil Improvement and Utilization (Saline-Alkali Land in Arid and Semi-Arid Regions), Ministry of Agriculture and Rural Affairs, Urumqi 830091, China
3
College of Water Conservancy and Civil Engineering, Xinjiang Agricultural University, Urumqi 830052, China
*
Author to whom correspondence should be addressed.
These two authors contributed equally.
Agronomy 2024, 14(1), 44; https://doi.org/10.3390/agronomy14010044
Submission received: 26 November 2023 / Revised: 21 December 2023 / Accepted: 21 December 2023 / Published: 22 December 2023
(This article belongs to the Special Issue Strategies for Enhancing Abiotic Stress Tolerance in Crops)

Abstract

:
Soil salinization is a primary environmental factor leading to reduced crop yields, and oil shale waste residues may have the potential to alleviate plant salt stress. This study aims to investigate the effects of three types of oil shale waste residues (fine concentrate ore, fine ore, and semi-coke) on the growth and physiological characteristics of maize seedlings in saline–alkali soil. The results indicate the following: (1) All three types of oil shale waste residues increased the root vitality of seedlings and reduced the root proline content. (2) The three types of oil shale waste residues increased the activity of superoxide dismutase (1.70% to 97.19%) and peroxidase (29.39% to 61.21%) in maize seedlings, but there were differences in their effects on catalase activity. The fine ore and semi-coke treatments increased catalase activity (4.98% to 77.42%), while fine concentrate ore decreased catalase activity (39.28% to 5.30%). (3) The three types of oil shale waste residues effectively alleviated the degree of membrane lipid peroxidation in maize seedling leaves. (4) Principal component analysis showed that the semi-coke treatment was beneficial to the growth and physiology of maize seedlings in saline–alkali soil, with the optimal effect occurring at a 0.2% addition rate. In conclusion, adding semi-coke to saline–alkali soil promotes the growth of maize by regulating its physiological and biochemical mechanisms, alleviating the salt stress on maize seedlings caused by salt content.

1. Introduction

With the growing global population and food demand, soil salinization poses a serious challenge to agricultural production [1,2,3]. In China, a quarter of the cultivated land for corn is affected by salt stress [4]. China is the world’s largest producer of unconventional shale oil, with Xinjiang possessing abundant shale oil resources, particularly in the crucial exploration area of Jimusaer County [5,6,7]. However, the development of shale resources generates a substantial amount of waste, constituting 60–80% of the total, posing significant challenges in environmental and resource management [8]. In this context, research on the potential feasibility of converting shale oil waste into reusable agricultural materials has emerged.
Excessive soil salinity makes it difficult for plant roots to absorb water, leading to the uptake of harmful ions by crops [1,2]. This triggers issues such as osmotic stress and ion toxicity, severely disrupting normal plant growth and metabolic processes [9]. Salt stress causes an imbalance in the oxidative–reductive state within plant cells, accelerating the generation of reactive oxygen species (ROS) [10,11]. The excessive production of ROS damages cell membranes, causing oxidative injury to plant tissues, and even resulting in plant death. The survival of plants under salt stress depends, to a large extent, on the capability of their antioxidant systems, which play a crucial role in mitigating damage caused by ROS [12].
Our primary objective is to address the challenge of recycling substantial industrial waste generated during oil shale production and processing. We aim to repurpose this waste as a material for enhancing saline–alkali conditions in agricultural production. This study delves into the feasibility and safety of this approach, seeking to contribute a novel solution to efforts to solve the global food security issue. The utilization of shale oil waste as a soil conditioner, stabilizer, and fertilizer holds the potential to enhance soil physical, chemical, and biological properties, leading to improved crop yields [13]. Shale oil waste is rich in micronutrients, oxygen-containing functional groups, organic matter, and acidic and alkaline oxides, exhibiting excellent water retention and nutrient retention capabilities. With its porous structure and high specific surface area [13,14,15,16,17], shale oil waste presents promising prospects for ameliorating low-yielding saline–alkali land. While shale oil waste has the potential to play a crucial role in improving agricultural soil, the precise mechanisms underlying its effectiveness remain unclear. Hence, this study collected three types of shale oil waste from the Baoming mining area in Jimusaer County, Xinjiang, namely fine concentrate ore, fine ore, and semi-coke. Our objective is to observe the impact of adding various proportions of shale oil waste to saline–alkali soil as a cultivation substrate on the growth, physiological, and biochemical indicators of maize seedlings. By comprehensively evaluating the overall effects of each treatment on maize seedlings in saline–alkali soil through principal component analysis, we aim to identify the specific type of shale oil waste that can mitigate salt damage and elucidate its mechanisms in alleviating salt stress in plants.

2. Materials and Methods

2.1. Experimental Materials

Oil shale waste residues, including fine concentrate ore (ore with particle size less than 6 mm after desliming and dewatering), fine ore (raw ore broken into particles of less than 6 mm), and semi-coke (the remaining raw ore left after oil shale distillation containing a small amount of residual carbon, similar to the raw material of volcanic ash, and the removal of volatiles, carbon, or other organic acids during the distillation or combustion process, forming a porous structure), were sourced from the Baoming mining Area in Jimusaer County, Xinjiang, China. The cultivation substrate used was typical saline–alkali desert soil in Xinjiang, characterized by sulfate-chloride salinity and classified as moderately saline soil. The maize variety used in this study was “Jiushenghe 2468”, with seeds selected for their fullness, uniform size, and intact embryos.
The basic physicochemical properties of the saline–alkali soil and oil shale waste residues are presented in Table 1. The heavy metal content in both was found to be below the limits specified in the People’s Republic of China National Standard [18].

2.2. Experimental Design

The experiment was conducted using potted plants in the artificial climate chamber at the Agricultural Mechanization Research Institute of Xinjiang Academy of Agricultural Sciences (longitude 87.57867, latitude 43.81211). The laboratory maintained a temperature range of 18 to 28 °C, a relative humidity of 60%, and utilized natural light with a transmittance exceeding 80%. Saline–alkali soil and oil shale waste residue were separately sieved through a 2 mm mesh and reserved for use. The experimental design included 4 (addition levels) × 3 (types of oil shale waste residue) treatments, along with one blank control. Each treatment had 3 replicates, resulting in a total of 39 pots. The four addition levels were 0.1%, 0.2%, 0.4%, and 0.8%. Saline–alkali soil and the respective treatment materials were proportionally loaded into round plastic pots with a diameter of 17 cm and a height of 13 cm. Each pot was filled with 3 kg of substrate. After filling, 450 mL of distilled water was added, and the pots were allowed to stand for one day before sowing. On 6 June 2022, ten maize seeds were sown in each pot and covered with plastic wrap. After seedlings emerged, the plastic wrap was removed. Seven days after emergence, 5~6 corn seedlings with consistent growth were planted in each pot. Uniform applications of urea (75 kg/ha), ammonium dihydrogen phosphate (75 kg/ha), and potassium sulfate (60 kg/ha) were carried out in two split doses during the seedling emergence and jointing stages. The experiment was conducted from 6 June 2022 to 29 July 2022, spanning a period of 54 days.

2.3. Index Determination and Methods

2.3.1. Growth Index Determination

Seedling height was measured directly using a tape measure. On 6 July 2022, the height of each seedling in each treatment was measured from the base of the seedling to its highest point using a tape measure [19], and calipers were used to measure stem width at the base [19]. On 29 July 2022, destructive sampling was carried out. We selected 3 corn seedlings from each treatment, uprooted them, and washed them with distilled water to remove the soil adhered to the roots. The aboveground parts (stems and leaves) and underground parts (roots) were separated, and their fresh weights were measured using an electronic scale. Samples were placed in paper bags and dried in an oven at 105 °C for 30 min, followed by drying at 75 °C to a constant weight. The dry weights were then measured. The root/shoot ratio and seedling vigor index were calculated according to the following formulas [19,20].
R o o t / S h o o t   r a t i o = U n d e r g r o u n d   d r y   w e i g h t A b o v e g r o u n d   d r y   w e i g h t
S e e d l i n g   v i g o r   i n d e x = S t e m   w i d t h h e i g h t + U n d e r g r o u n d   d r y   w e i g h t A b o v e g r o u n d   d r y   w e i g h t × T o t a l   d r y   w e i g h t

2.3.2. Physiological Index Measurement

The determination of root vitality was conducted using the chlorotriphenyltetrazolium chloride colorimetric method [21]. proline (PRO) was measured through the absorbance method [22]. The determination of malondialdehyde (MDA) content was carried out using the thiobarbituric acid method [19].
To determine enzyme activity, we needed to obtain clean leaf samples and immediately cool them with liquid nitrogen after sampling. After cooling, the samples were stored in a −80 °C freezer for later use. In the analysis of antioxidant enzymes, we used 0.5 g of maize seedling leaves. First, fresh leaf tissues were ground in a cold water bath and mixed with pH 7.4, 0.05 mol/L phosphate-buffered saline. Subsequently, the supernatant, obtained via centrifugation at 8000× g for 10 min at 4 °C, was used for the subsequent analysis of antioxidant enzyme activity. Superoxide dismutase (SOD) activity was determined using the nitroblue tetrazolium (NBT) photoreduction method [23]. Additionally, peroxidase (POD) activity was determined using the guaiacol method [24]. Catalase (CAT) activity was measured using the ultraviolet absorption method [23]. To determine the activity of superoxide dismutase (SOD), peroxidase (POD), and catalase (CAT), we utilized specific assay kits, namely SOD-1-W, POD-1-Y, and CAT-1-Y, respectively. These assay kits were provided by Suzhou Keming Biotechnology Co., Ltd. (Suzhou, China).

2.4. Statistical Analysis

The obtained data are expressed as mean ± standard deviation. Experimental data management was carried out using Excel 2016. Single-factor analysis of variance (ANOVA) was performed using SPSS 26.0, followed by Duncan’s post hoc test to determine the significance of differences (p < 0.05 is considered significant). Two-way analysis of variance was conducted using SPSS 26.0, and Tukey’s post hoc multiple comparison test was applied to compare mean differences (p < 0.05 is considered significant). Principal component synthesis was performed using SPSS 26.0. Bar charts were created using Origin 2018. Hierarchical clustering and principal component analysis (PCA) were carried out using RStudio. The first two principal components (PC1 and PC2) were extracted. The plotting process involved the use of the “pheatmap” and “devtools” packages.

3. Results

3.1. Growth Characteristics
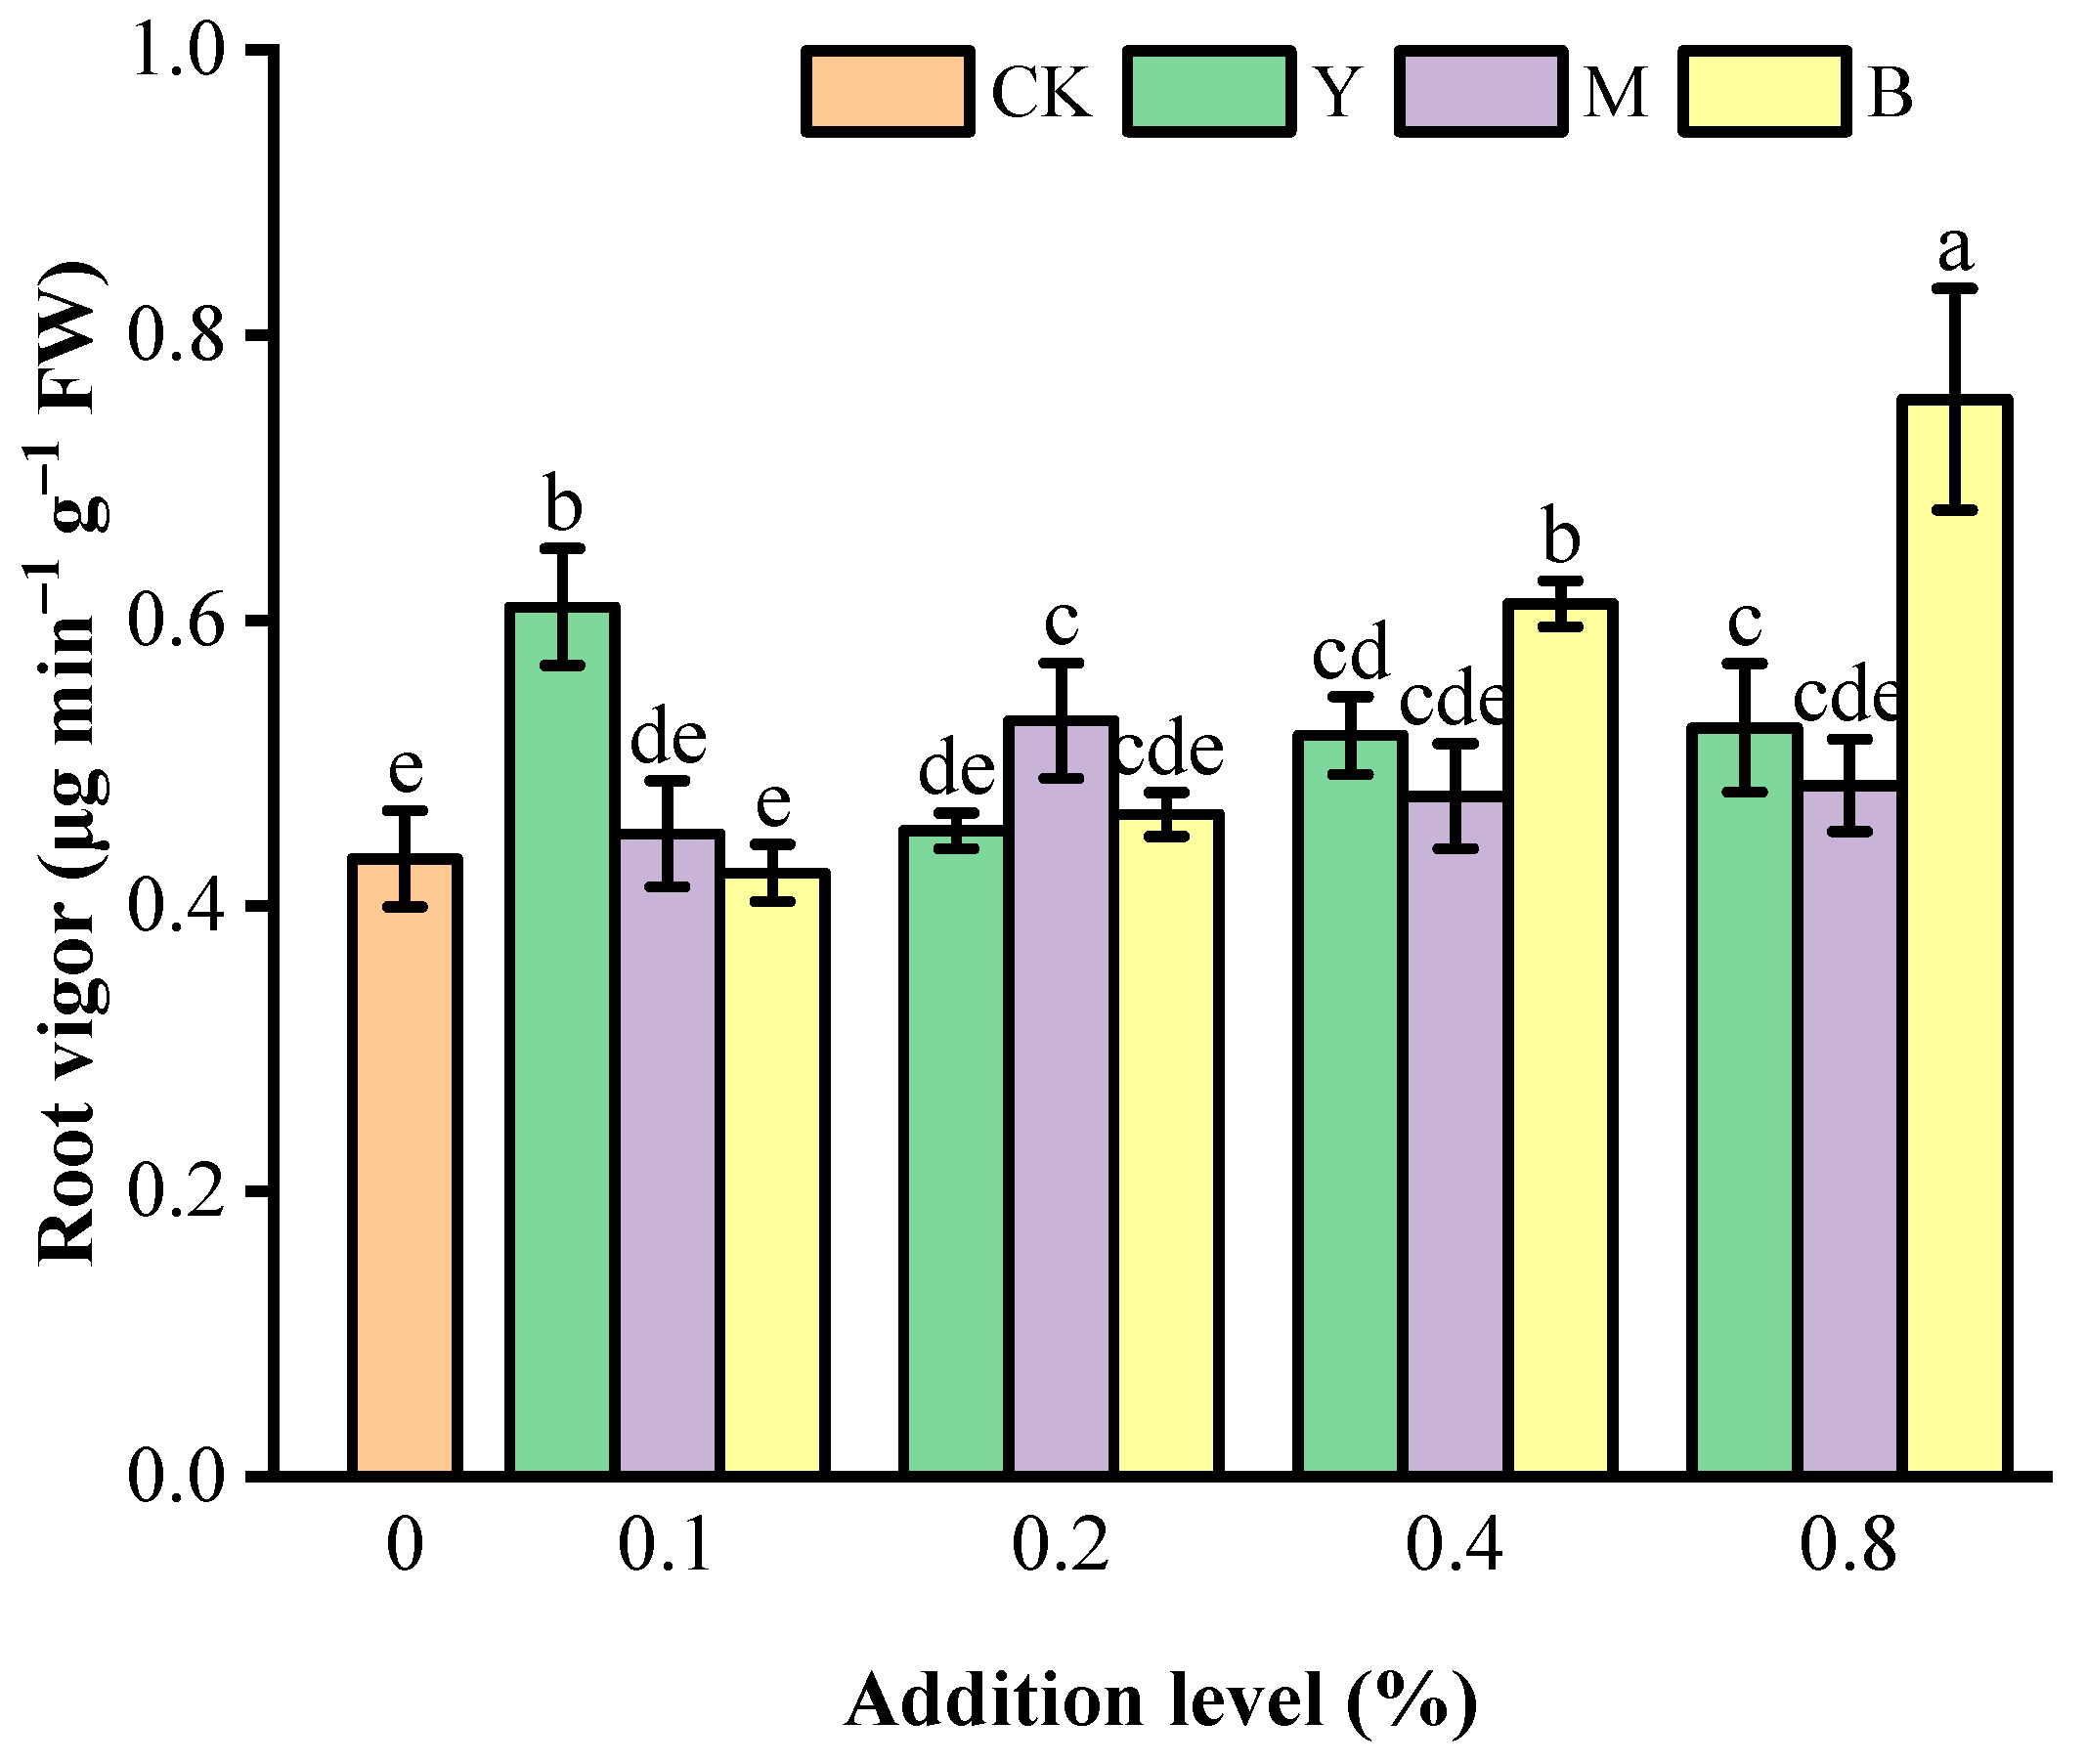
According to Table 2, it can be observed that the treatments with fine concentrate ore (Y), fine ore (M), and semi-coke (B) did not significantly affect seedling height and root/shoot ratio (p > 0.05). However, they had a significant impact on stem width, fresh and dry weight, and seedling vigor index (p < 0.05). In terms of stem width, all three treatments showed a decrease compared to CK. For underground fresh weight and dry weight, the addition of 0.2% Y, 0.2% M, and 0.1~0.8% B treatments increased compared to CK. In aboveground fresh weight and dry weight, the 0.4% M and the 0.1~0.8% B treatments increased compared to CK. For total fresh weight and dry weight, the 0.4% M and the 0.1~0.8% B treatments increased compared to CK. In terms of seedling vigor index, the 0.1~0.8% B treatments increased compared to CK, with significant differences observed at the 0.2% addition level.
A dual-axis plot from the principal component analysis revealed the relationships between various treatments and indicators (Figure 1). Principal Component 1 explained 62.7% of all variables, while Principal Component 2 explained 19.2%, collectively explaining 81.9% of the variation. Principal Component 1 divided the treatments into two groups, with 0.8% B, 0.4% M, 0.1% B, 0.4% B, 0.2% B, and 0.2% Y treatments on the left, and CK, 0.8% M, 0.4% Y, 0.8% Y, 0.1% M, 0.2% M, and 0.1% Y treatments on the right. Principal Component 2 separated the growth indicators into two groups, with stem width (X2), aboveground dry weight (X6), height (X1), aboveground fresh weight (X5), total fresh weight (X7), and total dry weight (X8) at the bottom, and seedling vigor index (X10), underground dry weight (X4), underground fresh weight (X3), and root/shoot ratio (X9) at the top.

3.2. Root Vitality

The effect of fine concentrate ore (Y), fine ore (M), and semi-coke (B) treatments on the root vitality of maize seedlings is depicted in Figure 2. Compared to the control (CK), treatments with Y, M, and B resulted in an enhancement in root system vitality. The respective increases ranged from 4.53% to 40.73%, 3.99% to 22.35%, and −2.31% to 74.37%. However, there were isolated cases, notably the 0.1% B treatment, which exhibited a decrease compared to CK, though the difference was not statistically significant.

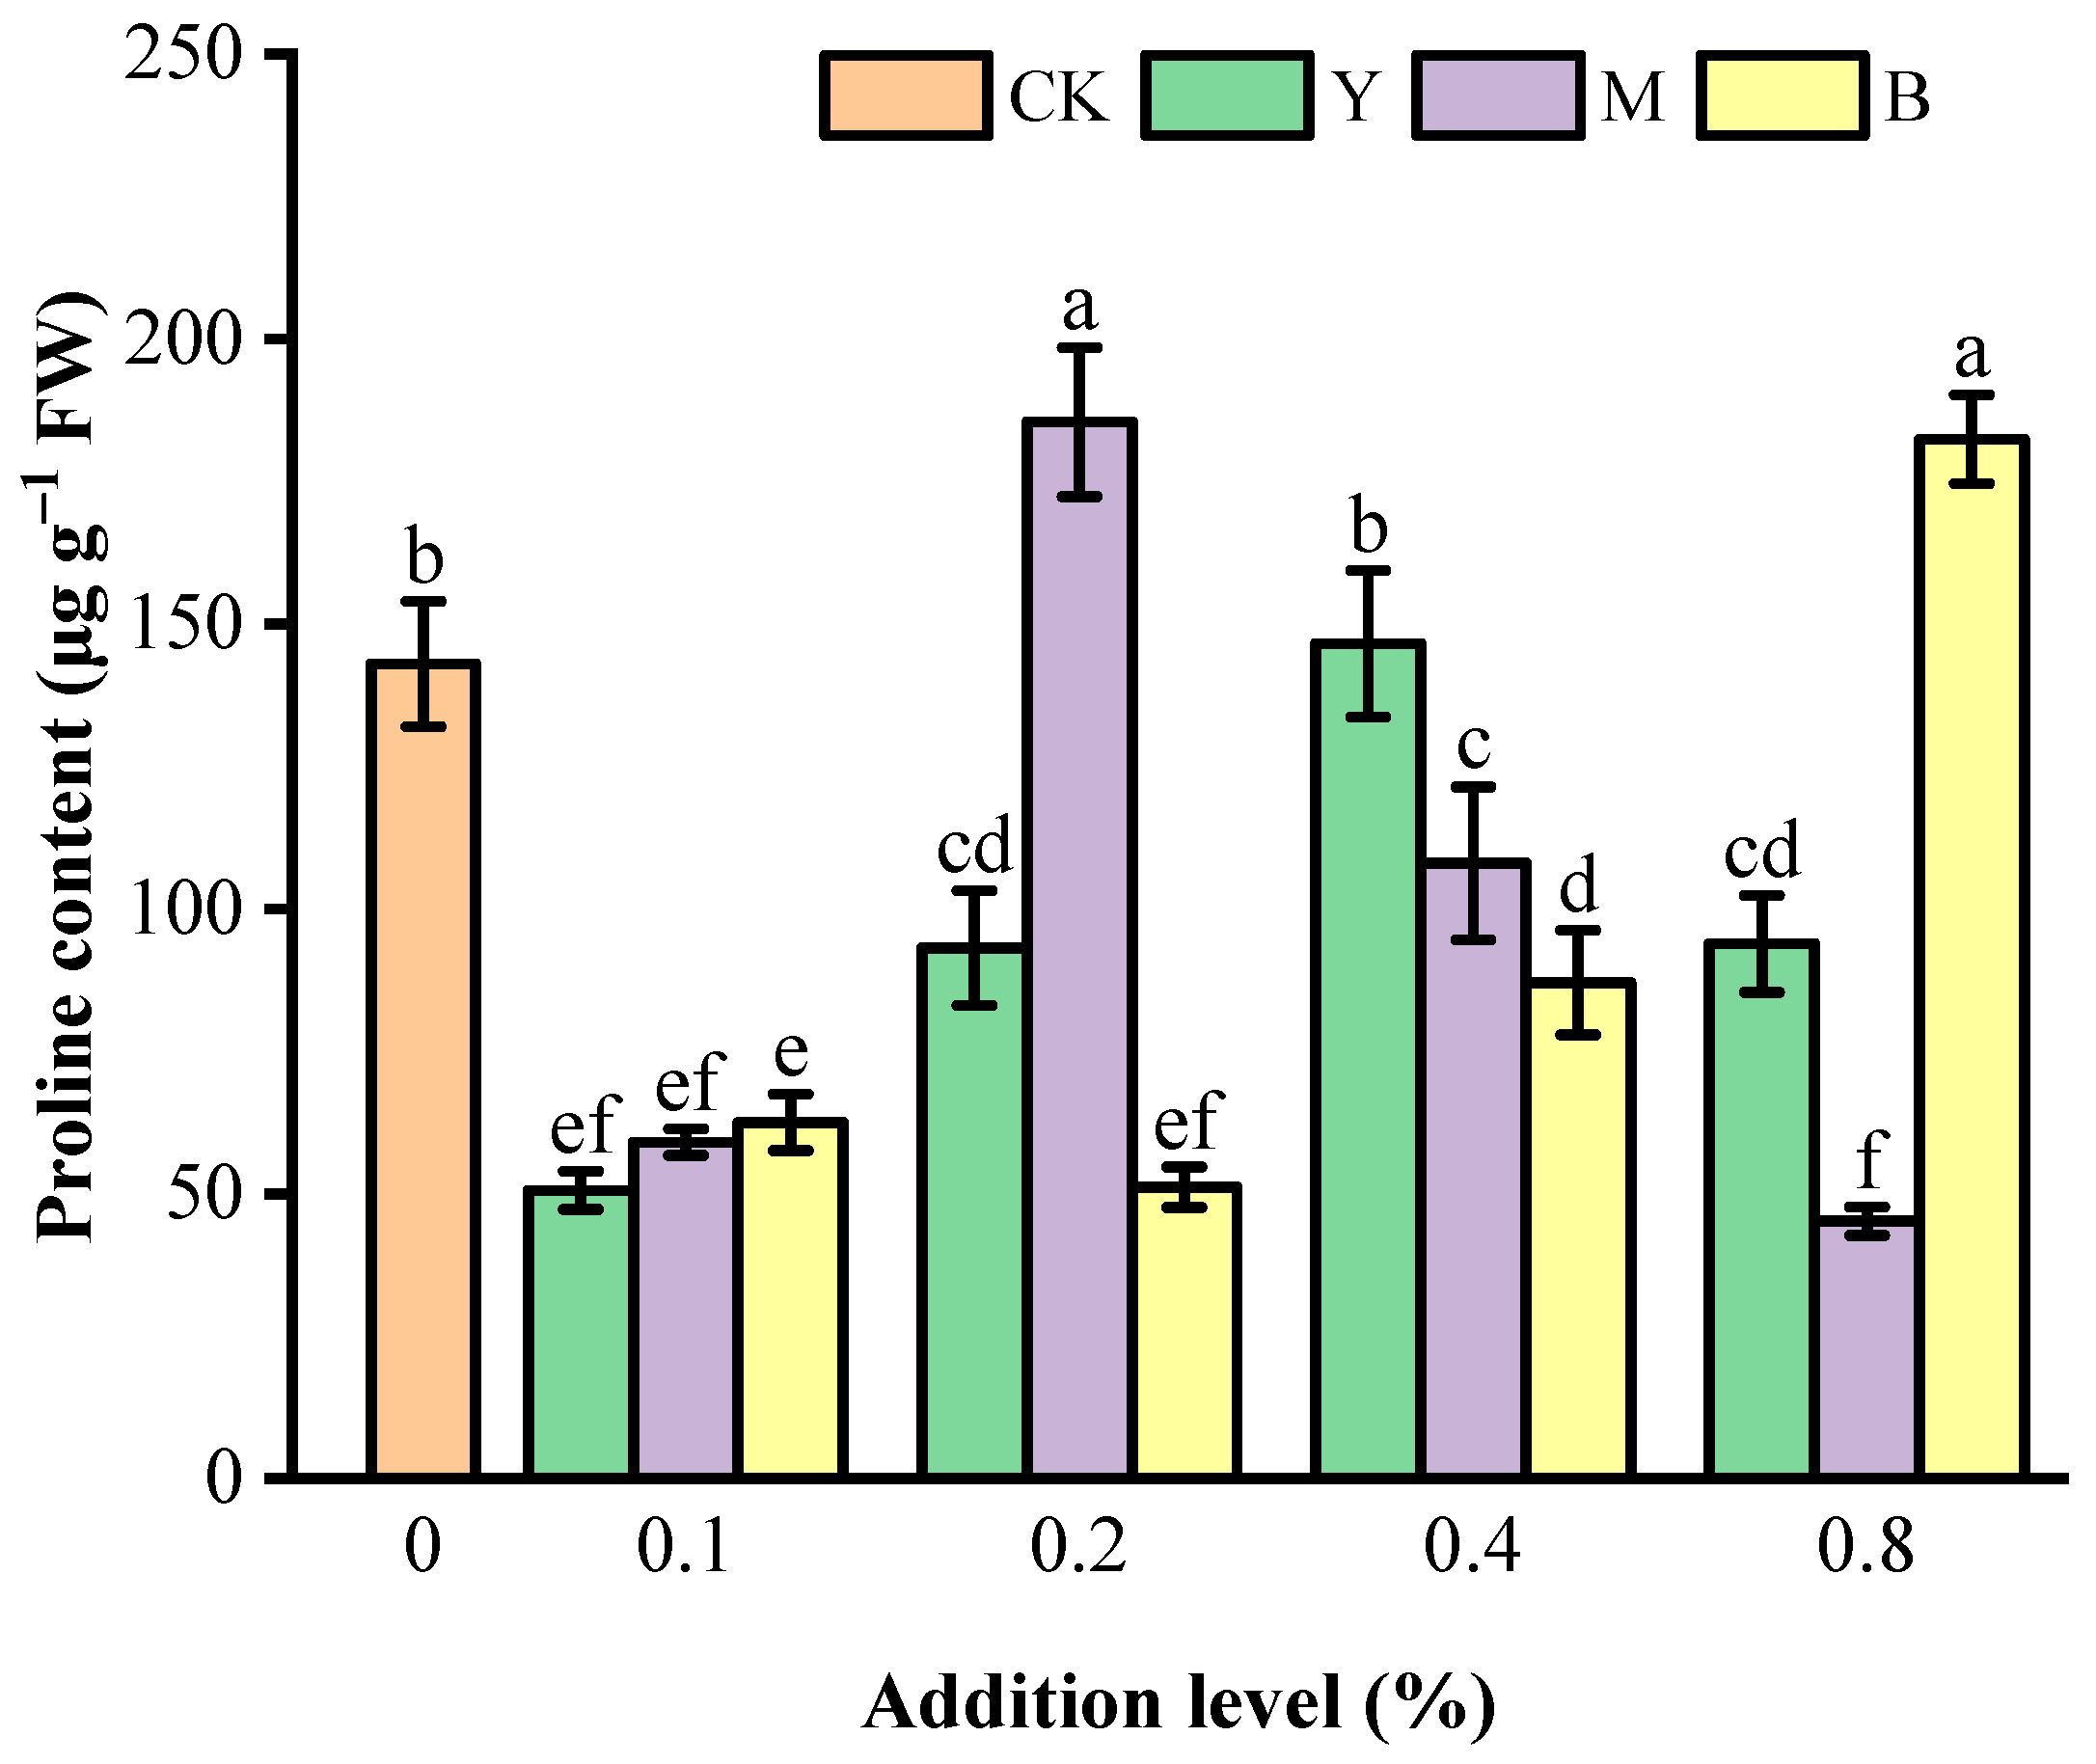
3.3. Proline Content

The impact of treatments with fine concentrate ore (Y), fine ore (M), and semi-coke (B) on the proline content in the roots of maize seedlings is illustrated in Figure 3. Except for the 0.4% Y, 0.2% M, and 0.8% B treatments, which showed an increase compared to CK, all other treatments significantly decreased proline content compared to CK. Among them, the Y treatment exhibited the greatest reduction at the 0.1% addition level, with a decrease of 64.62%. The M treatment showed the maximum reduction at the 0.8% addition level, with a decrease of 68.62%. The B treatment had the most substantial reduction at the 0.2% addition level, with a decrease of 64.25%.

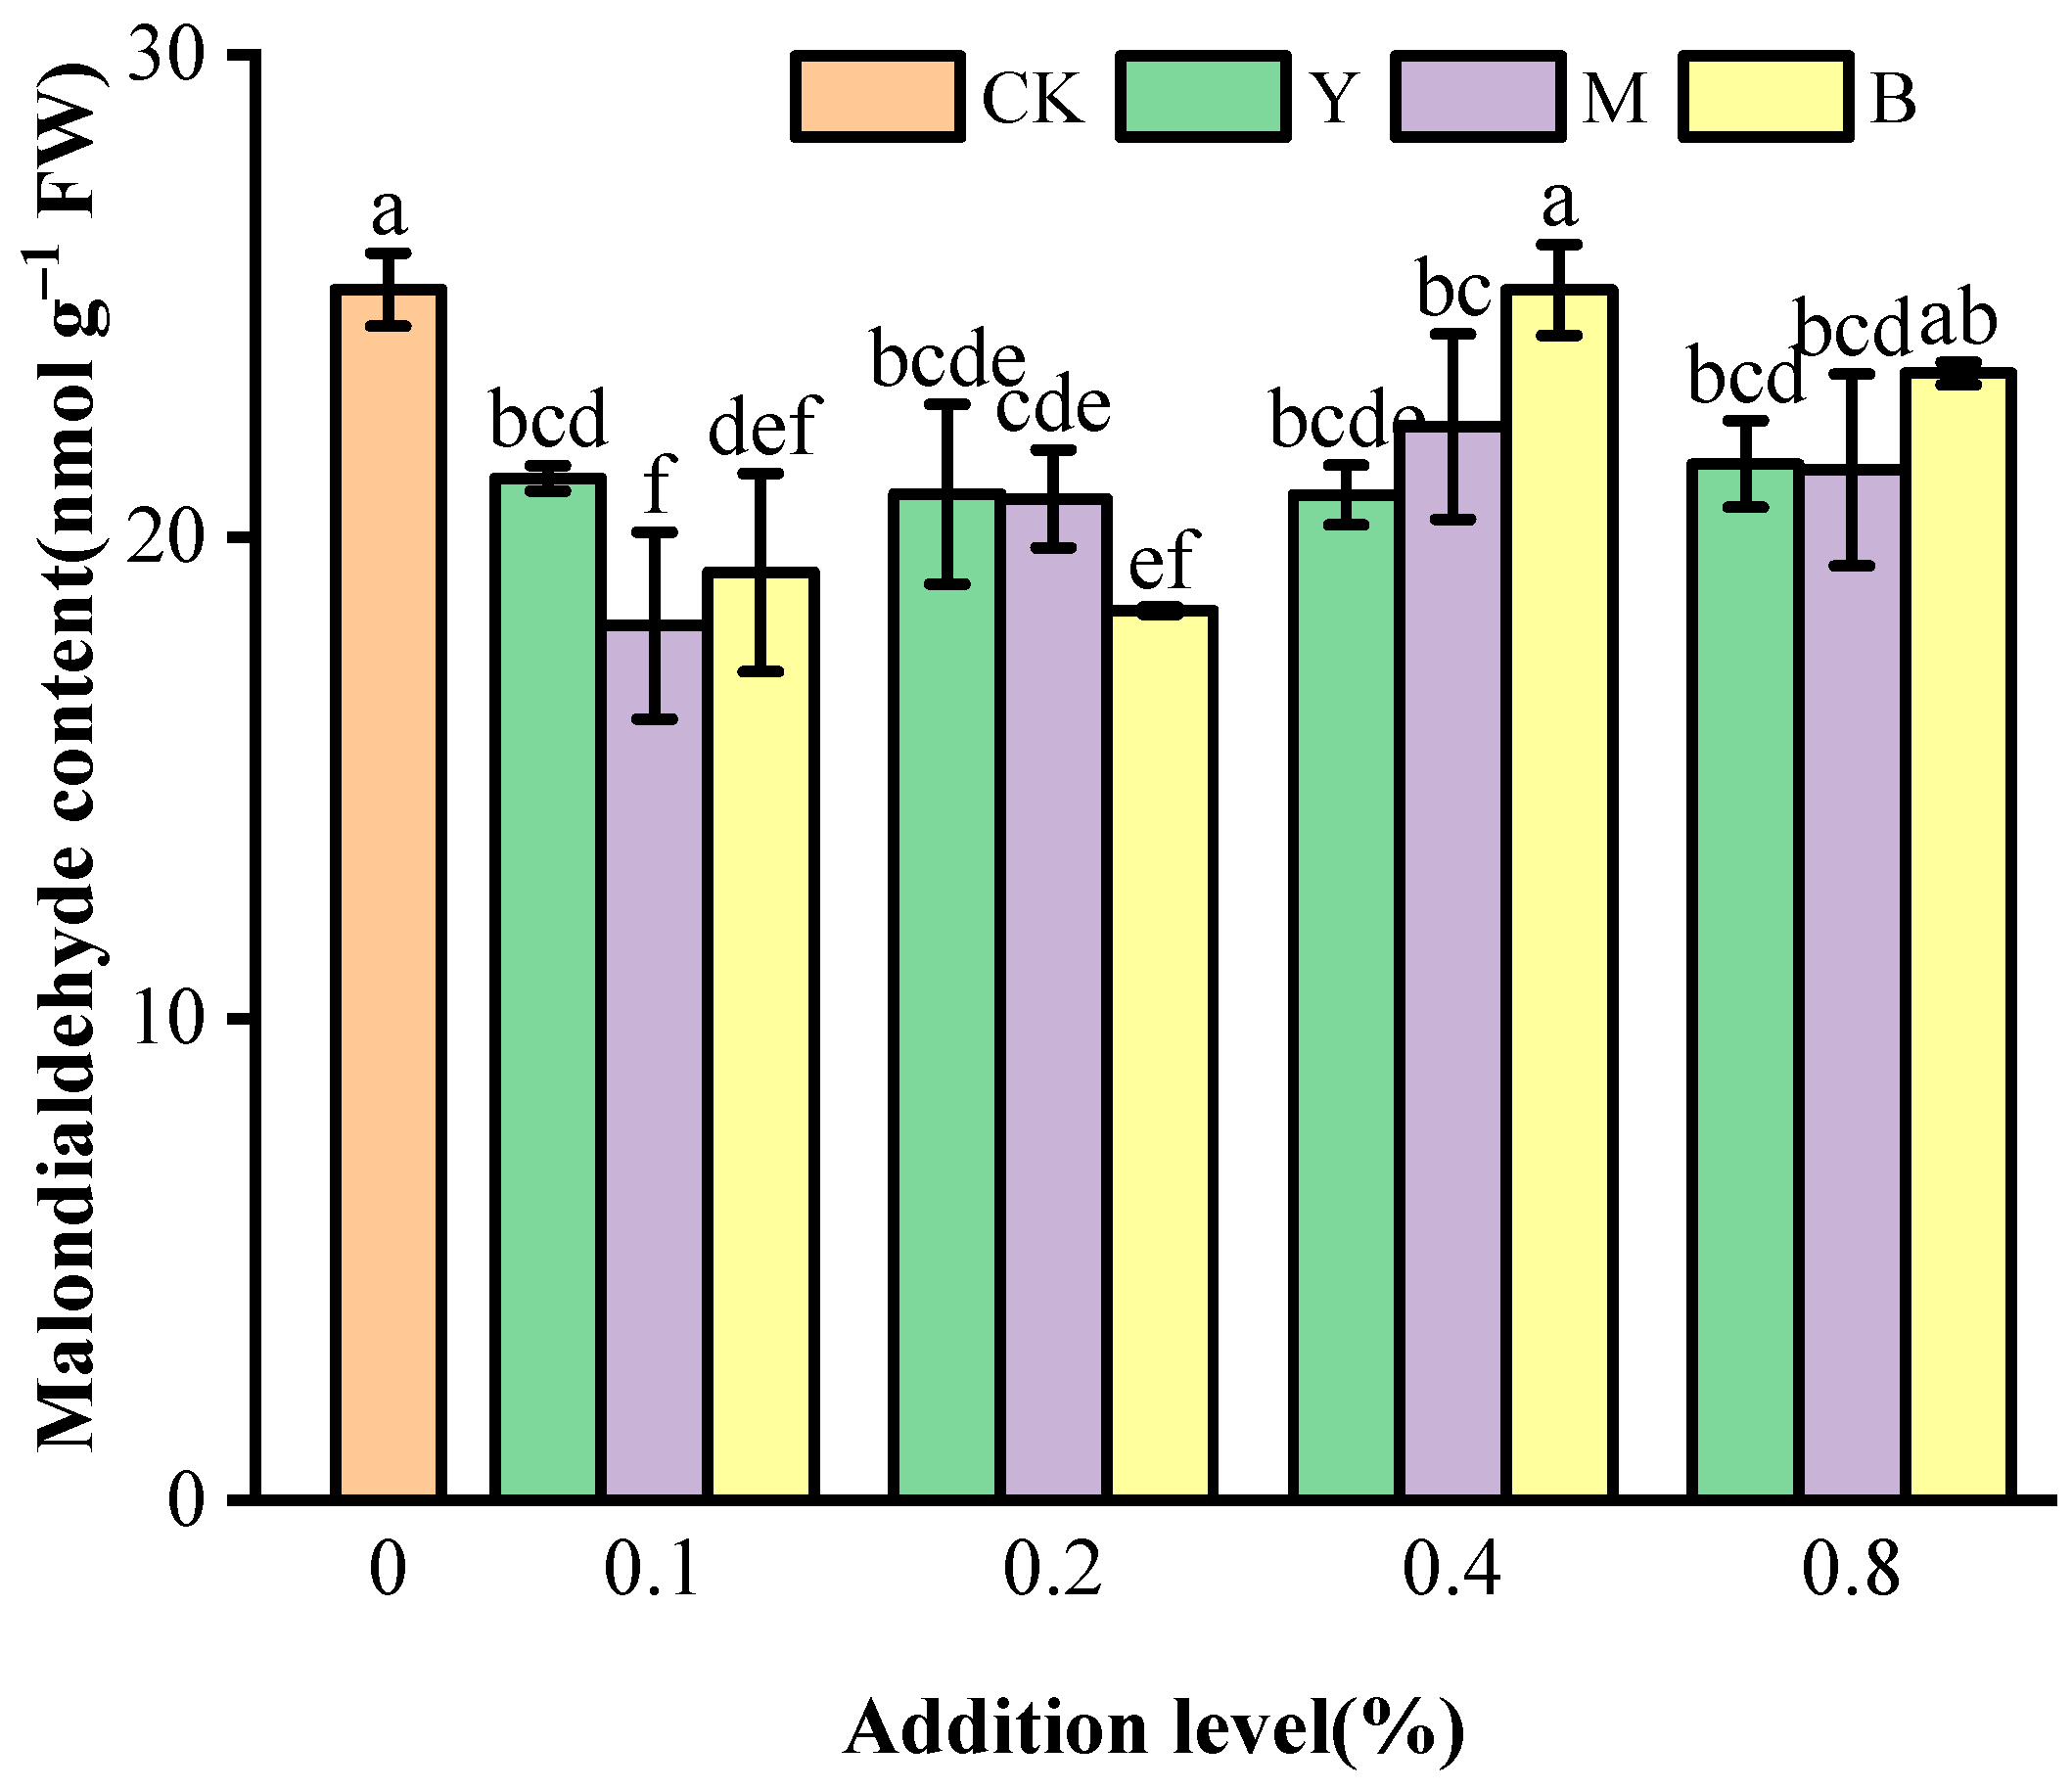
3.4. Malondialdehyde Content

Compared to CK, treatments with fine concentrate ore (Y), fine ore (M), and semi-coke (B) all resulted in a reduction in the malondialdehyde content in maize seedling leaves (Figure 4). Only the 0.4% B and 0.8% B treatments exhibited no significant difference compared to CK. Among these treatments, the Y treatment showed the greatest reduction, with a decrease of 16.96% at the 0.4% addition level. The M treatment exhibited the maximum reduction, reaching 27.73%, at the 0.1% addition level. The B treatment had the most substantial reduction, at 26.49%, at the 0.2% addition level.

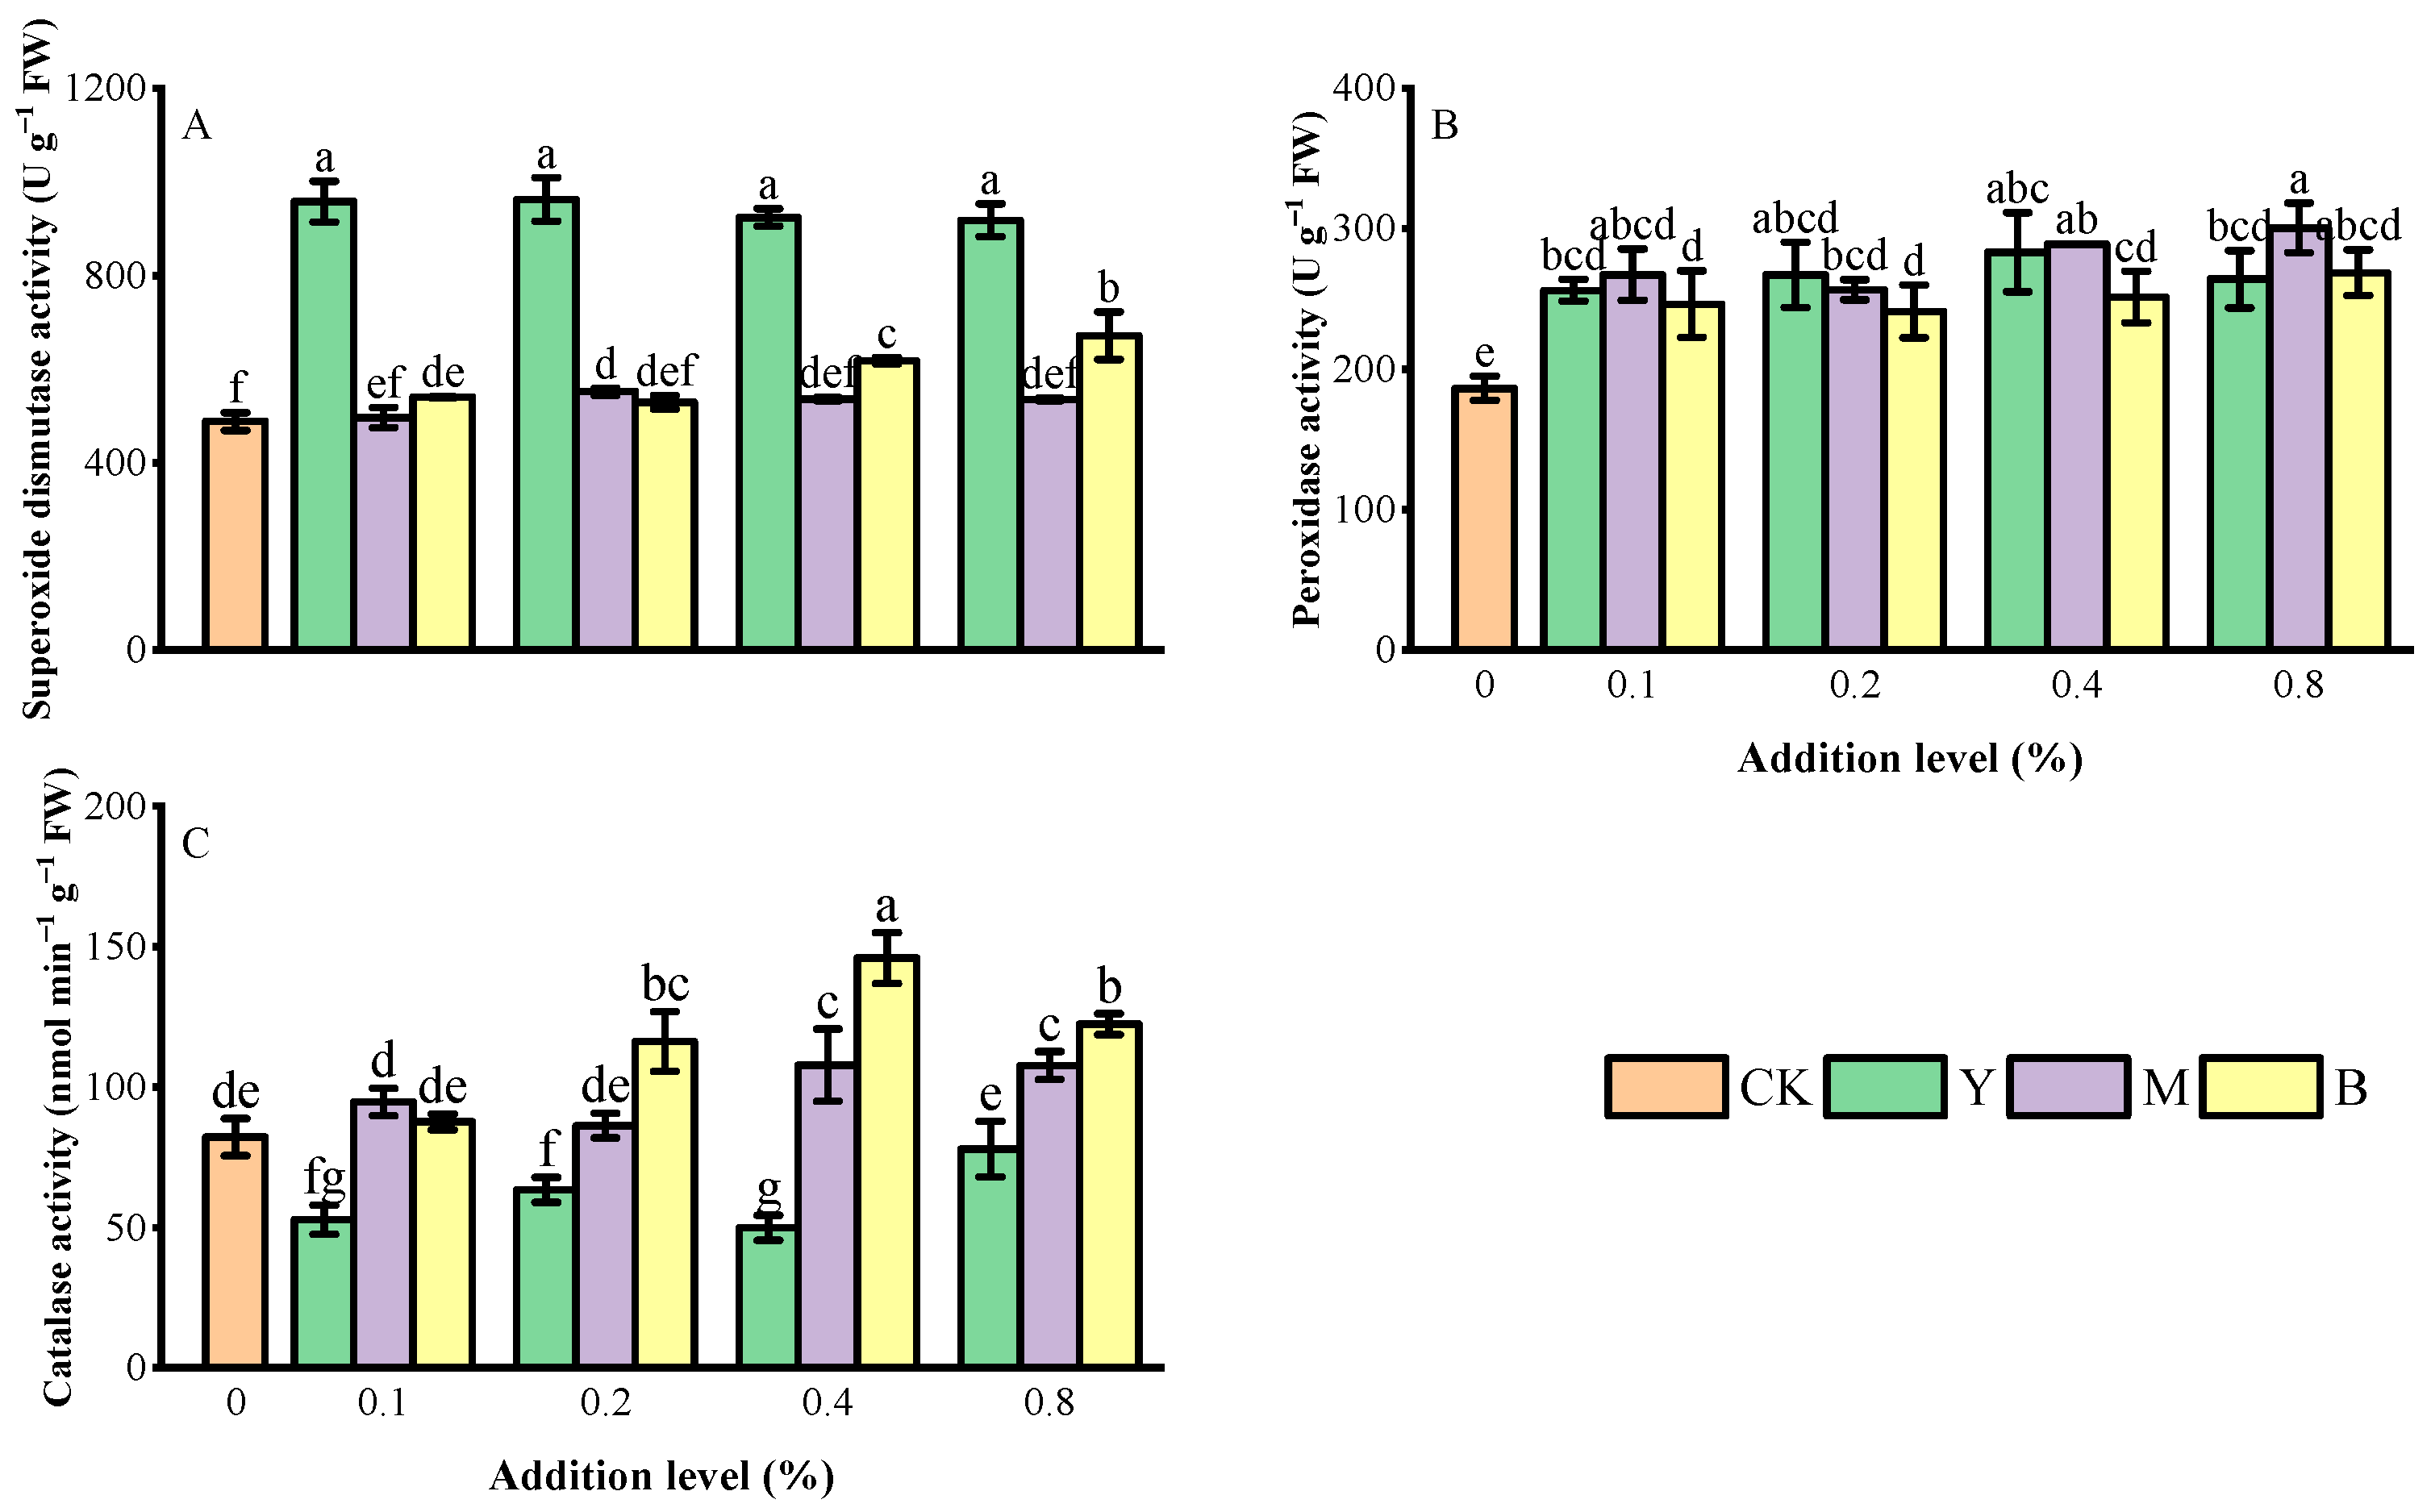
3.5. Antioxidant Enzyme Activity

The impact of treatments with fine concentrate ore (Y), fine ore (M), and semi-coke (B) on the antioxidant enzyme activity in maize seedling leaves is illustrated in Figure 5. Compared to CK, all three types of oil shale waste residues increased the activity of superoxide dismutase (SOD), particularly the Y treatment, with an increase ranging from 88.11% to 97.19%. Treatments with Y, M, and B significantly enhanced the activity of peroxidase (POD), with increases ranging from 37.45% to 51.91%, 37.67% to 61.21%, and 29.39% to 44.17%, respectively.
The impact of the three oil shale wast residues on catalase (CAT) activity varied depending on the type of waste residue. Specifically, both M and B treatments increased CAT activity compared to CK, with increases ranging from 4.98% to 30.95% and 6.48% to 77.42%, respectively. The maximum activity was achieved at the 0.4% addition level. In contrast, Y treatments decreased CAT activity compared to CK, with reductions ranging from 5.30% to 39.28%.

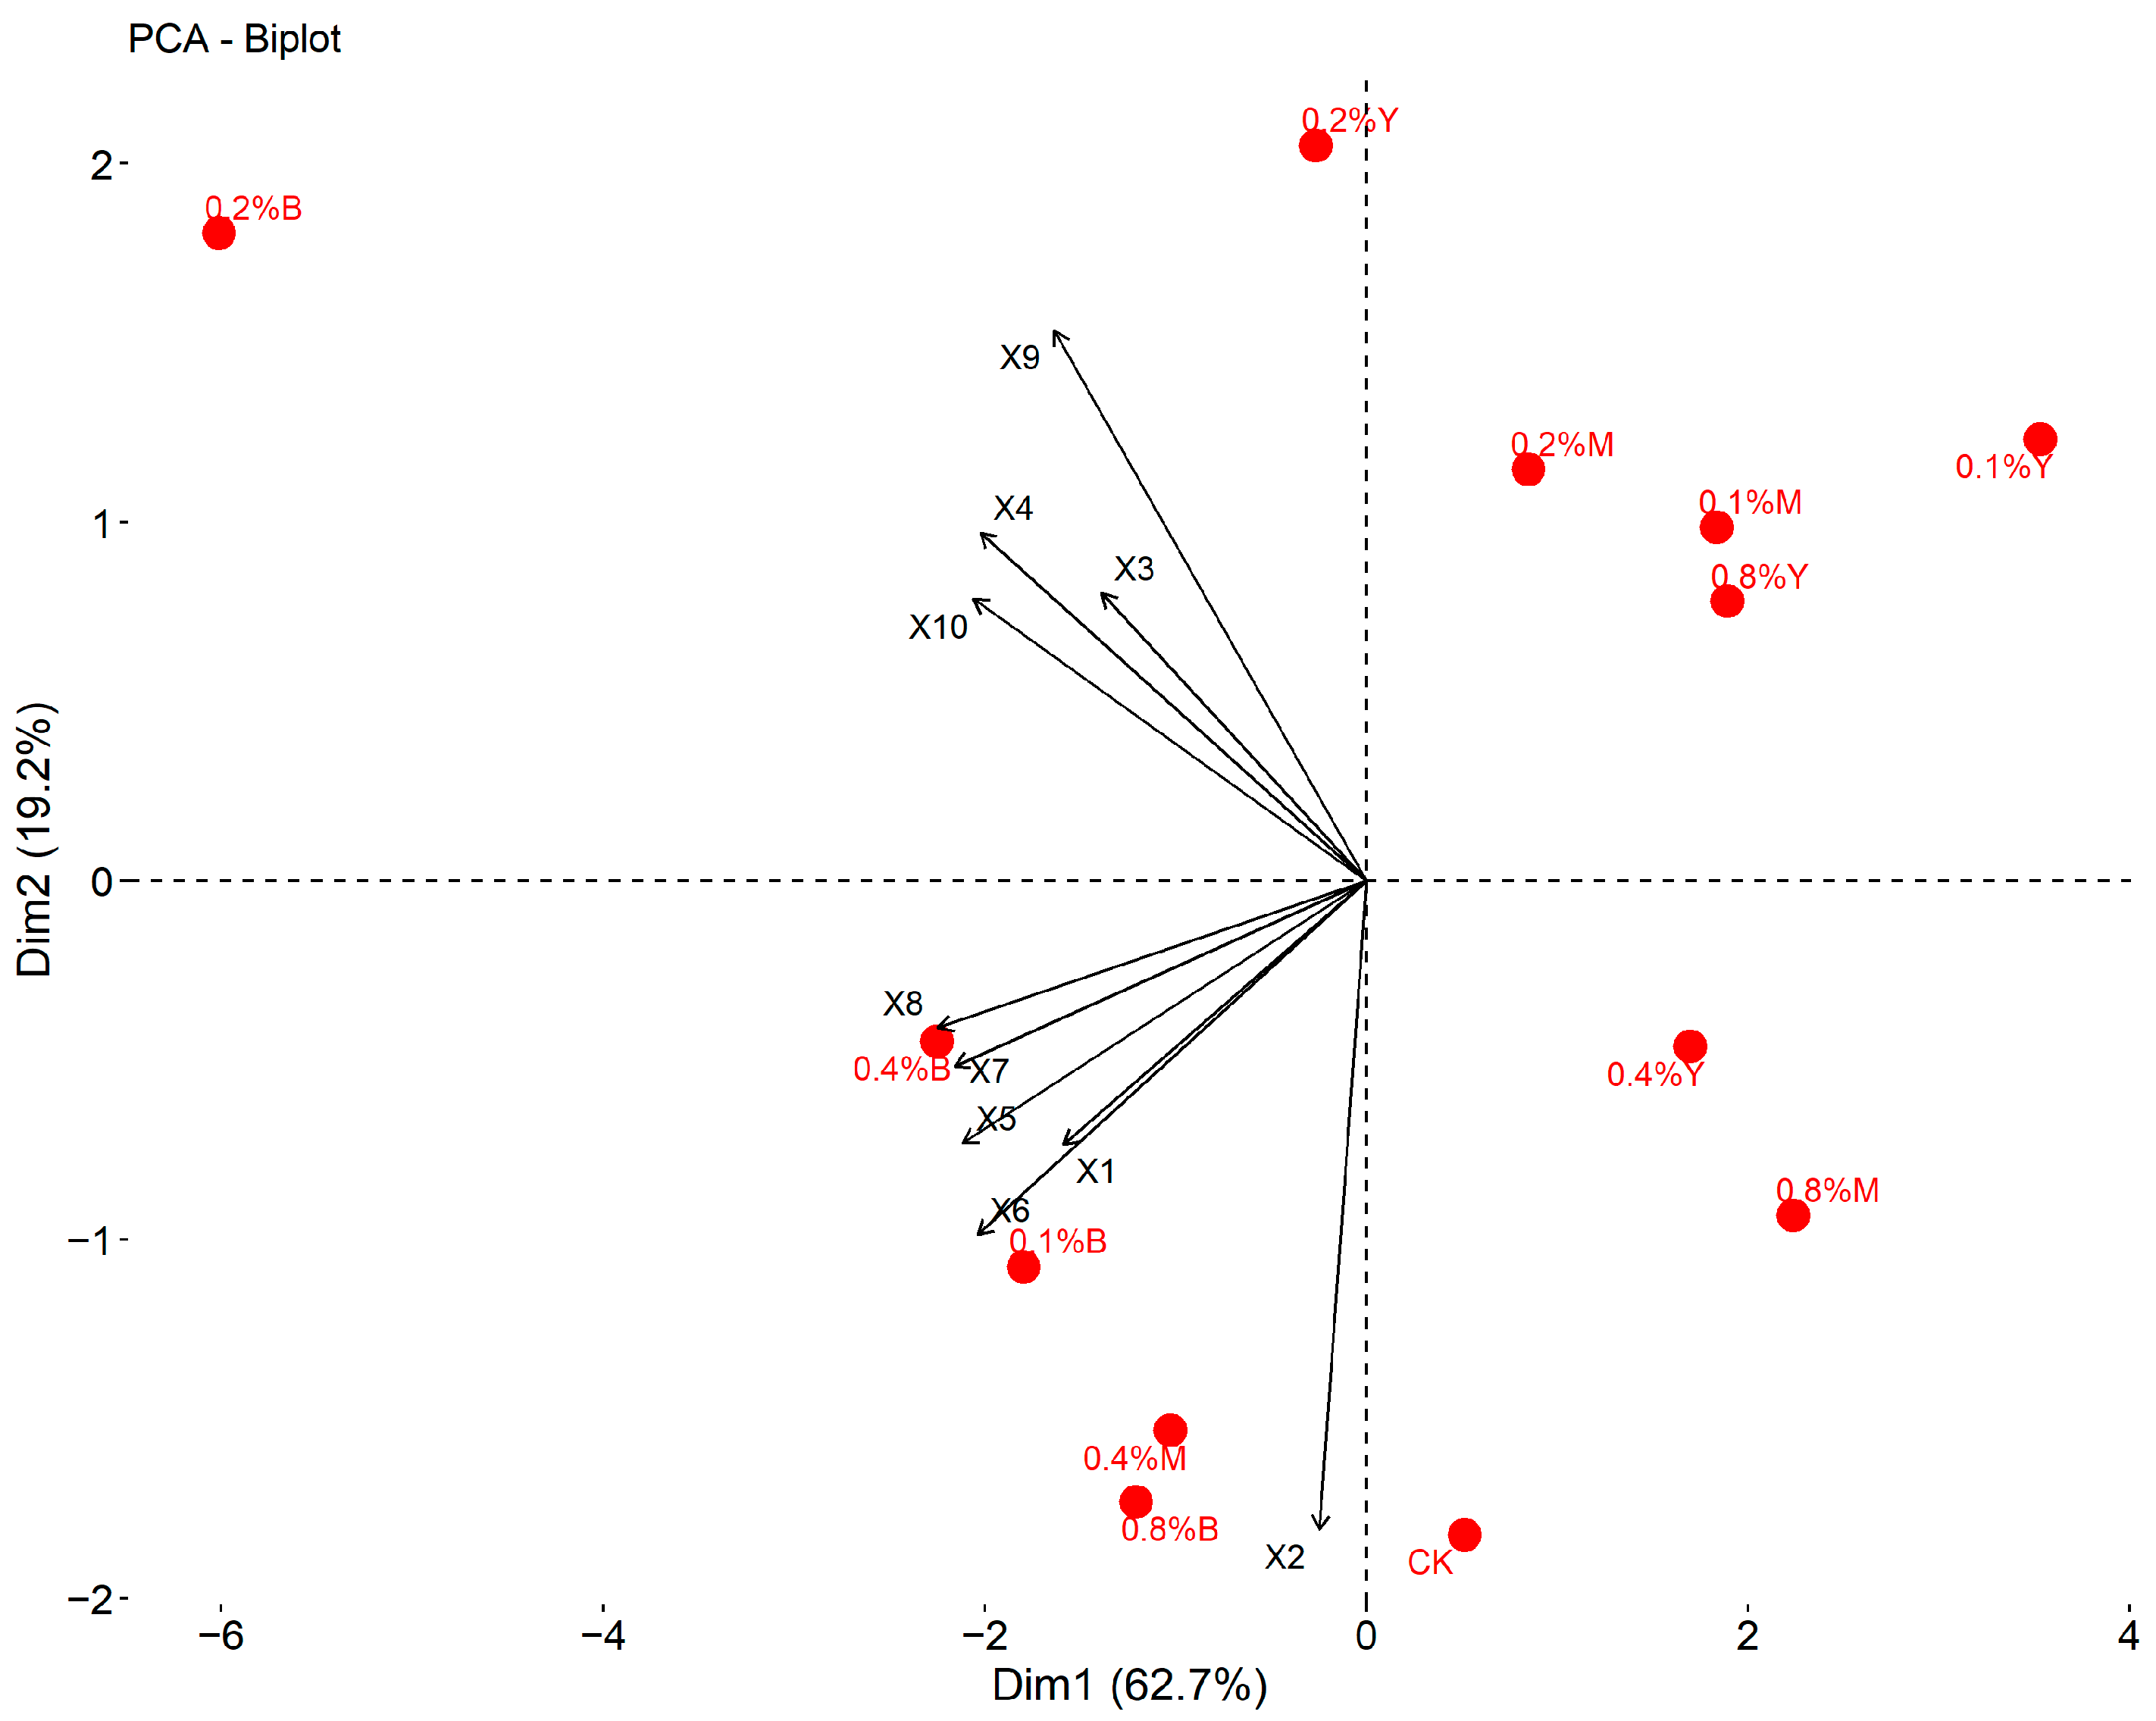
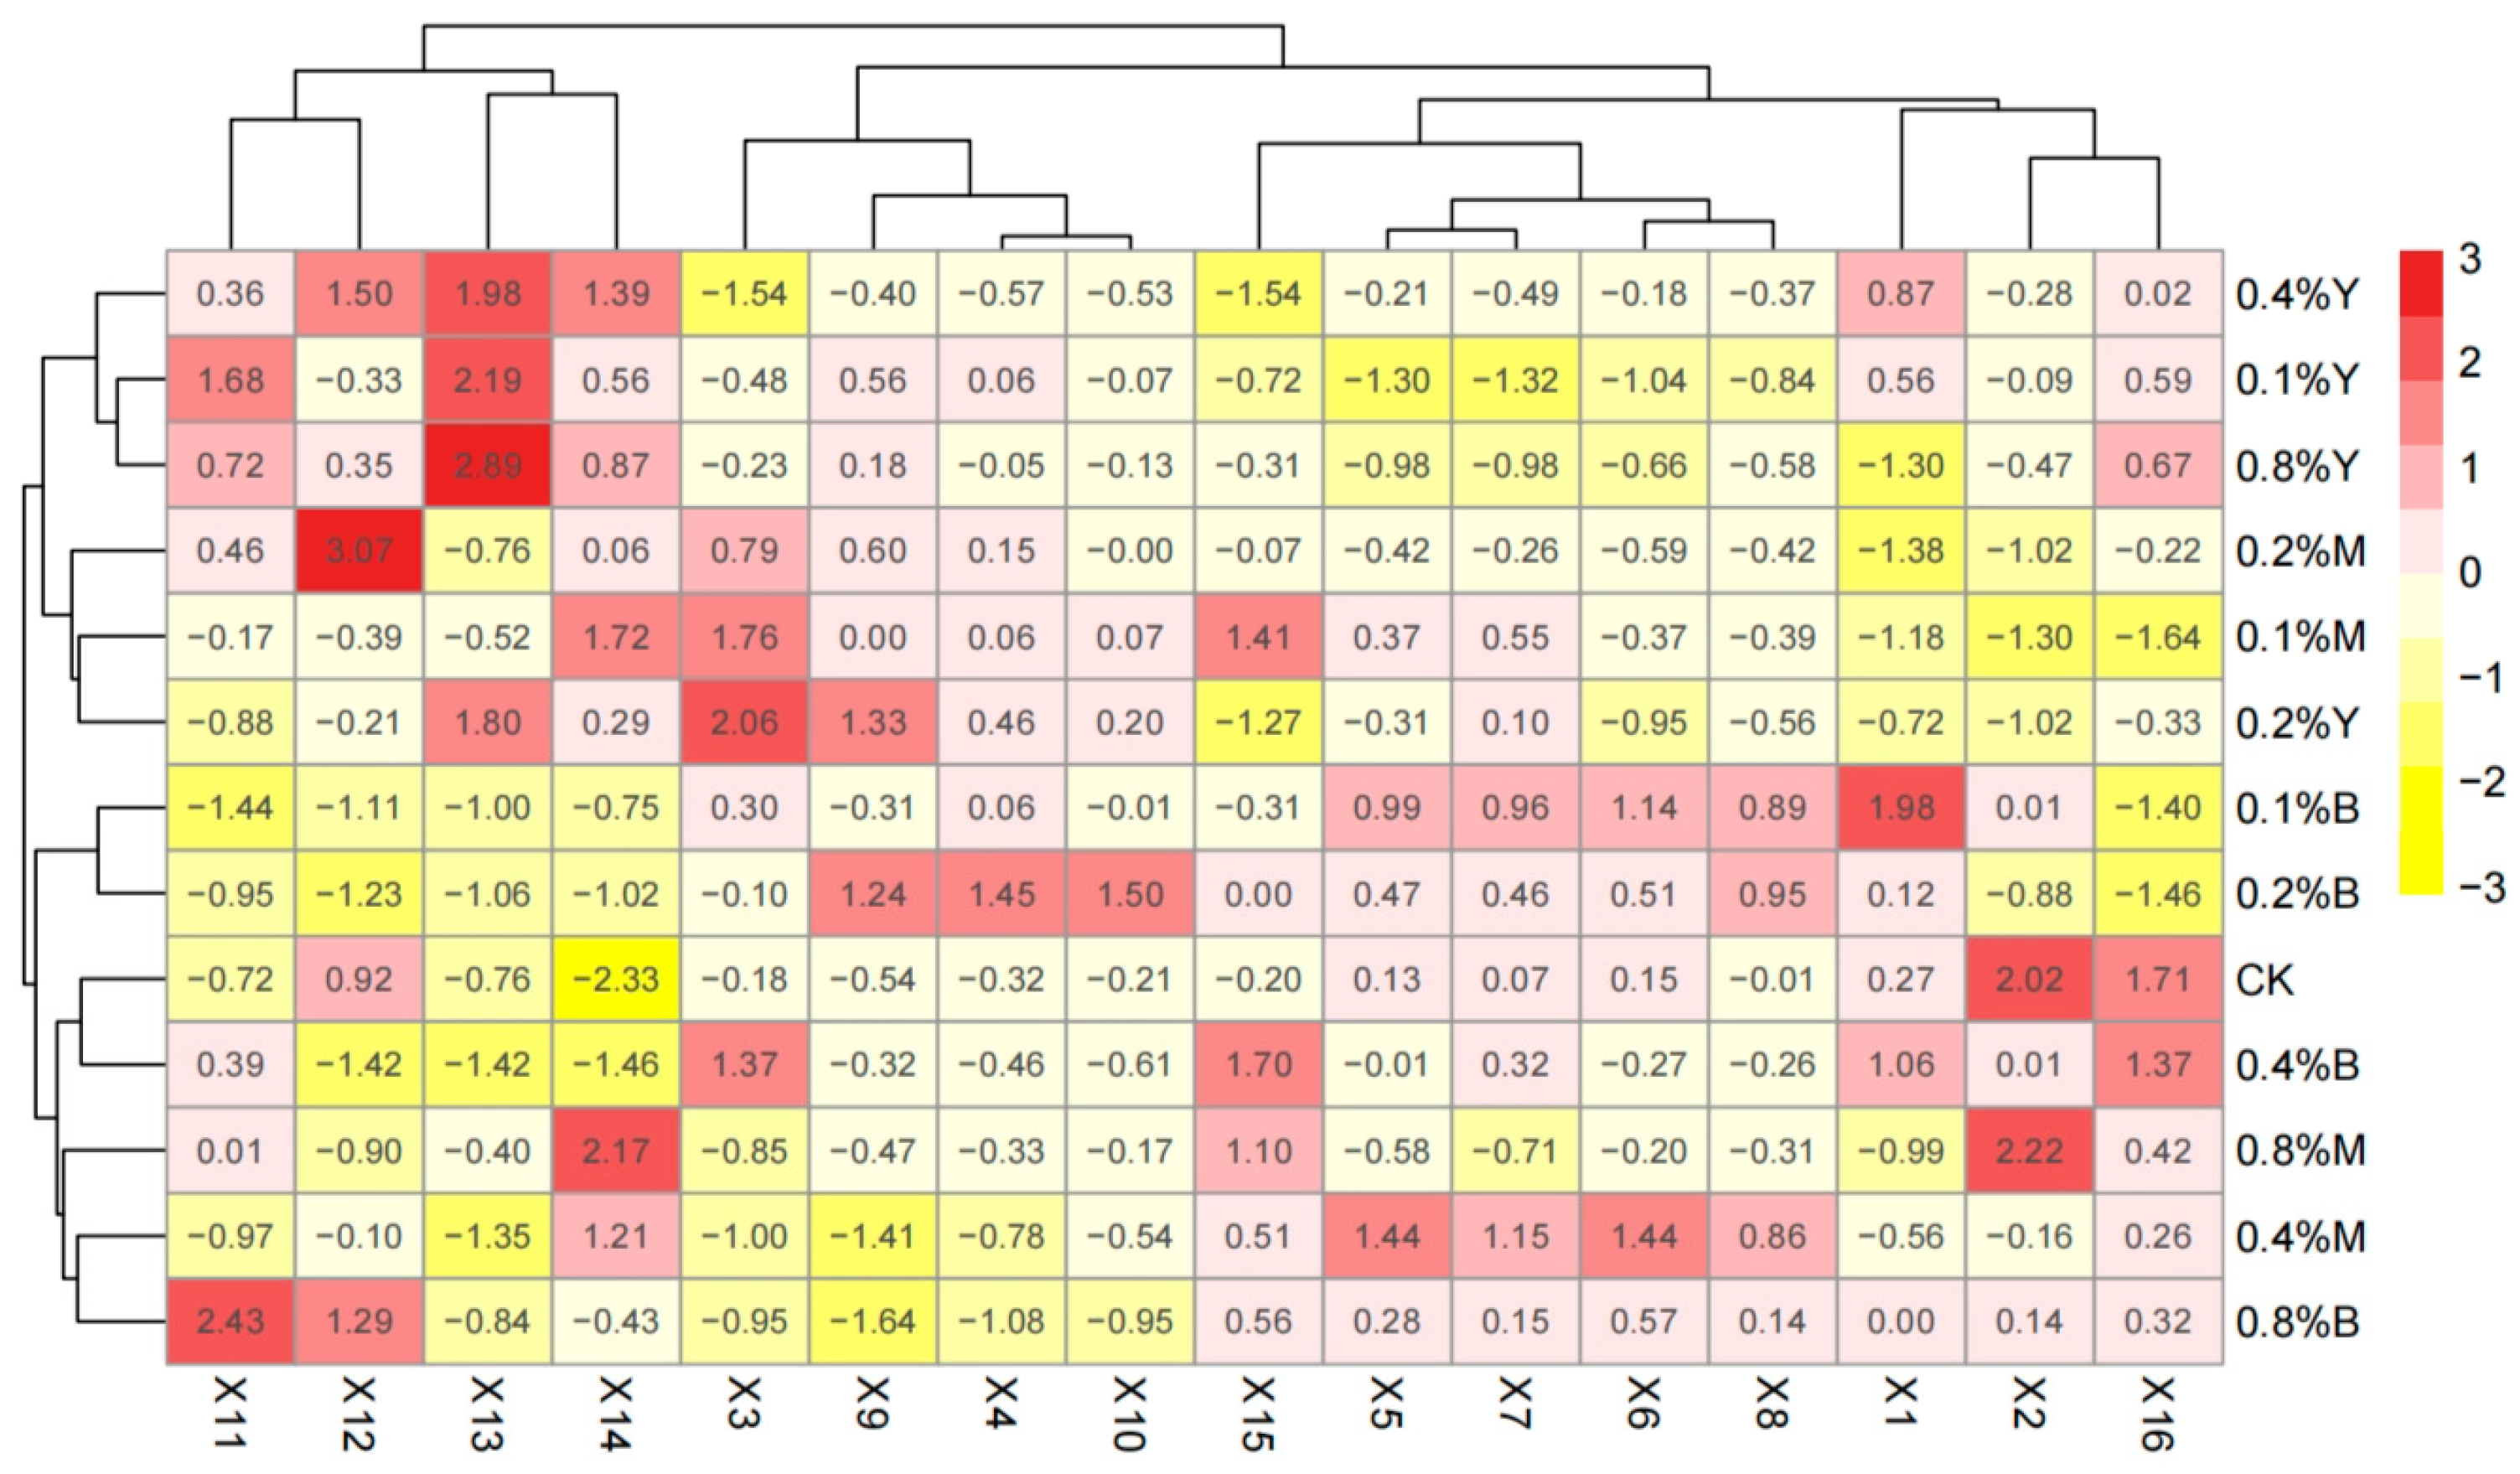
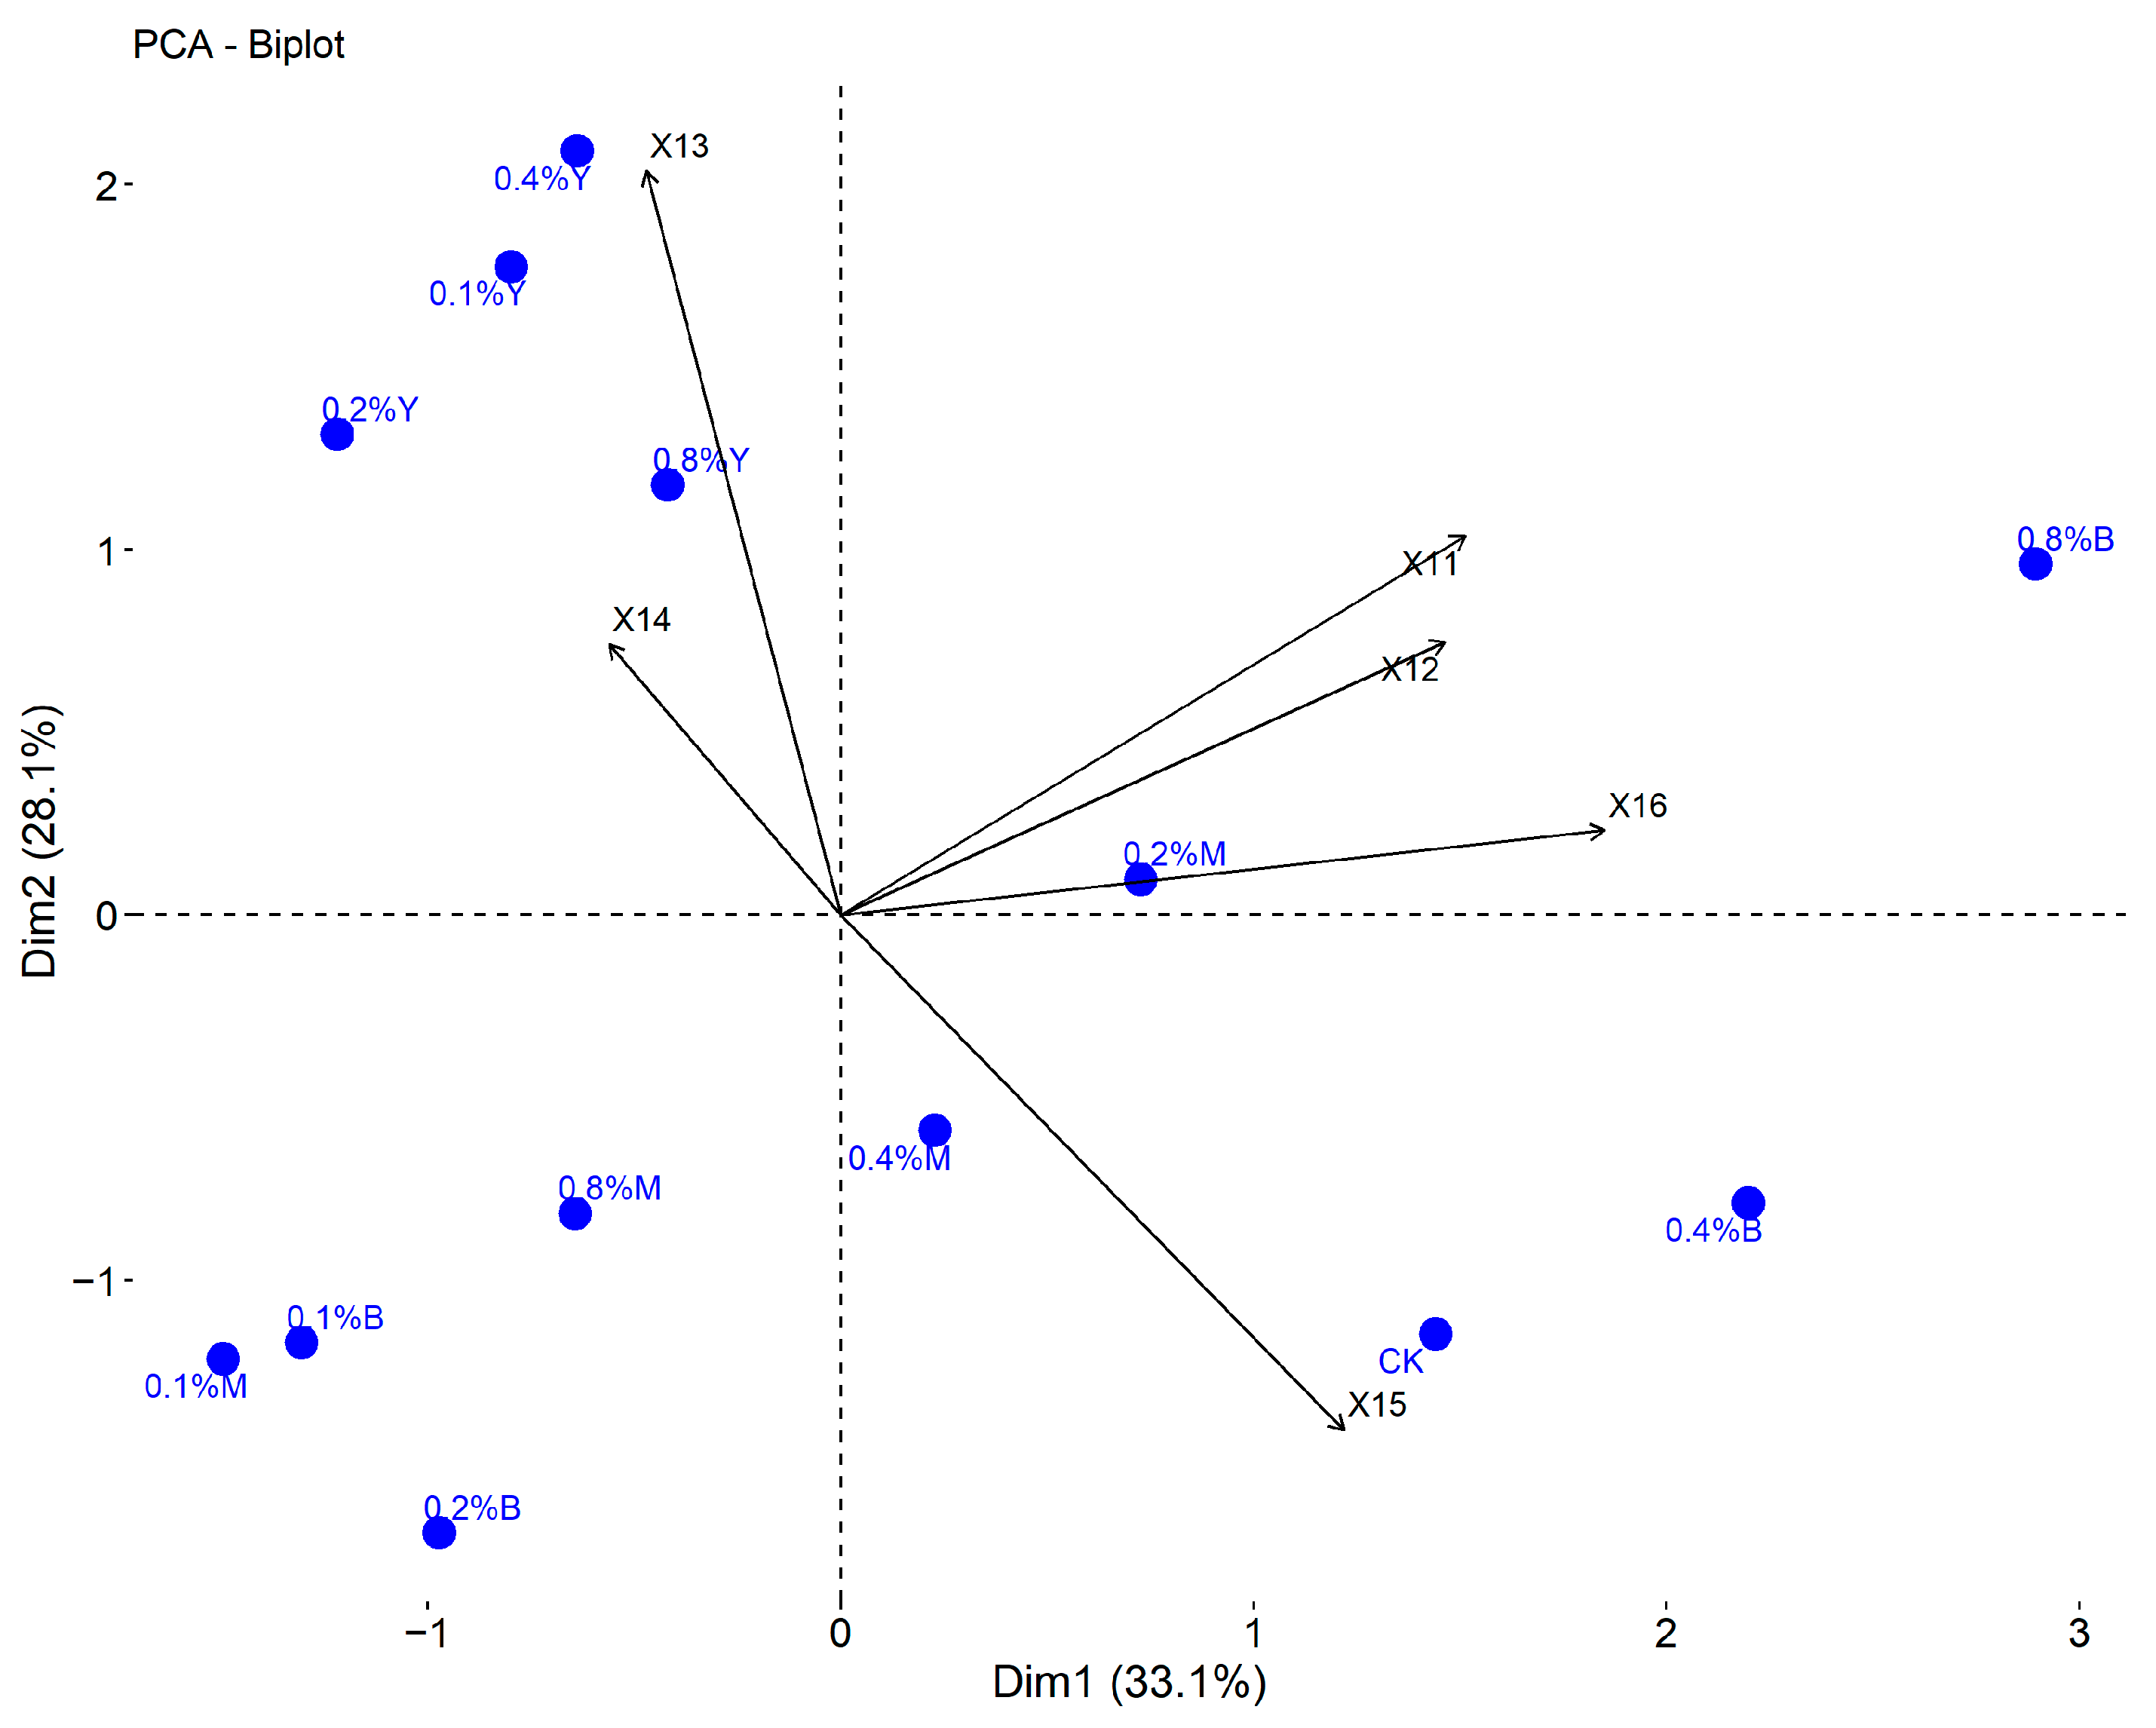
3.6. Comprehensive Evaluation

Single- and two-factor analyses of variance were conducted for the 16 indicators of maize seedlings (Table 3). The results revealed significant effects of oil shale type on growth indicators (underground fresh weight and dry weight, total fresh weight and dry weight, seedling height) and physiological–biochemical indicators (root vitality, superoxide dismutase, peroxidase, and catalase) (p < 0.05). The addition level also showed a significant impact on physiological–biochemical indicators (root vitality, proline, superoxide dismutase, peroxidase, catalase, and malondialdehyde) (p < 0.05), and there was a significant interaction between type and addition level for physiological–biochemical indicators (root vitality, proline, superoxide dismutase, catalase, and malondialdehyde) (p < 0.05).
Through clustering heatmap analysis of 16 indicators in maize seedlings subjected to different treatments (Figure 6), the research results reveal similarities among different indicators and demonstrate a feature of coordinated regulation. A principal component biplot was drawn for physiological and biochemical indicators and treatments (Figure 7), indicating a certain connection among indicators X11 to X16. Therefore, these findings suggest overlap and intertwining, revealing that individual indicator parameters have different effects on alleviating salt stress in maize seedlings. Thus, principal component analysis was employed to reanalyze the 16 indicators.
Using SPSS 26.0 software for the 16 indicators of maize seedlings, the Kaiser–Meyer–Olkin (KMO) value for validity testing was 0.850. The first four composite indicator contribution rates were 43.707%, 19.009%, 9.603%, and 8.499%, with a cumulative contribution rate of 80.818% (Table 4). Eigenvalues greater than 1 were selected, and the first four principal components were chosen as the main factors for the comprehensive evaluation of salt stress relief. The criterion was that the eigenvalues of these principal components were >1, and the cumulative variance contribution rate was >80%. The analysis of characteristic vectors for different composite indicators showed that in Principal Component 1 (Table 5), total dry weight (X8), total fresh weight (X7), aboveground fresh weight (X5), aboveground dry weight (X6), seedling vigor index (X10), and underground dry weight (X4) had relatively high contribution rates, namely 0.969, 0.943, 0.927, 0.9, 0.854, and 0.83, respectively. In Principal Component 2, malondialdehyde (X16) and stem width (X2) had relatively high contribution rates, namely 0.828 and 0.777. In Principal Component 3, root vitality (X11), and superoxide dismutase (X13) had relatively high contribution rates, namely 0.704 and 0.682. In Principal Component 4, peroxidase (X14) had a relatively high contribution rate of 0.886.
The first principal component is:
F1 = 0.252X1 + 0.074X2 + 0.224X3 + 0.314X4 + 0.351X5 + 0.340X6 + 0.357X7 + 0.366X8 + 0.240X9 + 0.323X10 − 0.023X11 − 0.018X12 − 0.198X13 − 0.108X140.262X15 − 0.002X16
The second principal component is:
F2 = 0.116X1 + 0.446X2 − 0.115X3 − 0.268X4 + 0.103X5 + 0.151X6 + 0.072X7 + 0.021X8 − 0.363X9 − 0.235X10 + 0.253X11 + 0.318X12 − 0.173X13 − 0.086X14 + 0.221X15 + 0.475X16
The third principal component is:
F3 = 0.228X1 − 0.203X2 + 0.174X3 + 0.120X4 − 0.056X5 − 0.066X6 − 0.019X7 − 0.008X8 + 0.248X9 + 0.072X10 + 0.568X11 + 0.316X12 + 0.550X13 − 0.014X14 − 0.090X15 + 0.232X16
The fourth principal component is:
F4 = −0.127X1 − 0.232X2 − 0.153X3 − 0.081X4 + 0.143X5 + 0.174X6 + 0.102X7 + 0.104X8 − 0.157X9 − 0.056X10 + 0.311X11 + 0.008X12 − 0.009X13 + 0.760X14 + 0.259X15 − 0.245X16
According to the variance contribution analysis, the first principal component accounts for 43.707%, the second principal component accounts for 19.009%, the third principal component accounts for 9.603%, and the fourth principal component accounts for 8.449%. Combining the principal component coefficients and their corresponding variance contribution rates, a comprehensive evaluation formula is established as F = 43.707F1 + 19.009F2 + 9.603F3 + 8.449F4. Through the evaluation formula, comprehensive scores for the three types of oil shale waste residues and their four addition levels on salt-affected soil maize seedlings can be obtained (Table 6). Based on the comprehensive scores, the alleviation effects are ranked as B2 > B3 > B4 > M3 > B1 > CK. This implies that semi-coke at addition levels of 0.1% to 0.4% and 0.4% fine ore treatment exhibit a mitigating effect on salt stress, while the other treatments do not show a significant alleviation effect.

4. Discussion

Salt stress negatively impacts various growth indicators of maize seedlings, including seedling height, leaf number, leaf area, and the fresh and dry weights of both aboveground and underground parts [9,25,26,27]. Similar salt-induced damage has been reported in other crops such as tomatoes [10], rapeseed [28], wheat [29], cotton [11], and clover [30]. Our research results indicate that the influence of oil shale waste residues on various growth indicators of maize seedlings is affected by the type and concentration of the waste residues. Specifically, the application of oil shale waste residues exhibits significant differences, particularly in biomass accumulation (Table 2 and Table 3). Among the three types of oil shale waste residues, the semi-coke treatment increased the plant height and biomass of maize seedlings, especially at the 0.2% semi-coke addition level, where the effect was most pronounced. Additionally, the root/shoot ratio and seedling vigor index also increased. Consistent with the results of Kul et al. [10]’s principal component analysis, growth indicators are located on the left side of the quadrant, indicating that biochar treatment, beneficial for alleviating salt stress, also falls on the left side, while the salt-treated control is located in the lower-right quadrant. Similarly, our semi-coke treatment and growth indicators are both on the left side of the quadrant. Therefore, the semi-coke treatment is beneficial for alleviating salt stress. This is attributed to the organic-rich content of semi-coke, which has higher nutrient levels than other additives, sustaining nutrient supply. This conclusion aligns with Guan et al. [31]’s findings in their study on the use of low-grade oil shale for wind-blown soil improvement, where the impact on oat growth was consistent.
The root system is the earliest part of plants to perceive salt stress, and root vitality is a crucial indicator for assessing the health of roots. Previous research has indicated that salt stress significantly reduces the root vitality of plant seedlings, such as in rice [32], rapeseed [28], and clover [30]. Additionally, the application of biochar improves the growth environment for roots, enhances soil porosity, reduces bulk density, and positively influences the morphological development of plant roots, including root length, surface area, density, and ultrastructure [33,34]. The application of biochar significantly enhances root vitality, alleviating nutrient and water uptake deficiencies in plants. These studies emphasize root improvement rather than simply increasing biomass accumulation [34,35]. Similar to biochar, oil shale waste residues exhibit similar physical and chemical characteristics, featuring a porous structure and high specific surface area [13]. Past research findings support our perspective that the three types of oil shale waste residue treatments contribute to enhancing the root vitality of maize seedlings. Salt stress lowers soil osmotic pressure, even below the 100 MPa of plant cells [8]. In such conditions, plants tend to undergo an increase in osmoprotectants, such as proline, to reduce cell water potential and enhance the absorption capacity of soil moisture [35]. Previous studies have indicated that salt stress increases the proline content in maize seedlings [9,36,37,38]. However, the addition of the three types of oil shale waste residues seems to alleviate salt stress, subsequently reducing the proline content in maize seedlings. We speculate that semi-coke, by increasing soil water retention capacity and sodium adsorption capability, contributes to stress mitigation [13]. This effect is similar to the action of biochar, which reduces osmotic stress by increasing soil water content and releasing mineral nutrients, thereby lowering the proline content in plant tissues [39,40].
Salt stress disrupts physiological processes in plants, particularly triggering oxidative damage. The accumulation of reactive oxygen species (ROS) is a primary cause of reduced crop productivity, adversely affecting various cellular functions such as nucleic acids, proteins, and lipids. Excessive ROS damages cell membranes, increases electrolyte leakage, and reduces membrane stability, leading to the accumulation of membrane lipid peroxidation products, such as malondialdehyde (malondialdehyde) [10,11,36,37,41]. Previous studies have reported an increase in malondialdehyde content in maize seedlings under salt stress [9,37,38]. One study, for instance, indicated that when the salt (NaCl) concentration was 100 mM, the malondialdehyde content in maize seedlings increased by 310.9% compared to the control [42]. Similar results have been reported in cotton [11], rapeseed [28], tomatoes [10], and wheat [29]. However, all three types of oil shale waste residue treatments reduced malondialdehyde content compared to the control, suggesting the potential alleviation of oxidative damage to cell membranes.
The enzymatic antioxidant system in plants, including superoxide dismutase (SOD), peroxidase (POD), and catalase (CAT), plays a crucial role in mitigating stress-induced ROS accumulation [10,11,28,29,38,43]. Superoxide dismutase (SOD) acts as the “first line of defense” in plants against oxidative damage by converting superoxide radicals into H2O2 and molecular oxygen, which are then transformed into water by POD and CAT [43]. Previous studies have indicated that salt stress increases SOD, POD, and CAT in maize seedlings [42]. In this study, treatments with final ore and semi-coke had significant positive effects on SOD, POD, and CAT, while fine concentrate ore had positive effects on SOD and POD, especially SOD, but a negative effect on CAT. Maize seedlings with higher SOD, POD, and CAT activities help in the removal or reduction of ROS, providing better growth conditions [9,37]. In this study, semi-coke treatment enhanced antioxidant enzyme activity and showed higher biomass. This aligns with previous research using biochar treatment, which enhanced the activities of SOD, POD, and CAT in plants, reducing oxidative damage [29]. Therefore, the above results support the conclusion that all three types of oil shale waste residues activate antioxidant enzyme activity, alleviating oxidative damage to cell membranes caused by salt stress.
The stress resistance of plants is a complex process regulated by multiple genes, and evaluating salt tolerance based on a single indicator appears to be simplistic. In this study, the principal component synthesis evaluation method was employed, revealing that semi-coke treatment ranked higher than the control treatment. This indicates that semi-coke treatment helps improve the growth of maize seedlings in saline–alkali soil. Additionally, considering the proportion of each indicator in the principal components, our results support that a reduction in biomass is one of the main reasons for the poor growth of maize [36]. Given the effectiveness of semi-coke treatment in alleviating salt stress, three potential mechanisms are speculated: (1)semi-coke leads to an improvement in the root growth environment, (2) semi-coke has strong water retention capabilities, aiding in diluting salts and reducing osmotic pressure, and (3) semi-coke is rich in mineral nutrients beneficial for plant growth. Based on the results of the pot experiments, we recommend an application rate in the field ranging from 30 to 90 tons per hectare. However, the actual effects may vary under field conditions. Therefore, we plan to conduct field verification in further studies to determine the optimal application rate. Future research will delve into the molecular and soil characteristics influenced by biochar on maize seedlings, providing a more comprehensive understanding of the deeper benefits of biochar under saline–alkali conditions for maize seedlings.

5. Conclusions

This study suggests that among the three types of oil shale waste residue added to saline–alkali soil, semi-coke treatment may be an effective method to alleviate salt stress and mitigate salt damage to corn seedlings. When semi-coke treatment is applied to moderately saline–alkali soil, it enhances the root vitality of corn seedlings, reduces root osmotic stress, and increases the activity of leaf superoxide dismutase (8.38~37.55%), peroxidase (29.39~44.17%), and catalase (6.48~77.42%). This treatment also slows down the degree of cell membrane lipid peroxidation (0.02~26.49%), thereby improving the vigor index of corn seedlings under salt stress (17.39~182.61%), with the most optimal effect observed at a 0.2% addition rate. This research not only holds the promise of providing new insights for increasing crop yield in saline–alkali soil, but also offers an innovative approach to balancing the relationship between global food demand and soil health. By gaining a deeper understanding of the potential value of oil shale waste residue in agriculture, there is an opportunity to achieve sustainable utilization of this resource, providing a sustainable solution for future food production in saline–alkali areas.

Author Contributions

Conceptualization, J.H. and T.Q.; Methodology, A.M.; Software, Z.D.; Validation, J.H., Z.D. and T.Q.; Formal analysis, A.M.; Investigation, C.G.; Resources, C.G.; Data curation, A.M.; Writing—original draft, J.H. and Z.D.; Writing—review & editing, T.Q. and C.G.; Visualization, Z.D.; Supervision, J.H. and T.Q.; Project administration, J.H.; Funding acquisition. All authors have read and agreed to the published version of the manuscript.

Funding

This study received funding from the National Key Research and Development Program (2021YFD1900802), the Major Special Project of Xinjiang Uygur Autonomous Region (2022A02007-1) and the Xinjiang Province Key Research and Development Project (2023B02002-2).

Data Availability Statement

The data is contained within the article.

Acknowledgments

We appreciate and thank the anonymous reviewers for providing helpful comments that led to an overall improvement in the manuscript. We also thank the Journal Editor Board for their help and patience throughout the review process.

Conflicts of Interest

The authors declare no conflicts of interest.

References

  1. Alkharabsheh, H.M.; Seleiman, M.F.; Hewedy, O.A.; Battaglia, M.L.; Jalal, R.S.; Alhammad, B.A.; Schillaci, C.; Ali, N.; Al-Doss, A. Field crop responses and management strategies to mitigate soil salinity in modern agriculture: A review. Agronomy 2021, 11, 2299. [Google Scholar] [CrossRef]
  2. Ahmad, I.; Zhu, G.L.; Zhou, G.S.; Younas, M.U.; Suliman, M.S.E.; Liu, J.; Zhu, Y.M.; Salih, E.G.I. Integrated approaches for increasing plant yield under salt stress. Front. Plant Sci. 2023, 14, 1215343. [Google Scholar] [CrossRef]
  3. Zhang, L. Analysis and countermeasure research on saline-alkali land change in Xinjiang irrigation area in recent 20 years. Water Resour. Dev. Manag. 2020, 6, 72–76. [Google Scholar] [CrossRef]
  4. Cao, Y.B.; Zhou, X.Y.; Song, H.F.; Zhang, M.; Jiang, C.F. Advances in deciphering salt tolerance mechanism in maize. Crop J. 2023, 11, 1001–1010. [Google Scholar] [CrossRef]
  5. Li, X.; Shi, X.S.; Lu, M.Y.; Zhao, Y.Z.; Guo, R.B.; Peng, H. Improved nitrogen conservation capacity during composting of dairy manure amended with oil shale semi-coke as the porous bulking agent. J. Hazard. Mater. 2020, 388, 121742. [Google Scholar] [CrossRef] [PubMed]
  6. Wang, S.; Jiang, X.M.; Han, X.X.; Tong, J.H. Investigation of Chinese oil shale resources comprehensive utilization performance. Energy 2012, 42, 224–232. [Google Scholar] [CrossRef]
  7. Zhang, Y.R.; Chen, L.H.; Aisha, N. The development and utilization and broad prospects of Xinjiang shale oil. Mod. Che. Res. 2022, 8, 121–123. [Google Scholar]
  8. Jing, W.H.; Liu, H.; Zhang, P.; Xu, J.L. An experimental study on agricul tural utilization of shale oil industrial solid waste. J. Beijing Norm. Univ. (Nat. Sci.) 2001, 2, 260–265. [Google Scholar] [CrossRef]
  9. Abdel Latef, A.A.H.; Abu Alhmad, M.F.; Kordrostami, M.; Abo–Baker, A.-B.A.-E.; Zakir, A. Inoculation with Azospirillum lipoferum or Azotobacter chroococcum reinforces maize growth by improving physiological activities under saline conditions. J. Plant Growth Regul. 2020, 39, 1293–1306. [Google Scholar] [CrossRef]
  10. Kul, R.; Arjumend, T.; Ekinci, M.; Yildirim, E.; Turan, M.; Argin, S. Biochar as an organic soil conditioner for mitigating salinity stress in tomato. Soil Sci. Plant Nutr. 2021, 67, 693–706. [Google Scholar] [CrossRef]
  11. Keya, S.S.; Mostofa, M.G.; Rahman, M.M.; Das, A.K.; Sultana, S.; Ghosh, P.K.; Anik, T.R.; Ahsan, S.; Rahman, M.A.; Jahan, N. Salicylic Acid Application Improves Photosynthetic Performance and Biochemical Responses to Mitigate Saline Stress in Cotton. J. Plant Growth Regul. 2023, 42, 1–14. [Google Scholar] [CrossRef]
  12. Hasanuzzaman, M.; Raihan, M.R.H.; Khojah, E.; Samra, B.N.; Fujita, M.; Nahar, K. Biochar and chitosan regulate antioxidant defense and methylglyoxal detoxification systems and enhance salt tolerance in jute (Corchorus olitorius L.). Antioxidants 2021, 10, 2017. [Google Scholar] [CrossRef] [PubMed]
  13. Li, X.; Shi, X.S.; Lu, M.Y.; Guo, R.B.; Feng, Q. Improved fertilization efficiency of manure compost obtained by using oil shale semicoke as the bulking agent. J. Environ. Manag. 2022, 324, 116309. [Google Scholar] [CrossRef] [PubMed]
  14. Xiao, Y.C. Research Progress of Agricultural Utilization of Oil Shale and Waste Residue. J. Liaoning Agric. Coll. 2014, 16, 12–14. [Google Scholar] [CrossRef]
  15. Huang, J.; Xia, H.P.; Kong, G.H. Impact of oil shale waste slag on plant growth and benefits of limestone amendment. Chin. J. Ecol. 2007, 01, 9–15. [Google Scholar] [CrossRef]
  16. Zhou, J.M.; Niu, X.C. Sources and Utilization of Oil Shale Residue. J. Guangdong Univ. Petrochem. Technol. 2013, 23, 11–14. [Google Scholar]
  17. Nicolini, J.; Pereira, B.F.; Pillon, C.N.; Machado, V.G.; Lopes, W.A.; de Andrade, J.B.; Mangrich, A.S. Characterization of Brazilian oil shale byproducts planned for use as soil conditioners for food and agro-energy production. J. Anal. Appl. Pyrolysis 2011, 90, 112–117. [Google Scholar] [CrossRef]
  18. GB15618-2018; Soil Environmental Quality Risk Control Standard for Soil Contamination of Agricultural Land. China MoEPotPsRo: Beijing, China, 2018.
  19. Wang, Y.; Li, L.Z.; Guo, W.Z.; Wen, J.L.; Li, Y.K.; Fan, F.C.; Wu, Y.S.; Li, H.P. Effects of Humic Acid on the Growth, Physiology and Water Use Efriciency of Zucchini Seedlings. Chin. Sci. Bull. 2022, 38, 47–53. [Google Scholar] [CrossRef]
  20. Wang, J.T.; Du, G.F.; Tian, J.S.; Zhang, Y.L.; Jiang, C.D.; Zhang, W.F. Effect of irrigation methods on root growth, root-shoot ratio and yield components of cotton by regulating the growth redundancy of root and shoot. Agric. Water Manag. 2020, 234, 106120. [Google Scholar] [CrossRef]
  21. Chen, G.D.; Wang, L.; Fabrice, M.R.; Tian, Y.A.; Qi, K.J.; Chen, Q.; Cao, P.; Wang, P.; Zhang, S.L.; Wu, J.Y. Physiological and nutritional responses of pear seedlings to nitrate concentrations. Front. Plant Sci. 2018, 9, 1679. [Google Scholar] [CrossRef]
  22. Mahmud, J.A.; Hasanuzzaman, M.; Khan, M.I.R.; Nahar, K.; Fujita, M. β-Aminobutyric Acid Pretreatment Confers Salt Stress Tolerance in Brassica napus L. by Modulating Reactive Oxygen Species Metabolism and Methylglyoxal Detoxification. Plants 2020, 9, 241. [Google Scholar] [CrossRef] [PubMed]
  23. Tang, J.; Li, M.L.; Mao, P.S.; Jiang, Y.W. Effects of gamma-aminobutyric acid on seed germination, ion balance, and metabolic activity in perennial ryegrass under salinity stress. J. Plant Growth Regul. 2022, 41, 1835–1844. [Google Scholar] [CrossRef]
  24. Ullah, A.; Tariq, A.; Zeng, F.; Noor, J.; Sardans, J.; Asghar, M.A.; Zhang, Z.; Peñuelas, J. Application of GABA (γ-aminobutyric acid) to improve saline stress tolerance of chufa (Cyperus esculentus L. var. sativus Boeck) plants by regulating their antioxidant potential and nitrogen assimilation. S. Afr. J. Bot. 2023, 157, 540–552. [Google Scholar] [CrossRef]
  25. Soothar, M.K.; Mounkaila Hamani, A.K.; Kumar Sootahar, M.; Sun, J.S.; Yang, G.; Bhatti, S.M.; Traore, A. Assessment of acidic biochar on the growth, physiology and nutrients uptake of maize (Zea mays L.) seedlings under salinity stress. Sustainability 2021, 13, 3150. [Google Scholar] [CrossRef]
  26. AbdElgawad, H.; Zinta, G.; Hegab, M.M.; Pandey, R.; Asard, H.; Abuelsoud, W. High salinity induces different oxidative stress and antioxidant responses in maize seedlings organs. Front. Plant Sci. 2016, 7, 276. [Google Scholar] [CrossRef] [PubMed]
  27. Liu, Y.; Huang, J.; Ma, Y.R.; Qi, T.; Feng, Y.Z.; Meng, A.J.; Wang, X.Y. Effects induced by inputting biochar into the saliferous gray desert soil on the soil moisture movement. Xinjiang Agric. Sci. 2017, 32, 182–188. [Google Scholar]
  28. Javeed, H.M.R.; Ali, M.; Skalicky, M.; Nawaz, F.; Qamar, R.; Rehman, A.U.; Faheem, M.; Mubeen, M.; Iqbal, M.M.; Rahman, M.H.U. Lipoic acid combined with melatonin mitigates oxidative stress and promotes root formation and growth in salt-stressed canola seedlings (Brassica napus L.). Molecules 2021, 26, 3147. [Google Scholar] [CrossRef]
  29. Aibdin, U.Z.; Nafees, M.; Rizwan, M.; Ahmad, S.; Ali, S.; Obaid, W.A.; Alsubeie, M.S.; Darwish, D.B.E.; Abeed, A.H. Combined effect of Zinc lysine and biochar on growth and physiology of wheat (Triticum aestivum L.) to alleviate salinity stress. Front. Plant Sci. 2022, 13, 1017282. [Google Scholar] [CrossRef]
  30. Cheng, B.Z.; Zhou, L.; Liang, L.L.; Cao, Y.Q.; Zeng, W.H.; Zhang, X.Q.; Ma, X.; Huang, L.K.; Nie, G.; Liu, W. The γ-aminobutyric acid (GABA) alleviates salt stress damage during seeds germination of white clover associated with Na+/K+ transportation, dehydrins accumulation, and stress-related genes expression in white clover. Int. J. Mol. Sci. 2018, 19, 2520. [Google Scholar] [CrossRef]
  31. Guan, B.; Zhou, X.Y.; Yu, G.G.; Zhao, Y.; Li, J.Y.; Luo, X.Z. Study on the Improvement Effect of Low-grade Oil Shale on Sandy Soil. China Resour. Compr. Util. 2021, 39, 26–28. [Google Scholar] [CrossRef]
  32. Li, X.J.; Yu, B.J.; Cui, Y.Q.; Yin, Y.F. Melatonin application confers enhanced salt tolerance by regulating Na+ and Cl accumulation in rice. Plant Growth Regul. 2017, 83, 441–454. [Google Scholar] [CrossRef]
  33. Zhang, J.H.; Bai, Z.G.; Huang, J.; Hussain, S.; Zhao, F.T.; Zhu, C.Q.; Zhu, L.F.; Cao, X.C.; Jin, Q.Y. Biochar alleviated the salt stress of induced saline paddy soil and improved the biochemical characteristics of rice seedlings differing in salt tolerance. Soil. Tillage Res. 2019, 195, 104372. [Google Scholar] [CrossRef]
  34. Xiang, Y.Z.; Deng, Q.; Duan, H.L.; Guo, Y. Effects of biochar application on root traits: A meta-analysis. GCB Bioenergy 2017, 9, 1563–1572. [Google Scholar] [CrossRef]
  35. Zhang, W.Q.; Wei, J.H.; Guo, L.L.; Fang, H.; Liu, X.J.; Liang, K.H.; Niu, W.Q.; Liu, F.L.; Siddique, K.H. Effects of two biochar types on mitigating drought and salt stress in tomato seedlings. Agronomy 2023, 13, 1039. [Google Scholar] [CrossRef]
  36. Islam, A.T.; Ullah, H.; Himanshu, S.K.; Tisarum, R.; Cha-um, S.; Datta, A. Effect of salicylic acid seed priming on morpho-physiological responses and yield of baby corn under salt stress. Sci. Hortic. 2022, 304, 111304. [Google Scholar] [CrossRef]
  37. Kaya, C.; Aydemir, S.; Akram, N.A.; Ashraf, M. Epibrassinolide application regulates some key physio-biochemical attributes as well as oxidative defense system in maize plants grown under saline stress. J. Plant Growth Regul. 2018, 37, 1244–1257. [Google Scholar] [CrossRef]
  38. Wang, M.Q.; Gong, S.C.; Fu, L.X.; Hu, G.H.; Li, G.L.; Hu, S.X.; Yang, J.F. The involvement of antioxidant enzyme system, nitrogen metabolism and osmoregulatory substances in alleviating salt stress in inbred maize lines and hormone regulation mechanisms. Plants 2022, 11, 1547. [Google Scholar] [CrossRef]
  39. Yildirim, E.; Ekinci, M.; Turan, M. Impact of biochar in mitigating the negative effect of drought stress on cabbage seedlings. J. Soil Sci. Plant Nutr. 2021, 21, 2297–2309. [Google Scholar] [CrossRef]
  40. Jabborova, D.; Abdrakhmanov, T.; Jabbarov, Z.; Abdullaev, S.; Azimov, A.; Mohamed, I.; AlHarbi, M.; Abu-Elsaoud, A.; Elkelish, A. Biochar improves the growth and physiological traits of alfalfa, amaranth and maize grown under salt stress. PeerJ 2023, 11, e15684. [Google Scholar] [CrossRef]
  41. Qi, Q.; Ma, S.R.; Xu, W.D. Advances in the effects of salt stress on plant growth and physiological mechanisms of salt tolerance. Mol. Plant Breed. 2020, 18, 2741–2746. [Google Scholar] [CrossRef]
  42. Ren, J.H.; Ye, J.; Yin, L.N.; Li, G.X.; Deng, X.P.; Wang, S.W. Exogenous melatonin improves salt tolerance by mitigating osmotic, ion, and oxidative stresses in maize seedlings. Agronomy 2020, 10, 663. [Google Scholar] [CrossRef]
  43. Hai, X.; Mi, J.Z.; Zhao, B.P.; Zhang, B.R.; Zhao, Z.; Liu, J.H. Foliar application of spermidine reduced the negative effects of salt stress on oat seedlings. Front. Plant Sci. 2022, 13, 846280. [Google Scholar] [CrossRef] [PubMed]
Figure 1. Biplots based on principal component analysis (PCA), illustrating the relationships between maize growth indicators and applied treatments. X1: height, X2: stem width, X3: underground fresh weight, X4: underground dry weight, X5: aboveground fresh weight, X6: aboveground dry weight, X7: total fresh weight, X8: total dry weight, X9: root/shoot ratio, X10: seedling vigor index. Y: fine concentrate ore, M: fine ore, B: semi-coke. 0.1%, 0.2%, 0.4%, and 0.8%, respectively, represent volume fraction additions of 0.1%, 0.2%, 0.4%, and 0.8% in the cultivation substrate.
Agronomy 14 00044 g001
Figure 2. Effects of oil shale waste residues on the root vitality of maize seedlings. Different lowercase letters indicate significant differences at the 0.05 probability level (p < 0.05), determined by one-way analysis of variance (ANOVA) and Duncan’s post hoc test for significance. The vertical bar chart represents the mean ± standard deviation (SD) calculated from three repetitions. Y: fine concentrate ore, M: fine ore, B: semi-coke.
Agronomy 14 00044 g002
Figure 3. Effects of oil shale waste residues on the proline content in the root system of maize seedlings. Different lowercase letters indicate significant differences at the 0.05 probability level (p < 0.05), determined by one-way analysis of variance (ANOVA) and Duncan’s post hoc test for significance. The vertical bar chart represents the mean ± standard deviation (SD) calculated from three repetitions. Y: fine concentrate ore, M: fine ore, B: semi-coke.
Agronomy 14 00044 g003
Figure 4. Effects of oil shale waste residues on the malondialdehyde content in maize seedling leaves. Different lowercase letters indicate significant differences at the 0.05 probability level (p < 0.05), determined by one-way analysis of variance (ANOVA) and Duncan’s post hoc test for significance. The vertical bar chart represents the mean ± standard deviation (SD) calculated from three repetitions. Y: fine concentrate ore, M: fine ore, B: semi-coke.
Agronomy 14 00044 g004
Figure 5. Effects of oil shale waste residues on the activity of superoxide dismutase (A), peroxidase (B), and catalase (C) in maize seedling leaves. Different lowercase letters indicate significant differences at the 0.05 probability level (p < 0.05), determined by one-way analysis of variance (ANOVA) and Duncan’s post hoc test for significance. The vertical bar chart represents the mean ± standard deviation (SD) calculated from three repetitions. Y: fine concentrate ore; M: fine ore; B: semi-coke.
Agronomy 14 00044 g005
Figure 6. Clustering heat map of each indicator and treatment. X1: height, X2: stem width, X3: underground fresh weight, X4: underground dry weight, X5: aboveground fresh weight, X6: aboveground dry weight, X7: total fresh weight, X8: total dry weight, X9: root/shoot ratio, X10: seedling vigor index. X11: root vitality, X12: proline, X13: superoxide dismutase, X14: peroxidase, X15: catalase, X16: malondialdehyde. Y: fine concentrate ore, M: fine ore, B: semi-coke. 0.1%, 0.2%, 0.4%, and 0.8%, respectively, represent volume fraction additions of 0.1%, 0.2%, 0.4%, and 0.8% in the cultivation substrate.
Agronomy 14 00044 g006
Figure 7. Dual-axis plot of physiological and biochemical indicators and treatment. X11: root vitality, X12: proline, X13: superoxide dismutase, X14: peroxidase, X15: catalase, X16: malondialdehyde. Y: fine concentrate ore, M: fine ore, B: semi-coke. 0.1%, 0.2%, 0.4%, and 0.8%, respectively, represent volume fraction additions of 0.1%, 0.2%, 0.4%, and 0.8% in the cultivation substrate.
Agronomy 14 00044 g007
Table 1. Basic physicochemical properties of the experimental materials.
MaterialsUnitCultivation SubstrateOil Shale Waste Residue
Saline–Alkali SoilFine Concentrate OreFine OreSemi-Coke
pH-8.558.267.898.43
Water-soluble saltsg·kg−19.44.27.58.2
Total nitrogeng·kg−10.42.570.932.73
Organic matter%4.3128.086.913.26
Hydrolysable nitrogenmg·kg−122.555.555.569.1
Available phosphorusmg·kg−17.944.342.852.9
Quick-acting potassiummg·kg−11147285105
Arsenicmg·kg−1<0.002<0.002<0.002<0.002
Mercurymg·kg−1<0.0020.0440.0280.041
Chromiummg·kg−1<0.040.70.60.7
Leadmg·kg−19383630
Cadmiummg·kg−1<0.01<0.01<0.01<0.01
Nickelmg·kg−112666866
Table 2. Effects of oil shale waste residues on seedling growth characteristics.
Addition LevelsTreatmentHeight (cm)Stem Width (mm)Fresh Weight (g/plant)Dry Weight (g/plant)Root/Shoot
Ratio
Seedling Vigor
Index
UndergroundAbovegroundTotalUndergroundAbovegroundTotal
0CK41.78 ± 0.59 a4.85 ± 0.16 a0.80 ± 0.18 ab6.68 ± 0.42 ab7.48 ± 0.60 abc0.10 ± 0.02 b0.98 ± 0.04 ab1.07 ± 0.05 b0.10 ± 0.02 a0.23 ± 0.02 b
0.1%Y41.22 ± 1.84 a4.33 ± 0.23 bc0.62 ± 0.24 b4.57 ± 1.03 b5.19 ± 1.14 c0.09 ± 0.03 b0.72 ± 0.11 b0.81 ± 0.10 b0.13 ± 0.05 a0.19 ± 0.03 b
M39.06 ± 2.56 a4.23 ± 0.46 bc0.93 ± 0.62 ab6.21 ± 2.41 ab7.14 ± 2.71 abc0.09 ± 0.07 b0.85 ± 0.28 ab0.94 ± 0.32 b0.10 ± 0.09 a0.20 ± 0.11 b
B44.59 ± 4.03 a4.49 ± 0.36 abc0.94 ± 0.14 ab7.58 ± 0.25 a8.52 ± 0.27 ab0.14 ± 0.02 ab1.11 ± 0.06 a1.25 ± 0.05 ab0.13 ± 0.02 a0.28 ± 0.04 b
0.2%Y40.39 ± 2.78 a4.32 ± 0.20 bc1.24 ± 0.46 a6.44 ± 1.76 ab7.67 ± 2.07 abc0.16 ± 0.06 ab0.86 ± 0.24 ab1.02 ± 0.29 b0.18 ± 0.04 a0.30 ± 0.10 b
M39.56 ± 4.06 a4.33 ± 0.27 bc0.94 ± 0.11 ab6.24 ± 0.92 ab7.18 ± 1.02 abc0.13 ± 0.01 b0.90 ± 0.12 ab1.02 ± 0.12 b0.14 ± 0.02 a0.26 ± 0.02 b
B43.52 ± 2.78 a4.39 ± 0.29 abc1.02 ± 0.40 ab8.37 ± 1.59 a9.39 ± 1.67 a0.34 ± 0.38 a1.21 ± 0.26 a1.55 ± 0.59 a0.26 ± 0.26 a0.65 ± 0.69 a
0.4%Y42.31 ± 4.64 a4.38 ± 0.11 abc0.55 ± 0.23 b6.21 ± 1.96 ab6.77 ± 1.82 abc0.08 ± 0.03 b0.91 ± 0.33 ab0.99 ± 0.32 b0.11 ± 0.07 a0.19 ± 0.03 b
M41.17 ± 1.32 a4.49 ± 0.18 abc0.77 ± 0.26 ab7.96 ± 1.67 a8.74 ± 1.71 ab0.11 ± 0.03 b1.15 ± 0.23 a1.26 ± 0.22 ab0.10 ± 0.04 a0.26 ± 0.03 b
B44.34 ± 2.54 a4.61 ± 0.08 abc1.23 ± 0.27 a7.45 ± 1.06 a8.68 ± 0.79 ab0.16 ± 0.04 ab1.05 ± 0.13 ab1.21 ± 0.09 ab0.16 ± 0.07 a0.31 ± 0.05 b
0.8%Y39.44 ± 1.58 a4.36 ± 0.13 bc0.77 ± 0.11 ab5.75 ± 1.17 ab6.52 ± 1.28 bc0.11 ± 0.02 b0.87 ± 0.13 ab0.98 ± 0.15 b0.12 ± 0.01 a0.23 ± 0.03 b
M39.17 ± 3.47 a4.75 ± 0.09 ab0.64 ± 0.15 b5.77 ± 0.91 ab6.41 ± 0.99 bc0.09 ± 0.01 b0.89 ± 0.12 ab0.98 ± 0.12 b0.10 ± 0.02 a0.22 ± 0.01 b
B42.76 ± 2.12 a4.61 ± 0.28 abc0.85 ± 0.10 ab7.61 ± 0.90 a8.46 ± 0.97 ab0.12 ± 0.02 b1.13 ± 0.17 a1.25 ± 0.18 ab0.11 ± 0.02 a0.27 ± 0.04 b
Note: different lowercase letters indicate significant differences at the 0.05 probability level (p < 0.05), determined by one-way analysis of variance (ANOVA) and Duncan’s post hoc test. The data are presented as means ± standard deviation (SD) calculated from three repetitions. Y: fine concentrate ore, M: fine ore, B: semi-coke.
Table 3. Single- and two-factor analysis of variance.
IndicatorsTypeAddition LevelType × Addition Level
FpFpFp
X1Height6.436**0.89ns0.126ns
X2Stem width1.566ns1.931ns0.652ns
X3Underground fresh weight1.913ns1.849ns1.518ns
X4Underground dry weight2.212ns1.796ns0.526ns
X5Aboveground fresh weight6.557**1.276ns0.805ns
X6Aboveground dry weight6.945**0.885ns0.796ns
X7Total fresh weight7.146**1.52ns0.786ns
X8Total dry weight7.21**1.165ns0.786ns
X9Root/Shoot ratio1.067ns2.012ns0.31ns
X10Seedling vigor index2.273ns1.583ns0.626ns
X11Root vitality13.48***14.508***22.34***
X12Proline0.639ns81.593***134.448***
X13Superoxide dismutase820.503***4.205*9.575***
X14Peroxidase6.738**4.015*1.186ns
X15Catalase201.306***23.447***13.511***
X16Malondialdehyde1.395ns12.374***5.326**
Note: *, **, and *** indicate statistically significant difference at p < 0.05, p < 0.01, and p < 0.001, respectively, and ‘ns’ indicates no statistically significant difference.
Table 4. Principal component analysis eigenvalues and contribution rates.
ComponentsInitial EigenvaluesTotal Extraction Sums of Squares Loadings
TotalVariance PercentageAccumulated %TotalVariance PercentageAccumulated %
16.99343.70743.7076.99343.70743.707
23.04119.00962.7163.04119.00962.716
31.5369.60372.3191.5369.60372.319
41.368.49980.8181.368.49980.818
50.945.87386.691
60.8835.51892.209
70.5953.71995.928
80.4232.64798.575
90.1260.78799.362
100.0750.46999.832
110.0190.11899.949
120.0080.051100
131.21 × 10−167.57 × 10−16100
14−8.16 × 10⁻¹⁷−5.10 × 10−16100
15−3.56 × 10⁻¹⁶−2.23 × 10−15100
16−7.47 × 10⁻¹⁶−4.67 × 10−15100
Table 5. Loading matrix and eigenvectors for each indicator in principal components.
VariablesLoading MatrixEigenvectors
Principal Components 1Principal Components 2Principal Components 3Principal Components 4Principal Components 1Principal Components 2Principal Components 3Principal Components 4
X10.667 0.203 0.282 −0.148 0.252 0.116 0.228 −0.127
X20.197 0.777 −0.252 −0.270 0.074 0.446 −0.203 −0.232
X30.592 −0.200 0.216 −0.178 0.224 −0.115 0.174 −0.153
X40.830 −0.468 0.149 −0.095 0.314 −0.268 0.120 −0.081
X50.927 0.180 −0.069 0.167 0.351 0.103 −0.056 0.143
X60.900 0.263 −0.082 0.203 0.340 0.151 −0.066 0.174
X70.943 0.126 −0.024 0.119 0.357 0.072 −0.019 0.102
X80.969 0.037 −0.010 0.121 0.366 0.021 −0.008 0.104
X90.635 −0.633 0.307 −0.183 0.240 −0.363 0.248 −0.157
X100.854 −0.410 0.089 −0.065 0.323 −0.235 0.072 −0.056
X11−0.061 0.441 0.704 0.363 −0.023 0.253 0.568 0.311
X12−0.047 0.554 0.392 0.009 −0.018 0.318 0.316 0.008
X13−0.523 −0.302 0.682 −0.010 −0.198 −0.173 0.550 −0.009
X14−0.285 −0.150 −0.017 0.886 −0.108 −0.086 −0.014 0.760
X150.693 0.386 −0.111 0.302 0.262 0.221 −0.090 0.259
X16−0.005 0.828 0.288 −0.286 −0.002 0.475 0.232 −0.245
Note: X1: height, X2: stem width, X3: underground fresh weight, X4: underground dry weight, X5: aboveground fresh weight, X6: aboveground dry weight, X7: total fresh weight, X8: total dry weight, X9: root/shoot ratio, X10: seedling vigor index. X11: root vitality, X12: proline, X13: superoxide dismutase, X14: peroxidase, X15: catalase, X16: malondialdehyde.
Table 6. Principal component composite scores.
TreatmentF1F2F3F4FRank
CK−0.0022.599−1.006−3.06813.5896
0.1%Y−4.033−1.1471.193−0.611−191.79613
0.1%M−1.544−1.449−1.6850.645−105.74912
0.1%B1.898−0.345−1.154−0.29862.8085
0.2%Y−0.397−2.1791.156−0.657−53.2528
0.2%M−0.788−0.1630.3150.002−34.4797
0.2%B6.025−2.8870.058−0.217207.1491
0.4%Y−2.359−0.0450.8070.531−91.68610
0.4%M1.2101.146−1.1061.50276.7944
0.4%B2.7071.6541.135−0.227158.7412
0.8%Y−2.204−0.6830.5410.014−103.98611
0.8%M−1.8790.639−1.9850.935−81.0949
0.8%B1.3652.8591.7301.449142.9613
Note—Y: fine concentrate ore, M: fine ore, B: semi-coke. 0.1%, 0.2%, 0.4%, and 0.8%, respectively, represent volume fraction additions of 0.1%, 0.2%, 0.4%, and 0.8% in the cultivation substrate.
Disclaimer/Publisher’s Note: The statements, opinions and data contained in all publications are solely those of the individual author(s) and contributor(s) and not of MDPI and/or the editor(s). MDPI and/or the editor(s) disclaim responsibility for any injury to people or property resulting from any ideas, methods, instructions or products referred to in the content.

