Article

Effect of Cultivar on Faba Bean–Wheat Intercrop Productivity under a Mediterranean Environment

by
Andreas Michalitsis
1,
Paschalis Papakaloudis
1,
Chrysanthi Pankou
1,†,
Anastasios Lithourgidis
2,
George Menexes
1 and
Christos Dordas
1,*
1
Laboratory of Agronomy, School of Agriculture, Aristotle University of Thessaloniki, 54124 Thessaloniki, Greece
2
Farm of Aristotle University of Thessaloniki, 57001 Thermi, Greece
*
Author to whom correspondence should be addressed.
Current address: Institute of Industrial and Forage Crops, Hellenic Agricultural Organization (ELGO-Dimitra), 41335 Larissa, Greece.
Agronomy 2024, 14(1), 70; https://doi.org/10.3390/agronomy14010070
Submission received: 22 November 2023 / Revised: 21 December 2023 / Accepted: 24 December 2023 / Published: 27 December 2023
(This article belongs to the Special Issue Promoting Intercropping Systems in Sustainable Agriculture)

Abstract

:
The term intercropping is used to describe agricultural systems where at least two or more species are cultivated in the same field for a portion of their biological cycle. It is an ancient agricultural practice that, with the evolution of agriculture, the prevalence of intensive cultivation systems, and the use of multiple inputs became mostly restricted to developing countries. However, due to climate instability and uncertainty about weather conditions, interest in intercropping has been revived in recent years. The objective of the present study was to determine which faba bean cultivar can be used with wheat cultivars to achieve higher yields and to examine the interaction between the cultivars in intercropping systems. It was found that the combination of Flamenko with Polycarpi gave the highest yield and showed complementarity in the interaction between these cultivars that also have the highest yield; also, the other indices that were used showed a good response on the intercropping system and the LER was 1.30 and 1.19 for the first and the second year of the study, respectively. Therefore, there are faba bean and wheat cultivars that are better adapted to intercropping conditions and can be utilized by farmers to enhance productivity.

1. Introduction

Intercropping is an agricultural practice that has garnered significant attention in recent years due to its various advantages. These benefits encompass higher yields, including biomass and grain production, resulting in enhanced land-use efficiency. The increase in yield is attributed to improved water, nutrient, and light use efficiency [1]. Additionally, intercropping contributes to overall yield stability, soil conservation, and effective control of weeds, insects, and diseases [2,3,4,5]. Moreover, it has the potential to enhance the quality of products such as forage and grains. Despite these advantages, intercropping faces limitations that restrict its widespread adoption, particularly in developed countries. The practice demands additional effort for seed mixture preparation, and there is a limited range of herbicides and other pesticides available for use in these systems [6].
Intercropping contributes to an increase in the biodiversity of cropping systems [7]. In contrast, monoculture systems, marked by heightened use of fertilizers, pesticides, and herbicides [8], lead to biodiversity loss [9] and restrict the functionality of agro-ecosystems [10]. Additionally, such monoculture practices can result in environmental consequences, including degradation of soil quality [11]. Hence, there is a pressing need to adopt systems that enhance biodiversity while striving to maintain high productivity and sustainability [7]. Within this framework, the concept of sustainable intensification has emerged, with the goal of sustaining production while minimizing environmental impact [12]. Intercropping is more widely practiced in low-input cropping systems, particularly in developing countries, with the most prevalent intercropping system being the cereal-legume system that involves different crop species, arrangements, and seeding ratios [6,13].
The use of the faba bean (Vicia faba L.) in cropping systems has earned the interest from numerous researchers in recent years [14,15,16], including its incorporation into intercropping systems [17,18,19,20]. While wheat and faba bean have been utilized in intercropping systems, there is limited information available regarding the appropriate cultivars for these systems [18,19,21,22]. Furthermore, it has been demonstrated that the selection of suitable cultivars significantly impacts the productivity of the system when different cultivars are used in various intercropping systems [23,24].
After selecting compatible intercropping species, the choice of appropriate genotypes becomes crucial [23,24]. The performance of a genotype heavily depends on the environment and prevailing conditions [25]. Modern cultivars have been primarily developed for monocropping systems with high inputs [26]. In intercropping systems, different species must coexist [27]. Consequently, significant differences in genotype behavior emerge in various systems due to the varying conditions of intraspecific and interspecific competition [28].
Selecting suitable genotypes for intercropping systems presents a challenge [29] because traits that were prioritized for breeding in monocropping may not be well-suited for intercropping scenarios [20,30]. For example, lodging resistance in peas is crucial for monocropping, but in intercropping with cereals, peas may climb onto cereal plants, making lodging resistance less relevant [31]. Consequently, a high-yielding genotype in monocropping may not be ideal for intercropping, as it might lack traits that foster complementarity [28].
While cereals contribute the majority of the yield in the mixture [32], the benefits of intercropping depend on legume behavior. Therefore, short-statured cereals, which are less competitive and allow legumes to grow, result in greater intercropping benefits [29]. For instance, oat varieties with medium height led to higher yields in mixtures with peas [33,34] and vetch [35]. Conversely, when legumes dominate, intercropping may be disadvantageous [17]. Ref. [23] found that short-statured faba bean genotypes were favorable for achieving higher mixture yields.
Differences in the timing of maturity are crucial to prevent developmental stages with high demands from coinciding for both species. For example, late oat genotypes led to higher mixture yields [33]. However, despite the recognition that intercropping genotypes should display lower competition and greater complementarity traits [6,25], there remains a research gap concerning the specific characteristics driving these interactions.
The objectives of the present study were twofold: (i) to assess the performance of four faba bean and two winter wheat cultivars as both sole crops and intercrops, with the aim of identifying the most suitable combination of faba bean and wheat cultivars, and (ii) to identify a key trait that can serve as a determinant for selecting proper cultivars for intercropping, with the ultimate goal of enhancing productivity through the use of relevant indices.

2. Materials and Methods

2.1. Establishment of the Experiment

The experiments were carried out over two consecutive years, during the growing seasons of 2020–2021 and 2021–2022, at the experimental farm of the Aristotle University of Thessaloniki in northern Greece, situated in the area of Thermi (40°32′07.7″ N 22°59′20.5″ E). The soil at the site was identified as clay loam, and the chemical properties of the soil are detailed in Table 1. Daily weather data were recorded and mean monthly values for both rainfall and temperatures are presented in Table 2 together with the thirty-year average from 1990 up to 2020.
The plant material used consisted of two varieties of bread wheat (Elissavet and Flamenko) and four varieties of faba bean (Polycarpi, Organdi, Nebraska, and Bumble). The cultivars that were used had differences in maturity, plant height, and grain size. Elissavet is an early flowering cultivar, with a plant height 0.7–0.9 m, with high tillering ability, resistance to lodging, tolerance to freezing, and 1000 grain weight 32–38 g. Flamenko is a mid-early flowering cultivar, with a plant height 0.7–0.8 m, high tillering ability, good resistance to lodging, good tolerance to freezing, and 1000 grain weight 36–42 g. Faba bean cultivar Polycarpi is an early flowering cultivar, with a plant height of 0.7–0.8 m, resistance to lodging, tolerance to freezing, and 1000 grain weight 340–350 g. Organdi is an early flowering cultivar, with a plant height of 0.6–0.7 m, resistance to lodging with low tolerance to freezing, and 1000 grain weight 520 g. Nebraska is a mid-early flowering cultivar, with a plant height of 0.7–0.8 m, resistance to lodging, tolerance to freezing, and 1000 grain weight 510 g. Finally, Bumble is a mid-early flowering cultivar, with a plant height of 0.6–0.7 m, resistance to lodging, tolerance to freezing, and 1000 grain weight 650 g (Table S1).
The preceding crop was barley, and the soil preparation involved moldboard plowing, harrowing, and the use of a cultivator. Weed control measures included the application of Pendimethalin at a rate of 1320 g ai ha−1, supplemented by hand hoeing when new weeds emerged in the field. It is important to note that the experiment was conducted in a rainfed area, and no irrigation was applied. Furthermore, no mineral fertilization was applied as the soil had all the necessary nutrients with the adequate concentrations for plant growth and no pesticides were used during the two growing seasons as there was no significant disease or other pest.
The experimental plots measured 1 m × 4 m, equivalent to 4 m2, with each plot consisting of 4 rows, each 4 m in length, and spaced 25 cm apart. There was a 1 m buffer zone surrounding each experimental plot. The experimental design employed was a Randomized Complete Block Design (RCBD) with four replications. Each block included monocrops of the two varieties of bread wheat and the four varieties of faba bean, as well as all possible intercropping combinations, resulting in 14 treatments and a total of 56 experimental plots. For monocultures, the seeding rate was set at 200 kg ha−1, which is the common seeding rate that the farmers apply in Greece, and was used in previous experiments. In intercropping scenarios, a replacement design was implemented with a ratio of 25:75 for wheat to faba bean, respectively. The seeding ratio was selected as it was found as the most suitable from previous experiments in the area [18,19]. In the intercropping treatments, both species were sown in the same row by hand at the second week of December (11 December 2020 and 9 December 2021) for both years.

2.2. Measurements

Various characteristics were assessed, including morphological, physiological, and agronomic measurements at three stages of plant development: during stem elongation (BBCH 30), the beginning of flowering (BBCH 61), and grain filling (BBCH 73) for the cereals. Additionally, data were collected on the number of tillers/m2, the number of spikes and pods per plant, dry biomass, and grain yield. To further analyze the intercropping systems, the Land Equivalent Ratio (LER) was calculated, providing a measure of the relative advantage of intercropping compared to monoculture. Additionally, the study determined the General Mixing Ability (GMA) and Specific Mixing Ability (SMA) indices, which offer insights into the overall and specific interactions between the different cultivars in the intercropping systems.

2.2.1. Morphological Characteristics

Plant Height

Plant height was measured at three growth stages. The first measurement occurred in April during the stem elongation stage of wheat (BBCH 30), serving as an indicator of early plant vigor. Faba bean plants were at the stage of two visible nodes (BBCH 32) during this measurement. The second measurement took place in early May, at the beginning of wheat flowering. Finally, the third measurement was conducted in mid-May, corresponding to the grain-filling stage of wheat (BBCH 73) and 50% pod expansion for faba beans (BBCH 75). Although there were minor variations in the growth stage of different cultivars and plant species, measurements were standardized. Plant height was determined by placing a measuring tape at the base of the plant and recording the highest point of the plant. For each species in the two central rows of each plot, five randomly selected plants were measured, and a mean value was calculated according to [36].

Leaf Area Index (LAI)

The Leaf Area Index (LAI) was determined using the ACCUPAR LP80 device (Meter, München, Germany) simultaneously with height measurements [37]. The calculation of LAI was based on Beer’s law:
LAI = −(ln(L/L0))/k
where L0 is the incident radiation on the canopy, L is the radiation within the canopy, k is the absorption coefficient, which depends on the crop, and LAI is the Leaf Area Index [38].
One measurement was taken above the experimental plot to record incident radiation, and three measurements were taken below the canopy. Measurements were conducted between 11:00 a.m. and 1:00 p.m. under clear sky conditions.

2.2.2. Normalized Difference Vegetation Index (NDVI)

Normalized Difference Vegetation Index (NDVI) is calculated as the difference in near-infrared to red reflectance divided by their sum [39]:
NDVI = (NIR − RED)/(NIR + RED)
where NIR is the near-infrared reflectance and RED, the reflectance in the red.
The index was calculated using the PolyPen RP110 device (Photon Systems Instruments, Drásov, Czech Republic). Five measurements were made, on five random plants, for wheat and faba bean, respectively. The upper, fully expanded leaves in faba beans and the flag leaf in wheat were selected. The measurements were taken between 11:00 and 13:00, under clear sky conditions, in early May.

2.2.3. Leaf Greenness Index (SPAD)

The measurement was performed using the SPAD 502DL (Minolta Camera Co., Ltd., Osaka, Japan). The measurement was carried out in the last ten days of May on 15 randomly selected plants as an assessment of the ability to stay green. The measurement was made for each species separately. The selected leaves were the fully developed leaves for faba beans and the flag leaf for wheat. The measurement was done during the hours of 11:00–13:00.

2.2.4. Dry Matter Yield, Grain Yield, and Yield Components

Dry yield was determined by harvesting the two central rows of each plot beginning of June in both years. Following this, the samples were dried in a greenhouse for 10 days, weighed, and dry weight per m² was calculated. Grain yield was determined from the two central rows that were harvested before and then the two species were separated. Also, the following yield components were determined: the number of spikes and pods per plant and the number of seeds per spike and per pod. The number of spikes per plant and the number of pods per plant were measured on three randomly selected plants per plot from the two central rows. The number of seeds per spike and the number of seeds per pod were measured on three randomly selected mature spikes and pods per plot. The means were calculated for each experimental plot and used in the statistical analysis.

2.2.5. Phenotyping Tools Used in the Present Study

The following measurements were performed with two PlantEye (Model F400) (Phenospex, Heerlen, The Netherlands) infrared laser scanners, that were moved by a Fieldscan system (Phenospex, Heerlen, The Netherlands). The platform scanned each experimental plot, which was divided into four zones in the platform software (HortControl, Phenospex). The mean of the experimental plot was then calculated.
Light Penetration Depth measures the deepest point through the canopy at which the laser of the camera can reach [40]. It is a measurement of vegetation density and a proxy of above-ground competition [41].
Plant Senescence Reflectance Index (PSRI) has a positive correlation with the carotenoid/chlorophyll ratio. Therefore, it can be used to assess ageing, as in healthy tissues it has low and negative values, and with the onset of ageing or stress, the values increase.
The index was calculated according to [42]:
PSRI = (R678 − R500)/R750
where R678, R500, and R750 are the reflectance at 678 nm, 500 nm, and 750 nm, respectively.
It was calculated with the high-precision phenotyping platform Fieldscan (Phenospex, Heerlen, The Netherlands). The measurement was performed at the end of May and the index was calculated at the experimental plot level.
Normalized Pigment Chlorophyll Index (NPCI) is an indicator of plant senescence that relates the ratio of total pigments to chlorophyll a. In healthy plants, it has low values, while in stressed or senescent plants, its values increase. The index was calculated according to [43]:
NPCI = (R680 − R430)/(R680 + R430)
where R680 and R430 are the reflectance at 680 nm and 430 nm, respectively.
The measurement was performed with the high-precision phenotyping platform Fieldscan in May. The values were obtained at the experimental plot level and the mean of the four zones into which the plot was divided was calculated and defined in the HortControl software used by this platform.

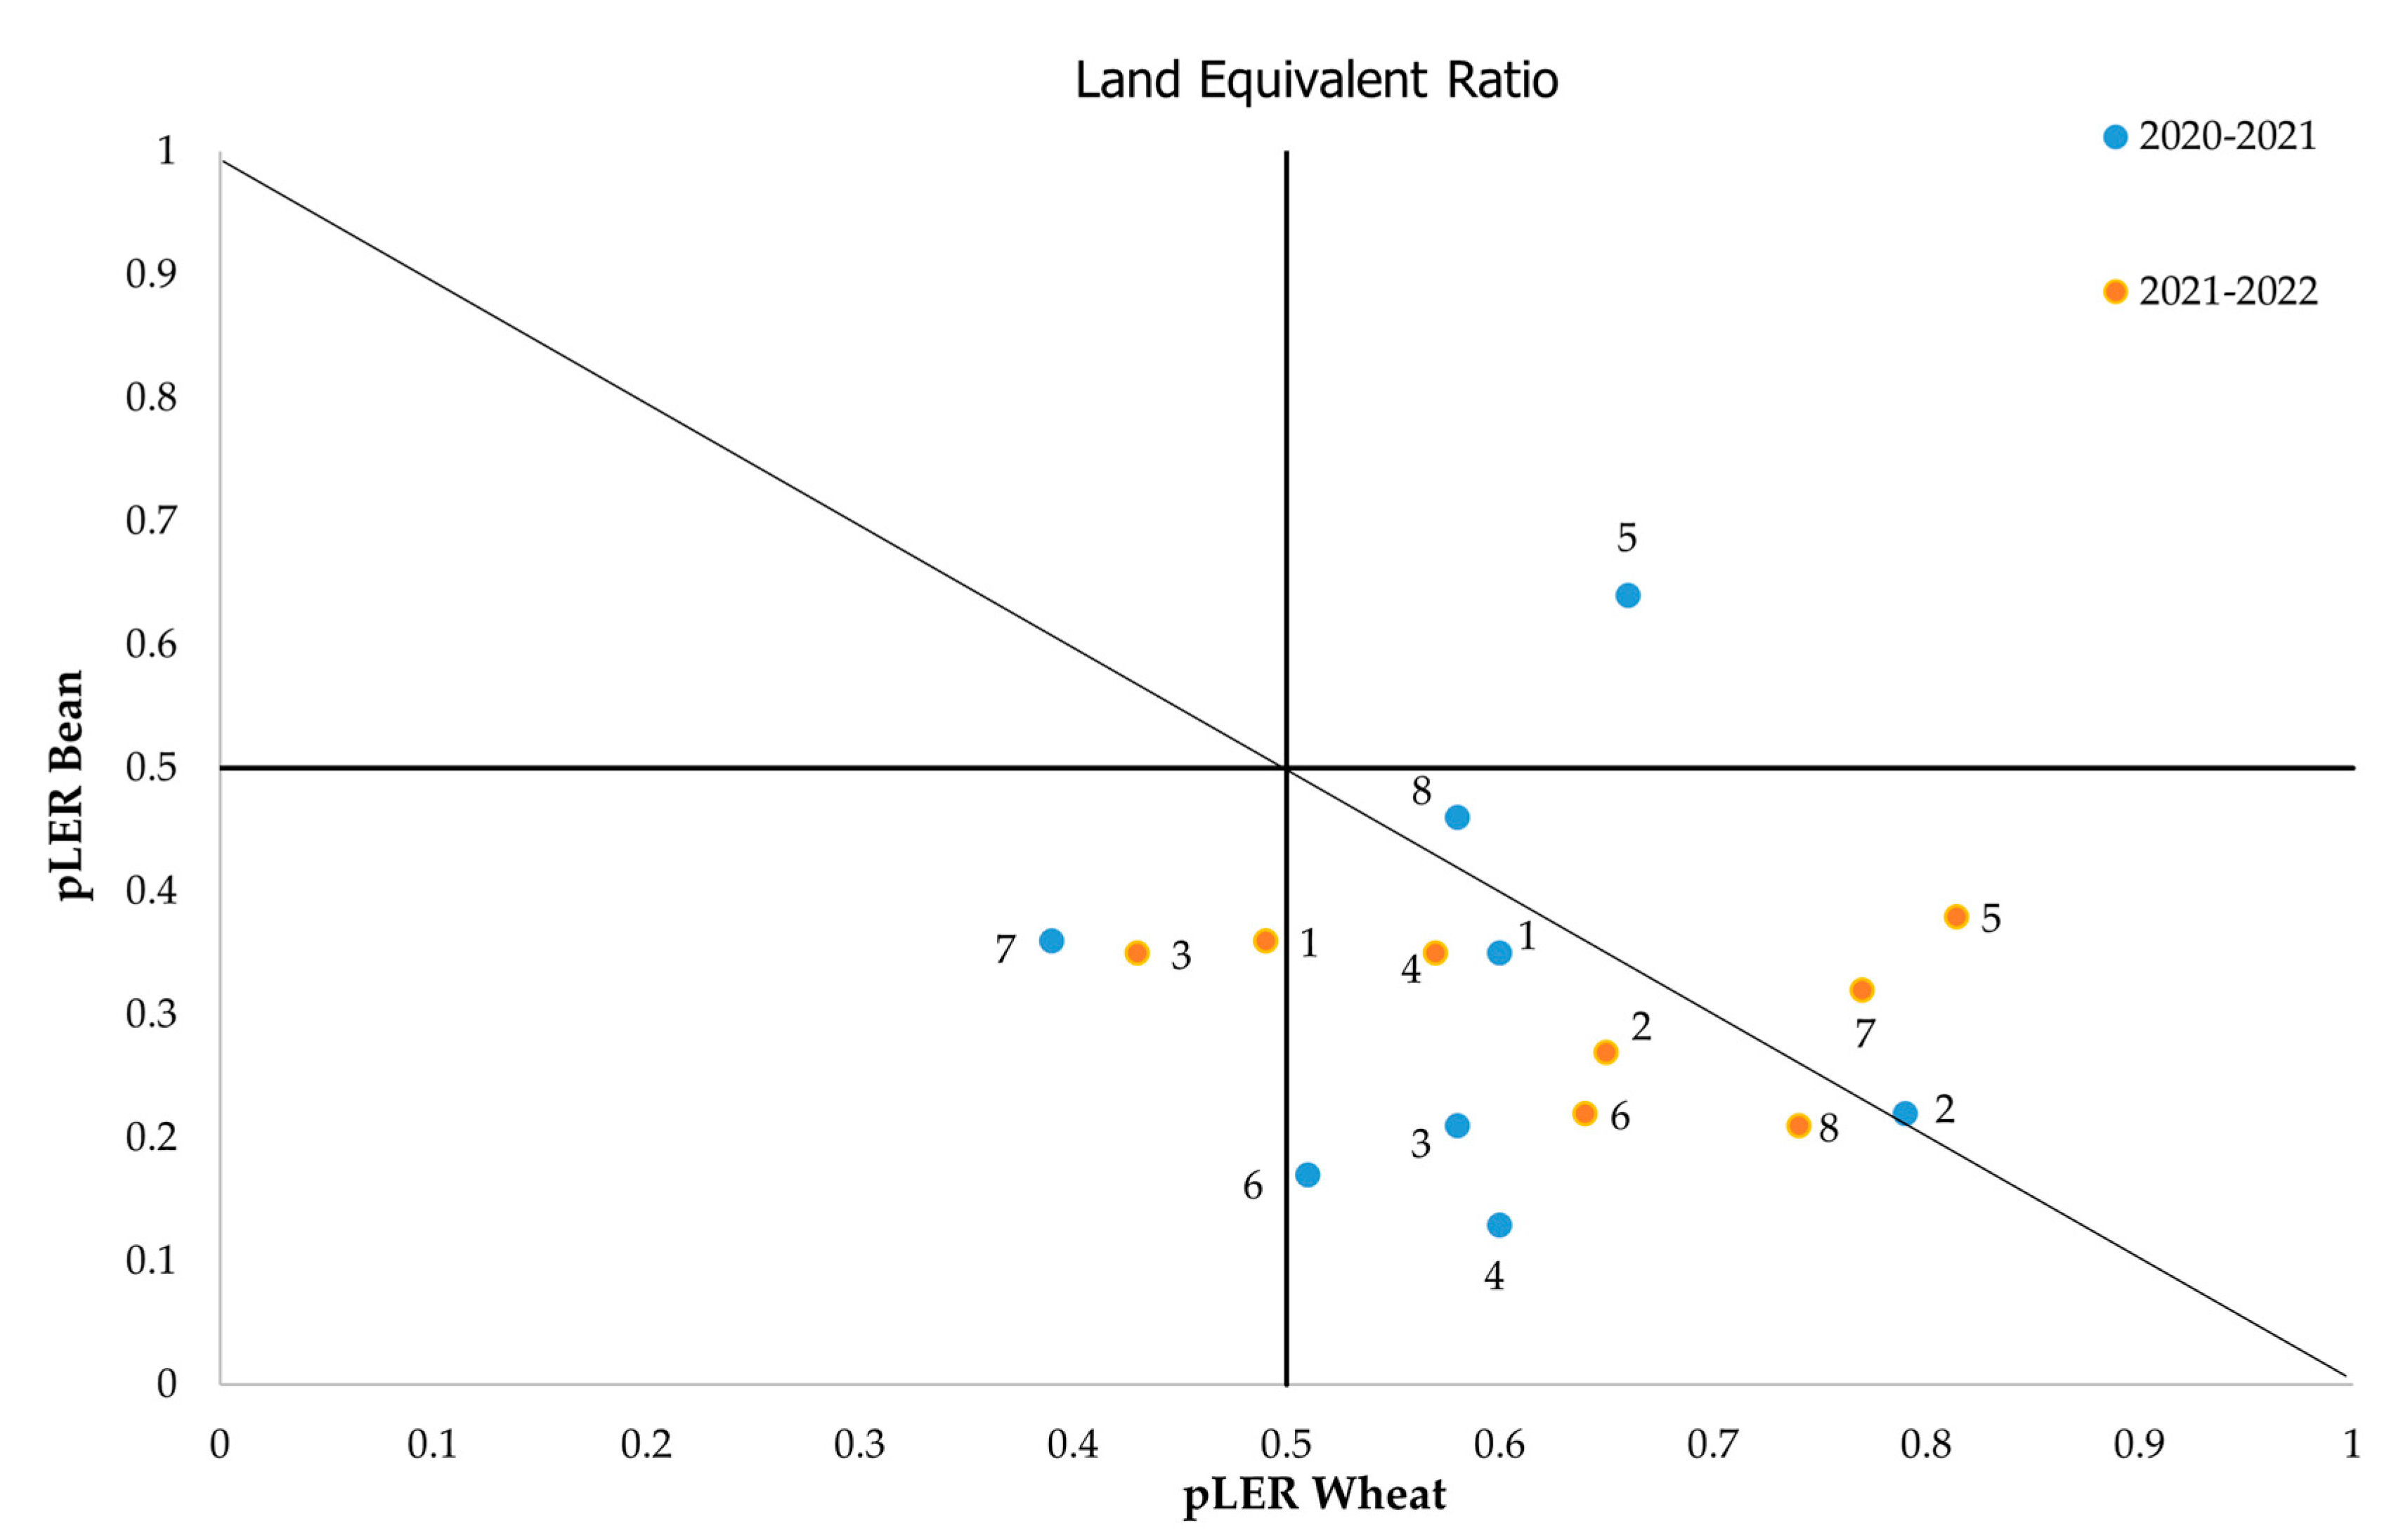
2.2.6. Land Equivalent Ratio (LER)

Land Equivalent Ratio (LER) was calculated on a grain yield basis for both crops and it was used to determine the advantage or disadvantage of intercropping [44,45,46] as follows:
LER = (Yw/Ywfb) + (Yfb/Yfbw)
where Yw is the wheat yield in monoculture, Ywfb is the wheat yield in intercrop, Yfb is the faba bean yield in monoculture, and Yfbw is the faba bean yield in intercrop. (Yw/Ywfb) and (Yf/Yfbw) are the partial LER of wheat and faba bean, respectively.
Land Equivalent Ratio (LER) describes the biological efficiency of the two species grown together [45] and was used extensively in the intercropping system. Also, partial LERs were used to describe the interactions that exist in the mixtures, which can be quite complex. These interactions were described by the 4C approach (competition, complementarity, cooperation, and compensation) [24,47].

2.2.7. General Mixing Ability (GMA) and Specific Mixing Ability (SMA) Indices

Two indices were used to determine the ability of the different cultivars to be used in intercropping mixtures. The indices are GMA and SMA, which have been used in quantitative genetics but also have been adopted from intercropping studies [24] to assess the ability of a cultivar to be used in mixtures with other cultivars. GMA indicates the average ability of a genotype to influence the response of a mixture, while SMA describes the interaction between two varieties [24,48]. Therefore, from a statistical view point, GMA represents the main effect, and SMA represents interaction [49,50]. The calculation of the index was done according to Han et al. [51], based on the original idea of [52] and as described before [24]. The cultivar that can be used in mixtures should have high GMA values but low variability and SMA values [53].
Based on Han et al. [51], a simplified algorithm for estimating the GMA and SMA indices is the following:
Suppose there are two sets of parents A and B, and Y i j r is the yield (or other interesting characteristic) of parent i of set A and parent j of set B at replication r.
Estimating the GMA:
Calculate the grand mean   Y ¯ of all yield values Y i j r
Compute the differences d i j r = Y i j r   Y ¯
Compute the mean value of the differences d i j r for each parent of set A. These mean values are the GMA indices for parents of set A
Compute the mean value of the differences d i j r for each parent of set B. These mean values are the GMA indices for parents of set B
Estimating the SMA:
Fit the yield values Y i j r to the general linear model that involves only the main effect of parents of set A and the main effect of parents of set B. Compute the model’s unstandardized residuals e i j r . The general form of the linear model is the following:
Y = μ + A + Β + e,
where Y is the yield values, A is the main effect of parents of set A, B is the main effect of parents of set B, μ is the grand mean (estimated by Y ¯ ), and e is the vector of the model’s residuals.
For each combination AiBj compute the mean value of the residuals e i j r . These mean values are the SMA indices for the parents’ combinations (interaction) of the two sets A and B.

2.2.8. Statistical Analysis

The data for Normalized Difference Vegetation Index (NDVI) and Leaf Greenness Index (SPAD) were analyzed with the analysis of variance (ANOVA) method within the methodological frame of General Linear Models. For both characteristics, the corresponding model included the effects (main and interactions) of the factors, “block” (4 blocks), “year” (two growing seasons: 2020–2021 and 2021–2022), “treatment” (the monocrops of the two varieties of bread wheat, the four varieties of faba bean, and the eight intercropping combinations, resulting in 14 treatments and a total of 56 experimental plots), and “growth stage” (two stages: full bloom and grain filling). In this model, all factors were entered as fixed effects factors except “block”, which was entered as a random effects factor. The statistical analysis of the above model is equivalent to a combined analysis over the two years and the two growth stages. In this approach, the analysis was based on an RCB design with a split split-plot arrangement. The two years were considered as the main plots, the 14 treatments as the sub-plots, and the two growth stages as the sub sub-plots [54,55]. Data for plant height and Leaf Area Index (LAI) data were measured at three growth stages (jointing, full bloom, and grain filling). Preliminary analyses of height and LAI data (according to the above-mentioned model) showed that the effect size of the factor “growth stage” was “huge” compared to some other effects (main and interactions) and masked their effects [Table S2, see the corresponding partial eta squared (η2) indices]. For this reason, the analysis was performed separately within each growth stage. Data for spikes per plant, pods per plant, seeds per spike, seeds per pod, dry weight, grain yield, Light Penetration Depth (LPD), Normalized Pigment Chlorophyll Index (NPCI), Plant Senescence Reflectance Index (PSRI), and Land Equivalent Ration (LER) were measured only once during each year and the corresponding ANOVAs were performed according to an RCB design with a split-plot arrangement. The two years were considered as the main plots and the 14 treatments as the sub-plots. The “protected” Least Significant Difference (LSD) criterion was used for testing the differences among mean values. In all hypothesis testing procedures, the significance level was predetermined at a = 0.05 (p ≤ 0.05). The GMA and SMA indices were estimated according to the methodology proposed by [51]. All statistical analyses were accomplished with the IBM SPSS Statistics for Windows, Version 26.0 statistical software (IBM Corporation, Armonk, New York, United States). The homoscedasticity and normality of residuals and the assumption of additivity were checked for each model, and no significant violations were found. One of the authors (GM) wrote an SPSS syntax code for performing the above-mentioned statistical analyses for linear models and the estimation of GMA and SMA indices.

3. Results

3.1. Morphological Characteraistics

3.1.1. Plant Height

Plant height of wheat plants was affected by the main effects of “year” (p = 0.008 and p = 0.039, respectively) and “treatment” (p < 0.001 and p = 0.002, respectively) at the jointing and full bloom growth stage (Tables S3 and S4). At the grain filling stage, plant height was affected only by the main effect of “treatment” (p = 0.010) (Table S5). During the first year, at the jointing growth stage (BBCH 31), Elissavet plants were taller than Flamenko plants, in monocrop and also in intercrops (0.50–0.55 m compared to 0.35–0.45 m, respectively) (Table 3). The same pattern was observed at the full bloom, while at the grain filling stage, the differences were minimized. Additionally, during the second year, both wheat cultivars were shorter than the first year, with Flamenko having shorter plants than Elissavet, especially in intercrop with Nebraska at the jointing growth stage (0.27 m compared to 0.34 m, respectively). Moreover, at the second and third growth stages, in Flamenko, the plants were taller in monoculture than in intercropping (Table 3).
Plant height of faba bean cultivars, at the first growth stage, was affected by the main effect of “year” (p < 0.001) and “treatment” (p < 0.001) and also by the “year × treatment” interaction (p = 0.009) (Table S3). At the second growth stage, plant height was affected by the main effect of “year” (p = 0.003) and “treatment” (p = 0.004) (Table S4). At the grain filling stage, plant height was affected only by the main effect of “treatment” (p < 0.001) (Table S5). More specifically, during the first year (2020–2021) and at the first growth stage, faba bean cultivars were taller in intercrop treatments compared to monocrops, as they tried to outcompete wheat plants mainly for sunlight. Depending on the cultivar that was used, plant height varied from 0.24 m to 0.38 m for intercrops and from 0.21 m to 0.26 m in monocultures (Table 4). Moreover, at the second measurement, there were not any statistically significant differences between the intercropping treatments. On the other hand, different weather conditions during the second year led to shorter plants than the first one, in particular at the jointing stage, where there were no significant differences. Plants of Polycarpi and Nebraska cultivars were tallest in monoculture treatment both at the full bloom and at the grain filling period. Regarding the intercrop treatments, Nebraska had comparably high plants to monoculture, while Polycarpi was affected unfavorably by the wheat companion (Table 4).

3.1.2. Leaf Area Index (LAI)

Leaf area index was affected by the main effects of “year” (p = 0.001), “treatment” (p < 0.001), and also by the interaction “year × treatment” (p < 0.001) for the first growth stage (Table S3). For the second growth stage, LAI was affected by the main effect of “year” (p = 0.003) and the interaction “year × treatment” (p = 0.007) (Table S4), while for the third growth stage, there were not any significant differences (Table S5). More specifically, in the first year, the lowest values of LAI were observed at the jointing stage, while the highest was at the grain filling. Flamenko-Polycarpi recorded the lowest values of LAI at all growth stages, while Organdi monoculture showed the highest values (Table 5). During the second year of experimentation, the lowest values of LAI were observed at the first growth stage, while for most treatments, the highest values were observed at the full bloom stage. At the first growth stage, Elissavet had the highest LAI values (2.01), followed by Flamenko (1.36), whereas Organdi monoculture had the lowest (0.24). At the full bloom stage, Elissavet-Polycarpi treatment obtained a value of 3.44, which was significantly higher than Organdi (2.15), Elissavet-Bumble (2.34), and Bumble (2.54), while the other treatments did not differ significantly between each other. Finally, at the grain filling stage, Flamenko sole crop treatment recorded a value of 3.45, while Elissavet-Bumble had LAI below 2.50 (2.40) (Table 5).

3.1.3. Normalized Difference Vegetation Index (NDVI)

The NDVI of wheat plants was affected by the main effects of “year” (p < 0.001) and “growth stage” (p < 0.001), the two-way interactions “year × treatment” (p < 0.001) and “treatment × growth stage” (p = 0.007), and the three-way interaction “year × treatment × growth stage” (p < 0.001) (Table S6). Table 6 reports the comparisons of mean values of NDVI at the two growth stages of wheat for the two years of the different intercropping systems (treatments). During the first year (2020–2021), there were not any significant differences between the treatments for the full bloom stage, while at the grain filling stage, Elissavet and Elissavet-Organdi treatments had lower NDVI values than Flamenko-Organdi. Higher values were observed at the grain filling stage compared to the full bloom. At the second year, NDVI values were lower in contrast with the first year. Furthermore, while at the full bloom stage, Flamenko cultivar treatment recorded lower values than Elissavet treatments; at the grain filling stage, this pattern was reversed with Elissavet cultivar obtaining significantly higher values both for monoculture and intercrop (from 0.617 to 0.629), compared to Flamenko cultivar (from 0.555 to 0.589) (Table 6).
The NDVI index of faba bean plants was influenced by the main effects of “year” (p < 0.001), “treatment” (p = 0.004), “growth stage” (p = 0.002), and the interactions “year × treatment” (p < 0.001) and “year × growth stage” (p < 0.001) (Table S6). More specifically, in the first year, at the full bloom, the highest NDVI values were obtained from Flamenko-Organdi and Flamenko-Nebraska treatments (0.652 and 0.653, respectively), while the lowest were obtained for Polycarpi and Bumble monocrops (0.619 and 0.615, respectively) (Table 6). At the second growth stage, Flamenko-Organdi treatment had the highest value (0.654), while Elissavet-Bumble intercrop had the lowest (0.591). Regarding the second year of experimentation, lower mean values of NDVI were observed at the full bloom compared to the grain filling stage. Also, for Nebraska cultivar, the highest mean values were measured in the first growth stage, while at the grain filling stage, Polycarpi and Elissavet-Polycarpi had the highest values (Table 6).

3.1.4. Leaf Greenness Index (SPAD)

According to the analysis of variance, leaf greenness index (SPAD) of wheat plants was affected by the main effect of “growth stage” (p < 0.001) and the two-way interaction “year × growth stage” (p < 0.001) (Table S6), with higher values recorded at the grain filling stage compared to the full bloom. At the full bloom stage of the first year, Elissavet showed a lower value (43.3) compared to Flamenko (48.8) in monocrop treatment. However, between the intercrop treatments, values of SPAD were similar for both cultivars. Furthermore, at the grain filling stage, Elissavet-Nebraska intercrop values (66.3) outweighed the other treatments, although there were no significant differences. For the second year of the experiment, intercropping treatments recorded increased values compared to the monocultures for both cultivars, without any significant differences (Table 7).
Leaf greenness index (SPAD) of faba bean plants was affected by the main effects of “year” (p = 0.007), “treatment” (p < 0.001), and “growth stage” (p = 0.004), as well as the two-way interaction “treatment × growth stage” (p < 0.001) (Table S6), with higher values recorded at the grain filling stage compared to the full bloom. At the first year and the full bloom stage, the highest values were recorded for Nebraska cultivar, either in monoculture or intercrop (Table 7). On the contrary, Polycarpi cultivar in monoculture and its intercrop with Elissavet obtained the lowest values (44.7 and 43.2, respectively), along with Organdi cultivar in its intercrop with Elissavet (45.4). Moreover, values at the grain filling stage varied from 45.4 to 56.8. During the second year, the leaf greenness index ranged from 42.5 to 50.2 at the full bloom stage with Nebraska treatments (monocrop and intercrops) showing the highest values. On the other hand, at the grain filling stage, leaf greenness index values of all cultivars decreased in the intercropping treatments. The descending order of the cultivar values was Organdi > Nebraska > Polycarpi > Bumble (Table 7).

3.1.5. Dry Matter Yield, Grain Yield, and Yield Components

According to the analysis of variance, the main effect of “treatment” (p = 0.004) affected the number of spikes per plant, while the number of pods per plant was affected by the main effects of “year” (p = 0.042), “treatment” (p < 0.001), and the two-way interaction “year × treatment” (p < 0.001) (Table S7). In the first year, the number of spikes per plant ranged from 6 to 9 and the number of pods per plant ranged from 5 to 8 (Table 8). However, in the second year, Flamenko had 10 to 11.3 spikes per plant, which was significantly higher than Elissavet, which varied from 6.8 to 8.3. Moreover, regarding the number of pods per plant, for the first year, no significant differences were detected (values ranged from 4.7 to 8.4 among different cultivars and cropping systems). In the second year, all faba bean cultivars were adversely affected by intercropping, as the number of pods per plant was significantly lower at these treatments regardless of the wheat cultivar intercropped with. In particular, values for intercrop ranged from 3 to 9.3 depending on the faba bean cultivar used, while for monoculture, values ranged from 11.3 to 19.3.
The number of seeds per spike was affected by the main effects of “year” (p < 0.001) and “treatment” (p < 0.001), while the number of seeds per pod was not affected by any parameter (Table S7). For the first year, the lowest number of seeds per spike was observed for the Flamenko-Nebraska treatment (21.8), while the highest was recorded for the intercrops of Elissavet-Polycarpi and Elissavet-Organdi (36.1 and 36.6, respectively) (Table 8). For the second year, Elissavet had a higher number of seeds per spike in contrast to Flamenko, either in monoculture or intercrop treatments (Table 8). Moreover, Polycarpi and Nebraska monocrops had the highest number of seeds per pod, whereas Elissavet-Organdi and Flamenko-Organdi had the lowest values (3.5, 3.7, 2.2, 1.9, respectively).
Plants dry weight was affected by the main effect of “treatment” (p < 0.001) and the two-way interaction “year × treatment” (p < 0.001) (Table S8). More specifically, during the first year, the highest dry weight was observed for the two wheat cultivar monocrops Elissavet and Flamenko (11.15 t ha−1 and 11.74 t ha−1, respectively) (Table 9). Also, the dry weights of four faba bean monoculture treatments were significantly lower than those of wheat cultivars, but there were not any statistically significant differences between the four faba bean cultivars. Finally, all intercropping treatments, excluding Elissavet-Bumble and Flamenko-Nebraska, produced an intermediate dry weight between the wheat and faba bean monocultures that were used (Table 9). The same pattern was recorded during the second year, where the intercropping systems and the wheat monocrops had similar and high dry yields compared with the four faba bean treatments. It is worth noting that Polycarpi monoculture had the highest dry matter yield among the four faba bean cultivars, while Organdi had the lowest (5.72 t ha−1 and 1.70 t ha−1, respectively).
According to the analysis of variance, grain yield was affected by the main effect of “treatment” (p < 0.001) and the two-way interaction “year × treatment” (p = 0.006) (Table S9). The first year, wheat monocrops had the highest grain yield of all the treatments that were used (Table 9). Also, faba bean monocultures grain yield was satisfactory and varied from 1.59 t ha−1 up to 2.20 t ha−1. Regarding the intercropping treatments, grain yield ranged from 2.34 t ha−1 to 3.73 t ha−1, which indicates that the grain yield of intercropping treatments ranged between the two species’ sole crops. On the other hand, during the second year, Organdi, Nebraska, and Bumble had significantly decreased yield, in contrast to the first year, while Polycarpi, which is a local variety, maintained its yield at a satisfactory level. However, intercrop treatments were not affected by this decrease, giving high yield, indicating a “compensation” effect.

3.1.6. Phenotyping Tools Used in the Study

The three phenotyping indices that were used were Light Penetration Depth (LPD), Normalized Pigment Chlorophyll Index (NPCI), and Plant Senescence Reflectance Index (PSRI). LPD was not affected by any factor of the study (Table S10 and Table 10). Moreover, Normalized Pigment Chlorophyll Index (NPCI) was affected by the main effect of “year” (p < 0.001), “treatment” (p < 0.001), and the two-way interaction “year × treatment” (p < 0.001) (Table S10). In particular, faba bean sole crops recorded lower NPCI values compared to wheat monoculture and the intercropping treatment with both wheat cultivars. Following Plant Senescence Reflectance Index (PSRI) was affected only by the main effect of “year” (p < 0.001) (Table S10). In the first year, between the monocrop treatments, both wheat cultivars obtained increased values compared to the faba bean monocultures. Among the different intercrops, treatments with Polycarpi showed the highest values (0.668 for Elissavet-Polycarpi and 0.762 for Flamenko-Polycarpi), while treatments with Organdi obtained the lowest values (0.613 for Elissavet-Organdi and 0.539 for Flamenko-Organdi), regardless of the wheat companion. Even though there were not any significant differences in the second year of experimentation, similar to NPCI, PSRI values of Flamenko cultivar treatments obtained lower values in contrast to Elissavet cultivar treatments (Table 10).

3.1.7. Land Equivalent Ratio (LER)

According to Table 11, values of Land Equivalent Ratio (LER) ranged between 0.68 and 1.30 across the two years. For the first year, Elissavet-Organdi, and Flamenko-Bumble had a LER above 1 (1.01 and 1.04, respectively), while in the second year, Flamenko-Nebraska had a LER = 1.09. Moreover, for both years of experimentation, the combination of Flamenko-Polycarpi was above 1.00, in particular, 1.30 in first year (2020–2021) and 1.19 in the second year (2021–2022). More specifically, considering pLER values, for the intercrops of Elissavet-Organdi, Flamenko-Nebraska, and Flamenko-Polycarpi in the second year, the contribution of wheat at the LER index was significantly higher than 50%. On the other hand, for Flamenko-Polycarpi in 2020–2021 and Flamenko-Bumble, both species contributed almost equally to the total LER (Table 11). According to Figure 1, most intercrop combinations were distributed at the lower right quadrant (4th quadrant) for both years, which indicates that wheat cultivars were more competitive than the faba bean cultivars. In addition, there was a mixture Flamenko-Polycarpi that was located at the right quadrant, and this indicates that there is a complementarity and cooperation, leading to an advantage from intercropping compared to the pure stands.

3.1.8. General Mixing Ability (GMA) and Specific Mixing Ability (SMA) Indices

The values for General Mixing Ability (GMA) and Specific Mixing Ability (SMA) varied between the two years and depended on the species and also the cultivars that were intercropped (Table 12). Regarding the two wheat cultivars, Elissavet showed positive values for GMA in 2020–2021, while Flamenko had positive values in the second year (2021–2022). For faba bean cultivars, Polycarpi had the highest positive values for both years and Nebraska had the negative values. Based on the SMA, Flamenko–Polycarpi and Elissavet–Organdi showed positive values both years, while the combination of Nebraska and Bumble with the two wheat cultivars differed from one year to the other.

4. Discussion

Cultivar selection and the use of appropriate cultivars for intercropping is an important component of the intercropping system that affects yield, as was found in several studies with various species combination [23,24,56,57]. However, the effect of using different cultivars was not determined in faba bean intercrops, especially with wheat. Despite the fact that it is known that the use of the right cultivar on the intercropping system is important for the productivity of the intercropping system, there are no cultivars that were produced through breeding programs that can be used in intercropping systems [28]. Therefore, the farmers are using cultivars that were bred for monocropping systems, since there are no alternative cultivars [56]. In the present study, it was found that there are specific cultivars that can be used in an intercropping system of faba bean with wheat that have a higher grain yield and also higher yield components (number of spikes per plant, number of seeds per spike for wheat, number of pods per plant, and number of seeds per pod for faba bean). In addition, the proper use of cultivars in an intercropping system can have a complementary effect and result in higher yield because the cultivars can use the environmental resources more efficiently [24,47].
It was also shown that the environment can have a significant effect on intercropping yield [24,58]. A similar trend was found in the present study as the grain yield and the other characteristics that were studied were different between the two years, and this affected the performance of the cultivars in the intercropping systems. Therefore, the performance of the intercropping systems can be affected by climate, soil conditions, biotic and abiotic conditions, together with the crop management. Moreover, the interaction of cultivars and the environment has been reported in other studies to be important [58], and is a reason why some cultivars respond better in some years, although it is not known why there is this difference as the response of the cultivar to certain conditions can vary considerably [25,59,60,61].

4.1. Plant Height

The plant height of Elissavet plants was higher than Flamenko cultivars, either in monocrop or in intercrops with faba bean at the jointing growth stage and also at full bloom, while at the grain filling stage, the differences were minimal. Faba bean cultivars were taller in intercrop treatments compared to monocrops, as they tried to outcompete wheat plants mainly for sunlight, as was reported in other studies [18,19]. Following this, at the second and third measurement, there were not any significant differences among the intercropping treatments. On the other hand, different weather conditions during the second year led to shorter plants than the first one, in particular at the jointing stage, where there were no significant differences. Plants of Polycarpi and Nebraska cultivars were tall in monoculture treatment both at the full bloom and at the grain filling period. Regarding the intercrop treatments, Nebraska had comparably high plants to monoculture, while Polycarpi was affected unfavorably by the wheat companion, indicating a competition effect from wheat cultivars.

4.2. Leaf Area Index

Leaf area index showed the lowest values at the jointing stage, while the highest values were found at the grain filling period. Although there were no significant differences between the different treatments in each growth stage, Flamenko–Polycarpi recorded the lowest values of LAI at all growth stages, while Organdi monoculture had the highest values. Leaf area index is an important characteristic of crop plants as it gives the opportunity to cover the soil surface and be competitive to weeds and at the same time intercept light and use it for growth more efficiently [1,47]. Some of the mixtures showed a higher LAI, especially during the second year, and this was observed in other studies [36].

4.3. Normalized Difference Vegetation Index (NDVI)

The index NDVI is an index that was used to determine the growth of the crop plants [62]. However, it was not used in intercropping experiments as it has the potential to be a useful index for determining the growth of the plants and to be used in intercropping systems. At the grain filling stage, the Elissavet cultivar had higher values both for monoculture and intercrop compared to the Flamenko cultivar. For the faba bean cultivars, the highest NDVI values were found at Flamenko–Organdi and Flamenko–Nebraska treatments, while the lowest were found for Polycarpi and Bumble monocrops during the first year and at the full bloom growth stage. At the second growth stage, Flamenko–Organdi treatment showed the highest value, whereas Elissavet–Bumble intercrop had the lowest. Similarly, NDVI can be affected by the intercropping treatments, as was shown in other studies [63]; however, there was no information about the faba bean–wheat intercrops and how the different cultivars and their combinations can affect the NDVI index.

4.4. Leaf Greenness Index

Leaf greenness index (SPAD) is an index that was used in different studies to describe the stay-green characteristic and the longevity of the leaf area [64,65]. Wheat plants had the highest values at the grain filling stage compared to the full bloom. However, between the intercrop treatments, values of SPAD were similar for both wheat cultivars. For the second year of experimentation, intercropping treatments recorded increased values compared to the monocultures for both cultivars, without any significant differences. In the case of faba beans, leaf greenness index (SPAD) was higher at the grain filling stage compared to the full bloom. Also on the other hand, at the grain filling stage, SPAD values of all cultivars decreased in the intercropping treatments, indicating leaf senescence as the plants close to maturity [65].

4.5. Grain Yield and Yield Components

Grain yield was affected by the year, as during the second year, Organdi, Nebraska, and Bumble had significantly decreased yield, in contrast to the first year. Polycarpi, which is a cultivar that was bred in Greece, maintained its yield at a satisfactory level in both years as it can be better adapted to the local environment. However, intercrop treatments were not affected by this decrease, giving high yield, indicating a “compensation” effect. This effect can be because the two plant species used the environmental resources more efficiently and showed complementary and overall higher yield. Similar responses were found in other studies where there were cultivars better adapted to intercropping systems and some pairs of these cultivars showed higher yield [24,66]. The importance of using the right cultivar was highlighted in other studies and in a variety of crop species such as wheat, barley, oat, common vetch, pea, and the faba bean in the present study [24,34]. In addition, the effect of using the proper cultivars for intercropping depends on the environmental conditions and especially on rainfall, as it affects the growth of cereals and legumes in a different way [14,66].
The yield components as the number of spikes per plant as well as the number of pods per plant during the first year, while in the second year, both parameters were affected. Regarding the number of pods per plant, for the first year, no significant differences were detected. However, in the second year, all faba bean cultivars were adversely affected by intercropping. Similarly, the yield components can follow the response of total grain yield, as was found in other studies [24]. However, it was reported that despite the fact that there was grain yield increase, it was not always followed by the increase in grain yield components [14]. Also, there were differences in the climatic conditions as the average temperature was higher during the two years of the experiments compared with the 30-year average, and also rainfall was significant lower during 2022. These climatic effects can affect the yield components and also the grain yield, as was reported in other studies where higher temperatures reduced the number of tillers and grain yield [67]. In addition, in legumes, higher temperatures decrease the yield components in faba beans [14,16]. Therefore, climate variability, which is a result of climate change, makes it difficult to draw a safe conclusion.

4.6. Dry Weight Yield

Plants dry weight was affected by the main effect of treatment for both years of experimentation. More specifically, during the first year, the highest dry weight was observed for the two wheat monocrops Elissavet and Flamenko. Also, dry weight yields of four faba bean monoculture treatments were significantly lower than those of wheat cultivars and there were not any statistically significant differences between the four faba bean cultivars. Finally, all intercropping treatments, excluding Elissavet-Bumble and Flamenko-Nebraska, produced comparable dry weight yield with the two wheat monocultures that were used. The same pattern was recorded during the second year, where the intercropping systems and the wheat monocrops had similar and high dry weight yields compared with the four faba bean treatments. It is worth noting that Polycarpi monoculture had the highest dry matter yield among the four faba bean cultivars, while Organdi had the lowest (5.72 t ha−1 and 1.70 t ha−1, respectively). Also, in other studies, it was found that dry matter yield was higher in some intercropping treatments, and it was comparable to cereal monocrops [68,69,70,71,72]. Also, cereals are better adapted to a dry climate and in many studies, cereal monocrops had higher dry matter production than legumes, which are affected more by the dryland conditions than the cereals [18,36]. Dry matter yield followed a similar trend with the grain yield as it was higher in the Elissavet-Organdi treatment, followed by the Flamenko-Polycarpi. A similar response was found in other crop species, as when there was an increase in grain yield, there was an increase in dry matter yield [18,24,36].

4.7. Phenotyping Tools Used in the Present Study

Several phenotyping indices were developed and used in present study, including Light Penetration Depth (LPD), Normalized Pigment Chlorophyll Index (NPCI), and Plant Senescence Reflectance Index (PSRI). LPD was not affected by the treatment in both years. Normalized Pigment Chlorophyll Index (NPCI) was affected by the treatment only during the first year. In particular, faba bean sole crops recorded lower NPCI values compared to wheat monoculture and the intercropping treatment with both wheat cultivars. More specifically, the highest value was recorded in Elissavet monoculture and the lowest in Polycarpi monocrop. During the second year of experimentation, treatment of Flamenko cultivar (sole crop and intercrop) exhibited lower values of NPCI compared to Elissavet cultivar treatment. Plant Senescence Reflectance Index (PSRI) was affected by the treatment for the first year only as both wheat cultivars obtained increased values compared to the faba bean monocultures. Intercrops with the Polycarpi cultivar showed the highest values, while intercropping treatments with Organdi showed the lowest values. High throughput phenotyping tools were used extensively in evaluating a number of genotypes and also to study the response in biotic and abiotic stress [73]. However, high throughput phenotyping was not used to study cropping systems and especially intercropping systems.

4.8. LER and Partial LER

Land Equivalent Ratio (LER) is an index that was used extensively in intercropping systems to describe the productivity of the system of using the environmental resources more efficiently compared with monocropping. When the LER is greater than one, there is an advantage in intercropping, and when the LER is below one, there is a disadvantage in intercropping [6]. Similarly, when partial LER values are above 0.5, it means that the companion crop is grown more than in the monocrop, and when the partial LER is below 0.5, it is less productive than monocropping [6,46]. Also, when the LER values are more than 1.0, more land is required for a monocropping system to produce the same yield as the intercropping system [6,46]. Therefore, these intercropping systems show high productivity and can be adapted from the farmers as they respond better under different environments [1,47]. In the present study, the values of Land Equivalent Ratio (LER) ranged between 0.68 to 1.30 across the two years. Moreover, for both years of experimentation, the combination of Flamenko-Polycarpi was above 1, in particular, 1.30 in the first year and 1.19 during the second year. More specifically, considering partial LER values, for the intercrops of Elissavet-Organdi, Flamenko-Nebraska, and Flamenko-Polycarpi in the second year, the contribution of wheat at the LER index was significantly higher than 50%. On the other hand, for Flamenko-Polycarpi in 2020–2021 and Flamenko-Bumble, both species contributed almost equally to the total LER. The bivariate diagram that was constructed using the partial LER values for both species showed that in some treatments, faba beans had higher LER values than 0.5, indicating the competitive ability of these cultivars [74,75]. In addition, there was a mixture of Flamenko-Polycarpi that was located at the right quadrant, and this indicates that there is a complementarity and cooperation, leading to an advantage from intercropping compared to the pure stands [24,47,74]. Therefore, there were proper combinations of cultivars that showed better utilization of environmental resources and especially in a mediterranean environment, leading to higher yield.

4.9. GMA and SMA

The different indices that were proposed to describe the intercropping system do not give any information about the ability of different cultivars to be used in intercropping systems. The adaption of the General Mixing Ability (GMA) and Specific Mixing Ability (SMA) from breeding studies provides information of whether a cultivar can be used in a specific combination and whether it is better than other combinations [24,56]. The values for GMA and SMA varied between the two years and depended on the species and also the cultivars that were tested. Regarding the two wheat cultivars, Elissavet showed positive values for GMA in 2020–2021, while Flamenko had the positive values in the second year. In contrast, faba bean cultivar Polycarpi had the highest positive values for both years, while Nebraska showed negative values. Based on the SMA, Flamenko-Polycarpi and Elissavet-Organdi had positive values for both years, while the combination of Nebraska and Bumble with the two wheat cultivars showed a different trend from year to year. Also, SMA showed variability during the two years of the study, which means that the environment affects the response of the different cultivars in the intercropping systems [24]. Therefore, the selection of cultivars adapted to intercropping conditions should be done using different methods such as trait-based, index-based, and diallel-based selection [76], or using the experience that the farmers have through participatory breeding [56].

5. Conclusions

The intercropping system was studied extensively in recent years, and one of the most important factors which affects the productivity is the genotype that is used. The characteristics that were found that can be used to describe the performance of the intercropping system are plant height, LAI, dry matter yield, and seed yield. Therefore, in the present study, it was found that the cultivar that can be used in an intercropping system is Flamenko-Polycarpi. This combination has a higher yield and LER values, GMA, and SMA over the two years of the study, and it indicated that there is a complementarity effect for exploiting the environmental resources. In addition, another mixture that can be used by the farmers is Elissavet-Organdi, which also has high grain yield and positive values for most indices. Therefore, intercropping systems of wheat with faba beans can be used by the farmers as they can give higher grain yield and utilize the environmental resources more efficiently. Moreover, these indices can be used in a variety of crop species to determine the best combination of cultivars that can be used in intercropping systems.

Supplementary Materials

The following supporting information can be downloaded at: https://www.mdpi.com/article/10.3390/agronomy14010070/s1. Table S1: Wheat and Faba bean cultivars characteristics description; Table S2: Results of analysis of variance (significance and effect size) combined over years and growth stages, for the parameters of wheat plant height, faba bean plant height and Leaf Area Index (LAI). Also, the coefficient of variation (CV) is presented. CV coefficient was calculated using the mean square of Error c. P is the p-value (observed significance level) and η2 is the partial eta squared, for each source of variance. MSE is the value of mean square error; Table S3: Results of analysis of variance, combined over years, for the first growth stage, for the parameters of wheat plant height, faba bean plant height and Leaf Area Index (LAI). Also, the coefficient of variation (CV) is presented. CV coefficient was calculated using the mean square of Error b. P is the p-value (observed significance level) and η2 is the partial eta squared, for each source of variance. MSE is the value of mean square error; Table S4: Results of analysis of variance, combined over years, for the second growth stage, for the parameters of wheat plant height, faba bean plant height and Leaf Area Index (LAI). Also, the coefficient of variation (CV) is presented. CV coefficient was calculated using the mean square of Error b. P is the p-value (observed significance level) and η2 is the partial eta squared, for each source of variance. MSE is the value of mean square error; Table S5: Results of analysis of variance, combined over years, for the third growth stage, for the parameters of wheat plant height, faba bean plant height and Leaf Area Index (LAI). Also, the coefficient of variation (CV) is presented. CV coefficient was calculated using the mean square of Error b. P is the p-value (observed significance level) and η2 is the partial eta squared, for each source of variance. MSE is the value of mean square error; Table S6: Results of analysis of variance, combined over years and two growth stages, for the parameters of wheat Normalized Difference Vegetation Index (NDVI), faba bean Normalized Difference Vegetation Index (NDVI), wheat chlorophyll content and faba bean chlorophyll content. Also, the coefficient of variation (CV) is presented. CV coefficient was calculated using the mean square of Error c. P is the p-value (observed significance level) and η2 is the partial eta squared, for each source of variance. MSE is the value of mean square error; Table S7: Results of analysis of variance, combined over years, for the parameters of spikes per plant, pods per plant, seeds per spike and seeds per pod. Also, the coefficient of variation (CV) is presented. CV coefficient was calculated using the mean square of Error b. P is the p-value (observed significance level) and η2 is the partial eta squared, for each source of variance. MSE is the value of mean square error; Table S8: Results of analysis of variance, combined over years, for the parameter of Dry weight. Also, the coefficient of variation (CV) is presented. CV coefficient was calculated using the mean square of Error b. P is the p-value (observed significance level) and η2 is the partial eta squared, for each source of variance. MSE is the value of mean square error; Table S9: Results of analysis of variance, combined over years, for the parameters of wheat seed yield, faba bean seed yield, as well as the total plot seed yield. Also, the coefficient of variation (CV) is presented. CV coefficient was calculated using the mean square of Error b. P is the p-value (observed significance level) and η2 is the partial eta squared, for each source of variance. MSE is the value of mean square error; Table S10: Results of analysis of variance, combined over years, for the parameters of Light Penetration Depth (LPD), Normalized Pigment Chlorophyll Index (NPCI) and Plant Senescence Reflectance Index (PSRI). Also, the coefficient of variation (CV) is presented. CV coefficient was calculated using the mean square of Error b. P is the p-value (observed significance level) and η2 is the partial eta squared, for each source of variance. MSE is the value of mean square error. Ref. [77] is cited in the supplementary materials.

Author Contributions

All authors made significant contributions to the manuscript. A.M. conducted the experiments and wrote the manuscript, P.P. conducted the experiments and wrote the manuscript, C.P. conducted the experiments. A.L. designed and took care of the experiments. G.M. was responsible for the statistical analysis. C.D. was responsible for conducting the experiments, writing, and also reviewing the manuscript. All authors have read and agreed to the published version of the manuscript.

Funding

This project Biodiversify (Boost ecosystem services through high Biodiversity-based Mediterranean Farming systems) is funded by the General Secretariat for Research and Technology of the Ministry of Development and Investments under the PRIMA Programme. PRIMA is an Art.185 initiative supported and co-funded under Horizon 2020, the European Union’s Programme for Research and Innovation.

Data Availability Statement

The data presented in this study are available on request from the corresponding author. The data are not publicly available due to privacy restrictions.

Acknowledgments

We are grateful to Pantazis Georgiou for the provided climatic data, and the personnel of the University Farm of Aristotle University of Thessaloniki for assistance with the field experiments.

Conflicts of Interest

The authors declare no conflicts of interest.

References

  1. Stomph, T.; Dordas, C.; Baranger, A.; de Rijk, J.; Dong, B.; Evers, J.; Gu, C.; Li, L.; Simon, J.; Jensen, E.S.; et al. Designing intercrops for high yield, yield stability and efficient use of resources: Are there principles? Adv. Agron. 2020, 160, 1–50. [Google Scholar] [CrossRef]
  2. Isbell, F.; Adler, P.R.; Eisenhauer, N.; Fornara, D.; Kimmel, K.; Kremen, C.; Letourneau, D.K.; Liebman, M.; Polley, H.W.; Quijas, S.; et al. Benefits of increasing plant diversity in sustainable agroecosystems. J. Ecol. 2017, 105, 871–879. [Google Scholar] [CrossRef]
  3. Raseduzzaman, M.D.; Jensen, E.S. Does intercropping enhance yield stability in arable crop production? A meta-analysis. Eur. J. Agron. 2017, 91, 25–33. [Google Scholar] [CrossRef]
  4. Verret, V.; Gardarin, A.; Pelzer, E.; Médiène, S.; Makowski, D.; Valantin-Morison, M. Can legume companion plants control weeds without decreasing crop yield? A meta-analysis. Field Crops Res. 2017, 204, 158–168. [Google Scholar] [CrossRef]
  5. Gu, C.; Bastiaans, L.; Anten, N.P.; Makowski, D.; van der Werf, W. Annual intercropping suppresses weeds: A meta-analysis. Agric. Ecosyst. Environ. 2021, 322, 107658. [Google Scholar] [CrossRef]
  6. Lithourgidis, A.S.; Dordas, C.A.; Damalas, C.A.; Vlachostergios, D. Annual intercrops: An alternative pathway for sustainable agriculture. Aust. J. Crop Sci. 2011, 5, 396–410. [Google Scholar]
  7. Cappelli, S.L.; Domeignoz-Horta, L.A.; Loaiza, V.; Laine, A.L. Plant biodiversity promotes sustainable agriculture directly and via belowground effects. Trends Plant Sci. 2022, 27, 674–687. [Google Scholar] [CrossRef]
  8. Ren, W.; Hu, L.; Zhang, J.; Sun, C.; Tang, J.; Yuan, Y.; Chen, X. Can positive interactions between cultivated species help to sustain modern agriculture? Front Ecol. Environ. 2014, 12, 507–514. [Google Scholar] [CrossRef]
  9. Bennett, E.M.; Baird, J.; Baulch, H.; Chaplin-Kramer, R.; Fraser, E.; Loring, P.; Morrison, P.; Parrott, L.; Sherren, K.; Winkler, K.J.; et al. Ecosystem services and the resilience of agricultural landscapes. Adv. Ecol. Res. 2021, 64, 1–43. [Google Scholar]
  10. Brooker, R.W.; George, T.S.; Homulle, Z.; Karley, A.J.; Newton, A.C.; Pakeman, R.J.; Schöb, C. Facilitation and biodiversity–ecosystem function relationships in crop production systems and their role in sustainable farming. J. Ecol. 2021, 109, 2054–2067. [Google Scholar] [CrossRef]
  11. Tilman, D.; Cassman, K.G.; Matson, P.A.; Naylor, R.; Polasky, S. Agricultural sustainability and intensive production practices. Nature 2002, 418, 671–677. [Google Scholar] [CrossRef] [PubMed]
  12. Doré, T.; Makowski, D.; Malézieux, E.; Munier-Jolain, N.; Tchamitchian, M.; Tittonell, P. Facing up to the paradigm of ecological intensification in agronomy: Revisiting methods, concepts and knowledge. Eur. J. Agron. 2011, 34, 197–210. [Google Scholar] [CrossRef]
  13. Glaze-Corcoran, S.; Hashemi, M.; Sadeghpour, A.; Jahanzad, E.; Afshar, R.K.; Liu, X.; Herbert, S.J. Understanding intercropping to improve agricultural resiliency and environmental sustainability. Adv. Agron. 2020, 162, 199–256. [Google Scholar]
  14. Papastylianou, P.; Vlachostergios, D.N.; Dordas, C.; Tigka, E.; Papakaloudis, P.; Kargiotidou, A.; Pratsinakis, E.; Koskosidis, A.; Pankou, C.; Kousta, A.; et al. Genotype X environment interaction analysis of faba bean (Vicia faba L.) for biomass and seed yield across different environments. Sustainability 2021, 13, 2586. [Google Scholar] [CrossRef]
  15. Abou-Khater, L.; Maalouf, F.; Jighly, A.; Rubiales, D.; Kumar, S. Adaptability and stability of faba bean (Vicia faba L.) accessions under diverse environments and herbicide treatments. Plants 2022, 11, 251. [Google Scholar] [CrossRef]
  16. Papakaloudis, P.; Dordas, C. Phosphorus Fertilization Affects Morphological, Physiological and Agronomic Characteristics of Faba Bean Cultivars. Sustainability 2023, 15, 13172. [Google Scholar] [CrossRef]
  17. Jensen, E.S.; Peoples, M.B.; Hauggaard-Nielsen, H. Faba bean in cropping systems. Field Crops Res. 2010, 115, 203–216. [Google Scholar] [CrossRef]
  18. Lithourgidis, A.S.; Dordas, C.A. Forage yield, growth rate, and nitrogen uptake of faba bean intercrops with wheat, barley, and rye in three seeding ratios. Crop Sci. 2010, 50, 2148–2158. [Google Scholar] [CrossRef]
  19. Dordas, C.A.; Lithourgidis, A.S. Growth, yield and nitrogen performance of faba bean intercrops with oat and triticale at varying seeding ratios. Grass Forage Sci. 2011, 66, 569–577. [Google Scholar] [CrossRef]
  20. Tavoletti, S.; Merletti, A. A comprehensive approach to evaluate durum wheat–faba bean mixed crop performance. Front. Plant Sci. 2022, 13, 733116. [Google Scholar] [CrossRef]
  21. Streit, J.; Meinen, C.; Rauber, R. Intercropping effects on root distribution of eight novel winter faba bean genotypes mixed with winter wheat. Field Crops Res. 2019, 235, 1–10. [Google Scholar] [CrossRef]
  22. Streit, J.; Meinen, C.; Nelson, W.C.D.; Siebrecht-Schöll, D.J.; Rauber, R. Above-and belowground biomass in a mixed cropping system with eight novel winter faba bean genotypes and winter wheat using FTIR spectroscopy for root species discrimination. Plant Soil 2019, 436, 141–158. [Google Scholar] [CrossRef]
  23. Nelson, W.C.D.; Siebrecht-Schöll, D.J.; Hoffmann, M.P.; Rötter, R.P.; Whitbread, A.M.; Link, W. What determines a productive winter bean-wheat genotype combination for intercropping in central Germany? Eur. J. Agron. 2021, 128, 126294. [Google Scholar] [CrossRef]
  24. Pankou, C.; Lithourgidis, A.; Menexes, G.; Dordas, C. Importance of selection of cultivars in wheat-pea intercropping systems for high productivity. Agronomy 2022, 12, 2367. [Google Scholar] [CrossRef]
  25. Davis, J.H.C.; Woolley, J.N. Genotypic requirement for intercropping. Field Crops Res. 1993, 34, 407–430. [Google Scholar] [CrossRef]
  26. Kiær, L.P.; Weedon, O.D.; Bedoussac, L.; Bickler, C.; Finckh, M.R.; Haug, B.; Iannetta, P.P.M.; Raaphorst-Travaille, G.; Weih, M.; Karley, A.J. Supply chain perspectives on breeding for legume–cereal intercrops. Front. Plant Sci. 2022, 13, 844635. [Google Scholar] [CrossRef] [PubMed]
  27. Litrico, I.; Violle, C. Diversity in plant breeding: A new conceptual framework. Trends Plant Sci. 2015, 20, 604–613. [Google Scholar] [CrossRef]
  28. Bourke, P.M.; Evers, J.B.; Bijma, P.; Van Apeldoorn, D.; Smulders, M.J.; Kuyper, T.; Mommer, L.; Bonnema, G. Breeding beyond monoculture: Putting the ‘intercrop’ into crops. Front. Plant Sci. 2021, 12, 734167. [Google Scholar] [CrossRef]
  29. Demie, D.T.; Döring, T.F.; Finckh, M.R.; Van Der Werf, W.; Enjalbert, J.; Seidel, S.J. Mixture × genotype effects in cereal/legume intercropping. Front. Plant Sci. 2022, 13, 846720. [Google Scholar] [CrossRef]
  30. Weih, M.; Adam, E.; Vico, G.; Rubiales, D. Application of crop growth models to assist breeding for intercropping: Opportunities and challenges. Front. Plant Sci. 2022, 13, 72048. [Google Scholar] [CrossRef]
  31. Timaeus, J.; Weedon, O.D.; Finckh, M.R. Harnessing the potential of wheat-pea species mixtures: Evaluation of multifunctional performance and wheat diversity. Front. Plant Sci. 2022, 13, 846237. [Google Scholar] [CrossRef] [PubMed]
  32. Ofori, F.; Stern, W.R. Cereal–legume intercropping systems. Adv. Agron. 1987, 41, 41–90. [Google Scholar]
  33. Baxevanos, D.; Tsialtas, I.T.; Vlachostergios, D.Ν.; Hadjigeorgiou, I.; Dordas, C.; Lithourgidis, A. Cultivar competitiveness in pea-oat intercrops under Mediterranean conditions. Field Crops Res. 2017, 214, 94–103. [Google Scholar] [CrossRef]
  34. Tsialtas, I.T.; Baxevanos, D.; Vlachostergios, D.N.; Dordas, C.; Lithourgidis, A. Cultivar complementarity for symbiotic nitrogen fixation and water use efficiency in pea-oat intercrops and its effect on forage yield and quality. Field Crops Res. 2018, 226, 28–37. [Google Scholar] [CrossRef]
  35. Baxevanos, D.; Tsialtas, I.T.; Voulgari, O.; Pankou, C.I.; Vlachostergios, D.; Lithourgidis, A.S. Oat genotypic requirement for intercropping with vetch under Mediterranean conditions. J. Agric. Sci. 2020, 158, 695–706. [Google Scholar] [CrossRef]
  36. Pankou, C.; Lithourgidis, A.; Dordas, C. Interaction of cultivar and irrigation on mixtures of wheat (Triticum aestivum L.) with pea (Pisum sativum L.). Not. Bot. Horti. Agrobo. 2021, 49, 12488. [Google Scholar] [CrossRef]
  37. Watson, D.J. Comparative physiological studies on the growth of field crops: I. Variation in net assimilation rate and leaf area between species and varieties, and within and between years. Ann. Bot. 1947, 11, 41–76. [Google Scholar] [CrossRef]
  38. De Wit, C.T. Photosynthesis of leaf canopies. Agric. Res. 1965, 663, 1–57. [Google Scholar]
  39. Rouse, J.W.; Haas, R.H.; Schell, J.A.; Deering, D.W. Monitoring vegetation systems in the Great Plains with ERTS. NASA Spec. Publ. 1974, 351, 309. [Google Scholar]
  40. Manavalan, L.P.; Cui, I.; Ambrose, K.V.; Panjwani, S.; DeLong, S.; Mleczko, M.; Spetsieris, K. Systematic approach to validate and implement digital phenotyping tool for soybean: A case study with PlantEye. TPJJ 2021, 4, e20025. [Google Scholar] [CrossRef]
  41. Zieschank, V.; Junker, R.R. Digital whole-community phenotyping: Tracking morphological and physiological responses of plant communities to environmental changes in the field. Front. Plant Sci. 2023, 14, 1141554. [Google Scholar] [CrossRef] [PubMed]
  42. Merzlyak, M.N.; Gitelson, A.A.; Chivkunova, O.B.; Rakitin, V.Y. Non-destructive optical detection of pigment changes during leaf senescence and fruit ripening. Physiol. Plant. 1999, 106, 135–141. [Google Scholar] [CrossRef]
  43. Penuelas, J.; Gamon, J.A.; Griffin, K.L.; Field, C.B. Assessing community type, plant biomass, pigment composition, and photosynthetic efficiency of aquatic vegetation from spectral reflectance. Remote Sens. Environ. 1993, 46, 110–118. [Google Scholar] [CrossRef]
  44. De Wit, C.T.; Van den Bergh, J.P. Competition between herbage plants. J. Agric. Sci. 1965, 13, 212–221. [Google Scholar]
  45. Mead, R.; Willey, R. The concept of a ‘land equivalent ratio’ and advantages in yields from intercropping. Exp. Agric. 1980, 16, 217–228. [Google Scholar] [CrossRef]
  46. Dhima, K.V.; Lithourgidis, A.S.; Vasilakoglou, I.B.; Dordas, C.A. Competition indices of common vetch and cereal intercrops in two seeding ratio. Field Crops Res. 2007, 100, 249–256. [Google Scholar] [CrossRef]
  47. Justes, E.; Bedoussac, L.; Dordas, C.; Frak, E.; Louarn, G.; Boudsocq, S.; Journet, E.P.; Lithourgidis, A.; Pankou, C.; Zhang, C.; et al. The 4C approach as a way to understand species interactions determining intercropping productivity. FASE 2021, 8, 3. [Google Scholar]
  48. Federer, W.T. Monocultures and Their Pairwise Combinations when Responses Are Available for Each Member of the Combination. In Statistical Design and Analysis for Intercropping Experiments; Springer: New York, NY, USA, 1993; Volume 1, pp. 134–159. [Google Scholar]
  49. Olfati, J.A.; Samizadeh, H.; Rabiei, B.; Peyvast, G. Griffing’s methods comparison for general and specific combining ability in cucumber. Sci. World J. 2012, 2012, 524873. [Google Scholar] [CrossRef]
  50. Forst, E.; Enjalbert, J.; Allard, V.; Ambroise, C.; Krissaane, I.; Mary-Huard, T.; Robin, S.; Goldringer, I. A generalized statistical framework to assess mixing ability from incomplete mixing designs using binary or higher order variety mixtures and application to wheat. Field Crops Res. 2019, 242, 107571. [Google Scholar] [CrossRef]
  51. Han, Y.Y.; Wang, K.Y.; Liu, Z.Q.; Pan, S.H.; Zhao, X.Y.; Zhang, Q.; Wang, S.F. Research on hybrid crop breeding information management system based on combining ability analysis. Sustainability 2020, 12, 4938. [Google Scholar] [CrossRef]
  52. Griffing, B. Concept of general and specific combining ability in relation to diallel crossing systems. Aust. J. Biol. Sci. 1956, 9, 463–493. [Google Scholar] [CrossRef]
  53. Haug, B.; Messmer, M.M.; Enjalbert, J.; Goldringer, I.; Forst, E.; Flutre, T.; Mary-Huard, T.; Hohmann, P. Advances in breeding for mixed cropping–incomplete factorials and the producer/associate concept. Front. Plant Sci. 2021, 11, 620400. [Google Scholar] [CrossRef] [PubMed]
  54. Gomez, K.A.; Gomez, A.A. Statistical Procedures for Agricultural Research; John Wiley & Sons: Hoboken, NJ, USA, 1984. [Google Scholar]
  55. Steel, R.G.D.; Torrie, J.H.; Dicky, D.A. Principles and Procedures of Statistics, A Biometrical Approach, 3rd ed.; McGraw Hill, Inc. Book Co.: New York, NY, USA, 1997; pp. 352–358. [Google Scholar]
  56. Annicchiarico, P.; Collins, R.P.; De Ron, A.M.; Firmat, C.; Litrico, I.; Hauggaard-Nielsen, H. Do we need specific breeding for legume-based mixtures? Adv. Agron. 2019, 157, 141–215. [Google Scholar]
  57. Haug, B.; Messmer, M.M.; Enjalbert, J.; Goldringer, I.; Flutre, T.; Mary-Huard, T.; Hohmann, P. New insights towards breeding for mixed cropping of spring pea and barley to increase yield and yield stability. Field Crops Res. 2023, 297, 108923. [Google Scholar] [CrossRef]
  58. Pużyńska, K.; Pużyński, S.; Synowiec, A.; Bocianowski, J.; Lepiarczyk, A. Grain yield and total protein content of organically grown oats-vetch mixtures depending on soil type and oats’ cultivar. Agriculture 2021, 11, 79. [Google Scholar] [CrossRef]
  59. Francis, C.A. Variety development for multiple cropping systems. Crit. Rev. Plant Sci. 1985, 3, 133–168. [Google Scholar] [CrossRef]
  60. O’Leary, N.; Smith, M.E. Breeding corn for adaptation to two diverse intercropping companions. Am. J. Agric. Biol. Sci. 1999, 14, 158–164. [Google Scholar] [CrossRef]
  61. Saxena, K.B.; Choudhary, A.K.; Saxena, R.K.; Varshney, R.K. Breeding pigeonpea cultivars for intercropping: Synthesis and strategies. Breed. Sci. 2018, 68, 159–167. [Google Scholar] [CrossRef]
  62. Lowe, A.; Harrison, N.; French, A.P. Hyperspectral image analysis techniques for the detection and classification of the early onset of plant disease and stress. Plant Methods 2017, 13, 80. [Google Scholar] [CrossRef]
  63. Diatta, A.A.; Abaye, O.; Thomason, W.E.; Lo, M.; Thompson, T.L.; Vaughan, L.J.; Gueye, F.; Diagne, M. Evaluating pearl millet and mungbean intercropping in the semi-arid regions of Senegal. Agron. J. 2020, 112, 4451–4466. [Google Scholar] [CrossRef]
  64. Roy, C.; Chattopadhyay, T.; Ranjan, R.D.; Hasan, W.U.; Kumar, A.; De, N. Association of leaf chlorophyll content with the stay-green trait and grain yield in wheat grown under heat stress conditions. Czech J. Genet. Plant Breed. 2021, 57, 140–148. [Google Scholar] [CrossRef]
  65. Dordas, C.A.; Papathanasiou, F.; Lithourgidis, A.; Petrevska, J.K.; Papadopoulos, I.; Pankou, C.; Gekas, F.; Ninou, E.; Mylonas, I.; Sistanis, I.; et al. Evaluation of physiological characteristics as selection criteria for drought tolerance in maize inbred lines and their hybrids. Maydica 2018, 63, 14. [Google Scholar]
  66. Pankou, C.; Lithourgidis, A.; Dordas, C. Effect of Irrigation on Intercropping Systems of Wheat (Triticum aestivum L.) with Pea (Pisum sativum L.). Agronomy 2021, 11, 283. [Google Scholar] [CrossRef]
  67. Harrison, P.A.; Porter, J.R.; Downing, T.E. Scaling-up the AFRC WHEAT 2 model to assess phenological development for wheat in Europe. Agric. For. Meteorol. 2000, 101, 167–186. [Google Scholar] [CrossRef]
  68. Dordas, C.A.; Vlachostergios, D.N.; Lithourgidis, A.S. Growth dynamics and agronomic-economic benefits of pea-oat and pea-barley intercrops. Crop Pasture Sci. 2012, 63, 45–52. [Google Scholar] [CrossRef]
  69. Berkenkamp, B.; Meeres, J. Mixtures of annual crops for forage in central Alberta. Can. J. Plant Sci. 1987, 67, 175–183. [Google Scholar] [CrossRef]
  70. Lithourgidis, A.S.; Vasilakoglou, I.B.; Dhima, K.V.; Dordas, C.A.; Yiakoulaki, M.D. Forage yield and quality of common vetch mixtures with oat and triticale in two seeding ratios. Field Crops Res. 2006, 99, 106–113. [Google Scholar] [CrossRef]
  71. Carr, P.M.; Horsley, R.D.; Poland, W.W. Barley, oat, and cereal–pea mixtures as dryland forages in the northern Great Plains. Agron. J. 2004, 96, 677–684. [Google Scholar] [CrossRef]
  72. Agegnehu, G.; Ghizaw, A.; Sinebo, W. Yield potential and land-use efficiency of wheat and faba bean mixed intercropping. Agron. Sustain. Dev. 2008, 28, 257–263. [Google Scholar] [CrossRef]
  73. Chawade, A.; van Ham, J.; Blomquist, H.; Bagge, O.; Alexandersson, E.; Ortiz, R. High-Throughput Field-Phenotyping Tools for Plant Breeding and Precision Agriculture. Agronomy 2019, 9, 258. [Google Scholar] [CrossRef]
  74. Bedoussac, L.; Justes, E. A comparison of commonly used indices for evaluating species interactions and intercrop efficiency: Application to durum wheat–winter pea intercrops. Field Crops Res. 2011, 124, 25–36. [Google Scholar] [CrossRef]
  75. Helenius, J.; Jokinen, K. Yield advantage and competition in intercropped oats (Avena sativa L.) and faba bean (Vicia faba L.): Application of the hyperbolic yield-density model. Field Crops Res. 1994, 37, 85–94. [Google Scholar] [CrossRef]
  76. Reinprecht, Y.; Schram, L.; Smith, T.H.; Pauls, K.P. Enhancing In-crop Diversity in Common Bean by Planting Cultivar Mixtures and Its Effect on Productivity. Front. Sustain. Food Syst. 2020, 4, 126. [Google Scholar] [CrossRef]
  77. Cohen, J. Eta-squared and partial eta-squared in fixed factor ANOVA designs. Educ. Psychol. Meas 1973, 33, 107–112. [Google Scholar] [CrossRef]
Figure 1. Graphical representation of the interaction between the two species based on the mean partial LER values of faba bean (pLERfb) and wheat (pLERw) of the intercropping systems under evaluation for two years. Where: 1. Elissavet–Polycarpi, 2. Elissavet–Organdi, 3. Elissavet–Nebraska, 4. Elissavet–Bumble, 5. Flamenko–Polycarpi, 6. Flamenko–Organdi, 7. Flamenko–Nebraska, and 8. Flamenko–Bumble.
Agronomy 14 00070 g001
Table 1. Soil characteristics of the experimental field at the University Farm where the experiments were established.
CharacteristicsSoil Depth (0–0.30 m)
Soil textureClay loam
pH (1:1 H2O)7.80
EC (dS m−1)1.29
Organic matter (%)1.02
N-NO3 (mg kg−1)33.15
P (Olsen mg kg−1)6.69
CaCO3 (%)6.21
Mg++ (mg kg−1)918.12
K (exchangeable mg kg−1)91.34
Fe++ (mg kg−1)6.98
Zn++ (mg kg−1)0.42
Mn++ (mg kg−1)8.68
Cu++ (mg kg−1)2.25
B (mg kg−1)0.89
Source: Land Reclamation Department, Soil and Water Resources Institute, Hellenic Agricultural Organisation “DEMETER”, Sindos, Greece.
Table 2. Weather conditions of the two years where the experiments took place and also 30-years mean of monthly rainfall and mean temperature (1990–2020).
20202021202230-Years Mean20202021202230-Years Mean
Temperature (°C)Rainfall (mm)
January5.998.476.005.23.0104.634.029
February9.059.048.786.423.214.439.631
March10.519.957.779.695.86.450.431
April12.8713.1814.6713.997.831.024.238
May19.3120.5420.719.336.612.220.644
June24.2624.8925.5924.525.69.048.632
July27.4428.9627.4526.713.010.254.431
August26.6928.7427.6726.074.811.240.224
September24.6322.4622.4421.715.421.449.029
October18.8615.3817.5516.315.2136.27.642
November12.2413.4514.1610.315.223.610.061
December11.068.0510.976.5131.254.010.451
Average annual temperature16.9116.9316.9815.53
Total annual rainfall546.8434.2389443
Table 3. Plant height (m) at three growth stages of wheat for the two years of the different intercropping systems.
Plant Height of Wheat Plants (m)
YearTreatmentGrowth Stage
JointingFull BloomGrain Filling
2020–2021Elissavet0.55 aϮ0.80 aϮ0.78 aϮ
Flamenko0.41 cde0.73 ab0.78 a
Elissavet-Polycarpi0.50 abc0.75 ab0.73 a
Elissavet-Organdi0.52 ab0.76 ab0.73 a
Elissavet-Nebraska0.50 abcd0.74 ab0.74 a
Elissavet-Bumble0.51 abc0.75 ab0.75 a
Flamenko-Polycarpi0.35 e0.69 b0.76 a
Flamenko-Organdi0.40 de0.71 ab0.73 a
Flamenko-Nebraska0.42 bcde0.71 ab0.75 a
Flamenko-Bumble0.45 abcd0.69 b0.75 a
2021–2022Elissavet0.48 a0.75 a0.81 ab
Flamenko0.35 bc0.76 a0.85 a
Elissavet-Polycarpi0.34 bc0.70 abc0.75 bc
Elissavet-Organdi0.36 bc0.71 abc0.73 bc
Elissavet-Nebraska0.34 bc0.69 abc0.72 c
Elissavet-Bumble0.38 ab0.72 ab0.72 bc
Flamenko-Polycarpi0.32 bc0.65 bcd0.73 bc
Flamenko-Organdi0.33 bc0.63 cd0.75 bc
Flamenko-Nebraska0.28 c0.59 d0.72 bc
Flamenko-Bumble0.36 bc0.70 bcd0.73 bc
LSD0.050.100.90.9
Ϯ Within each year, mean values in the same growth stage followed by the same letter(s) do not differ statistically significantly according to the protected LSD criterion. LSD0.05: common Least Significant Difference, at significance level a = 0.05 (p ≤ 0.05). This LSD value can be also used for performing all interesting comparisons within each growth stage.
Table 4. Plant height (m) at three growth stages of faba bean for the two years of the different intercropping systems.
Plant Height of Faba Bean Plants (m)
YearTreatment Growth Stage
JointingFull BloomGrain Filling
2020–2021Polycarpi0.26 bcdϮ0.63 aϮ0.68 abcϮ
Organdi0.23 cd0.64 a0.70 abc
Nebraska0.23 cd0.63 a0.74 ab
Bumble0.21 d0.57 a0.68 abc
Elissavet-Polycarpi0.39 a0.67 a0.66 abc
Elissavet-Organdi0.33 ab0.65 a0.66 abc
Elissavet-Nebraska0.30 bc0.67 a0.70 abc
Elissavet-Bumble0.24 cd0.60 a0.60 c
Flamenko-Polycarpi0.31 b0.68 a0.63 bc
Flamenko-Organdi0.27 bcd0.57 a0.61 c
Flamenko-Nebraska0.29 bc0.67 a0.75 a
Flamenko-Bumble0.24 cd0.60 a0.65 abc
2021–2022Polycarpi0.16 a0.60 ab0.75 a
Organdi0.10 a0.45 e0.60 bc
Nebraska0.12 a0.58 abc0.76 a
Bumble0.11 a0.45 e0.70 ab
Elissavet-Polycarpi0.15 a0.57 abcd0.61 bc
Elissavet-Organdi0.11 a0.50 bcde0.58 c
Elissavet-Nebraska0.15 a0.62 a0.68 abc
Elissavet-Bumble0.13 a0.47 cde0.61 bc
Flamenko-Polycarpi0.10 a0.48 cde0.57 c
Flamenko-Organdi0.10 a0.46 de0.59 bc
Flamenko-Nebraska0.11 a0.49 bcde0.67 abc
Flamenko-Bumble0.11 a0.50 abcde0.63 bc
LSD0.050.070.110.12
Ϯ Within each year, mean values in the same growth stage followed by the same letter(s) do not differ statistically significantly according to the protected LSD criterion. LSD0.05: common Least Significant Difference, at significance level a = 0.05 (p ≤ 0.05). This LSD value can be also used for performing all interesting comparisons within each growth stage.
Table 5. Leaf Area Index (LAI) at three growth stages of faba bean and wheat for the two years of the different intercropping systems.
Leaf Area Index (LAI)
YearTreatment Growth Stage
JointingFull BloomGrain Filling
2020–2021Elissavet1.19 abcϮ1.93 abcϮ2.76 aϮ
Flamenko1.46 ab2.28 ab3.20 a
Polycarpi1.58 a2.45 ab3.42 a
Organdi1.58 a2.54 a3.61 a
Nebraska1.44 ab2.25 ab3.16 a
Bumble0.98 bc1.67 bc2.44 a
Elissavet-Polycarpi1.10 abc1.75 abc2.48 a
Elissavet-Organdi1.47 ab2.44 ab3.52 a
Elissavet-Nebraska1.10 abc1.92 abc2.83 a
Elissavet-Bumble1.14 abc2.01 abc2.99 a
Flamenko-Polycarpi0.81 c1.35 c1.95 a
Flamenko-Organdi1.46 ab2.26 ab3.15 a
Flamenko-Nebraska1.19 abc1.92 abc2.74 a
Flamenko-Bumble1.10 abc1.89 abc2.77 a
2021–2022Elissavet2.01 a3.12 abc2.94 a
Flamenko1.36 b3.16 ab3.45 a
Polycarpi0.54 cde3.14 abc3.14 a
Organdi0.24 e2.15 d2.55 a
Nebraska0.53 cde2.77 abcd3.01 a
Bumble0.47 cde2.54 bcd3.11 a
Elissavet-Polycarpi0.99 bc3.44 a2.69 a
Elissavet-Organdi0.62 cde2.66 abcd2.69 a
Elissavet-Nebraska0.62 cde3.06 abc2.74 a
Elissavet-Bumble0.42 de2.34 cd2.40 a
Flamenko-Polycarpi0.40 de3.08 abc2.70 a
Flamenko-Organdi0.49 cde2.87 abcd2.56 a
Flamenko-Nebraska0.90 bcd3.19 ab3.24 a
Flamenko-Bumble0.54 cde2.85 abcd2.64 a
LSD0.050.530.810.93
Ϯ Within each year, mean values in the same growth stage followed by the same letter(s) do not differ statistically significantly according to the protected LSD criterion. LSD0.05: common Least Significant Difference, at significance level a = 0.05 (p ≤ 0.05). This LSD value can be also used for performing all interesting comparisons within each growth stage.
Table 6. NDVI at two growth stages of wheat for the two years of the different intercropping systems.
NDVI of Wheat PlantsNDVI of Faba Bean Plants
YearTreatmentGrowth Stage
Full BloomGrain FillingFull BloomGrain Filling
2020–2021Elissavet0.630 aϮ0.649 bϮ--
Flamenko0.639 a0.666 ab--
Polycarpi--0.619 bcϮ0.626 bcdeϮ
Organdi--0.641 abc0.646 ab
Nebraska--0.633 abc0.64 abc
Bumble--0.615 c0.605 def
Elissavet-Polycarpi0.642 a0.652 ab0.630 abc0.615 cdef
Elissavet-Organdi0.640 a0.649 b0.647 a0.634 abc
Elissavet-Nebraska0.641 a0.661 ab0.651 a0.631 abcd
Elissavet-Bumble0.646 a0.655 ab0.633 abc0.591 f
Flamenko-Polycarpi0.646 a0.666 ab0.643 ab0.620 bcde
Flamenko-Organdi0.642 a0.675 a0.652 a0.654 a
Flamenko-Nebraska0.642 a0.660 ab0.653 a0.624 bcde
Flamenko-Bumble0.649 a0.670 ab0.631 abc0.602 ef
2021–2022Elissavet0.581 ab0.629 a--
Flamenko0.585 a0.589 b--
Polycarpi--0.421 bc0.480 a
Organdi--0.420 bc0.439 d
Nebraska--0.434 ab0.457 abcd
Bumble--0.405 c0.445 cd
Elissavet-Polycarpi0.571 ab0.625 a0.434 ab0.477 ab
Elissavet-Organdi0.557 b0.617 a0.427 abc0.451 bcd
Elissavet-Nebraska0.571 ab0.624 a0.441 ab0.466 abc
Elissavet-Bumble0.578 ab0.625 a0.433 ab0.467 abc
Flamenko-Polycarpi0.570 ab0.555 c0.430 abc0.465 abcd
Flamenko-Organdi0.583 ab0.577 bc0.415 bc0.455 abcd
Flamenko-Nebraska0.584 a0.560 c0.452 a0.447 cd
Flamenko-Bumble0.592 a0.557 c0.427 abc0.462 abcd
LSD0.050.0260.027
Ϯ Within each year, mean values in the same growth stage followed by the same letter(s) do not differ statistically significantly according to the protected LSD criterion. LSD0.05: common Least Significant Difference, at significance level a = 0.05 (p ≤ 0.05). This LSD value can be also used for performing all interesting comparisons within and between growth stages. (-): Not applicable.
Table 7. Leaf greenness index (SPAD) at two growth stages of wheat for the two years of the different intercropping systems.
Leaf Greenness Index (SPAD) of Wheat PlantsLeaf Greenness Index (SPAD) of Faba Bean Plants
YearTreatmentGrowth Stage
Full BloomGrain FillingFull BloomGrain Filling
2020–2021Elissavet43.3 aϮ55.7 bϮ--
Flamenko48.8 a55.7 b--
Polycarpi--44.7 deϮ51.5 bϮ
Organdi--49.4 bc56.1 a
Nebraska--54.6 a51.8 b
Bumble--50.2 b46.3 cd
Elissavet-Polycarpi45.4 a55.7 b43.2 e50.5 b
Elissavet-Organdi47.0 a56.3 b45.4 cde50.3 bc
Elissavet-Nebraska45.7 a66.3 a50.9 ab45.4 d
Elissavet-Bumble47.6 a55.0 b47.5 bcd45.7 d
Flamenko-Polycarpi46.0 a57.1 b48.4 bcd56.8 a
Flamenko-Organdi45.0 a56.0 b50.5 b53.6 ab
Flamenko-Nebraska44.9 a56.1 b51.4 ab51.7 b
Flamenko-Bumble46.7 a58.0 b47.7 bcd46.1 d
2021–2022Elissavet49.0 ab54.0 a--
Flamenko47.1 b54.4 a--
Polycarpi--42.5 d47.4 cdef
Organdi--45.1 cd54.4 a
Nebraska--49.6 ab49.7 bc
Bumble--45.5 cd44.8 defg
Elissavet-Polycarpi50.1 ab54.5 a44.1 cd44.4 defg
Elissavet-Organdi53.3 a54.9 a45.7 bcd48.1 cde
Elissavet-Nebraska54.0 a54.0 a50.2 a48.4 bcd
Elissavet-Bumble54.0 a56.0 a42.9 d44.2 efg
Flamenko-Polycarpi51.4 ab56.0 a43.6 cd43.5 fg
Flamenko-Organdi51.7 ab54.7 a46.3 abcd52.2 ab
Flamenko-Nebraska52.7 a54.0 a47.2 abc46.9 cdef
Flamenko-Bumble48.9 ab55.4 a45.0 cd43.3 g
LSD0.055.544.02
Ϯ Within each year, mean values in the same growth stage followed by the same letter(s) do not differ statistically significantly according to the protected LSD criterion. LSD0.05: common Least Significant Difference, at significance level a = 0.05 (p ≤ 0.05). This LSD value can be also used for performing all interesting comparisons within and between growth stages. (-): Not applicable.
Table 8. Yield components of wheat (spikes per plant, seeds per spike) and faba bean (pods per plants and seeds per pod) for the two years of the different intercropping systems.
YearTreatmentNumber of Spikes per PlantNumber of Pods per PlantNumber of Seeds per SpikeNumber of Seeds per Pod
2020–2021Elissavet7.3 abϮ- 32.3 abϮ-
Flamenko8.6 a-32.9 ab-
Polycarpi-7.4 aϮ-3.0 aϮ
Organdi-7.8 a-2.7 a
Nebraska-6.3 a-3.3 a
Bumble-6.0 a-3.3 a
Elissavet-Polycarpi7.9 ab6.3 a36.1 a2.8 a
Elissavet-Organdi6.6 ab6.6 a36.6 a2.7 a
Elissavet-Nebraska7.5 ab4.7 a30.4 abc2.8 a
Elissavet-Bumble6.5 b5.5 a29.5 abc3.2 a
Flamenko-Polycarpi6.5 ab8.4 a24.1 bc2.5 a
Flamenko-Organdi9.3 a5.1 a31.3 abc3.3 a
Flamenko-Nebraska7.8 ab6.2 a21.8 c3.1 a
Flamenko-Bumble8.4 ab6.1 a33.6 a2.8 a
2021–2022Elissavet7.5 bc-69.0 a-
Flamenko11.3 a-51.0 de-
Polycarpi-19.3 a-3.5 a
Organdi-11.8 b-2.8 a
Nebraska-11.3 b-3.7 a
Bumble-15.5 a-3.4 a
Elissavet-Polycarpi8.3 bc9.3 bc64.8 ab2.9 a
Elissavet-Organdi6.8 c4.0 de60.8 abc2.2 a
Elissavet-Nebraska6.8 c4.8 de58.3 bcd2.5 a
Elissavet-Bumble7.5 bc3.0 e60.8 abc3.0 a
Flamenko-Polycarpi10.3 ab7.3 bc55.3 cde2.8 a
Flamenko-Organdi10 ab4.0 de55.3 cde1.9 a
Flamenko-Nebraska10.3 ab3.0 e45.5 e2.6 a
Flamenko-Bumble9.5 ab2.8 e55.3 cde2.8 a
LSD0.053.24.09.91.0
Ϯ Within each year, mean values in the same growth stage followed by the same letter(s) do not differ statistically significantly according to the protected LSD criterion. LSD0.05: common Least Significant Difference, at significance level a = 0.05 (p ≤ 0.05). (-): Not applicable.
Table 9. Dry weight and grain yield of wheat and faba bean monocrops and their respective intercrops for the two years of the different intercropping systems.
YearTreatmentDry Weight (t ha−1)Grain Yield (t ha−1)
Wheat
Grain Yield (t ha−1)
Faba Bean
Grain Yield (t ha−1)
2020–2021Elissavet11.15 abϮ4.37 aϮ-4.37 aϮ
Flamenko11.74 a4.16 ab-4.16 a
Polycarpi5.06 hi-1.85 abϮ1.85 ef
Organdi6.18 fghi-2.20 a2.20 def
Nebraska5.86 ghi-2.13 ab2.13 def
Bumble4.31 i-1.59 b1.59 f
Elissavet-Polycarpi8.71 cde2.51 cd0.59 cd3.10 bc
Elissavet-Organdi10.43 abc3.33 bc0.40 d3.73 ab
Elissavet-Nebraska8.34 cdef2.50 cd0.42 d2.92 bcd
Elissavet-Bumble6.73 efgh2.55 cd0.19 d2.75 cd
Flamenko-Polycarpi9.45 bcd2.71 cd1.01 c3.72 ab
Flamenko-Organdi7.46 defg2.15 de0.34 d2.49 cde
Flamenko-Nebraska6.89 efgh1.60 e0.74 cd2.34 cdef
Flamenko-Bumble8.76 cde2.41 de0.51 cd2.92 bcd
2021–2022Elissavet9.57 ab4.36 a-4.36 a
Flamenko8.78 ab3.63 ab-3.63 abc
Polycarpi5.72 c-2.15 a2.15 fg
Organdi1.70 d-0.64 bcd0.64 i
Nebraska4.05 c-1.18 b1.18 hi
Bumble4.10 c-1.79 a1.79 gh
Elissavet-Polycarpi10.21 ab2.09 cd0.73 bc2.82 cdef
Elissavet-Organdi10.13 ab2.83 bc0.17 d3.00 bcdef
Elissavet-Nebraska9.86 ab1.87 d0.41 cd2.28 efg
Elissavet-Bumble10.71 a2.51 cd0.63 bcd3.14 bcd
Flamenko-Polycarpi8.47 b2.94 bc0.75 bc3.68 ab
Flamenko-Organdi8.99 ab2.32 cd0.14 d2.46 defg
Flamenko-Nebraska9.37 ab2.80 bc0.37 cd3.17 bcd
Flamenko-Bumble9.56 ab2.69 cd0.38 cd3.06 bcde
LSD0.052.240.890.560.86
Ϯ Within each year, mean values followed by the same letter(s) do not differ statistically significantly according to the protected LSD criterion. LSD0.05: common Least Significant Difference, at significance level a = 0.05 (p ≤ 0.05). (-): Not applicable.
Table 10. Light Penetration Depth (LPD), Normalized Pigment Chlorophyll Index (NPCI), and Plant Senescence Reflectance Index (PSRI) of wheat and faba bean monocrops and their respective intercrops for the two years of the different intercropping systems.
YearTreatmentLPD (mm)NPCIPSRI
2020–2021Elissavet 342.73 a Ϯ 0.266 a Ϯ 0.851 a Ϯ
Flamenko 447.80 a 0.232 ab 0.751 a
Polycarpi 336.99 a 0.154 f 0.459 a
Organdi 333.59 a 0.158 f 0.511 a
Nebraska 422.21 a 0.164 ef 0.388 a
Bumble 397.16 a 0.182 def 0.596 a
Elissavet-Polycarpi 401.51 a 0.229 abc 0.668 a
Elissavet-Organdi 411.03 a 0.205 bcde 0.613 a
Elissavet-Nebraska 427.10 a 0.237 ab 0.631 a
Elissavet-Bumble 472.73 a 0.233 ab 0.681 a
Flamenko-Polycarpi 431.71 a 0.211 bcd 0.762 a
Flamenko-Organdi 336.39 a 0.194 bcdef 0.539 a
Flamenko-Nebraska 413.47 a 0.210 bcd 0.635 a
Flamenko-Bumble 395.70 a 0.185 cdef 0.609 a
2021–2022Elissavet 485.55 a 0.086 ab 0.225 a
Flamenko 438.49 a 0.057 ab 0.349 a
Polycarpi 426.48 a 0.093 ab 0.260 a
Organdi 373.25 a 0.097 ab 0.286 a
Nebraska 470.59 a 0.099 a 0.274 a
Bumble 308.86 a 0.084 ab 0.300 a
Elissavet-Polycarpi 375.54 a 0.099 a 0.357 a
Elissavet-Organdi 360.28 a 0.085 ab 0.275 a
Elissavet-Nebraska 425.80 a 0.085 ab 0.323 a
Elissavet-Bumble 404.18 a 0.083 ab 0.330 a
Flamenko-Polycarpi 377.89 a 0.055 ab 0.299 a
Flamenko-Organdi 418.36 a 0.062 ab 0.263 a
Flamenko-Nebraska 408.16 a 0.058 ab 0.236 a
Flamenko-Bumble 384.90 a 0.053 b 0.300 a
LSD0.05 127.84 0.045 0.210
Ϯ Within each year, mean values followed by the same letter(s) do not differ statistically significantly according to the protected LSD criterion. LSD0.05: common Least Significant Difference, at significance level a = 0.05 (p ≤ 0.05).
Table 11. Partial Land Equivalent Ratio (pLER) for wheat (pLERw) and faba bean (pLERfb) and also total LER of wheat and faba bean intercrops for the two years of the different intercropping systems that were tested.
YearTreatmentpLERwpLERfbLER
2020–2021Elissavet-Polycarpi0.60 abc Ϯ0.35 abc Ϯ0.95 bc Ϯ
Elissavet-Organdi0.79 a0.22 bc1.01 abc
Elissavet-Nebraska0.58 abc0.21 bc0.79 bc
Elissavet-Bumble0.60 abc0.13 c0.73 bc
Flamenko-Polycarpi0.66 ab0.64 a1.30 a
Flamenko-Organdi0.51 bc0.17 bc0.68 c
Flamenko-Nebraska0.39 c0.36 abc0.75 bc
Flamenko-Bumble0.58 abc0.46 ab1.04 ab
2020–2021Elissavet-Polycarpi0.49 c0.36 a0.85 b
Elissavet-Organdi0.65 abc0.27 a0.92 ab
Elissavet-Nebraska0.43 c0.35 a0.78 b
Elissavet-Bumble0.57 bc0.35 a0.92 ab
Flamenko-Polycarpi0.81 a0.38 a1.19 a
Flamenko-Organdi0.64 abc0.22 a0.86 ab
Flamenko-Nebraska0.77 ab0.32 a1.09 ab
Flamenko-Bumble0.74 ab0.21 a0.95 ab
LSD0.050.240.310.34
Ϯ Within each year, mean values followed by the same letter(s) do not differ statistically significantly according to the protected LSD criterion. LSD0.05: common Least Significant Difference, at significance level a = 0.05 (p ≤ 0.05).
Table 12. Specific mixing ability (SMA) and general mixing ability (GMA) of wheat and faba bean varieties for the two years.
YearSMAw-fbPolycarpiOrgandiNebraskaBumbleGMAw
2020–2021Elissavet−0.4410.4900.164−0.2130.128
Flamenko0.441−0.490−0.1640.213−0.128
GMAfb0.4150.116−0.368−0.162
2021–2022Elissavet−0.2910.409−0.3020.183−0.142
Flamenko0.291−0.4090.302−0.1830.142
GMAfb0.301−0.221−0.2290.150
Where: SMAw-fb is the specific mixing ability of each cultivar combination, GMAw is the general mixing ability of each wheat cultivar, and GMAfb is the general mixing ability of each faba bean cultivar.
Disclaimer/Publisher’s Note: The statements, opinions and data contained in all publications are solely those of the individual author(s) and contributor(s) and not of MDPI and/or the editor(s). MDPI and/or the editor(s) disclaim responsibility for any injury to people or property resulting from any ideas, methods, instructions or products referred to in the content.

