Article

Effect of Water and Nitrogen Coupling Regulation on the Growth, Physiology, Yield, and Quality Attributes of Isatis tinctoria L. in the Oasis Irrigation Area of the Hexi Corridor

by
Yucai Wang
1,*,
Xiaofan Pan
1,2,
Haoliang Deng
2,
Mao Li
1,
Jin Zhao
1 and
Jine Yang
1
1
College of Water Conservancy and Hydropower Engineering, Gansu Agricultural University, Lanzhou 730070, China
2
College of Civil Engineering, Research Institute of Water Resources Protection and Utilization in Hexi Corridor, Hexi University, Zhangye 734000, China
*
Author to whom correspondence should be addressed.
Agronomy 2024, 14(10), 2187; https://doi.org/10.3390/agronomy14102187
Submission received: 21 August 2024 / Revised: 18 September 2024 / Accepted: 19 September 2024 / Published: 24 September 2024
(This article belongs to the Special Issue Water and Fertilizer Regulation Theory and Technology in Crops)

Abstract

:
To address the prevailing problems of high water and fertilizer input and low productivity in Isatis tinctoria L. production in the Hexi Corridor in China, the effects of different irrigation amounts and nitrogen application rates on growth characteristics, photosynthetic physiology, root yield, and quality of I. tinctoria plants were studied with the aim of obtaining the optimal irrigation level and nitrogen application rate. From 2021 to 2023, we established a two-factor split-plot experiment in the oasis irrigation area with three irrigation amounts (sufficient water, medium water, and low water are 100%, 85%, and 70% of the typical local irrigation quota) for the main zone; three nitrogen application rates (low nitrogen, 150 kg ha−1, medium nitrogen, 200 kg ha−1, and high nitrogen, 250 kg ha−1) for the secondary zone; and three irrigation amounts without nitrogen as the control to explore the response of these different water and nitrogen management patterns for I. tinctoria in terms of growth characteristics, photosynthetic physiology, root yield, and quality. The results showed the following: (1) When the irrigation amount was increased from 75% to 100% of the local typical irrigation quota and the nitrogen application rate was increased from 150 to 250 kg ha−1, while the plant’s height, leaf area index, dry matter accumulation in the stem, leaf, and root, as well as the net photosynthetic rate (Pn), the stomatal conductance (Gs), and the transpiration rate (Tr) of I. tinctoria increased gradually, and the root–shoot ratio decreased. (2) When the irrigation amount increased from 75% to 100% of the local typical irrigation quota, the yield and net proceeds of I. tinctoria increased from 43.12% to 53.43% and 55.07% to 71.61%, respectively. However, when the irrigation quota was 100% of the local typical irrigation quota, and the nitrogen application rate increased from 150 to 200 kg ha−1, the yield of I. tinctoria increased from 21.58% to 23.69%, whereas the increase in nitrogen application rate from 200 to 250 kg ha−1 resulted in a decrease in the yield of I. tinctoria from 10.66% to 18.92%. During the 3-year experiment, the maximum yield of I. tinctoria appeared when treated with sufficient water and medium nitrogen, reaching 9054.68, 8066.79, and 8806.15 kg ha−1, respectively. (3) The effect of different water and nitrogen combination treatments on the root quality of I. tinctoria was significant. Under the same irrigation level, increasing the nitrogen application rate from 150 to 250 kg ha−1 could increase the contents of indigo, indirubin, (R,S)–goitrin, total nucleoside, uridine, and adenosine in the root of I. tinctoria from 3.94% to 9.59%, 1.74% to 12.58%, 5.45% to 18.35%, 5.61% to 11.59%, 7.34% to 11.32%, and 14.98% to 54.40%, respectively, while the root quality of I. tinctoria showed a trend of first increasing and then decreasing under the same nitrogen application level. (4) AHP, the entropy weight method, and the TOPSIS method were used for a comprehensive evaluation of multiple indexes of water–nitrogen coupling planting patterns for I. tinctoria, which resulted in the optimal evaluation of the W3N2 combination. Therefore, the irrigation level was 100% of the local typical irrigation quota, the nitrogen application rate should be appropriately reduced, and controlling the nitrogen application rate at the level of 190.30–218.27 kg ha−1 can improve water–nitrogen productivity yields for I. tinctoria and root quality. The results of this study can provide a theoretical basis and technical support for a more reasonable water and fertilizer management model for the I. tinctoria production industry in the Hexi Corridor in China.

1. Introduction

I. tinctoria is an anti-influenza virus with antibacterial, anti-inflammatory as well as anti-endotoxin properties. It is widely used as a conventional drug for clinical dispensation in traditional Chinese medicine [1]. The development of pharmaceutical technology and improvements in living standards have seen an increase in demand for higher quality Chinese medicine products. This has also led to higher quality control requirements for I. tinctoria production. The I. tinctoria planting industry is facing multiple pressures, such as rigid resource constraints, impure germplasm [2], continuous rises in labor costs, restricted availability of arable land for cultivation, sloppy field management [3], unscientific irrigation and fertilization methods [4], excessive use of pesticides [5], and the high energy consumption requirements of mechanization [6]. At the same time, climate change, as well as ecological and water resources crises [7,8], have severely constrained the sustainable production capacity of the I. tinctoria industry, and the development of traditional Chinese medicine eco-agriculture is still facing multifaceted challenges.
The unique natural environmental conditions and location advantages of the oasis irrigation area in the Gansu Hexi Corridor make it the best ecological area for I. tinctoria planting; the output in Minle County accounts for more than 60% of the national production, giving it the reputation of the “Hometown of Chinese I. tinctoria” [9]. However, local farmers have no quantitative concept of fertilizer application and irrigation, and there is a common problem of excessive irrigation and fertilizer application in I. tinctoria production and planting. This not only results in the loss of limited water resources through inefficient usage and increased production costs, but it also adversely affects the yield and medicinal quality of I. tinctoria and leads to environmental pollution caused by nitrate nitrogen leaching, which threatens the ecological security of the Qilian Mountains.
The China Hexi Corridor oasis irrigation area is a typical ecologically fragile area, where precipitation is low, inter-annual variability is large, and where water scarcity is still a key factor that severely limits the large-scale planting of I. tinctoria. Therefore, clarifying the crop’s water consumption characteristics, selecting efficient water-saving irrigation methods, and improving water use efficiency are the main ways to alleviate the supply and demand issues of water resources [10]. It has been confirmed through a large number of experiments that the water-saving and yield-increasing effect of drip irrigation under plastic film mulching is the best among the efficient water-saving irrigation methods, and the amount of water saved can be as much as 50% [11]. Drip irrigation under plastic film mulching can not only improve field water use efficiency, avoid deep seepage, and reduce inter-plant evaporation [12] but also perform warming and moisture keeping functions [13], increasing crop yields [14], and improving fruit quality [15], and it has been widely used in agricultural irrigation in the arid areas of northwestern China, especially in the Hexi Corridor and Xinjiang [16]. The technology has been widely popularized in the region in staple crops such as maize [17], cotton [18], and potatoes [19], and it has also been widely applied to cash crops, such as tomatoes [20] and cucumbers [21].
Nitrogen is the key nutrient element required for the growth and development of I. tinctoria, and it is also one of the main limiting factors for the yield and quality of I. tinctoria [22]. Low nitrogen application rates cannot meet the nitrogen demand for I. tinctoria production, inhibiting the growth of roots, stems, and leaves [23]. An excessive nitrogen application rate would lead to the deterioration of soil properties, nutrient imbalances, and weakened resilience to adversity [24]. Therefore, scientific and reasonable nitrogen application rates is particularly important for achieving the high quality and high yield of I. tinctoria as well as improving the nitrogen use efficiency. Previous studies have shown that for most crops, due to the lack of scientific guidance, the rates of nitrogen applied by farmers during the planting process are often greater than that required for maximum yield in order to obtain higher yield and economic value [25]. An excessive nitrogen application rate caused soil nitrogen excess, soil acidification and salinization intensification [26], affected soil permeability and aeration [27], destroyed soil granular structure, resulted in soil hardening [28], and destroyed the balance between crop nutrient growth and reproductive growth [29], reduced crop yield and nitrogen use efficiency [30], increased production costs, and declined economic benefits [31]. Therefore, it is imperative to optimize nitrogen management during the growth period of I. tinctoria, which can not only reduce the nitrogen application rates but also improve the nitrogen use efficiency and environmental sustainability.
Studies on the effects of water–nitrogen coupling on crop yield and quality and related models have been reported [32]. Jin et al. [33] showed that the irrigation amounts, nitrogen application rates, and rice yield and quality showed a synergistic effect of water and nitrogen on increasing yield and regulating quality in a certain range. Cai et al. [34] established a melon quality evaluation system based on 10 indicators from three categories of yield, quality, and efficiency, and the results showed that there was a significant interaction effect between the irrigation amounts and nitrogen application rates, which could achieve high yield while improving the quality and water–nitrogen use efficiency of melons. Ma et al. [35] constructed a water and nitrogen management model with better indicators based on a TOPSIS model and comprehensive scoring method. Using this model to comprehensively evaluate the yield, quality, and water–nitrogen use efficiency of wolfberry, it was found that the water–nitrogen interaction had a significant effect. The TOPSIS model showed the results provide a scientific basis for the optimal irrigation and management of fertilization of wolfberry in arid regions. Numerous studies have collectively confirmed that both the single factor of water and nitrogen and their interaction have significant effects on crop yield and quality but with variations due to different factors such as crop species, regional climate, water and nitrogen usage.
Although there have been relevant reports on the optimal nitrogen application rates for I. tinctoria, it is still unclear how to respond to the optimal nitrogen application rates under different irrigation amounts. Therefore, in this study, we carried out experimental studies on the effects of different water and nitrogen combinations for I. tinctoria yield and components, quality, water–nitrogen productivity through a locational experiment using a split-plot experimental design. The AHP method was used to subjectively judge and quantitatively describe the relative importance of multiple indicator factors, such as I. tinctoria yield, quality, and water–nitrogen productivity. The entropy weighting method was used to calculate the variance degree of each indicator and obtain the weighting values of each indicator. Finally, the TOPSIS method was used to compare the advantages and disadvantages of each indicator, and the optimal water and nitrogen combination model under the multi-indicator synergistic system was selected. At the same time, a binary quadratic regression simulation was carried out based on the comprehensive growth score of I. tinctoria and water and nitrogen input to derive the optimal irrigation and fertilizer interval in the agricultural production of I. tinctoria with the aim of providing a theoretical reference for the optimal utilization of water and nitrogen in the planting and production of I. tinctoria as well as for increasing yield and regulating quality.

2. Materials and Methods

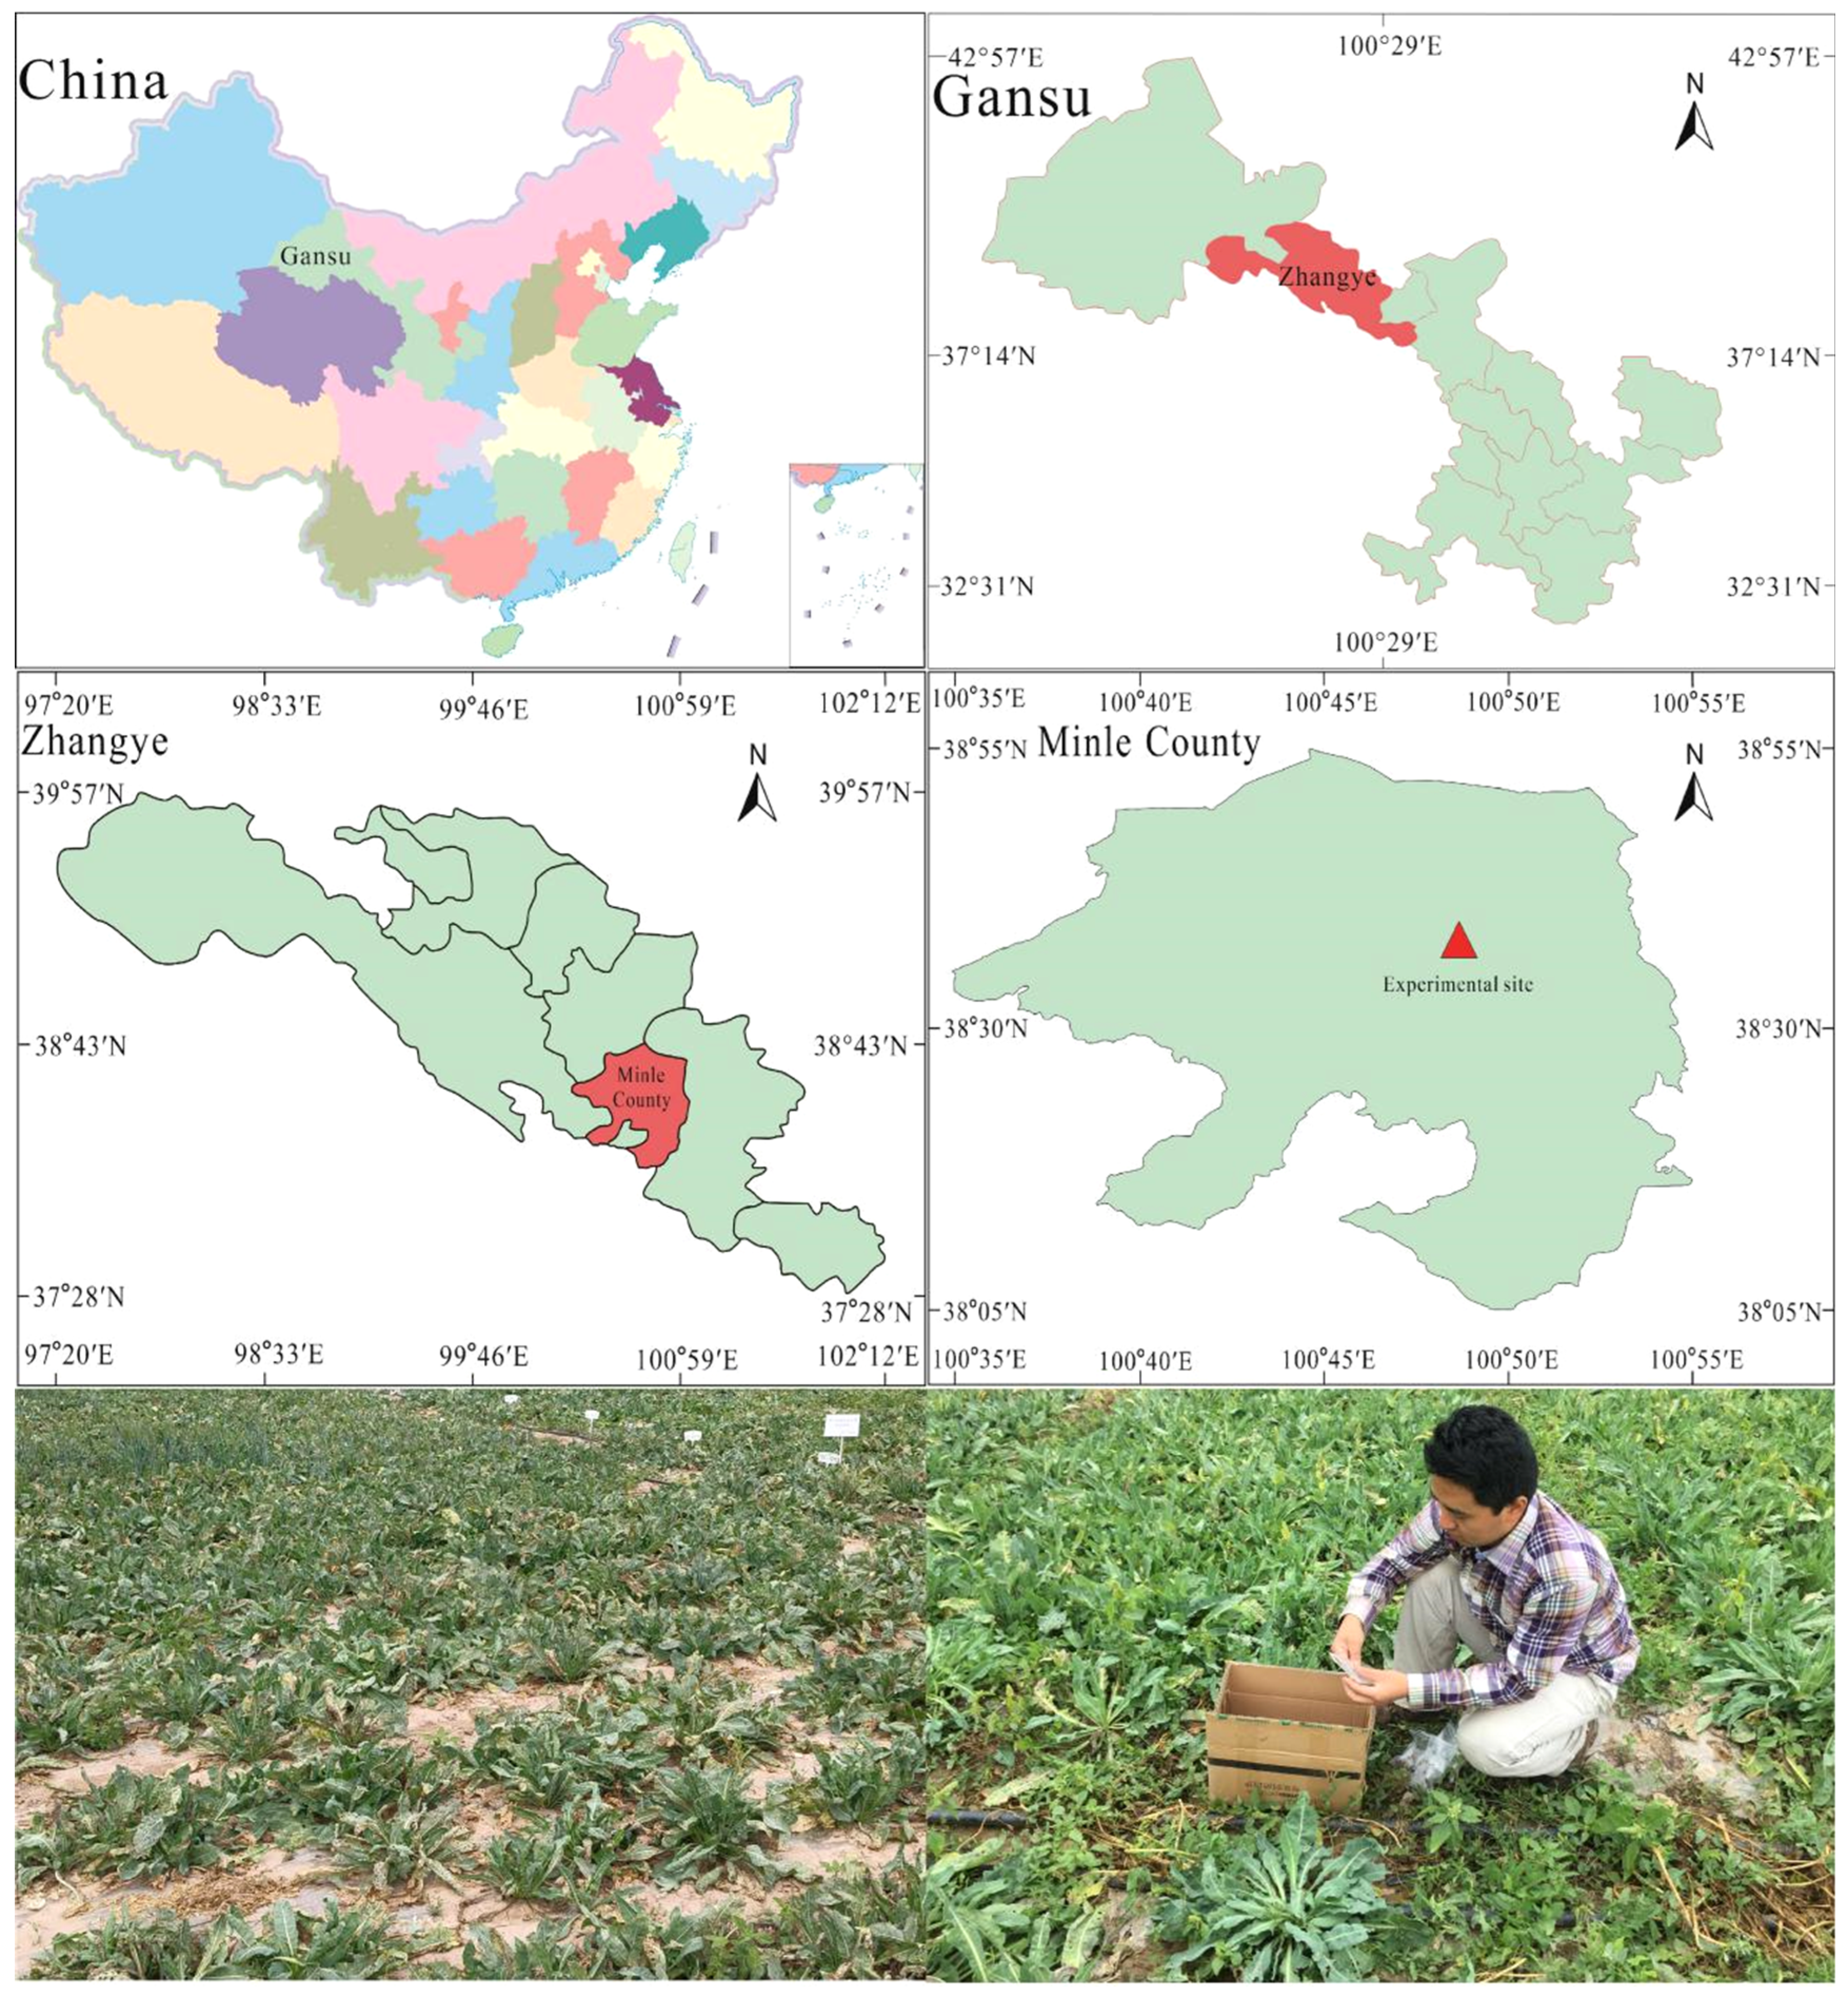
2.1. Experimental Site

The experimental was conducted in Yimin Irrigation Experimental Station, Minle County, which is the middle part of the Hexi Corridor, Gansu Province (100°43′ E, 38°39′ N, 1970 m a.s.l.) (Figure 1). The climate in the experimental area is temperate continental. The average annual precipitation is 200 mm, the annual evaporation is 1900 mm, the average annual temperature is 6.0 °C, and the frost-free period is about 105 d based on meteorological data of the last 20 years. The soil is a light loam with a topsoil bulk density of 1.46 g cm−3 and maximum field water-holding capacity of 24%. The basal fertility status and the effective photosynthesizing radiation of the crops during the symbiosis stage are shown in Table 1, and the precipitation and the average temperature over the experiments are shown in Figure 2.

2.2. Experimental Design

The irrigation amounts were based on the evapotranspiration (ET0) of the reference crop and precipitation, and the nitrogen application rates were based on the nitrogen uptake of I. tinctoria and the soil nitrogen contents. The experiment was a two-factor split-plot design experiment, including two factors: the drip irrigation amounts under the plastic film mulching and the nitrogen application rates, where the main factor was the irrigation amounts, and three irrigation gradients were used as follows: low (W1, 70% of the local typical irrigation quota), medium (W2, 85% of the local typical irrigation quota), and sufficient water (W3, 100% of the local typical irrigation quota). The secondary area was the nitrogen application rates, and four gradients were set up: zero (N0, 0 kg ha−1), low (N1, 150 kg ha−1), medium (N2, 200 kg ha−1), and high nitrogen (N3, 250 kg ha−1) (Table 2). The experiment consisted of 12 treatments, each of which was repeated 3 times and arranged in randomized groups. The plots were all running east–west with an area of 60 m2 (10.0 m in length and 6.0 m in width). The plots were separated by burying 1.0 m deep PVC plastic sheeting and building 20 cm high ridges to prevent water and fertilizer from affecting each other between the plots (Figure 3).
The I. tinctoria seeds for the test were provided by the professional cooperative of Chinese Herbal Medicine Planting in Minle County, with large, full, uniform and 98.6% seed purity. A Ycbz-6 Chinese herbal medicine film-laying drip irrigation belt integrated seeder was used to carry out precision sowing with eight rows in one film and east–west rows planted at a row spacing of 0.15 m, and at a plant spacing of 0.08 m, with a planting density of 8.3 × 10⁵ hm−2. Field management and pest control measures were managed by the farmers in accordance with the requirements of cooperatives. Th seeds were sown on 27 April 2021, harvested on 8 October, sown on 1 May 2022, harvested on 10 October, sown on 4 May 2023, harvested on 12 October.
They were irrigated nine times during the I. tinctoria growing period, and each plot was fitted with an individual water meter to control the irrigation amounts. Nitrogen (urea, produced by Gansu Liuhua Group Co., Ltd., Linxia, China, N ≥ 46%), phosphate (calcium superphosphate, produced by Shandong Mengshi Chemical Co., Ltd., Jinan, China, P2O5 ≥ 12%) and potash (potassium sulfate, produced by Shandong Huali Fertiliser Co., Ltd., Liaocheng, China, K2O ≥ 52%) were applied to the base fertilizer with the same amounts for each treatment, which were 80 kg ha−1, 350 kg ha−1 and 60 kg ha−1, respectively. The remaining nitrogen was applied in late June, late July, and early August by combined drip irrigation at a ratio of 4:3:3, and the remaining potassium was applied in early August and September by combined drip irrigation at a ratio of 1:1. The distance between the drip irrigation belt and drip head was 30 cm, the drip flow rate was 2.5 L h−1, and the normal irrigation pressure was 0.1 MPa. The plastic film was made of ordinary transparent plastic film with a width of 120 cm and a thickness of 0.08 mm. The field application rates for each factor of the experiment, as well as the coded value after normalization, are shown in Table 2, and the nitrogen application rates are the converted pure nitrogen rates.

2.3. Measurement Items and Methods

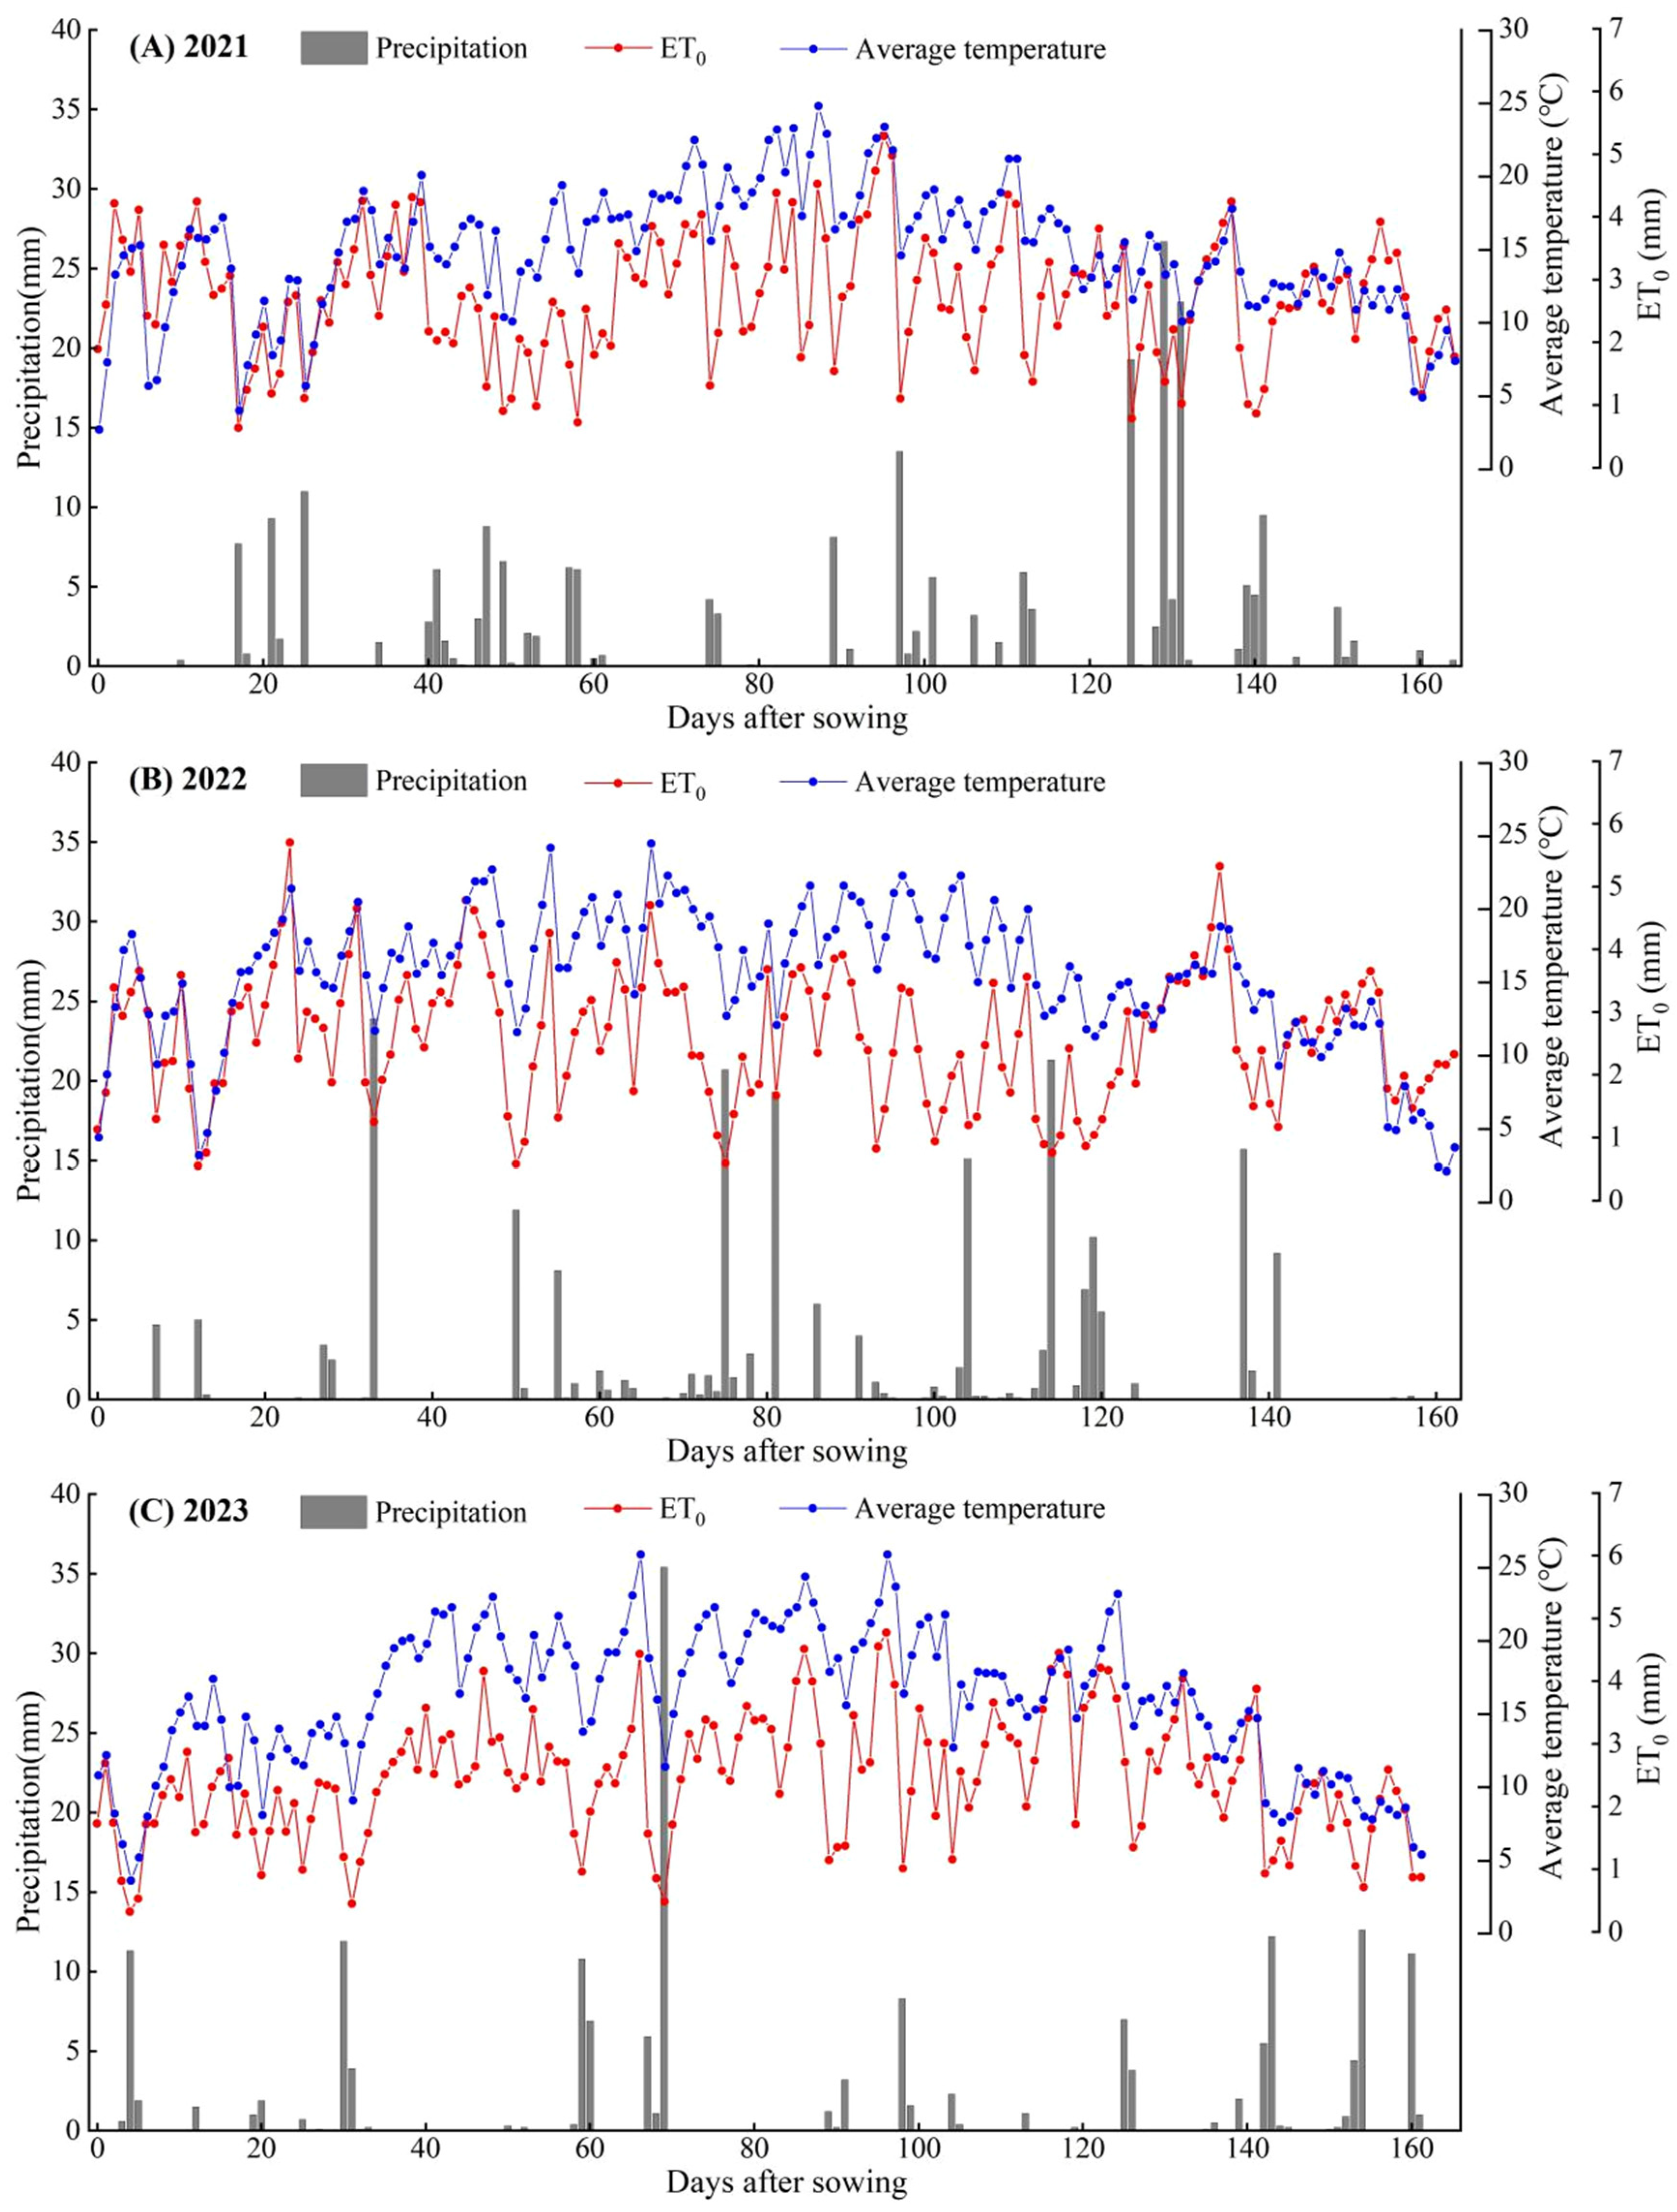
2.3.1. Meteorological Data

Meteorological data such as precipitation, solar radiation, air temperature, relative air humidity, and wind speed were obtained from a microclimate observer (MC-NQXZ type) installed in the nearby experiment station.

2.3.2. Determination of Biological Indicators

At the maturity stage of I. tinctoria, 10 standard plants were randomly selected from the non-side rows of each experimental plot. The roots were removed, the plant samples were measured with a straightedge with a range of 100 cm, the maximum distance from the bottom of the stem to the growing point of I. tinctoria was measured, and the data of three plants were recorded. Finally, the mean value was calculated to be the average height of I. tinctoria in the plot. The leaf area of all leaves were measured by YMJ-B Leaf Area Measuring Instrument (produced by Zhejiang Tuopuyunnong Technology Co., Ltd., Hangzhou, China), and finally, the average value was taken and the Leaf Area Index (LAI = Total Leaf Area/Land Area) was calculated.
The roots of I. tinctoria were cleaned, and the length of the main root was determined by using a straight ruler with a range of 100 cm, and the diameter of the main root was determined by using vernier calipers with an accuracy of 0.01 mm. After the determination, the above-ground portion and the roots were bagged and killed in a constant temperature oven at 105 °C for 30 min, dried at a constant temperature of 80 °C to a constant weight, and then weighed on an electronic balance with an accuracy of 0.01 g. The average value was taken, and the root–crown ratio was calculated (root–crown ratio = root dry matter mass/above-ground dry matter mass).

2.3.3. Determination of Photosynthetic Physiological Indicators

At the seedling, vegetative, fleshy root growth and fleshy root maturity stage of I. tinctoria, we chose several sunny and cloudless days from 9:00 a.m. to 11:00 a.m., we selected three plants with good growth condition and basically the same growth condition in each plot, and used a LI-6400 portable photosynthetic system analyzer (produced by LI-COR Company, Lincoln, NE, USA) to determine the net photosynthesis rate (Pn), the transpiration rate (Tr), and the stomatal conductance (Gs) of the third leaf from the inside to the outside, and the results showed the average values.

2.3.4. Determination of Yield

I. tinctoria was harvested separately in each plot after maturity, dried naturally, weighed and converted into yield per hectare.

2.3.5. Determination of Water–Nitrogen Productivity

  • Soil bulk density
The ring knife method was used to determine the soil bulk density, the sampling depth was 100 cm, the soil was taken in layers every 20 cm and repeated three times, the soil samples were dried in the oven at 105 °C until constant weight, and the soil bulk density of each layer was calculated with a ring knife volume of 100 cm3.
γ i = m i / 100
where γi is the soil bulk density of the i layer, g cm−3; and mi is the drying weight of the i layer, g.
2.
Soil moisture content
Soil moisture content was determined using CPN 503DR Neutron Soil Moisture Tester (produced by Beijing Bolunjingwei Technology Development Co., Ltd., Beijing, China). The soil samples were measured every 7 days during the whole growth period of I. tinctoria with additional measurements before sowing, after harvesting, before and after irrigation and rainfall, at a sampling depth of 100 cm, with a gradient of every 20 cm. Three measurement points were taken in each plot, and the average value was taken.
3.
Water consumption of I. tinctoria
The water consumption (ET) of I. tinctoria was calculated using the water balance method. Since the irrigation method was drip irrigation under plastic film mulching, evaporation losses could be ignored; that is, the irrigation infiltration rate was 100%. For rainfall infiltration, the effect of plastic film mulching on rainfall infiltration was calculated by calculating the ratio of the increase in soil moisture before and after a single rainfall to the current rainfall, that is,
λ = γ i ( w i f w i b ) d
where λ is rainfall infiltration, mm; Wif is the soil volumetric water content of the i layer after rainfall, cm3 cm−3; Wib is the soil volumetric water content of the i layer before rainfall, cm3 cm−3; and d is the thickness of the soil layer, mm.
Water consumption was calculated using the water balance formula. Since the depth of groundwater in the experimental area was greater than 10 m, and the irrigation method was drip irrigation, there was no runoff drainage during the growth period, groundwater recharge and seepage were ignored: that is,
E T = λ + I + W b W f
where ET is the total water consumption during the growth period of the crop, mm; λ is the rainfall infiltration, mm; I is the effective irrigation amounts, mm; Wb is soil water storage before the sowing of I. tinctoria, mm; and Wf is soil water storage after harvesting of I. tinctoria, mm.
4.
Water productivity
Water productivity (WP, kg m−3) is
W P = Y / E T
Irrigation water productivity (IP, kg m−3) is
I P = Y / I
where Y is the yield of I. tinctoria, kg ha−1.
5.
Nitrogen use efficiency
Nitrogen partial productivity (PN, kg kg−1) is
P N = Y / N
where N is nitrogen input, kg ha− 1.
Nitrogen agronomy use efficiency (AN, kg kg−1) is
AN = (YNY0)/N
where YN is grain yield with nitrogen application, kg ha−1; Y0 is grain yield without nitrogen application, kg ha−1.

2.3.6. Determination of Economic Benefit

(1)
Total inputs
Total inputs per unit area = irrigation water cost + fertilizer cost + seed cost + labor cost + machinery cost + other costs.
(2)
Total output value
Total output value per unit area = I. tinctoria production per unit area × I. tinctoria unit price. Through investigation, the market unit price of I. tinctoria in Minle County is 12.6 CNY kg−1 in 2021, 10.2 CNY kg−1 in 2022, and 8.2 CNY kg−1 in 2023.
(3)
Economic benefit
Economic benefit per unit area = total output value per unit area—total input per unit area.
(4)
Output–input ratio
Output–input ratio = total output value per unit area/total input per unit area.

2.3.7. Determination of Quality Indicators

The content of the active ingredients indigo, indirubin, (R,S)–goitrin in I. tinctoria was determined by high-performance liquid chromatography (HPLC) according to the Chinese Pharmacopoeia [36]. The LC−10ATVP high-performance liquid chromatography was used with the following chromatographic conditions: SPD−10Avp (UV−VIS) detector, the column was AgilentZorbaxSB−C18 (100 mm × 4.6 mm, 3.5 μm), methanol−0.1% formic acid solution as the mobile phase; the flow rate was 1.0 mL min−1, and the injection volume was 20 μL by autosampler. The detection wavelength was 280 nm, and the column temperature was 25 °C. The total nucleoside, uridine and adenosine contents of I. tinctoria root were determined by the HPLC−DAD method [37].

2.3.8. The Water–Nitrogen Coupling Model

In this experiment, we studied the regression relationships between three different levels of drip irrigation amounts under plastic film mulching, nitrogen application rates, and comprehensive growth scores of I. tinctoria. Taking the comprehensive growth score as the target, and the irrigation amounts and nitrogen application rates as the independent variables, we established the regression model of irrigation amounts–nitrogen application rates–comprehensive growth score, and expressed the model using a binary quadratic regression equation. The expression for the binary quadratic regression equation is as follows:
y = a 0 + a 1 x 1 + a 2 x 2 + a 12 x 1 x 2 + a 11 x 1 2 + a 22 x 2 2
where y is the comprehensive growth score of I. tinctoria, kg ha−1; a0 is the constant term of the regression model; a1, a2 are the first-order coefficients of the regression model; a12 is the interaction coefficient of the regression model; and a11, a22 are the quadratic coefficients of the regression model.

2.4. Statistical Analysis Methods

The LSD multiple comparison method in SPSS (Version 22.0, IBM, Inc., New York, NY, USA) software was used for statistical analysis and regression model building. Origin (Version 8.0, Origin Lab, Corp., Hampton, MA, USA) software was used for plotting. Yaaph (Version v12.11.8293, Meta Decision Software Technology Co., Ltd., Corp., Taiyuan, China) software was used to draw the comprehensive analytical hierarchical model of I. tinctoria and the weight analysis of each index. Microsoft Excel (Version 2010, Microsoft Corp., Raymond, WA, USA) software was used to calculate the comprehensive evaluation values according to the TOPSIS method. DPS was used to establish the mathematical model. MATLAB (Version R2023b, Math Works, Corp., Natick, MA, USA) software was used to analyze the model.

3. Results and Analysis

3.1. Effects of Water–Nitrogen Interaction on Biological Characteristics of I. tinctoria

Reasonable water–nitrogen interaction can improve the growing environment of I. tinctoria, which in turn promotes the growth of plant stems, leaves and roots and increases the dry matter accumulation. The results of water–nitrogen ANOVA showed that the irrigation amounts had a significant or extremely significant effect on the biological characteristics of I. tinctoria, while nitrogen application rates only had a significant or extremely significant effect on the plant height, taproot length and root–crown ratio, and they had no significant effect on other biological characteristics. The water–nitrogen interaction did not have a significant effect on the biological characteristics of I. tinctoria (Table 3). At the same irrigation amounts, the mean values of the data showed that the plant height, leaf area index, taproot length and taproot diameter of I. tinctoria from low water to medium water showed a positive effect with significant increases of up to 13.64% to 15.91%, 40.05% to 45.08%, 8.02% to 20.90% and 25.54% to 26.70%, respectively. The increase in root dry matter accumulation was more significant than that of stem and leaf dry matter accumulation, which were 39.84% to 46.75% and 15.74% to 19.71%, respectively, and thus the root–crown ratio was increased by 21.80% to 24.24% accordingly. However, with the continuous increase in irrigation amounts, the increase in biological characters decreased significantly, which was in line with the effect of diminishing returns. The increases of plant height, leaf area index, taproot length and taproot diameter of I. tinctoria from medium water to sufficient water were 7.79% to 7.84%, 10.23% to 11.09%, 3.71% to 14.20% and 6.94% to 7.18%, respectively. There was no significant difference between dry matter accumulation in root dry matter accumulation and in stem and leaf dry matter accumulation with average increases of 15.46% and 13.40%, respectively. Although the root–crown ratio showed a decreasing trend with the increase in irrigation amounts, there was no significant change. The nitrogen application rates also significantly affected the biological characteristics of I. tinctoria. At the same nitrogen application rates, the mean values of the data showed that from no nitrogen to low nitrogen and from low nitrogen to medium nitrogen, the indicators of biological characteristics such as I. tinctoria plant height, leaf area index, stem and leaf dry matter accumulation, taproot diameter, and root dry matter accumulation showed a positive effect with a significant increase of up to 11.63% to 14.81%, 18.97% to 22.26%, 20.02% to 29.11%, 11.83% to 16.16%, 19.88% to 22.57% and 8.87% to 13.27%, 11.31% to 14.59%, 19.88% to 20.83%, 11.58% to 12.15%, and 16.28% to 19.03%, respectively. The taproot length significantly increased from no nitrogen to low nitrogen by 15.16% to 17.64%, but the increase from low nitrogen to medium nitrogen was not significant. From medium nitrogen to high nitrogen, although all biological characteristics indicators still showed a positive effect, the increase was not significant. The root–crown ratio showed a negative effect with the gradual increase in nitrogen application rates, but the variation was small and not a significant difference.

3.2. Effects of Water–Nitrogen Interaction on Photosynthetic Characteristics of I. tinctoria

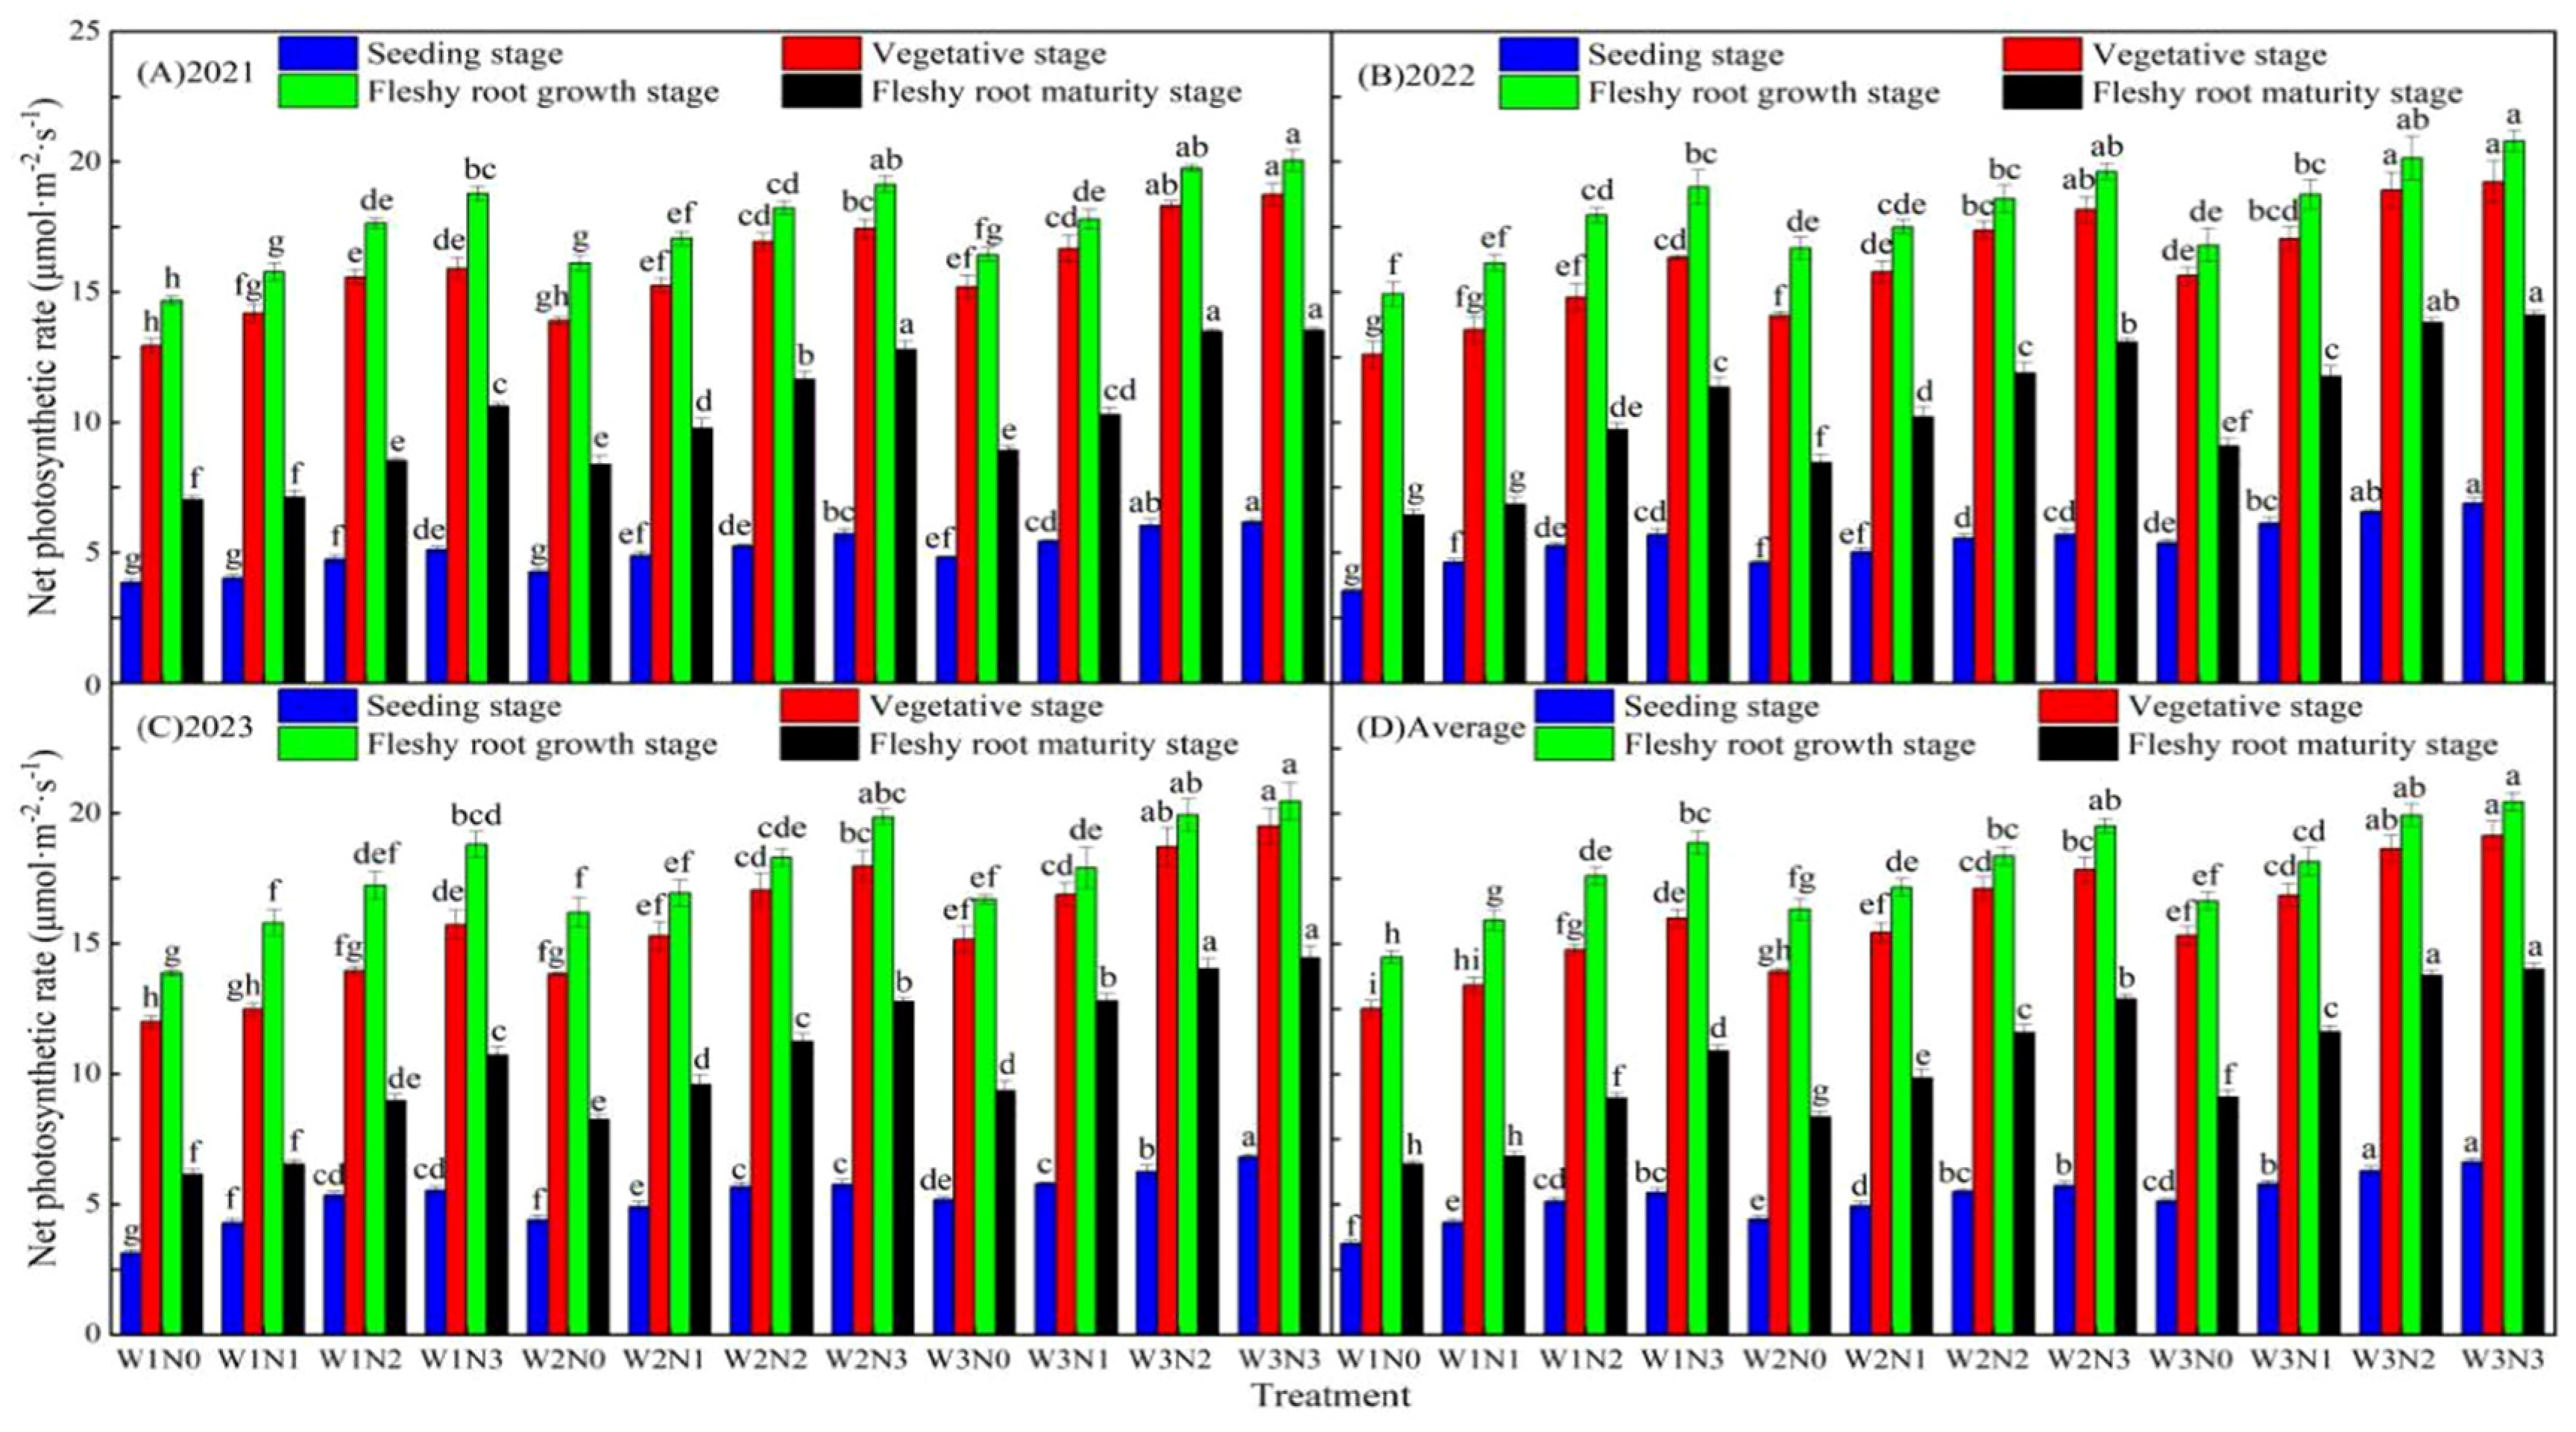
3.2.1. Effects of Water–Nitrogen Interaction on Net Photosynthetic Rate of I. tinctoria

The net photosynthetic rate (Pn) of I. tinctoria showed a first increasing and then decreasing trend with the passage of growth period, reaching a maximum at the fleshy root growth stage (Figure 4). At the same irrigation amounts, the mean values of the data showed that from low water to medium water, Pn significantly increased by 9.25% to 13.47%, 8.32% to 18.45% and 26.88% to 29.36% at seedling, vegetative and fleshy root maturity stages, respectively, whereas the fleshy root growth stage did not show any significant difference. From medium water to sufficient water, Pn increased by 11.77% to 19.46% and 8.47% to 20.95% only at the seedling and fleshy root maturity stages, while no significant changes in Pn were observed during the vegetative and fleshy root growth stages. At the same nitrogen application rates, the mean values of the data showed that from no nitrogen to low nitrogen, the Pn significantly increased by 10.81 to 17.92% and 11.85 to 21.76% at the seedling and fleshy root maturity stages. In contrast, Pn increased only by 8.93 to 9.73% and 7.27 to 8.28% during the vegetative and fleshy root growth stages with no significant changes. From low nitrogen to medium nitrogen, Pn was significantly increased by 10.20% to 15.27%, 10.18% to 11.35% and 18.32% to 23.76% during the seedling, vegetative and fleshy root maturity stages, while there was no significant change in Pn during the fleshy root growth stage. From medium nitrogen to high nitrogen, there was no significant change in Pn in all the growth stages of I. tinctoria, which indicated that increasing nitrogen application rates could promote photosynthesis of I. tinctoria leaves and significantly increase Pn. But with the increasing rates of nitrogen application, Pn gradually tended to be stable. Based on the analysis of the mean values of the 3-year Pn data, it can be seen that under the water–nitrogen interaction, the W3N3 of I. tinctoria had the highest Pn at all growth stages, followed by the W3N2, and there was no significant difference between the two treatments, whose values were significantly higher than those of the other treatments. It was also found that Pn of I. tinctoria at each growth stage was different in response to the single factor and interaction of water and nitrogen, with the fleshy root maturity stage being the most sensitive, followed by the seedling and vegetative stages, while the fleshy root growth stage showed less variation.

3.2.2. Effects of Water–Nitrogen Interaction on Stomatal Conductance of I. tinctoria

The stomatal conductance (Gs) of I. tinctoria showed a continuous increasing trend with the passage of growth period, reaching a maximum at the fleshy root maturity stage (Figure 5). At the same irrigation amounts, the mean values of the data showed that from low water to medium water, and medium water to sufficient water, the Gs significantly increased by 12.47% to 28.22%, 17.50% to 28.40%, 11.91% to 13.84%, 16.32% to 21.40%, 9.65% to 13.68%, and 8.20% to 9.68% at the seedling, vegetative, and fleshy root growth stages, respectively. In contrast, the fleshy root maturity stage did not show significant differences. At the same nitrogen application rates, the mean values of the data showed that from no nitrogen to low nitrogen, the Gs significantly increased by 10.57% to 14.65%, 28.36% to 34.46%, 15.73% to 18.02%, and 10.05% to 12.26% at the seedling, vegetative, fleshy root growth, and fleshy root maturity stages. From low nitrogen to medium nitrogen, the Gs significantly increased at the seedling and vegetative stages by 14.36% to 16.94%, 10.63% to 12.15%, while the Gs only increased by 5.44% to 8.51%, 5.46% to 7.96% during the fleshy root growth and fleshy root maturity stages with no significant changes. From medium nitrogen to high nitrogen, there was no significant change in the Gs of I. tinctoria in all the growth stages, which indicated that increased nitrogen application rates could promote the stomatal opening of I. tinctoria leaves, which could significantly increase the Gs. But with increasing nitrogen application rates, the Gs tended to gradually stabilize. Based on the analysis of the mean values of the 3-year Gs data, it can be seen that under the water–nitrogen interaction, the W3N3 of I. tinctoria had the highest Gs at each growth stage, followed by the W3N2, and there was no significant difference between the two treatments, which was significantly higher than the other treatments. It was also found that the Gs of I. tinctoria at each growth stage was different in response to the single factor and interaction of water and nitrogen with the vegetative stage being the most sensitive, followed by the fleshy root growth and seedling stages, while the fleshy root maturity stage showed less variation.

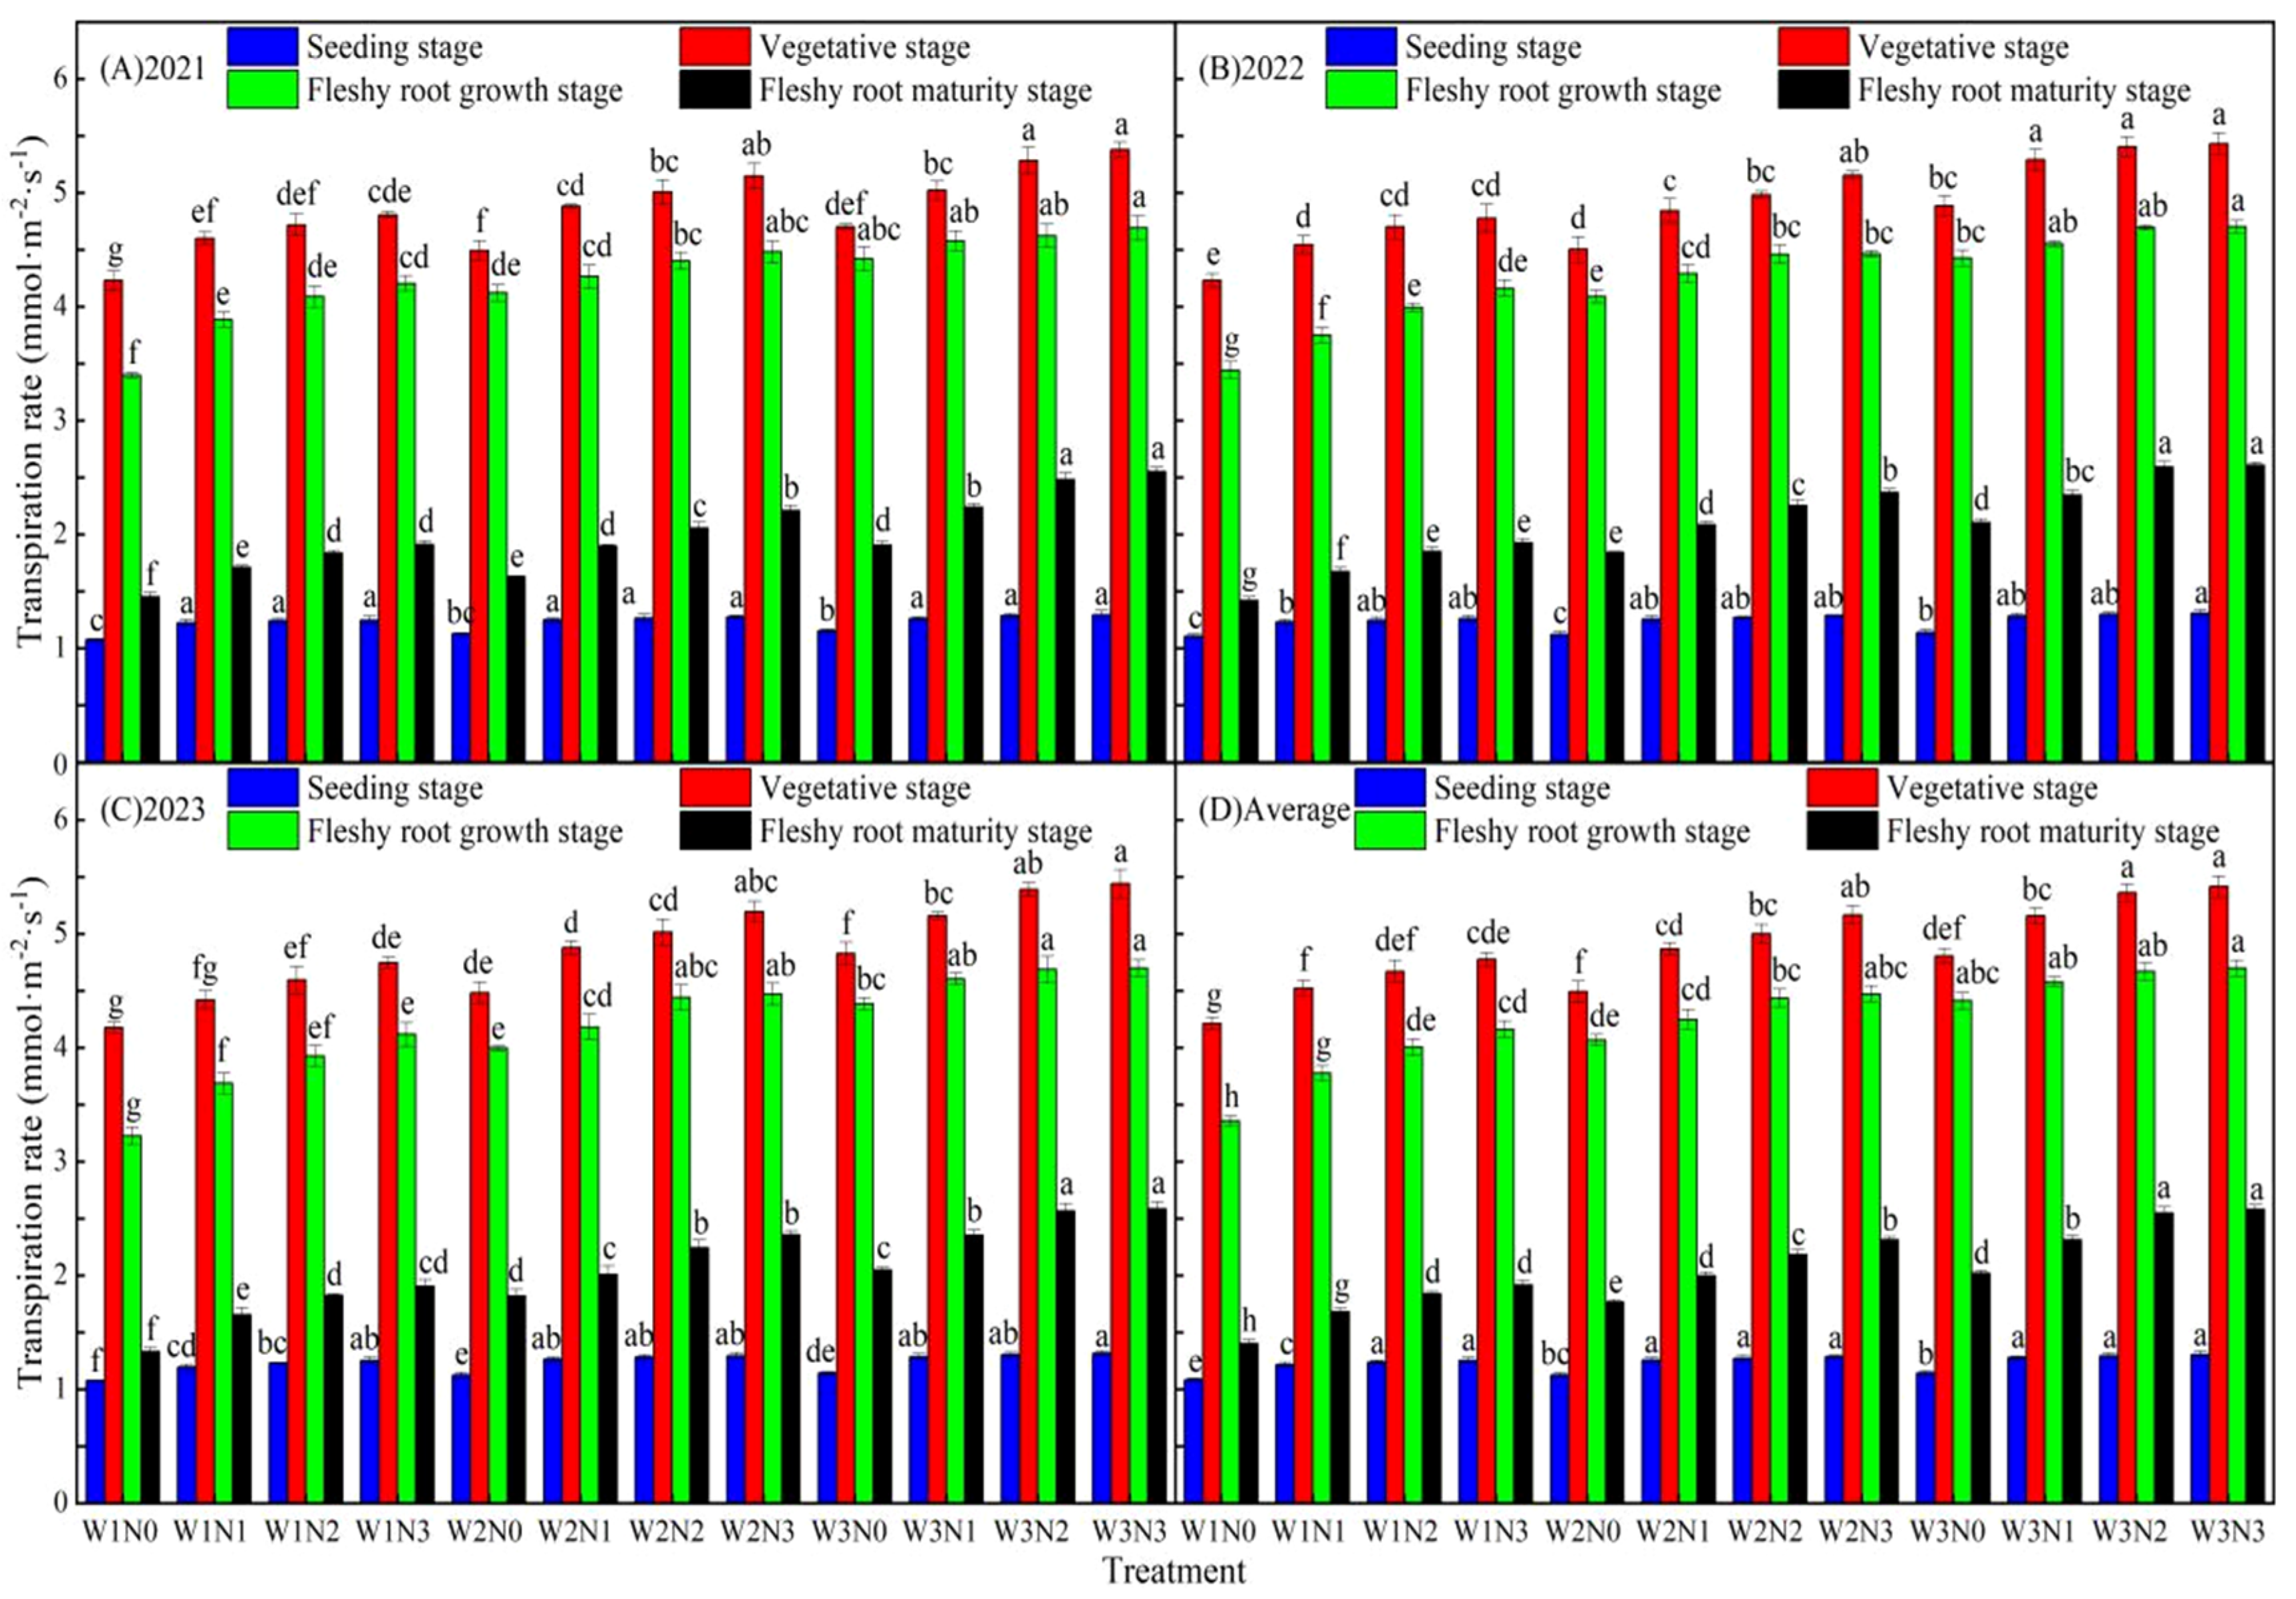
3.2.3. Effects of Water–Nitrogen Interaction on Transpiration Rate of I. tinctoria

The transpiration rate (Tr) of I. tinctoria showed a first increasing and then decreasing trend with the passage of growth period, reaching a maximum at the vegetative stage (Figure 6). At the same irrigation amounts, the mean values of the data showed that from low water to medium water, the Tr values at fleshy root growth and fleshy root maturity stages were significantly increased by 10.90% to 14.26% and 12.82% to 25.57%, respectively, while the Tr values at the seedling and vegetative stages increased by only 1.84% to 2.74% and 6.41% to 9.09%, respectively, with no significant change. From medium water to sufficient water, the Tr at the fleshy root maturity stage was significantly increased by 12.83% to 17.73%, while no significant difference was shown at other growth stages. At the same nitrogen application rates, the mean values of the data showed that from no nitrogen to low nitrogen, the Tr values at the seedling and fleshy root maturity stages were significantly increased by 11.20% to 12.10% and 13.77% to 17.27%, whereas the Tr values at the vegetative and fleshy root growth stages were increased by only 7.21% to 8.06% and 5.32% to 7.45%, which showed no significant change. From low nitrogen to medium nitrogen, only the Tr value of the fleshy root maturity stage was significantly increased by 9.06% to 10.30%, while the Tr values of the other growth stages did not show any significant difference. From medium nitrogen to high nitrogen, the Tr values of all the growth stages of I. tinctoria did not have any significant change, which indicated that the increased rates of nitrogen application could promote the transpiration of I. tinctoria leaves and significantly increase the Tr, but with the continuous increase in nitrogen, the Tr gradually tended to stabilize. Based on the analysis of the mean values of the 3-year Tr data, it can be seen that under the water–nitrogen interaction, the W3N3 had the highest Tr at each growth stage, followed by the W3N2, and there was no significant difference between the two treatments, which was higher than that of the other treatments. At the same time, it was found that the response degree of Tr to water and nitrogen single factor and interaction was different at each growth stage of I. tinctoria, among which the vegetative stage was the most sensitive, followed by the seedling stage, while the fleshy root growth stage and fleshy root maturity stage had smaller variations.

3.3. Effects of Water–Nitrogen Interaction on Quality of I. tinctoria

The results of the variance by irrigation amounts and nitrogen application rates showed that irrigation amounts had a highly significant effect on I. tinctoria indigo, indirubin, (R,S)–goitrin, total nucleoside, uridine and adenosin, and the rates of nitrogen application had a significant or extremely significant effect on I. tinctoria indigo, indirubin, (R,S)–goitrin, and total nucleosides. In contrast, the water–nitrogen interaction had no significant effect on the quality of I. tinctoria (Table 4). At the same irrigation amounts, the mean values of the data showed that from low water to medium water, the I. tinctoria indigo, (R,S)–goitrin, total nucleoside, uridine and adenosine were significantly increased by 10.99% to 14.57%, 11.18% to 16.18%, 8.00% to 12.03%, 14.85% to 17.72%, and 20.06% to 33.01%, respectively, while there was no significant change in indirubin. From medium water to sufficient water, the quality of I. tinctoria decreased slightly, but there was no significant difference. It can be seen that increasing the irrigation amounts can significantly improve the quality of I. tinctoria, but excessive irrigation not only leads to the waste of water resources but also causes a decline of I. tinctoria quality. Among the quality indexes of I. tinctoria, only adenosine increased with increasing nitrogen application rates. At the same nitrogen application rates, the mean values of the data showed that from no nitrogen to low nitrogen and low nitrogen to medium nitrogen, the adenosine of I. tinctoria significantly increased by 15.93% to 26.10% and 13.98% to 16.87%, whereas there was no significant change from medium nitrogen to high nitrogen with only a 7.32% to 8.93% increase and without significant change. Although the I. tinctoria indigo, (R,S)–goitrin, total nucleoside and uridine increased with increasing nitrogen application rates, the increase was small and did not show any significant change. It can be seen that the quality of I. tinctoria was improved with increasing nitrogen application rates, but the effect did not show any significant difference. Under the water–nitrogen interaction, in terms of the analysis of the mean values of the three experimental years, the W2N3 showed the best quality, with indigo, indirubin, (R,S)–goitrin, total nucleoside, uridine and adenosine up to 6.87 mg kg−1, 9.44 mg kg−1, 0.283 mg g−1, 0.1942%, 0.0588%, 0.0537%, respectively, which was not significantly different from the N3W3. It can be seen that choosing a reasonable combination of water and nitrogen can not only reduce the amount of water and nitrogen input but also obtain better quality.

3.4. Effects of Water–Nitrogen Interaction on Yield and Water–Nitrogen Productivity of I. tinctoria

The results of the variance through irrigation amounts and nitrogen application rates showed that irrigation amounts had a significant or extremely significant effect on yield, water productivity, nitrogen partial productivity and nitrogen agronomy use efficiency, whereas nitrogen application rates only had a significant effect on irrigation water productivity. The water–nitrogen interaction did not significantly affect I. tinctoria yield and water–nitrogen productivity (Table 5). At the same irrigation amounts, the mean values of the data showed that from low water to medium water, the yield, water productivity, irrigation water productivity, nitrogen partial productivity and nitrogen agronomic use efficiency of I. tinctoria significantly increased by 38.65% to 45.19%, 34.88% to 41.42%, 14.18% to 19.57%, 39.51% to 47.57%, and 103.35% to 159.77%, respectively. From medium water to sufficient water, there was no significant change in yield, water productivity, nitrogen partial productivity, and nitrogen agronomic use efficiency, while the irrigation water productivity significantly decreased by 7.53% to 12.74%. It can be seen that increasing irrigation amounts could significantly increase I. tinctoria yield, as well as promote nitrogen uptake, and improve nitrogen partial productivity and nitrogen agronomic use efficiency. However, more irrigation amounts would result in a decrease in irrigation water productivity, but the water consumption did not increase with increasing irrigation amounts. The yield and water–nitrogen productivity of I. tinctoria were also significantly affected by nitrogen application rates. At the same nitrogen application rates, the mean values of the data showed that from no nitrogen to low nitrogen, the yield, water productivity, and irrigation water productivity significantly increased by 14.83% to 28.57%, 11.05% to 23.97%, and 14.19% to 27.16%. From low nitrogen to medium nitrogen, it was significantly increased by 20.97% to 24.78%, 10.12% to 14.27%, and 21.05% to 24.74%. From medium nitrogen to high nitrogen, the I. tinctoria yield and irrigation water productivity showed a decreasing trend, but there was no significant change; while water productivity was significantly reduced by 10.62% to 14.38%, the water consumption also showed a stable trend and did not increase with the increase in nitrogen application rates. From low nitrogen to medium nitrogen, nitrogen partial productivity decreased only by 6.41% to 9.27%, with no significant change, but it decreased significantly by 23.15% to 26.90% from medium nitrogen to high nitrogen. From low nitrogen to medium nitrogen, the nitrogen agronomic use efficiency increased significantly by 51.74% to 101.77%, but it decreased significantly from medium to high nitrogen by 28.60% to 41.82%. It can be seen that the I. tinctoria yield and water productivity were positively correlated with increasing nitrogen application rates, but they were negatively correlated after exceeding a certain threshold. In addition, 250 kg ha−1 urea applications leading to excessive nitrogen also resulted in the decrease in nitrogen partial productivity and nitrogen agronomic use efficiency, which led to nitrogen losses. Under the water–nitrogen interaction, according to the analysis of the mean values of the three experimental years, the maximum of I. tinctoria yield, water productivity and nitrogen agronomic use efficiency appeared in the W3N2, which could reach 8642.54 kg ha−1, 2.12 kg m−3, 15.80 kg kg−1, respectively with significant increases of 17.90%, 26.22%, and 113.73% compared with the N3W3. The maximum irrigation water productivity and nitrogen partial productivity appeared in W1N3 and W3N1, which could reach 5.33 kg m−3 and 47.07 kg kg−1, respectively, and they significantly increased by 32.36% and 60.53% compared with N3W3. It can be seen that sufficient water and high nitrogen did not produce high yield and high water–nitrogen productivity. Therefore, selecting a reasonable water–nitrogen combination is not only beneficial to improve the yield of I. tinctoria but also can obtain higher water productivity, irrigation water productivity, nitrogen partial productivity and nitrogen agronomic use efficiency.

3.5. Effects of Water–Nitrogen Interaction on Economic Benefit of I. tinctoria

The results of the variance by irrigation amounts and nitrogen application rates showed that only irrigation amounts had an extremely significant effect on the economic benefit, net proceeds, and output–input ratio of I. tinctoria, whereas nitrogen application rates and water–nitrogen interaction did not have a significant effect on those (Table 6 and Table 7). At the same irrigation amounts, the mean values of the data showed that from no nitrogen to low nitrogen and from low nitrogen to medium nitrogen, the economic benefit, net proceeds and output–input ratio of I. tinctoria were significantly higher by 14.83% to 28.57%, 17.92% to 37.23%, 11.49% to 23.89%, 20.97% to 24.78%, 25.53% to 28.41%, and 19.82% to 23.88%, respectively. Even though there was a decreasing trend from medium nitrogen to high nitrogen, there was no significant difference. It could be seen that increasing nitrogen application rates within a certain range could significantly improve the economic benefit, net proceeds, and output–input ratio of I. tinctoria, but beyond the threshold of nitrogen application rates, the economic benefit, net proceeds and output–input ratio of I. tinctoria slightly decreased. At the same nitrogen application rates, the mean values of the data showed that from low water to medium water, the economic benefit, net proceeds and output–input ratio of I. tinctoria were significantly increased by 38.65% to 45.19%, 49.48% to 55.16%, and 37.66% to 44.03%, respectively. While from medium water to sufficient water, the increase was less and did not show any significant change. It could be seen that with the increase in irrigation amounts, the economic benefit, net proceeds and output–input ratio of I. tinctoria could be significantly improved, but the excessive irrigation amounts did not show any significant advantage. Under the interaction of water and nitrogen, with the analysis of the mean values of the three experimental years, the maximum economic benefit, net proceeds and output–input ratio of I. tinctoria appeared in the W3N2, which were up to 89,526.89 CNY hm−2, 79,092.45 CNY hm−2 and 8.63, respectively. Compared with N3W3, it was significantly increased by 18.30%, 21.41% and 19.58%, respectively. It could be seen that sufficient water and high nitrogen did not obtain high yield, so choosing a reasonable combination of water and nitrogen is not only conducive to improving the economic benefit of I. tinctoria but also obtaining higher net proceeds.

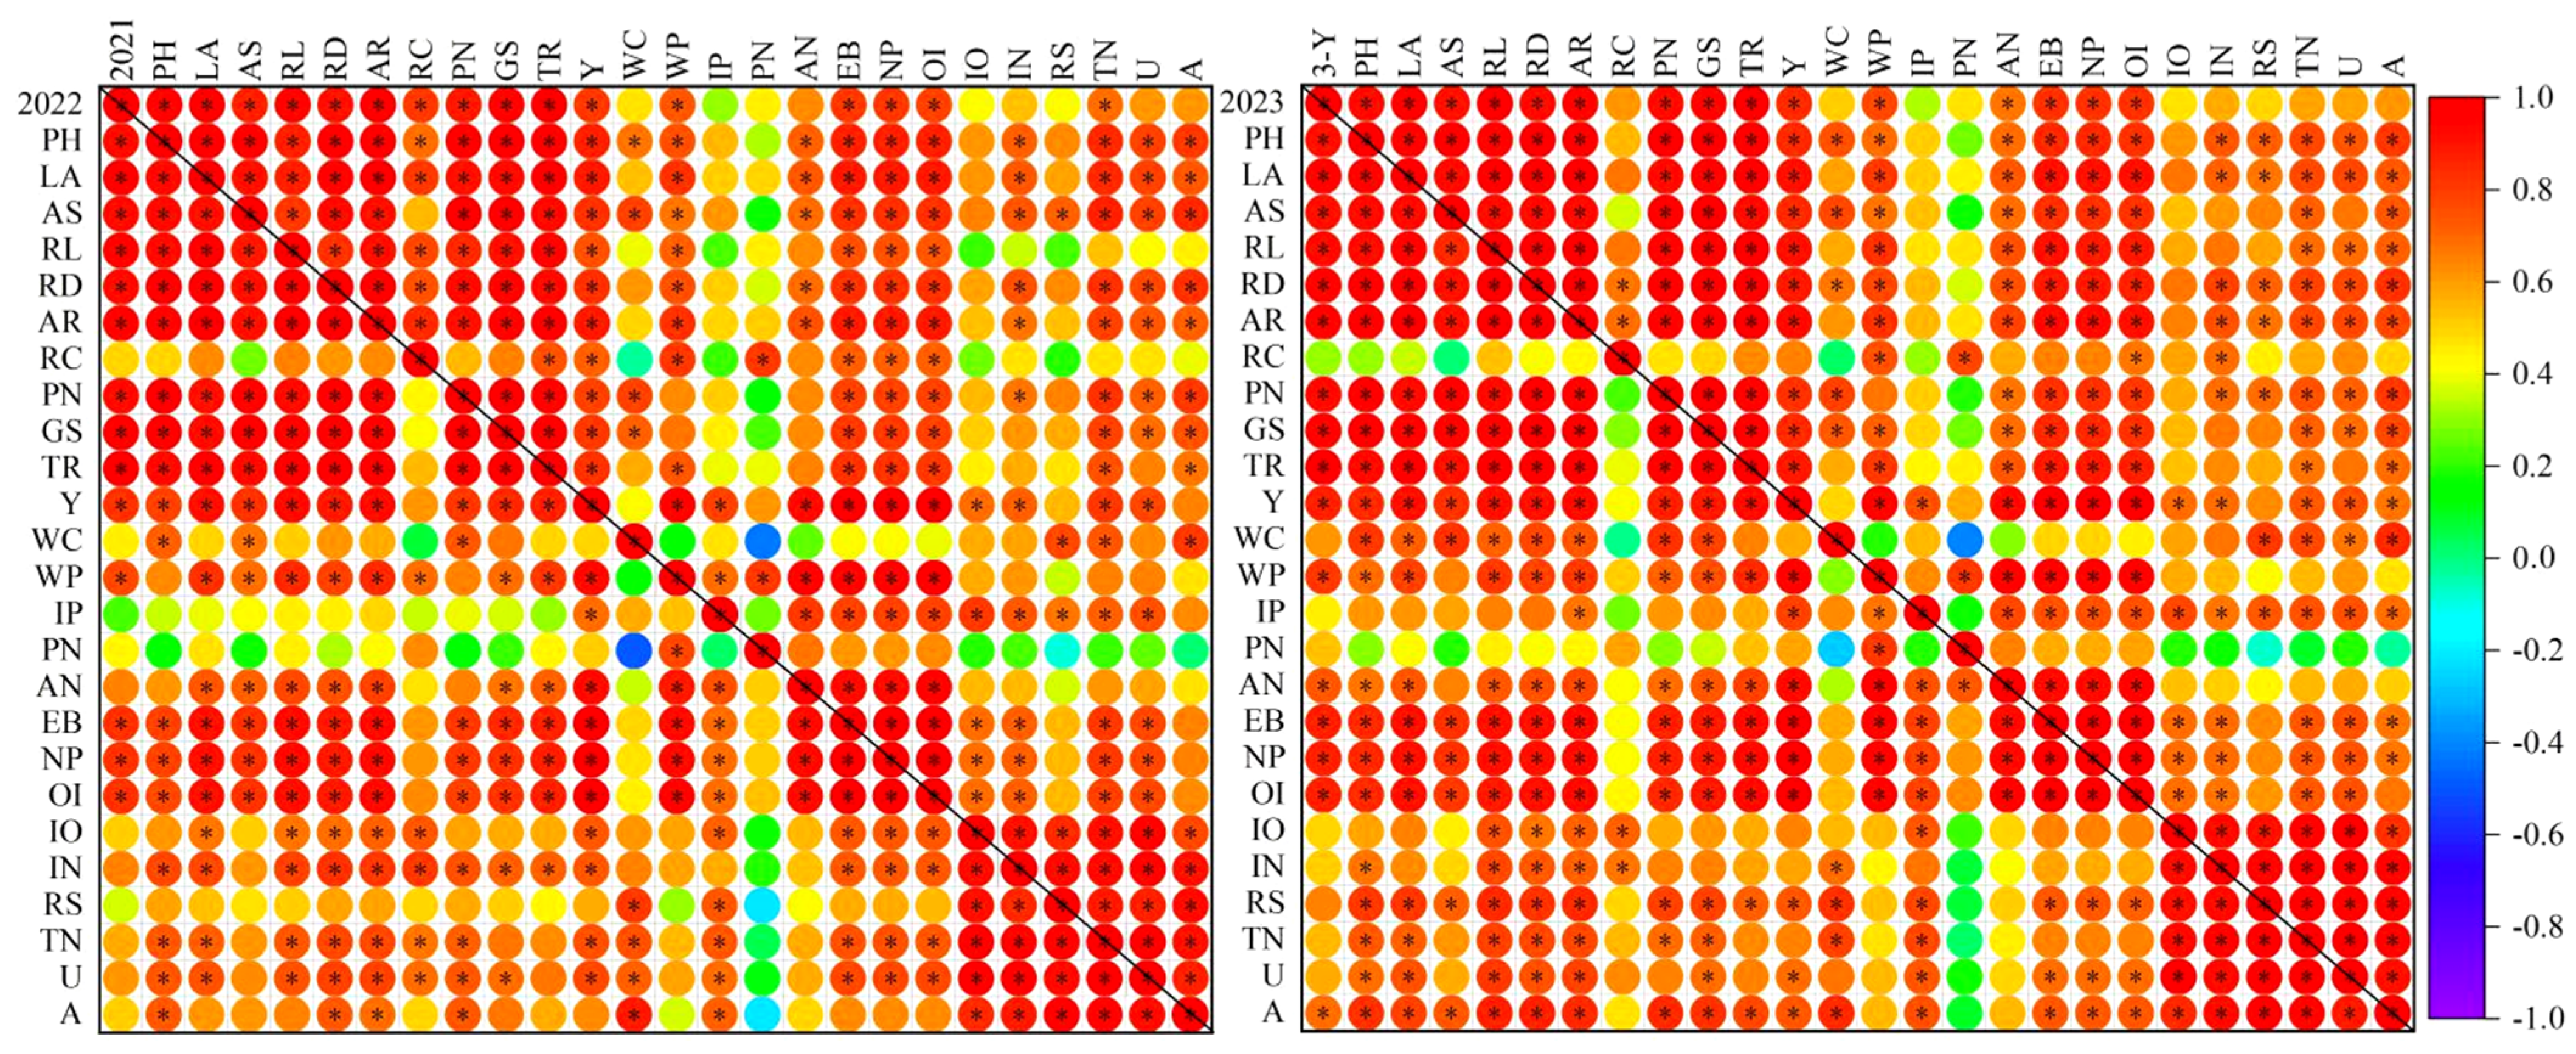
3.6. Correlation Analysis of Indicators under Water–Nitrogen Interaction

The correlation analysis results of each indicator under the water–nitrogen interaction model are shown in Figure 7. Different water–nitrogen interaction models changed the original growth environment of I. tinctoria. According the correlation of the average data of the three experiment years, the net photosynthetic rate, stomatal conductance, and transpiration rate had a significant and positive correlation (p < 0.05) with the I. tinctoria yield, leaf area index, dry matter accumulation of stems and leaves, taproot length, taproot diameter, and root dry matter accumulation, which indicated that a favorable light environment could promote the I. tinctoria growth and the dry matter accumulation. The leaf area index, stem and leaf dry matter accumulation, taproot length, taproot diameter, and root dry matter accumulation were significantly and positively correlated with the yield, economic benefit, and net proceeds (p < 0.05), suggesting that good growth conditions and dry matter accumulation of I. tinctoria plants can significantly increase the yield and then enhance the economic benefit and net proceeds. There was a significant and positive correlation (p < 0.05) between I. tinctoria yield and water productivity, irrigation water productivity, and nitrogen agronomic use efficiency, with the r correlation coefficients up to 0.974, 0.744, and 0.935, which indicated that suitable water and nitrogen environments not only produce a high yield but also obtain higher water productivity, irrigation water productivity, and nitrogen agronomic use efficiency. The yield of I. tinctoria was positively correlated with indigo, indirubin, (R,S)–goitrin, total nucleosides, uridine and adenosine with r correlation coefficients up to 0.692, 0.682, 0.629, 0.737, 0.755, 0.679, which suggested that the appropriate water and nitrogen environments can improve the quality of I. tinctoria while obtaining high yield. It was further found that there was also a significant and positive correlation (p < 0.05) among the quality indicators of I. tinctoria, suggesting that indigo, indirubin, (R,S)–goitrin, total nucleosides, uridine and adenosine have a mutually promoting effect on each other.

3.7. Establishment of a Comprehensive Growth Evaluation System for Hybrid Seed Maize

3.7.1. Comprehensive Evaluation Hierarchy Model (IHM)

A hierarchical model for the comprehensive evaluation of I. tinctoria was established using Yaaph software (Version v12.11.8293). The target layer of comprehensive growth indices (C) was divided into three guideline layers: yield index (C1), water–nitrogen use efficiency index (C2), and quality index (C3); the yield indices included four layers: yield (C11), production value (C12), net proceeds (C13), and output–input ratio (C14); the water–nitrogen use efficiency indices included four layers: water productivity (C21), irrigation water productivity (C22), nitrogen partial productivity (C23), and nitrogen agronomic use efficiency (C24); the quality indices included six layers: indigo (C31), indirubin (C32), (R,S)–glutathione (C33), total nucleosides (C34), uridine (C35), and adenosine (C36).

3.7.2. Indicator Weights

(1) Determination of weights based on the AHP method
After the establishment of the hierarchical model, a scale of 1 to 10 was used to establish the judgement matrix and test the consistency of the matrix; the judgement matrices for the comprehensive growth index, yield index, water–nitrogen use efficiency index, and quality index are as follows:
C = [ 1.0000 3.0000 3.5000 0.3333 1.0000 1.5000 0.2857 0.6667 1.0000 ] C 1 = [ 1.0000 1.0000 1.0000 1.2000 1.0000 1.0000 1.0000 1.2000 1.0000 1.0000 1.0000 1.0000 0.8333 0.8333 1.0000 1.0000 ] C 2 = [ 1.0000 2.0000 3.0000 0.9000 0.5000 1.0000 2.5000 0.5000 0.3333 0.4000 1.0000 0.3333 1.1111 2.0000 3.0000 1.0000 ] C 3 = [ 1.0000 0.5000 1.2000 0.5000 0.2500 0.3333 2.0000 1.0000 1.5000 0.5000 0.3333 0.5000 0.8333 0.6667 1.0000 0.5000 0.2500 0.3333 2.0000 2.0000 2.0000 1.0000 0.5000 1.5000 4.0000 3.0000 4.0000 2.0000 1.0000 1.8000 3.0000 2.0000 3.0000 0.6667 0.5556 1.0000 ]
The consistency test coefficients CR of the comprehensive growth index, yield index, water–nitrogen use efficiency index, and quality index were <0.10, the consistency test results were better, and the established judgement matrix was reliable and reasonable (Table 8, where λmax is the maximum eigenvalue). The results showed that the weights of each index, in descending order, were yield, net proceeds, economic benefit, output–input ratio, nitrogen agronomic use efficiency, water productivity, uridine, irrigation water productivity, adenosine, total nucleoside, nitrogen partial productivity, indirubin, indigo, and (R,S)–goitrin.
(2) Determination of weights based on entropy weighting
The entropy weighting method was used to assign weights to the single index of I. tinctoria, and the weights of each index were calculated (Table 9). From the table, it can be seen that the weights of each index of yield determined by the entropy weighting method, in descending order, were irrigation water productivity, nitrogen agronomic use efficiency, indigo, output–input ratio, net proceeds, economic benefit, yield, water productivity, uridine, nitrogen partial productivity, (R,S)–goitrin, total nucleosides, indirubin and adenosine.
(3) Combinatorial Empowerment Based on Game Theory
In order to improve the reliability of the weight assignment values and avoid the influence of subjective factors on the evaluation, a basic weight set was constructed based on the two assignment values obtained with the AHP and the entropy weight method  w = k = 1 l α k × w k T ( α k > 0 ) , where ak is derived from the AHP method and wk is derived from the entropy weight method.
Based on the weight set model of game theory, the game model was derived  M in j = 1 i a j × u j T u i T  i = 1, 2. The optimal combination coefficients of the above equation could be obtained using Matlab: a1 = 1.1252, a2 = −0.1252. This yields a vector of combined weights:  w * = k = 1 2 a k * × u k T , and the final results are presented in Table 10. The weights of the indices of I. tinctoria decreased in the order of yield, net proceeds, economic benefit, output–input ratio, nitrogen agronomic use efficiency, water productivity, uridine, irrigation water productivity, adenosine, total nucleosides, nitrogen partial productivity, indirubin, (R,S)–goitrin, and indigo.

3.7.3. Comprehensive Evaluation of I. tinctoria Based on the TOPSIS Method

Based on the evaluation of the TOPSIS comprehensive model with combined assignment, the decision matrix was normalized, the weighting matrix was established, and then the ideal solution and the fit Ci of the evaluation index were calculated (Table 11). As can be seen from the table, the W3N2 (sufficient water and high nitrogen) had the largest fit degree of comprehensive indices, and the comprehensive indices was optimal, followed by W2N3 (medium water and high nitrogen) and W2N2 (medium water and medium nitrogen), while W1N1 (low water and low nitrogen) had the smallest fit degree, which indicated that the comprehensive performance of I. tinctoria was the worst under the conditions of low water and low nitrogen.

3.8. Coupled Water–Nitrogen Response Modeling for Comprehensive Growth of I. tinctoria

Based on the comprehensive growth score of I. tinctoria and the amounts of water and nitrogen input, the regression model between the comprehensive growth score (y) and the coded values of irrigation amounts (x1) and nitrogen application rates (x2) was obtained as follows:
y = 0.025 + 1.455 x 1 + 1.140 x 2 0.851 x 1 2 0.934 x 2 2 0.192 x 1 x 2
The regression equation was tested for significance, and the correlation coefficient R2 = 0.947, with a high fit degree, p = 0.001 < 0.01, indicating that the regression relationship reached a highly significant level, which proves that the regression model is reliable.

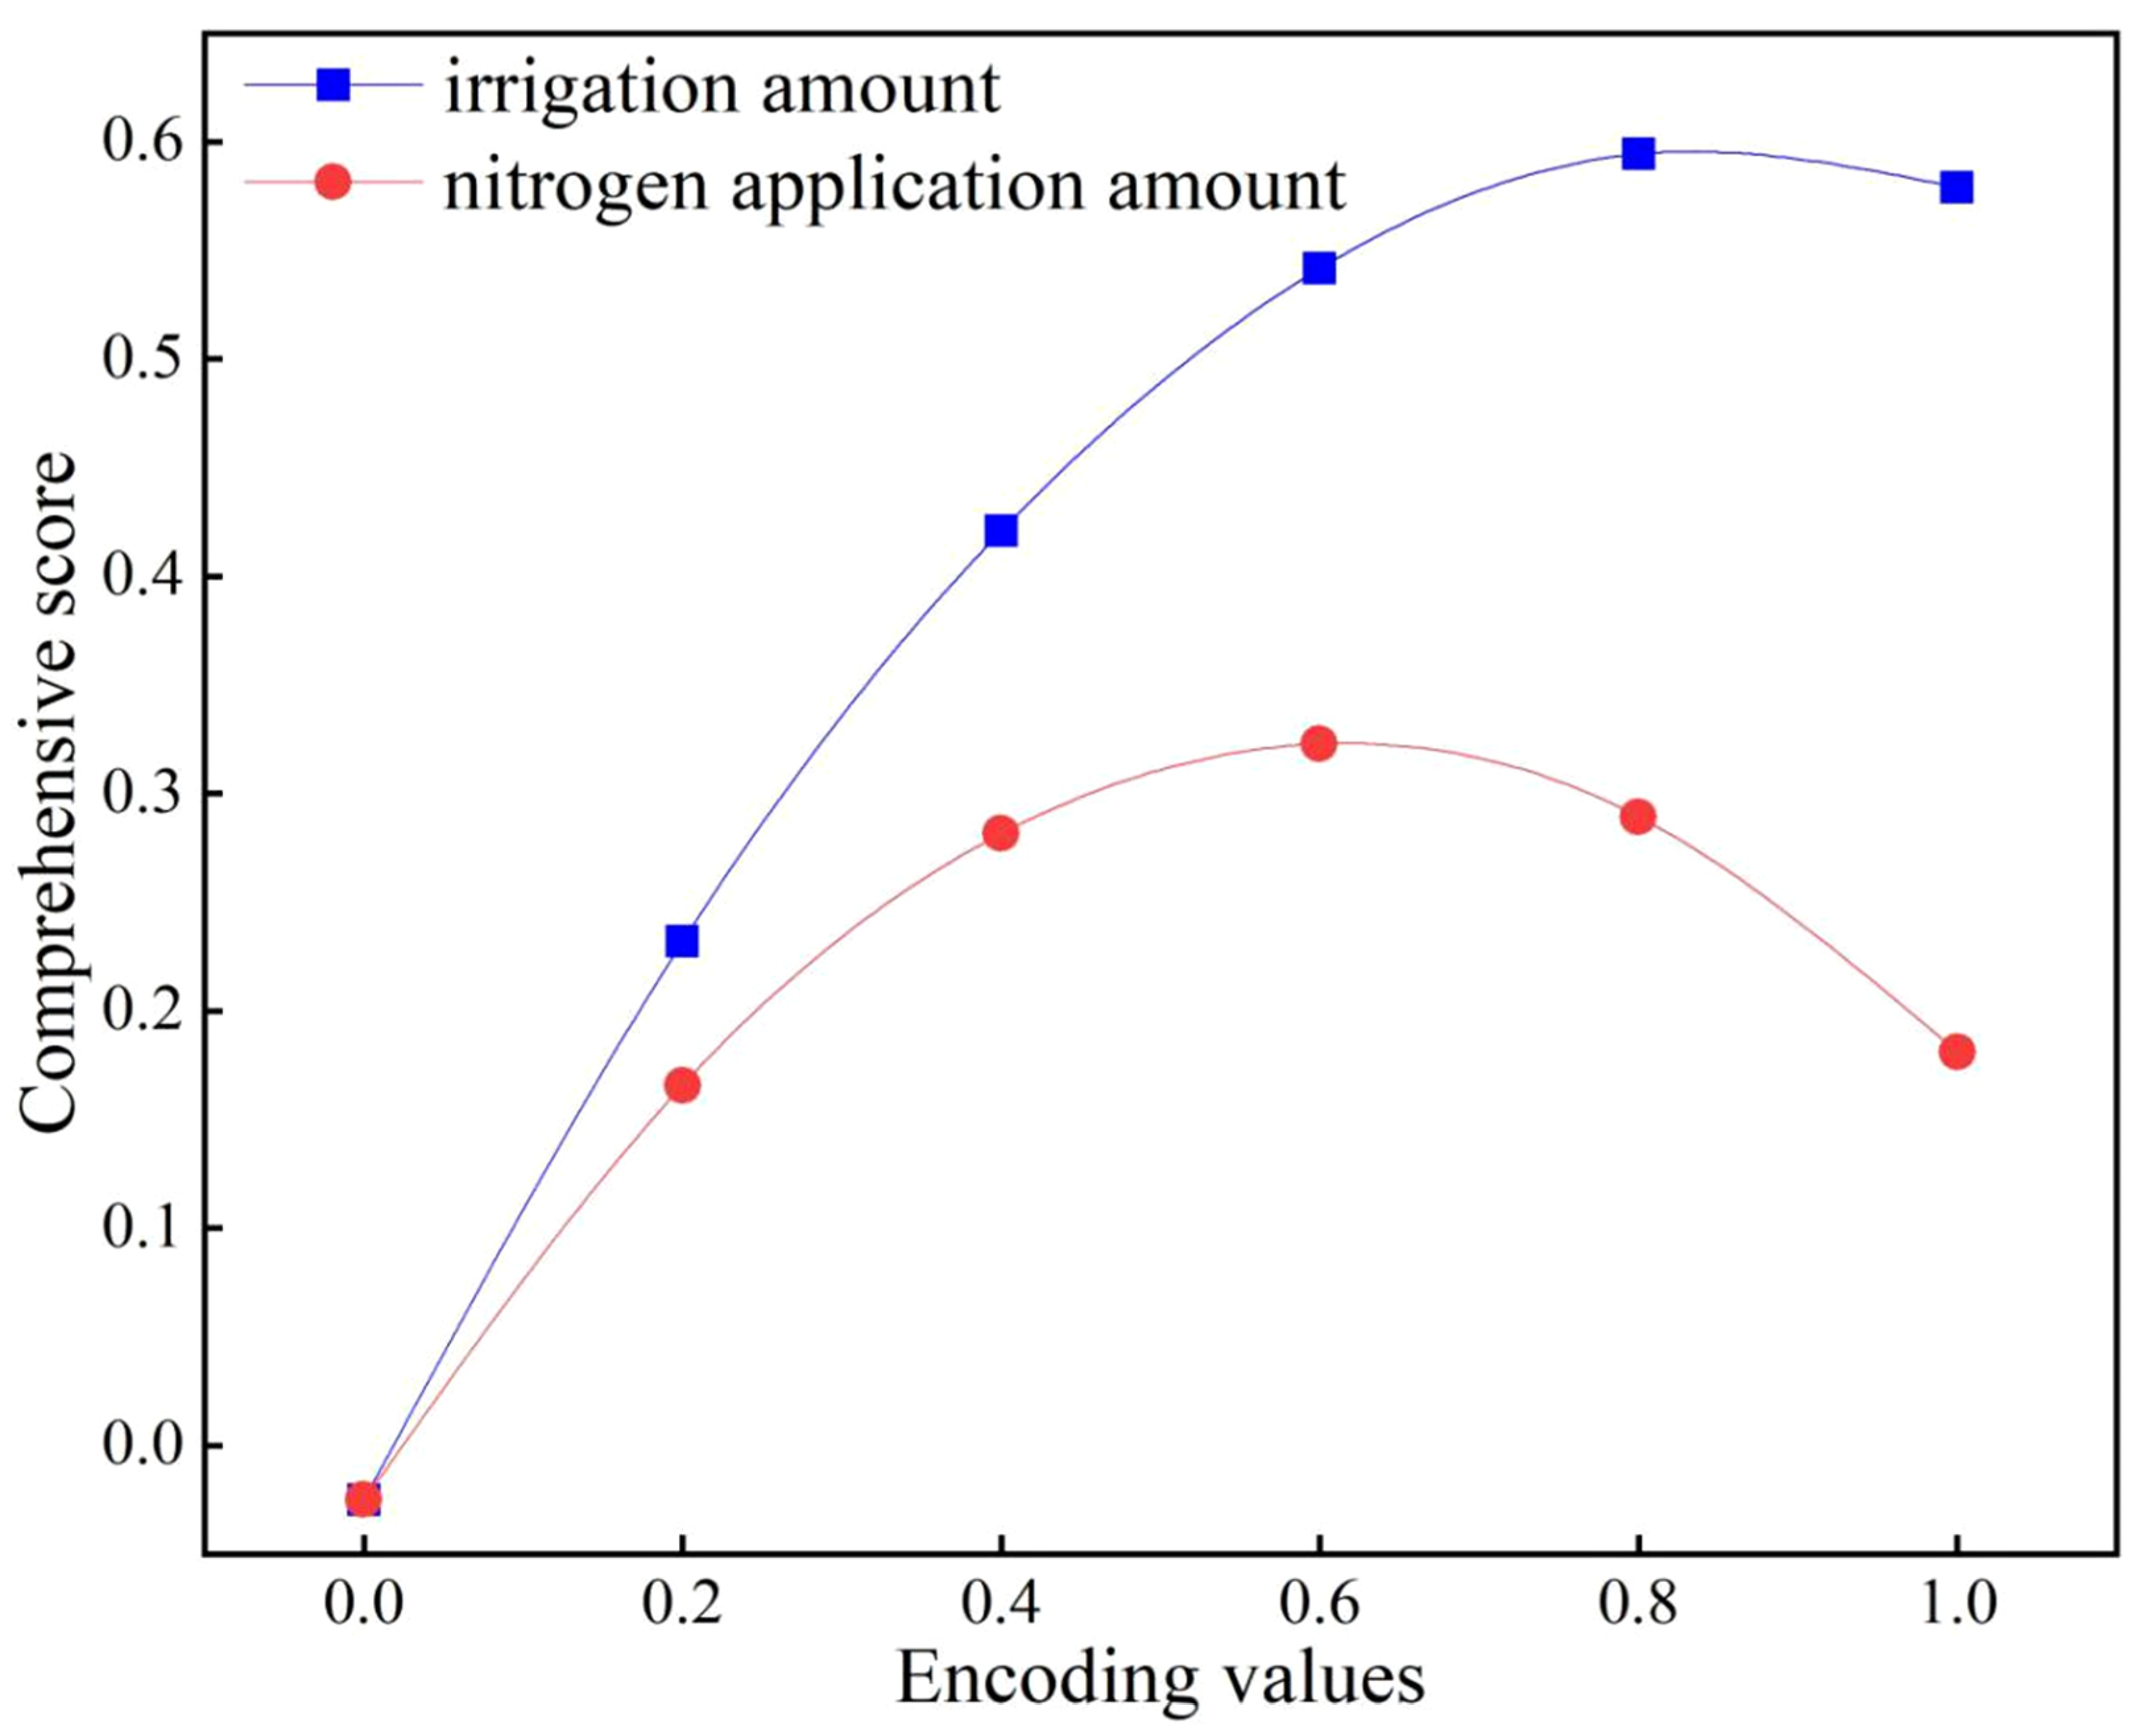
3.8.1. Single Factor Effect of Water–Nitrogen

In order to further investigate the effect of single factors on the comprehensive growth of I. tinctoria, the single-factor equations of irrigation amounts (yw) and nitrogen application rates (yn) were obtained by dimensionality reduction in the binary quadratic regression model.
y w = 0.025 + 1.455 x 1 0.851 x 1 2
y n = 0.025 + 1.140 x 1 0.934 x 1 2
As can be seen from Figure 8, the comprehensive score of I. tinctoria increased with the increasing irrigation amounts within the design range of irrigation levels, and the effect of the nitrogen application rates on the comprehensive score of I. tinctoria was a downward parabola. Overall, the comprehensive score of I. tinctoria showed an increasing and then decreasing trend with increasing irrigation amounts or nitrogen application rates, which is consistent with the diminishing reward effect. That is, the comprehensive score showed a decreasing trend when the irrigation amounts and nitrogen application rates exceeded a certain range. The comprehensive growth scores changed gently with the increasing irrigation amounts but changed sharply with the increasing nitrogen application rates, indicating that the comprehensive growth scores were more sensitive to the change in nitrogen application rates.

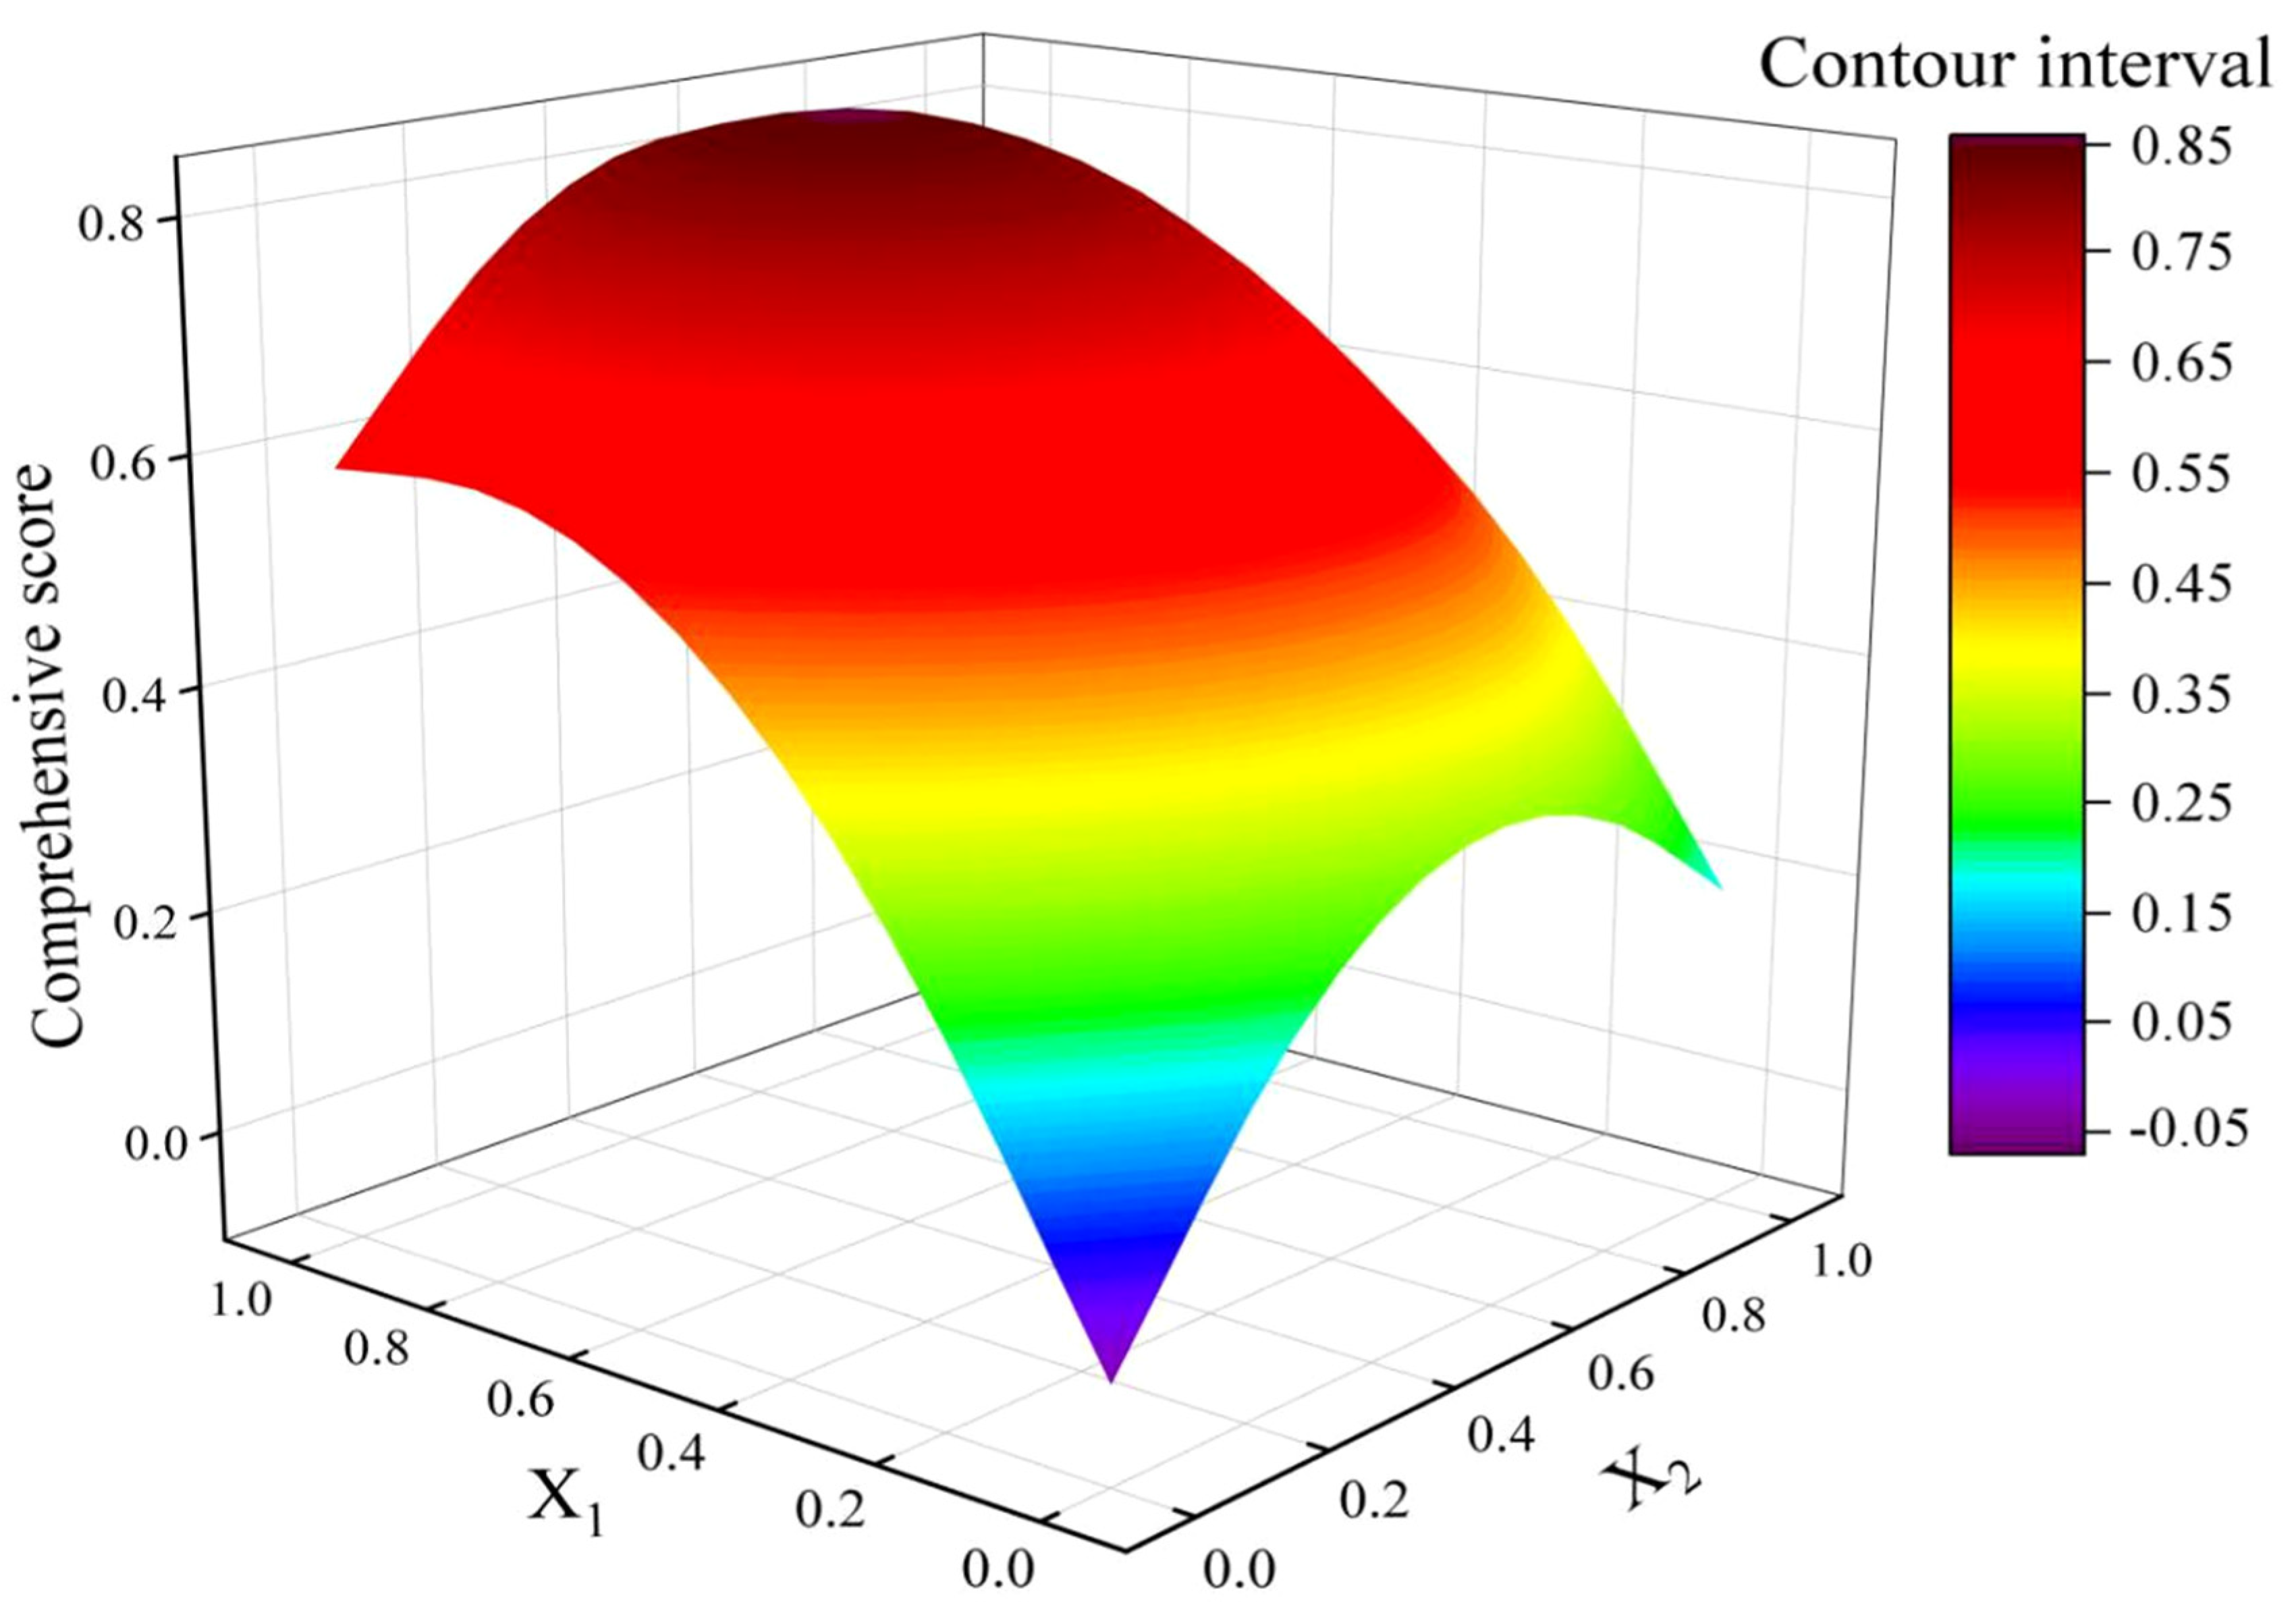
3.8.2. Analysis of the Water–Nitrogen Interaction

As can be seen from Figure 9, we divided the closed zone of water–nitrogen coupling based on 90% of the maximum comprehensive score, and this closed zone appeared at the medium-sufficient irrigation level and medium fertilization application level. It can be concluded that the optimal irrigation amounts for agricultural production were 129.39 to 171.05 mm (in 2021), 145.74 to 160.50 mm (in 2022), and 193.89 to 213.52 mm (2023), respectively, and the optimal nitrogen application rates were between 190.30 and 218.27 kg ha−1; that water–nitrogen combination was the most favorable for achieving the high yield and high quality of I. tinctoria.

4. Discussion

Water and nitrogen are the two major factors limiting crop growth, and different water and nitrogen supply conditions can significantly affect crop growth and development as well as yield formation [38]. The results of this study showed that low water supply caused severe drought stress, which significantly inhibited leaf area expansion as well as the stem and leaf dry matter mass accumulation of I. tinctoria; in addition, it also caused irreversible damage to stem and leaf development as well as limited root growth in the later stages. In contrast, the insufficient nitrogen supply caused by no or low nitrogen application significantly inhibited the growth of I. tinctoria plants and the accumulation of stem and leaf dry matter mass. Meanwhile, different levels of water and nitrogen supply in this study did not show significant interaction effects on I. tinctoria stem and root growth. With the aggravation of drought stress, the promotional effects of low nitrogen and no nitrogen on stems, leaves and roots dry matter mass accumulation, and roots growth of I. tinctoria gradually weakened, while there was no significant difference between the effects of medium nitrogen and high nitrogen on the growth of I. tinctoria. This indicates that improving water conditions can enhance the advantages of appropriate nitrogen supply and exert the water–fertilizer coupling effect as well as alleviate the negative effects of excessive nitrogen application and reduce soil nitrogen excess. Therefore, appropriate water and nitrogen supply can create a good growing environment for I. tinctoria. The results of this experiment showed that when the irrigation amount was 100% of the local typical irrigation quota, the nitrogen application rates of 200 to 250 kg ha−1, it could promote the growth of I. tinctoria leaf area and the accumulation of stem and leaf dry matter mass as well as effectively promote the taproot growth and improve the root–crown ratio, which is consistent with the conclusions of He et al. [39], both of which showed that reasonable nitrogen management measures can help exert the effects of water–nitrogen coupling, promote water absorption by the root of I. tinctoria, enhance the growth and development of stems and leaves, and jointly achieve a high yield and high efficiency of water and fertilizer, which further proved that reasonable water and nitrogen management measures are the key ways to promote the root growth and increase the dry matter accumulation of I. tinctoria. However, the optimal water and nitrogen application rates varied slightly in this study results, which may be due to the differences in the experimental program, the period of water and nitrogen supply, and the climatic conditions of the experimental area. The results of Chun et al. [40] showed that reducing irrigation amounts and giving moderate drought stress during the crop growth period could change the root morphology, and the crops would allocate more photosynthetic products to the root system to promote root growth, form more fine roots, increase the root length and root expansion area, and form a deeper root distribution [41]. Thus, the root system ability to obtain water is enhanced to maintain plant growth, and the physiological responses ability of plant osmosis regulation, carbon and nitrogen metabolism, and enzymatic defense is enhanced, which will play a compensatory and stimulating effect on plant growth after rehydration, thus promoting crop growth and improving dry matter accumulation [42]. The results of this experiment did not well support this conclusion, which may be mainly related to the experimental program, different test crops, and other factors. It can be seen that crop root development and morphological plasticity have complex response characteristics to water and nitrogen coupling, and more studies are needed to be explored and verified in the future.
The dry matter yield characteristics of I. tinctoria roots were the result of the accumulation of the plant photosynthetic products and their distribution among different organs. Water supply and nitrogen application rates, which were closely related to root growth, would affect the significant changes of Pn, Gs and Tr indexes of I. tinctoria, which in turn affect the accumulation of dry matter. In this study, under the same nitrogen application rates, the Pn, Gs and Tr indexes of I. tinctoria reached the peak value when the irrigation amounts reached 100% of the local typical irrigation quota, which indicates that sufficient irrigation can significantly improve I. tinctoria photosynthesis characteristics, and whether a higher irrigation rate still has positive significance needs to be further verified by relevant experiments. In addition, compared with low irrigation amount, the Pn, Gs, and Tr of I. tinctoria improved with increasing irrigation amounts, which may be due to the fact that sufficient irrigation promoted the expansion of leaf area, leading to an increase in the number of stomata and a stronger transpiration pull. Reasonable nitrogen application rates can effectively increase the green holding time of crop leaves, which is positive for the improvement of photosynthesis [43]. Generally, the fertility in the soil is limited, but long-term excessive inputs of fertilizer may lead to high residual fertility in the soil. Therefore, in this study, under the same irrigation amount conditions, the differences in photosynthetic indexes of I. tinctoria between no nitrogen and low nitrogen in 2021 were small. However, with the increase in experimental years, the residual nitrogen in the experimental area of no nitrogen was exhausted, and the Pn, Gs, and Tr of I. tinctoria showed a trend of increasing and significant differences when the nitrogen application rate was increased to 200 kg ha−1, which was due to the fact that topdressing nitrogen application could increase the chlorophyll content in I. tinctoria leaves, which in turn increased Pn. It was also found that no significant difference was observed when the nitrogen application rate was increased from 200 to 250 kg ha−1, although all photosynthetic physiological indexes of I. tinctoria still tended to increase, which undoubtedly suggests that higher nitrogen application rates did not have a positive significance on the photosynthetic characteristics of I. tinctoria. Generally, the increase in leaf area has a positive significance for the increase in Pn [44]. The leaf area was largest and Pn was highest when the irrigation amount was 100% of the local typical irrigation quota and the nitrogen application rate was 200–250 kg ha−1, and the correlation analysis also showed the same results. Lv et al. [45] showed that under medium water and sufficient water conditions, topdressing nitrogen application rates could significantly increase the Pn, maximum fluorescence, maximum photochemical efficiency and chlorophyll SPAD values of liquorice, but it no longer increased significantly after nitrogen application rates exceeded 140 kg ha−1. Liu et al. [46] found that under the same irrigation amounts, the photosynthetic characteristics of red bean showed an increasing trend with the increase in nitrogen application rates and reached the maximum at the medium nitrogen rate of 80 kg ha−1, but the photosynthetic characteristics showed a decreasing trend when the nitrogen application rates exceeded the middle nitrogen rate. Similarly, Qi et al. [47] also found a similar rule, that is, the coupling of sufficient water and medium nitrogen can effectively enhance maize Pn and Tr, and obtain the optimal photosynthetic characteristics, which could better support the conclusion of this experiment. Xia [48] and Meng [49] et al. showed that under the same irrigation amounts, high nitrogen treatments significantly increased peanut and cotton Pn and Tr. This was inconsistent with the study conclusions of this experiment and the former study. The reason for the difference may be related to the experimental program, crop type, regional climatic conditions and other factors.
Water and nitrogen are key factors affecting the growth and development of I. tinctoria, and the two factors can produce a coupling effect to increase yield and economic benefit and improve water–nitrogen productivity. Related studies have shown that a moderate water deficit can increase I. tinctoria yield, but under a low irrigation amount, I. tinctoria yield was significantly reduced [50]. Nitrogen has a significant effect on the yield of I. tinctoria as well as yield components. Increasing nitrogen application rates can improve the yield and economic benefit of I. tinctoria. However, an excessive application of nitrogen can lead to the loss of soil nitrate nitrogen, damage the soil environment, affect the stability of the agricultural ecosystem, and meanwhile reduce the yield of I. tinctoria [51]. Jiang et al. [52] found that with the increase in nitrogen application rates, the fresh mass and dry mass of I. tinctoria leaves increased gradually, while the fresh mass, dry mass and root–crown ratio of roots showed a trend of first increasing and then decreasing with increasing nitrogen application rates. Through the fitting analysis of nitrogen application rates and the quadratic function of I. tinctoria yield, it was found that the highest yield could be obtained with the nitrogen application rate of 220 kg ha−1. The results of Cao et al. [53] showed that nitrogen application rates were positively correlated with the taproot length and taproot diameter of I. tinctoria. With increasing nitrogen application rates, both the fresh weight and dry weight of I. tinctoria from Shanxi Province showed an increasing trend, and the maximum yield was obtained at the nitrogen application rate of 675 kg ha−1. Meanwhile, I. tinctoria from Gansu Province showed a trend of first increasing and then slightly decreasing, and the maximum yield was obtained at the nitrogen application rate of 338 kg ha−1. The results of this study showed that the single factor of water and nitrogen and their interaction significantly affected the yield and economic benefit of I. tinctoria. Under the same irrigation amounts, I. tinctoria yield increased with the increase in nitrogen application rates, which was due to the fact that increasing nitrogen application rates could regulate the soil moisture, promote the root development, enhance the root water absorption capacity, increase the leaf area and chlorophyll content, enhance the photosynthesis, and increase dry matter accumulation and distribution to the root, thus promoting the improvement of root dry matter. Under the same rates of nitrogen application, the yield of I. tinctoria increased with increasing irrigation amounts. This was due to the fact that the increase in irrigation amounts promoted the soil nutrient transport and nitrogen conversion and enhanced the nitrogen metabolism ability of the plant. Especially under the low nitrogen environment, increasing irrigation amounts had a promotion effect on the yield of I. tinctoria, realizing the regulation effect of fertilizer regulating the water and promoting the fertilizer with the water. The two-factor interaction effect analysis of water and nitrogen showed that under the condition of planting I. tinctoria with drip irrigation under plastic film in the irrigation area of the Hexi Corridor, the appropriate irrigation amount was 100% of the local typical irrigation quota, and the nitrogen application rate was 200 kg ha−1, which was consistent with the overall results of He et al. on the water and nitrogen regulation of I. tinctoria [39], but the threshold ranges of the irrigation amount and nitrogen application rate differed slightly, which may be related to the experimental program, the I. tinctoria variety, and the timing of nitrogen application.
Crop water and nitrogen productivity is an important indicator reflecting the relationship between crop water–nitrogen uptake and utilization and yield [54]. Reasonable water and nitrogen supply can greatly improve crop yield and water–nitrogen productivity, because reasonable irrigation amounts reduce ineffective soil water depletion, enhance crop transpiration intensity, and effectively coordinate the reduction in consumption in the farm-crop system, increasing water productivity [55]. It has been shown that appropriately increasing the irrigation amounts and nitrogen application rates within a certain range will increase crop water–nitrogen productivity, but excessive irrigation and nitrogen application will result in a waste of resources and serious reduction in water–nitrogen productivity [56,57]. In this study, when the irrigation quota increased from 70% to 85% of the typical irrigation quota, the water productivity, irrigation water productivity, nitrogen partial productivity, and nitrogen agronomic use efficiency showed a significant increasing trend, while the water productivity, nitrogen partial productivity, and nitrogen agronomic use efficiency showed an increasing trend, but the increase was not significant, while the irrigation water productivity showed a significant decreasing trend, which was due to the fact that on the one hand, the effect of irrigation on the yield of I. tinctoria was in accordance with the law of diminishing returns; on the other hand, I. tinctoria was subjected to drought stress at low irrigation amounts, which suppressed physiological activities and negatively affected root growth and development, and then the yield of I. tinctoria was lower at low irrigation amounts, which resulted in a low water–nitrogen productivity. Meanwhile, the results showed that the water productivity, irrigation water productivity, and nitrogen agronomic use efficiency increased significantly when nitrogen application rates increased from 150 to 200 kg ha−1, while nitrogen partial productivity showed a decreasing trend. When nitrogen application rates increased from 200 to 250 kg ha−1, nitrogen partial productivity and nitrogen agronomic use efficiency showed a decreasing trend, while water productivity and irrigation water productivity also showed a decreasing trend, but the increase was not significant, which was similar to the results of previous studies [58,59]. Therefore, supplemental irrigation is needed to promote water–nitrogen coupling to improve the water–nitrogen productivity of I. tinctoria along with additional nitrogen application rates. Tang et al. [60] pointed out that the water–nitrogen interaction has a significant role in regulating water and nitrogen utilization in crops; in this study, we also found that irrigation combined with nitrogen was more effective in promoting the growth of I. tinctoria plants than irrigation alone, and that moderately increasing the amount of nitrogen under a certain irrigation level can improve water productivity and irrigation water productivity. This may be due to the fact that both irrigation and nitrogen application contributed to the vigorous growth of I. tinctoria, which increased the water and nutrient demand of the plant and thus enhanced the water and nutrient uptake of the root. Meanwhile, irrigation could promote nitrogen uptake and utilization by crops, but excessive irrigation and nitrogen application may cause the negative effect of downward leaching of soil nitrogen with irrigation [61]. In this study, it was found that increasing the irrigation amounts was beneficial for enhancing the nitrogen partial productivity and nitrogen agronomic use efficiency, but the increase in irrigation amounts led to a decrease in irrigation water productivity; in contrast, water productivity and irrigation water productivity were maintained at a high level when the nitrogen application rate was at 200 kg ha−1. Therefore, in order to balance water and nitrogen productivity with I. tinctoria yield, and to facilitate production practices, it is recommended to apply 200 kg ha−1 of nitrogen at 100% of the local typical irrigation quota.
At present, a large number of scholars have conducted irrigation amounts optimization experiments on tomato, cucumber, alfalfa, potato and other crops, and it has been found that reasonable irrigation amounts improved crop quality and were conducive to the formation and accumulation of crop quality [62,63,64]. It has also been shown that timely and appropriate irrigation was the basis for I. tinctoria to obtain higher indigo, indirubin and (R,S)–goitrin, while lower and excessive irrigation levels are not conducive to the accumulation of indirubin and (R,S)–goitrin and the formation of integrated quality. In this study, it was found that under the same nitrogen application rates, when the irrigation amounts increased from 70% to 85% of the local typical irrigation quota, indigo, indirubin, (R,S)–goitrin, total nucleosides, uridine and adenosine tended to increase significantly, whereas all the quality factors tended to decrease when irrigation amounts increased from 85% to 100% of the local typical irrigation quota, but the decreasing rate was not significant. This is due to the fact that on the one hand, excessive irrigation changes the microbial activity trajectory, reduces the effectiveness of nutrients in the soil, and reduces the amount of nutrient uptake by root; on the other hand, excessive irrigation caused a decline in the oxygen content of the soil, inhibiting root respiration, which led to a decline in the vigor of the root, and it also weakened the absorption of water and fertilizer capacity. Deng et al. [65] concluded that a reasonable reduction in irrigation level was effective in promoting the accumulation of I. tinctoria indigo, indirubin, and (R,S)–goitrin compared to conventional sufficient irrigation, but excessive water deficit instead resulted in a significant reduction in the content of effective ingredients, which was similar to the findings of this study. Meanwhile, the results of this study showed that under the same irrigation amounts, indigo, indirubin, (R,S)–goitrin, total nucleosides, uridine, and adenosine showed an increase in the nitrogen application rates from 150 to 250 kg ha−1, where the maximum increment could be obtained when the irrigation amount was 85% of the local typical irrigation quota, which was similar to the results obtained by Deng et al. [65]. Therefore, reasonable irrigation is needed to promote water–nitrogen coupling and improve the quality of I. tinctoria while increasing nitrogen application. Ma et al. [66] pointed out that water–nitrogen interaction can significantly regulate the crop quality. In this study, we also found that irrigation combined with nitrogen application could improve the content of effective ingredients of I. tinctoria more than irrigation alone; that is, increasing the nitrogen application rates under certain irrigation amounts could improve the quality of I. tinctoria, which may be due to the fact that a favorable water–nitrogen environment is conducive to the activation of the secondary metabolism in the I. tinctoria root and thus increased its content of active components [61]. In conclusion, 85% of the local typical irrigation quota coupled with a 250 kg ha−1 nitrogen application rate can improve the content of effective ingredients in the root of I. tinctoria, which had the highest nutritional value.
In this study, a hierarchical model for the comprehensive evaluation of I. tinctoria was established using Yaaph software, the weight hierarchy was determined based on the AHP method, and the entropy weighting method was used to assign weights to the single index of I. tinctoria. Finally, the comprehensive evaluation was carried out based on the TOPSIS comprehensive model with combined weighting, and W3N2 (sufficient water and medium nitrogen) was determined to be a more suitable water–nitrogen combination, which indicated that the water–nitrogen system matching the sufficient water and medium nitrogen under the conditions of drip irrigation under plastic film can not only ensure the yield of I. tinctoria but also improve the water–nitrogen productivity and the contents of indigo, indirubin, (R,S)–goitrin, total nucleosides, uridine, and adenosine in root. It can be seen that W3N2 is beneficial for achieving the purpose of increasing the production and high quality of I. tinctoria planting in the experimental area. However, the influence of irrigation levels on yield, water–nitrogen productivity, and quality in this study lacked the upper limit of the dosage. It is necessary to continue to increase the gradient of irrigation amounts and conduct a more comprehensive and integrated evaluation on more indexes in further studies. The most appropriate water–nitrogen regime needs to be further verified.

5. Conclusions

A comprehensive evaluation of multiple indexes of the I. tinctoria water–nitrogen coupling planting model using the AHP method, entropy weight method, and TOPSIS method concluded that 100% of the local typical irrigation quota and 200 kg ha−1 nitrogen application was evaluated optimally, which could improve the soil water and nitrogen environment in the I. tinctoria planting area and increase the dry matter mass accumulation of I. tinctoria while maintaining the photosynthetic capacity of leaves, facilitating the distribution of dry matter to the root, and laying the foundation for high yield in the later stage. It can also obtain better quality of medicinal materials as well as increase the water productivity, irrigation water productivity, nitrogen partial productivity, and nitrogen agronomic use efficiency, leading to greater net proceeds. Therefore, in the actual production of I. tinctoria field in the oasis irrigation area of the Hexi Corridor in China, in order to obtain medicinal materials with stable yield and better quality, it is recommended to control the nitrogen application rates at 190.30 to 218.27 kg ha−1 by appropriately adopting reduced nitrogen application rates under the level of maintaining the local typical irrigation quota.

Author Contributions

Conceptualization, Y.W., X.P., H.D., M.L., J.Z. and J.Y.; methodology, Y.W.; software, Y.W. and X.P.; validation, Y.W., X.P., H.D., M.L., J.Z. and J.Y.; formal analysis, H.D.; data curation, Y.W.; writing—original draft preparation, Y.W.; writing—review and editing, Y.W.; funding acquisition, Y.W. All authors have read and agreed to the published version of the manuscript.

Funding

This research was funded by the 2023 Special Commissioner of Science and Technology Department of Gansu Province (project number: 23CXNA0032) and the Construction Project of Water Conservancy Engineering Discipline of Gansu Agricultural University (No. 27000102).

Data Availability Statement

Data are contained within the article.

Acknowledgments

We thank everyone who helped during the field trials. We also thank the reviewers for their useful comments and suggestions.

Conflicts of Interest

The authors declare no conflicts of interest.

References

  1. Li, W.Y.; Yao, J.J.; He, C.; Ren, Y.F.; Zhao, L.L.; He, X.L. The synergy of dark septate endophytes and organic residue on Isatis indigotica growth and active ingredients accumulation under drought stress. Ind. Crops Prod. 2023, 203, 117147. [Google Scholar] [CrossRef]
  2. Han, W.J.; Zhou, L.; Wan, H.F.; Fu, X.D.; Xu, L.G.; Sun, X.B.; Guo, W.; Guo, X.W.; Sui, C.; Wei, J.H. A comprehensive comparison on root yield and content of polysaccharides and alkaloids from ten germplasms of Isatis indigotica Fort. in two growing areas. Ind. Crops Prod. 2022, 187, 115254. [Google Scholar] [CrossRef]
  3. Yang, X.M. Development of characteristic economic industries of traditional Chinese medicine in Ganzhou district existing problems and suggestions. Gansu Agric. 2023, 1, 100–102. [Google Scholar] [CrossRef]
  4. Wang, R.Q.; Li, D.D.; Luo, S.W.; Wang, K.; Don, Y.X.; Zhang, L.L.; TuErHong, G.L.N.G.E.; Zhang, J.S.; Shi, S.B. Current situation, existing problems and solutions of banlangen planting in Bazhou area. Xinjiang Agric. Sci. Technol. 2022, 03, 23–25. [Google Scholar] [CrossRef]
  5. Shuai, Y.Y.; He, M.J. Analysis and control of common diseases and insect pests in Radix Isatidis. Agric. Technol. Equip. 2020, 370, 146–147. [Google Scholar] [CrossRef]
  6. Wu, C.Y.; Wang, J.H.; Yang, Y.; Li, D.Y.; Li, X.; Yan, R. Analysis of the development status and mechanization trends of economic crop industry in China. J. Chin. Agric. Mech. 2024, 45, 1–13. [Google Scholar] [CrossRef]
  7. Hao, X.Y.; Li, P.; Feng, Y.X.; Han, X.; Gao, J.; Lin, E.D.; Han, Y.H. Effects of fully open-air [CO2] elevation on leaf photosynthesis and ultrastructure of Isatis indigotica fort. PLoS ONE 2013, 8, 74600. [Google Scholar] [CrossRef]
  8. Guo, L.P.; Wang, T.L.; Yang, W.Z.; Zhou, L.Y.; Chen, N.F.; Han, B.X.; Huang, L.Q. Ecological agriculture: Future of agriculture for Chinese material medica. China J. Chin. Mater. Med. 2017, 42, 231–238. [Google Scholar] [CrossRef]
  9. Yang, L.; Liu, Y.; Chen, J.B.; Shi, X.J.; Chen, Y.R.; Gong, Y.T.; Don, L.; Sun, Y. Formation and development of Dao-di herbs “Long” medicines. China J. Chin. Mater. Med. 2019, 44, 5513–5519. [Google Scholar] [CrossRef]
  10. Fang, Y.J.; Zhang, X.C.; Li, L.L.; Effah, Z.; Nizamani, M.M. Effects of the plastic mulching system and fertilizer application on the yield of tartary buckwheat (fagopyrum tataricum) and water consumption characteristics in a semi-arid area. Agronomy. 2024, 14, 735. [Google Scholar] [CrossRef]
  11. Wang, Z.H.; Yang, B.L.; Xie, X.W.; Wang, Z.Y.; Yang, H.Z.; Dong, X.J. Effects of different irrigation regimes of drip irrigation under plastic film on sugar beet yield and water use efficiency. Trans. Chin. Soc. Agric. Eng. 2019, 35, 158–166. [Google Scholar] [CrossRef]
  12. Jia, Q.; Shi, H.B.; Li, R.P.; Miao, Q.F.; Feng, Y.Y.; Wang, N. Evaporation of maize crop under mulch film and soil covered drip irrigation: Field assessment and modelling on West Liaohe Plain, China. Agric. Water Manag. 2021, 253, 106894. [Google Scholar] [CrossRef]
  13. Wen, Y.; Liu, J.; Zhang, J.Z.; Li, W.H.; Ayantobo, O.O. Effects of macro-plastics on soil hydrothermal environment, cotton yield, and fiber quality under mulched drip irrigation in the arid region of Northwest China. Field Crops Res. 2023, 302, 109060. [Google Scholar] [CrossRef]
  14. Huang, T.B.; Wang, Z.H.; Guo, L.; Li, H.Q.; Tan, M.D.; Zou, J.; Zong, R.; Dhital, Y.P. The impact of long-term mulched drip irrigation on soil particle composition and salinity in arid northwest China. Agronomy. 2014, 14, 599. [Google Scholar] [CrossRef]
  15. Jayakumar, M.; Bosu, S.S.; Kantamaneni, K.; Rathnayake, U.; Surendran, U. Drip irrigation on productivity, water use efficiency and profitability of turmeric (Curcuma longa) grown under mulched and non-mulched conditions. Results Eng. 2024, 22, 102018. [Google Scholar] [CrossRef]
  16. Chen, Y.; Zhang, J.Z.; Wang, Z.H.; Li, H.Q.; Chen, R.; Zhao, Y.; Huang, T.B.; Luo, P.C. Influence of long-term mulched drip irrigation on upward capillary water movement characteristics in the saline–sodic region of northwest China. Agronomy 2024, 14, 1300. [Google Scholar] [CrossRef]
  17. Yang, W.; Jia, Y.L.; Feng, G.; Ma, C.; Qu, Z.Y. Residual effect of single biochar application on soil nutrients availability and fertilizer productivity in a mulched drip-irrigated corn field. Arch. Agron. Soil Sci. 2023, 69, 905–919. [Google Scholar] [CrossRef]
  18. Wu, F.Q.; Tang, Q.X.; Zhang, L.Z.; Cui, J.P.; Tian, L.W.; Guo, R.S.; Wang, L.; Chen, B.Q.; Ali, S.; Zhang, N.; et al. Reducing irrigation and increasing plant density enhance both light interception and light use efficiency in cotton under film drip irrigation. Agronomy 2023, 13, 2248. [Google Scholar] [CrossRef]
  19. Yang, Y.P.; Yin, J.; Ma, Z.H.; Wei, X.D.; Sun, F.D.; Yang, Z. Water and nitrogen regulation effects and system optimization for potato (Solanum tuberosum L.) under film drip irrigation in the dry zone of Ningxia China. Agronomy 2023, 13, 308. [Google Scholar] [CrossRef]
  20. Xu, J.; Wan, W.L.; Zhu, X.L.; Zhao, Y.H.; Chai, Y.Q.; Guan, S.H.; Diao, M. Effect of regulated deficit irrigation on the growth, yield, and irrigation water productivity of processing tomatoes under drip irrigation and mulching. Agronomy 2013, 13, 2862. [Google Scholar] [CrossRef]
  21. Yang, Z.O.; Tian, J.C.; Yan, X.F.; Yang, Z.F. Micro-nano oxygenated irrigation improves the yield and quality of greenhouse cucumbers under-film drip irrigation. Sci. Rep. 2023, 13, 19453. [Google Scholar] [CrossRef]
  22. Guan, J.L.; Wang, G.; Zhang, M.R.; Cheng, X.; Cao, Y.W.; Tang, X.Q.; Wang, K.C. Effects of different nitrogen supply levels on the growth of Isatis indigotica fort. and quality of medicinal materials. J. Nucl. Agric. Sci. 2019, 33, 2077–2085. [Google Scholar] [CrossRef]
  23. Yang, F.H.; Bao, G.J.; Wang, H.Y.; He, Y.B. Effect of nitrogen and phosphorus on growth and yield of Isatis indigotica fort in Eastern Gansu Province. Chin. Agric. Sci. Bull. 2017, 33, 80–84. [Google Scholar]
  24. Liu, L.D.; Liu, M.X.; Sun, X.; Wang, M.M.; Xie, X.L.; Wen, C.X.; Tian, W.; Jia, D.H.; Bian, J.B. Dry matter accumulation and absorption and distribution of N, P, K in Isatis indigotica. J. Agric. Sci. Technol. 2017, 33, 80–84. [Google Scholar] [CrossRef]
  25. He, H.D.; Hu, C.; Xu, H.C.; Yang, R.; You, C.C.; Ke, J.; Zhang, Q.Q.; Wu, L.Q. High yield, good eating quality, and high N use efficiency for medium hybrid indica rice: From the perspective of balanced source-sink relationships at heading. Eur. J. Agron. 2024, 159, 127281. [Google Scholar] [CrossRef]
  26. Liang, L.Z.; Zhao, X.Q.; Yi, X.Y.; Chen, Z.C.; Dong, X.Y.; Chen, R.F.; Shen, R.F. Excessive application of nitrogen and phosphorus fertilizers induces soil acidification and phosphorus enrichment during vegetable production in Yangtze River Delta, China. Soil Use Manag. 2013, 29, 161–168. [Google Scholar] [CrossRef]
  27. Xiao, Y.S.; Peng, Y.; Peng, F.T.; Zhang, Y.F.; Yu, W.; Sun, M.X.; Gao, X.L. Effects of concentrated application of soil conditioners on soil–air permeability and absorption of nitrogen by young peach trees. Soil Sci. Plant Nutr. 2018, 64, 423–432. [Google Scholar] [CrossRef]
  28. Fang, H.S.; Li, C.L. Advances in causes and improvement measures of soil compaction in tea gardens. Mod. Agric. Sci. Technol. 2024, 128–132. [Google Scholar]
  29. Cheng, L.; Li, K.K.; Shi, W.J.; Wang, X.L.; Wang, E.T.; Liu, J.F.; Sui, X.H.; Mi, G.H.; Tian, C.F.; Chan, W.X. Negative impacts of excessive nitrogen fertilization on the abundance and diversity of diazotrophs in black soil under maize monocropping. Geoderma 2021, 393, 114999. [Google Scholar] [CrossRef]
  30. Hu, Y.M.; Wang, L.; Chen, F.X.; Ren, X.N.; Tan, Z.X. Soil carbon sequestration efficiency under continuous paddy rice cultivation and excessive nitrogen fertilization in South China. Soil Tillage Res. 2021, 213, 105108. [Google Scholar] [CrossRef]
  31. Yao, B.; Jiang, W.; Yan, D.C.; Zhang, L.C.; Ma, E.D.; Deng, X.P.; Xu, Z.L.; Sun, W.C.; Li, J.Y.; Tang, L. Determining nitrogen status using a universal critical nitrogen dilution curve for predicting flue-cured tobacco yield and quality. J. Agric. Food Res. 2024, 18, 101296. [Google Scholar] [CrossRef]
  32. Yin, J.; Ma, Z.H.; Yang, Y.P.; Du, B.; Sun, F.B.; Yang, Z. Water and nitrogen coupling on the regulation of soil nutrient–microbial biomass balance and its effect on the yield of wolfberry (Lycium barbarum L.). Plants 2023, 12, 2768. [Google Scholar] [CrossRef] [PubMed]
  33. Jin, Z.Q.; Tao, Y.; Yue, R.; Ma, Z.F.; Cheng, S.H.; Khan, M.N.; Nie, L.X. Trade-off between grain yield and bioactive substance content of colored rice under coupled water and nitrogen conditions. Field Crops Res. 2024, 309, 109312. [Google Scholar] [CrossRef]
  34. Cai, Z.L.; Bai, J.M.; Li, R.; He, D.W.; Du, R.C.; Li, D.Y.; Hong, T.T.; Zhang, Z. Water and nitrogen management scheme of melon based on yield quality efficiency matching perspective under CO2 enrichment. Agric. Water Manag. 2023, 285, 108379. [Google Scholar] [CrossRef]
  35. Ma, Z.H.; Yin, J.; Yang, Y.P.; Sun, F.D.; Yang, Z. Effect of water and nitrogen coupling regulation on the growth, physiology, yield, and quality attributes and comprehensive evaluation of wolfberry (Lycium barbarum L.). Front. Plant Sci. 2023, 14, 1130109. [Google Scholar] [CrossRef]
  36. National Pharmacopoeia Committee. Pharmacopoeia of the People’s Republic of China (Part I); China Medical Science and Technology Press: Beijing, China, 2015; pp. 204–205. [Google Scholar]
  37. Ren, G.P.; Li, Z.; Fu, X.T.; Guo, H.Z.; Chen, Y.G. Simultaneous determination of uridine, guanosine, (R,S)-goitrin and adenosine in Isatidis Radix by HPLC. Chin. J. New Drugs 2012, 21, 2330–2334. [Google Scholar]
  38. Liu, K.; Liao, H.; Hao, H.B.; Hou, Z.N. Water and nitrogen supply at spatially distinct locations improves cotton water productivity and nitrogen use efficiency and yield under drip irrigation. Agric. Water Manag. 2024, 296, 108808. [Google Scholar] [CrossRef]
  39. He, X.C.; Qiu, H.Z.; Xie, K.Z.; Wang, Y.C.; Hu, J.; Li, F.Q.; An, J. Effects of water saving and nitrogen reduction on the yield, quality, water and nitrogen use efficiency of Isatis indigotica in Hexi Oasis. Sci. Rep. 2022, 12, 550. [Google Scholar] [CrossRef]
  40. Chun, H.C.; Lee, S.H.; Choi, Y.D.; Gong, D.H.; Jung, K.Y. Effects of drought stress on root morphology and spatial distribution of soybean and adzuki bean. J. Integr. Agric. 2021, 20, 2639–2651. [Google Scholar] [CrossRef]
  41. Taleb, M.H.; Majidi, M.M.; Maibody, S.A.M.M.; Pirnajmedin, F. Variation in persistency, postdrought recovery and root characteristics in a tall fescue germplasm under interactive effects of exogenously applied salicylic acid and water stress. Plant Breed. 2021, 140, 678–692. [Google Scholar] [CrossRef]
  42. Gebre, M.G.; Earl, H.J. Soil water deficit and fertilizer placement effects on root biomass distribution, soil water extraction, water use, yield, and yield components of soybean [Glycine max (L.) Merr.] grown in 1-m rooting columns. Front. Plant Sci. 2021, 12, 581127. [Google Scholar] [CrossRef] [PubMed]
  43. Cui, P.Y.; Sheng, X.Z.; Chen, Z.X.; Ning, Q.Q.; Zhang, H.P.; Lu, H.; Zhang, H.C. Optimizing one-time nitrogen fertilization for rice production using controlled-release urea and urease inhibitors. Agronomy 2024, 14, 67. [Google Scholar] [CrossRef]
  44. He, L.; Li, H.R.; He, J.N.; Han, D.W.; Li, R.Q.; Wang, H.G. Irrigation at appearance of top 2nd or flag leaf could improve canopy photosynthesis by regulating light distribution and LAI at each leaf layer. Field Crops Res. 2023, 295, 10883. [Google Scholar] [CrossRef]
  45. Lv, X.L.; Li, M.; Li, Y.X.; Bai, H.B.; Hui, J.; Ma, H.J.; Li, S.H.; Guo, S.H.; Xu, X. Effects of different ratios of water and nitrogen on growth, water use efficiency and flavonoid content of Glycyrrhiza uralensis. Plant Physiol. J. 2023, 59, 421–431. [Google Scholar] [CrossRef]
  46. Liu, C.F.; Wang, X.L.; Chai, C.L.; Liang, S.T.; Liu, H.Q. Effects of water and nitrogen coupling on photosynthetic characteristics, dry matter accumulation and yield of Adzuki Bean. J. Hebei Agric. Univ. 2022, 45, 37–43. [Google Scholar] [CrossRef]
  47. Qi, Y.L.; Ning, X.L.; Sun, G.F.; Li, M.; Shi, H.B. Regulatory effects of water-nitrogen coupling on photosynthetic characteri-stics and yield of drip-irrigated maize. J. North. Agric. Univ. 2024, 55, 10–20. [Google Scholar] [CrossRef]
  48. Xia, G.M.; Luo, X.L.; Nie, X.P.; Zheng, J.L.; Chi, D.C. Effects of water deficit in different growth stages coupling with nitrogen application rates on photosynthetic traits and quality of peanuts. Trans. Chin. Soc. Agric. Eng. 2022, 38, 67–75. [Google Scholar] [CrossRef]
  49. Meng, Y.J.; Ma, X.Y.; Song, C.; Sun, H.C.; Liu, L.T.; Zhang, K.; Zhang, Y.J.; Bai, Z.Y.; Li, C.D. Effects of water and nitrogen regulation on physiological characteristics and yield of cotton. Chin. J. Eco-Agric. 2023, 31, 1379–1391. [Google Scholar] [CrossRef]
  50. Zhou, C.L.; Yu, S.C.; Zhang, H.J.; Li, F.Q. Physiological and biochemical responses of Isatis indigotica to deficit irrigation in a cold and arid environment. Front. Plant Sci. 2022, 13, 1094158. [Google Scholar] [CrossRef]
  51. Zhang, C.L. The effect of different nitrogen application rates on the yield of Isatis indigotica in Hexi region. Gansu Sci. Technol. 2022, 38, 132–134. [Google Scholar]
  52. Jiang, L.L.; Wang, Z.Q.; Shi, X.Y.; Zhang, M.Y.; Jin, Y.H. The effect of different nitrogen application rate on the yield and quality of Isatis indigotica fort. North. Hortic. 2020, 24, 107–112. [Google Scholar]
  53. Cao, Y.W.; Qu, R.J.; Wang, L.; Shen, B.Q.; Guan, J.L.; Geng, L.; Tang, X.Q.; Wang, K.C. Effect of nitrogen reduction on growth and quality of Isatis indigotica Fort. J. Plant Nutr. Fertil. 2019, 25, 765–772. [Google Scholar] [CrossRef]
  54. Sainju, U.M.; Lenssen, A.W.; Allen, B.L.; Jabro, J.D.; Stevens, W.B. Crop water and nitrogen productivity in response to long-term diversified crop rotations and management systems. Agric. Water Manag. 2021, 257, 107149. [Google Scholar] [CrossRef]
  55. Calvo, F.E.; Trentacoste, E.R.; Silvente, S.T. Vegetative growth, yield, and crop water productivity response to different irrigation regimes in high density walnut orchards (Juglans regia L.) in a semi-arid environment in Argentina. Agric. Water Manag. 2022, 274, 107969. [Google Scholar] [CrossRef]
  56. Ye, T.Y.; Ma, J.F.; Zhang, P.; Shan, S.; Liu, L.L.; Tang, L.; Cao, W.X.; Liu, B. Interaction effects of irrigation and nitrogen on the coordination between crop water productivity and nitrogen use efficiency in wheat production on the North China Plain. Agric. Water Manag. 2022, 271, 107787. [Google Scholar] [CrossRef]
  57. Ran, H.; Kang, S.Z.; Li, F.S.; Du, T.S.; Ding, R.S.; Li, S.E.; Tong, L. Responses of water productivity to irrigation and N supply for hybrid maize seed production in an arid region of Northwest China. J. Arid Land. 2017, 9, 504–514. [Google Scholar] [CrossRef]
  58. Gao, R.P.; Pan, Z.H.; Zhang, J.; Chen, X.; Qi, Y.L.; Zhang, Z.Y.; Chen, S.Q.; Jiang, K.; Ma, S.Q.; Wang, J.L.; et al. Optimal cooperative application solutions of irrigation and nitrogen fertilization for high crop yield and friendly environment in the semi-arid region of North China. Agric. Water Manag. 2023, 283, 108326. [Google Scholar] [CrossRef]
  59. He, P.R.; Yu, S.E.; Ding, J.H.; Ma, T.; Li, J.G.; Dai, Y.; Chen, K.W.; Peng, S.H.; Zeng, G.Q.; Guo, S.S. Multi-objective optimization of farmland water level and nitrogen fertilization management for winter wheat cultivation under waterlogging conditions based on TOPSIS-Entropy. Agric. Water Manag. 2024, 297, 108840. [Google Scholar] [CrossRef]
  60. Tang, R.; Han, Y.X.; Yi, S.S.; Zheng, W.; Nan, X.H.; Luo, H.; Wen, X.R.; Zhai, B.N. Optimal water and nitrogen rate combination for winter wheat yield and water-nitrogen efficiency in Guanzhong area of Shaanxi. J. Plant Nutr. Fertil. 2023, 29, 1944–1955. [Google Scholar] [CrossRef]
  61. Er, C.; Lin, T.; Xia, W.; Zhang, H.; Xu, G.Y.; Tang, Q.X. Coupling effects of irrigation and nitrogen levels on yield, water distribution and nitrate nitrogen residue of machine-harvested cotton. Acta Agron. Sin. 2022, 48, 497–510. [Google Scholar] [CrossRef]
  62. Li, R.; Bai, J.M.; Li, D.Y.; Ren, X.R.; He, D.W.; Du, R.C. Water and fertilizer decision model for synergistic optimization of yield, quality and efficiency of cherry tomato based on combination evaluation. Compu. Electron. Agric. 2024, 224, 109224. [Google Scholar] [CrossRef]
  63. Li, N.; Wang, X.X.; Xue, Z.J.; Li, Q.Y. Water and potassium utilization efficiency and yield and quality of cucumber (Cucumis sativus L.). Sci. Hortic. 2024, 330, 113025. [Google Scholar] [CrossRef]
  64. Zhang, F.; Chen, M.R.; Fu, J.T.; Zhang, X.Z.; Li, Y.; Shao, Y.T.; Xing, Y.Y.; Wang, X.K. Coupling effects of irrigation amount and fertilization rate on yield, quality, water and fertilizer use efficiency of different potato varieties in Northwest China. Agric. Water Manag. 2023, 287, 1084466. [Google Scholar] [CrossRef]
  65. Deng, H.L.; Zhang, J.H.; Li, F.Q.; Wang, Y.C.; Zhou, H.; Deng, Z.R.; Hao, N. Response of growth, photosynthetic characteristics, and quality of Isatis indigotica in Hexi Corridor to mulched drip irrigation under water deficit. Chin. J. Soil Water Conserv. 2018, 32, 321–327. [Google Scholar] [CrossRef]
  66. Ma, H.X.; Jiang, P.; Zhang, X.J.; Ma, W.L.; Cai, Z.H.; Sun, Q. Effects of nitrogen fertilization combined with subsurface irrigation on alfalfa yield, water and nitrogen use efficiency, quality, and economic benefits. Front. Plant Sci. 2024, 15, 1339417. [Google Scholar] [CrossRef]
Figure 1. Location of the experimental site.
Agronomy 14 02187 g001
Figure 2. Daily variation in reference crop evapotranspiration (ET0), average temperature, and precipitation throughout the I. tinctoria growing seasons of 2021 (A), 2022 (B) and 2023 (C).
Agronomy 14 02187 g002
Figure 3. A schematic diagram of the I. tinctoria planting arrangement.
Agronomy 14 02187 g003
Figure 4. Effects of different irrigation amounts and nitrogen application rates on net photosynthetic rate of I. tinctoria in 2021, 2022, 2023 and 3-year average (mean ± standard error). Different lowercase letters within columns indicate significant differences among treatments at p < 0.05.
Agronomy 14 02187 g004
Figure 5. Effects of different irrigation amounts and nitrogen application rates on stomatal conductance of I. tinctoria in 2021, 2022, 2023 and 3-year average (mean ± standard error). Different lowercase letters within columns indicate significant differences among treatments at p < 0.05.
Agronomy 14 02187 g005
Figure 6. Effects of different irrigation amounts and nitrogen application rates on transpiration rate of I. tinctoria in 2021, 2022, 2023 and 3-year average (mean ± standard error). Different lowercase letters within columns indicate significant differences among treatments at p < 0.05.
Agronomy 14 02187 g006
Figure 7. Pearson’s correlation analysis between I. tinctoria photosynthetic physiology, yield, water–nitrogen productivity and quality under the different irrigation amounts and nitrogen application rates in 2021, 2022, 2023 and 3-year average. Correlations between the two indicators were significant at * p < 0.05. PH: plant height; LA: leaf area index; AS: accumulation of dry matter in stems and leaves; RL: taproot length; RD: taproot diameter; AR: accumulation of dry matter in root; RC: root–crown ratio; PN: net photosynthetic rate; GS: stomatal conductance; TR: transpiration rate; Y: yield; WC: water consumption; WP: water productivity; IP: irrigation water productivity; PN: nitrogen partial productivity; AN: nitrogen agronomy use efficiency; EB: economic benefit; NP: net proceeds; OI: output–input ratio; IO: indigo; IN: indirubin; RS: (R,S)–goitrin; TN: total nucleosides; U: uridine; A: adenosine.
Agronomy 14 02187 g007
Figure 8. The effect of single factors on the comprehensive score of I. tinctoria.
Agronomy 14 02187 g008
Figure 9. The effect of water–nitrogen coupling on the comprehensive growth of I. tinctoria.
Agronomy 14 02187 g009aAgronomy 14 02187 g009b
Table 1. Basic physical and chemical properties of 0–40 cm soil layer in the experimental site.
Soil Depth (cm)OM
(g kg−1)
TN
(g kg−1)
TP
(g kg−1)
TK
(g kg−1)
NN
(mg kg−1)
AN
(mg kg−1)
AP
(mg kg−1)
AK
(mg kg−1)
pH
0–2013.91.271.1524.7203.7525.50102.88208.21
20–4013.01.180.9922.1116.4023.8050.45948.45
OM: soil organic matter content, TN: soil total nitrogen content, TP: soil total phosphorus content, TK: soil total potassium content, NN: soil nitrate nitrogen content, AN: soil ammonium nitrogen content, AP: soil available phosphorus content, AK: soil available potassium content.
Table 2. The irrigation quota and fertilizer application of different year.
TreatmentIrrigation Quota (mm)Total Fertilizer Application
(kg ha−1)
Factor Code Value
202120222023NPKIrrigation Amount
×1
Nitrogen Application Rate
×2
W1N0121.5 114.0 151.7 0350200
W1N1121.5114.0 151.7 1503502000.00.0
W1N2121.5114.0 151.7 2003502000.00.5
W1N3121.5114.0 151.7 2503502000.01.0
W2N0147.6 138.5184.20350200
W2N1147.6 138.5184.21503502000.50.0
W2N2147.6 138.5184.22003502000.50.5
W2N3147.6 138.5 184.22503502000.51.0
W3N0173.6162.9216.70350200
W3N1173.6162.9216.71503502001.00.0
W3N2173.6162.9216.72003502001.00.5
W3N3173.6162.9216.72503502001.01.0
Note: W1N0 indicates 70% of the local typical irrigation quota and 0 kg ha−1 nitrogen application; W1N1 indicates 70% of the local typical irrigation quota and 150 kg ha−1 nitrogen application; W1N2 indicates 70% of the local typical irrigation quota and 200 kg ha−1 nitrogen application; W1N3 indicates 70% of the local typical irrigation quota and 250 kg ha−1 nitrogen application; W2N0 indicates 85% of the local typical irrigation quota and 0 kg ha−1 nitrogen application; W2N1 indicates 85% of the local typical irrigation quota and 150 kg ha−1 nitrogen application; W2N2 indicates 85% of the local typical irrigation quota and 200 kg ha−1 nitrogen application; W1N3 indicates 85% of the local typical irrigation quota and 250 kg ha−1 nitrogen application; W3N0 indicates 100% of the local typical irrigation quota and 0 kg ha−1 nitrogen application; W3N1 indicates 100% of the local typical irrigation quota and 150 kg ha−1 nitrogen application; W3N2 indicates 100% of the local typical irrigation quota and 200 kg ha−1 nitrogen application; W3N3 indicates 100% of the local typical irrigation quota and 250 kg ha−1 nitrogen application.
Table 3. Effects of different irrigation amounts and nitrogen application rates on I. tinctoria biological characteristic indicators (mean ± standard error). Different lowercase letters within columns indicate significant differences among treatments at p < 0.05.
YearTreatment Plant Height
(cm)
Leaf Area
Index
Dry Matter Accumulation In Stem and Leaf
(g)
Taproot Length
(cm)
Taproot Diameter
(mm)
Dry Matter Accumulation In Root
(g)
Root−Crown Ratio
2021W1N019.39 ± 0.37 f0.72 ± 0.012 g6.84 ± 0.22 g15.12 ± 0.61 g8.73 ± 0.04 e5.49 ± 0.07 g0.80 ± 0.017 d
W1N122.34 ± 0.66 de0.94 ± 0.015 f8.12 ± 0.31 f17.83 ± 0.30 ef10.64 ± 0.14 d6.46 ± 0.15 f0.80 ± 0.029 d
W1N224.28 ± 0.30 cd1.07 ± 0.040 e9.85 ± 0.29 e18.54 ± 0.38 e12.81 ± 0.32 c8.51 ± 0.35 e0.86 ± 0.022 d
W1N326.06 ± 1.00 bc1.16 ± 0.045 de10.76 ± 0.19 cd18.87 ± 0.37 e14.77 ± 0.42 b9.08 ± 0.16 e0.84 ± 0.036 d
W2N021.65 ± 0.86 ef1.13 ± 0.015 e8.05 ± 0.24 f16.71 ± 0.42 f12.96 ± 0.48 c8.84 ± 0.34 e1.10 ± 0.023 ab
W2N125.72 ± 0.97 bc1.37 ± 0.036 c9.94 ± 0.40 de19.20 ± 0.43 de14.46 ± 0.41 b10.47 ± 0.28 d1.05 ± 0.031 bc
W2N228.08 ± 1.13 ab1.51 ± 0.029 b11.93 ± 0.29 b19.44 ± 0.75 de15.93 ± 0.30 a11.73 ± 0.12 c0.98 ± 0.042 c
W2N329.18 ± 0.63 a1.56 ± 0.045 b12.66 ± 0.47 ab20.65 ± 0.44 cd16.25 ± 0.49 a12.31 ± 0.18 bc0.97 ± 0.037 c
W3N024.91 ± 1.09 cd1.25 ± 0.031 d9.18 ± 0.26 e18.23 ± 0.62 ef13.70 ± 0.51 bc10.22 ± 0.33 d1.11 ± 0.025 ab
W3N127.66 ± 0.86 ab1.48 ± 0.036 b10.83 ± 0.25 c21.86 ± 0.66 bc16.01 ± 0.53 a12.50 ± 0.24 b1.15 ± 0.031 a
W3N230.08 ± 0.74 a1.69 ± 0.032 a12.95 ± 0.23 a23.69 ± 0.81 a17.13 ± 0.34 a13.98 ± 0.20 a1.08 ± 0.055 ab
W3N330.16 ± 1.05 a1.72 ± 0.061 a13.26 ± 0.15 a23.01 ± 0.22 ab16.96 ± 0.34 a13.66 ± 0.29 a1.03 ± 0.038 bc
2022W1N018.49 ± 0.25 f0.77 ± 0.016 h7.11 ± 0.29 g14.58 ± 0.23 g8.91 ± 0.20 f5.73 ± 0.15 h0.81 ± 0.029 de
W1N120.87 ± 0.45 e1.02 ± 0.035 g9.73 ± 0.26 ef16.91 ± 0.42 f11.09 ± 0.23 e7.18 ± 0.25 g0.74 ± 0.026 e
W1N223.28 ± 0.55 cd1.13 ± 0.029 ef11.01 ± 0.34 cd18.36 ± 0.34 e13.00 ± 0.45 d9.02 ± 0.34 f0.82 ± 0.020 d
W1N325.89 ± 0.91 b1.20 ± 0.020 e11.42 ± 0.40 c19.05 ± 0.74 de13.94 ± 0.29 d9.75 ± 0.10 e0.85 ± 0.010 d
W2N022.15 ± 0.43 de1.19 ± 0.044 e8.60 ± 0.17 f17.02 ± 0.39 f13.25 ± 0.36 d8.59 ± 0.25 f1.00 ± 0.033 ab
W2N124.96 ± 0.83 bc1.43 ± 0.053 cd10.36 ± 0.29 cde19.96 ± 0.47 cd14.18 ± 0.12 cd10.91 ± 0.18 d1.05 ± 0.017 a
W2N226.43 ± 0.87 b1.55 ± 0.041 bc12.95 ± 0.43 b20.57 ± 0.21 bc15.64 ± 0.55 ab12.56 ± 0.25 bc0.97 ± 0.038 b
W2N327.16 ± 0.93 b1.60 ± 0.049 b13.80 ± 0.55 b21.83 ± 0.13 a15.86 ± 0.38 ab13.23 ± 0.33 b0.96 ± 0.025 bc
W3N023.52 ± 0.95 cd1.34 ± 0.025 d9.93 ± 0.32 de18.78 ± 0.38 de14.11 ± 0.44 cd10.63 ± 0.29 d1.07 ± 0.020 a
W3N125.88 ± 0.08 b1.53 ± 0.036 bc12.71 ± 0.48 b21.25 ± 0.60 ab15.29 ± 0.43 bc12.08 ± 0.14 c0.95 ± 0.051 bc
W3N229.24 ± 0.93 a1.75 ± 0.074 a15.36 ± 0.64 a22.36 ± 0.35 a16.85 ± 0.36 a14.33 ± 0.29 a0.93 ± 0.022 bc
W3N329.95 ± 0.58 a1.79 ± 0.051 a15.88 ± 0.56 a21.94 ± 0.26 a16.77 ± 0.63 a14.02 ± 0.37 a0.88 ± 0.043 cd
2023W1N017.42 ± 0.22 f0.68 ± 0.023 h6.95 ± 0.14 h13.95 ± 0.43 f8.63 ± 0.06 g6.11 ± 0.16 h0.88 ± 0.012 de
W1N119.53 ± 0.43 e0.99 ± 0.026 g9.27 ± 0.18 f16.11 ± 0.24 e10.85 ± 0.25 f7.48 ± 0.29 g0.81 ± 0.035 e
W1N222.26 ± 0.60 cd1.04 ± 0.050 fg10.74 ± 0.41 e17.85 ± 0.71 de12.76 ± 0.38 e9.29 ± 0.31 ef0.86 ± 0.032 de
W1N324.19 ± 0.31 bc1.15 ± 0.046 ef11.35 ± 0.13 e18.83 ± 0.23 cd13.71 ± 0.48 de10.08 ± 0.20 de0.89 ± 0.025 cde
W2N021.08 ± 0.64 de1.17 ± 0.017 e8.08 ± 0.17 g17.39 ± 0.70 de12.99 ± 0.36 de8.53 ± 0.29 fg1.06 ± 0.046 ab
W2N123.74 ± 0.93 bc1.31 ± 0.021 cd9.94 ± 0.22 f20.08 ± 0.36 bc14.04 ± 0.41 cd11.07 ± 0.38 cd1.11 ± 0.026 a
W2N225.82 ± 0.87 b1.49 ± 0.039 c12.17 ± 0.13 d21.14 ± 0.85 ab15.17 ± 0.31 b12.94 ± 0.28 bc1.06 ± 0.035 ab
W2N326.03 ± 0.64 b1.63 ± 0.046 b14.15 ± 0.37 c22.08 ± 0.56 ab16.02 ± 0.40 ab13.55 ± 0.42 b0.96 ± 0.052 cd
W3N022.10 ± 0.81 cd1.26 ± 0.035 de9.36 ± 0.33 f18.26 ± 0.71 cd13.89 ± 0.46 d10.39 ± 0.55 de1.11 ± 0.044 a
W3N124.38 ± 0.67 bc1.40 ± 0.061 cd12.28 ± 0.30 d20.93 ± 0.75 ab15.00 ± 0.08 bc12.13 ± 0.43 bc0.99 ± 0.031 bc
W3N228.55 ± 0.98 a1.71 ± 0.057 ab15.14 ± 0.25 b21.74 ± 0.64 ab16.58 ± 0.26 a14.08 ± 0.64 ab0.93 ± 0.035 cd
W3N329.17 ± 1.23 a1.82 ± 0.054 a16.26 ± 0.10 a22.75 ± 0.86 a16.93 ± 0.51 a14.76 ± 0.47 a0.91 ± 0.029 cde
AverageW1N018.43 ± 0.27 i0.72 ± 0.007 h6.97 ± 0.19 i14.55 ± 0.28 g8.76 ± 0.10 g5.78 ± 0.15 h0.83 ± 0.018 d
W1N120.91 ± 0.48 gh0.98 ± 0.022 g9.04 ± 0.22 g16.95 ± 0.34 f10.86 ± 0.21 f7.04 ± 0.19 g0.78 ± 0.035 d
W1N223.27 ± 0.36 fg1.08 ± 0.032 fg10.53 ± 0.28 de18.25 ± 0.47 ef12.86 ± 0.53 e8.94 ± 0.22 ef0.85 ± 0.023 d
W1N325.38 ± 0.67 de1.17 ± 0.041 f11.18 ± 0.43 cd18.92 ± 0.52 de14.14 ± 0.35 c9.64 ± 0.13 e0.86 ± 0.025 d
W2N021.63 ± 0.57 gh1.16 ± 0.027 f8.24 ± 0.15 h17.04 ± 0.41 f13.07 ± 0.62 de8.65 ± 0.26 f1.05 ± 0.028 a
W2N124.81 ± 0.80 def1.37 ± 0.035 de10.08 ± 0.25 ef19.75 ± 0.60 cd14.23 ± 0.58 c10.82 ± 0.18 d1.07 ± 0.047 a
W2N226.78 ± 0.92 cd1.52 ± 0.030 bc12.35 ± 0.18 b20.38 ± 0.53 bc15.58 ± 0.42 b12.41 ± 0.30 bc1.00 ± 0.029 ab
W2N327.46 ± 0.58 bc1.60 ± 0.044 b13.54 ± 0.39 b21.52 ± 0.36 ab16.04 ± 0.39 ab13.03 ± 0.56 b0.96 ± 0.030 bc
W3N023.51 ± 0.73 efg1.28 ± 0.025 e9.49 ± 0.28 fg18.42 ± 0.74 de13.90 ± 0.33 cd10.41 ± 0.34 d1.10 ± 0.053 a
W3N125.97 ± 0.47 cd1.47 ± 0.038 cd11.94 ± 0.35 cd21.35 ± 0.65 ab15.43 ± 0.28 b12.24 ± 0.41 c1.03 ± 0.031 ab
W3N229.29 ± 0.83 ab1.72 ± 0.049 a14.48 ± 0.51 a22.60 ± 0.49 a16.85 ± 0.57 a14.13 ± 0.37 a0.98 ± 0.028 bc
W3N329.76 ± 0.69 a1.78 ± 0.057 a15.13 ± 0.46 a22.57 ± 0.34 a16.89 ± 0.45 a14.15 ± 0.44 a0.94 ± 0.043 c
ANOVA
Year (Y)*ns ns nsns ns ***
Irrigation (W)****** *** *** *** ******
Nitrogen (N)*ns ns*nsns***
Y × Wnsnsnsnsnsns**
Y × Nnsnsnsnsnsnsns
W × Nnsnsnsnsnsnsns
Y × W × Nnsnsnsnsnsnsns
Note: Different lowercase letters in the same column indicate significant differences among different treatments (p < 0.05). The *, ** and *** indicate significant differences among different treatments at the levels of p < 0.05, p < 0.01 and p < 0.001, respectively. The ns means not significant at the level of p ≥ 0.05.
Table 4. Effects of different irrigation amounts and nitrogen application rates on quality of I. tinctoria (mean ± standard error). Different lowercase letters within columns indicate significant differences among treatments at p < 0.05.
YearTreatmentIndigo
(mg kg−1)
Indirubin
(mg kg−1)
(R,S)–Goitrin
(mg g−1)
Total Nucleoside
(%)
Uridine
(%)
Adenosine
(%)
2021W1N05.78 ± 0.24 c8.04 ± 0.18 b0.206 ± 0.008 f0.1580 ± 0.0075 c0.0436 ± 0.0019 f0.0203 ± 0.0009 i
W1N15.84 ± 0.17 c8.48 ± 0.26 ab0.218 ± 0.013 ef0.1663 ± 0.0062 abc0.0457 ± 0.0023 ef0.0318 ± 0.0015 h
W1N25.93 ± 0.15 c8.83 ± 0.26 ab0.244 ± 0.010 cd0.1712 ± 0.0083 abc0.0484 ± 0.0030 ef0.0442 ± 0.0027 de
W1N36.11 ± 0.23 c8.92 ± 0.21 ab0.253 ± 0.015 bc0.1774 ± 0.0091 abc0.0508 ± 0.0017 cde0.0491 ± 0.0023 c
W2N06.10 ± 0.07 c8.76 ± 0.11 ab0.230 ± 0.009 de0.1670 ± 0.0055 abc0.0502 ± 0.0026 de0.0403 ± 0.0019 f
W2N16.36 ± 0.19 bc9.19 ± 0.10 a0.257 ± 0.011 abc0.1801 ± 0.0102 abc0.0539 ± 0.0021 bcd0.0474 ± 0.0024 cd
W2N26.83 ± 0.24 ab9.27 ± 0.28 a0.266 ± 0.014 ab0.1894 ± 0.0096 a0.0581 ± 0.0033 ab0.0512 ± 0.0030 bc
W2N36.97 ± 0.05 a9.35 ± 0.20 a0.271 ± 0.013 a0.1902 ± 0.0081 a0.0597 ± 0.0024 a0.0545 ± 0.0018 a
W3N05.97 ± 0.17 c8.69 ± 0.40 ab0.220 ± 0.011 ef0.1629 ± 0.0072 bc0.0482 ± 0.00300.0367 ± 0.0026 g
W3N16.02 ± 0.21 c8.85 ± 0.38 ab0.228 ± 0.008 de0.1758 ± 0.0100 abc0.0514 ± 0.0026 cde0.0435 ± 0.0024 ef
W3N26.25 ± 0.14 bc9.03 ± 0.34 a0.249 ± 0.012 bc0.1829 ± 0.0094 ab0.0530 ± 0.0028 bcd0.0480 ± 0.0021 cd
W3N36.36 ± 0.24 bc9.11 ± 0.36 a0.262 ± 0.013 ab0.1873 ± 0.0068 ab0.0557 ± 0.0022 abc0.0526 ± 0.0026 ab
2022W1N05.49 ± 0.14 d7.96 ± 0.17 c0.213 ± 0.008 g0.1493 ± 0.0068 f0.0440 ± 0.0018 f0.0286 ± 0.0012 g
W1N15.62 ± 0.20 d8.27 ± 0.15 bc0.227 ± 0.011 f0.1629 ± 0.0084 e0.0468 ± 0.0021 ef0.0372 ± 0.0019 f
W1N25.78 ± 0.04 cd8.64 ± 0.22 abc0.249 ± 0.014 cd0.1736 ± 0.0092 cd0.0497 ± 0.0026 de0.0451 ± 0.0025 cd
W1N36.04 ± 0.024 bcd9.01 ± 0.25 ab0.260 ± 0.010 bc0.1800 ± 0.0079 bc0.0521 ± 0.0023 c0.0486 ± 0.0020 bc
W2N06.23 ± 0.026 bc8.85 ± 0.14 ab0.241 ± 0.009 de0.1724 ± 0.0083 d0.0516 ± 0.0028 cd0.0411 ± 0.0017 e
W2N16.41 ± 0.07 ab9.20 ± 0.36 a0.260 ± 0.012 bc0.1850 ± 0.0095 b0.0541 ± 0.0027 b0.0459 ± 0.0024 c
W2N26.77 ± 0.10 a9.32 ± 0.32 a0.279 ± 0.014 a0.1912 ± 0.0102 a0.0572 ± 0.0031 a0.0507 ± 0.0028 ab
W2N36.86 ± 0.08 a9.41 ± 0.24 a0.286 ± 0.013 a0.1973 ± 0.0099 a0.0583 ± 0.0029 a0.0538 ± 0.0022 a
W3N05.75 ± 0.20 cd8.62 ± 0.36 abc0.226 ± 0.008 f0.1655 ± 0.0083 e0.0477 ± 0.0024 e0.0383 ± 0.0016 f
W3N15.94 ± 0.09 bcd8.91 ± 0.24 ab0.231 ± 0.010 ef0.1729 ± 0.0067 cd0.0508 ± 0.0015 cd0.0421 ± 0.0024 de
W3N26.21 ± 0.25 bc9.07 ± 0.18 ab0.252 ± 0.013 cd0.1834 ± 0.0082 b0.0535 ± 0.0026 bc0.0469 ± 0.0020 c
W3N36.40 ± 0.17 ab9.23 ± 0.33 a0.273 ± 0.016 ab0.1885 ± 0.0112 ab0.0560 ± 0.0028 ab0.0510 ± 0.0018 a
2023W1N05.52 ± 0.16 e7.79 ± 0.26 d0.209 ± 0.008 g0.1526 ± 0.0069 f0.0433 ± 0.0019 f0.0246 ± 0.0009 h
W1N15.69 ± 0.04 e8.11 ± 0.24 cd0.218 ± 0.011 fg0.1631 ± 0.0077 e0.0463 ± 0.0023 e0.0335 ± 0.0017 g
W1N25.85 ± 0.15 de8.82 ± 0.19 abc0.242 ± 0.014 e0.1741 ± 0.0085 c0.0486 ± 0.0027 de0.0433 ± 0.0024 de
W1N36.14 ± 0.13 cd9.13 ± 0.26 ab0.258 ± 0.010 de0.1820 ± 0.0093 b0.0511 ± 0.0026 cd0.0468 ± 0.0029 cd
W2N06.17 ± 0.03 cd9.10 ± 0.17 ab0.248 ± 0.013 e0.1730 ± 0.0081 cd0.0514 ± 0.0026 c0.0418 ± 0.0023 e
W2N16.45 ± 0.20 abc9.31 ± 0.25 ab0.263 ± 0.012 cd0.1829 ± 0.0095 b0.0545 ± 0.0030 b0.0453 ± 0.0021 cd
W2N26.68 ± 0.11 ab9.49 ± 0.18 ab0.275 ± 0.014 bc0.1933 ± 0.0108 ab0.0569 ± 0.0028 ab0.0500 ± 0.0028 ab
W2N36.79 ± 0.12 a9.56 ± 0.22 a0.291 ± 0.015 a0.1951 ± 0.0088 a0.0585 ± 0.0032 a0.0529 ± 0.0025 a
W3N05.86 ± 0.09 de8.70 ± 0.31 bc0.229 ± 0.011 f0.1693 ± 0.0082 d0.0473 ± 0.0024 de0.0379 ± 0.0019 f
W3N16.09 ± 0.08 cd8.86 ± 0.29 ab0.242 ± 0.012 e0.1734 ± 0.0078 c0.0499 ± 0.0029 d0.0442 ± 0.0024 cd
W3N26.18 ± 0.17 cd8.95 ± 0.20 ab0.266 ± 0.013 c0.1818 ± 0.0090 b0.0527 ± 0.0026 bc0.0474 ± 0.0020 bc
W3N36.33 ± 0.09 bc9.30 ± 0.33 ab0.280 ± 0.017 ab0.1891 ± 0.0094 b0.0552 ± 0.0028 ab0.0513 ± 0.0026 a
AverageW1N05.60 ± 0.17 f7.93 ± 0.23 d0.209 ± 0.008 e0.1533 ± 0.0069 d0.0436 ± 0.0015 f0.0245 ± 0.0011 h
W1N15.72 ± 0.09 ef8.29 ± 0.19 cd0.221 ± 0.013 d0.1641 ± 0.0091 b0.0463 ± 0.0020 e0.0342 ± 0.0019 g
W1N25.85 ± 0.11 de8.76 ± 0.20 abc0.245 ± 0.016 c0.1730 ± 0.0075 b0.0489 ± 0.0024 de0.0442 ± 0.0024 d
W1N36.10 ± 0.15 cd9.02 ± 0.17 abc0.257 ± 0.010 bc0.1798 ± 0.0084 ab0.0513 ± 0.0025 c0.0482 ± 0.0025 bc
W2N06.17 ± 0.10 cd8.90 ± 0.14 abc0.240 ± 0.012 cd0.1708 ± 0.0092 bc0.0511 ± 0.0019 c0.0411 ± 0.0018 e
W2N16.41 ± 0.14 bc9.23 ± 0.24 ab0.260 ± 0.017 bc0.1827 ± 0.0067 a0.0542 ± 0.0027 ab0.0462 ± 0.0023 cd
W2N26.76 ± 0.16 ab9.36 ± 0.27 ab0.273 ± 0.014 ab0.1913 ± 0.0099 a0.0574 ± 0.0033 a0.0506 ± 0.0027 ab
W2N36.87 ± 0.07 a9.44 ± 0.34 a0.283 ± 0.014 a0.1942 ± 0.0086 a0.0588 ± 0.0029 a0.0537 ± 0.0019 a
W3N05.86 ± 0.15 de8.67 ± 0.25 bc0.225 ± 0.011 d0.1659 ± 0.0072 b0.0477 ± 0.00230.0376 ± 0.0020 f
W3N16.02 ± 0.13 cde8.87 ± 0.29 abc0.234 ± 0.015 cd0.1740 ± 0.0061 b0.0507 ± 0.0026 cd0.0433 ± 0.0024 d
W3N26.21 ± 0.14 cd9.02 ± 0.22 abc0.256 ± 0.013 bc0.1827 ± 0.0087 a0.0531 ± 0.0015 bc0.0474 ± 0.0028 bc
W3N36.36 ± 0.20 bc9.21 ± 0.33 ab0.272 ± 0.016 ab0.1883 ± 0.0103 a0.0556 ± 0.0030 ab0.0516 ± 0.0031 ab
ANOVA
Year (Y)ns ns ns ns ns ns
Irrigation (W)*** *** *** *** *** ***
Nitrogen (N)*** *** ** ** nsns
Y × Wnsnsnsnsnsns
Y × Nnsnsnsnsnsns
W × Nnsnsnsnsnsns
Y × W × Nnsnsnsnsnsns
Note: Different lowercase letters in the same column indicate significant differences among different treatments (p < 0.05). The ** and *** indicate significant differences among different treatments at the levels of p < 0.01 and p < 0.001, respectively. The ns means not significant at the level of p ≥ 0.05.
Table 5. Effects of different irrigation amounts and nitrogen application rates on I. tinctoria yield and water–nitrogen productivity (mean ± standard error). Different lowercase letters within columns indicate significant differences among treatments at p < 0.05.
YearTreatmentYield
(mg km−2)
Water Consumption
(mm)
Water Productivity
(kg m−3)
Irrigation Water Productivity
(kg m−3)
Nitrogen Partial Productivity
(kg kg−1)
Nitrogen Agronomy Use Efficiency
(kg kg−1)
2021W1N04347.32 ± 154.73 h377.26 ± 1.72 d1.15 ± 0.039 e3.58 ± 0.127 fg
W1N14658.46 ± 167.75 gh385.35 ± 11.46 cd1.21 ± 0.010 e3.83 ± 0.140 ef31.06 ± 1.12 e2.07 ± 0.36 e
W1N25720.64 ± 143.19 e415.29 ± 5.97 bc1.38 ± 0.043 d4.71 ± 0.117 c28.60 ± 0.72 e6.87 ± 1.01 c
W1N35061.92 ± 126.07 fg447.64 ± 15.30 ab1.13 ± 0.055 e4.17 ± 0.104 de20.25 ± 0.51 f2.86 ± 0.83 de
W2N05570.41 ± 256.75 ef374.7 ± 16.30 d1.49 ± 0.049 cd3.78 ± 0.038 f
W2N16414.40 ± 190.05 d395.31 ± 15.75 cd1.62 ± 0.058 c4.35 ± 0.061 d42.76 ± 0.60 bc5.63 ± 0.22 cd
W2N28176.20 ± 292.58 b430.25 ± 14.13 ab1.90 ± 0.047 b5.54 ± 0.198 ab40.88 ± 1.46 c13.03 ± 1.30 b
W2N38569.29 ± 168.13 ab456.58 ± 7.31 a1.88 ± 0.029 b5.81 ± 0.047 a34.28 ± 0.27 d12.00 ± 0.18 b
W3N05778.43 ± 279.54 e384.71 ± 6.00 cd1.50 ± 0.030 cd3.33 ± 0.045 g
W3N17320.22 ± 245.69 c390.9 ± 6.98 cd1.87 ± 0.067 b4.22 ± 0.142 d48.80 ± 1.64 a10.28 ± 1.47 b
W3N29054.68 ± 335.88 a431.67 ± 13.29 ab2.10 ± 0.043 a5.22 ± 0.193 b45.27 ± 1.68 b16.38 ± 1.57 a
W3N37341.35 ± 163.83 c460.41 ± 7.67 a1.59 ± 0.026 c4.23 ± 0.093 d29.37 ± 0.65 e6.25 ± 0.37 c
2022W1N04185.91 ± 66.61 g355.63 ± 14.88 cd1.18 ± 0.030 g3.67 ± 0.056 ef
W1N14560.98 ± 134.07 fg363.84 ± 11.65 cd1.25 ± 0.003 g4.00 ± 0.117 de30.41 ± 0.90 de2.50 ± 0.45 e
W1N25613.88 ± 175.52 de390.8 ± 5.62 bc1.44 ± 0.045 f4.92 ± 0.152 b28.07 ± 0.88 e7.14 ± 0.54 c
W1N34809.89 ± 148.89 f421.96 ± 11.07 ab1.14 ± 0.038 g4.22 ± 0.132 cd19.24 ± 0.59 f2.50 ± 0.51 e
W2N05322.75 ± 184.46 e350.41 ± 12.91 d1.52 ± 0.032 ef3.84 ± 0.062 de
W2N16070.93 ± 286.98 d371.44 ± 9.90 cd1.63 ± 0.023 cde4.38 ± 0.098 c40.47 ± 0.58 b4.99 ± 0.61 d
W2N27206.97 ± 271.15 b408.33 ± 10.36 ab1.77 ± 0.079 bc5.20 ± 0.194 b36.03 ± 1.36 c9.42 ± 0.96 b
W2N37978.58 ± 236.80 a434.8 ± 8.48 a1.84 ± 0.019 b5.76 ± 0.170 a31.91 ± 0.95 d10.62 ± 0.93 b
W3N05528.80 ± 172.24 e358.09 ± 6.71 cd1.54 ± 0.037 def3.39 ± 0.109 f
W3N16634.87 ± 133.16 c364.47 ± 13.96 cd1.82 ± 0.083 b4.07 ± 0.081 cd44.23 ± 0.89 a7.37 ± 0.77 c
W3N28066.79 ± 182.53 a406.72 ± 13.21 ab1.98 ± 0.022 a4.95 ± 0.113 b40.33 ± 0.92 b12.69 ± 0.09 a
W3N37206.98 ± 177.14 b436.25 ± 12.75 a1.65 ± 0.034 cd4.42 ± 0.137 c28.83 ± 0.71 e6.71 ± 0.02 cd
2023W1N03784.23 ± 108.16 g317.63 ± 12.70 e1.19 ± 0.053 f2.49 ± 0.072 e
W1N14397.14 ± 151.72 f325.83 ± 8.99 e1.35 ± 0.025 e2.90 ± 0.098 d29.31 ± 1.01 de4.09 ± 0.73 e
W1N25340.50 ± 161.30 e357.5 ± 6.49 cd1.49 ± 0.049 d3.52 ± 0.108 c26.70 ± 0.80 e7.78 ± 0.82 cd
W1N35127.17 ± 178.12 e391.83 ± 9.81 ab1.31 ± 0.025 e3.38 ± 0.117 c20.51 ± 0.71 f5.37 ± 0.37 de
W2N04753.07 ± 44.63 ef322.39 ± 5.73 e1.47 ± 0.032 d2.58 ± 0.125 e
W2N15958.07 ± 141.65 d342.84 ± 2.52 de1.74 ± 0.019 c3.23 ± 0.122 c39.72 ± 0.28 c8.03 ± 0.02 cd
W2N27432.37 ± 232.40 c375.78 ± 13.19 bc1.98 ± 0.031 b4.04 ± 0.138 b37.16 ± 1.16 c13.40 ± 1.18 b
W2N38159.68 ± 221.21 b400.45 ± 5.59 ab2.04 ± 0.042 b4.43 ± 0.142 a32.64 ± 0.88 d13.63 ± 0.77 b
W3N05137.90 ± 150.91 e339.57 ± 11.70 de1.51 ± 0.033 d2.37 ± 0.169 e
W3N17226.68 ± 317.34 c345.28 ± 4.83 de2.09 ± 0.067 b3.33 ± 0.147 c48.18 ± 2.12 a13.93 ± 1.79 b
W3N28806.15 ± 205.83 a384.66 ± 8.12 b2.29 ± 0.016 a4.06 ± 0.093 b44.03 ± 1.03 b18.34 ± 0.66 a
W3N37442.72 ± 277.98 c412.73 ± 5.01 a1.80 ± 0.049 c3.43 ± 0.127 c29.77 ± 1.11 de9.22 ± 0.63 c
AverageW1N04105.82 ± 194.34 g350.17 ± 9.49 e1.17 ± 0.019 g3.25 ± 0.075 fg
W1N14538.86 ± 145.76 g358.34 ± 10.66 e1.27 ± 0.014 f3.58 ± 0.116 e30.26 ± 0.97 e2.89 ± 0.46 e
W1N25558.34 ± 114.67 e387.86 ± 4.80 cd1.44 ± 0.020 e4.38 ± 0.085 c27.79 ± 0.57 e7.26 ± 0.11 d
W1N34999.66 ± 141.23 f420.48 ± 10.53 ab1.19 ± 0.038 g3.92 ± 0.108 d20.00 ± 0.63 f3.58 ± 0.49 e
W2N05215.41 ± 350.49 ef349.17 ± 11.03 e1.49 ± 0.032 de3.40 ± 0.036 ef
W2N16147.80 ± 270.23 d369.86 ± 9.27 de1.66 ± 0.025 c3.99 ± 0.049 d40.99 ± 0.49 b6.22 ± 0.23 d
W2N27605.18 ± 195.78 b404.79 ± 10.74 bc1.88 ± 0.017 b4.93 ± 0.128 b38.03 ± 0.98 c11.95 ± 0.73 b
W2N38235.85 ± 166.35 a430.61 ± 6.01 ab1.92 ± 0.023 b5.33 ± 0.107 a32.94 ± 0.67 d12.08 ± 0.50 b
W3N05481.71 ± 129.76 e360.79 ± 9.04 de1.52 ± 0.013 d3.03 ± 0.073 g
W3N17060.59 ± 165.93 c366.88 ± 8.47 de1.93 ± 0.032 b3.87 ± 0.090 d47.07 ± 1.11 a10.53 ± 0.24 c
W3N28642.54 ± 210.21 a407.68 ± 11.13 bc2.12 ± 0.029 a4.74 ± 0.119 b43.21 ± 1.05 b15.80 ± 0.42 a
W3N37330.35 ± 202.35 bc436.46 ± 7.32 a1.68 ± 0.018 c4.03 ± 0.134 d29.32 ± 0.81 e7.39 ± 0.31 d
ANOVA
Year (Y)ns*** * ***ns**
Irrigation (W)***ns ***********
Nitrogen (N)nsnsnsnsnsns
Y×Wnsnsnsnsnsns
Y×Nnsnsnsnsnsns
W×Nnsnsnsnsnsns
Y×W×Nnsnsnsnsnsns
Note: Different lowercase letters in the same column indicate significant differences among different treatments (p < 0.05). The *, **, and *** indicate significant differences among different treatments at the levels of p < 0.05, p < 0.01, and p < 0.001, respectively. The ns means not significant at the level of p ≥ 0.05.
Table 6. Effects of different irrigation amounts and nitrogen application rates on the input cost (CNY hm−2).
YearTreatmentIrrigation
Water Cost
Fertilizer CostSeed CostLabor CostMechanical CostOther CostTotal Input
2021W1N0316 1692 1125240031509009583
W1N1316 1908 1125240031509009799
W1N2316 1980 1125240031509009871
W1N3316 2052 1125240031509009943
W2N0384 1692 1125240031509009651
W2N1384 1908 1125240031509009867
W2N2384 1980 1125240031509009939
W2N3384 2052 11252400315090010,011
W3N0451 1692 1125240031509009718
W3N1451 1908 1125240031509009934
W3N2451 1980 11252400315090010,006
W3N3451 2052 11252400315090010,078
2022W1N0296 1750 13502850360067510,521
W1N1296 2065 13502850360067510,836
W1N2296 2170 13502850360067510,941
W1N3296 2275 13502850360067511,046
W2N0360 1750 13502850360067510,585
W2N1360 2065 13502850360067510,900
W2N2360 2170 13502850360067511,005
W2N3360 2275 13502850360067511,110
W3N0424 1750 13502850360067510,649
W3N1424 2065 13502850360067510,964
W3N2424 2170 13502850360067511,069
W3N3424 2275 13502850360067511,174
2023W1N0394 1730 1200225032257809579
W1N1394 2090 1200225032257809939
W1N2394 2210 12002250322578010,059
W1N3394 2330 12002250322578010,179
W2N0479 1730 1200225032257809664
W2N1479 2090 12002250322578010,024
W2N2479 2210 12002250322578010,144
W2N3479 2330 12002250322578010,264
W3N0563 1730 1200225032257809748
W3N1563 2090 12002250322578010,108
W3N2563 2210 12002250322578010,228
W3N3563 2330 12002250322578010,348
Table 7. Effects of different irrigation amounts and nitrogen application rates on the economic benefit (mean ± standard error). Different lowercase letters within columns indicate significant differences among treatments at p < 0.05.
YearTreatmentEconomic Benefit (CNY hm−2)Net Proceeds
(CNY hm−2)
Output–Input Ratio
2021W1N054,776.23 ± 1949.60 h45,193.28 ± 1949.64 g5.72 ± 0.20 f
W1N158,696.60 ± 2113.65 gh48,897.64 ± 2113.69 fg5.99 ± 0.22 f
W1N272,080.06 ± 1804.19 e62,209.11 ± 1804.17 e7.30 ± 0.18 e
W1N363,780.19 ± 1588.48 fg53,837.24 ± 1588.51 f6.41 ± 0.16 f
W2N070,187.17 ± 3235.05 ef60,536.51 ± 3235.16 e7.27 ± 0.07 e
W2N180,821.44 ± 2394.63 d70,954.78 ± 2394.70 d8.19 ± 0.12 d
W2N2103,020.12 ± 3686.51 b93,081.46 ± 3686.49 b10.37 ± 0.37 b
W2N3107,973.05 ± 2118.44 ab97,962.40 ± 2118.37 ab10.79 ± 0.08 ab
W3N072,808.22 ± 3522.20 e63,089.86 ± 3522.28 e7.49 ± 0.10 e
W3N192,234.77 ± 3095.69 c82,300.41 ± 3095.65 c9.28 ± 0.31 c
W3N2114,088.97 ± 4232.09 a104,082.61 ± 4232.10 a11.40 ± 0.42 a
W3N392,501.01 ± 2064.26 c82,422.65 ± 2064.30 c9.18 ± 0.21 c
2022W1N042,696.28 ± 679.42 g32,174.80 ± 679.45 g4.06 ± 0.06 f
W1N146,522.00 ± 1367.51 fg35,685.52 ± 1367.55 fg4.29 ± 0.13 f
W1N257,261.58 ± 1790.30 de46,320.10 ± 1790.31 de5.23 ± 0.16 de
W1N349,060.88 ± 1518.68 f38,014.40 ± 1518.65 f4.44 ± 0.14 f
W2N054,292.05 ± 1881.49 e43,707.04 ± 1881.48 e5.13 ± 0.08 e
W2N161,923.49 ± 2927.20 d51,023.48 ± 2927.24 d5.68 ± 0.08 d
W2N273,511.09 ± 2765.73 b62,506.09 ± 2765.77 b6.68 ± 0.25 b
W2N381,381.52 ± 2415.36 a70,271.51 ± 2415.39 a7.33 ± 0.22 a
W3N056,393.76 ± 1756.85 e45,745.22 ± 1756.82 e5.30 ± 0.17 de
W3N167,675.67 ± 1358.23 c56,712.13 ± 1358.22 c6.17 ± 0.12 c
W3N282,281.26 ± 1861.81 a71,212.72 ± 1861.84 a7.43 ± 0.17 a
W3N373,511.20 ± 1806.83 b62,337.66 ± 1806.83 b6.58 ± 0.16 bc
2023W1N031,030.69 ± 886.91 g21,451.29 ± 886.93 g3.24 ± 0.09 g
W1N136,056.55 ± 1244.10 f26,117.15 ± 1244.09 f3.63 ± 0.12 fg
W1N243,792.10 ± 1322.66 e33,732.71 ± 1322.65 e4.35 ± 0.13 e
W1N342,042.79 ± 1460.58 e31,863.40 ± 1460.55 e4.13 ± 0.15 e
W2N038,975.17 ± 365.97 ef29,311.27 ± 365.94 ef4.03 ± 0.04 ef
W2N148,856.17 ± 1161.53 d38,832.27 ± 1161.56 d4.87 ± 0.03 d
W2N260,945.43 ± 1905.68 c50,801.53 ± 1905.65 c6.01 ± 0.19 c
W2N366,909.38 ± 1813.92 b56,645.47 ± 1813.96 b6.52 ± 0.18 b
W3N042,130.78 ± 1237.46 e32,382.36 ± 1237.49 e4.32 ± 0.13 e
W3N159,258.78 ± 2602.19 c49,150.36 ± 2602.21 c5.86 ± 0.26 c
W3N272,210.43 ± 1687.81 a61,982.01 ± 1687.77 a7.06 ± 0.17 a
W3N361,030.30 ± 2279.44 c50,681.88 ± 2279.41 c5.90 ± 0.22 c
AverageW1N042,834.40 ± 1033.55 g32,939.79 ± 1033.55 g4.34 ± 0.11 g
W1N147,091.71 ± 1525.49 g36,900.11 ± 1525.49 g4.64 ± 0.15 fg
W1N257,711.25 ± 1109.31 e47,420.64 ± 1109.31 e5.63 ± 0.11 e
W1N351,627.95 ± 1419.59 f41,238.35 ± 1419.59 f5.00 ± 0.14 f
W2N054,484.80 ± 541.97 ef44,518.27 ± 541.98 ef5.48 ± 0.05 e
W2N163,867.03 ± 762.10 d53,603.51 ± 762.11 d6.25 ± 0.07 d
W2N279,158.88 ± 2029.49 b68,796.36 ± 2029.49 b7.68 ± 0.19 b
W2N385,421.32 ± 1612.02 a74,959.79 ± 1612.02 a8.21 ± 0.15 a
W3N057,110.92 ± 1279.06 e47,072.48 ± 1279.06 e5.70 ± 0.13 e
W3N173,056.41 ± 1737.77 c62,720.97 ± 1737.77 c7.11 ± 0.17 c
W3N289,526.89 ± 2290.67 a79,092.45 ± 2290.67 a8.63 ± 0.22 a
W3N375,680.84 ± 2012.63 c65,147.40 ± 2012.63 c7.22 ± 0.19 c
ANOVA
Year (Y)*********
Irrigation (W)*********
Nitrogen (N)nsnsns
Y × Wnsnsns
Y × Nnsnsns
W × Nnsnsns
Y × W × Nnsnsns
Note: Different lowercase letters in the same column indicate significant differences among different treatments (p < 0.05). The *** indicate significant differences among different treatments at the levels of p < 0.001, respectively. The ns means not significant at the level of p ≥ 0.05.
Table 8. Results of AHP hierarchical analysis for calculating weights.
Hierarchical StructureLocal WeightFinal Weight Consistency Test Parameter
Target Layer C0.61530.6153CR = 0.0068 < 0.1
λmax = 3.0070
0.22300.2230
0.16170.1617
Criterion layer C10.26110.1607CR = 0.0016 < 0.1
λmax = 4.0042
0.26110.1607
0.24970.1536
0.22800.1403
Criterion layer C20.33960.0757CR = 0.0128 < 0.1
λmax = 4.0342
0.19970.0445
0.10290.0229
0.35780.0798
Criterion layer C30.07810.0126CR = 0.0146 < 0.1
λmax = 6.0917
0.11400.0184
0.07650.0124
0.19690.0318
0.33610.0543
0.19830.0321
Table 9. Weights of single index of I. tinctoria determined by the entropy weighting method.
IndexC11C12C13C14C21C22C23
Weight0.07890.07940.07990.08120.07780.09280.0617
IndexC24C31C32C33C34C35C36
Weight0.0909 0.0833 0.0469 0.0597 0.0579 0.0649 0.0447
Table 10. Single index weights for I. tinctoria assigned based on game theory.
IndexC11C12C13C14C21C22C23
Weight0.1709 0.1709 0.1628 0.1477 0.0754 0.0384 0.0180
IndexC24C31C32C33C34C35C36
Weight0.0784 0.0037 0.0148 0.0065 0.0285 0.0530 0.0305
Table 11. Comprehensive indices of I. tinctoria based on TOPSIS method and their ranking.
TreatmentC11C12C13C14C21C22C23C24C31
W1N10.22190.22220.20320.22620.24850.27480.28540.10110.3043
W1N20.27180.27220.26120.27440.28180.33620.26210.25410.3112
W1N30.24450.24360.22710.24370.23280.30090.18860.12530.3245
W2N10.30060.30130.29520.30470.32480.30630.38660.21770.3410
W2N20.37190.37340.37890.37440.36780.37850.35870.41820.3596
W2N30.40270.40300.41280.40020.37570.40920.31070.42280.3655
W3N10.34520.34460.34540.34660.37760.29710.44390.36850.3202
W3N20.42260.42230.43560.42070.41480.36390.40750.55300.3303
W3N30.35840.35700.35880.35200.32870.30940.27650.25860.3383
  S + 0.42260.42230.43560.42070.41480.40920.44390.55300.3655
  S 0.22190.22220.20320.22620.23280.27480.18860.10110.3043
TreatmentC32C33C34C35C36   D +   D CiSorted
W1N10.30610.28740.30160.29090.24300.22010.01370.05869
W1N20.32340.31860.31800.30720.31400.15940.06470.28877
W1N30.33300.33420.33050.32230.34250.20310.02790.12098
W2N10.34080.33810.33580.34050.32830.14240.08540.37486
W2N20.34560.35500.35160.36060.35950.05890.16440.73633
W2N30.34850.36800.35700.36940.38150.04520.18570.80432
W3N10.32750.30430.31980.31850.30760.08850.13840.61014
W3N20.33300.33290.33580.33360.33680.01610.21960.93151
W3N30.34000.35370.34610.34930.36660.10660.12710.54385
  S + 0.34850.36800.35700.36940.3815
  S 0.30610.28740.30160.29090.2430
Note: S+ is the ideal solution, S is the inverse ideal solution; D+ is the distance of each treatment from the ideal solution, and D is the distance of each treatment from the inverse ideal solution.
Disclaimer/Publisher’s Note: The statements, opinions and data contained in all publications are solely those of the individual author(s) and contributor(s) and not of MDPI and/or the editor(s). MDPI and/or the editor(s) disclaim responsibility for any injury to people or property resulting from any ideas, methods, instructions or products referred to in the content.

