Article

Drought Characteristics during Spring Sowing along the Great Wall Based on the MCI

1
College of Resources and Environment, Shanxi Agricultural University, Jinzhong 030801, China
2
Shanxi Institute of Organic Dryland Farming, Shanxi Agricultural University, Taiyuan 030001, China
3
Mechanical and Electrical Engineering College, Gansu Agricultural University, Lanzhou 730070, China
4
Institute of Cotton Research, Shanxi Agricultural University, Yuncheng 044000, China
5
School of Software, Shanxi Agricultural University, Jinzhong 030801, China
*
Author to whom correspondence should be addressed.
Agronomy 2024, 14(10), 2195; https://doi.org/10.3390/agronomy14102195
Submission received: 4 August 2024 / Revised: 20 September 2024 / Accepted: 22 September 2024 / Published: 24 September 2024
(This article belongs to the Section Agroecology Innovation: Achieving System Resilience)

Abstract

:
The region along the Great Wall is a typical dryland agricultural zone, serving as both a potential area for staple grain production and a key region for specialty crops like coarse grains and cool-climate vegetables. Studying the characteristics of drought during the spring sowing period is crucial for developing diversified planting strategies and ensuring food security. This study analyzes the drought conditions along the Great Wall from 1960 to 2023, revealing the spatial and temporal distribution of drought in the region and quantifying the impact of climate change on drought frequency and intensity. By doing so, it fills a gap in the existing drought research, which often lacks the long-term, multi-dimensional analysis of spring sowing drought characteristics. Using daily meteorological data from April 20 to May 20 during the spring sowing period between 1960 and 2023, the study employs the Meteorological Composite Drought Index (MCI) to quantitatively identify drought conditions and examine the spatial and temporal evolution of drought in the region. The results show that, on a daily scale, the frequency of mild and moderate droughts is 60.45% and 25.19%, respectively, with no occurrences of severe or extreme drought. On an annual scale, the intensity of drought and the ratio of affected stations show an increasing trend, with a decrease in mild drought frequency and an increase in moderate and severe drought occurrences. Additionally, the spatial distribution of drought frequency follows a pattern of “higher in the east than in the west” and “higher in the north than in the south”. The study also finds that the migration of drought frequency centers shows a clear temporal evolution, with the center shifting southwestward from the 1960s to the 2000s, and then moving northeastward from the 2000s to 2023. These findings provide critical data support for optimizing agricultural drought resistance strategies and offer new insights for future research on the relationship between drought and climate change. It is suggested that agricultural practices and water resource management policies should be adjusted according to the spatial migration of drought centers, with a particular focus on optimizing drought mitigation measures during the spring sowing period.

1. Introduction

The frequency and intensity of extreme weather events caused by global warming have significantly increased, with drought events becoming more severe and frequent. Climate change has altered precipitation patterns, reducing rainfall in some regions, shortening drought cycles, and exacerbating drought severity [1]. Since 2000, the frequency and duration of global droughts have increased by 29%; between 2010 and 2019, the frequency and severity index of droughts in China increased by 2.3 compared to the period from 1950 to 2009 [2]. The widespread impacts of drought are not only reflected in direct aspects such as water shortages and agricultural production losses but also profoundly affect the stability of ecological environments, the sustainable development of the economy and society, and even human survival and safety [3,4,5]. Agriculture, being the foundation of the national economy, is sector the most directly and significantly affected by drought. Drought leads to insufficient soil moisture, affecting crop growth cycles and yields, and in severe cases, causing crop failures. This threatens food security and directly impacts farmers’ incomes and rural economic development [6,7,8]. Drought monitoring can provide early warnings of drought risks, offering a time window for farmers to take drought-resistant measures and reduce agricultural losses.
Based on the frequent occurrence of drought events, numerous scholars domestically and internationally have invested in drought research [9,10,11,12,13,14]. Globally, several drought monitoring systems have been established, such as the North American Drought Monitor (NADM) in the United States and the European Drought Observatory (EDO) in Europe [15,16], utilizing various drought indices for global and regional drought monitoring. Drought indices are fundamental for conducting drought monitoring and risk assessment, as well as effective tools for studying drought characteristics. Many scholars widely adopt indices such as the SPI (Standardized Precipitation Index), SPEI (Standardized Precipitation Evapotranspiration Index), PDSI (Palmer Drought Severity Index), and MCI (Meteorological Comprehensive Index) to perform multi-scale drought analysis and evaluation. For instance, the SPI has been used to assess drought conditions in North America [17], the SPI and the SPEI have been employed to evaluate climate drought trends in Europe [18,19], the SPI has been used to interpret the spatial and temporal conditions of drought in China [20], and the SPI has been utilized to assess the frequency and severity of drought in North China [21]. Additionally, the SPEI and the SPI have been used to evaluate drought characteristics in Yunnan Province [22] and Shandong Province [23], and a hybrid drought index combining the SPEI and the Regional Improved Weighted Standardized Drought Index (RIWSDI) has been used to assess drought conditions in seven different regions of Pakistan [24]. Furthermore, the SPEI has been used to analyze drought characteristics during the growth period of summer maize in the Huang-Huai-Hai Plain [25].
Among these indices, the Meteorological Comprehensive Index (MCI) has garnered widespread attention due to its ability to comprehensively reflect the impacts of various meteorological factors on drought [26,27,28]. Existing studies have demonstrated that using the MCI to evaluate crop drought conditions can more accurately predict the potential impacts of droughts on crop growth [29].
The agriculture along the Great Wall is predominantly dryland farming, accounting for about one-tenth of the country’s arable land. It covers most of the northern semi-arid, sub-humid, and dry regions, making it a potential main grain production area and an advantageous zone for specialty agricultural products such as coarse grains and cool-season vegetables. However, it is also an area with highly variable climate conditions and fragile ecosystems. Precipitation in the Great Wall region is mainly concentrated in the summer and autumn, with relatively little rainfall in the spring. Yet, spring is the sowing period for many crops, which is a critical stage in agricultural production, directly affecting crop yield and quality.
In recent years, research has mostly focused on the overall assessment of droughts [21,22,23,24,25,26,27,28], while detailed studies on the critical sowing period remain insufficient, especially concerning spring sowing droughts along the Great Wall. In-depth research on the drought characteristics during the crop sowing period along the Great Wall is of great significance for agricultural production and management in this region. To accurately identify short-term droughts that occur during crop growth and development, drought indicators with smaller time scales are used for monitoring and analysis to better reveal the drought characteristics during crop growth stages.
Therefore, this study aims to address the problem of short drought duration and high intensity during the spring sowing period along the Great Wall. Daily scale MCI is used to quantitatively identify the drought conditions during the spring sowing period along the Great Wall from 1960 to 2023. The goal is to provide a scientific theoretical basis for spring plowing production and drought prevention along the Great Wall from the perspective of sowing period.

2. Materials and Methods

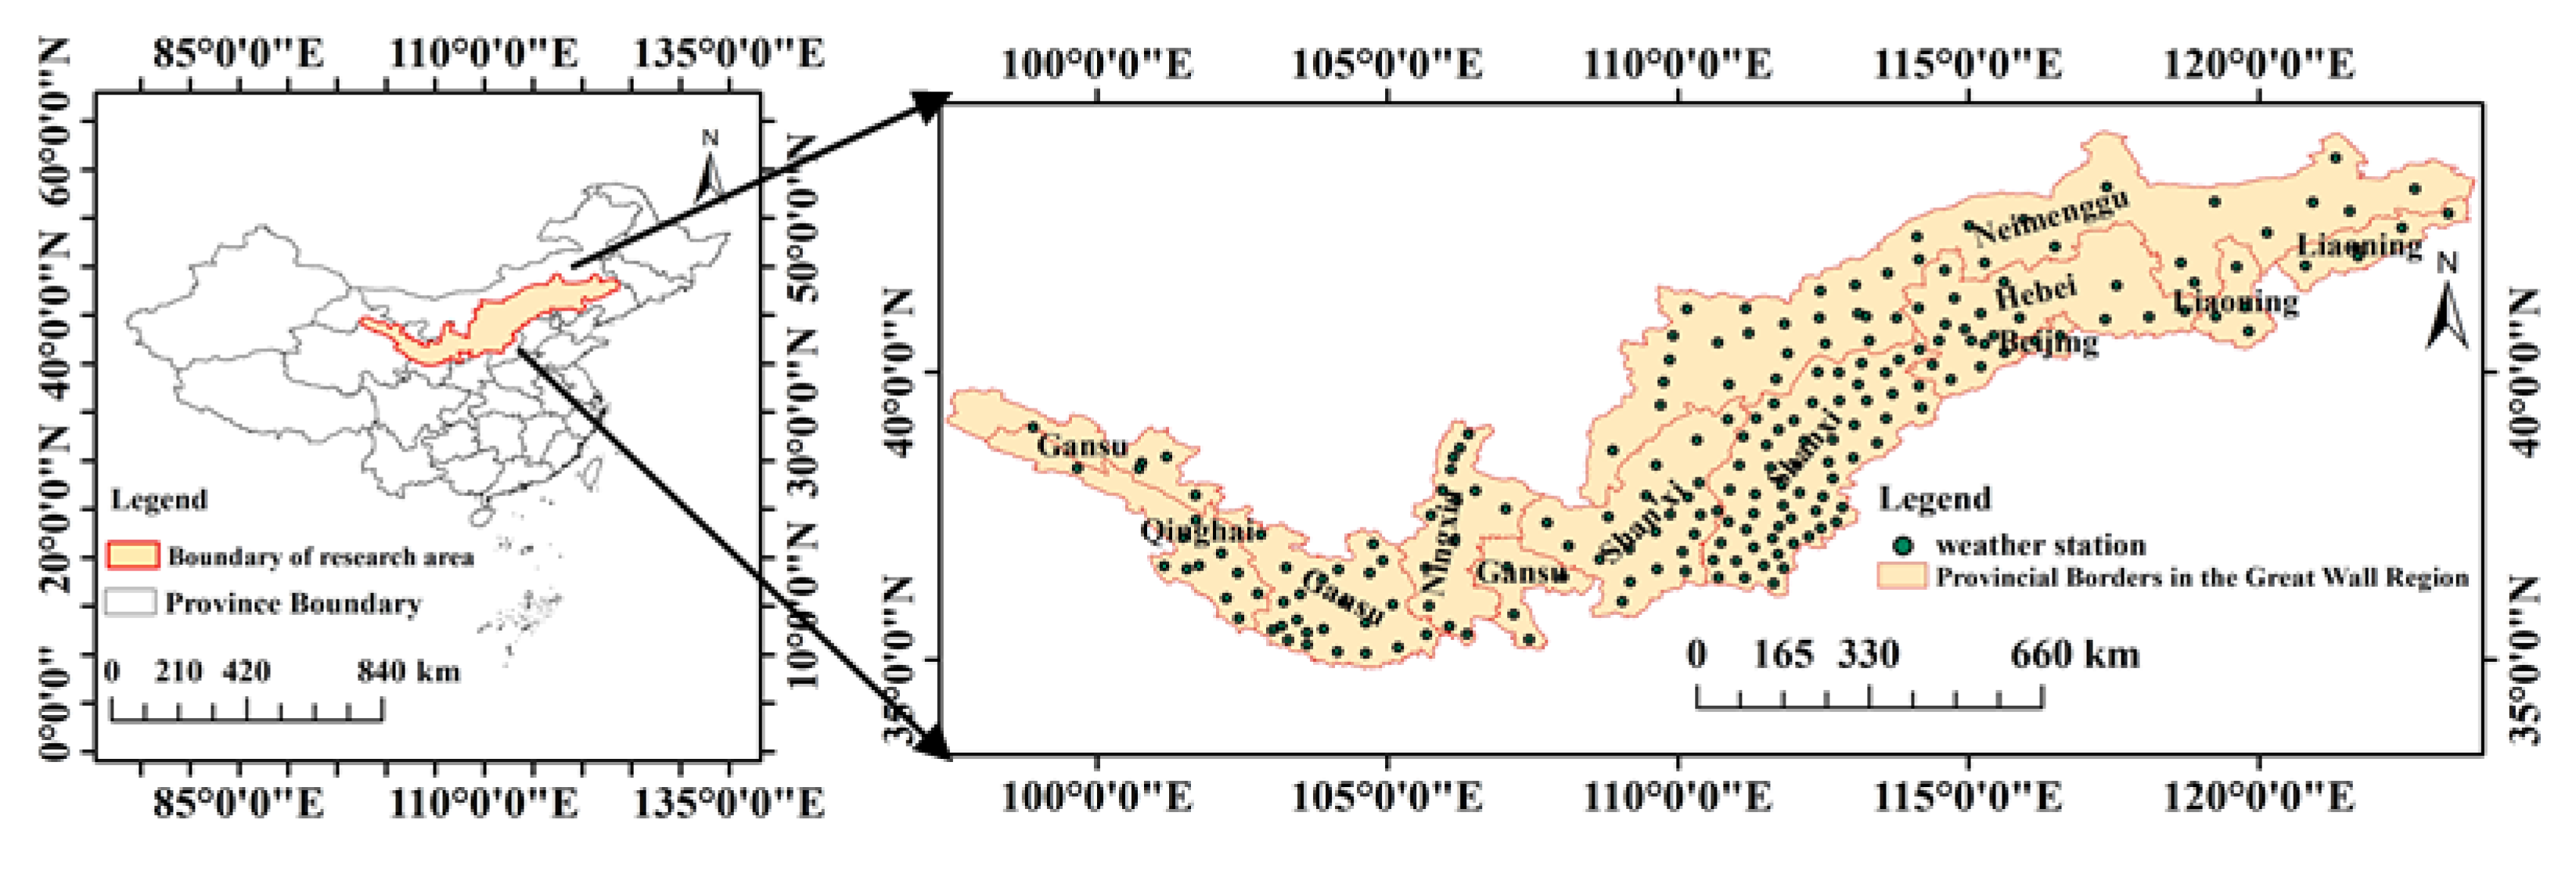
2.1. Overview of the Study Area

The dry farming area along the Great Wall is located in north-central China (Figure 1), spanning the Loess Plateau, the Mongolian Plateau, and including 220 counties across nine provinces such as Shanxi, Hebei, Inner Mongolia, Shaanxi, Gansu, and Ningxia. It encompasses most regions of the northern semi-arid zone with a higher level of drought, sub-humid, and semi-arid zones, lying between latitudes 34°49′ N to 44°24′ N and longitudes 97°16′ E to 124°8′ E. The topography along the Great Wall’s dry farming area is complex and diverse, covering various landforms including plateaus, mountains, hills, plains, and deserts. The region features the rugged terrain of the Loess Plateau, the vast expanse of the Mongolian Plateau, and the coexistence of oases and deserts in the Hexi Corridor, forming a unique landscape.
The climate in this area is diverse, generally belonging to the transitional zone between monsoon and non-monsoon regions, and between semi-humid and semi-arid zones. Annual precipitation decreases gradually from east to west, with significant diurnal temperature variations and strong winds. The region’s vegetation distribution exhibits distinct zonal characteristics. The central and eastern sections of the Great Wall transition between forest steppe and steppe, with relatively high vegetation coverage, while the western section lies between oasis vegetation and desert vegetation, characterized by sparse vegetation and primarily arid soils such as calcareous arid soils and gypsum-saline arid soils [30,31].
The dry farming area along the Great Wall predominantly engages in dryland agriculture, accounting for about one-tenth of the nation’s arable land. It is a potential main grain production area and an advantageous zone for specialty agricultural products such as coarse grains and cool-season vegetables. The crops grown here are mostly drought-resistant, hardy, and short-growing season coarse grains. However, the region faces severe ecological and environmental issues, such as land desertification, soil erosion, and reduced biodiversity, making it a typical ecologically fragile area and a wind-sand barrier zone [32].

2.2. Data Source

The selected daily meteorological data from 195 stations along the Great Wall, from 1960 to 2023, including precipitation, maximum temperature, minimum temperature, relative humidity, wind speed, sunshine duration, and atmospheric pressure, are being used. The data are sourced from the China National Meteorological Science Data Center website (http://www.nmic.cn (12 October 2023)) and the China Surface Basic Meteorological Observation Dataset available within its data and products and WheatA Malt—an Agricultural Meteorological Big Data Platform. The spring sowing period in the research area is from 20 April to 20 May.

2.3. Research Method

2.3.1. Meteorological Drought Composite Index (MCI)

The MCI is a drought index constructed by comprehensively considering the impact of precipitation and evapotranspiration over different preceding periods on the current drought [33].
Step 1:
Calculate the daily potential evapotranspiration (PET), using the FAO Penman–Monteith method for this study [25].
P E T = 0.408 Δ ( R n G ) + γ 900 T m e a n + 273 u 2 ( e s e a ) Δ + γ ( 1 + 0.34 u 2 )
where PET is the potential evapotranspiration (mm·d−1); R n is the net radiation at the surface (MJ·m−2·d−1); G is the soil heat flux density (MJ·m−2·d−1); T m e a n is the mean daily air temperature (°C); u 2 is the wind speed at 2 m of height (m·s−1); e s is the saturation vapor pressure (kPa); e a is the actual vapor pressure (kPa); Δ is the slope of the saturation vapor pressure curve (kPa·°C−1); γ is the psychrometric constant (kPa·°C−1).
Step 2:
Calculate the relative humidity index (MI) [33]
M I = P P E T P E T
where M I is the relative Moisture Index for a certain period; P E T is the potential evapotranspiration for a certain period (mm); and P is the precipitation for a certain period (mm), with the study period being 30 days.
Step 3:
Calculate the SPI [33]. Since the distribution of precipitation is generally not normal, a Gamma distribution is used to describe the variation in precipitation. After calculating the Gamma distribution probability of precipitation, a normal standardization process is carried out. Finally, the cumulative frequency of the standardized precipitation is used as the Standardized Precipitation Index.
(1)
Calculate the Gamma distribution probability density function f x of precipitation.
f x = 1 β γ Γ γ x γ 1 e x / β   x > 0
where β > 0 , γ > 0 are the scale and shape parameters, respectively, and can be estimated using the maximum likelihood estimation method.
γ ^ = 1 + 1 + 4 A / 3 4 A , β ^ = x ¯ γ ^ , where A = lg x ¯ 1 n i = 1 n lg x i . In the formula, x i is the sample size of precipitation, and   x ¯   is the average precipitation.
After determining the parameters in the probability density function, the probability F x < x 0 of the event where the random variable x is less than x 0 for a certain year’s precipitation can be calculated.
(2)
Calculate the probability F(x) of precipitation.
F x < x 0 = 0 x 0 f x d x   x 0 F x = 0 = m n                     x = 0
where x and x 0 represent the precipitation (mm), m is the number of samples with zero precipitation, and n is the total number of samples.
(3)
Perform normalization on the probability of Γ distribution, that is, substitute the probability value obtained from the second step into the standardized normal distribution function:
F x < x 0 = 1 2 π 0 x 0 e z 2 / 2 d x
By approximately solving the above formula,
Z = S t c 2 t + c 1 t + c 0 d 3 t + d 2 t + d 1 t + 1.0
where t = ln 1 F 2 , F is the probability obtained from the above formula, if F > 0.5 , F = 1.0 F ,     S = 1 ; if F 0.5 , S = 1 ;   c 0 = 2.515517 ,     c 1 = 0.802853 ,     c 2 = 0.010328 ,     d 1 = 1.432788 ,   d 2 = 0.189269 ,     d 3 = 0.001308 , and the Z value is the Standardized Precipitation Index (SPI).
Step 4:
Calculate the Standardized Weighted Precipitation Index (SPIW)
S P I W = S P I n = 0 N a n P n
where S P I W is the Standardized Weighted Precipitation Index, N is the length of a certain period (days), a is the contribution parameter, which is 0.85 when N is 60, P n is the precipitation (mm) n days before the current day, and the SPI is the standardized processing.
Step 5:
Calculate the MCI [33]
M C I = K a × a × S P I W 60 + b × M I 30 + c × S P I 90 + d × S P I 150
where the M C I is the Meteorological Drought Composite Index; S P I W 60 is the Standardized Weighted Precipitation Index for the past 60 days; M I 30 is the relative wetness index for the past 30 days; S P I 90 is the Standardized Precipitation Index for the past 90 days; S P I 150 is the Standardized Precipitation Index for the past 150 days; a , b , c , and d are the weighting coefficients, with values of 0.3, 0.5, 0.3, and 0.2, respectively; and K a is the seasonal adjustment coefficient. For Beijing, Shanxi, Hebei, Gansu, and Shaanxi, K a is 1.2; for Inner Mongolia in April and May, K a is 0.8 and 1.0, respectively; for Ningxia and Qinghai in April and May, K a is 1.0 and 1.2, respectively; and for Liaoning in April and May, K a is 0.8 and 0.9, respectively.
The MCI takes into account the effective precipitation within 60 days, the evapotranspiration within 30 days, and the combined impact of precipitation over 90 and 150 days, adding a seasonal adjustment coefficient. This index is suitable for monitoring and assessing meteorological drought on a daily basis during the crop growing season. According to the “Meteorological Drought Classification” (GB/T 20481-2017) published by the National Climate Center, the MCI drought classification is shown in Table 1 [33].

2.3.2. Drought Characterization Indicators

(1)
Drought Intensity
Drought intensity is the average MCI value over all days within the study period. The larger the value, the stronger the drought process [33].
(2)
Drought Frequency
If on an annual scale, when the MCI is continuously less than or equal to −0.5 for 10 days during the study period, it is determined that a drought process has occurred in that year. Drought frequency is the ratio of drought years to the total number of years. On a sowing period scale, drought frequency is the ratio of drought days to the total number of days in the sowing period [33].
(3)
Station Ratio
The station ratio is the ratio of the number of stations experiencing drought to the total number of stations in the study area; the number of drought stations; the total number of stations.
f = n N × 100 %
where f is the ratio of the number of stations experiencing drought to the total number of stations in the study area; n is number of drought stations; N is total number of stations.

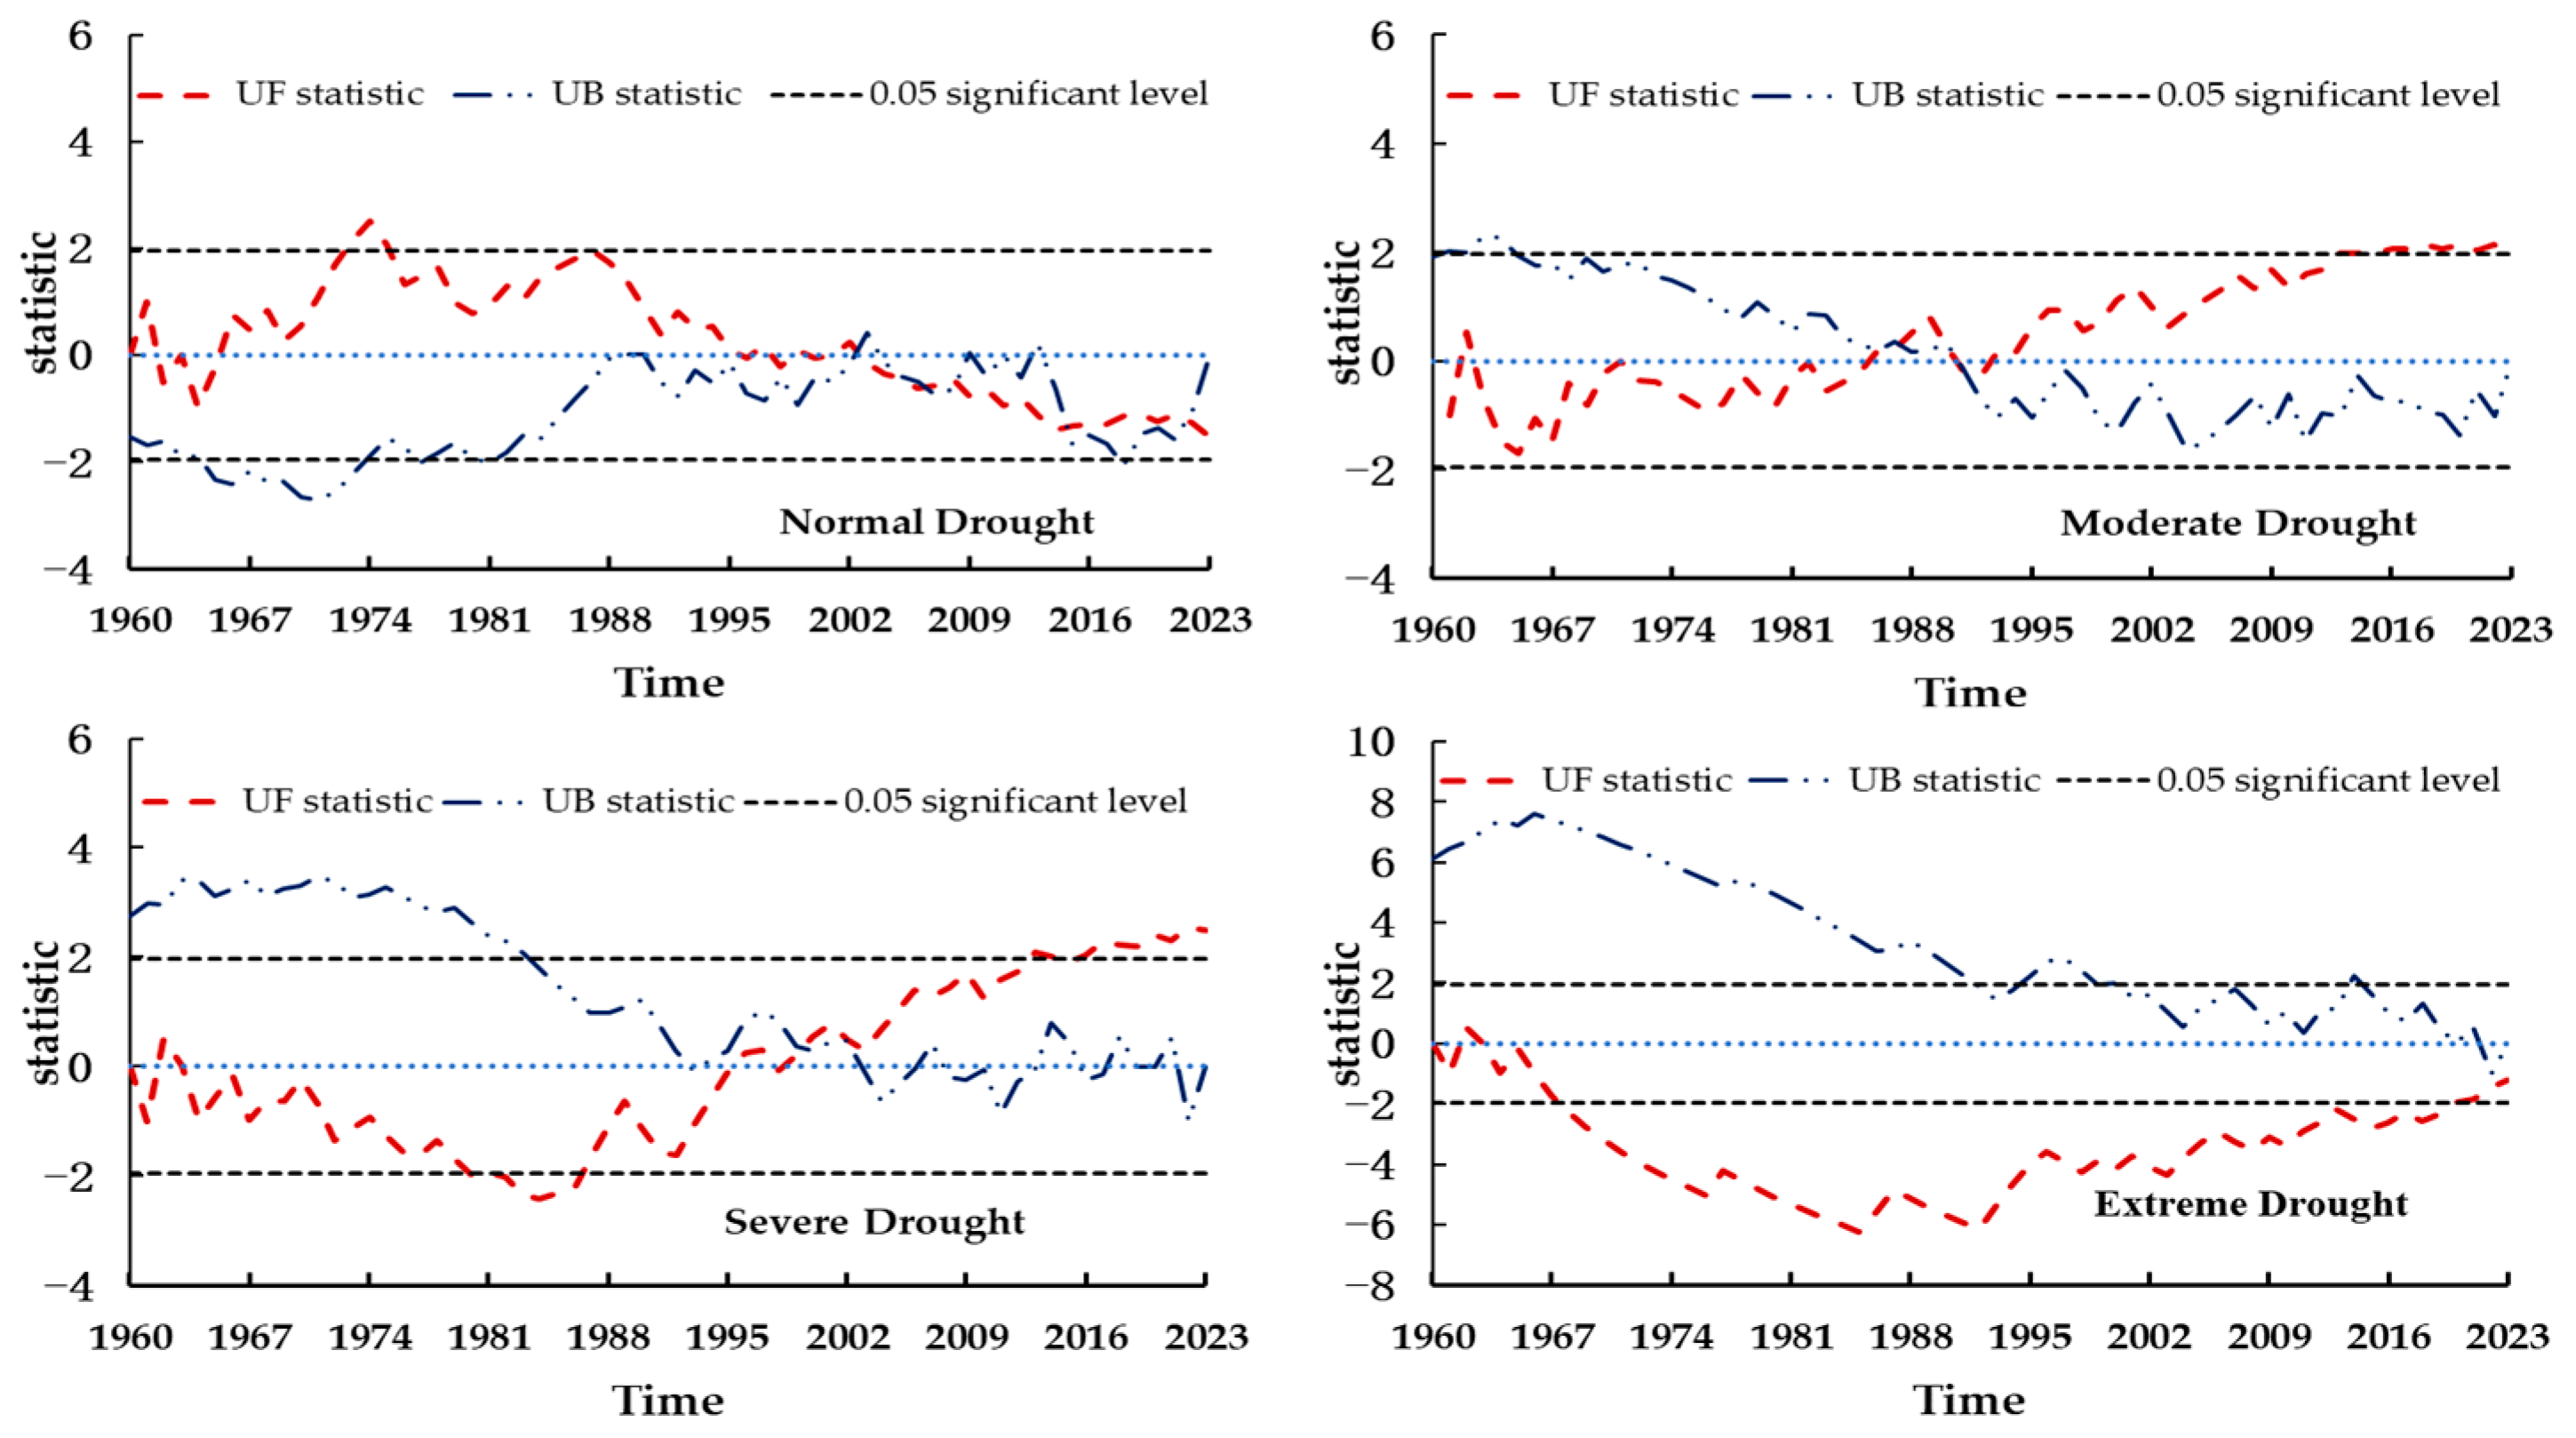
2.3.3. The Mann–Kendall Test

The Mann–Kendall test is a widely used non-parametric statistical method for analyzing trends in time series data. It is suitable for detecting monotonic trends (either upward or downward) as well as change points (also known as mutation points) in a dataset.
For a time series x1, x2, … …, xn, with n number of samples, construct the rank sequence S [34]:
S k = i = 1 k R i   k = 2 , 3 , n
where R i is the cumulative number when xi is greater than xj ( 1 i j ). Under the assumption of independent randomness in the time series, the statistic is defined as follows:
U F k = S k E S k V a r S k
where   U F 1 = 0 when k = 1 . E S k and V a r S k are the mean and variance of the cumulative number S k , given by E S k = n n + 1 / 4 , V a r S k = n n 1 2 n + 5 / 72 .
Reverse the time series to xn, xn−1, … …, x1 and repeat the above process to obtain   U F k , where U B k = U F k   k = n , n 1 , 1 .
Finally, plot the curves of U F k . If the U F k curve exceeds the confidence interval, it indicates a significant upward or downward trend in the time series. In this study, α = 0.05, corresponding to a confidence interval of ±1.96.

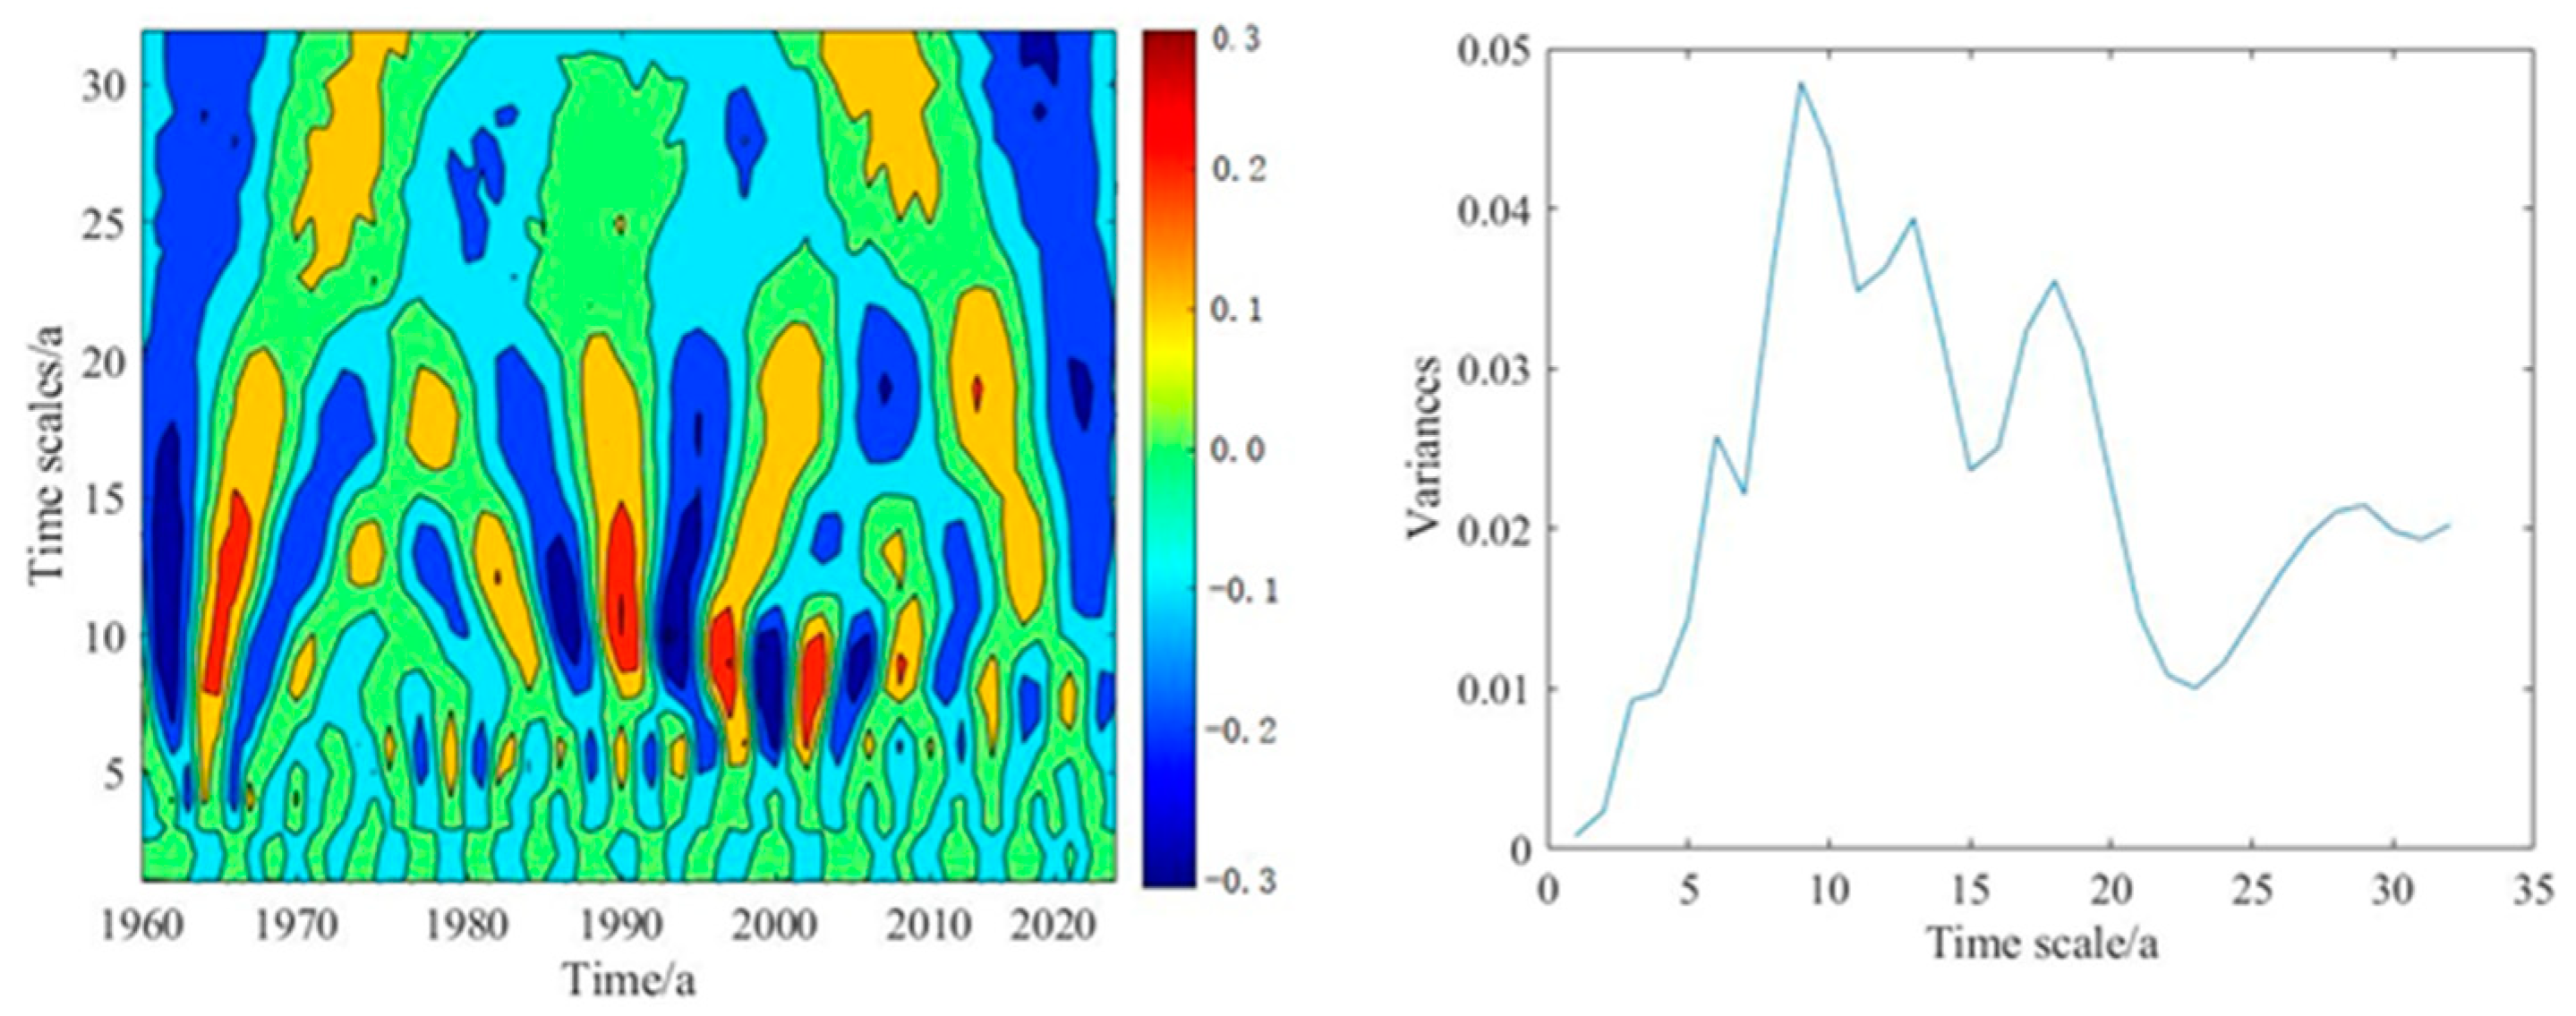
2.3.4. Wavelet Analysis

The Morlet continuous wavelet analysis is a time-frequency analysis method that decomposes a signal into different frequency and time scales, revealing the local characteristics of the signal. Its principles and steps are as follows [35].
The Morlet continuous wavelet analysis steps include signal preprocessing, selecting appropriate wavelet parameters, calculating the continuous wavelet transform, generating a time-frequency map, and extracting features. Morlet wavelet is a complex wavelet, composed of a sinusoidal wave modulated by a Gaussian function, which provides good time and frequency resolution in the time-frequency plane.
The Morlet wavelet is a mother wavelet, and its expression is:
ψ t = π 1 4 e i ω 0 t e t 2 2
where ψ(t) is the wavelet function; ω0 is the central frequency, typically set to 5 or 6 to balance time and frequency resolution; e i ω 0 t is the sinusoidal part, used to capture the frequency information of the signal; e t 2 2 is the Gaussian window function, ensuring the good localization of the wavelet.
The continuous wavelet transform (CWT) of the Morlet wavelet is defined as follows:
W a , b = + x t ψ a , b t d t
where W a , b is the wavelet transform coefficient, representing the characteristics of the signal at scale a and time position b ; x t is the original signal; ψ a , b t is the Morlet wavelet function adjusted by scale a and position b , with the expression
ψ a , b t = 1 a ψ t b a
By changing scale a and time position b , the Morlet wavelet can analyze the variations in the signal across different frequencies (scales) and time.

2.3.5. Center of Gravity Migration

The change in the center of gravity of drought frequency reveals the spatial variation trend and pattern of drought events. The calculation method for the center of gravity is [36]:
X i = i = 1 n w i x i i = 1 n w i   Y i = i = 1 n w i y i i = 1 n w i
where X i and Y i are the longitude and latitude coordinates of the drought center of gravity, n is the number of stations, w i is the drought frequency at the i-th station, and x i , y i are the coordinates of the i-th station.
For each time point, use the same method to calculate the centroid position (Xc1, Yc1), (Xc2, Yc2), and so on. If the data includes multiple time periods, the position of the centroid will change over time, indicating the dynamic migration of the system.

3. Results

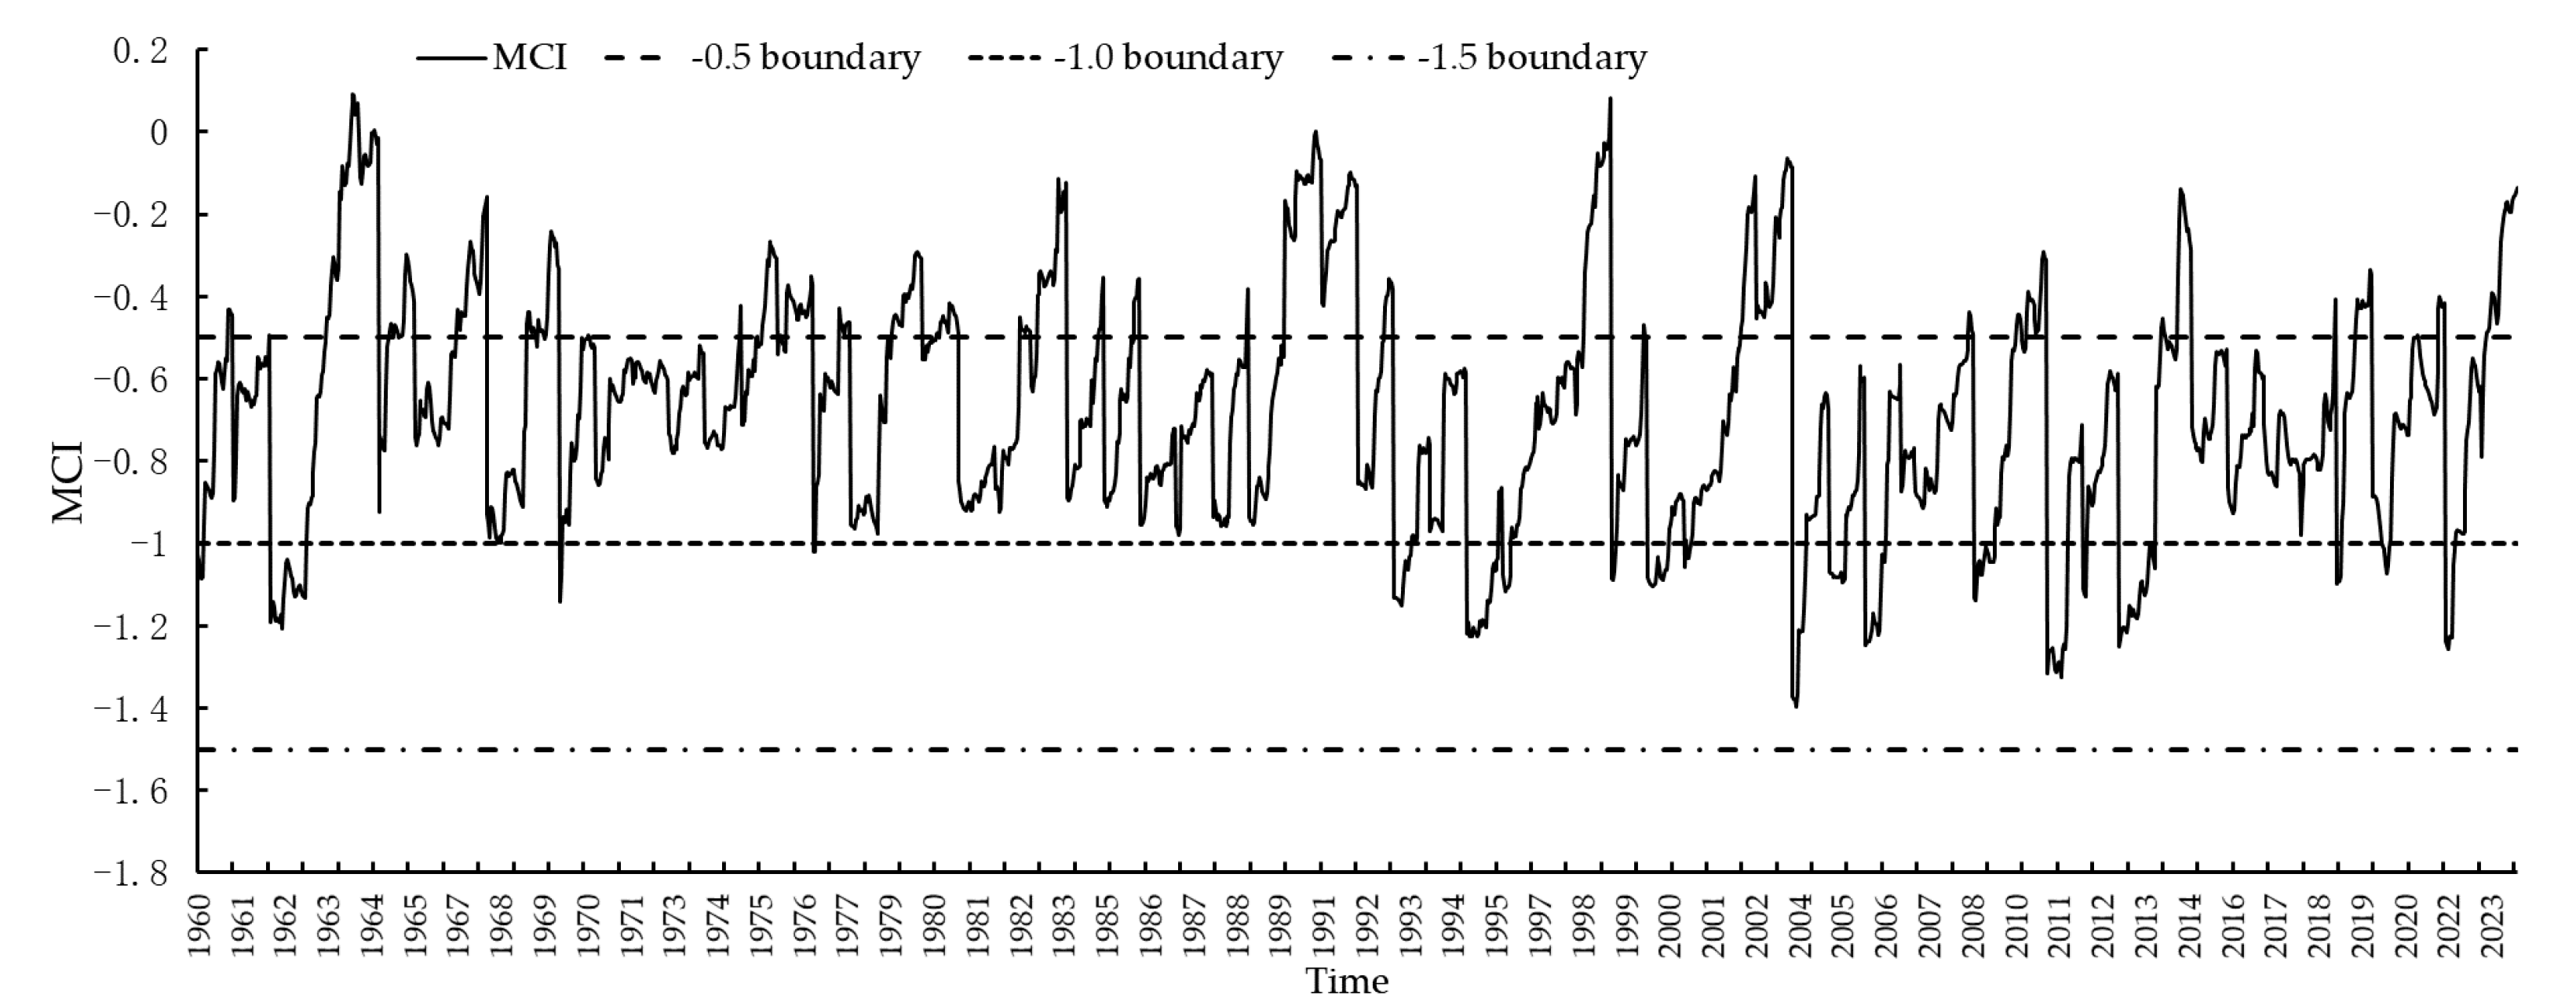
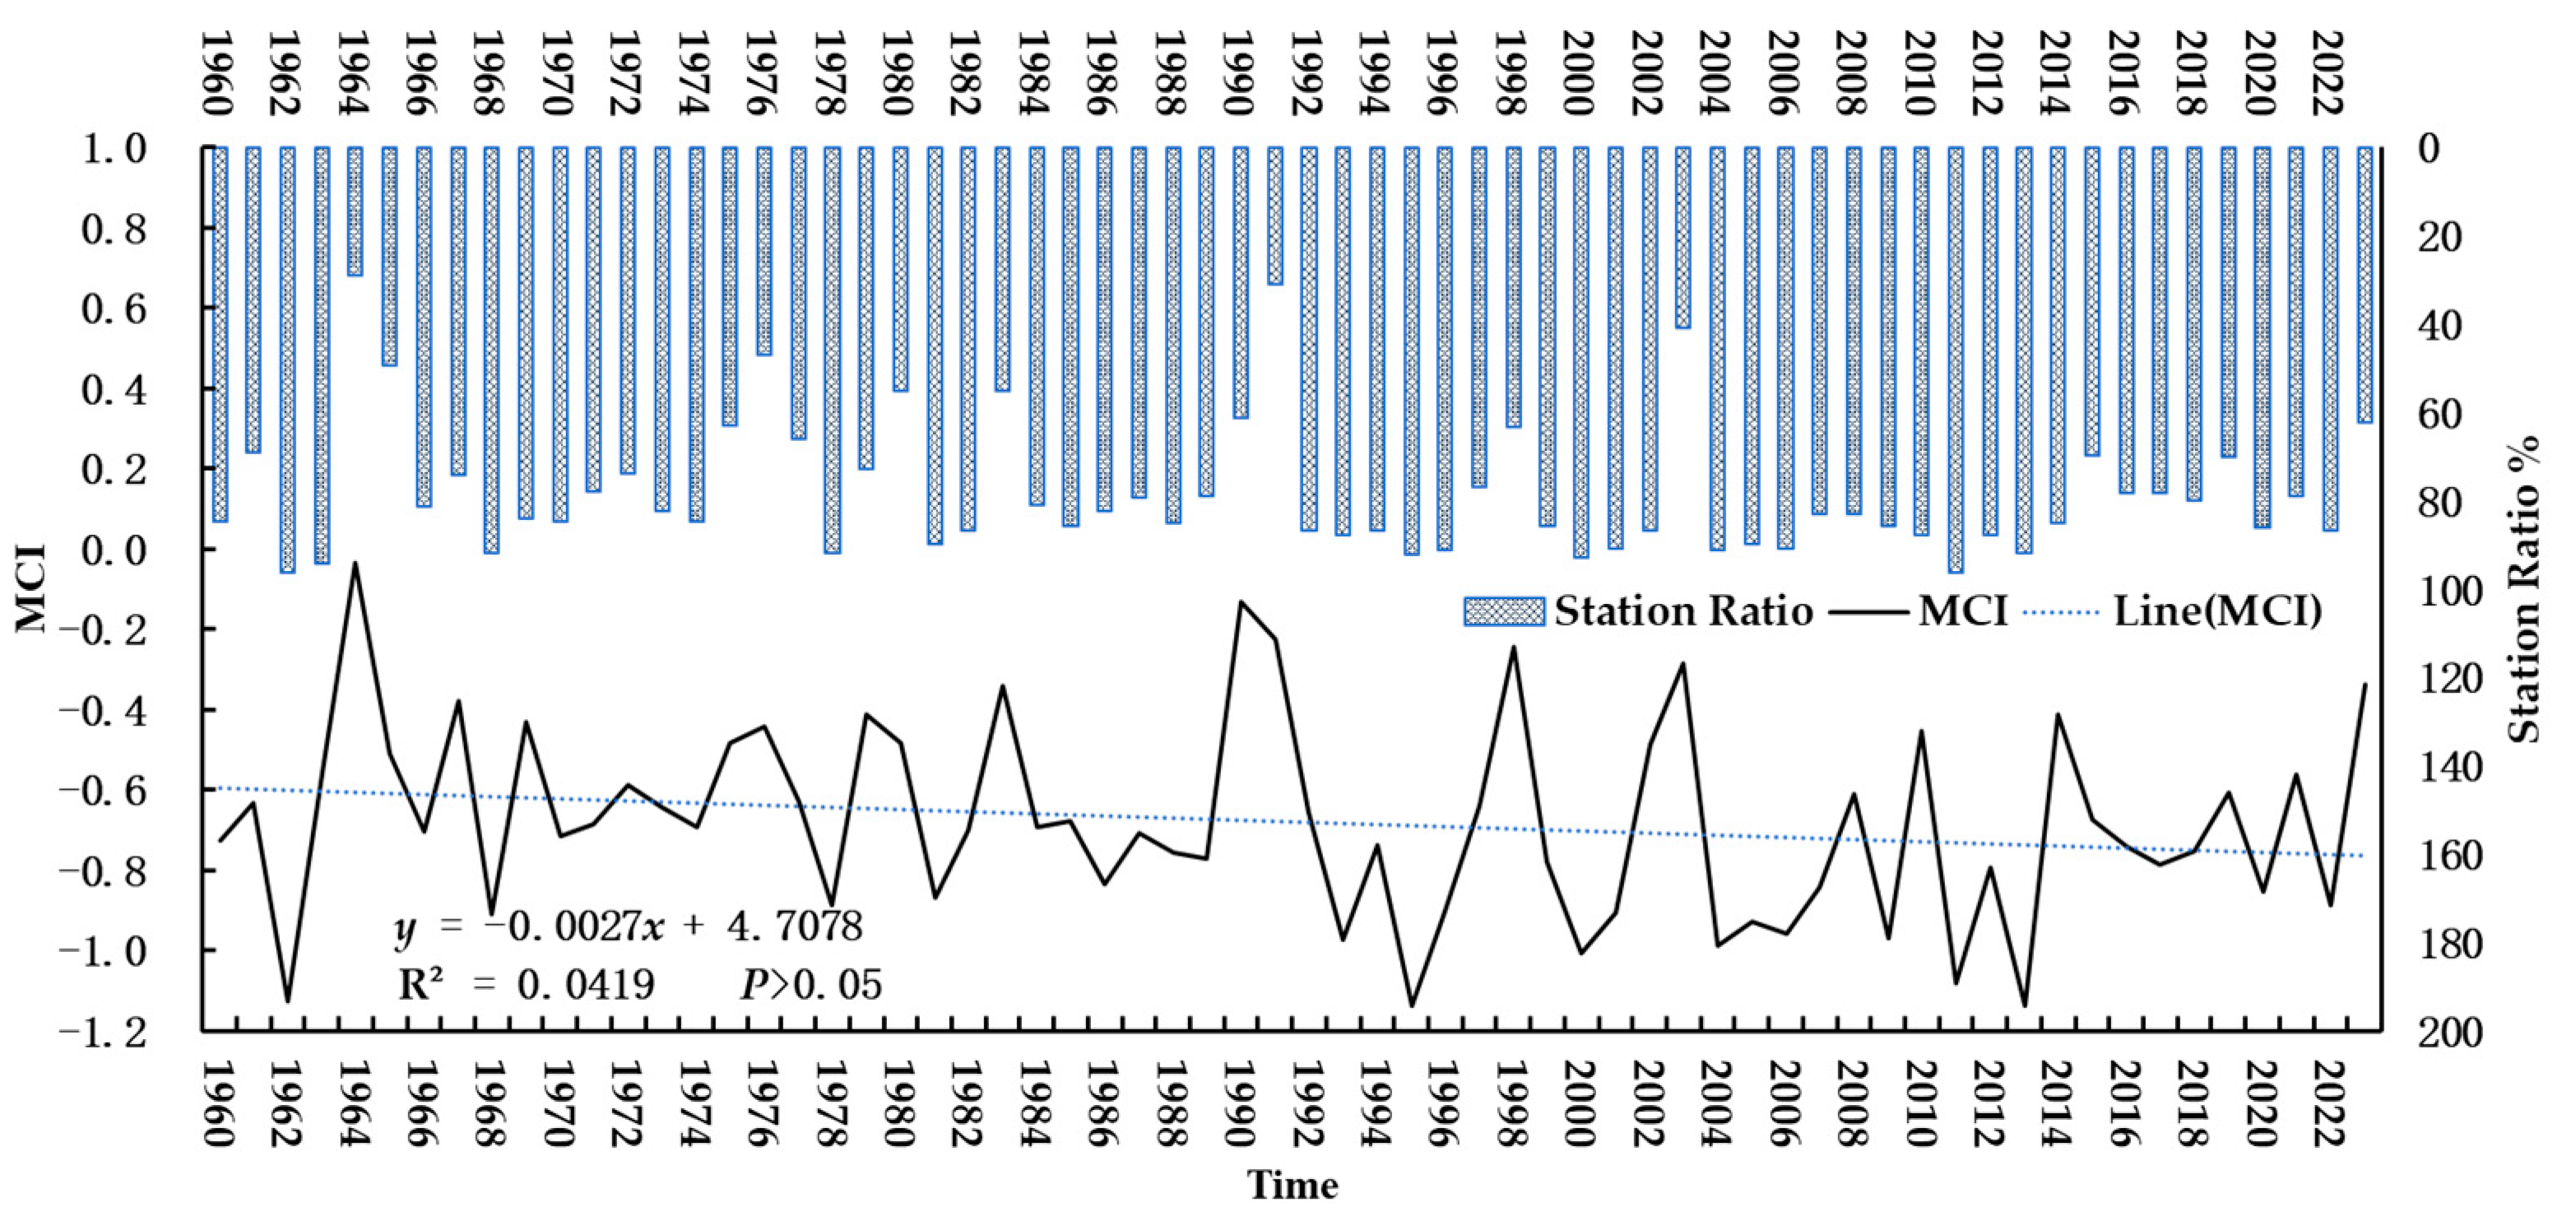
3.1. Drought Intensity

The temporal evolution characteristics of drought intensity during the spring sowing period along the Great Wall region on a daily scale (Figure 2) and an annual scale (Figure 3) are discussed. Figure 2 and Figure 3 indicate that regional drought intensity exhibits a fluctuating phenomenon, with an overall insignificant downward trend. The most severe drought years were 2013, 1995, 1962, and 2011, with MCI values of −1.14, −1.14, −1.13, and −1.08, respectively. The daily MCI fluctuated frequently throughout the period, showing multiple cyclical dry and wet periods. From the mid-1980s to the early 1990s, MCI values were relatively low, indicating severe drought conditions. After 2000, MCI values recovered somewhat but continued to fluctuate significantly, with drought conditions not fully alleviated. In recent years, MCI values have shown marked fluctuations again, indicating the cyclical nature of drought conditions.
The frequency of no drought occurrence was relatively low at 20.40%, while the frequency of moderate drought occurrence was 25.19%. Mild drought had the highest occurrence frequency at 60.45%, and severe drought occurred relatively less frequently. The station ratio experiencing drought fluctuated significantly over the entire period but generally showed some distinct peaks and troughs. The total drought station ratio ranged between 28.87% and 96.39%. The years with the lowest drought station ratios were 1964 (28.86%) and 1991 (30.92%), while the years with the highest drought station ratios were 2011 and 1962 (96.39%). The years with a drought station ratio greater than 80% accounted for 52.78%, while those with a ratio less than 50% accounted for only 25.77%.
Years with lower MCI values corresponded to higher drought station ratios, indicating more severe drought conditions. The overall downward trend in MCI values and the fluctuations in the drought station ratio suggest that, despite some years showing relief in drought conditions, the overall drought situation is intensifying.
Further analysis of the periodicity of the MCI using wavelet analysis is shown in Figure 4. The variance diagram in Figure 4 indicates that on a shorter time scale (0 to 5 years), the wavelet variance is relatively low, suggesting that drought fluctuations are relatively minor within these short-term cycles. On a medium time scale (5 to 15 years), the wavelet variance increases rapidly, peaking at around 8 to 10 years with a variance value close to 0.045. This indicates that drought fluctuations are most pronounced within the 8 to 10-year cycle. The increase in variance suggests that drought changes are more significant within these medium-term cycles, possibly reflecting the impact of periodic climate phenomena such as El Niño and La Niña.
On a longer time scale (15 to 20 years), the wavelet variance gradually decreases, indicating that drought fluctuations weaken over longer cycles. The variance increases again on a 20-to-30-year time scale, although not as prominently as during the 10-year cycle, still indicating some long-term drought fluctuations.
The wavelet coefficient diagram reveals that in the mid-1960s and early 1970s, there were some high-intensity droughts. From the 1980s to the 2000s, there was an increase in drought intensity and greater variability, with high-intensity droughts becoming more prominent and frequent. There were significant peaks in the late 1980s and early 1990s. The period from the 2000s to the 2020s shows a continuation of significant drought events. High-intensity droughts also occurred in the early 2000s and late 2010s.

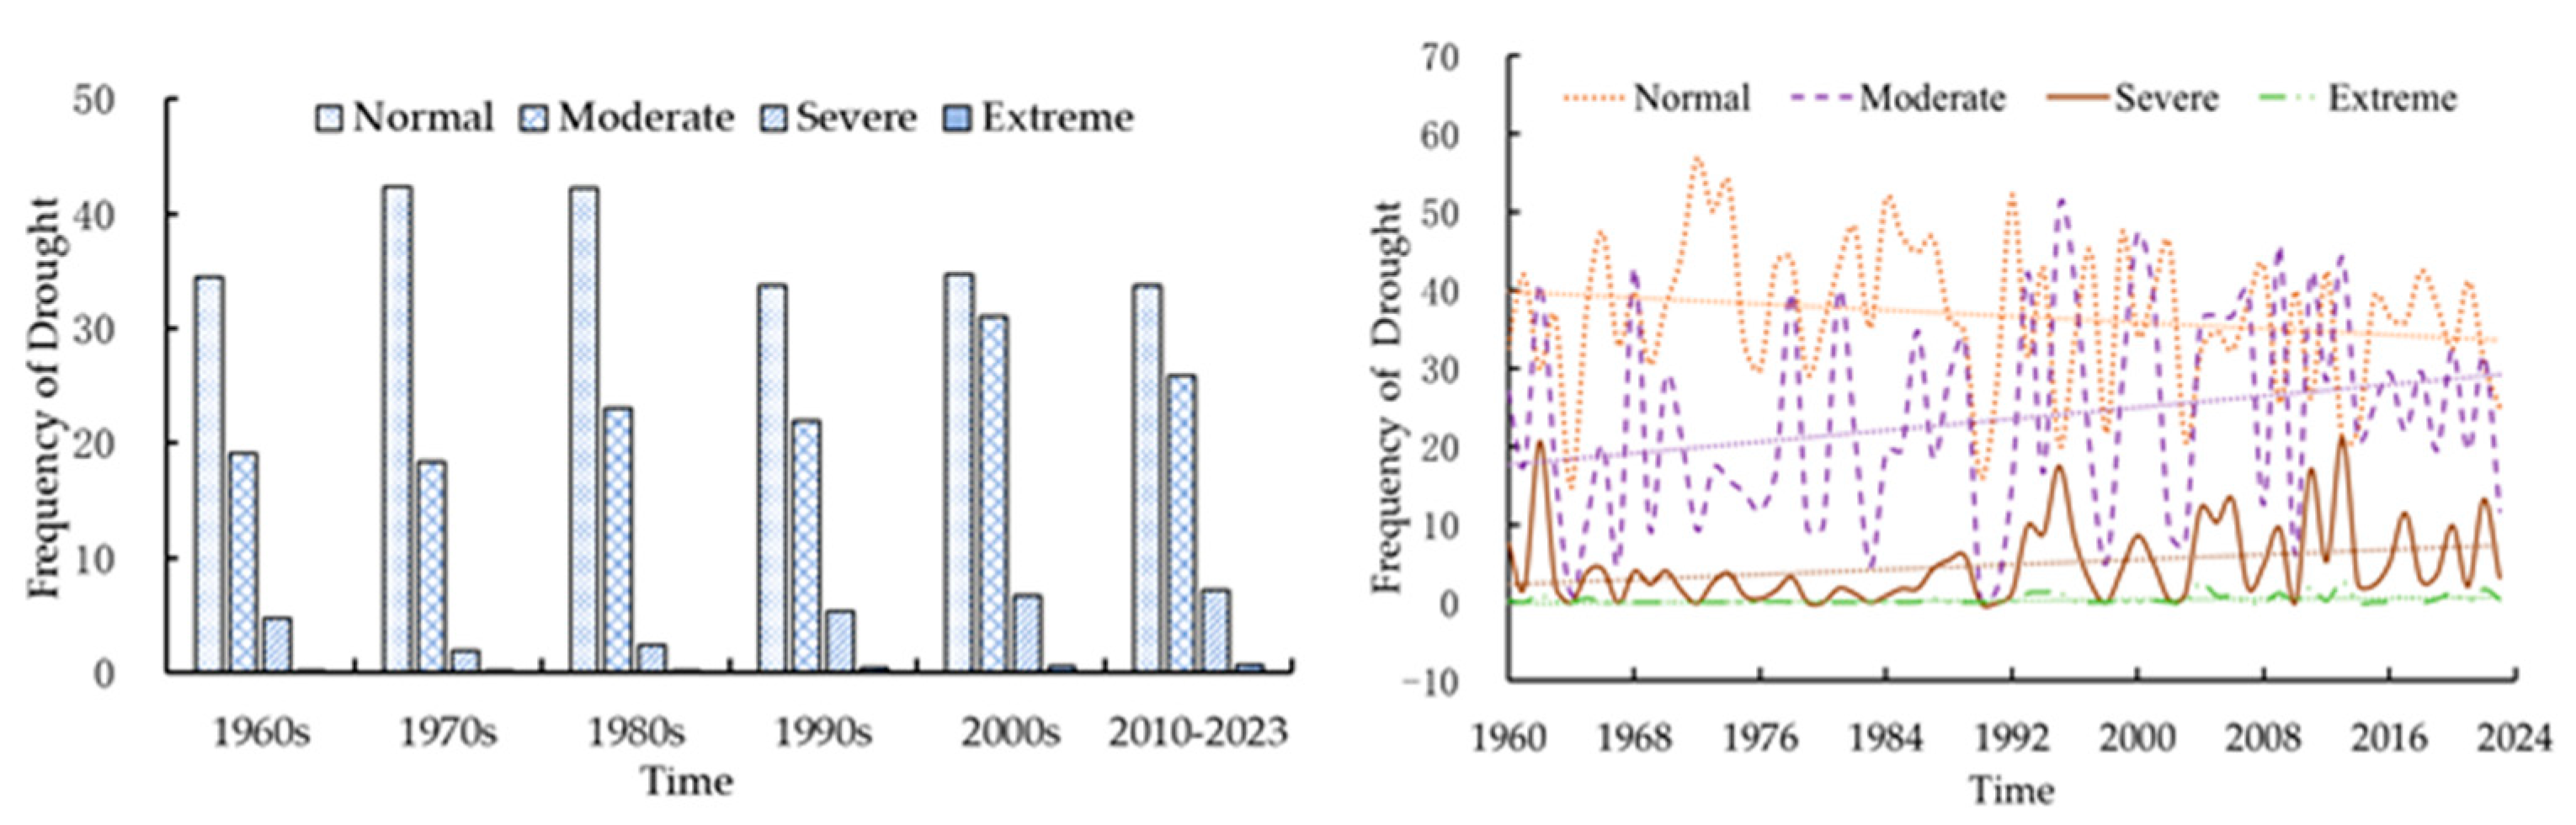
3.2. Drought Frequency

3.2.1. Temporal Analysis

Based on the Meteorological Drought Composite Index (MCI), the daily MCI values for each station during the spring sowing period from 1960 to 2023 were calculated. Using Table 1, the drought occurrence frequency along the Great Wall region from 1960 to 2023 was computed and statistically analyzed (Figure 5).
From Figure 5, it can be seen that the drought occurrence frequency during the spring sowing period along the Great Wall is highest for mild drought and lowest for extreme drought in each decade. The highest drought frequency was in the 2000s, reaching 73.15%, with moderate drought accounting for 31.09% of this. The lowest drought frequency was in the 1960s, at 58.47%, with mild drought accounting for 34.43% and severe and extreme droughts accounting for 4.93%. Severe and extreme drought frequencies were lowest in the 1970s, only accounting for 1.89% of droughts. After the 1970s, the frequency of severe and extreme droughts showed an increasing trend.
Analyzing the annual variation, the frequency of mild drought shows a decreasing trend, while the frequencies of moderate drought, severe drought, and extreme drought show increasing trends.
From the M-K abrupt change test of the drought frequency change trend from 1960 to 2023 (Figure 6), the frequency of mild droughts shows an increasing trend from 1966 to 1995, with a significant upward trend in 1974. There is an insignificant decreasing trend from 2003 to 2023, with multiple abrupt change points, but they are not significant. The frequency of moderate droughts shows a slow decreasing trend from 1963 to 1985, with a rapid increase after 1985, and a significant increasing trend after 2013, with an abrupt change in 1987. The frequency of severe droughts shows a rapid decreasing trend from 1964 to 1998, with a rapid increase after 1998, and a significant increasing trend after 2013, with an abrupt change in 1999. The frequency of extreme droughts shows a rapid initial decrease followed by a slow decrease from 1960 to 2023.

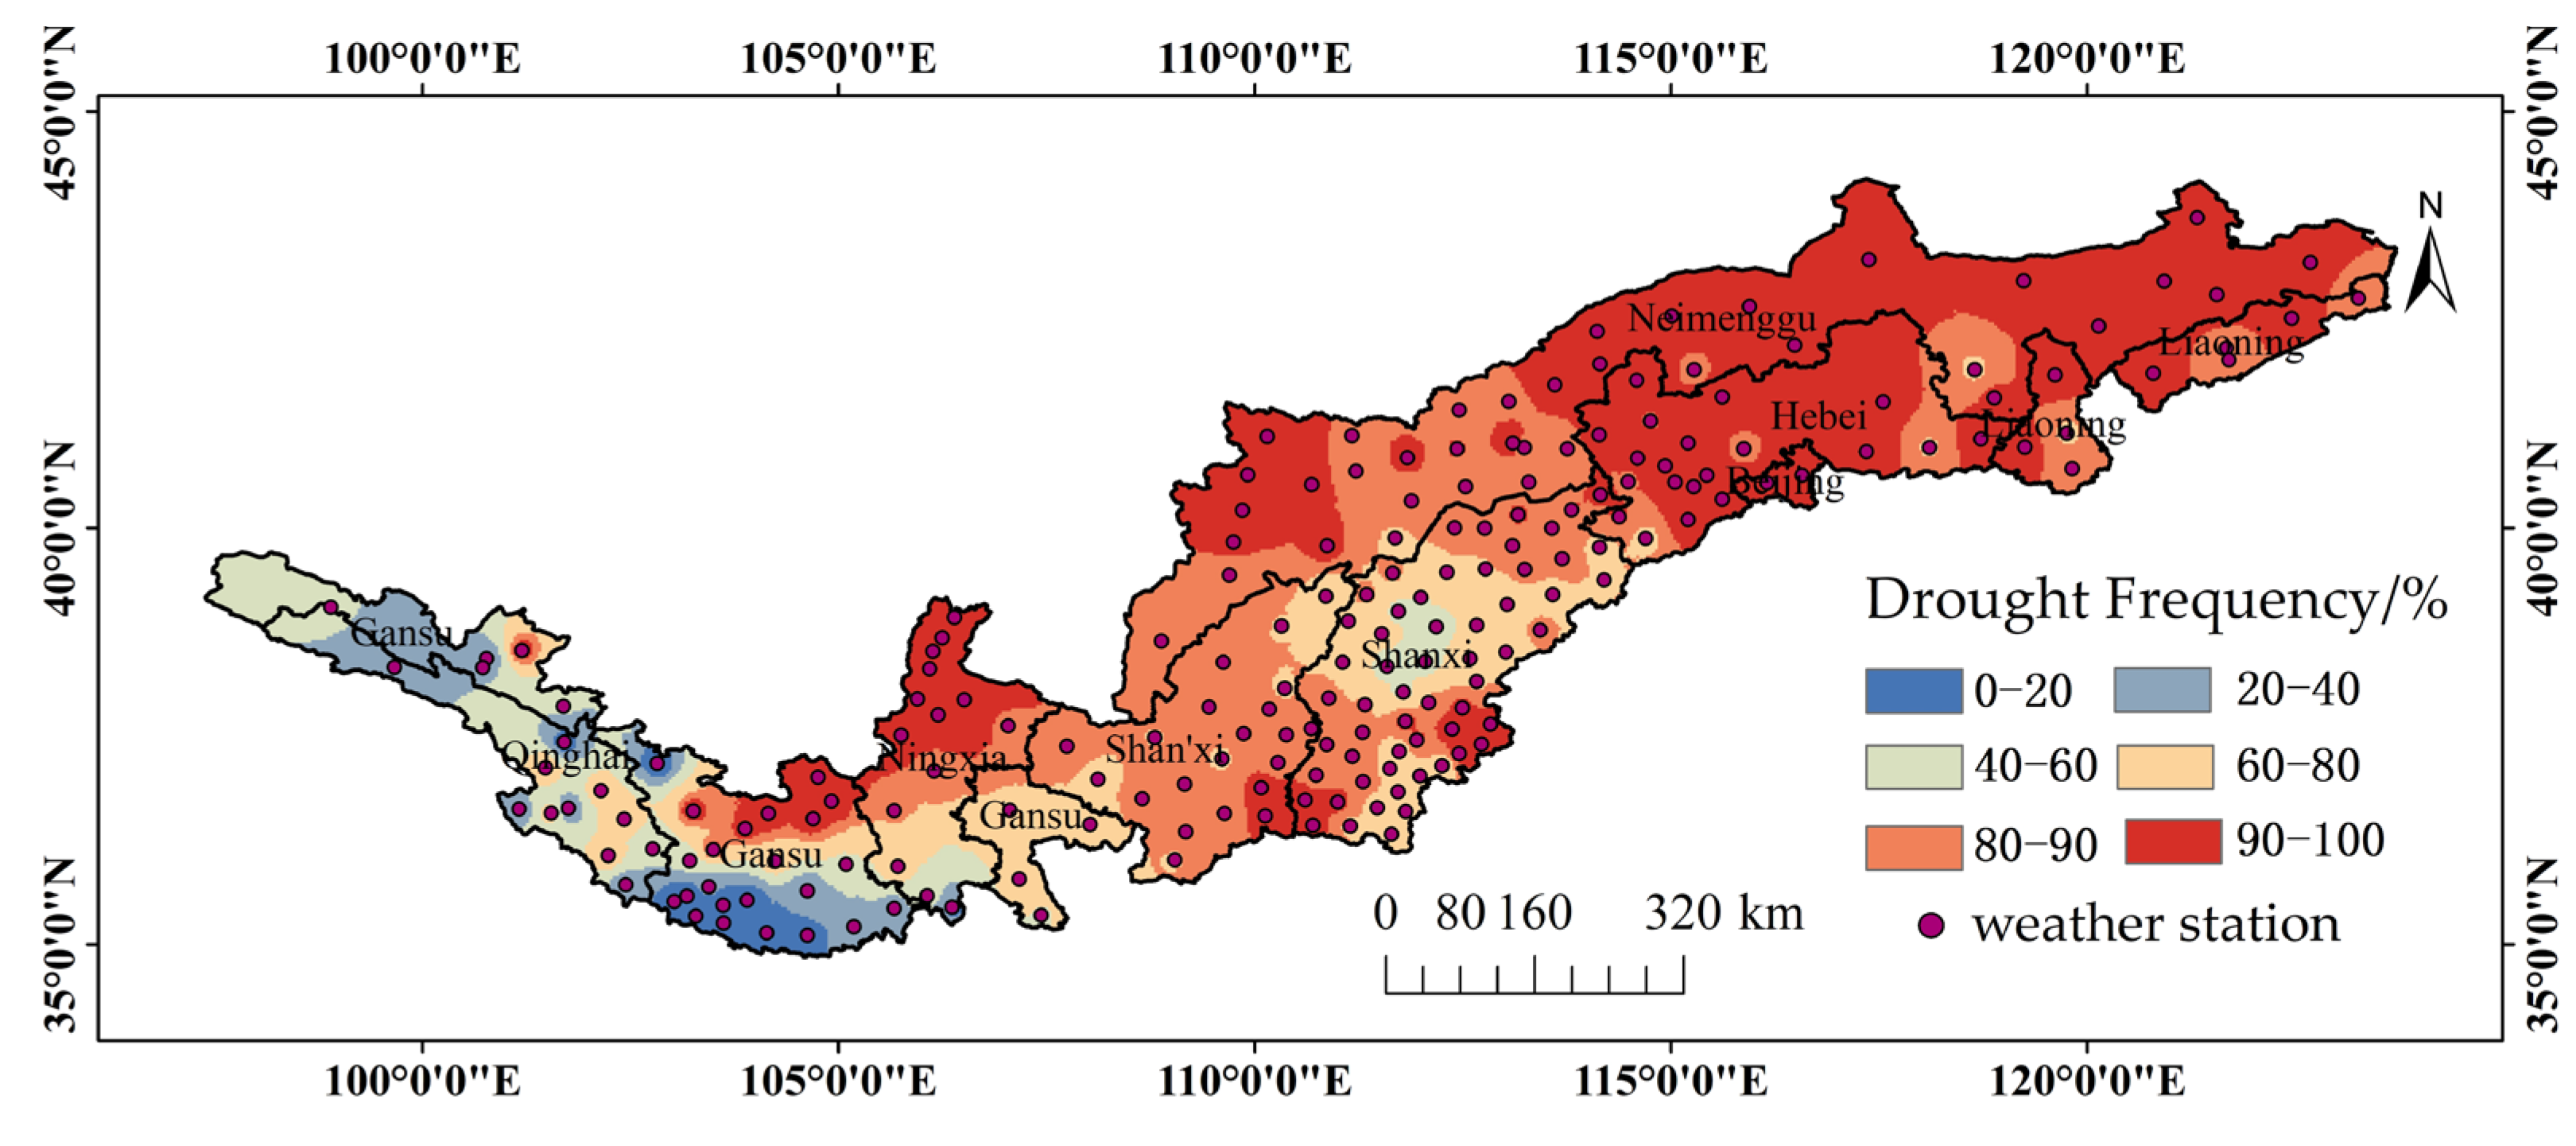
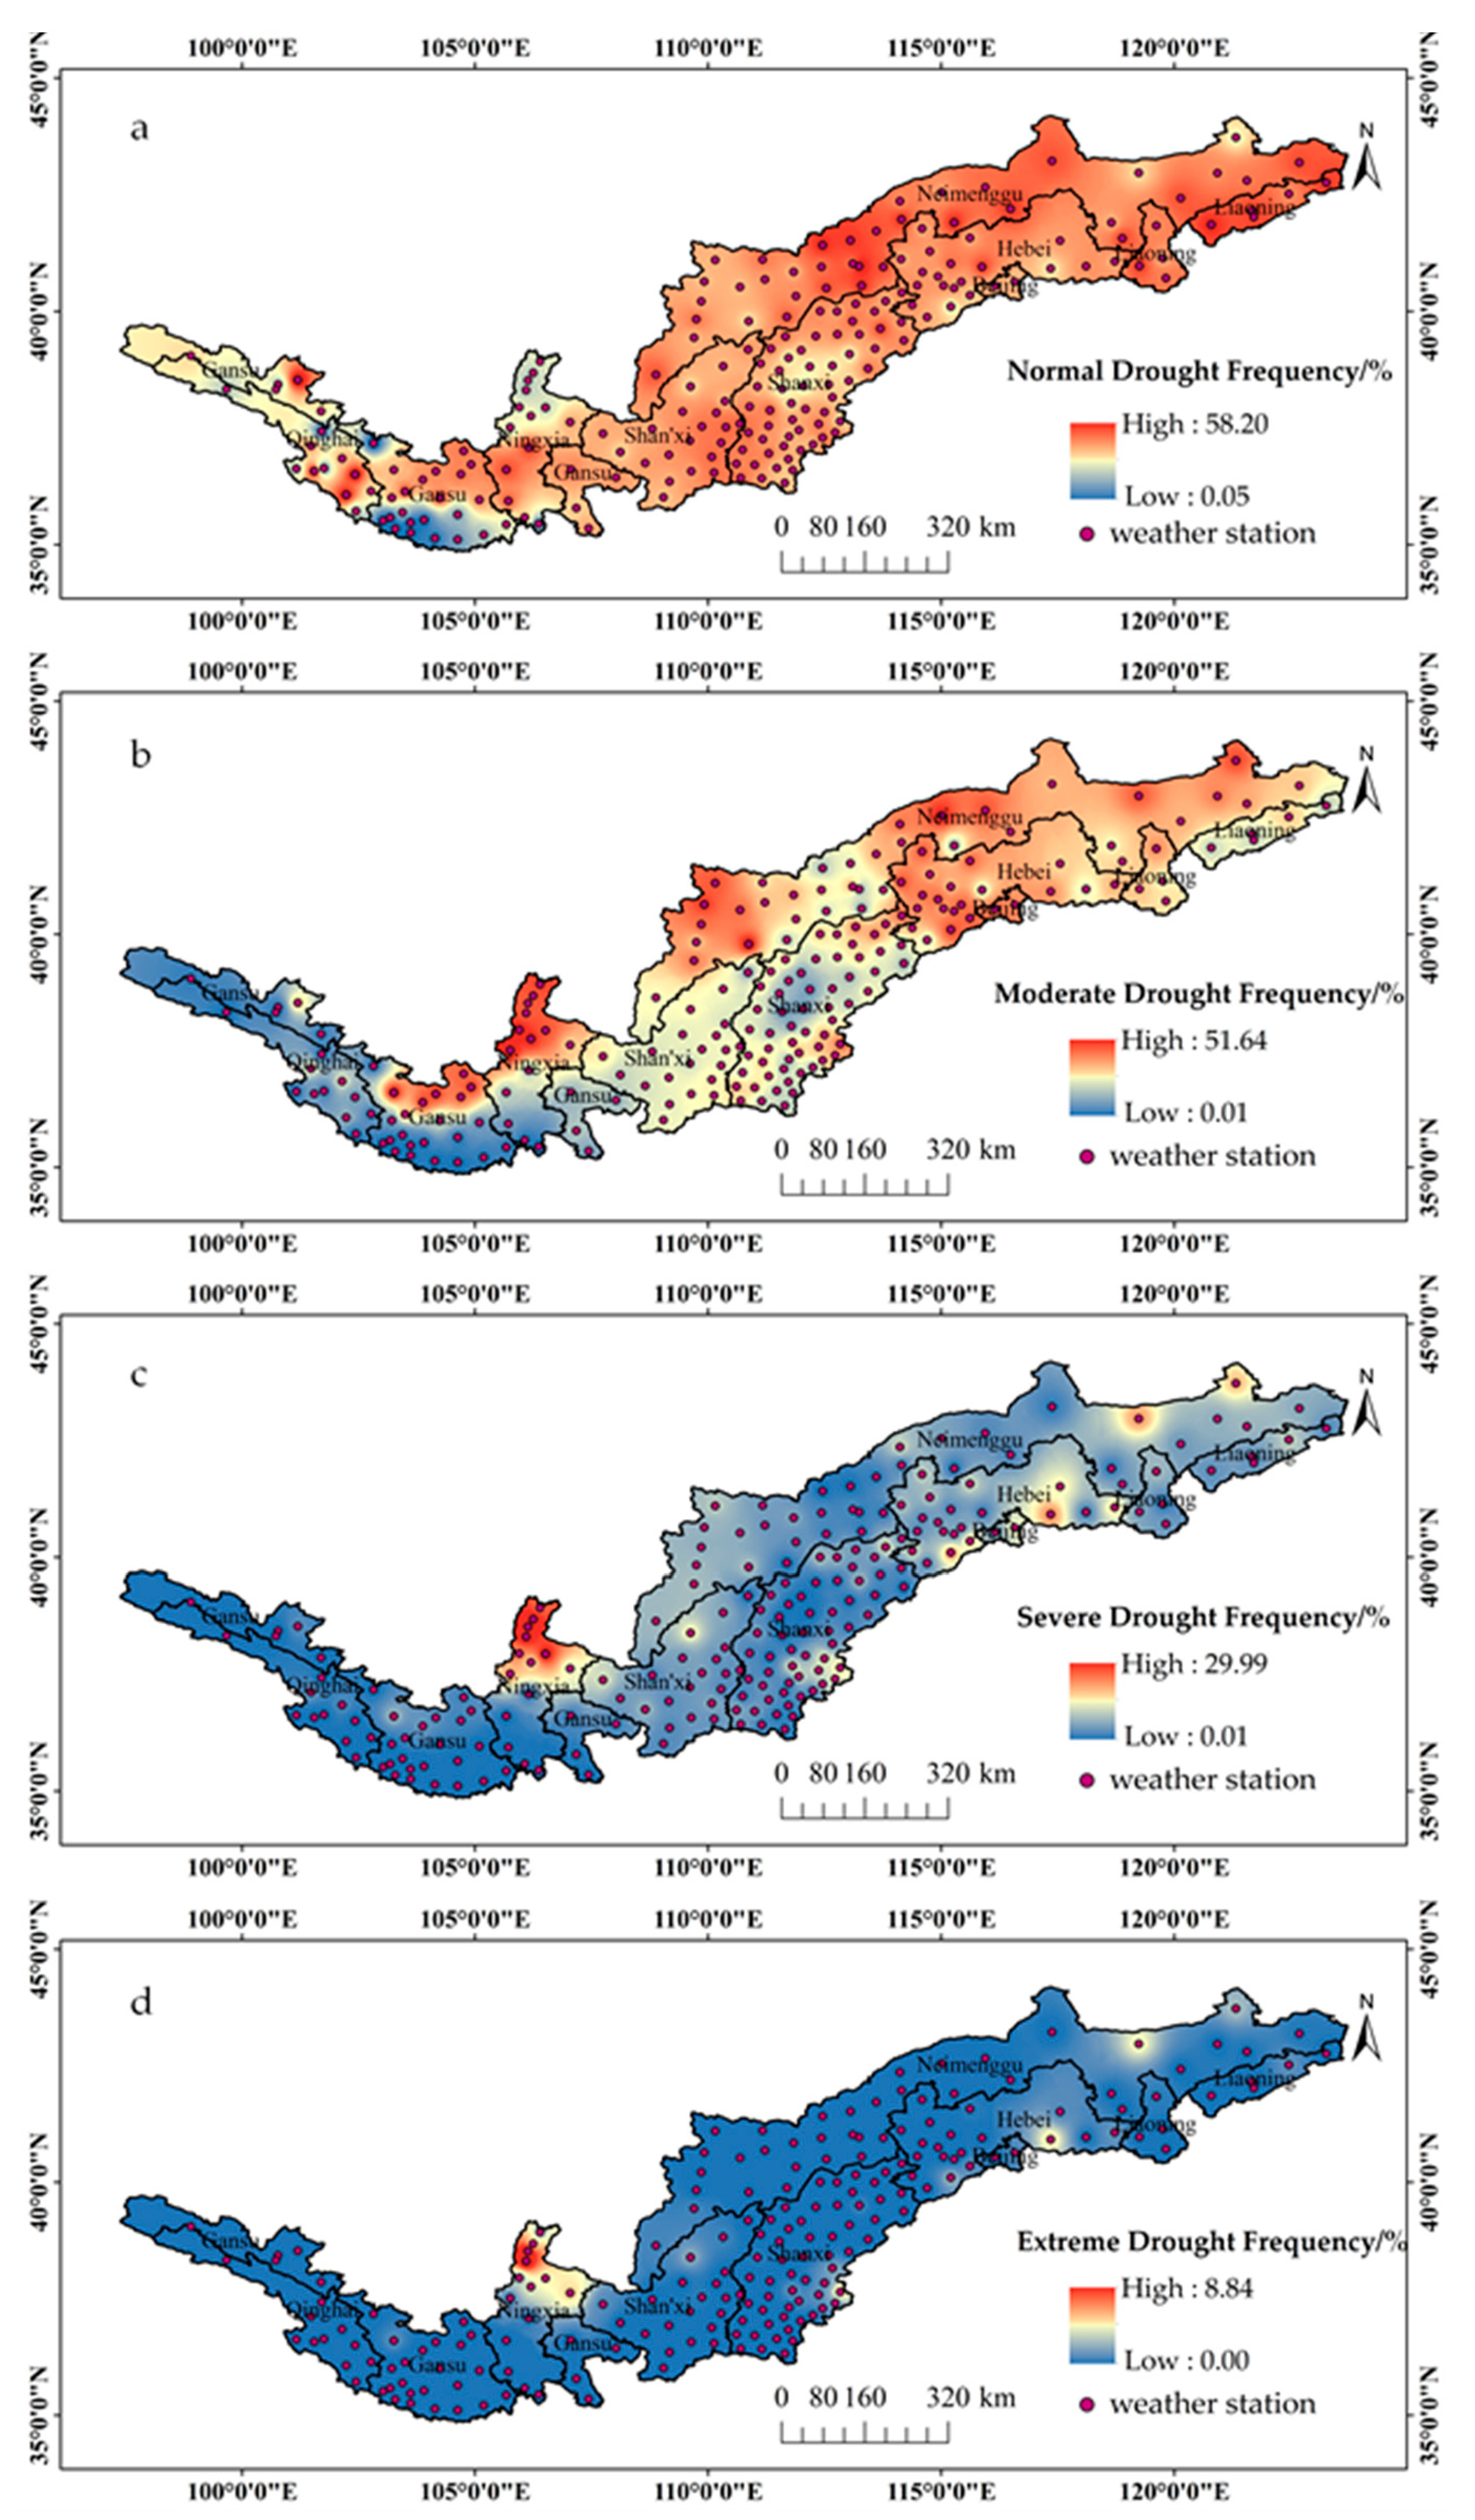
3.2.2. Spatial Distribution Characteristics

To analyze the spatial distribution characteristics of drought frequency during the spring sowing period along the Great Wall region over the past 64 years, the drought frequency (ratio of drought years to total years) for each station was calculated. Based on the inverse distance weighting method, the spatial distribution map of drought frequency along the Great Wall region was produced (Figure 7). Drought frequency was classified from low to high as follows: low drought (below 20%), mild drought (20–40%), moderate drought (40–60%), severe drought (60–80%), heavy drought (80–90%), and extreme drought (90–100%).
As shown in Figure 7, the drought frequency during the spring sowing period ranges from 0.00% to 100.00%, with an average value of 77.91%. There is significant variation in regional drought frequency, generally showing a high incidence of drought. Spatially, the distribution generally shows higher frequencies in the east and north, and lower frequencies in the south.
Low drought areas are mainly located in the southern part of Gansu, accounting for 1.89% of the total area along the Great Wall. Mild drought areas are sporadically distributed in Gansu and Qinghai, accounting for 5.26% of the area. Moderate drought areas are mainly in Qinghai, Gansu, and central Shanxi, accounting for 8.13% of the area. Severe drought areas are primarily in western Gansu and central Shanxi, accounting for 14.84% of the area. Heavy drought areas are mainly in most parts of Shaanxi and the northern and southern parts of Shanxi, accounting for 29.67% of the area. Extreme drought areas are mainly in northern Gansu, northern Ningxia, most parts of Inner Mongolia, most parts of Hebei, Beijing, and parts of Liaoning, accounting for 40.21% of the area.
A spatial analysis of drought frequencies at each station over the 64-year period was further conducted (Figure 8). Figure 8a–d represent the spatial distribution of the frequency of normal drought, moderate drought, severe drought, and extreme drought, respectively. From Figure 8, it is shown that the frequency of mild drought is higher in the northern and northeastern regions, with some areas reaching a drought frequency of 58.20%. In contrast, the frequency of mild drought is relatively lower in the southern and southwestern regions, with some areas having as low as 0.05%. Similarly, the frequency of moderate drought is also higher in the northern regions, with a maximum of 51.64%, while the southern regions have a lower moderate drought frequency. Overall, the spatial distribution trend in moderate drought is similar to that of mild drought, but the extent of moderate drought is smaller in comparison. The frequency of severe drought significantly decreases, with high-frequency areas limited to small regions in the north and northwest, with a maximum frequency of 29.99%. In most areas, especially in the south, the frequency of severe drought is very low, approaching 0.01%. The frequency of extreme drought is generally low across the entire region, with a maximum of 8.84%, occurring only in small areas in the north. In most regions, the frequency of extreme drought is extremely low, close to 0, indicating that extreme drought events are relatively rare in this region.
To analyze the changes in drought frequency (drought days/total days) during the spring sowing period each year over the past 64 years at each station along the Great Wall region, a heat map of drought frequency during the spring sowing period from 1960 to 2023 was created using the Heml platform (Figure 9), and hierarchical clustering was used for the cluster analysis of the stations.
From Figure 9, it can be seen that the drought frequency during the spring sowing period ranges from 0% to 100%, with years of 0% drought frequency accounting for 16.52% and years of drought occurrence accounting for 83.49%. The frequency of drought occurrence is mainly concentrated in the 90–100% range, accounting for 62.77% of the total droughts. Analyzing each station, five stations have a drought frequency of less than 20%, mainly in Gansu. Among the remaining stations, 78.84% have a drought frequency reaching 80%, and 52.91% have a drought frequency of over 90%. Sixteen stations have a drought frequency of 100%, mainly located in Inner Mongolia, Ningxia, Gansu, and Hebei. The clustering results show that the drought frequency of each station can be clearly grouped into three categories, consistent with the results of the spatial distribution map.
In 1962, except for the Menyuan (52765) station in Qinghai Province and the Chengde (54430) station in Hebei Province, all other stations experienced drought, with 88.02% of the stations in a drought state throughout the spring sowing period. In 2011, except for the Menyuan (52765) and Huangyuan (52855) stations in Qinghai Province and the Guanghe (52982) and Hezheng (52985) stations in Gansu Province, all other stations experienced drought, with 67.89% of the stations in a drought state throughout the spring sowing period.
In 1990, 73.19% of the stations were drought-free throughout the spring sowing period, while 9.28% of the stations were in a drought state throughout the period, all located in Inner Mongolia and Gansu. In 1964, 66.50% of the stations were drought-free throughout the spring sowing period, while 3.60% of the stations were in a drought state throughout the period, all located in Inner Mongolia and Gansu. In 15.63% of the years, 95% of the stations experienced drought.

3.3. Drought Center Analysis

Based on the drought frequency during the spring sowing period along the Great Wall region from 1960 to 2023, the centroid model was used to calculate the centroid of drought frequency, its migration trajectory, and its standard deviation ellipse over the 64 years (Figure 10). The migration direction and distance relative to the previous decade were also determined (Table 2).
From Figure 10, it can be seen that the centroid of drought frequency during the spring sowing period shows a northeast–southwest distribution pattern across decades, with significant differences in drought frequency in the southwest–northeast direction and smaller differences in the northwest–southeast direction. The main area is between 38.625° N–39.740° N and 109.304° E–113.184° E along the central part of the Great Wall region.
Regarding migration direction, during the spring sowing period in the 1970s, 1980s, 1990s, 2000s, and 2000–2023, the drought centroid migrated to the west, southeast, west, southwest, and northeast, respectively, with migration distances of 5.570 km, 9.865 km, 7.529 km, 21.708 km, and 53.691 km, respectively. The migration direction and distance indicate that the drought intensity difference was smaller before the 1990s and larger after the 1990s. From 1960 to 2009, the drought centroid generally migrated southwest. From 2010 to 2023, the drought centroid generally migrated northeast. The centroid of drought frequency was distributed within the borders of Kelan County, Wuzhai County, and Shenchi County in Shanxi Province.
The centroid of drought frequency during the spring sowing period across years shows a northeast–southwest distribution pattern, with a more easterly distribution than across decades. There are significant differences in drought frequency in the southwest-–northeast direction and smaller differences in the northwest–southeast direction. The migration extent across years is larger, mainly located between 38.928° N–39.325° N and 111.522° E–111.911° E along the central part of the Great Wall region.
Over the 64 years, the maximum migration distance of the drought frequency centroid was 282.593 km towards the northeast from 1964 to 1965, followed by 220.403 km towards the northeast from 2013 to 2014. Overall, the average centroid of drought frequency distribution is located in Wuzhai County, Shanxi Province. The variation range is 193.813 km in the northeast–southwest direction and 63.747 km in the northwest–southeast direction.
The drought centroids in 1962, 1964, 1969, 1976, 1979, 1998, 2008, 2009, and 2010 were located in Shaanxi Province, while the drought centroids in 1983 and 1990 were located in Inner Mongolia. In other years, the drought centroids were located in Shanxi Province, mainly concentrated in Wuzhai County, Shenchi County, Hequ County, and the Shuozhou area.

4. Discussion

This study calculates the daily meteorological comprehensive drought index (MCI) for the spring sowing period from 1960 to 2023 at 195 stations along the Great Wall region. It investigates the temporal and spatial evolution characteristics of drought intensity and frequency on a daily and annual scale, discovering that the MCI values during the spring sowing period over the past 64 years show an overall decreasing trend, indicating that drought conditions are generally intensifying, despite some signs of relief in certain years.
In the study area, drought conditions in Inner Mongolia have worsened significantly. The spatial distribution characteristics of drought align with the findings of Zhang Weijie et al. [37], showing that the drought intensity and frequency in Inner Mongolia are higher than those in other regions. This can be attributed to the atmospheric evolution characteristics of insufficient precipitation in spring, the weakening of the West Pacific subtropical high, and the expansion of the Arctic vortex on the western side of the East Asian trough, which generally hinder moisture transport to the East Asian trough during the spring [38]. The results indicate that drought frequency and mild drought in northern Ningxia are higher than in the southern part, consistent with the findings of Yuan Fang et al. [39], who found that spring is a high-incidence season for extreme drought. This is mainly due to the significant influence of the Siberian High and the Mongolian High in northern Ningxia, which often bring dry air during spring, reducing precipitation and leading to frequent droughts [40]. Northern Ningxia, located on the edge of the Loess Plateau, has complex terrain and poor soil water retention. Combined with sparse precipitation, high evaporation, and primarily agricultural and pastoral land use, excessive grazing, and unreasonable farming practices, these factors contribute to the high susceptibility to drought in the spring [39].
In the Qinghai region, drought intensity and frequency during the spring sowing period are relatively alleviated compared to other regions, mainly due to the influence of the southwest monsoon in spring, bringing a certain amount of precipitation and reducing the extent of drought. Additionally, the northeastern part of Qinghai has reasonable land use practices, with high grassland and forest coverage, which helps maintain soil moisture and reduce the impact of drought [39]. The study results indicate that central Shanxi has lower drought severity compared to surrounding areas, consistent with findings by Yuanyuan Xu et al. [41], primarily due to its location between the Taihang and Lüliang Mountains, where the mountainous influence results in relatively higher precipitation and a more humid climate, helping alleviate drought conditions. Northern Shanxi, near the Inner Mongolia Plateau, is significantly affected by the continental climate, with lower precipitation, lower temperatures, and higher evaporation, making the northern region more prone to drought [41,42]. The study results show that the northern parts of Lanzhou and Yinchuan in Gansu Province have higher drought severity compared to other regions, mainly due to the influence of the Siberian High and Mongolian High, which usually bring dry cold air, reducing precipitation. Additionally, the impact of the East Asian winter monsoon results in sparse precipitation during winter and spring, further exacerbating drought [43].
The M-K abrupt change test results indicate that moderate drought showed a significant abrupt change in 1987, and severe drought showed a significant abrupt change in 1999. Between 1986 and 1987, anomalous sea surface temperatures in the Pacific affected global atmospheric circulation patterns, inhibiting Pacific moisture transport and affecting precipitation in northern China, exacerbating drought conditions [43]. A strong El Niño event occurred between 1997 and 1998, profoundly impacting global climate. Although the El Niño event ended in late 1998, its effects continued into 1999 [43,44].
The migration of drought centers has had a profound impact on agricultural practices and policy-making, necessitating adjustments in crop selection, optimization of water resource management, expansion of agricultural insurance coverage, and the development of more flexible regional strategies to effectively address the challenges posed by drought. First, agricultural planting patterns need to be adjusted, with drought-prone areas promoting drought-tolerant crops and making appropriate changes to sowing schedules. At the same time, irrigation infrastructure and water resource management policies should prioritize drought-affected regions, ensuring there is a water supply and promoting the adoption of water-saving technologies. Additionally, agricultural insurance coverage should be expanded to severely drought-affected areas, and drought early warning systems should be strengthened. The government should also provide subsidies and technical support to help farmers cope with drought risks. In the long term, policymakers need to implement differentiated agricultural policies, combining sustainable techniques such as soil improvement and water-saving irrigation, to enhance agriculture’s ability to withstand droughts. Furthermore, multi-sector collaboration should be promoted to ensure the sustainability of agricultural production and food security.
Although the Meteorological Composite Drought Index (MCI) used in this study is effective, different drought indices may have varying sensitivities in identifying droughts. Future research should consider using multiple drought indices (such as the SPI, SPEI, etc.) for comparative analysis, enabling a comprehensive identification of the complex effects of climate change on drought. Additionally, this multi-index approach could help assess the sensitivity of different drought indices, revealing broader drought characteristics. This study mainly relies on meteorological data and does not account for the potential impact of human activities on drought. Human activities may significantly alter soil moisture conditions and the availability of regional water resources, factors that could play a critical role in shaping drought characteristics. Future research should incorporate agricultural activities, irrigation, and land use changes into model analysis to explore how human factors regulate and exacerbate drought impacts. This would provide decision-makers with more practical drought management strategies.

5. Conclusions

The daily scale of the spring sowing period along the Great Wall region experienced multiple mild, moderate, and severe drought events. The cyclical fluctuations of drought intensity were evident, with the periodic variation of drought intensity being most pronounced on an 8–10 year medium-term scale and also showing long-term cyclical drought fluctuations on a 20–30 year scale. In recent decades, the frequency of extreme low values has increased. From 1960 to 2023, the overall drought condition in the study area has intensified, with the ratio of drought stations showing an increasing trend.
Moderate and severe drought frequencies showed significant abrupt changes in 1987 and 1999, respectively, both transitioning from a decreasing to an increasing trend. The frequency of drought occurrence during the spring sowing period along the Great Wall region is high, with increasing frequencies of moderate and severe droughts and a decreasing frequency of mild droughts. The most severe period was in the early 2000s, with the entire study area being prone to moderate and severe droughts. The spatial distribution of drought severity showed higher values in the east and north and lower values in the west and south. Overall, except for the southern areas of Qinghai and Gansu, other regions experienced moderate or higher drought levels.
The centroid of drought frequency during the spring sowing period across decades and years showed a northeast–southwest distribution pattern, with significant differences in drought frequency in the southwest–northeast direction and smaller differences in the northwest–southeast direction.

Author Contributions

Conceptualization, J.W. and M.H.; methodology, W.S. and X.H.; software, G.W.; data curation, J.Z., X.H. and G.W.; writing—review and editing, G.W. and W.Z.; funding acquisition, J.W. All authors have read and agreed to the published version of the manuscript.

Funding

Supported by the National Key R&D Program, Project No. 2021YFD1901101; Shanxi Province Major Special Fund for Science and Technology, Project No. 202101140601026, Key Project of Shanxi Province’s Key R&D Program, Project No. 201703D211002-2-1.

Data Availability Statement

The data presented in this study are available on request from the corresponding author.

Conflicts of Interest

The authors declare no conflicts of interest.

References

  1. Tye, M.R.; Dagon, K.; Molina, M.J.; Jadwiga, H. Indices of extremes: Geographic patterns of change in extremes and associated vegetation impacts under climate intervention. Earth Syst. Dyn. Discuss. 2022, 13, 1233–1257. [Google Scholar] [CrossRef]
  2. Chu, Y.; Yang, D.; Wang, X.; Li, Z.; Tang, X. Research on Drought Characteristics in the Lijiang River Basin Based on Standardized Precipitation Evapotranspiration Index from 1980 to 2019. Water Sav. Irrig. 2024, 1, 77–86. [Google Scholar]
  3. Lin, J.; Chen, J.J.; Lou, P. Temporal and spatial changes of drought in Beijing-Tianjin-Hebei region based on remote sensing technology. Int. Arch. Photogramm. Remote Sens. Spat. Inf. Sci. 2020, 10, 747–753. [Google Scholar] [CrossRef]
  4. Mu, Y.; Liu, Y.; Yan, R.; Luo, P.; Liu, Z.; Sun, Y.; Wang, S.; Wei, Z.; Zha, X. Analysis of the Ongoing Effects of Disasters in Urbanization Process and Climate Change: China’s Floods and Droughts. Sustainability 2023, 16, 14. [Google Scholar] [CrossRef]
  5. Shilky; Patra, S.; Ekka, P.; Kumar, A.; Saikia, P.; Khan, M.L. Climate Change: A Major Challenge to Biodiversity Conservation, Ecological Services, and Sustainable Development. Biodivers. Conserv. 2023, 9, 577–592. [Google Scholar]
  6. Chen, C.; Ruan, T.; Luo, G.; Gao, C. Response of winter wheat drought to meteorological drought above the Bengbu Sluice in the Huaihe River. J. Nat. Disasters 2019, 28, 113–124. [Google Scholar]
  7. Tong, D.; Bai, Y.; Zhang, S.; Liu, Q.; Yang, J. Applicability of Drought Severity Index (DSI) in Remote Sensing Monitoring of Drought in Shandong Province. Chin. J. Agrometeorol. 2020, 41, 102–112. [Google Scholar]
  8. Sun, Z.; Zhang, Q.; Sun, R.; Deng, B. Characteristics of the extreme high temperature and drought and their main impacts in southwestern China of 2022. J. Arid Meteorol. 2022, 40, 764–770. [Google Scholar]
  9. Yang, J.; Yang, Y.; Li, Z.; Liao, L.; Gan, R.; Wang, W.; Wang, T.; Liang, L. The regional characteristics of meteorological drought event and its multidimensional factors measurement by daily SPEI in Guangxi, China. Geomat. Nat. Hazards Risk 2022, 14, 117–142. [Google Scholar] [CrossRef]
  10. Shelton, S.; Dixon, R.D. Long-Term Seasonal Drought Trends in the China-Pakistan Economic Corridor. Climate 2023, 11, 45. [Google Scholar] [CrossRef]
  11. Ai, P.; Chen, B.; Yuan, D.; Hong, M.; Liu, H. Dynamic risk assessment of drought disaster: A case study of Jiangxi Province, China. J. Water Clim. Chang. 2020, 12, 1761–1777. [Google Scholar] [CrossRef]
  12. Meitner, J.; Bálek, J.; Bláhová, M.; Semerádová, D.; Hlavinka, P.; Lukas, V.; Jurečka, F.; Žalud, Z.; Klem, K.; Anderson, M.C.; et al. Estimating Drought-Induced Crop Yield Losses at the Cadastral Area Level in the Czech Republic. Agronomy 2023, 13, 1669. [Google Scholar] [CrossRef]
  13. Fang, Z.; Tao, H. Assessing drought disaster hazard in Xinjiang of China using MCI and Gumbel-Copula function. Trans. Chin. Soc. Agric. Eng. 2023, 39, 133–141. [Google Scholar]
  14. Shi, J.; Gan, C.; Zhou, K.; Yuan, L.; Zhang, D. Spatiotemporal distribution of drought and hazard assessment of highland barley in Tibet. Arid Land Geogr. 2023, 46, 1098–1110. [Google Scholar]
  15. Lawrimore, J.H.; Heim, R.R.; Svoboda, M.D.; Swail, V.R.; Englehart, P.J. Beginning a new era of drought monitoring across North America. Bull. Am. Meteorol. Soc. 2002, 83, 1191–1192. [Google Scholar] [CrossRef]
  16. Heim, R.R., Jr. A Review of Twentieth-Century Drought Indices Used in the United States. Bull. Am. Meteorol. Soc. 2002, 83, 1149–1165. [Google Scholar] [CrossRef]
  17. Sánchez Hernández, K.A.; Corzo Perez, G.A. A Comparative Analysis of Spatiotemporal Drought Events from Remote Sensing and Standardized Precipitation Indexes in Central America Dry Corridor. Water Sci. Technol. Libr. 2022, 105, 77–103. [Google Scholar]
  18. Dukat, P.; Bednorz, E.; Ziemblińska, K.; Urbaniak, M. Trends in drought occurrence and severity at mid-latitude European stations (1951–2015) estimated using standardized precipitation (SPI) and precipitation and evapotranspiration (SPEI) indices. Meteorol. Atmos. Phys. 2022, 134, 20. [Google Scholar] [CrossRef]
  19. Vicente-Serrano, S.M.; Begueria, S.; Lopez-Moreno, J.I. A Multiscalar Drought Index Sensitive to Global Warming: The Standardized Precipitation Evapotranspiration Index. J. Clim. 2010, 23, 1696–1718. [Google Scholar] [CrossRef]
  20. Wagan, B.; Zhang, Z.; Baopeing, F.; Wagan, H.; Si, H.; Ahmad, I.; Kabo-bah, A.T. Using the SPI to Interpret Spatial and Temporal Conditions of Drought in China. Outlook Agric. 2015, 44, 235–241. [Google Scholar] [CrossRef]
  21. Liu, X.; Zhu, X.; Pan, Y.; Bai, J.; Li, S. Performance of different drought indices for agriculture drought in the North China Plain. J. Arid Land 2018, 10, 507–516. [Google Scholar] [CrossRef]
  22. Liu, X.; Leng, X.; Sun, G.; Peng, Y.; Huang, Y.; Yang, Q. Assessment of Drought Characteristics in Yunnan Province Based on SPI and SPEI from 1961 to 2100. Trans. Chin. Soc. Agric. Mach. 2018, 49, 236–245+299. [Google Scholar]
  23. Ren, J.; Wang, F.; Lu, X. Spatiotemporal Variation of Drought in Shandong Province Analyzed Using the Standardized Precipitation-evapotranspiration Index. J. Irrig. Drain. 2021, 40, 1672–3317. [Google Scholar]
  24. Khan, M.A.; Riaz, S.; Jiang, H.; Qamar, S.; Ali, Z.; Islamil, M.; Nazeer, A.; Faisal, M.; Satti, S.; Zhang, X. Development of an assessment framework for the proposed Multi-Scalar Seasonally Amalgamated Regional Standardized Precipitation Evapotranspiration Index (MSARSPEI) for regional drought classifications in global warming context. J. Environ. Manag. 2022, 312, 114951. [Google Scholar] [CrossRef]
  25. Ling, M.; Han, H.; Hu, X.; Xia, Q.; Guo, X. Drought characteristics and causes during summer maize growth period on Huang-Huai-Hai Plain based on daily scale SPEI. Agric. Water Manag. 2023, 280, 108198. [Google Scholar] [CrossRef]
  26. Qu, X.; Yang, Q.; Wang, H.; Cao, Q.; Lin, C. Characteristics of Meteorological Drought Intensity in Inner Mongolia Based on MCI. Meteorol. Environ. Sci. 2019, 42, 47–54. [Google Scholar]
  27. Liao, Y.; Zhang, C. Spatio-Temporal distribution characteristics and disaster change of drought in China Based on meteorological drought composite index. Meteorol. Mon. 2017, 43, 1402–1409. [Google Scholar]
  28. Zhang, Y.; Zhi, X.; Li, F. Characteristics of spatiotemporal variation of drought in Henan based on meteorological drought composite index. Sci. Technol. Eng. 2020, 20, 3420–3426. [Google Scholar]
  29. Shi, J.; Dou, Y.; Zhan, X.; Xi, F.; Luo, Z.; Gan, C. Analysis on Change Characteristics of Drought Intensity during the Growth Period of Highland Barley in Tibet. Chin. J. Agrometeorol. 2023, 44, 834–844. [Google Scholar]
  30. Jiang, D.; Huang, G.; Liu, M. Linwangtian—Basic Farmland Construction Model in the Great Wall Area. Soil Water Conserv. Res. 1992, 2, 40–49. [Google Scholar]
  31. Wang, F. Artificial Degradation of Natural Landscapes and Rational Regulation Strategies for Human-Land Systems in Ecologically Fragile Areas—A Case Study of the Great Wall Area in Shanxi, Shaanxi, and Inner Mongolia. Resour. Environ. Arid Reg. 1989, 3, 21–27. [Google Scholar]
  32. Jiang, D.; Huang, G.; Liu, M. History and Prevention Strategies of Soil Erosion Development in the Great Wall Area of Shaanxi, Mongolia, and Shanxi. Bull. Soil Water Conserv. 1986, 3, 38–43. [Google Scholar]
  33. GB/T 20481-2017; Meteorological Drought Level. National Climate Center. Lanzhou Institute of Arid Meteorology. National Meteorological Administration. Forecasting and Network Department of China Meteorological Administration. Standard Press: Beijing, China, 2017; p. 32.
  34. Wang, D.; Chen, X.; Sun, Z.; Xin, Y.; Wang, H.; Chai, H.; Wang, H. Long-Term Monitoring of Remote Sensing Ecological Index Changes in Golmud. Acta Ecol. Sin. 2022, 42, 5922–5933. [Google Scholar]
  35. Gu, X.; Zhang, P.; Zhang, W.; Yang, L.; Pan, J.-Y.; Wang, S.; Lai, X.; Long, A. A Study of Drought and Flood Cycles in Xinyang, China, Using the Wavelet Transform and M-K Test. Atmosphere 2023, 14, 1196. [Google Scholar] [CrossRef]
  36. Zhang, S.; E, C.; Li, X.; Qi, D.; Zhou, L. Characteristics of Winter Precipitation Changes and Centroid Migration in the Qinghai Plateau from 1960 to 2019. J. Nat. Disasters 2023, 32, 118–130. [Google Scholar]
  37. Zhang, W.; Wang, Z.; Lai, H.; Men, R.; Wang, F.; Feng, K.; Qi, Q.; Zhang, Z.; Quan, Q.; Huang, S. Dynamic Characteristics of Meteorological Drought and Its Impact on Vegetation in an Arid and Semi-Arid Region. Water 2023, 15, 3882. [Google Scholar] [CrossRef]
  38. Gao, T.; Si, Y.; Xiao, Y.; Wulan, Y.; Peng, Y.; Gao, J. A seasonal forecast scheme for the Inner Mongolia spring drought. Theor. Appl. Climatol. 2018, 135, 519–532. [Google Scholar] [CrossRef]
  39. Fang, Y.; Qian, H.; Chen, J.; Han, X. Characteristics of Spatial-Temporal Evolution of Meteorological Drought in the Ningxia Hui Autonomous Region of Northwest China. Water 2018, 10, 992. [Google Scholar] [CrossRef]
  40. Tan, C.; Yang, J.; Wang, X.; Qin, D.; Huang, B.; Chen, H. Drought disaster risks under CMIP5 RCP scenarios in Ningxia Hui Autonomous Region, China. Nat. Hazards 2020, 100, 909–931. [Google Scholar] [CrossRef]
  41. Xu, Y.; Chen, Y.; Yang, J.; Zhang, W.; Wang, Y.; Jiaxuan, W.; Cheng, W. Drought in Shanxi Province Based on Remote Sensing Drought Index Analysis of Spatial and Temporal Variation Characteristics. Atmosphere 2023, 14, 799. [Google Scholar] [CrossRef]
  42. Ren, J.; Li, Y.; You, L.; Zhai, D. Analysis of the Trends in Extreme Temperature and Precipitation Changes in Shanxi over the Past 53 Years. Geogr. Geo-Inf. Sci. 2014, 30, 120–126. [Google Scholar]
  43. Zhang, Q.; Yu, Y.; Li, Y.; Huang, J.; Ma, Z.; Wang, Z.; Wang, S.; Wang, Y.; Zhang, Y. Causes and Changes of Drought in China: Research Progress and Prospects. J. Meteorol. Res. 2020, 34, 460–481. [Google Scholar] [CrossRef]
  44. Zhao, T.; Dai, A.; Huang, J.; Zhang, L. Preface to the Special Issue on Causes, Impacts, and Predictability of Droughts for the Past, Present, and Future. Adv. Atmos. Sci. 2023, 41, 191–192. [Google Scholar] [CrossRef]
Figure 1. Location map of the research area along the Great Wall.
Agronomy 14 02195 g001
Figure 2. Daily scale MCI temporal variation characteristics from 1960 to 2023.
Agronomy 14 02195 g002
Figure 3. Annual scale of MCI values and drought station ratio temporal variation characteristics from 1960 to 2023.
Agronomy 14 02195 g003
Figure 4. MCI wavelet transform coefficients and wavelet variance.
Agronomy 14 02195 g004
Figure 5. Drought frequency from 1960 to 2023.
Agronomy 14 02195 g005
Figure 6. M-K statistic chart for drought frequency.
Agronomy 14 02195 g006
Figure 7. Spatial distribution map of drought frequency.
Agronomy 14 02195 g007
Figure 8. Spatial distribution map of drought frequency by level. (a) normal drought frequency, (b) moderate drought frequency, (c) severe drought frequency, (d) extreme drought frequency.
Agronomy 14 02195 g008
Figure 9. Heat map of drought frequency at each station from 1960 to 2023.
Agronomy 14 02195 g009
Figure 10. Migration of the drought frequency centroid from 1960 to 2023.
Agronomy 14 02195 g010
Table 1. Classification of Meteorological Drought Composite Index levels.
LevelTypeMCIDrought Impact Degree
1No Drought−0.5 < MCISurface is moist, crop water supply is sufficient
2Normal Drought−1.0 < MCI ≤ −0.5Surface air is dry, soil has slight moisture deficiency
3Moderate Drought−1.5 < MCI ≤ −1.0Soil surface is dry, soil has moisture deficiency
4Severe Drought−2.0 < MCI ≤ −1.5Soil moisture is severely deficient, surface has dry soil, crops are wilting
5Extreme DroughtMCI ≤ −2.0Soil moisture is severely deficient, thick dry soil layer appears, crops are dying on a large scale
Table 2. Migration trajectory of the drought frequency centroid across decades.
Type1960s1970s1980s1990s2000s2000–2023
Migratory direction-WestSoutheastWestSouthwestNortheast
Migration distance (km)-5.5709.8657.52921.70853.691
Disclaimer/Publisher’s Note: The statements, opinions and data contained in all publications are solely those of the individual author(s) and contributor(s) and not of MDPI and/or the editor(s). MDPI and/or the editor(s) disclaim responsibility for any injury to people or property resulting from any ideas, methods, instructions or products referred to in the content.

