Abstract
Star anise, a widely popular spice, benefits from classification that enhances its economic value. In response to the low identification efficiency and accuracy of star anise varieties in the market, as well as the scarcity of related research, this study proposes an efficient identification method based on non-similarity augmentation and a lightweight cascaded neural network. Specifically, this approach utilizes a Siamese enhanced data network and a front-end SRGAN network to address sample imbalance and the challenge of identifying blurred images. The YOLOv8 model is further lightweight to reduce memory usage and increase detection speed, followed by optimization of the weight parameters through an extended training strategy. Additionally, a diversified fusion dataset of star anise, incorporating open data, was constructed to further validate the feasibility and effectiveness of this method. Testing showed that the SA-SRYOLOv8 detection model achieved an average detection precision (mAP) of 96.37%, with a detection speed of 146 FPS. Ablation experiment results showed that compared to the original YOLOv8 and the improved YOLOv8, the cascade model’s mAP increased by 0.09 to 0.81 percentage points. Additionally, when compared to mainstream detection models such as SSD, Fast R-CNN, YOLOv3, YOLOv5, YOLOX, and YOLOv7, the cascade model’s mAP increased by 1.81 to 19.7 percentage points. Furthermore, the model was significantly lighter, at only about 7.4% of the weight of YOLOv3, and operated at twice the speed of YOLOv7. Visualization results demonstrated that the cascade model accurately detected multiple star anise varieties across different scenarios, achieving high-precision detection targets. The model proposed in this study can provide new theoretical frameworks and ideas for constructing real-time star anise detection systems, offering new technological applications for smart agriculture.
1. Introduction
Spices are highly valued for their aroma and culinary significance, having been integral to human culture and cuisine for centuries. Additionally, they are among the most valuable medicinal plants utilized in the food industry and medical science. Due to variations in their composition and price, classification and grading based on quality levels are crucial [1]. Star anise, as a spice and traditional Chinese medicine with both culinary and medicinal uses, is not only an economically valuable agricultural byproduct but also has extensive medicinal value and cultural significance. In China, star anise is classified as a food and medicinal plant and has been continuously included in the Chinese Pharmacopoeia [2], highlighting its significant potential for development and application. According to the European Pharmacopoeia [3], both star anise fruit and star anise essential oil have expectorant and antispasmodic properties, making them highly valuable medicinally.
In the traditional Chinese medicine market, the prices of different varieties of star anise vary significantly due to their different chemical compositions. Among them, the Dahong star anise, commonly referred to as autumn produce, has plump fruit segments, a brownish red color, a strong aroma, the best quality, and the highest market value [4]. The Jiaohua star anise, commonly known as spring produce, has a lighter scent, a weaker aroma, a reddish brown color, slightly lower quality, and a slightly lower price. The Ganzhi branch star anise, which is harvested late, air-dried, and often collected after falling, is black red, of poor quality, and the least expensive.
In recent years, as the demand for star anise trade continues to grow, the overall yield rate of high-quality star anise has become increasingly important. This rate is also a crucial standard for evaluating the overall quality of single batches in import and export. Therefore, the ability to quickly and accurately sort different types of star anise is crucial not only for improving overall quality but also for enhancing the added value of agricultural products, making it of great practical significance. Machine vision, as a rapid and non-destructive detection method [5], has a wide range of applications in agriculture, including crop seed screening, crop pest and disease monitoring, grain detection, and plant phenotyping. In recent years, its rapid development in agriculture has recently made the non-destructive detection of agricultural products feasible [6]. Machine vision algorithms are mainly categorized into traditional machine learning algorithms and more advanced deep learning algorithms. Star anise, a small-scale agricultural product, is typically studied using traditional image detection methods that integrate machine learning with features such as color and texture to achieve classification and recognition. Minhui An et al. [7] classified walnut shells and kernels using SVM and ELM methods in the near-infrared spectrum, achieving 97% accuracy. Yanqiu Zhu et al. [8] used the PLS-DA algorithm in near-infrared spectroscopy to differentiate and classify corn seeds from different years, achieving 88.75% classification accuracy. Junyan Xu et al. [9] collected spectral data characteristics of walnut mold at different stages, preprocessed the spectra using SNV, extracted feature bands with PCA, and modeled the feature bands using SVM, achieving 93% overall classification accuracy. Santos et al. [10] classified papayas of different maturity levels using a random forest method, achieving 94.3% classification accuracy on the cross-validation set. Although machine learning methods are simple and efficient, they have limited sample processing capabilities and poor generalization and robustness, making them less suitable for practical implementation or deployment. In contrast, deep learning offers robust sample processing capabilities, faster speeds, and higher recognition accuracy, overcoming the limitations of traditional machine learning methods. As a result, it has gradually become a key branch in agricultural material detection [11].
Deep learning algorithms based on machine vision are developing rapidly and are widely used in scientific research in agriculture [12], animal husbandry [13], and other fields, including sensor monitoring, automation, and robotic operations. Recent explorations by domestic and international scholars into the detection and grading of fields such as food [14] and traditional Chinese medicinal materials [15] have provided valuable references for the classification of star anise varieties. Depending on the dataset, feature selection, and problem complexity, each method has its own advantages and limitations, highlighting the importance in selecting the appropriate approach for different scenarios. Wang et al. [16] proposed the WT-YOLOM model to detect endogenous impurities in walnut kernels, combining SPPF and MobileNet modules for improvements, achieving a recognition accuracy of 94.4%. Xue et al. [17] used the Faster R-CNN model to detect defects in ginseng, a traditional Chinese medicinal material, with an accuracy of up to 95%. Feiyun Wang et al. [18] improved YOLOv5 by integrating the DSConv module and using EIOU as the loss function to achieve real-time, efficient, non-destructive detection of various kiwi fruit defects. The improved model reduced the training loss by 0.013, decreased the number of parameters, and achieved an overall accuracy of 97.7%. Yang et al. [19] added DSConv to YOLOv8s to reduce the model size and incorporated feature enhancement modules to improve recognition accuracy for efficient detection of different tomato varieties, achieving an mAP of 93.4%. Liu et al. [20] improved the YOLOv5 algorithm by adding the lightweight upsampling operator CARAFE to reduce the workload of manual cottonseed sorting. Results showed that the detection mAP for uncoated cottonseeds reached 99.5%, and for coated cottonseeds, it reached 99.2%, achieving efficient detection. Xie et al. [21] combined deformable convolutions and spatial pyramids to construct the Tea-YOLOv8s model, achieving multi-feature fusion. The study results showed that the average recognition accuracy for tea buds was 88.27%, with an inference time of 37.1 ms. Zhao et al. [22] proposed an enhanced model based on YOLOv7 to improve plant disease detection, using the DW-ELAN structure to reduce model parameters and computational load. The improved model achieved mAP, F1 score, and Recall of 96.75%, 94%, and 89.69%, respectively. These studies demonstrate that YOLO models have high accuracy and strong generalization, allowing for tailored improvement plans based on the characteristics and scenarios of the detection targets, making them suitable for application and deployment in agriculture.
At the same time, image blurring is a significant issue that needs to be addressed in the agricultural field. In practical applications, image acquisition is often affected by factors such as machine vibration, operating speed, and occlusion, leading to low-resolution, blurred, and defocused images [23], which is the challenge and research difficulty.
In summary, several main issues exist. First, research on star anise in the field of computer vision is limited, with a lack of reference frameworks. Second, the current related research mainly uses machine learning methods, with small sample sizes and poor model generalization, making future deployment in practical applications difficult. Third, in real detection environments, due to fast detection speeds and high model frame rates, low-resolution or blurred images often occur. To address these issues, this paper explores star anise variety detection technology using machine vision, focusing on star anise from Funing, Yunnan Province. Leveraging the YOLOv8 model, the study develops a high efficiency detection network, SA-SRYOLOv8, specifically designed for star anise through lightweight improvements, integration of a front-end SRGAN network, non-similar data augmentation, and optimized training strategies. The research results of this study provide theoretical support and an important reference for the classification of star anise varieties.
2. Materials and Methods
2.1. Experimental Setup
The star anise samples selected for this study were sourced from Funing County in Wenshan Prefecture, Yunnan Province. Funing is located in the eastern region of the Wenshan Zhuang and Miao Autonomous Prefecture, spanning from 105°13′ to 106°12′ east longitude and 23°11′ to 24°09′ north latitude. Funing star anise is a specialty of Yunnan Province and has a national agricultural product geographical indication. According to the Chinese national standard (GB/T 7652—2016) [24], star anise is typically classified into three categories: Dahong, Jiaohua, and Ganzhi.
After being harvested, star anise undergoes prolonged processing and storage. During humid rainy seasons, it is prone to mold or aflatoxin contamination, affecting human dietary health. Additionally, in the market, it is often mixed with broken segments or extra lobes, severely impacting its quality. To better study the classification of star anise varieties, this report categorizes these issues as non-conforming types, resulting in four categories in total: Dahong, Jiaohua, Ganzhi, and Buhege.
2.2. Image Data Collection
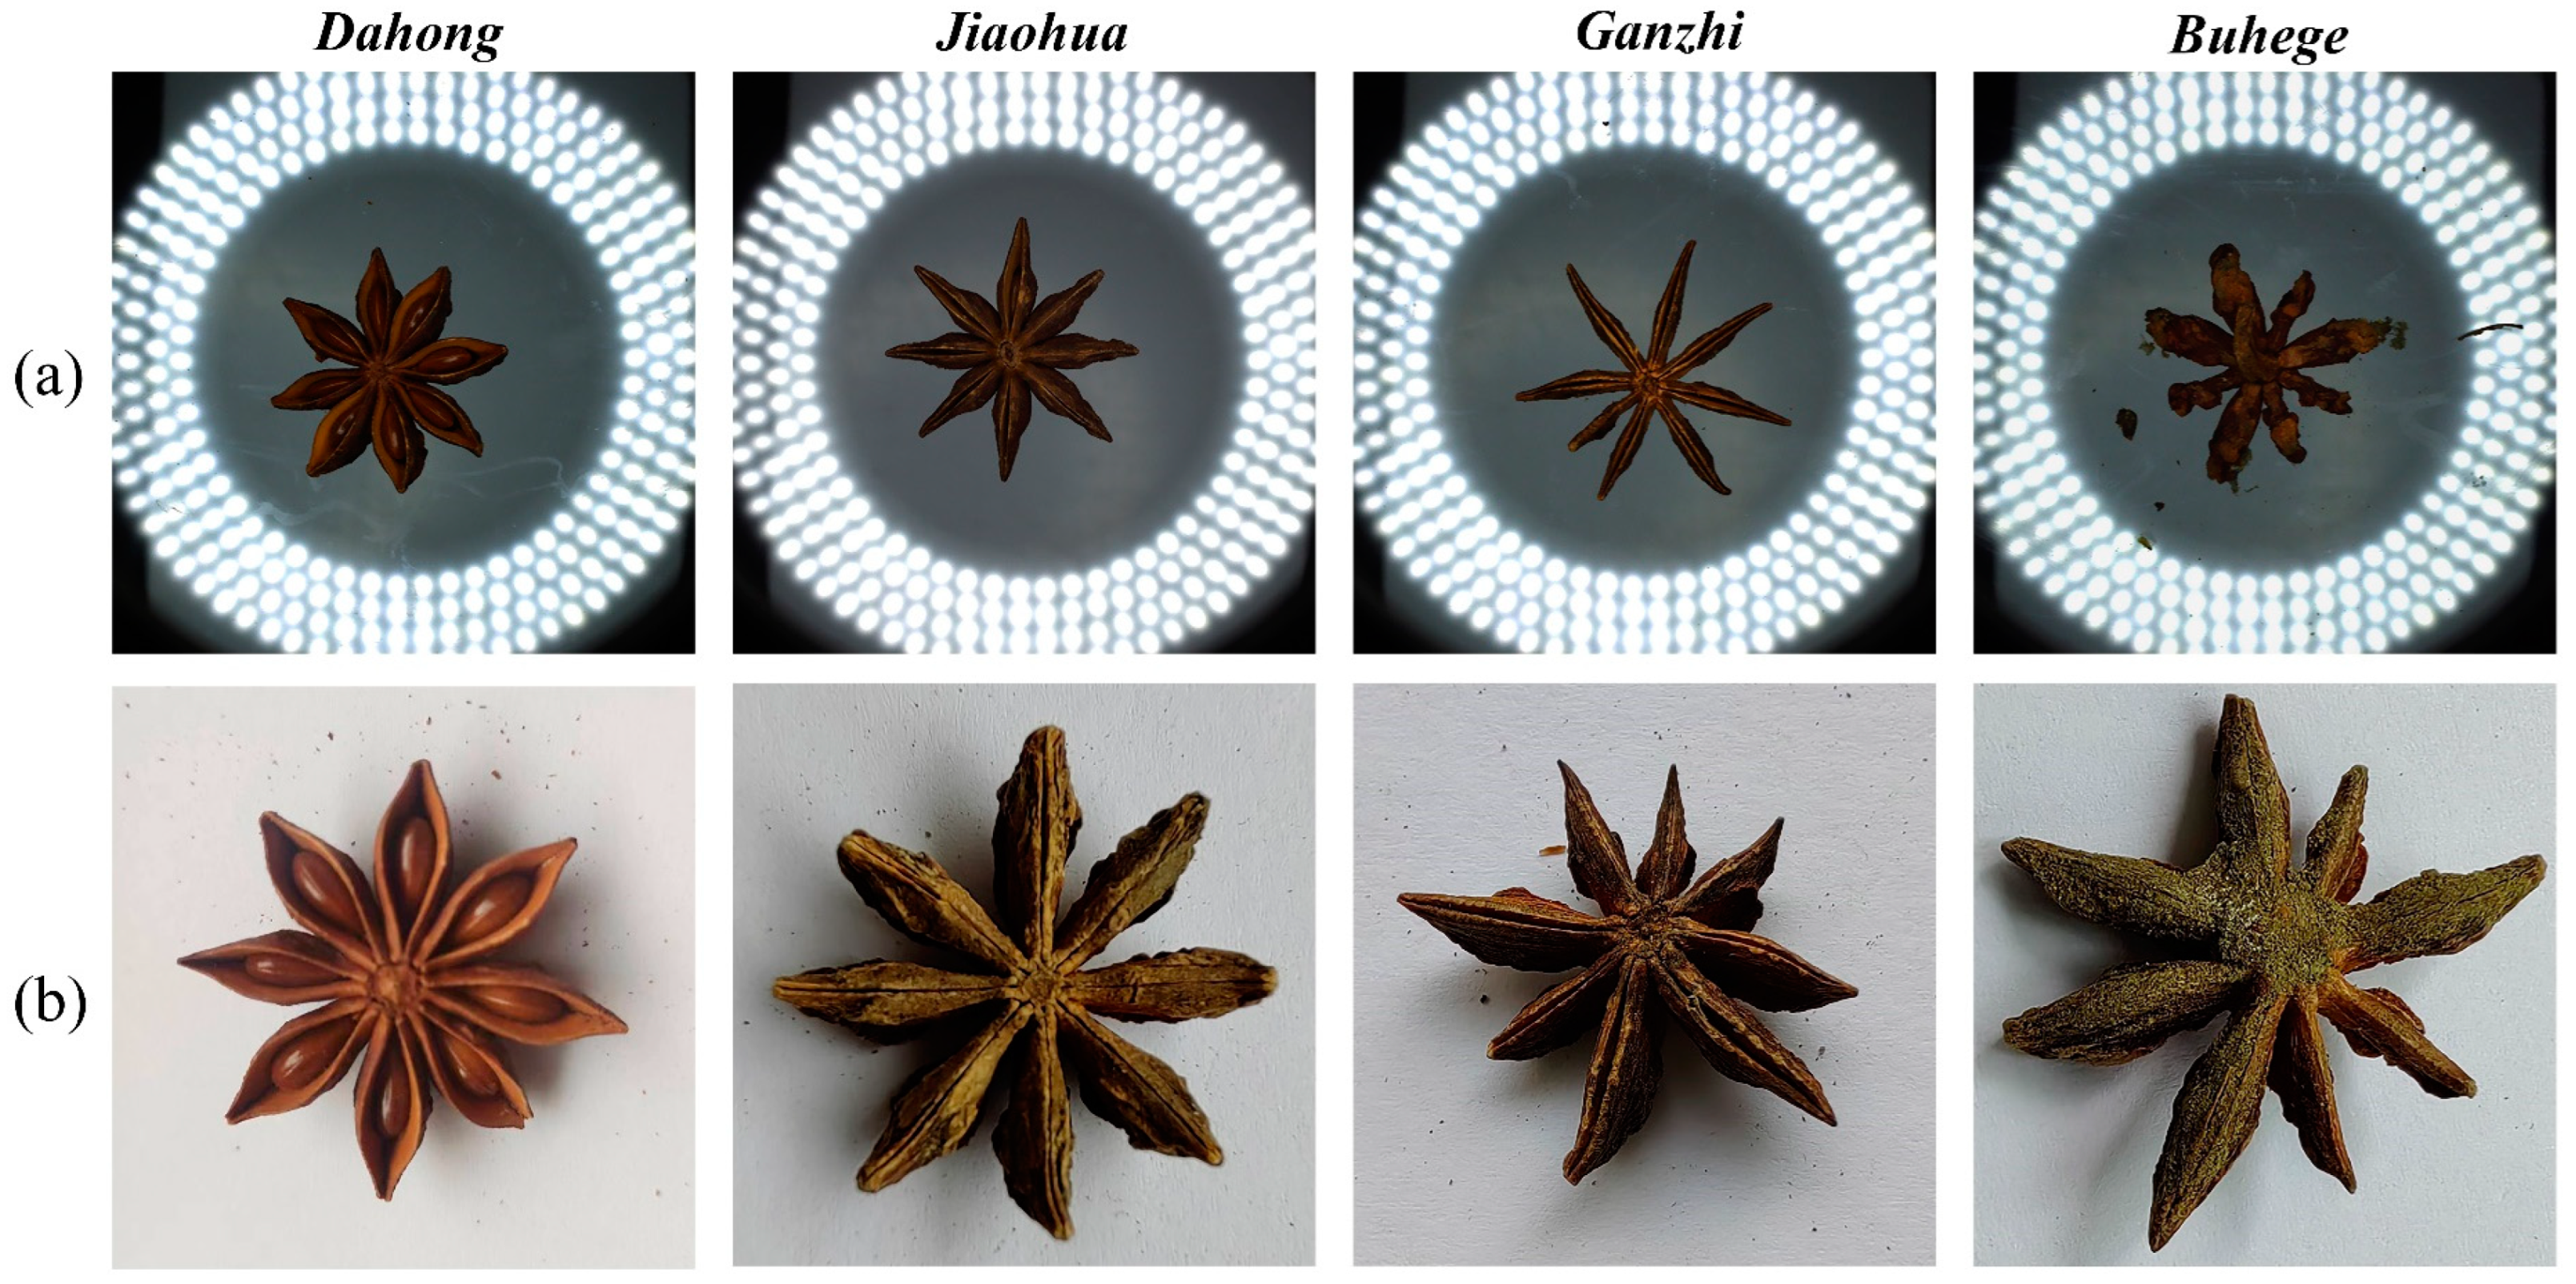
In this study, star anise of Funing County, Wenshan Prefecture, Yunnan Province, was selected as the research object. Under the guidance of agronomy experts and in strict accordance with the national standard (GB/T 7652—2016), careful selection was made to identify the Dahong, Jiaohua, and Ganzhi varieties, with additional Buhege samples collected. The different varieties of star anise are shown in Figure 1, including Dahong (plump fruit segments, brownish red color, the best quality), Jiaohua (reddish brown color, slightly lower quality), Ganzhi (often collected after falling, black red, poor quality), and Buhege (moldy, bad, or with broken and incomplete segments).
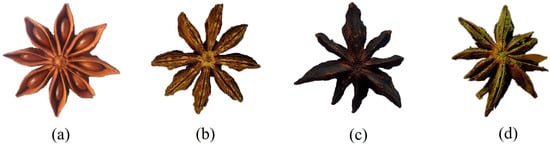
Figure 1.
Images of different star anise varieties: (a) Dahong; (b) Jiaohua; (c) Ganzhi; (d) Buhege.
Image Acquisition
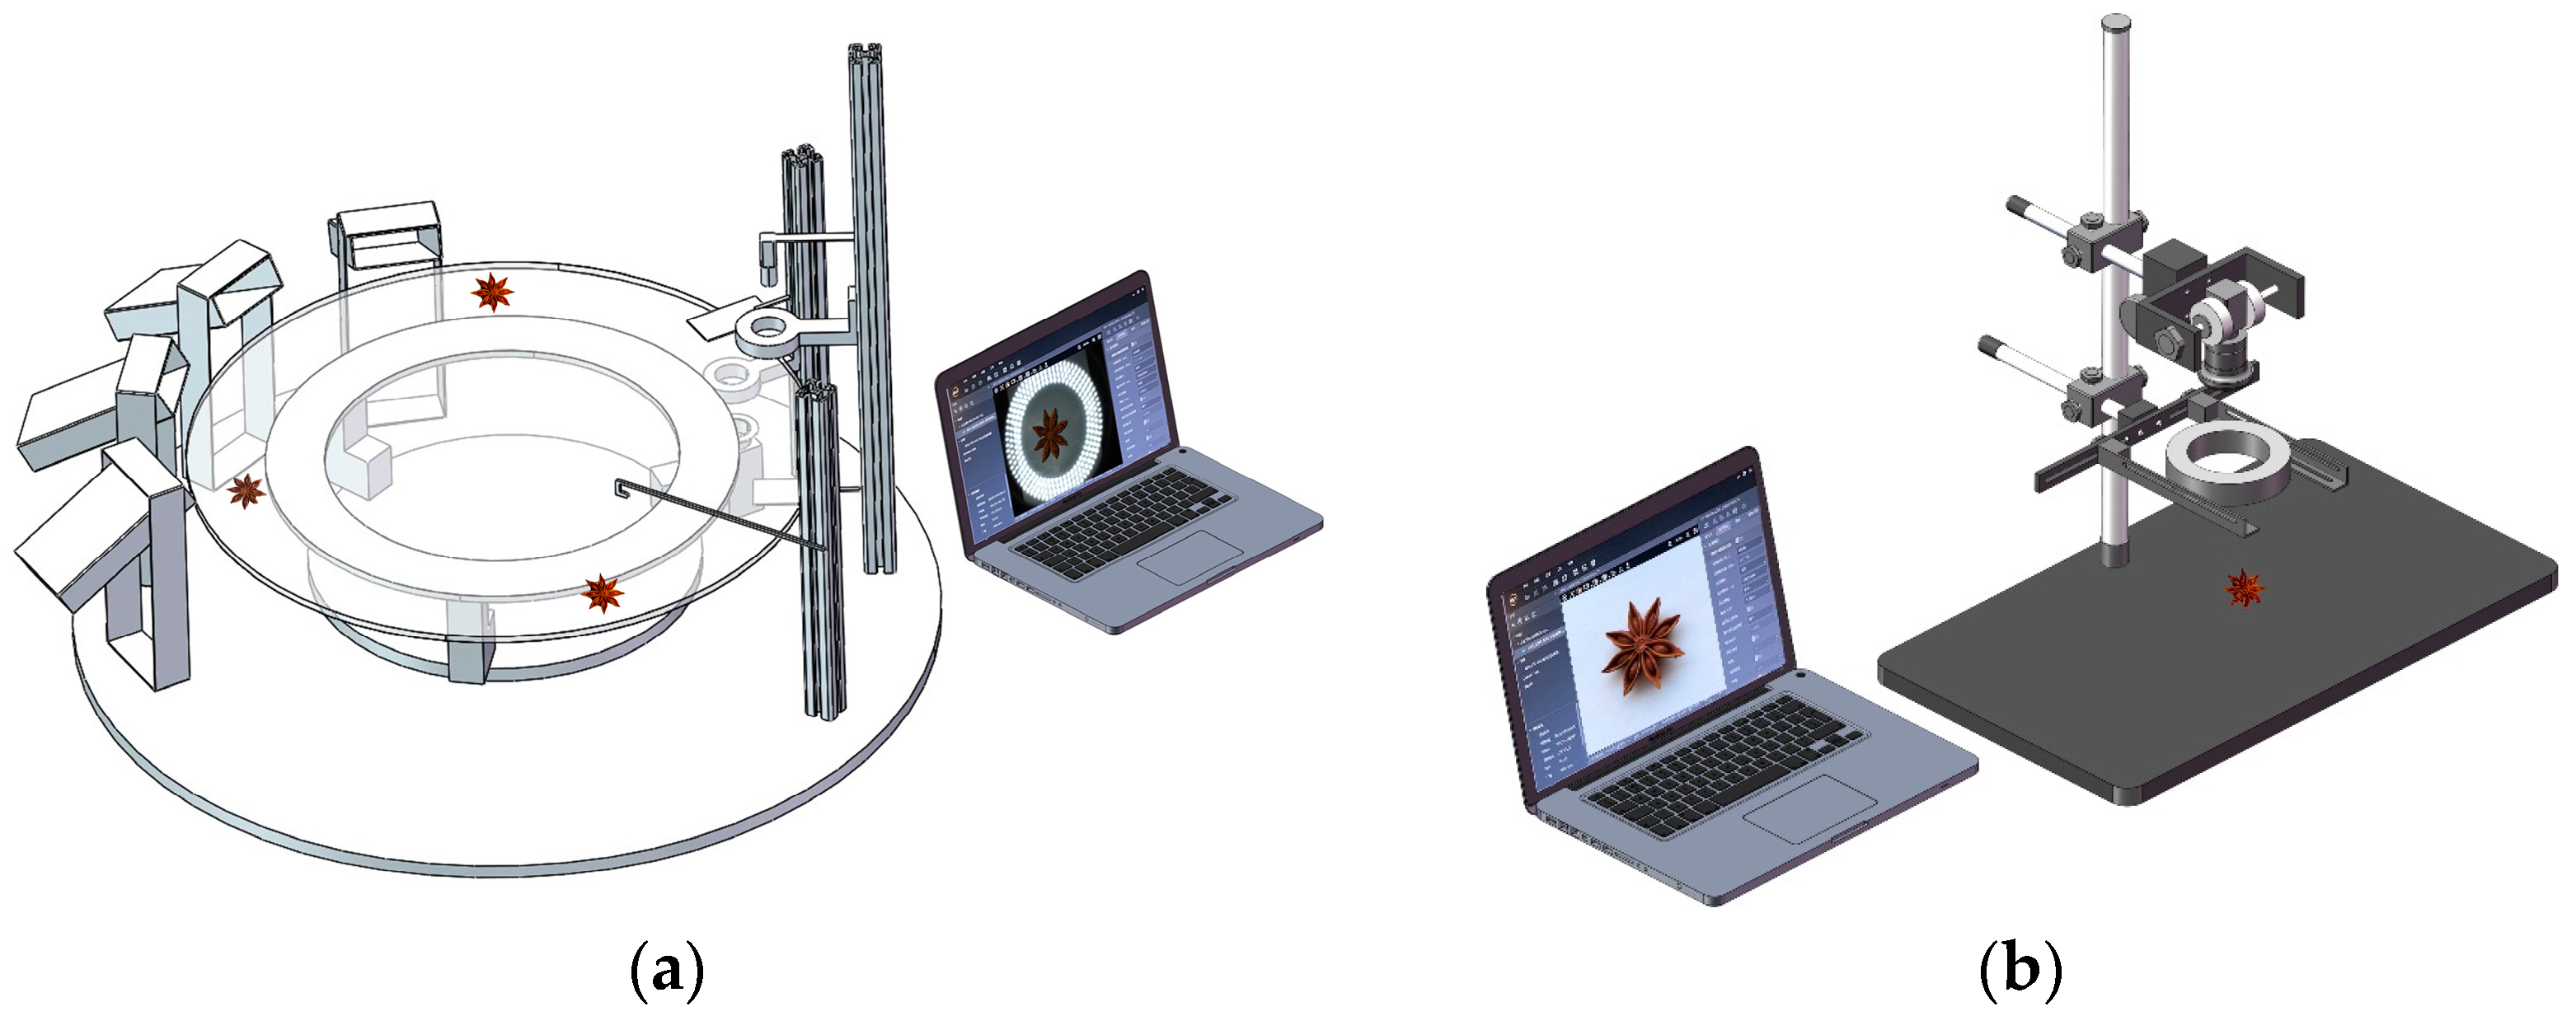
The RGB images used for analysis were collected by the Agricultural Materials Laboratory at Kunming University of Science and Technology. The first period images were captured on a turntable testing device between 7 and 10 March 2024. For image acquisition, a Hikvision industrial camera (MV-CA013-20GC, 1.3 megapixels, resolution 1280 × 1024) was employed, capturing a total of 11,253 images. During the second period of image acquisition, a high-resolution camera was employed. The camera was securely mounted on an adjustable stand 27 cm above the horizontal surface, and all images were taken under the same conditions from 16 to 21 March 2024. A total of 2083 images were collected. The images collected during both periods were saved in .jpg format. For image annotation, the LabeIImg software version 1.8.1 was used, and the dataset format was based on Pascal VOC 2007, generating XML files containing dataset names, location information, and label names. These files were then converted to the txt format required for YOLO training using Python programming. The equipment used in this study is shown in Figure 2.

Figure 2.
Experimental collection equipment: (a) glass turntable collection device; (b) high-resolution camera.
The image results collected in the Agricultural Material Laboratory for this study are shown in Figure 3. Images a and b represent pictures collected by the turntable and high-resolution camera, respectively. The four small images represent different varieties of star anise.
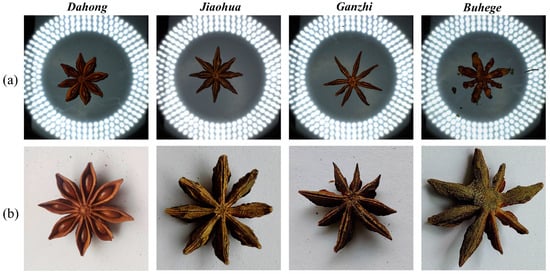
Figure 3.
Experimental collection results: (a) turntable experimental images; (b) high-resolution camera experimental images.
2.3. Image Preprocessing
2.3.1. Non-Similar Image Selection
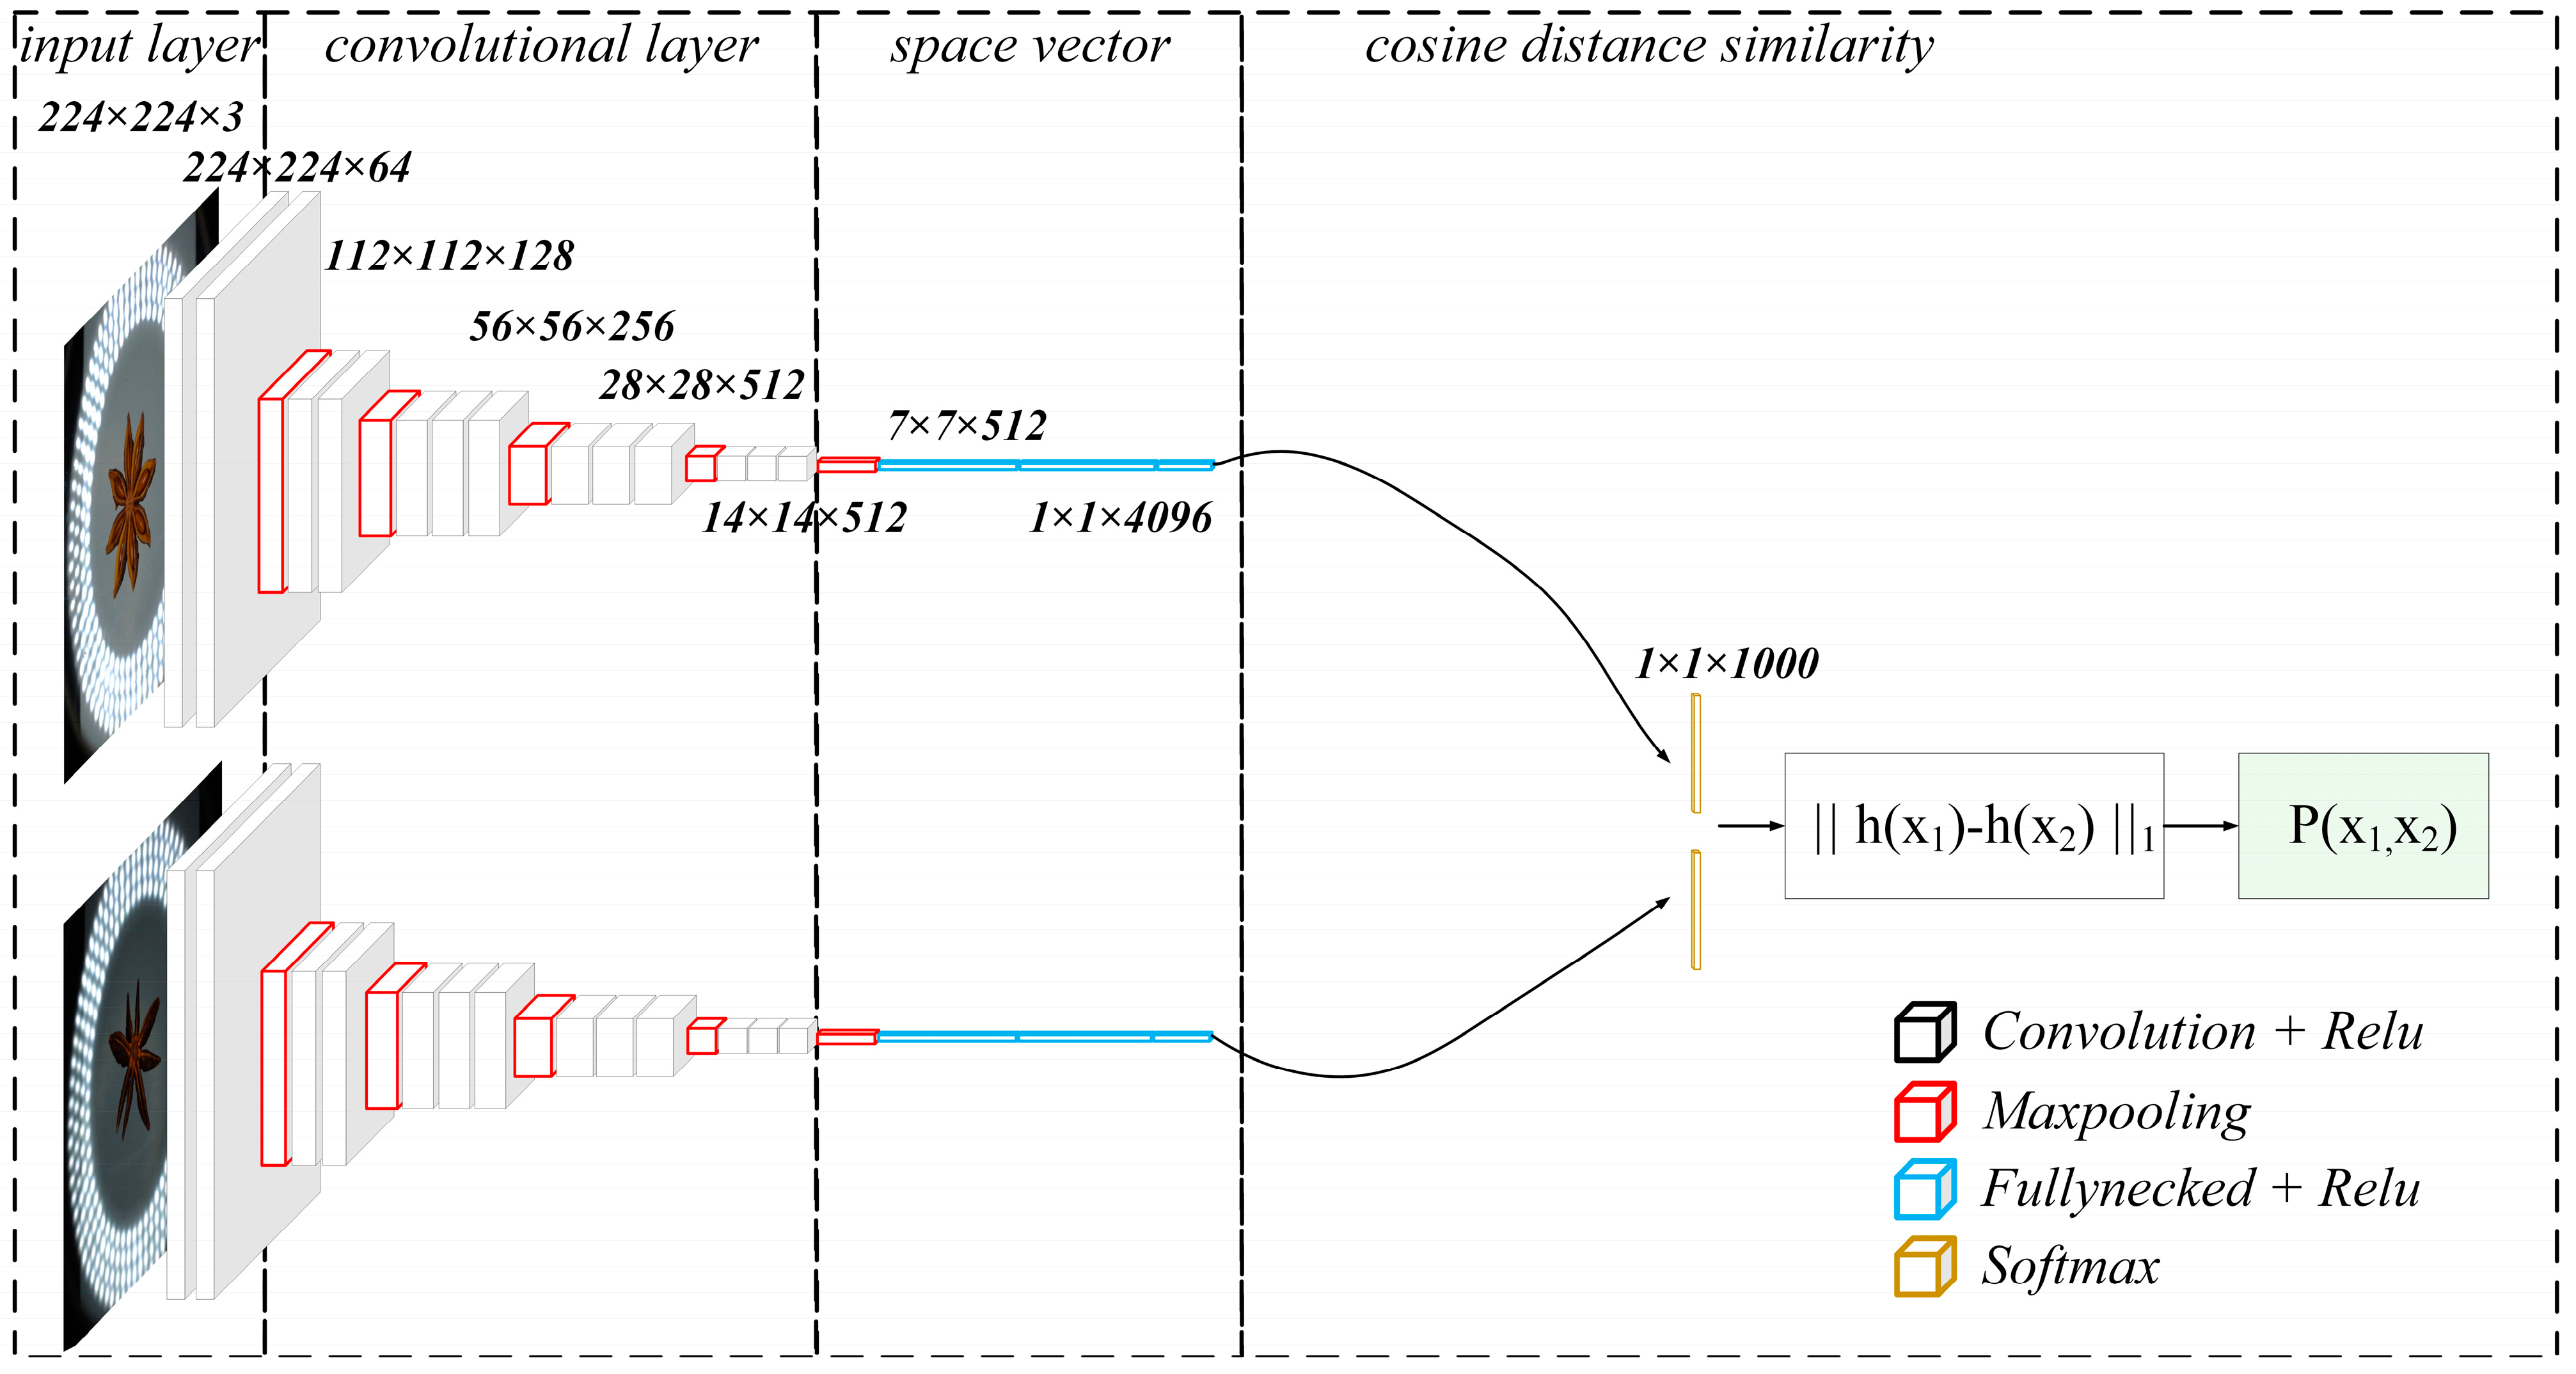
The Siamese Network is a neural network architecture consisting of two or more identical subnetworks with the same parameters and weights [25]. The parameters of the two VGG subnetworks are updated simultaneously through weight sharing, allowing the network to learn feature representations by comparing the similarity of input image pairs. The non-similar image filtering process is illustrated in Figure 4. In the input layer, images are resized to a fixed size. In the convolutional layer, image features are further abstracted and compressed, generating high-dimensional feature vectors. At the space vector stage, the output from the convolutional layer is transformed into spatial vectors via a fully connected layer. These vectors contain the critical feature information of the image and serve as the basis for similarity computation. Finally, in the cosine distance similarity stage, spatial vectors are compared using cosine similarity to calculate the similarity between two feature vectors. The two VGG networks independently extract image features and output feature vectors and . The difference between these two feature vectors is then assessed by measuring the distance in the feature space. The similarity score is the key metric used to determine whether the images are similar. The application of the Siamese Network ensures the scientific rigor of data filtering. The experiment set a similarity threshold of 0.9, and non-similar filtering was performed by measuring similarity, retaining samples with diversity and differences, forming a representative set of 1195 typical images.
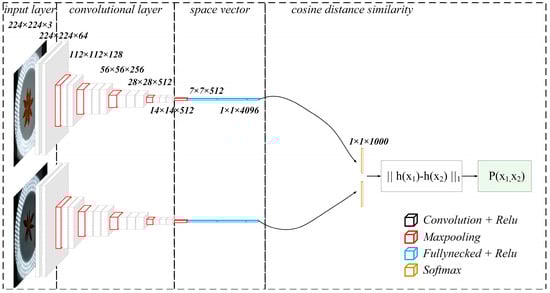
Figure 4.
Non-similar images selection process.
2.3.2. Image Enhancement
To balance the number of images across different categories and to enable the model to better handle various potential factors during training [26], this study employed eight data augmentation techniques on the representative image set. These techniques included Color balance, Brightness adjustment, Rotate_Only_BBoxes, Equalize_Only_BBoxes, Posterize, Image sharpness, Flip_Only_BBoxes, and BBox_Cutout. As an example, the augmented effects on the Dahong variety are illustrated in Figure 5.
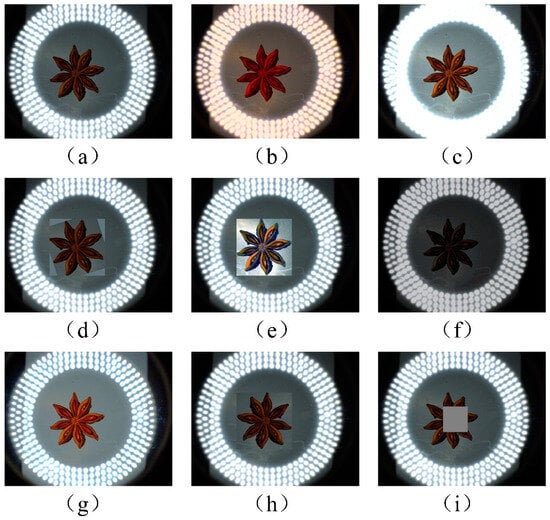
Figure 5.
Data augmentation effects: (a) Original image; (b) Color balance; (c) Brightness adjustment; (d) Rotate_Only_BBoxes; (e) Equalize_Only_BBoxes; (f) Posterize; (g) Image sharpness; (h) Flip_Only_BBoxes; (i) BBox_Cutout.
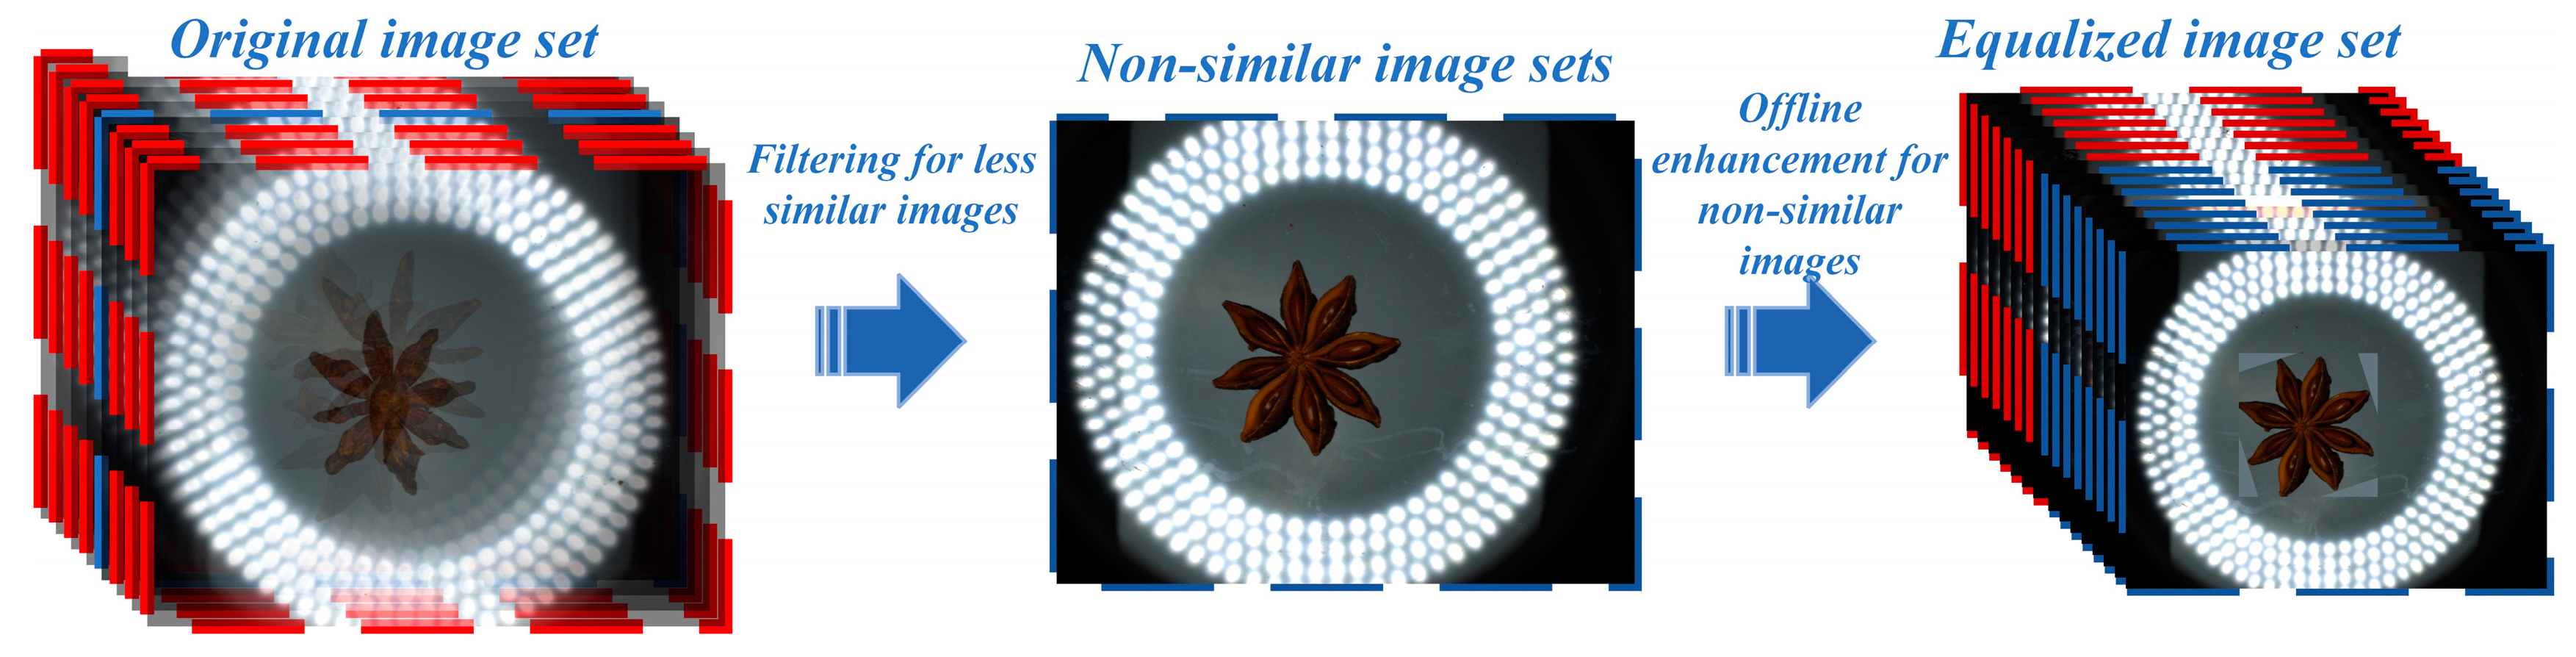
Through these augmentation methods, 10,755 augmented images were obtained, including 2223 Dahong, 2763 Jiaohua, 2340 Ganzhi, and 3429 Buhege images. The collected star anise images are primarily single-target, making these augmentation methods more suitable for the actual image set used in this study. These augmentation operators were specifically designed to address the typical material characteristics of star anise, such as color, shape, and texture, overcoming the limitations of monotonous information in single images. They also recreated the complexity of real detection scenarios, enabling the model to better fit during training. The specific details of non-similar data augmentation in this section are shown in Figure 6.
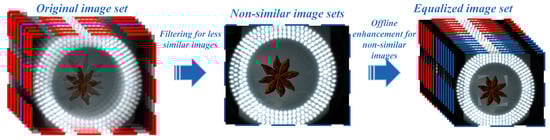
Figure 6.
Non-similar data augmentation.
2.3.3. Dataset Production
The images collected at various initial stages of this study are shown in Table 1. In Phase I, the original Turntable images set was collected. In Phase II, the non-similar image set was extracted from the Phase I collection. In Phase III, images were collected using a high-resolution camera. In Phase IV, the non-similar image set from Phase II was enhanced and expanded to make the image set more balanced. Finally, in Phase V, a total of 24,091 images were gathered.

Table 1.
Images collected at various stages.
Due to the large number of images initially acquired, this study performed data selection on the image sets from each stage. A total of 18,000 images were selected from the turntable image set, high-resolution camera image set, and enhancement image set for training and testing the model in the experiments. Additionally, 1800 images were selected from an open-source dataset on the Roboflow website (https://universe.roboflow.com/hi-yuc6l/visual-inspection-of-star-anise/dataset, accessed on 3 June 2024) to serve as the evaluation set in the experiments. These selected datasets constitute the diversified fusion star anise image set in this study. To test the effectiveness and environmental adaptability of the object detection algorithm, the datasets were divided into training, validation, and test sets in an 8:1:1 ratio, with the open dataset serving as the evaluation set, as shown in Table 2.
Table 2.
Diversified fusion dataset.
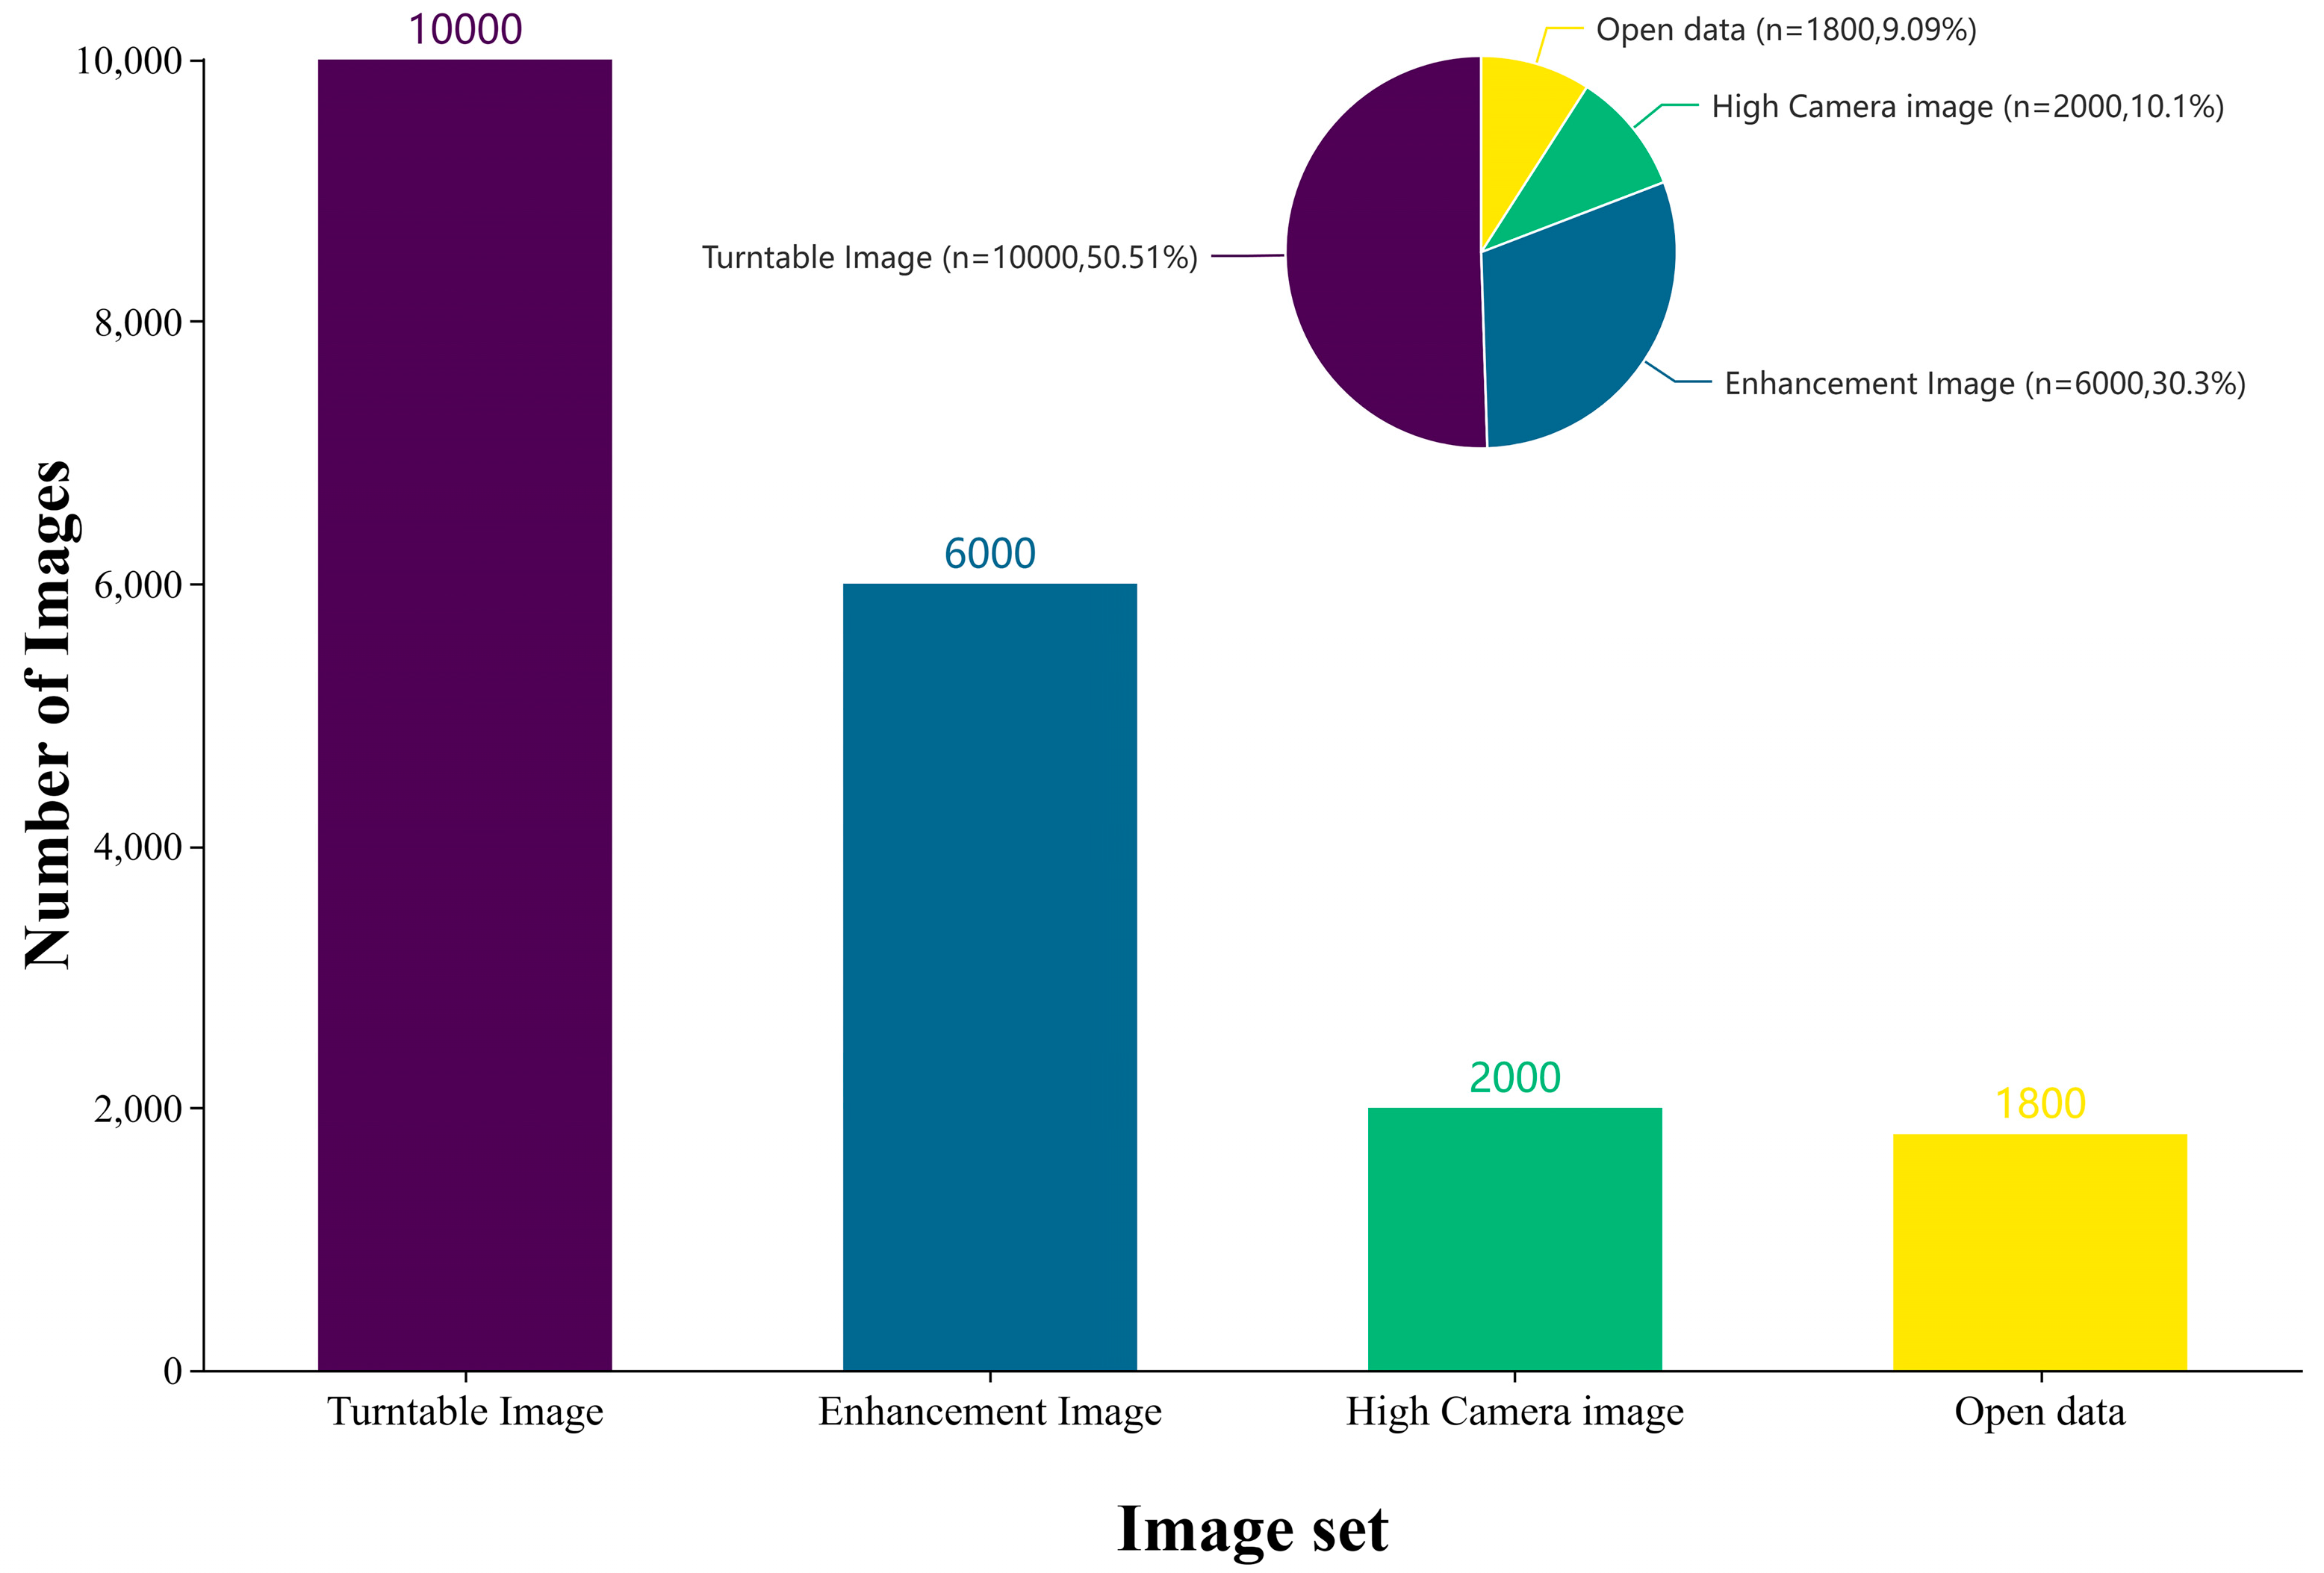
As illustrated in Figure 7, the bar chart shows the distribution of the curated data, consisting of 10,000 images from the turntable image set, 2000 from the high-resolution scanner set, 6000 from the enhancement set, and 1800 from the open dataset. The open dataset primarily serves as an evaluation set to assess the model’s actual detection performance. The selected dataset has a moderate quantity, reducing redundant data and lowering computational resource consumption, providing high quality data input for subsequent model training.

Figure 7.
Distribution of the diversified fusion dataset.
2.4. Construction of the Model Structure
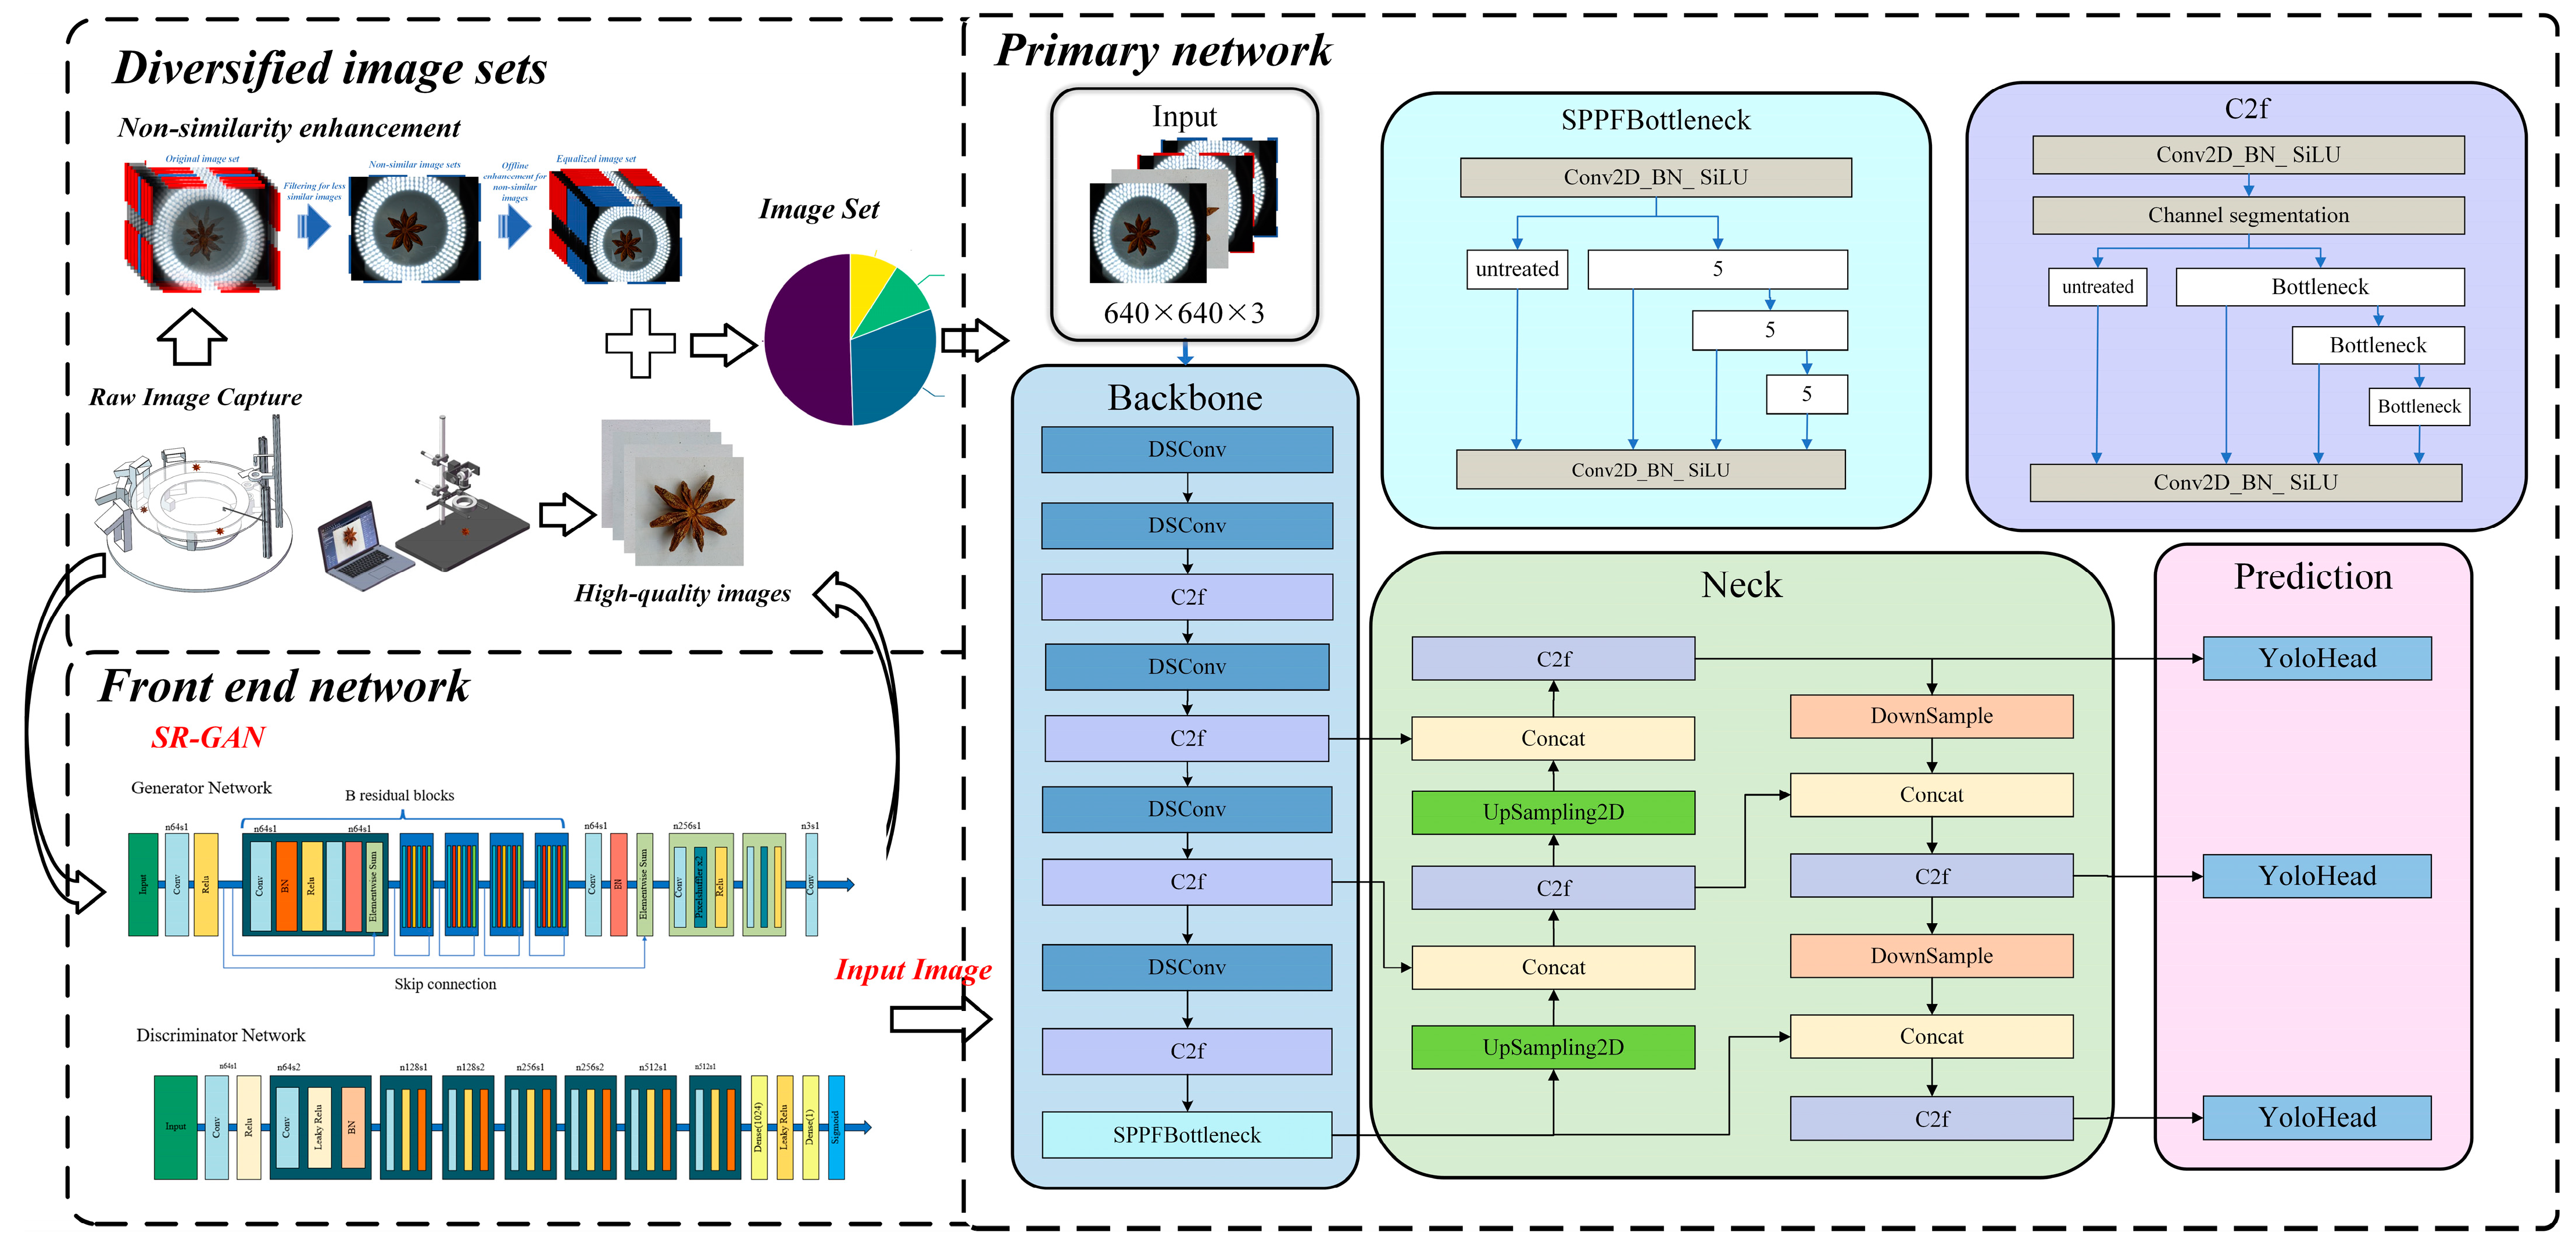
The overall architecture of the model is illustrated in Figure 8. The proposed cascade detection model consists of three main parts: the front-end SRGAN super-resolution generative adversarial network, diversified fusion image enhancement, and the improved primary YOLOv8 object recognition network. These components work together to complete the detection task.
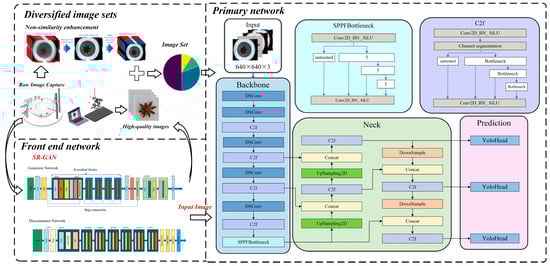
Figure 8.
Overall architecture of the model.
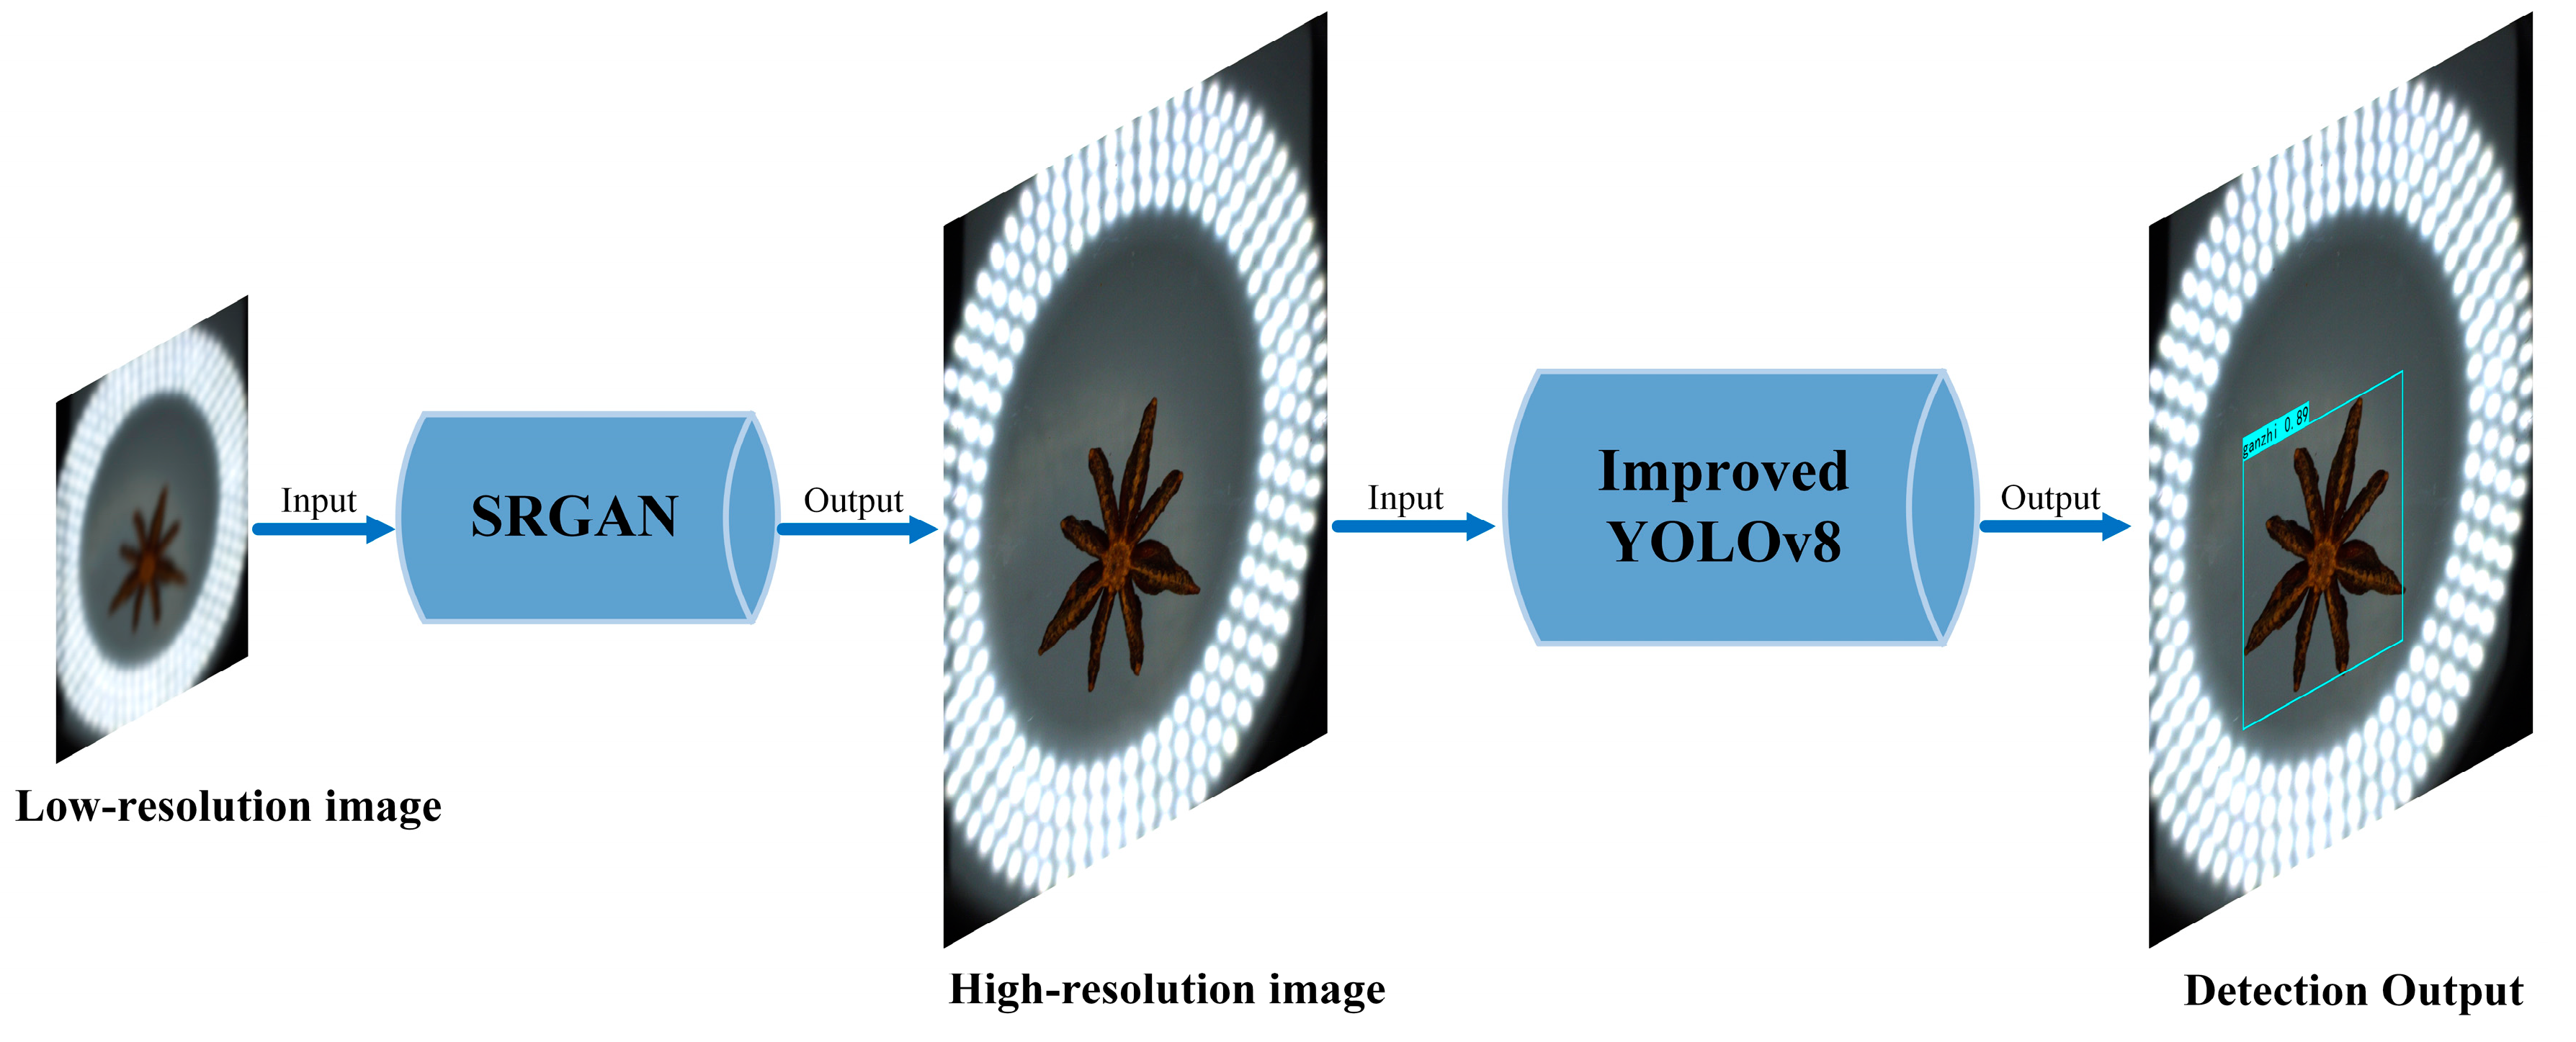
The collaborative detection process between the front-end network and the primary object recognition network is shown in Figure 9. This process begins by using SRGAN to reconstruct low-resolution images into high-resolution images to better capture the characteristic details of star anise in the images. The reconstructed images are then input into the improved YOLOv8 for detection.
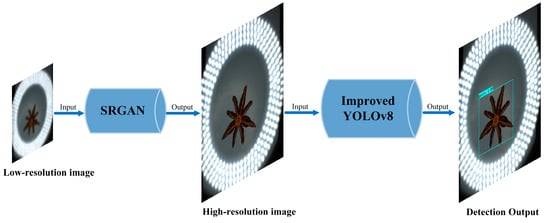
Figure 9.
Collaborative detection of the front-end network and primary object recognition network.
2.4.1. YOLOv8 Primary Object Recognition Network and Improvements
YOLOv8 is a cutting-edge object detection model developed by Ultralytics, featuring an anchor-free split detection head. It is more accurate and efficient than anchor-based methods, ensuring rapid detection and recognition of objects in images [27]. Compared to two-stage algorithms, YOLOv8 has a smaller model memory and higher accuracy, making it highly portable and suitable for addressing agriculture-related problems.
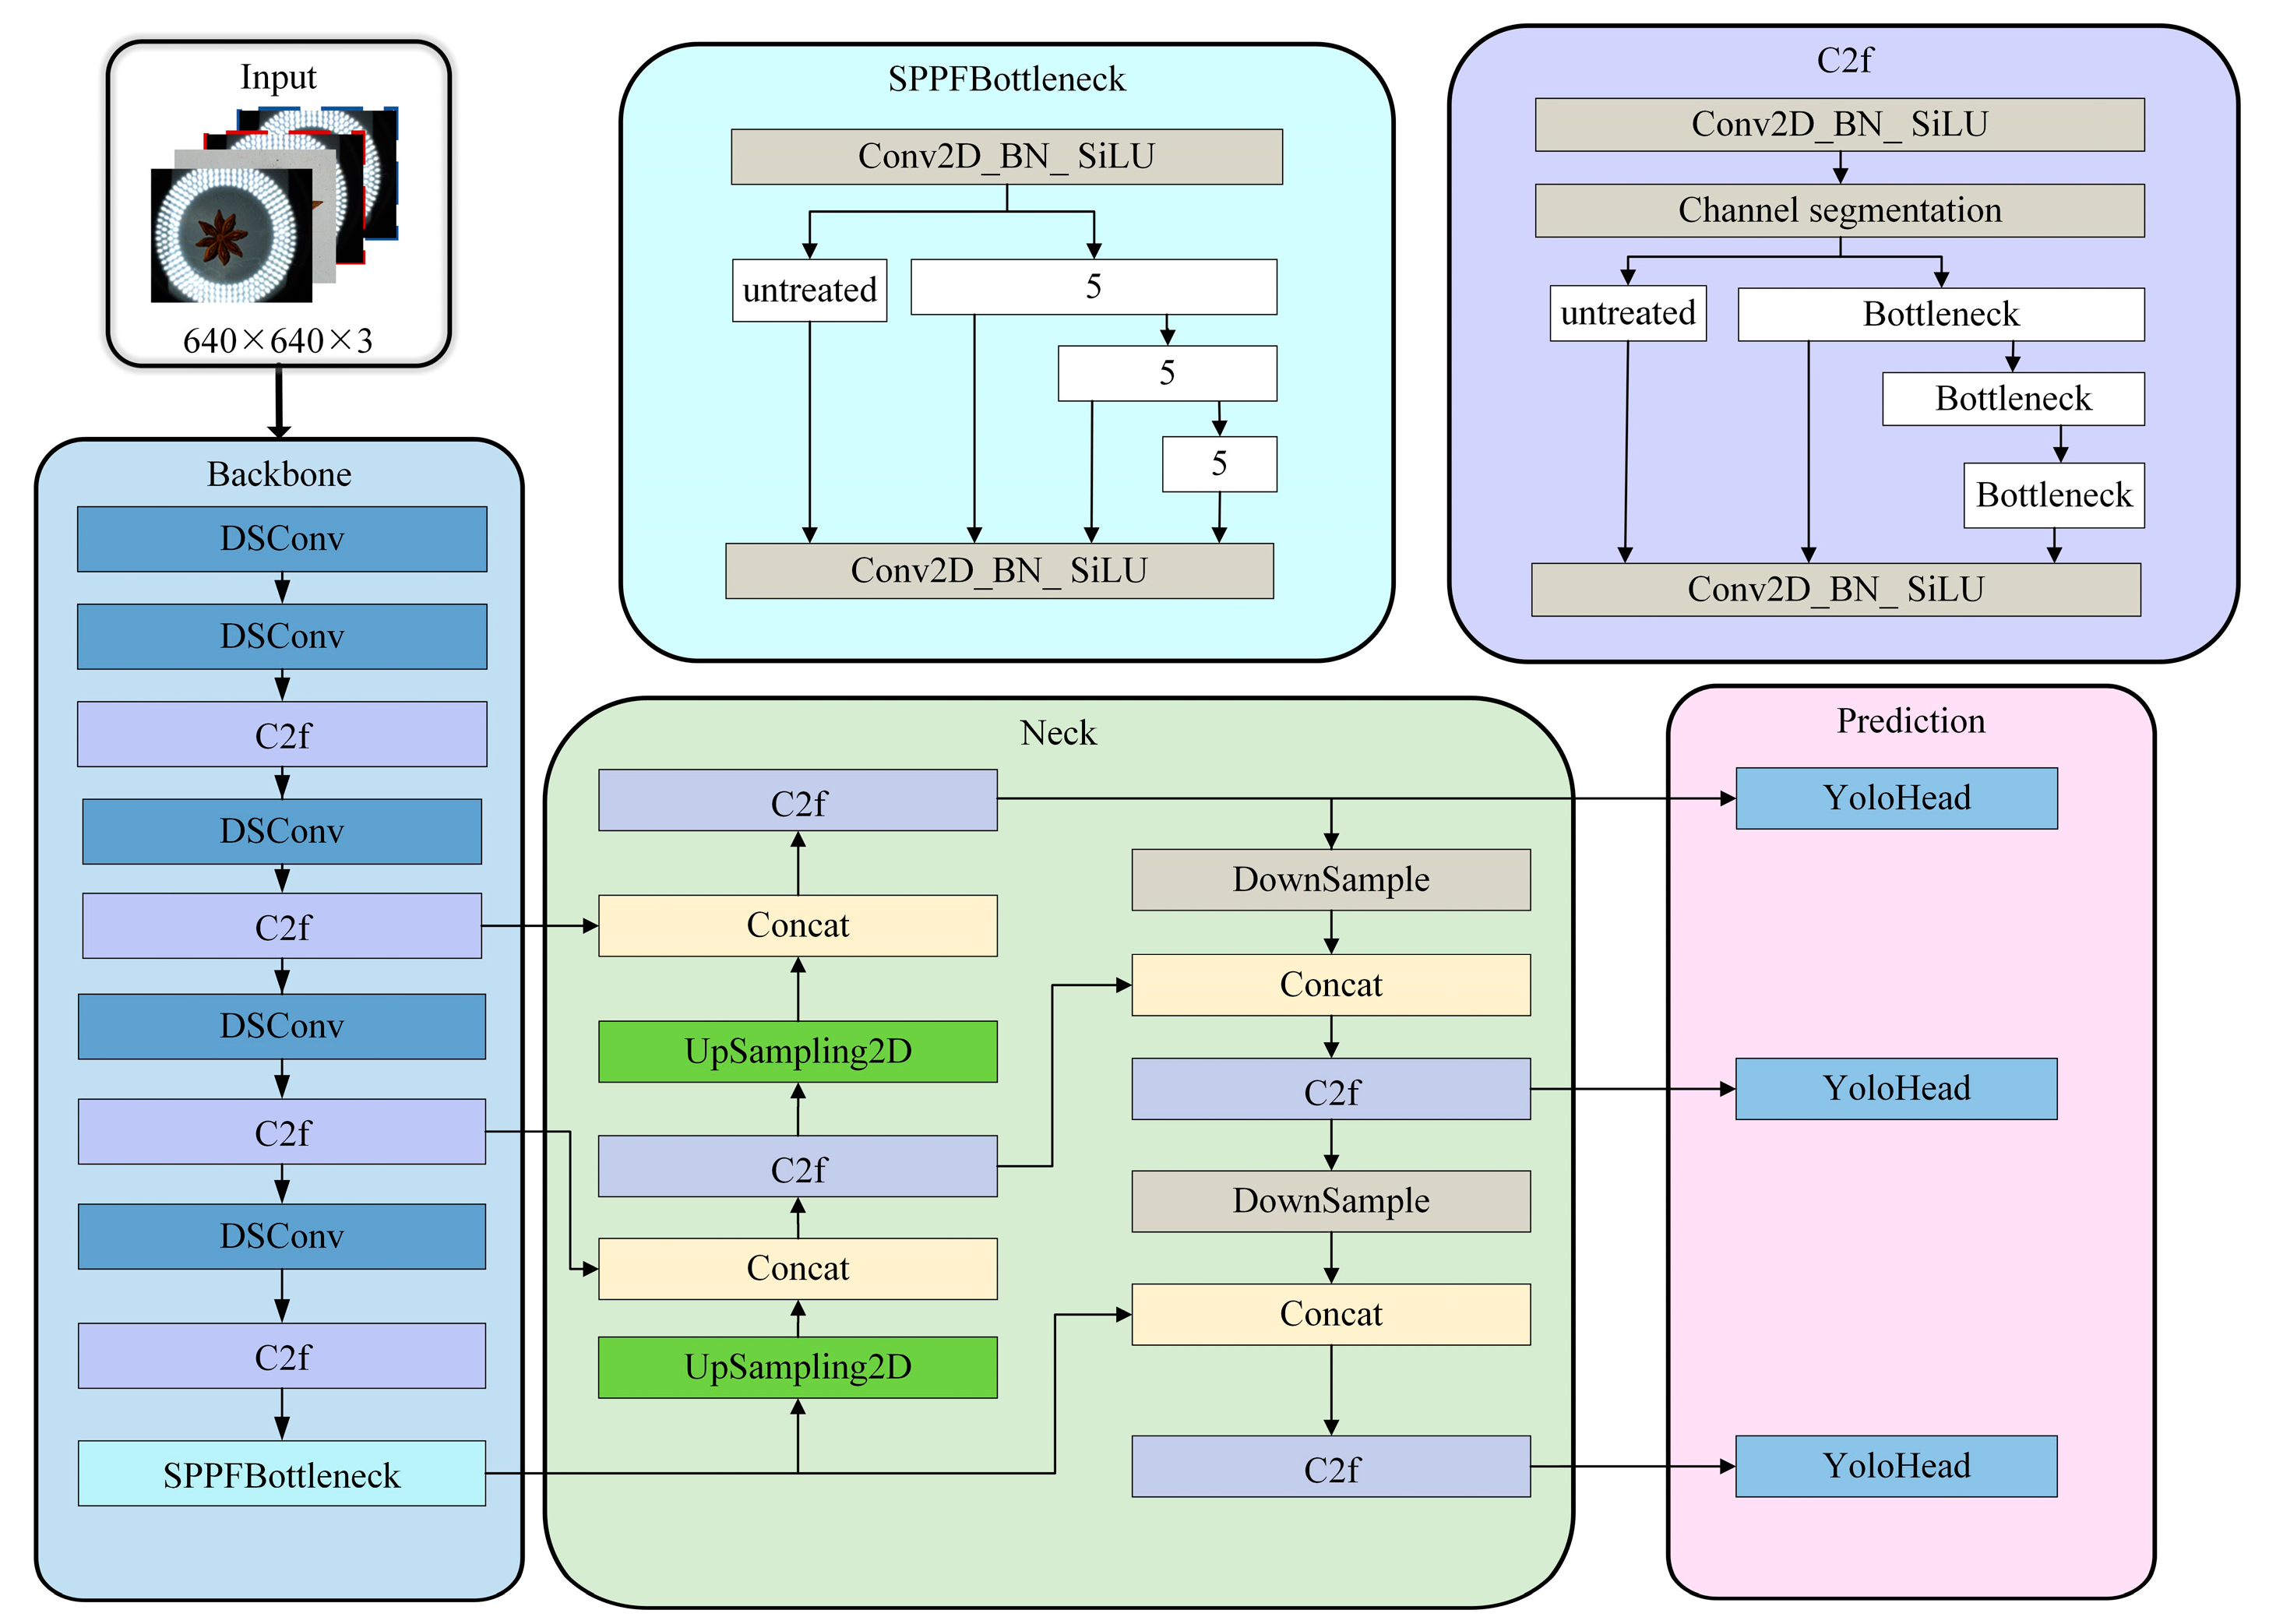
The YOLOv8 network structure [28] comprises several components: the input layer, backbone network, enhanced feature extraction network, and head prediction network. In the backbone network, the C2f module replaces the C3 module, drawing on the ELAN concept from YOLOv7. The C2f module introduces additional parallel gradient flow branches to maintain a lightweight design while enriching gradient flow information, thus reducing computational load. Additionally, the increase in gradient flow also significantly enhances convergence speed and effectiveness. Furthermore, compared to the previous YOLOv5, the first convolution in the backbone has its kernel size reduced to 3. Specifically, the first convolution doubles the number of channels, and the resulting convolution is then split in half along the channels. It also incorporates the multi-stack structure from YOLOv7. In the enhanced feature extraction network, the feature layers obtained from the backbone network are no longer convolved, primarily to increase speed. Additionally, the preprocessing in the C2f module is changed from three convolutions to two convolutions. In the prediction head part, YOLOv8 uses a decouple-head structure. Specifically, a DFL (distance-based feature learning) module is added to the prediction head, enabling the probabilistic estimation of regression values. It optimizes the probabilities of the two positions closest to the target label using cross-entropy. This models the box position as a general distribution, enabling the network to quickly focus on the positional distribution near the target. The formula can be expressed as:
Here, and represent the network’s output as the “predicted value” and the “adjacent predicted value,” respectively; , , and denote the label’s “true value”, “integral value”, and “adjacent integral value”, respectively. DFL enables the network to quickly focus on values near the target, thereby increasing the probability of accurate identification. YOLOv8 also innovatively adopts adaptive multiple positive sample matching and uses an anchor-free implementation. This provides an advantage in detection, especially when considering star anise targets with irregular length and width. To enhance feature representation and improve the network’s detection performance and speed, this study integrated depthwise separable convolutions into the YOLOv8 backbone, reducing the model size and the computational burden of convolutions [29], as illustrated in Figure 10.

Figure 10.
Imp-YOLOv8 model.
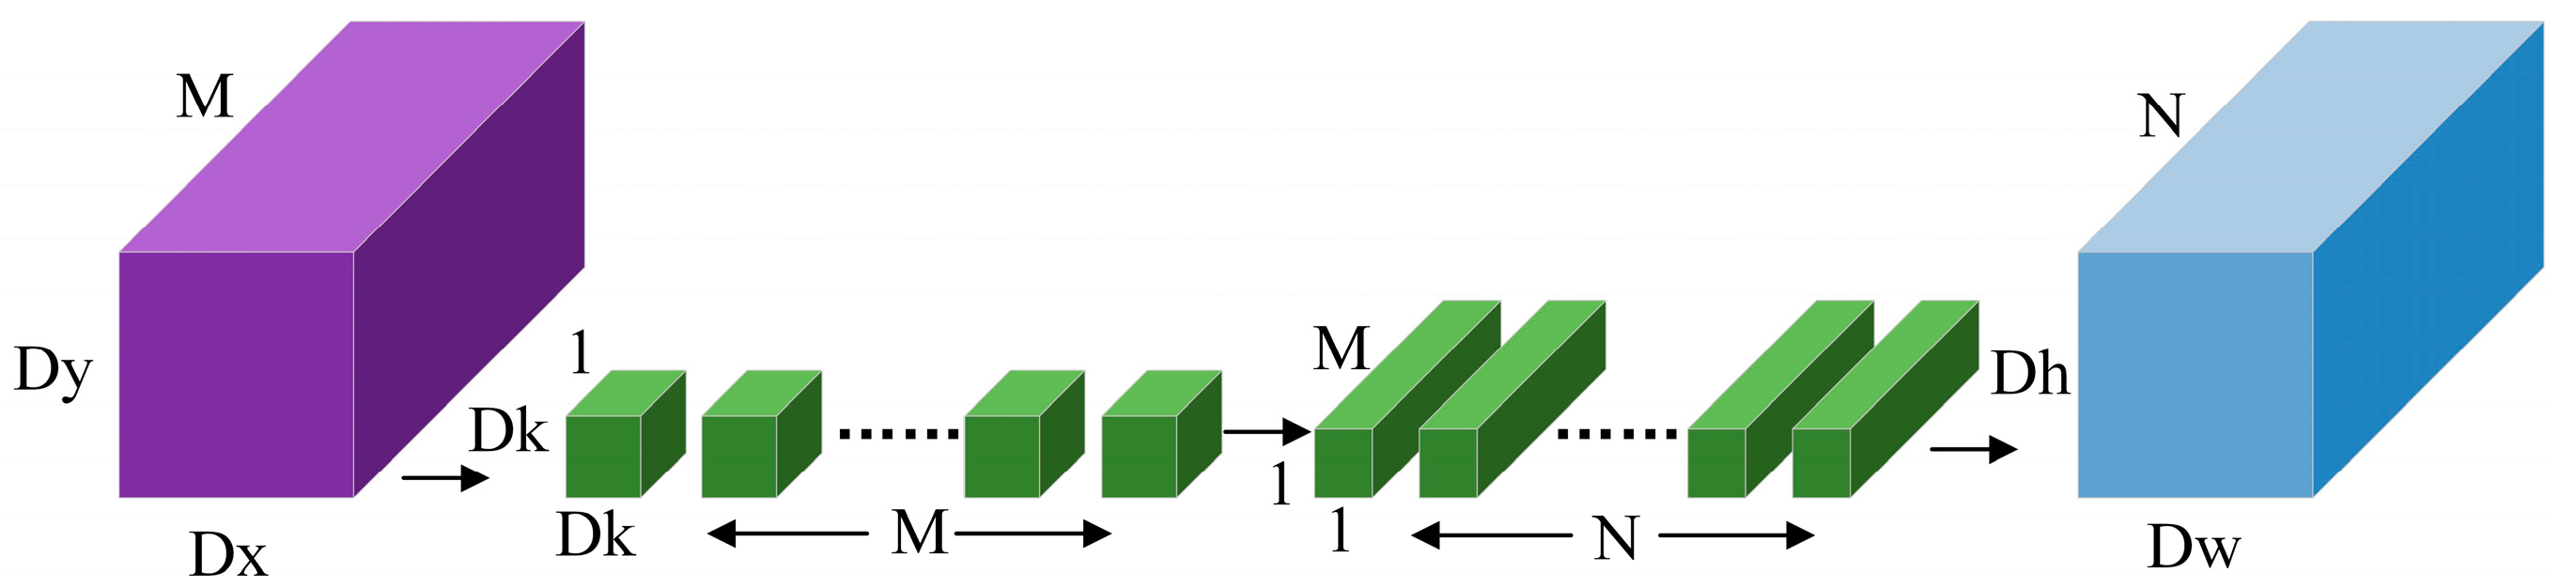
The DSConv module is composed of depthwise (DW) convolution and pointwise (PW) convolution. Compared to conventional convolution, it has lower computational costs. As shown in Figure 11, it replaces the single operation in ordinary convolution with a 3 × 3 depthwise convolution and a 1 × 1 pointwise convolution. The convolution operation is performed on the channels of the input image, with the specific computational cost calculated as shown in Formula (2):
In the formula, represents the size of the convolution kernel, usually set to 3. M and N denote the number of channels in the input and output data, respectively, while and represent the width and height of the output data.
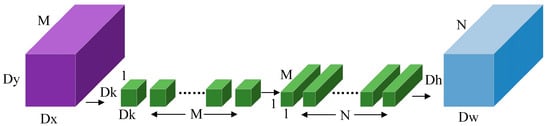
Figure 11.
DSConv module.
This module is primarily used to address the issues of parameter complexity and computational workload involved in extracting star anise category information from the model’s backbone network. It further reduces the model size and improves inference speed. Therefore, depthwise separable convolutions are the preferred choice for mobile and edge computing devices with limited computational power and memory [30]. This improved model is named Imp-YOLOv8 in this paper.
2.4.2. Front-End SRGAN Network
SRGAN is an advanced method that utilizes generative adversarial networks (GAN) to achieve image super-resolution reconstruction [31]. Essentially, it functions as a black box that takes a low-resolution image as input and produces a high-resolution image as output. In this study, some of the star anise datasets obtained from the turntable equipment include blurry images, which hinder the primary network’s detection and recognition capabilities. Thus, SRGAN super-resolution reconstruction is employed to convert these images to high-definition, restoring their details and clarity, enhancing the perception of fine structures, and aiding the model in more accurately recognizing and locating objects.
SRGAN utilizes perceptual loss and adversarial loss to enhance the realism of the reconstructed images. To ensure that the images generated by the generator are perceptually very close to real images, the perceptual loss is used as the loss function of the network, as shown in Formula (3). This loss function consists of content loss and adversarial loss. represents the perceptual loss, represents the content loss, and represents the adversarial loss.
This study uses VGG loss as the content loss, measuring the difference between the generated high-resolution image and the real high-resolution image in the VGG feature space, thereby generating a super-resolution image that is more similar to the real image. The specific calculation is shown in Formula (4):
Here, and represent the VGG loss, feature map width, feature map height, and feature map of the convolutional layer after the max-pooling layer, respectively. represents the real high-resolution image, represents the low-resolution image, and represents the super-resolution image generated after inputting the low-resolution image into the generator , represents the probability that the discriminator D considers the generated super-resolution image to be a real image. The purpose of the adversarial loss is to make the super-resolution image generated by the model closer to the real image, with the expression shown in Formula (5).
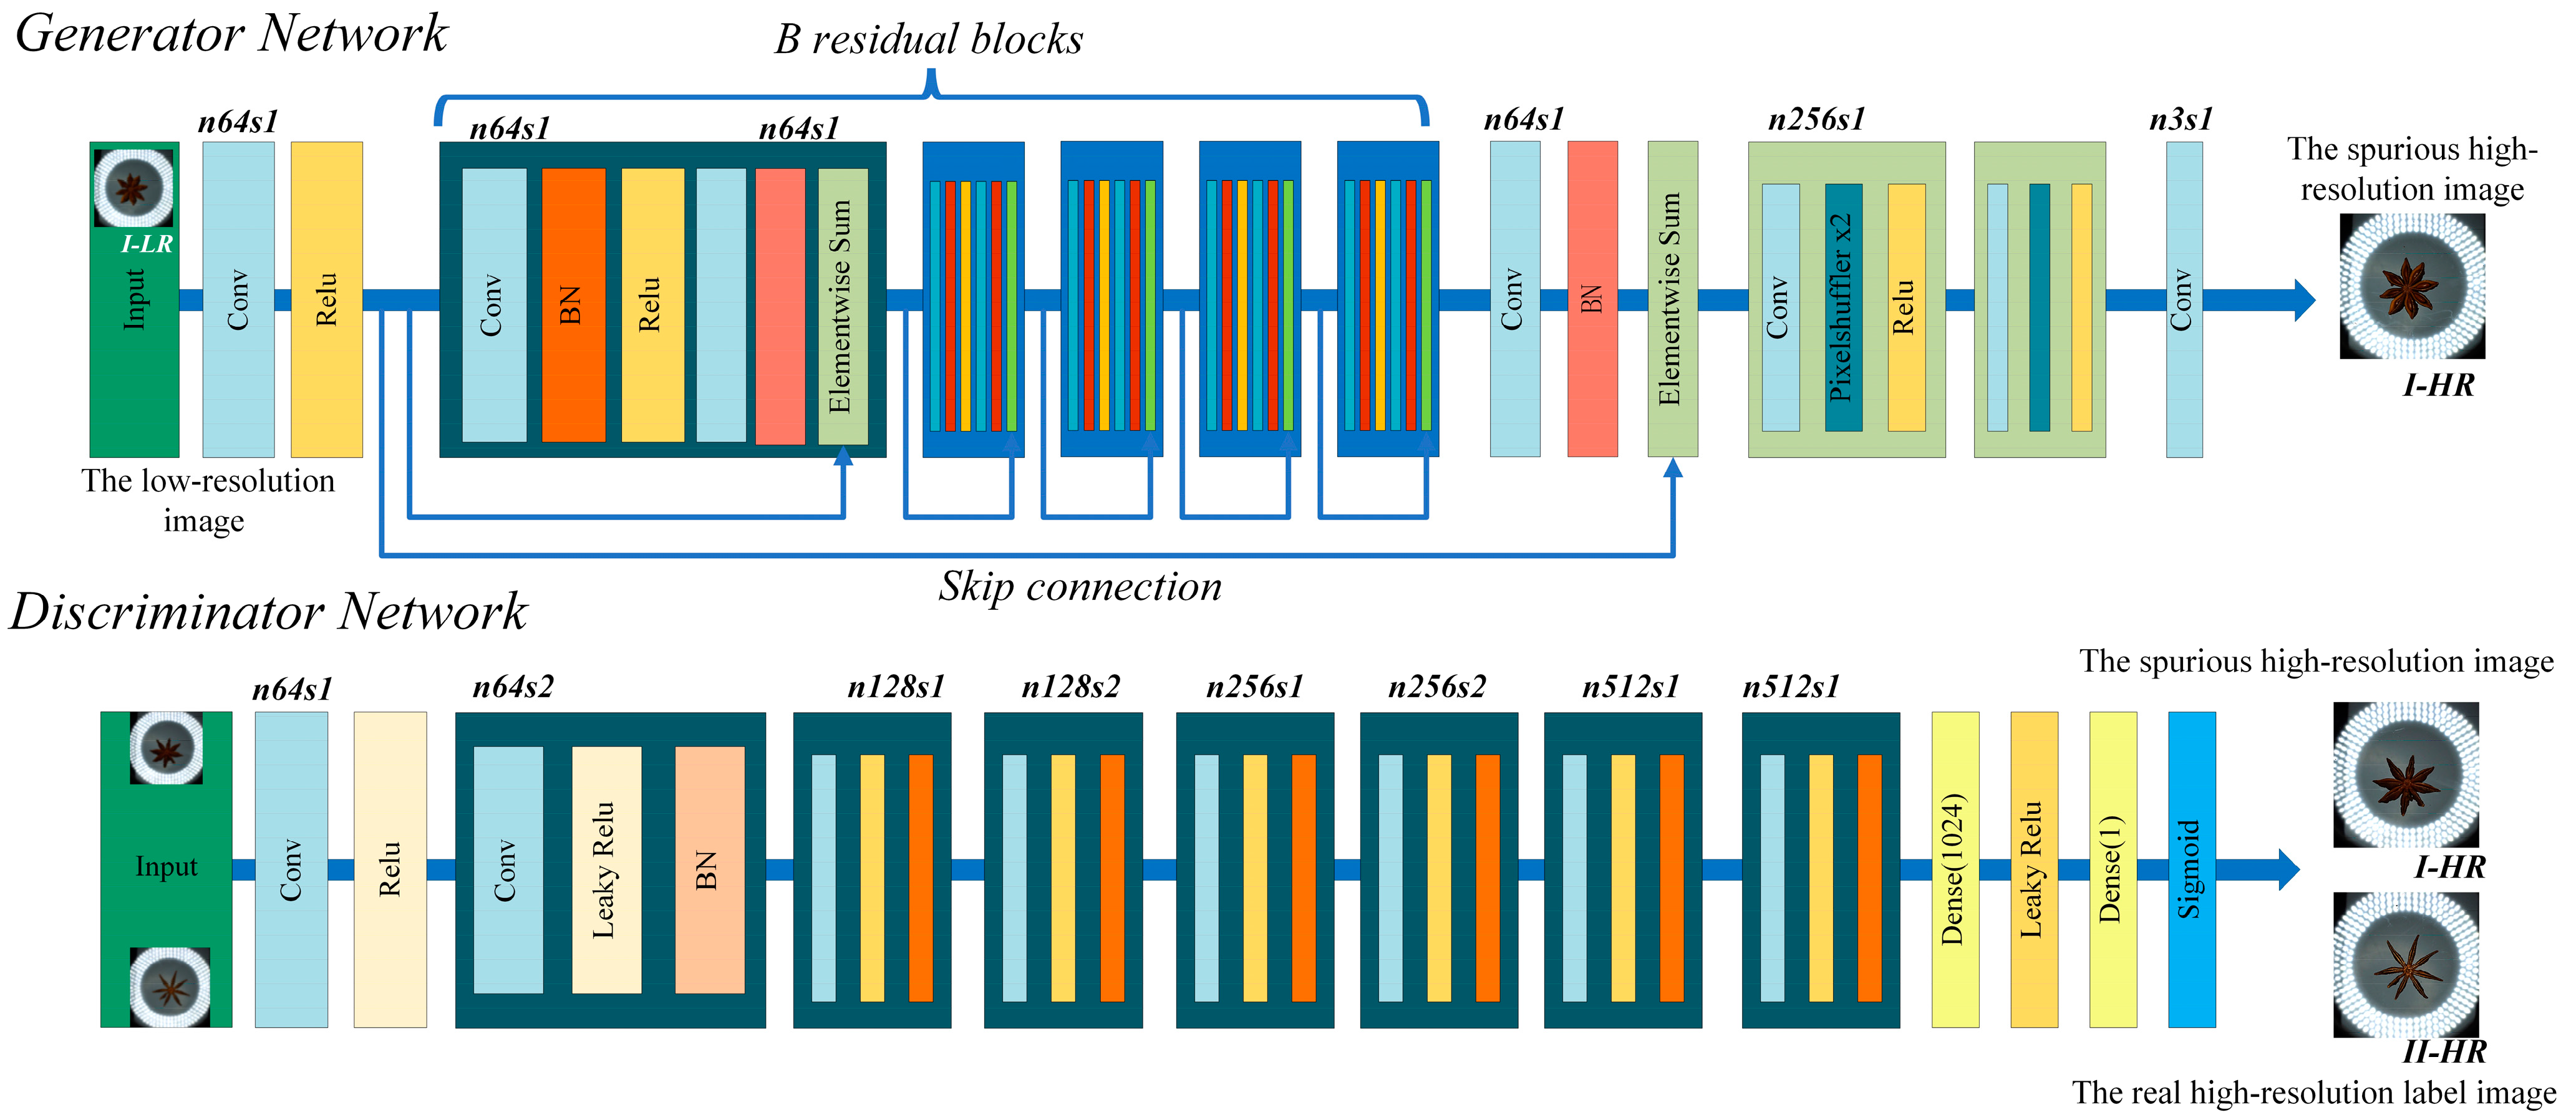
The SRGAN used in this study is mainly composed of a generator network and a discriminator network. The primary task of the generator network is to learn the mapping from low-resolution images to high-resolution images, while the task of the discriminator network is to distinguish the generated high-resolution images from the real high-resolution images. The super-resolution reconstruction process of blurry images is shown in Figure 12, where low-resolution images are input into the generator network to produce pseudo high-resolution images. The real high-resolution images and the generated pseudo high-resolution images are then fed into the discriminator network, and the discriminator’s feedback is provided to both the generator and discriminator networks, leading to their simultaneous updates [32]. The generator network continually refines its ability to produce pseudo high-resolution images that closely resemble real images, while the discriminator enhances its capability to distinguish between them, thereby fostering the generator’s efficient learning process. The DF2K dataset was utilized to train the model until the SRGAN’s loss value converged, yielding optimal weights. These weights were subsequently used to perform super-resolution reconstruction on the blurry image sets in the experiment, resulting in clear images.

Figure 12.
The network structure of the SRGAN.
2.5. Dataset Training Environment
All experiments in this study were conducted on a laboratory workstation, with the experimental environment configuration shown in Table 3. Taking into account workstation performance, the required amount of training data, and model complexity, the network training parameters were set as follows: 640 × 640 input image size and 32 for the batch size. The stochastic gradient descent (SGD) optimizer was used, with the momentum factor set to 0.937 and the learning rate set to 0.001.
Table 3.
Experimental environment configuration.
2.6. Model Comparison and Evaluation
2.6.1. Comparison of Object Detection Models
To select the most effective YOLO model for the star anise dataset, a comparison was made under the same experimental conditions between mainstream models such as SSD-VGG, Faster R-CNN, and the YOLO series models before and after improvements. The comparison included metrics such as mAP, model size, inference speed, etc.
2.6.2. Evaluation Indicators
To better evaluate the model’s performance, the most classic evaluation metrics in object detection algorithms were used. These metrics include precision (P), recall (R), F1 score, average precision (AP), mean average precision (mAP), model parameters, model weight size, detection speed, and the P-R curve. During the entire experiment, the IoU value was set to 0.50. The calculations for P, R, F1, AP, and mAP are shown in Formulas (6)–(10).
In the formulas, TP represents the number of correctly identified star anise samples, FP represents the number of incorrectly predicted negative samples of star anise, and FN represents the number of incorrectly predicted positive samples of star anise. N is the number of detection categories; in this study, the four categories of star anise to be identified are Dahong, Jiaohua, Ganzhi, and Buhege, so N = 4.
3. Results and Discussion
3.1. Primary Recognition Network Model Training and Test Evaluation
The YOLOv8 series models achieve a good balance in terms of model size, training difficulty, and inference time. This balance makes them a viable choice for achieving high performance and real-time detection.
3.1.1. Performance Comparison of YOLOv8 Models with Different Versions and Image Sets
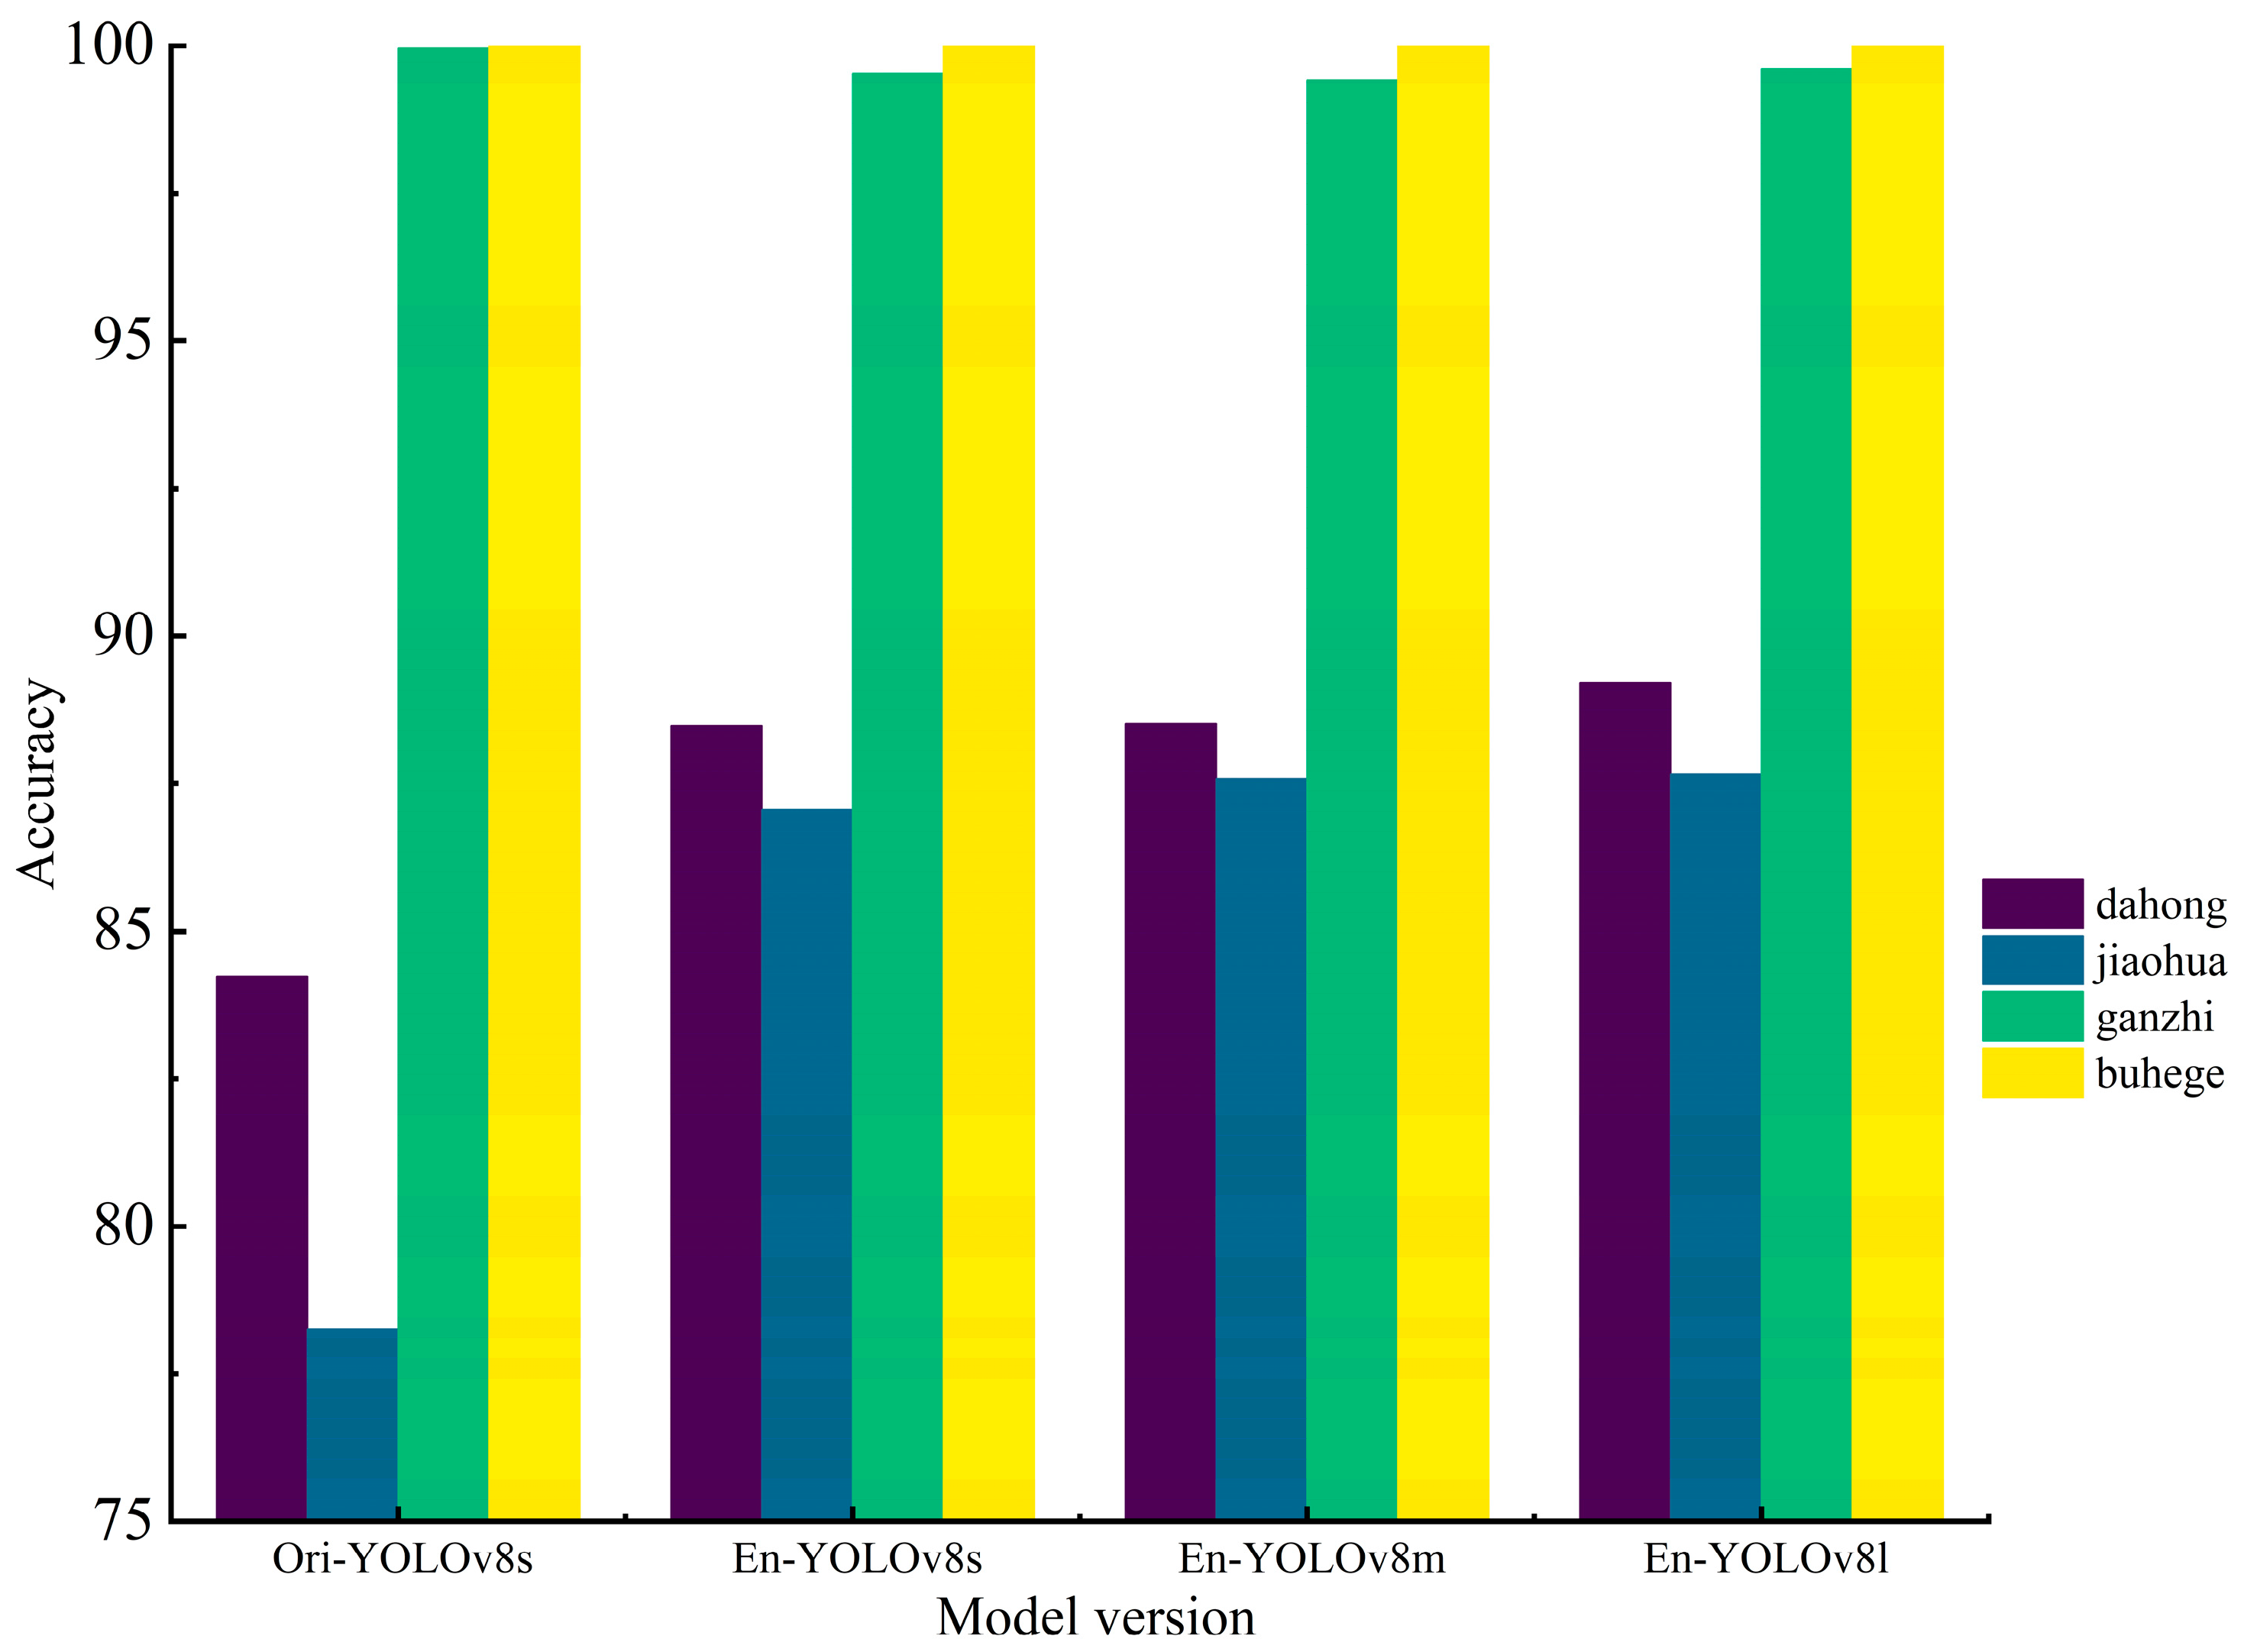
This study focused on comparing metrics such as mAP, FPS, and model size to analyze and evaluate performance comprehensively. In the ablation experiment, we compared the initially trained Ori-YOLOv8s (using the turntable image set for training) and the enhanced training of the network optimization strategy, Enhance-YOLOv8 (using the turntable image set, high-resolution camera image set, and enhanced image set for the training) across different versions of the model (s, m, l). All models were trained for 100 epochs under the same experimental environment and evaluated on the same test set. For simplicity, Enhance will be abbreviated as En in the following text. As shown in Table 4, the models trained with enhancement showed better performance, with greater emphasis on category targets. En-YOLOv8s is lighter in weight, faster in detection speed, and has a relatively higher mAP. The AP values of the different versions of the models are shown in Figure 13.
Table 4.
Performance testing of YOLOv8 models with different versions and image sets.

Figure 13.
AP value distribution.
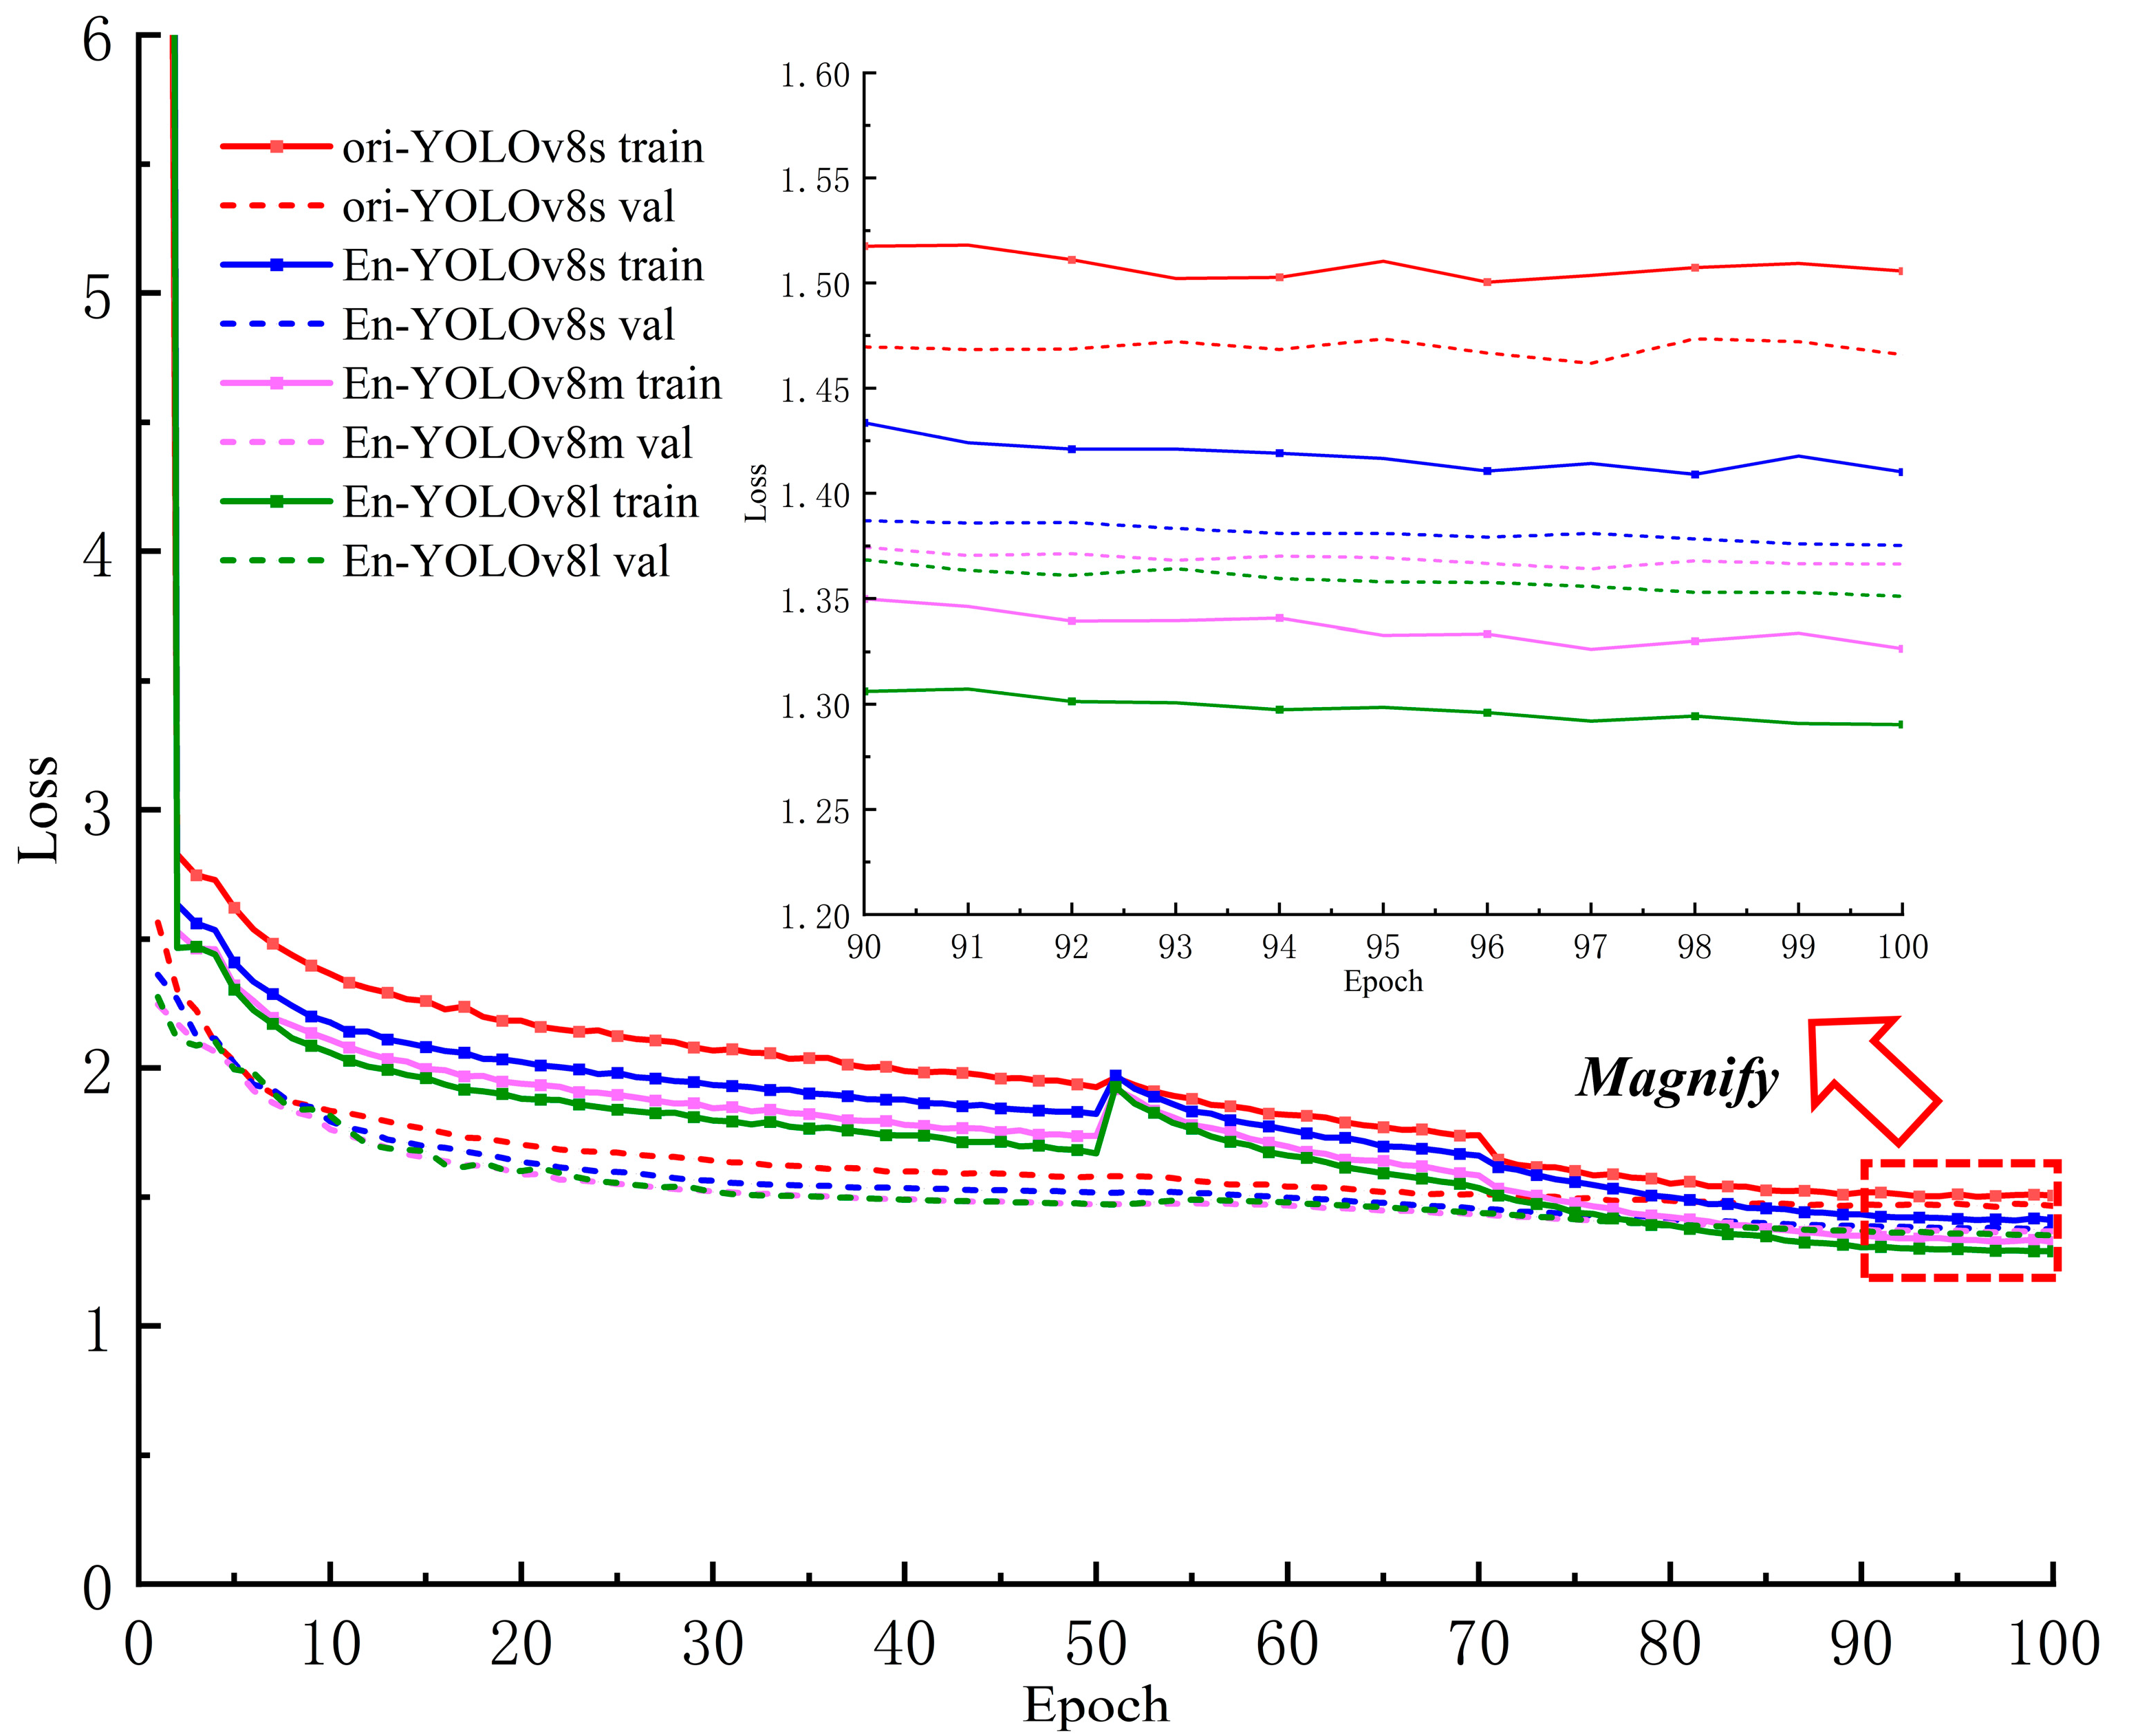
As shown in Figure 14, the overall trend of the loss curves for different versions is similar. Zooming in on the curve region from the 90th to 100th epoch, the training and validation losses of Ori-YOLOv8s are higher than those of En-YOLOv8s, with more pronounced fluctuations. Additionally, the validation loss values for En-YOLOv8m and En-YOLOv8l are higher than their corresponding training loss values, indicating a potential risk of overfitting during the training process. This suggests that the m and l versions are less effective at learning from the dataset compared to the s version. Within the 90th to 100th epoch interval, the training loss of En-YOLOv8s is higher than the validation loss, with a lower final loss value and more stable overall performance. This indicates that the s version model has a stronger capability and a significant advantage in learning key information features from the images. It also demonstrates that the data enhancement strategy used in this study effectively improved the model’s generalization and robustness, contributing positively to enhancing network performance. Therefore, this study selected the YOLOv8s model, which is smaller in size and faster in detection speed, for further improvements and training.
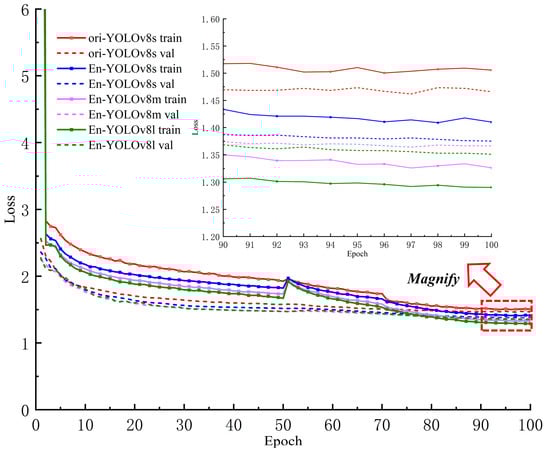
Figure 14.
Loss curves for different model versions and enhancement sets.
3.1.2. Analysis of Network Training Based on Different YOLOv8s Optimization Strategies
The enhanced training strategy used in the previous section did not fully achieve the desired recognition performance for the Dahong and Jiaohua categories. Generally, the reasons for low model accuracy include insufficient data and inadequate fitting during model training. To fully exploit the network’s potential and explore the impact of different training strategies on the YOLOv8s network’s performance, this study introduced two strategies: Two-round training (first training for 100 epochs to obtain optimal weights, then using them as pretrained weights for a second 100 epochs of training) and the Extended training strategies to enhance the performance of the neural network. The Imp-YOLOv8 model was also included in the experiment. Table 5 summarizes the network test results under various optimization strategies. From the results of the models using different training strategies, after two-round training, the model’s mAP reached 95.13%, which was 1.36% higher than the enhanced training. After extended training, the mAP was 95.56%, a 1.79% improvement over the enhanced training. Comparing enhanced training and two-round training, extended training effectively improved the model’s accuracy; among them, the Imp-YOLOv8 model trained with extended training showed the best mAP results.
Table 5.
Comparison of model performance under different optimization strategies.
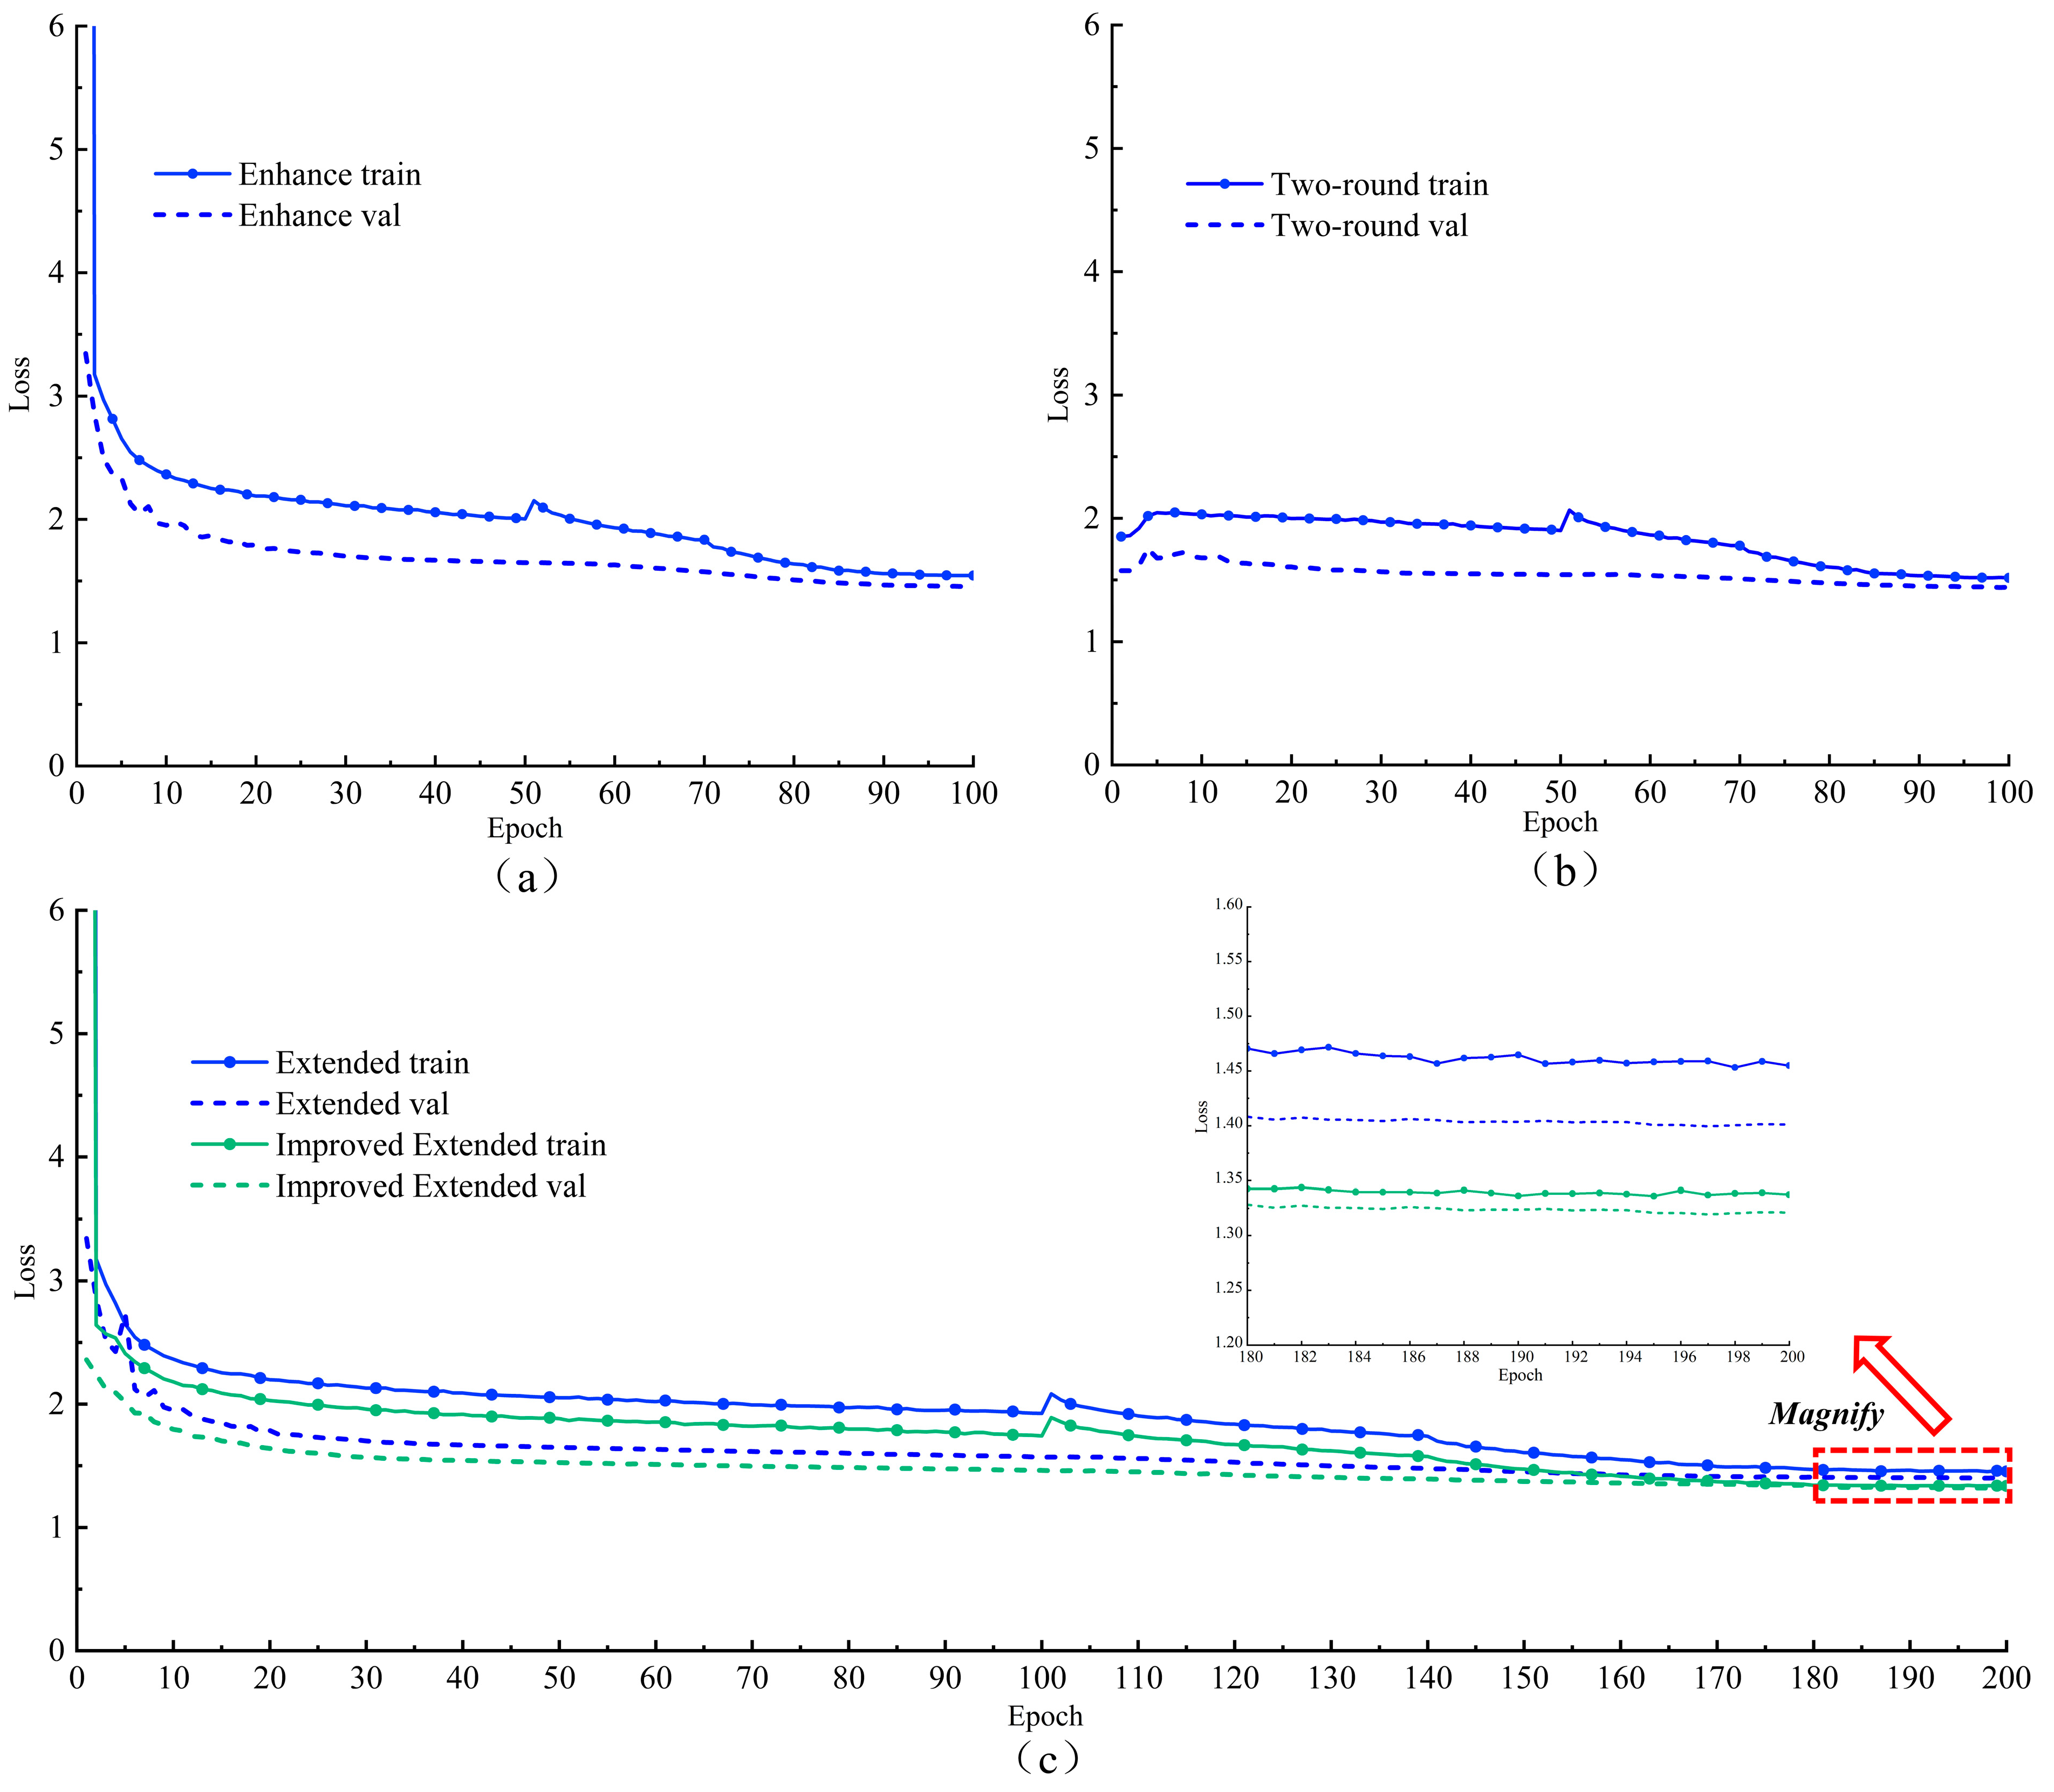
The loss behavior under three different training optimization strategies is illustrated in Figure 15. With the enhanced training strategy, the model initially exhibited a higher learning rate, and the loss function converged more rapidly, resulting in a final training loss of 1.544 and a validation loss of 1.456. The difference between the two is 0.088, with the loss values being lower than before enhancement, indicating that the enhanced training improves the generalization capability of the YOLOv8 network. In the loss curve of the two-round training, the training loss started relatively low, increased slightly after the freezing phase, and then steadily decreased back to the lowest value. The final training loss was 1.517, and the validation loss was 1.441, with a difference of 0.076. The difference in loss between the training and validation sets was lower than that of the enhanced training, indicating that the two-round training was more effective than the enhanced training strategy.
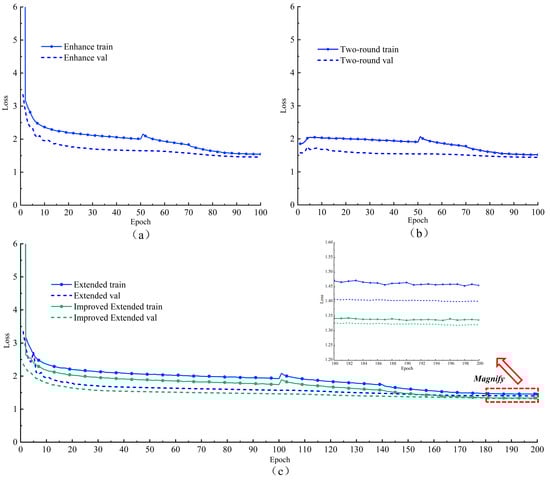
Figure 15.
Loss curves for different optimization strategies: (a) Enhanced training; (b) Two-round training; (c) Extended training.
During extended training, the loss curve converged more rapidly, with a sharp decline during the first 100 epochs. After unfreezing, the loss value initially decreased slowly, then gradually stabilized after the 140th epoch, and the model eventually reached saturation. The final training loss was 1.454, and the validation loss was 1.401, indicating that extended training no longer reduced the loss value but minimized the difference between the two, further enhancing the model’s generalization capability. From the magnified effect of the curve between the 180th and 200th epochs, the overall loss value of the improved Imp-YOLOv8 was lower than that of YOLOv8s, fluctuating in the range of 1.3 to 1.35. The final training loss was 1.337, and the validation loss was 1.321, with a difference of 0.016 between the two, indicating a better fit than that achieved with two-round training. In the experiment, the results after 200 epochs were already very satisfactory. If more epochs were added, overfitting might occur, significantly increasing energy consumption costs while reducing the corresponding benefits of the trained model.
Among all the training strategies, the Imp-YOLOv8 model with extended training performed the best. After comprehensively considering the model’s generalization and detection performance, this study selected the Imp-YOLOv8 network with the extended training optimization strategy as the primary object detection model.
3.1.3. Network Performance Evaluation Based on Different YOLOv8s Optimization Strategies
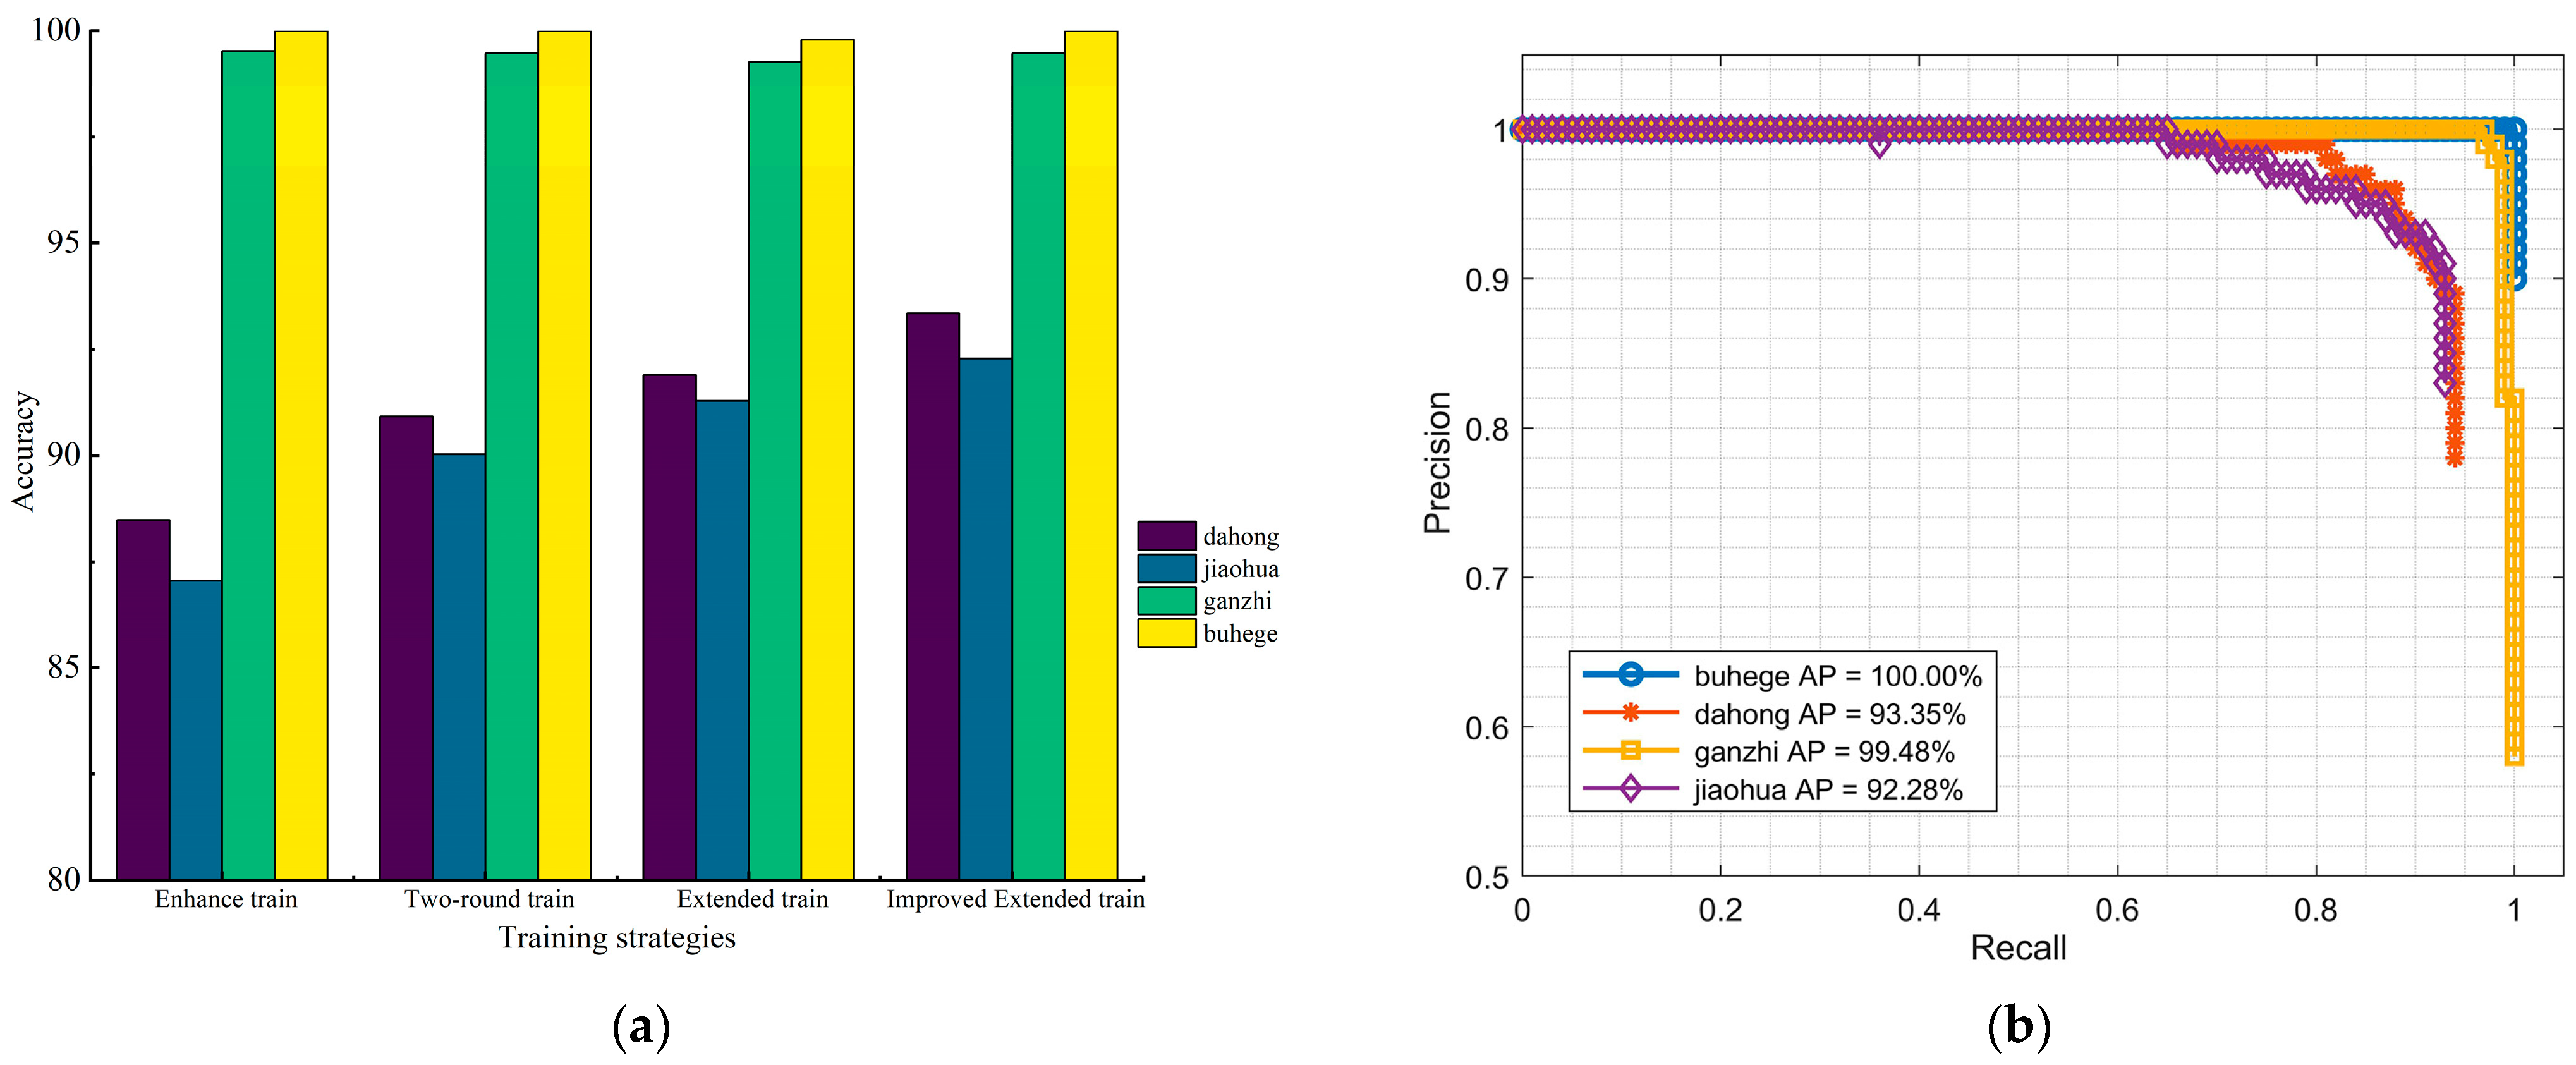
The model performance evaluation on the same test set is shown in Figure 16. Before optimization, the YOLOv8 network had recognition accuracies of 88.48%, 87.06%, 99.53%, and 100% for Dahong, Jiaohua, Ganzhi, and Buhege, respectively, with an overall mAP of 93.77%. The Imp-YOLOv8 with the extended strategy showed the best results, achieving the mAP of 96.28%, which is 2.51% higher than the original network. The recognition accuracies for Dahong and Jiaohua were 93.35% and 92.28%, respectively, representing improvements of 4.87 and 5.22 percentage points over the original network. As seen from the P-R curve in Figure 16b, the improved Imp-YOLOv8 performed very well in detecting all categories. The experimental results demonstrate that the training optimization strategies adopted in this study significantly improved the model’s performance.

Figure 16.
Network performance under different optimization strategies: (a) test results for each object under different optimization strategies; (b) P-R curves for each detection object in Imp-YOLOv8.
3.1.4. Comparison with Other Deep Learning Detection Models
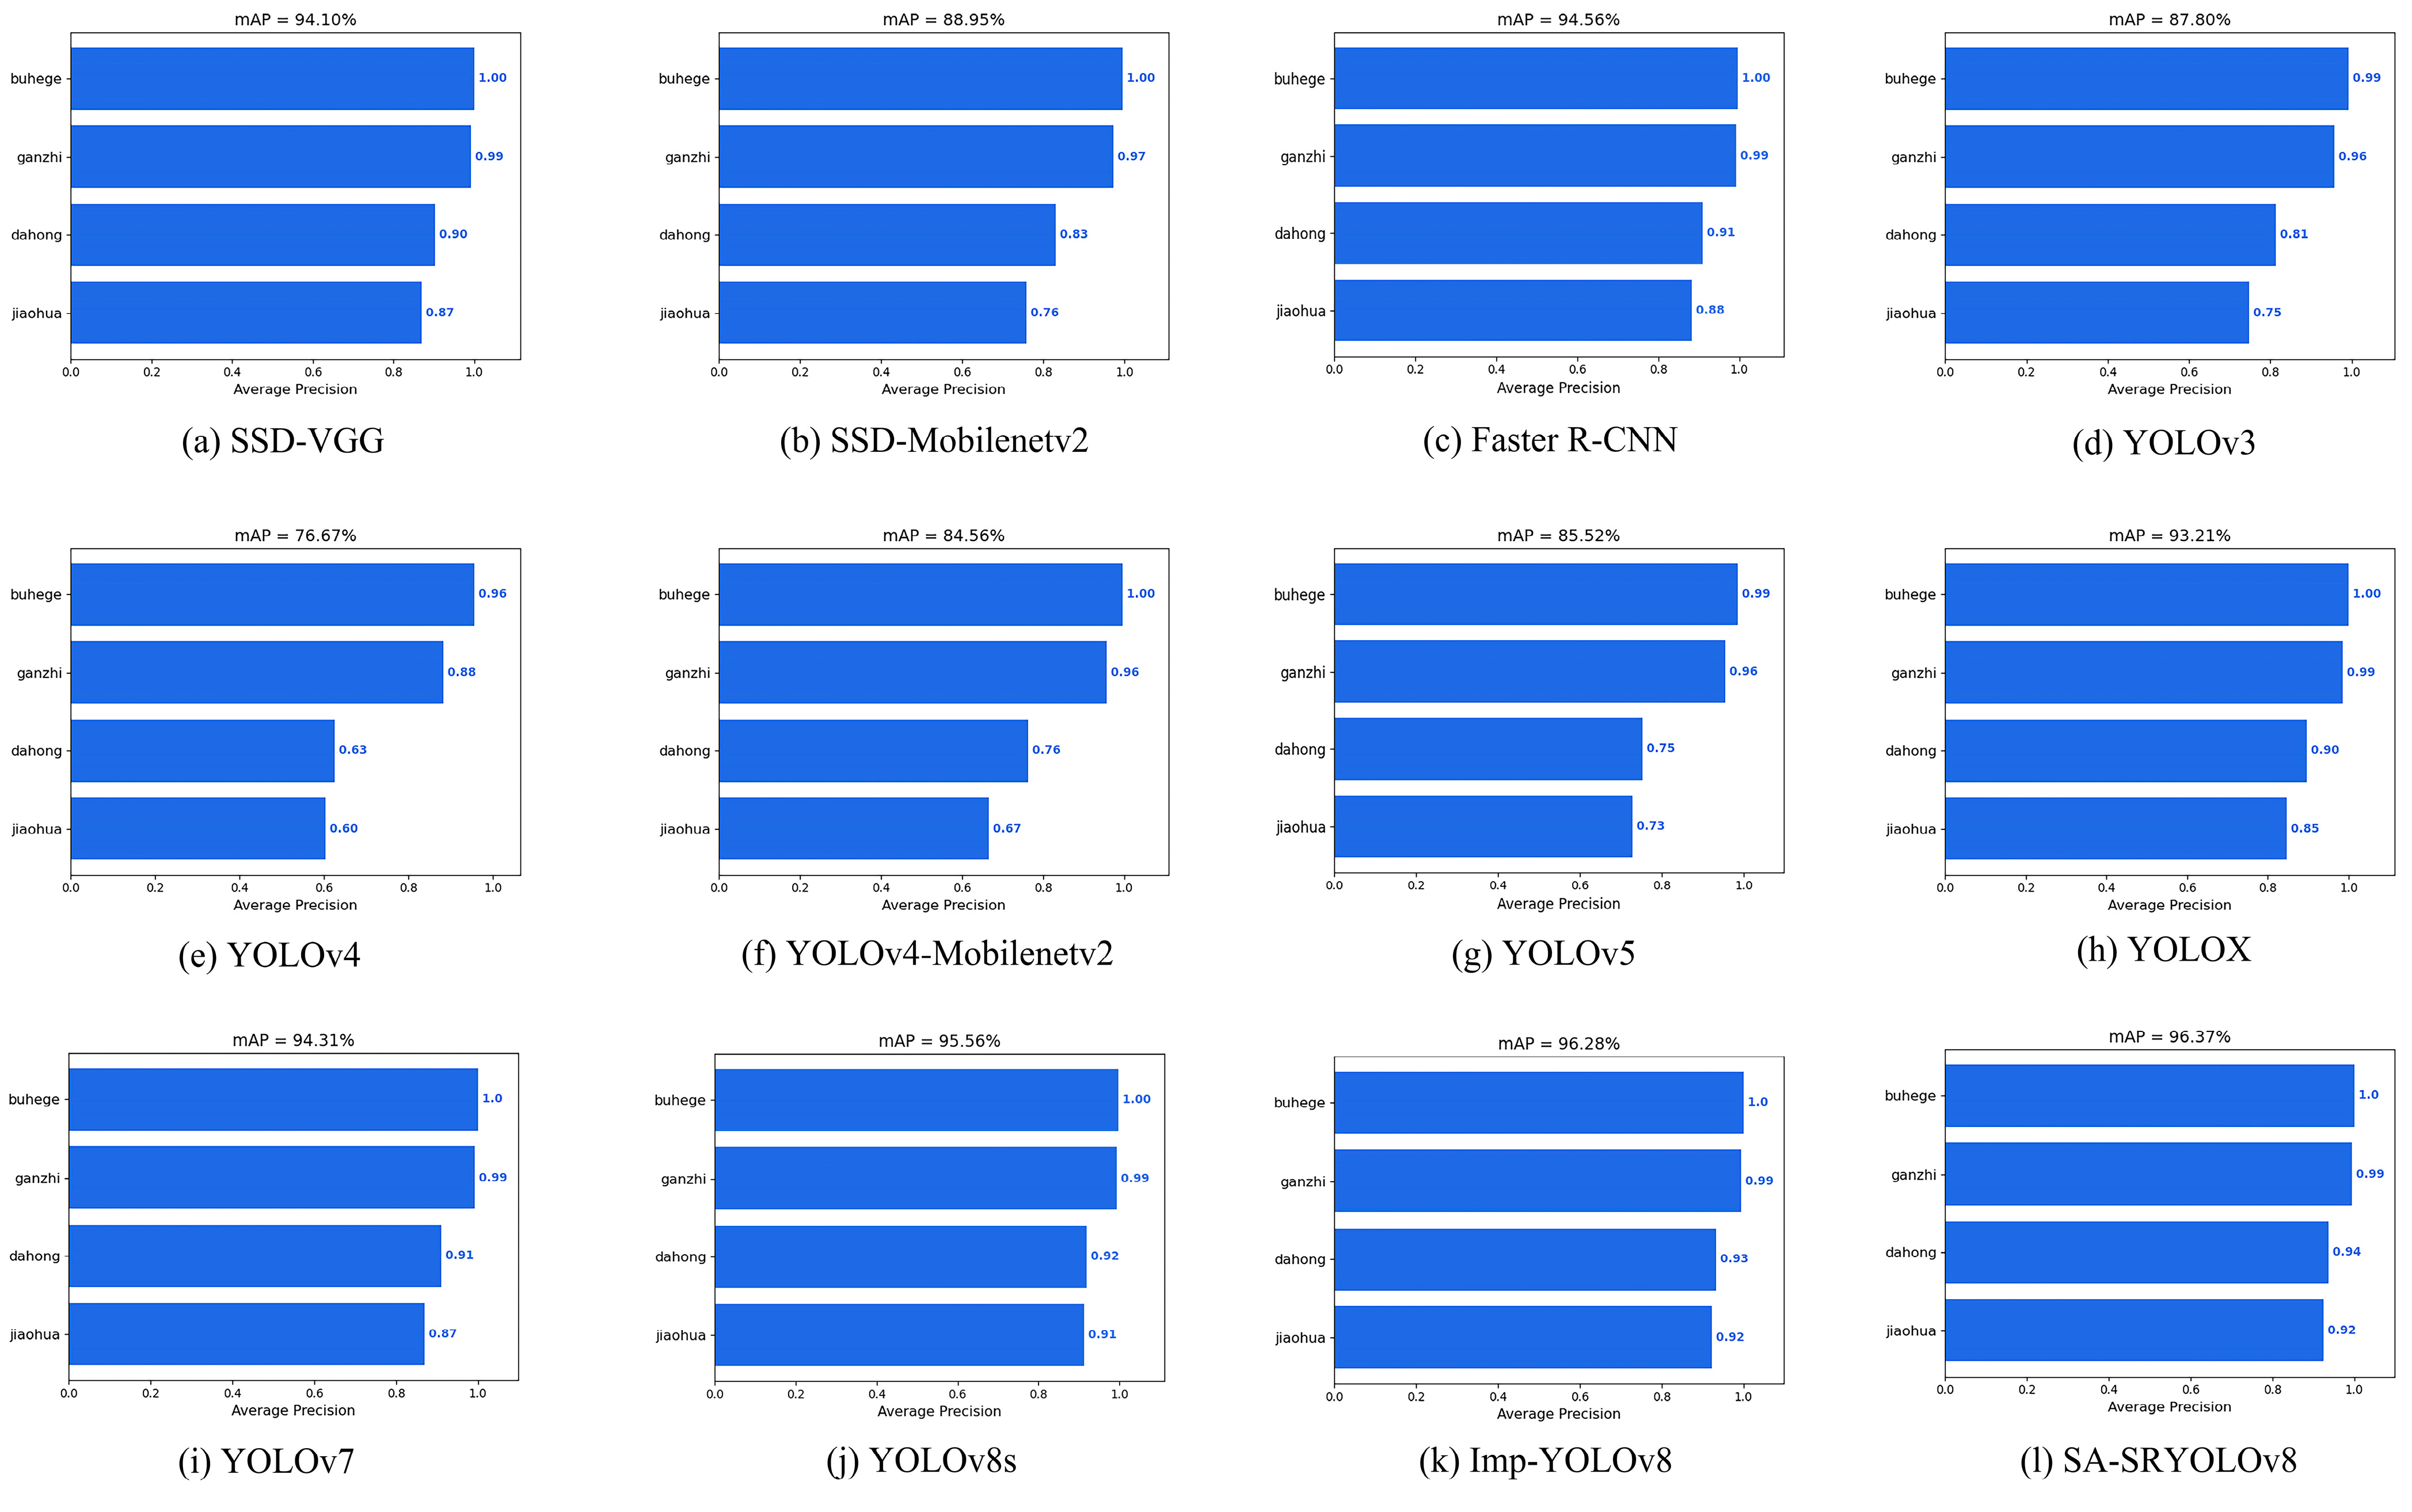
To evaluate the performance of the improved model for star anise detection, mainstream object detection algorithms such as SSD-VGG, SSD-Mobilenetv2, Faster R-CNN, YOLOv3, YOLOv4, YOLOv4-Mobilenetv2, YOLOv5s, YOLOXs, and YOLOv7 were applied to the same dataset and trained on the same configuration platform for performance evaluation. The results are shown in Table 6.
Table 6.
Performance testing of mainstream detection networks.
The results of the ablation experiment show that the improved model has significant improvements in P, R, F1, and other metrics when compared to other detection networks. The accuracy and inference speed of the Imp-YOLOv8 model are both higher than those of the original model. This indicates that the DSConv module, while maintaining convolution performance, enhances the feature extraction capability of the backbone network, allowing the network to capture more detailed category features. Although the SSD-Mobilenetv2 and SSD-VGG models have relatively smaller weights, their mAP is not as ideal as that of the improved model. The Faster R-CNN model has higher accuracy, but its model weight is large, making it less suitable as the primary model for detecting star anise categories. Compared to the other models, the SA-SRYOLOv8 model achieved the best mAP value. Due to the introduction of the front-end SRGAN network, the original model size increased, and the preprocessing of blurry images added time costs, resulting in a slight decrease in detection speed. However, considering all metrics, the cascade model showed the best overall performance.
Based on the analysis of the above results, the lightweight improvements to YOLOv8s, the introduction of the front-end SRGAN, and the optimized training strategies all effectively enhance the model’s performance. The cascade network improves model accuracy while maintaining balanced speed, and with its smaller model size and faster inference speed, it offers feasibility for subsequent deployment. The mAP detection results of the various models in this experiment are shown in Figure 17.
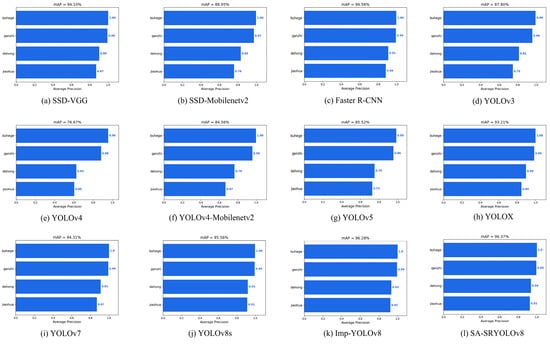
Figure 17.
mAP of mainstream detection networks.
3.2. Comparison of the Model’s Performance before and after Improvement
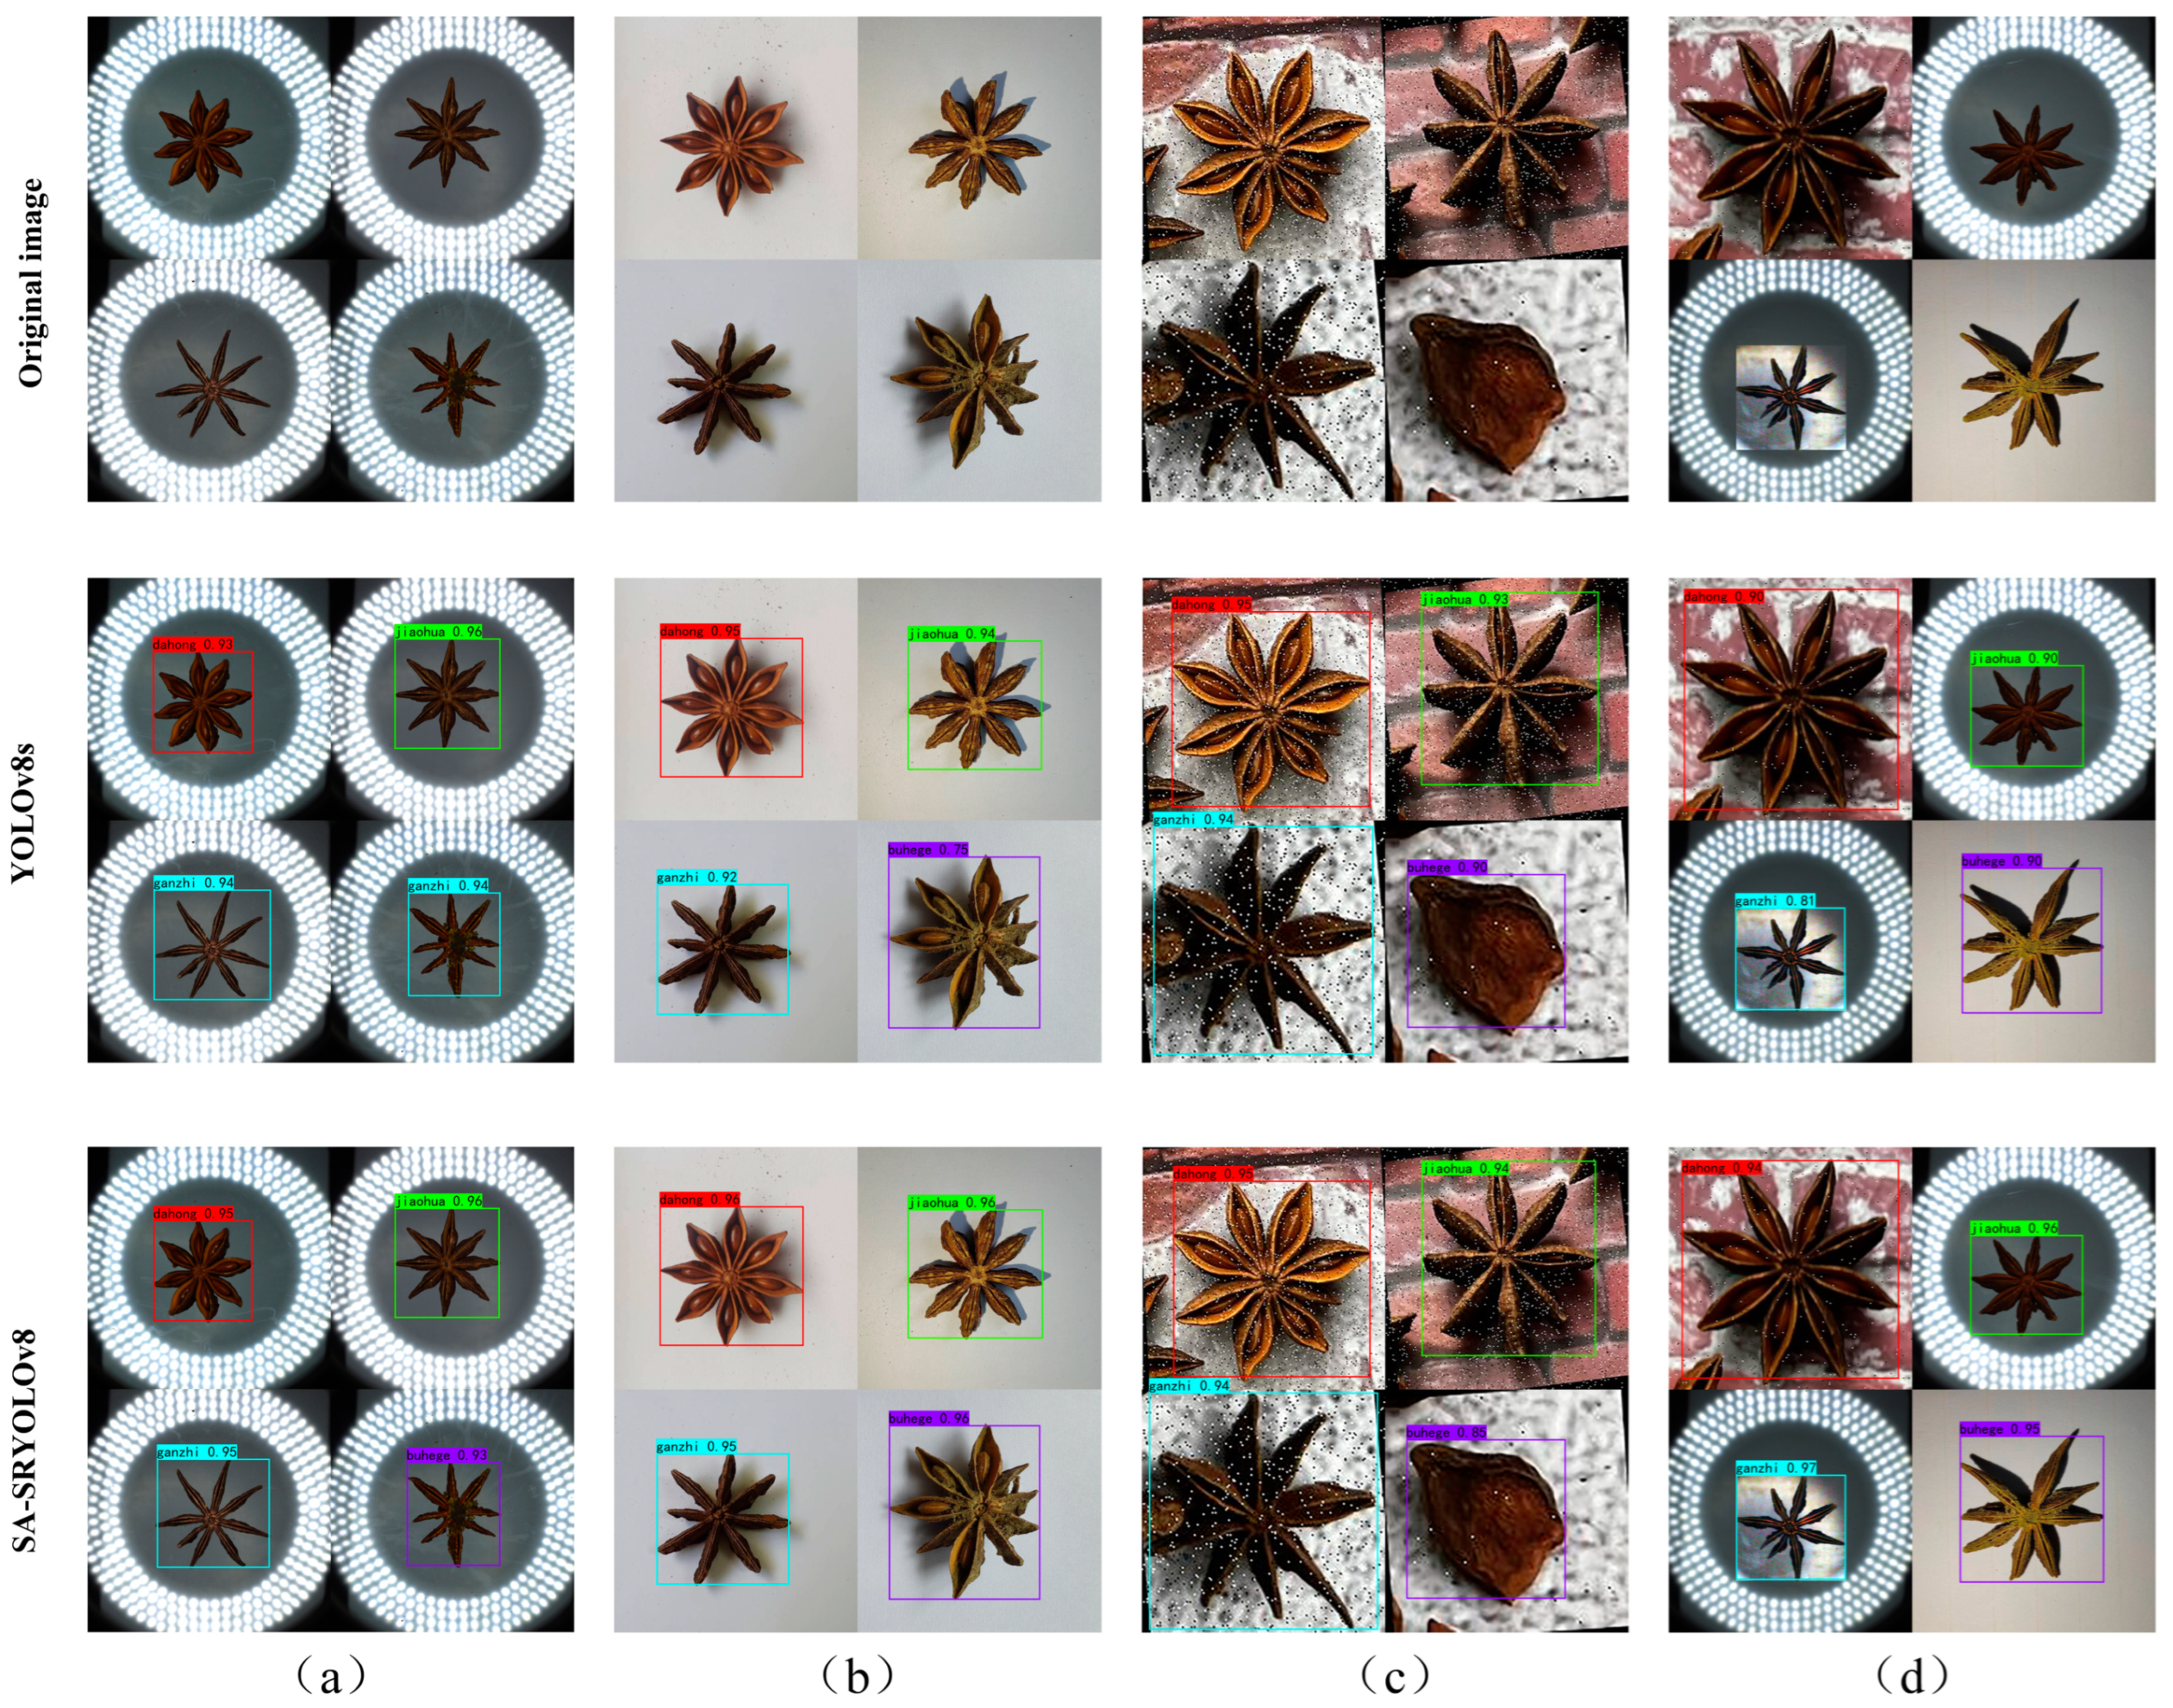
To validate the effectiveness of the proposed SA-SRYOLOv8 model for detecting star anise categories under different experimental conditions, an open dataset was used as the evaluation image set for assessing actual performance. Figure 18a shows the detection results on the turntable image set, Figure 18b on the high-resolution image set, Figure 18c on the open dataset, and Figure 18d on the diversified fusion image set. In terms of actual detection performance, the original YOLOv8s exhibited a misdetection in the Buhege category in Figure 18a, whereas the SA-SRYOLOv8 accurately identified the different star anise varieties with high confidence. This suggests that the network is more attentive to detailed features along the star anise edges and concave areas, while effectively filtering out irrelevant background information, as shown in Figure 18.
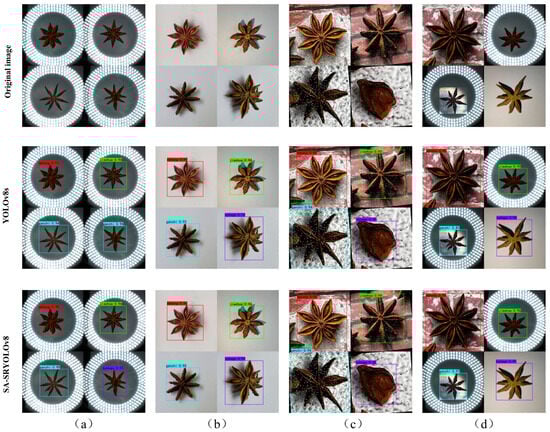
Figure 18.
Comparison of model performance before and after improvement: (a) detection results on the turntable image set; (b) detection results on the high-resolution image set; (c) detection results on the open image set; (d) detection results on the diversified fusion dataset.
3.3. Discussion
3.3.1. Detection Results for Blurry Images
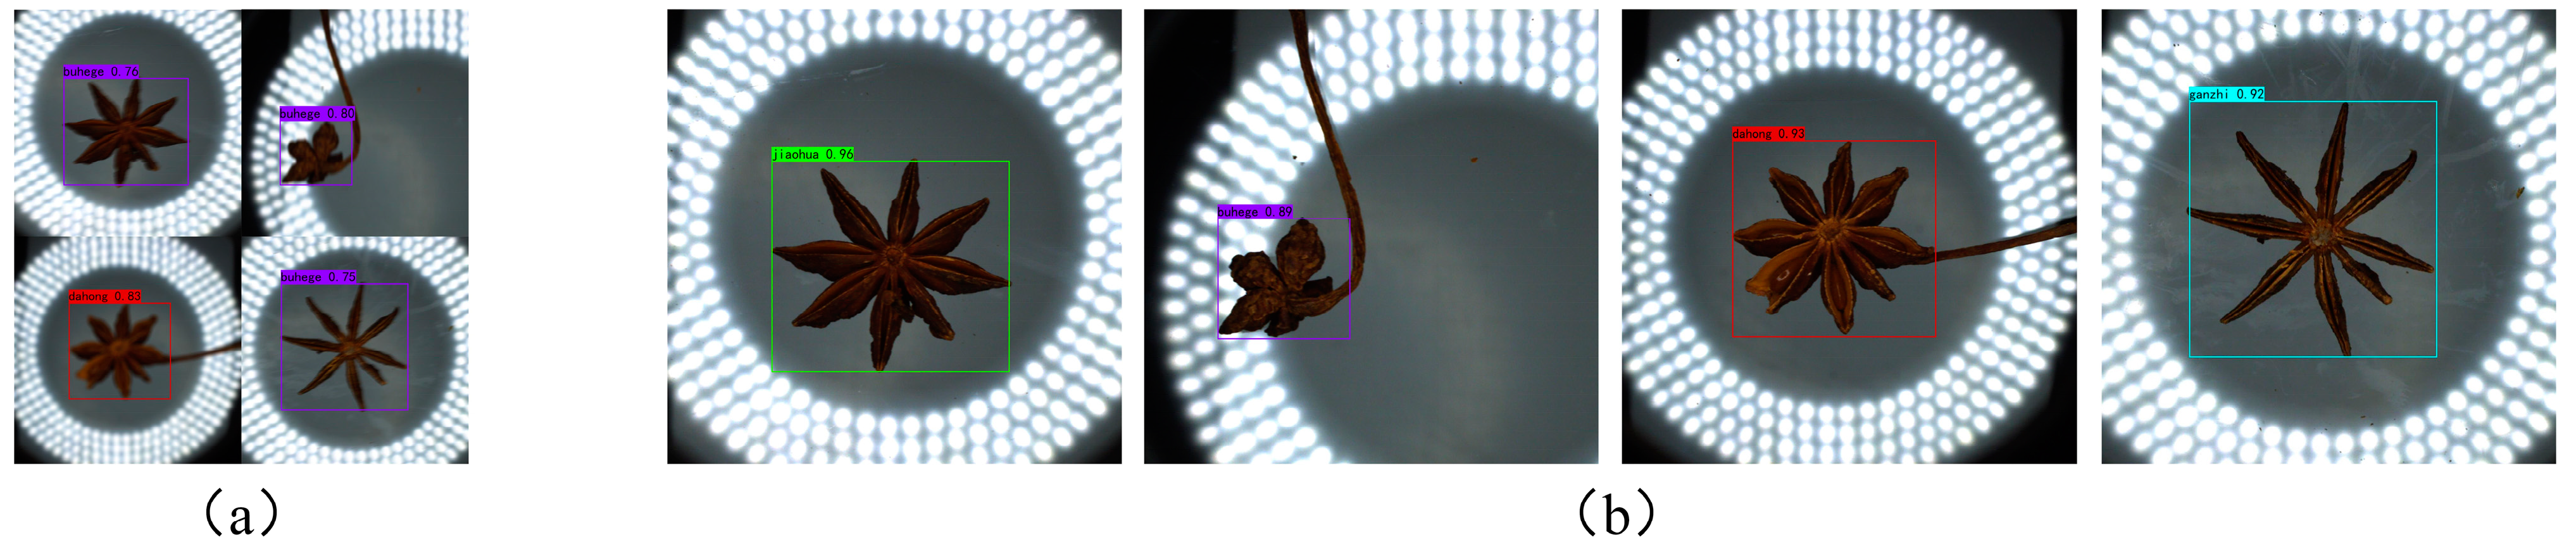
As shown in Figure 19, Imp-YOLOv8 exhibited misdetection when identifying blurry images in this experiment, indicating that the model’s ability to detect similar samples in blurry backgrounds is still insufficient, and its generalization needs improvement. In contrast, the SA-SRYOLOv8 model correctly predicted different categories of star anise, indicating that the front-end SRGAN module has a positive effect on YOLOv8’s recognition, significantly reducing misidentification issues caused by image blurriness.
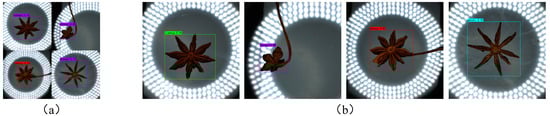
Figure 19.
Detection results: (a) direct detection on blurry images; (b) detection results on images processed by the front-end SRGAN.
The detection results of both the blurry images and those processed by SRGAN confirm the beneficial impact of the front-end SRGAN on the backbone network’s predictions, leading to enhanced detection accuracy across various categories. After processing, the image size increased fourfold, and the clarity improved significantly, effectively addressing the challenges of recognizing defocused and blurry images in motion capture. The proposed cascaded SA-SRYOLOv8 model demonstrates an enhanced ability to interpret targets in blurry images, focusing on key features while suppressing irrelevant information, achieving precise recognition even in complex or suboptimal environments, and offering better network generalization.
3.3.2. Three-Dimensional Comparison of Model Performance
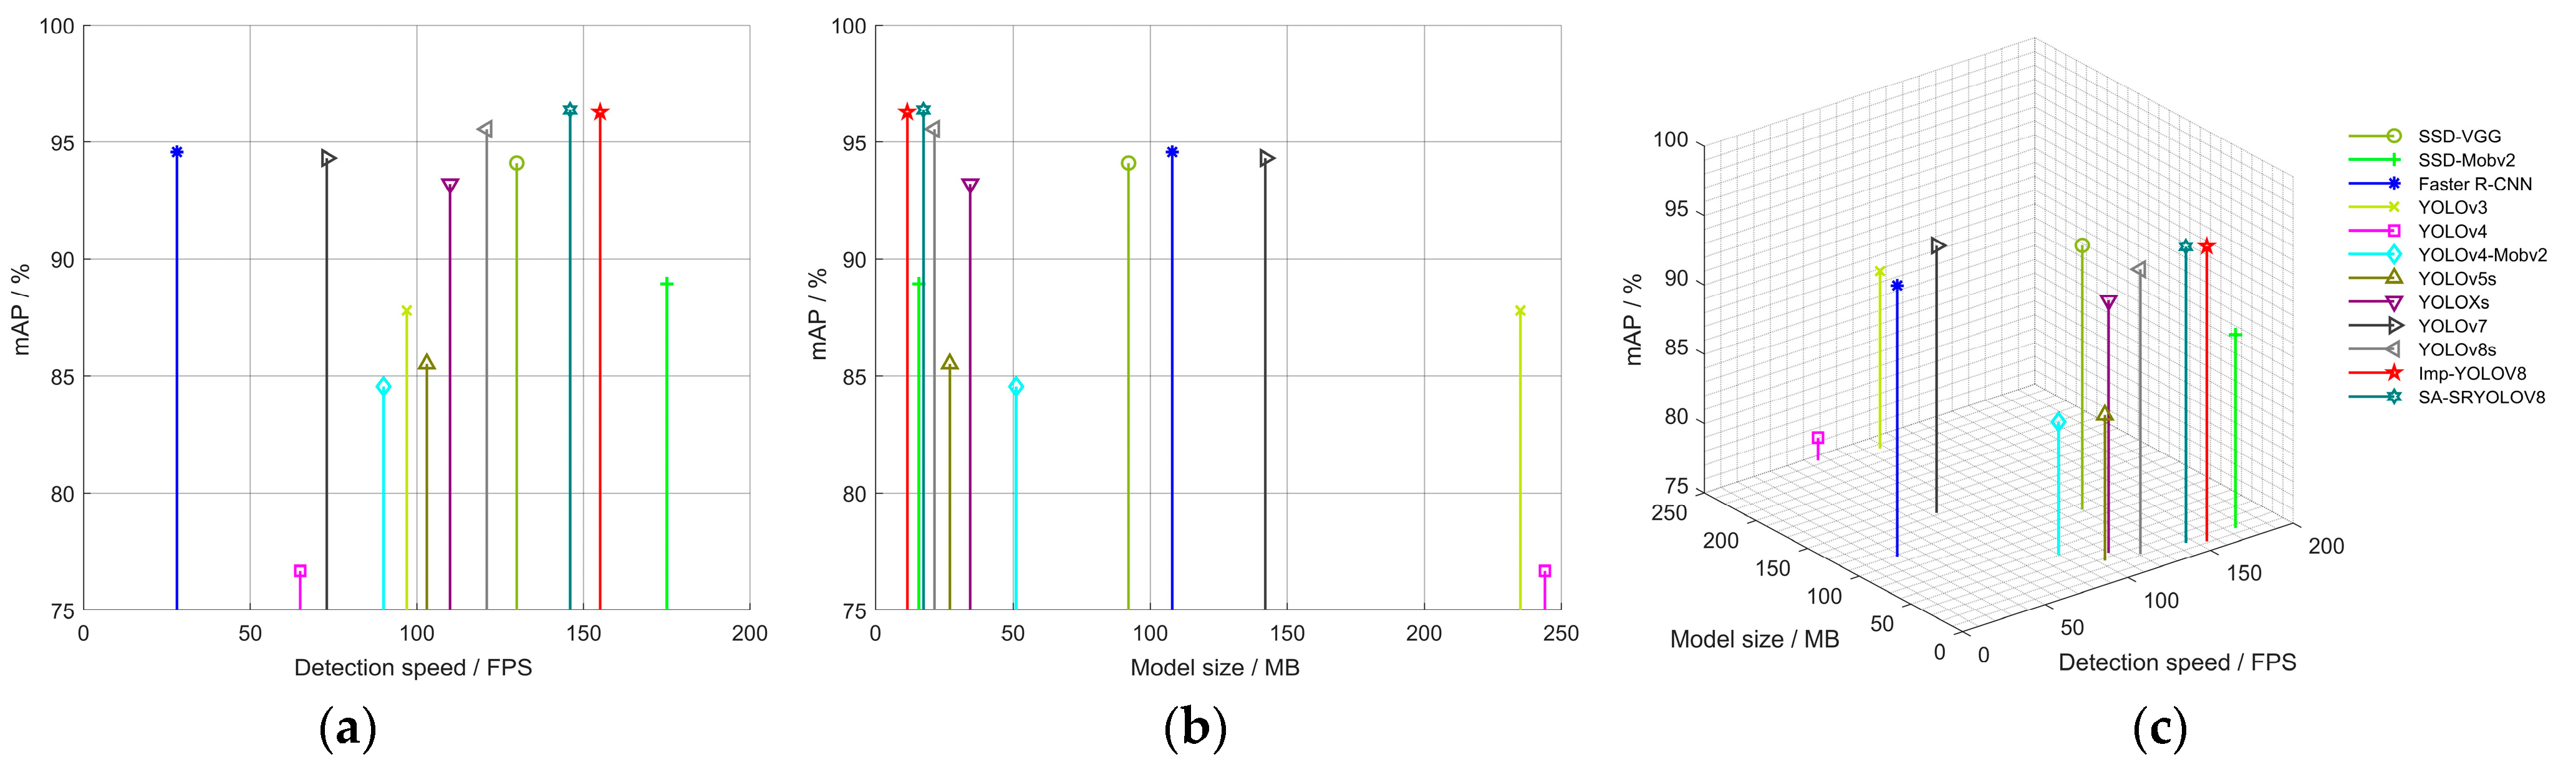
Figure 20 provides a comprehensive overview of the performance of various mainstream object detection networks based on three-dimensional metrics: recognition accuracy (mAP), detection speed (FPS), and weight parameter size (Model size). On the same dataset, the mAP of the YOLOv8 object detection network significantly surpasses that of other mainstream detection networks, with the performance metrics of Imp-YOLOv8 and SA-SRYOLOv8 standing out among all networks. While Imp-YOLOv8 has a smaller model size, SA-SRYOLOv8 offers greater advantages in terms of accuracy and detection speed. The cascaded model’s weight is only 17.5 MB, with a detection speed of 146 FPS, indicating that this approach achieves an optimal balance between network size, detection speed, and recognition accuracy. The cascaded neural network balances the size of a lightweight network while maintaining high performance.
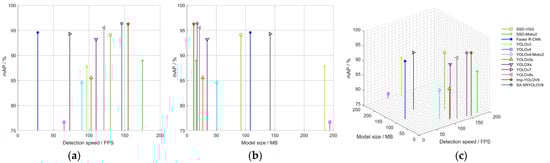
Figure 20.
Comprehensive performance comparison chart of various detection networks: (a) mAP and real-time frame rate performance chart; (b) performance diagram of mAP and model size; (c) three-dimensional graphs of different network performances.
3.3.3. Comparison with Related Studies
Against the backdrop of artificial intelligence, machine learning and deep learning have become widespread transformations. The research subjects listed in Table 7 primarily focus on the detection of agricultural products. The main task of these studies is to enhance the recognition capabilities of agricultural objects by formulating various optimization strategies on the original models to improve network performance, which illustrates the importance of improving network detection capability in distinguishing different categories of agricultural products.
Table 7.
Recent studies on agricultural product detection.
4. Conclusions
Research on the visual classification of star anise is currently limited, with existing studies primarily concentrated in botany, food science, and medicine. To bridge the data gap and support the classification of star anise, this study first collected and developed a diversified fusion image dataset specific to star anise. Next, recognizing the limitations of traditional machine learning in data processing and model generalization, this study enhanced the deep learning network model to be more lightweight, optimizing training strategies to improve the detection accuracy of different star anise categories. Finally, to address the issue of blurry images, an SRGAN super-resolution generative adversarial network was integrated into the front-end, forming a cascaded neural network. The main conclusions of this paper are as follows:
- (1)
- To enable category detection of star anise across various environments, an enhanced YOLOv8 network model was developed. This study compared image enhancement training, two-round optimization, and extended training methods, concluding that the lightweight model with extended training delivered the best performance. To evaluate the model’s real-time detection performance for star anise categories, ablation experiments were conducted under the same experimental environment and test-set conditions. The experimental results demonstrated that the cascade model improved mAP by 0.81%, reduced computation by 6.574 M, and decreased model size by 3.8 MB compared to the original YOLOv8 model. The proposed cascade model achieved higher recognition accuracy, smaller model size, and better overall performance.
- (2)
- To address the issue of blurry images, this study employed a lightweight cascaded neural network by introducing a front-end SRGAN super-resolution generative adversarial network to assist the subsequent YOLOv8 model in its predictions. Before the blurry images are input into the primary recognition network, the images are enlarged and their resolution is enhanced, ensuring accurate recognition by the subsequent primary recognition network and mitigating the information loss issue present in the original YOLOv8 when processing blurry images. Similarly, the integration of the front-end network effectively resolved misidentification issues caused by low mAP recognition accuracy for Dahong and Jiaohua varieties due to image blurriness, enhancing the recognition accuracy of similar categories that are easily confused. The comparison of actual detection results indicates that the cascade model not only delivered superior detection outcomes but also exhibited a broader receptive field, establishing it as an effective approach for real-time detection of star anise categories across various environments.
- (3)
- Additionally, this study optimized the model’s performance by expanding the diversified fusion dataset, improving its applicability on edge devices, and offering a more reliable and efficient solution for detecting other small agricultural products. Implementing this system on mobile devices for image processing offers significant potential, particularly for the detection of star anise varieties on mobile platforms. This will open up practical applications for the developed system in star anise variety detection, especially in complex environments such as fields or markets, enabling convenient and efficient classification of varieties.
This research offers valuable insights into the deployment and application of star anise detection models in complex environments. In future research, the detection model for star anise will be further improved and its application extended to other fields such as spices and traditional Chinese medicine. The methods employed in this study are feasible and provide valuable reference and guidance for the intelligent development in the star anise industry.
Author Contributions
Collected data on star anise, H.C., F.Z. and C.G.; analyzed the data, H.C., F.Z. and X.M.; wrote the paper, H.C. and F.Z.; drafted the diagrams in this paper, H.C., F.Z. and X.M.; reviewed and edited the paper, H.C., F.Z., C.G., J.Y. and X.M. All authors have read and agreed to the published version of the manuscript.
Funding
This research was supported by the Major Science and Technology Projects in Yunnan Province (202102AE090050 and 202302AH360003).
Data Availability Statement
The original contributions of this study are comprehensively presented in the article, including all data in the form of figures and tables.
Acknowledgments
The authors thank all the reviewers who participated in the review.
Conflicts of Interest
The authors declare no conflicts of interest.
References
- Jahanbakhshi, A.; Abbaspour-Gilandeh, Y.; Heidarbeigi, K.; Momeny, M. Detection of Fraud in Ginger Powder Using an Automatic Sorting System Based on Image Processing Technique and Deep Learning. Comput. Biol. Med. 2021, 136, 104764. [Google Scholar] [CrossRef] [PubMed]
- Zou, Q.; Huang, Y.; Zhang, W.; Lu, C.; Yuan, J. A Comprehensive Review of the Pharmacology, Chemistry, Traditional Uses and Quality Control of Star Anise (Illicium verum Hook. F.): An Aromatic Medicinal Plant. Molecules 2023, 28, 7378. [Google Scholar] [PubMed]
- Sharafan, M.; Jafernik, K.; Ekiert, H.; Kubica, P.; Kocjan, R.; Blicharska, E.; Szopa, A. Illicium verum (Star Anise) and Trans-Anethole as Valuable Raw Materials for Medicinal and Cosmetic Applications. Molecules 2022, 27, 650. [Google Scholar] [CrossRef] [PubMed]
- He, Z.; Huan, J.; Ye, M.; Liang, D.; Wu, Y.; Li, W.; Gong, X.; Jiang, L. Based on Citespace Insights into Illicium verum Hook. F. Current Hotspots and Emerging Trends and China Resources Distribution. Foods 2024, 13, 1510. [Google Scholar] [PubMed]
- Patrício, D.I.; Rieder, R. Computer Vision and Artificial Intelligence in Precision Agriculture for Grain Crops: A Systematic Review. Comput. Electron. Agric. 2018, 153, 69–81. [Google Scholar] [CrossRef]
- Lv, X.; Zhang, X.; Gao, H.; He, T.; Lv, Z.; Zhangzhong, L. When Crops Meet Machine Vision: A Review and Development Framework for a Low-Cost Nondestructive Online Monitoring Technology in Agricultural Production. Agric. Commun. 2024, 2, 100029. [Google Scholar] [CrossRef]
- An, M.; Cao, C.; Wu, Z.; Luo, K. Detection Method for Walnut Shell-Kernel Separation Accuracy Based on near-Infrared Spectroscopy. Sensors 2022, 22, 8301. [Google Scholar] [CrossRef]
- Zhu, Y.; Fan, S.; Zuo, M.; Zhang, B.; Zhu, Q.; Kong, J. Discrimination of New and Aged Seeds Based on on-Line near-Infrared Spectroscopy Technology Combined with Machine Learning. Foods 2024, 13, 1570. [Google Scholar] [CrossRef]
- Xu, J.; Xu, D.; Bai, X.; Yang, R.; Cao, J. Non-Destructive Detection of Moldy Walnuts Based on Hyperspectral Imaging Technology. Molecules 2022, 27, 6776. [Google Scholar] [CrossRef]
- Santos Pereira, F.L.; Barbon, S.; Valous, N.A.; Barbin, D.F. Predicting the Ripening of Papaya Fruit with Digital Imaging and Random Forests. Comput. Electron. Agric. 2018, 145, 76–82. [Google Scholar] [CrossRef]
- Li, Z.; Wang, D.; Zhu, T.; Tao, Y.; Ni, C. Review of Deep Learning-Based Methods for Non-Destructive Evaluation of Agricultural Products. Biosyst. Eng. 2024, 245, 56–83. [Google Scholar] [CrossRef]
- Rehman, T.U.; Mahmud, M.S.; Chang, Y.K.; Jin, J.; Shin, J. Current and Future Applications of Statistical Machine Learning Algorithms for Agricultural Machine Vision Systems. Comput. Electron. Agric. 2019, 156, 585–605. [Google Scholar] [CrossRef]
- Xiong, H.; Xiao, Y.; Zhao, H.; Xuan, K.; Zhao, Y.; Li, J. Ad-Yolov5: An Object Detection Approach for Key Parts of Sika Deer Based on Deep Learning. Comput. Electron. Agric. 2024, 217, 108610. [Google Scholar] [CrossRef]
- Zhu, L.; Spachos, P.; Pensini, E.; Plataniotis, K.N. Deep Learning and Machine Vision for Food Processing: A Survey. Curr. Res. Food Sci. 2021, 4, 233–249. [Google Scholar] [CrossRef]
- Duan, X.; Lin, Y.; Li, L.; Zhang, F.; Li, S.; Liao, Y. Hierarchical Detection of Gastrodia Elata Based on Improved Yolox. Agronomy 2023, 13, 1477. [Google Scholar] [CrossRef]
- Wang, D.; Dai, D.; Zheng, J.; Li, L.; Kang, H.; Zheng, X. Wt-Yolom: An Improved Target Detection Model Based on Yolov4 for Endogenous Impurity in Walnuts. Agronomy 2023, 13, 1462. [Google Scholar] [CrossRef]
- Xue, Q.; Miao, P.; Miao, K.; Yu, Y.; Li, Z. An Online Automatic Sorting System for Defective Ginseng Radix Et Rhizoma Rubra Using Deep Learning. Chin. Herb. Med. 2023, 15, 447–456. [Google Scholar] [CrossRef]
- Wang, F.; Lv, C.; Dong, L.; Li, X.; Guo, P.; Zhao, B. Development of Effective Model for Non-Destructive Detection of Defective Kiwifruit Based on Graded Lines. Front. Plant Sci. 2023, 14, 1170221. [Google Scholar] [CrossRef]
- Yang, G.; Wang, J.; Nie, Z.; Yang, H.; Yu, S. A Lightweight Yolov8 Tomato Detection Algorithm Combining Feature Enhancement and Attention. Agronomy 2023, 13, 1824. [Google Scholar] [CrossRef]
- Liu, Z.; Wang, L.; Liu, Z.; Wang, X.; Hu, C.; Xing, J. Detection of Cotton Seed Damage Based on Improved Yolov5. Processes 2023, 11, 2682. [Google Scholar] [CrossRef]
- Xie, S.; Sun, H. Tea-Yolov8s: A Tea Bud Detection Model Based on Deep Learning and Computer Vision. Sensors 2023, 23, 6576. [Google Scholar] [CrossRef] [PubMed]
- Zhao, Y.; Lin, C.; Wu, N.; Xu, X. Apeiou Integration for Enhanced Yolov7: Achieving Efficient Plant Disease Detection. Agriculture 2024, 14, 820. [Google Scholar] [CrossRef]
- Badgujar, C.M.; Poulose, A.; Gan, H. Agricultural Object Detection with You Only Look Once (Yolo) Algorithm: A Bibliometric and Systematic Literature Review. Comput. Electron. Agric. 2024, 223, 109090. [Google Scholar] [CrossRef]
- GB/T 7652—2016; Star Anise. Standardization Administration of the People’s Republic of China: Beijing, China, 2016.
- Zhang, S.; Wang, D.; Yu, C. Apple Leaf Disease Recognition Method Based on Siamese Dilated Inception Network with Less Training Samples. Comput. Electron. Agric. 2023, 213, 108188. [Google Scholar] [CrossRef]
- Salari, A.; Djavadifar, A.; Liu, X.; Najjaran, H. Object Recognition Datasets and Challenges: A Review. Neurocomputing 2022, 495, 129–152. [Google Scholar] [CrossRef]
- Hussain, M. Yolo-V1 to Yolo-V8, the Rise of Yolo and Its Complementary Nature toward Digital Manufacturing and Industrial Defect Detection. Machines 2023, 11, 677. [Google Scholar] [CrossRef]
- Yang, W.; Wu, J.; Zhang, J.; Gao, K.; Du, R.; Wu, Z.; Firkat, E.; Li, D. Deformable Convolution and Coordinate Attention for Fast Cattle Detection. Comput. Electron. Agric. 2023, 211, 108006. [Google Scholar] [CrossRef]
- Hao, F.; Zhang, T.; He, G.; Dou, R.; Meng, C. Casnli-Yolo: Construction Site Multi-Target Detection Method Based on Improved Yolov5s. Meas. Sci. Technol. 2024, 35, 085202. [Google Scholar] [CrossRef]
- Cao, Y.; Pang, D.; Zhao, Q.; Yan, Y.; Jiang, Y.; Tian, C.; Wang, F.; Li, J. Improved Yolov8-Gd Deep Learning Model for Defect Detection in Electroluminescence Images of Solar Photovoltaic Modules. Eng. Appl. Artif. Intell. 2024, 131, 107866. [Google Scholar] [CrossRef]
- Song, J.; Yi, H.; Xu, W.; Li, X.; Li, B.; Liu, Y. Esrgan-Dp: Enhanced Super-Resolution Generative Adversarial Network with Adaptive Dual Perceptual Loss. Heliyon 2023, 9, e15134. [Google Scholar] [CrossRef]
- Wang, X.; Yu, K.; Wu, S.; Gu, J.; Liu, Y.; Dong, C.; Qiao, Y.; Loy, C.C. Esrgan: Enhanced Super-Resolution Generative Adversarial Networks. In Proceedings of the European Conference on Computer Vision (ECCV) Workshops, Munich, Germany, 8–14 September 2018; pp. 63–79. [Google Scholar]
- Chen, S.; Dai, D.; Zheng, J.; Kang, H.; Wang, D.; Zheng, X.; Gu, X.; Mo, J.; Luo, Z. Intelligent Grading Method for Walnut Kernels Based on Deep Learning and Physiological Indicators. Front. Nutr. 2023, 9, 1075781. [Google Scholar] [CrossRef] [PubMed]
- Deng, R.; Cheng, W.; Liu, H.; Hou, D.; Zhong, X.; Huang, Z.; Xie, B.; Yin, N. Automatic Identification of Sea Rice Grains in Complex Field Environment Based on Deep Learning. Agriculture 2024, 14, 1135. [Google Scholar] [CrossRef]
- Zhang, F.; Lv, Z.; Zhang, H.; Guo, J.; Wang, J.; Lu, T.; Zhangzhong, L. Verification of Improved Yolox Model in Detection of Greenhouse Crop Organs: Considering Tomato as Example. Comput. Electron. Agric. 2023, 205, 107582. [Google Scholar] [CrossRef]
- Ma, X.; Li, Y.; Wan, L.; Xu, Z.; Song, J.; Huang, J. Classification of Seed Corn Ears Based on Custom Lightweight Convolutional Neural Network and Improved Training Strategies. Eng. Appl. Artif. Intell. 2023, 120, 105936. [Google Scholar] [CrossRef]
- Li, H.; Hao, Y.; Wu, W.; Tu, K.; Xu, Y.; Zhang, H.; Mao, Y.; Sun, Q. Rapid Detection of Turtle Cracks in Corn Seed Based on Reflected and Transmitted Images Combined with Deep Learning Method. Microchem. J. 2024, 201, 110698. [Google Scholar] [CrossRef]
- Yang, S.; Xing, Z.; Wang, H.; Dong, X.; Gao, X.; Liu, Z.; Zhang, X.; Li, S.; Zhao, Y. Maize-Yolo: A New High-Precision and Real-Time Method for Maize Pest Detection. Insects 2023, 14, 278. [Google Scholar] [CrossRef]
- Li, X.; Wu, J.; Bai, T.; Wu, C.; He, Y.; Huang, J.; Li, X.; Shi, Z.; Hou, K. Variety Classification and Identification of Jujube Based on near-Infrared Spectroscopy and 1d-Cnn. Comput. Electron. Agric. 2024, 223, 109122. [Google Scholar] [CrossRef]


Disclaimer/Publisher’s Note: The statements, opinions and data contained in all publications are solely those of the individual author(s) and contributor(s) and not of MDPI and/or the editor(s). MDPI and/or the editor(s) disclaim responsibility for any injury to people or property resulting from any ideas, methods, instructions or products referred to in the content. |
© 2024 by the authors. Licensee MDPI, Basel, Switzerland. This article is an open access article distributed under the terms and conditions of the Creative Commons Attribution (CC BY) license (https://creativecommons.org/licenses/by/4.0/).