Abstract
Field robots are an important tool when improving the efficiency and decreasing the climatic impact of food production. Although several commercial field robots are available, the advantages, limitations, and optimal utilization methods of this technology are still not well understood due to its novelty. This study aims to evaluate the performance of a commercial field robot for seeding and weeding tasks. The evaluation was carried out in a 2-hectare sugar beet field. The robot’s performance was assessed by counting plants and weeds using image processing. The YOLOv8 model was trained to detect sugar beets and weeds. The plant and weed densities were compared on a robotically weeded area of the field, a chemically weeded control area, and an untreated control area. The average weed density on the robotically treated area was about two times lower than that on the untreated area and about three times higher than on the chemically treated area. The testing robot in the specific testing environment and mode showed intermediate results, weeding a majority of the weeds between the rows; however, it left the most harmful weeds close to the plants. Software for robot performance assessment can be used for monitoring robot performance and plant conditions several times during plant growth according to the weeding frequency.
1. Introduction
Commercial agricultural robotics [1], and particularly field robots [2], are a relatively new area in precision agriculture, which still requires research and analysis of such aspects as sustainable food production, autonomy regulations, business models and economic feasibility, farmers attitude, etc. [3,4,5,6]. The performance of dedicated tasks is one of the most significant factors for using a robot. The ROSE challenge [7] was organized particularly to evaluate the detection and actuation performance of weeding robots using image processing for the weed detection. Moreover, Bawden et al. [8] described the assessment of a weeding robot performance on a 0.1 ha field, but without technical details. Wu X. et al. [9] evaluated the success rates of selectively spraying and mechanically removing weeds manually, while Jiang et al. [10] used NDVI. Gerhards et al. [11] used manual plant counting to compare a number of commercial weeding robots, which partially used the exact plant location for the plant and weed localization. However, we did not find studies including the estimation of robot performance for weed detection on a field scale.
Field robots could become a regular farm tool partially due to advancements in image processing for plant detection in real agricultural environments based on the image processing hardware, machine learning algorithms, and a growing number of available datasets [12,13,14]. For food production in fields, methods are being developed mainly for the detection of weeds [15,16,17] and main crops, like corn [18], peanuts [19], and others [20].
A number of models were developed for weed detection in sugar beet fields, where a number of datasets and different domain adaptation and generalization techniques were used. Gao et al. [21] used a YOLO-based model and the LincolnBeet dataset [22]. Guo et al. [23] used a RetinaNet-based model and the SugarBeets2016 dataset [24]. Salazar-Gomez et al. [22] and Darbyshire et al. [25] tested different models with the SugarBeets2016 and LincolnBeet datasets separately. Milioto et al. [26] used a custom model and the SugarBeets2016 dataset. Different analyses for the applicability of sugar beet detecting models were performed by Lottes et al. [27], Bertoglio et al. [28], and Magistri et al. [29]. The developed methods can be used for a field scale assessment of the robot’s performance.
Factors influencing farmers’ decisions to use robots as well as improvements in the robot’s design made by manufacturers still require additional study and feedback regarding the real environment. In addition, studies on the influence of the number of weeds on the yield were not found. In this study, the performance of a commercial field weeding robot and individual plant and weed growth were analyzed on a field scale. A method for sugar beet and weed detection was developed and published together with a new large dataset used for training. The method for the accuracy analysis was transformed to a robot-based field monitoring tool that is available for farmers and researchers.
2. Materials and Methods
2.1. Field and Crop
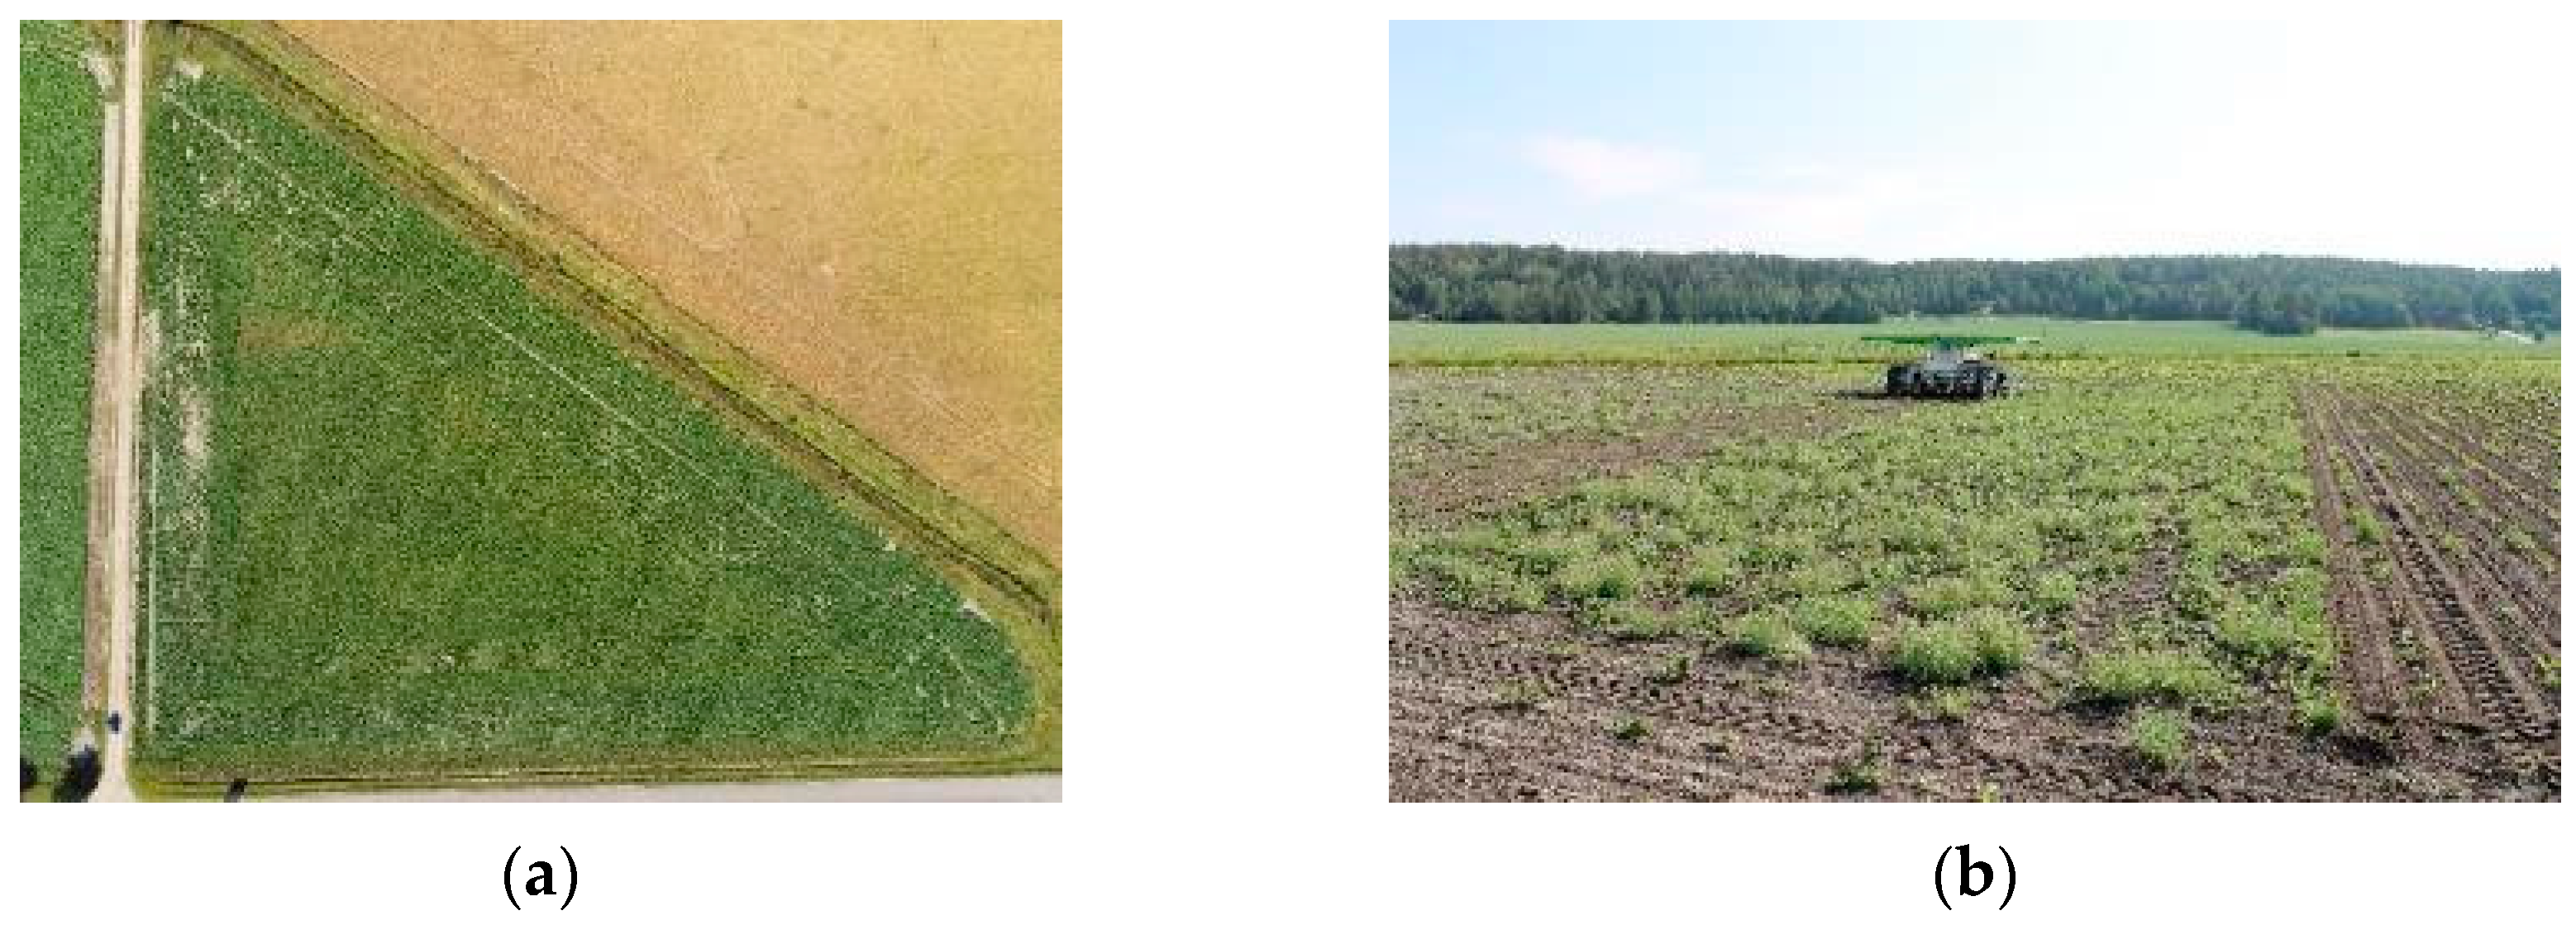
The experiments were conducted in 2023 on a research sugar beet field (Sokerijuurikkaan Tutkimuslaitos, Hevonpää, Finland, Figure 1) with a clay soil type, which had been plowed, cultivated, and fertilized by a separate drilling machine before sowing. The sugar beet was sowed on a 2 ha research field on 27 April and emerged on 15–20 May. The robotic weeding was conducted on 15, 23, and 30 May, 7, 13, and 27 June, and 11 July. The field was divided into areas weeded by the robot, and control areas which were chemically treated and untreated.

Figure 1.
Experimental research 2 ha sugar beet fields (a) and a view of the FarmDroid 20 weeding robot with robotically weeded and untreated field areas (b).
2.2. Robot
A seeding and weeding field robot (FD20, FarmDroid ApS, Vejen, Denmark) was tested in this study. The robot was equipped with six seeding tools with seeding disks designed for sowing sugar beets at 18 cm distances and six weeding tools, operating passively between rows, harrowing with hoes, and actively hoe cutting inside the rows between the plants. The robot moved at a maximal speed of 0.7 km/h. During the experiments, the safety distance between the active cutting hoe and plants was set at 4 cm before the plant and 5 cm after the plant.
2.3. Image Recording
An activity camera (Hero 11, GoPro, CA, USA) with a resolution of 5568 × 4872 pixels was installed on a boom attached to the robot at a 2 m height, resulting in a space resolution of about 1380 pixel/meter and a side overlap of about 25% (Figure 2a). The camera was operated in an automatic mode collecting RGB images every 10 s, resulting in about a 40% overlap in the motion direction. The boom was made of a 2 m long aluminum tube with a round cross section with a 20 mm diameter and a 2 mm thickness. The image location was recorded by the camera’s positioning system with an accuracy of about 5 m. This accuracy was not sufficient for mosaic mapping without preprocessing.
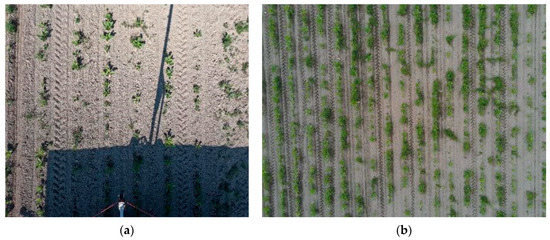
Figure 2.
Images collected from the sugar beet field by an action camera installed on the robot from a 2 m height (a) and a drone camera from a 4 m height (b). The distance between the plant rows was 0.5 m.
A drone (Anafi 1.8.2, Parrot SA, Paris, France) equipped with an RGB camera with a resolution of 4608 × 3456 pixels was used to collect field images by flying at a height of 4 m, resulting in a space resolution of about 570 pixel/meter (Figure 2b). The image collecting was conducted in a scanning mode, controlled by a flight control software (QGroundControl, Dronecode Foundation, Zurich, Switzerland) with a side and front overlap of 25%. The image location was recorded by the drone’s positioning system with an accuracy of about 1 m. The images were taken while hovering and stabilizing over locations of interest. The scanning of the entire 2 ha field comprised about 120 min of the flying time.
The successful image recording of the field was completed on 27 June, 2023 (part of the field, stopped because of rain) and 5 July, 2023. In addition to the drone and activity camera images, images taken manually by a mobile phone camera were included in the dataset. The dataset consisting of 2272 images collected in this study is available in open access (https://zenodo.org/records/10716274, accessed 18 September 2024).
2.4. Field Mapping
In this study, we assumed that a stitched map with an accurate fitting between the field images is not required for estimating plant and weed density and condition. Hence, to create a field map, the collected images were assembled only according to their recorded coordinates and estimated space resolution. Creating this map does not require specialized software, computational efforts, or time and does not distort the images. Two maps of the sugar beet field map are shown in Figure 3, which is assembled from 399 drone images taken on 27 June 2023 (in the folder SjT_SB_Drone_2023_06_27 in the dataset) and from 1117 drone images taken on 5 July 2023 (in the folder SjT_SB_Drone_2023_07_05 in the dataset).
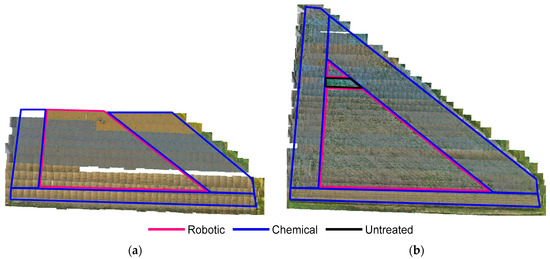
Figure 3.
A field map assembled from field images collected by a drone without accurate fitting between the images taken on 27 June 2023 (a) and 5 July 2023 (b). The field was divided into areas analyzed in the study: robotically weeded area, chemically weeded area, and untreated area.
2.5. Plant Detection
The plant detection was completed using a YOLOv8 medium detection model (https://docs.ultralytics.com/, accessed on 18 September 2024). The YOLOv8 default pretrained model was trained by images with a size of 1280 × 1280. To train the YOLOv8 model, parts of the original images were split into 23,265 1280 × 1280 images, where 18,593 of them were manually labelled with 186,442 sugar beets and 151,729 weeds to be used for training. The dataset was randomly split into training, testing, and validating sets including 14652, 1952, and 1989 images, respectively. The model was trained during 100 epochs with all default hyperparameters except for the following parameters for augmentation: perspective = 0.001, mixup = 0.3, copy_paste = 0.3, mosaic = 0.5, hsv_v = 0.4, degrees = 180, flipud = 0.5.
For model validation, mean average precision calculated at an intersection over union threshold of 0.50 (mAP50), precision, recall, and harmonic mean of the precision and recall (F1) for detecting sugar beets, weeds, and their average were used.
For the robot performance assessment, the YOLOv8 model was applied to the unlabeled images, which, together with the manually labelled images, were used for the plant and weed counting and analyses. In the untreated area, the weed canopies were interconnected; hence, the accuracy of the automatic detection was low. For this reason, the weed location and boundary boxes were estimated manually.
2.6. Robot Performance Analysis
The robot’s performance was estimated by a comparison of the weed density between the robotically weeded, chemically weeded, and untreated field areas presented in Figure 3b. The location of the plants and weeds were estimated based on manual labelling, detection by the trained YOLOv8 model, and image coordinates recorded by the drone during imaging. The areas of the detected boundary boxes were used for the estimation of the area covered by the plants and the weeds. Plant and weed density and area maps were constructed with resolution of 1 × 1 m2. The density distribution for areas with different treatments was calculated. Software for robot performance analysis detecting plants and weeds and their location and size was implemented on Matlab (R2024a, MathWorks Inc., MA, USA) and is available at https://github.com/VicB18/FieldAnalyzer/tree/main/Matlab (accessed on 18 September 2024).
3. Results
The training convergence of the YOLOv8 detecting model validated by the validation set is presented in Figure 4. The accuracy measures were as follows: mAP50, F1 for sugar beets, F1 for weeds and the average F1. They were equal to 94.3%, 94.1%, 82.4%, and 88.3%, respectively. The precision for detection of the sugar beets, weeds, and the average was 92.9, 84.9 and 88.9 respectively. The recall was 95.3, 80.1 and 87.7 respectively. A possible reason for the lower accuracy of the weed detection could be that, in contrast to the sugar beet plants, which were well organized and distinguishable, a significant part of the weeds were unorganized and hardly visually distinguishable, which made the labelling of the weeds less accurate. However, we assumed that the average accuracy of F1 = 88.3% was sufficient for the further robot performance analysis.
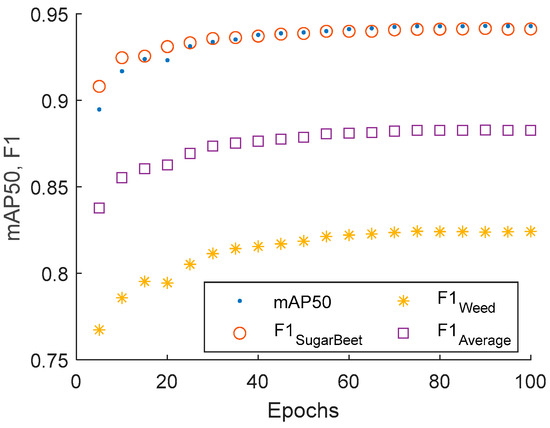
Figure 4.
Convergence of the YOLOv8 model training with mAP50 and F1 for detecting sugar beets, weeds, and their average validated by the validation set.
The distribution of the plant and weed density in different testing areas calculated based on the field map from Figure 3 is presented in Figure 5. The values for the plant and weed densities are presented in Table 1. Maps of the plant and weed densities with resolution of 1 × 1 m2 are presented in Figure 6. Examples of consecutive images taken over the same locations are presented in Figure 7.

Figure 5.
Plant and weed density and covering area distributions for the robotically weeded area, chemically weeded area, and untreated control area measured on 27 June 2023 and 5 July 2023. (a) Plant density, 1/m2, 27 June 2023; (b) weed density, 1/m2, 27 June 2023; (c) Plant area, %, 27 June 2023; (d) Weed area, %, 27 June 2023; (e) Plant density, 1/m2, 5 July 2023; (f) weed density, 1/m2, 5 July 2023; (g) Plant area, %, 5 July 2023; (h) Weed area, %, 5 July 2023.

Table 1.
The average ± STD values for the plant and weed densities for different field treatments recorded on 27 June 2023 and 5 July 2023. The data for the untreated area on 27 June 2023 were not available (NA).
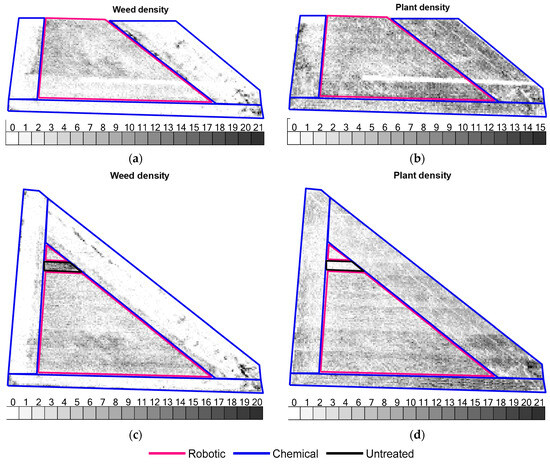
Figure 6.
Weed (a,c) and plant (b,d) density maps based on drone images taken on 27 June 2023 (a,b) and 5 July 2023 (c,d).
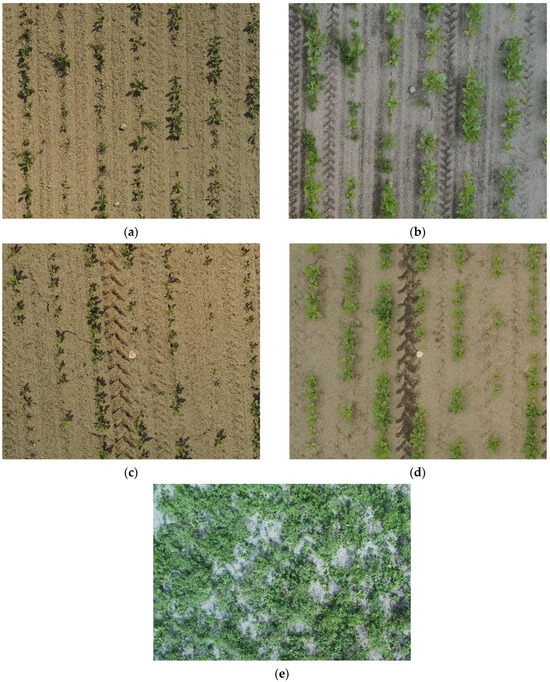
Figure 7.
Drone images taken over the same place in the robotically weeded area on 27 June 2023 (a) and 5 July 2023 (b), in the chemically weeded area on 27 June 2023 (c) and 5 July 2023 (d), and in the untreated area on 27 June 2023 (e).
On the chemically weeded area, the weed density and area were mainly low, fulfilling the requirements of a typical commercial farm, while the densities of the plants and weeds on the untreated area were unacceptable. On the robotically weeded area, the average weed density was about two times lower than on the untreated area, which created a significantly larger area for collecting sun irradiation for the plants and a larger amount of minerals in the soil. However, the average weed density and area were about three times higher than on the chemically treated area, which means that not all available irradiation and mineral resources were used for the plants.
4. Discussion
According to the density maps and field images, the robot weeded a majority of the weeds in the spaces between the rows. However, the ability to cut weeds inside the rows was limited by the safety distance between the cutting blades and the plants. As a result, a majority of the weeds remained close to the plants, using light and mineral resources intended for the plants. In addition, without competition with other weeds, the remaining weeds developed large canopies, which could not be cut by the robot.
In the two successful field samplings recorded in this study, the density and area measurement changes can be observed in Table 1 and Figure 5. For example, the plant density remains similar for both the robotic and chemically weeded areas on 27 June 2023 and 5 July 2023, while the plant area increased by about two times for the robotically weeded area and by about three times for the chemically weeded area. We can assume that the growth rate of the plants in the robotically weeded area was lower because the remaining weeds consumed part of the light and mineral resources.
The weed density in the robotically weeded area remained similar, while the part of the area covered by the weeds increased by about three times. We can assume that the robot kept reachable placed free of weeds, but the weeds in the unreachable places grew faster than the sugar beet plants almost without competition. In the chemically weeded area, the weed density remained similar, while the part of the area covered by the weeds increased by about two times.
The changes in the untreated area could not be traced because the data were not available (NA) on 27 June 2023. However, the density and the area of the weeds were significantly higher than those of the plants.
In contrast to reviewed studies ([7,9,10,11,17]), where the robot performance assessment was completed based on a number of manually controlled rows with tens or hundreds of samples, in this study, a 2 ha field was used for assessment, resulting in tens of thousands of density samples with hundreds of thousands of plants, which were used in statistical analysis. This amount of data allows for stronger statistical conclusions about the actual performance of the robot and the analysis of its variability.
According to the plant and weed distribution and maps presented in Figure 5f and Figure 6c, the performance of the robot varies in different locations in the field. Areas with a higher and lower average density can be seen on the density map. However, the patterns in these areas are not clear and it is hard to conclude whether they were caused by the robotic treatment or by the initial higher density of the weeds. The average density was 4.3 weeds/m2, while the majority of the values were distributed between 1 and 11 weeds/m2. This partially corresponds to the values ranging from 2 to 6 weed/m2 across different experiments reported by [11]; however, in [11], the weed density was only assessed on a small part of a field. The weed distribution in the chemically treated area was less diverse in a larger area, ranging from 1 to 9 weeds/m2 with an average value of 1.4, which corresponds to the values from [11] ranging from 1 to 4 weeds/m2. However, the patterns of the high weed density areas have a clear directionality in the spraying tool and point to the lack of overlap during the chemical treatment.
The development of plants and weeds can be followed based on consecutive field samplings like in Figure 7, which was limited in this study by only two successful samplings. For example, in the robotically treated area presented in Figure 7a,b, the weed to the right of the stone (Figure 7a) was cut, while the weed above it developed and grew. Growth and leaves overlapping in plants can be observed in the example of the chemically treated area presented in Figure 7c,d. In a future study, the possibility for monitoring individual plants and weeds will be tested using mosaic field mapping.
In this study, the plant and weed detection accuracy for this specific dataset was mAP50 = 94.3%, which was similar to the measures reported in other studies, like mAP50 = 92.3% in [23] and mAP50 = 88.4% in [25]. Further improvements in the plant and weed detection accuracy and robustness will be conducted in a future study using additional datasets with sugar beet and weed images and transfer learning.
The next stage in the robot performance assessment is the study of the influence of the amount of remaining weeds on the yield. Additional experiments measuring the yield and estimation of profitability similarly to in [11] will be conducted in further research.
Since the performance of weeding robots is still lower than that of manual or chemical treatments, frequent field monitoring is important for farm management. Many commercial companies provide services for field monitoring, usually based on drone imaging, which can significantly improve the field management by detecting and the diseases, pests, deficiencies, and estimating yield. However, freely available and farmer-friendly tools and software, similar to the selective spraying system [15] or robot building, were not found [30]. The software for robot performance analyses can represent a tool for field management for farmers and researchers. An initial version of a user-friendly software for farmers based on the assessment software is available at https://github.com/VicB18/FieldAnalyzer (accessed on 18 September 2024). After updating the detecting model in the future, the software will be able to classify the plant’s condition, such as diseases, water, and material deficiencies.
With the help of the robotic software, farmers could know the field condition and efficiency of the robotic treatment for all of the field. Farmers and researchers could develop optimal strategies for using the robot, such as seeding and weeding timing, robot settings, plant and field parameters, and geometry. The robot producers can obtain quantitative information from an actual working environment and improve the robots accordingly.
5. Conclusions
In this study, the performance of a commercial field robot was assessed for an entire field. The robotic treatment in the tested conditions significantly decreased the weed density; however, better robotic settings must be found to overtake the results of the chemical weeding. Future studies for finding a relation between the weed density, the yield, and the optimal robot actuation setting will be conducted.
A tool for this assessment was designed and published for open access. Farmers and researchers can benefit from this tool and improve the efficiency of field robots.
Author Contributions
Conceptualization, V.B. and R.P.; methodology, V.B. and R.P.; software, V.B. and B.G.P.; experiments, V.B., E.K. and R.P.; data curation, V.B.; writing, V.B.; project administration, V.B. and R.P.; funding acquisition, V.B. and R.P. All authors have read and agreed to the published version of the manuscript.
Funding
This research was funded by Ministry of Agriculture and Forestry of Finland, MAKERA PeltoRobo project (https://mmm.fi/makera-2023/peltorobotiikalla-kestavia-viljelykaytantoja, accessed on 18 September 2024).
Data Availability Statement
The data are available at https://zenodo.org/records/10716274 (accessed on 18 September 2024).
Acknowledgments
We would like to thank the staff of Sokerijuurikkaan Tutkimuslaitos Susanna Muurinen, Sami Talola, and Arvo Ekman for providing the robot, experimental fields, and technical support.
Conflicts of Interest
The authors declare no conflicts of interest.
References
- Oliveira, L.F.P.; Moreira, A.P.; Silva, M.F. Advances in Agriculture Robotics: A State-of-the-Art Review and Challenges Ahead. Robotics 2021, 10, 52. [Google Scholar] [CrossRef]
- Gil, G.; Casagrande, D.E.; Pérez Cortés, L.; Verschae, R. Why the low adoption of robotics in the farms? Challenges for the establishment of commercial agricultural robots. Smart Agric. Technol. 2023, 3, 100069. [Google Scholar] [CrossRef]
- Vahdanjoo, M.; Gislum, R.; Sørensen, C.A.G. Operational, Economic, and Environmental Assessment of an Agricultural Robot in Seeding and Weeding Operations. AgriEngineering 2023, 5, 299–324. [Google Scholar] [CrossRef]
- Fountas, S.; Mylonas, N.; Malounas, I.; Rodias, E.; Hellmann, S.C.; Pekkeriet, E. Agricultural Robotics for Field Operations. Sensors 2020, 20, 2672. [Google Scholar] [CrossRef]
- Spykman, O.; Gabriel, A.; Ptacek, M.; Gandorfer, M. Farmers’ perspectives on field crop robots – Evidence from Bavaria, Germany. Comput. Electron. Agric. 2021, 186, 106176. [Google Scholar] [CrossRef]
- Qu, H.R.; Su, W.H. Deep Learning-BasedWeed–Crop Recognition for Smart Agricultural Equipment: A Review. Agronomy 2024, 14, 363. [Google Scholar] [CrossRef]
- Avrin, G.; Boffety, D.; Lardy-Fontan, S.; Regnier, R.; Rescoussie, R.; Barbosa, V. Design and validation of testing facilities for weeding robots as part of ROSE Challenge. In Proceedings of the IA (EPAI), Saint-Jacques-de-Compostelle (Virtual Conference), Spain, September 2020. [Google Scholar]
- Bawden, O.; Kulk, J.; Russell, R.; McCool, C.; English, A.; Dayoub, F.; Lehnert, C.; Perez, T. Robot for weed species plant-specific management. J. Field Robot. 2017, 34, 1179–1199. [Google Scholar] [CrossRef]
- Wu, X.; Aravecchia, S.; Lottes, P.; Stachniss, C.; Pradalier, C. Robotic weed control using automated weed and crop classification. J. Field Robot. 2020, 37, 322–340. [Google Scholar] [CrossRef]
- Jiang, W.; Quan, L.; Wei, G.; Chang, C.; Geng, T. A conceptual evaluation of a weed control method with post-damage application of herbicides: A composite intelligent intra-row weeding robot. Soil Tillage Res. 2023, 234, 105837. [Google Scholar] [CrossRef]
- Gerhards, R.; Risser, P.; Spaeth, M.; Saile, M.; Peteinatos, G. A comparison of seven innovative robotic weeding systems and reference herbicide strategies in sugar beet (Beta vulgaris subsp. vulgaris L.) and rapeseed (Brassica napus L.). Weed Res. 2024, 64, 42–53. [Google Scholar] [CrossRef]
- Li, Y.; Zhiqiang, G.; Feng, S.; Man, Z.; Xiuhua, L. Key technologies of machine vision for weeding robots: A review and benchmark. Comput. Electron. Agric. 2022, 196, 106880. [Google Scholar] [CrossRef]
- Murad, N.Y.; Mahmoodm, T.; Forkan, A.R.M.; Morshed, A.; Jayaraman, P.P.; Siddiqui, M.S. Weed Detection Using Deep Learning: A Systematic Literature Review. Sensors 2023, 23, 3670. [Google Scholar] [CrossRef] [PubMed]
- Hu, K.; Wang, Z.; Coleman, G.; Bender, A.; Yao, T.; Zeng, S.; Song, D.; Schumann, A.; Walsh, M. Deep learning techniques for in-crop weed recognition in large-scale grain production systems: A review. Precis. Agric. 2024, 25, 1–29. [Google Scholar] [CrossRef]
- Coleman, G.; Salter, W.; Walsh, M. OpenWeedLocator (OWL): An open-source, low-cost device for fallow weed detection. Sci. Rep. 2022, 12, 170. [Google Scholar] [CrossRef]
- Olsen, A.; Konovalov, D.A.; Philippa, B.; Ridd, P.; Wood, J.C.; Johns, J.; Banks, W.; Girgenti, B.; Kenny, O.; Whinney, J.; et al. DeepWeeds: A Multiclass Weed Species Image Dataset for Deep Learning. Sci. Rep. 2019, 9, 2058. [Google Scholar] [CrossRef]
- Zhang, W.; Miao, Z.; Li, N.; He, C.; Sun, T. Review of Current Robotic Approaches for Precision Weed Management. Curr. Robot. Rep. 2022, 3, 139–151. [Google Scholar] [CrossRef]
- Jiang, H.; Zhang, C.; Qiao, Y.; Zhang, Z.; Zhang, W.; Song, C. CNN feature based graph convolutional network for weed and crop recognition in smart farming. Comput. Electron. Agric. 2020, 174, 105450. [Google Scholar] [CrossRef]
- Zhang, H.; Wang, Z.; Guo, Y.; Ma, Y.; Cao, W.; Chen, D.; Yang, S.; Gao, R. Weed Detection in Peanut Fields Based on Machine Vision. Agriculture 2022, 12, 1541. [Google Scholar] [CrossRef]
- Visentin, F.; Cremasco, S.; Sozzi, M.; Signorini, L.; Signorini, M.; Marinello, F.; Muradore, R. A mixed-autonomous robotic platform for intra-row and inter-row weed removal for precision agriculture. Comput. Electron. Agric. 2023, 214, 108270. [Google Scholar] [CrossRef]
- Gao, J.; French, A.P.; Pound, M.P.; He, Y.; Pridmore, T.P.; Pieters, J.G. Deep convolutional neural networks for image-based Convolvulus sepium detection in sugar beet fields. Plant Methods 2020, 16, 29. [Google Scholar] [CrossRef]
- Salazar-Gomez, A.; Darbyshire, M.; Gao, J.; Sklar, E.I.; Parsons, S. Towards practical object detection for weed spraying in precision agriculture. arXiv 2021, arXiv:2109.11048. [Google Scholar] [CrossRef]
- Guo, Z.; Goh, H.H.; Li, X.; Zhang, M.; Li, Y. WeedNet-R: A sugar beet field weed detection algorithm based on enhanced RetinaNet and context semantic fusion. Front. Plant Sci. 2023, 14, 1226329. [Google Scholar] [CrossRef] [PubMed]
- Chebrolu, N.; Lottes, P.; Schaefer, A.; Winterhalter, W.; Burgard, W.; Stachniss, C. Agricultural robot dataset for plant classification, localization and mapping on sugar beet fields. Int. J. Robot. Res. 2017, 36, 1045–1052. [Google Scholar] [CrossRef]
- Darbyshire, M.; Salazar-Gomez, A.; Gao, J.; Sklar, E.I.; Parsons, S. Towards practical object detection for weed spraying in precision agriculture. Front. Plant Sci. 2023, 14, 1183277. [Google Scholar] [CrossRef]
- Milioto, A.; Lottes, P.; Stachniss, C. Real-Time Semantic Segmentation of Crop and Weed for Precision Agriculture Robots Leveraging Background Knowledge in CNNs. In Proceedings of the 2018 IEEE International Conference on Robotics and Automation (ICRA), Brisbane, QLD, Australia, 21–25 May 2018. [Google Scholar] [CrossRef]
- Lottes, P.; Behley, J.; Chebrolu, N.; Milioto, A.; Stachniss, C. Robust joint stem detection and crop-weed classification using image sequences for plant-specific treatment in precision farming. J. Field Robot. 2019, 37, 20–34. [Google Scholar] [CrossRef]
- Bertoglio, R.; Mazzucchelli, A.; Catalano, N.; Matteucci, M. A comparative study of Fourier transform and CycleGAN as domain adaptation techniques for weed segmentation. Smart Agric. Technol. 2023, 4, 100188. [Google Scholar] [CrossRef]
- Magistri, F.; Weyler, J.; Gogoll, D.; Lottes, P.; Behley, J.; Petrinic, N.; Stachniss, C. From one field to another—Unsupervised domain adaptation for semantic segmentation in agricultural robotics. Comput. Electron. Agric. 2023, 212, 108114. [Google Scholar] [CrossRef]
- Fasiolo, D.T.; Scalera, L.; Maset, E.; Gasparetto, A. Towards autonomous mapping in agriculture: A review of supportive technologies for ground robotics. Robot. Auton. Syst. 2023, 169, 104514. [Google Scholar] [CrossRef]


Disclaimer/Publisher’s Note: The statements, opinions and data contained in all publications are solely those of the individual author(s) and contributor(s) and not of MDPI and/or the editor(s). MDPI and/or the editor(s) disclaim responsibility for any injury to people or property resulting from any ideas, methods, instructions or products referred to in the content. |
© 2024 by the authors. Licensee MDPI, Basel, Switzerland. This article is an open access article distributed under the terms and conditions of the Creative Commons Attribution (CC BY) license (https://creativecommons.org/licenses/by/4.0/).