Article

Optimizing Nitrogen Fertilizer Application for Synergistic Enhancement of Economic and Ecological Benefits in Rice–Crab Co-Culture Systems

1
Key Laboratory of Non-Point Source Pollution Control, Ministry of Agriculture and Rural Affairs/Changping Soil Quality National Observation and Research Station/State Key Laboratory of Efficient Utilization of Arid and Semi-Arid Arable Land in Northern China, Institute of Agricultural Resources and Regional Planning, Chinese Academy of Agricultural Sciences, Beijing 100081, China
2
Institute of Ecology and Environment, Inner Mongolia University, Hohhot 010021, China
3
Liaoning Institute of Saline-Alkali Land Utilization, Panjin 124000, China
4
Department of Agronomy, Engro Fertilizers Ltd., Lahore 54600, Pakistan
5
Institute of Plant Nutrition and Environment Resources, Liaoning Academy of Agricultural Sciences, Shenyang 110161, China
*
Authors to whom correspondence should be addressed.
Agronomy 2024, 14(10), 2219; https://doi.org/10.3390/agronomy14102219
Submission received: 17 August 2024 / Revised: 20 September 2024 / Accepted: 24 September 2024 / Published: 26 September 2024

Abstract

:
The rice–crab co-culture (RC) system is a multidimensional integrated farming model with significant potential for balancing ecological and economic benefits in paddy fields. However, improper nitrogen (N) fertilizer application exacerbates greenhouse gas (GHG) emissions, degrades water quality, and disrupts the balance of the RC ecosystem. Therefore, optimizing and improving N management strategies for the RC system is crucial to maximize its ecological and economic benefits. This study conducted a two-year field experiment to assess the impact of optimizing N application on the productivity, sustainability, and economic benefits in RC systems. Comparisons were made to compare rice and crab productions, GHG emissions, and net ecosystem economic benefit (NEEB) between the RC and rice monoculture (RM) systems under different N application rates (0, 150, 210, and 270 kg ha−1) with the aim of identifying the optimal N application rate for the RC system. The results showed that the N application rate of 210 kg ha−1 in the RC system improved the agronomic traits and N use efficiency, leading to a 0.4% increase in rice yield (7603.1 kg ha−1) compared to the maximum rice yield in the RM system at 270 kg ha−1. At this application rate, surface water quality was optimal for crabs, resulting in the highest crab yields (370.1 kg ha−1) and average weights (81.1 g). The lower N application reduced the greenhouse gas intensity (GHGI) of the RC system by 13.7% compared to the RM system. The NEEB at the optimal N application rate of 210 kg ha−1 in the RC system reached 8597.5 CNY ha−1, which was 1265.7% higher than that of the RM system at 270 kg ha−1. In summary, optimizing N application in the RC system conserves N fertilizer resources, increases rice and crab yields, and reduces GHG emissions, thereby synergistically enhancing both economic and ecological benefits. Optimizing the N application rate has greater potential in other innovative RC models, and the productivity, sustainability, and economic efficiency should be further investigated.

1. Introduction

Rice (Oryza sativa L.) is one of the most widely cultivated cereal crops, providing sustenance for approximately 3.3 billion people globally [1]. In contemporary agricultural systems, rice production relies heavily on the use of nitrogen (N) fertilizers [2,3]. However, the excessive application of N fertilizers in traditional rice cultivation systems has resulted in rice paddies exhibiting the highest greenhouse gas (GHG) emissions per unit of yield among all food crops [4,5,6]. Additionally, it has increased the risk of surface water degradation, thereby compromising environmental sustainability and adversely affecting rice production [7,8]. Therefore, appropriate N fertilizer application is crucial for ensuring food security and protecting ecosystems.
Rice–animal co-culture systems represent multidimensional integrated farming models that combine rice cultivation with the farming of aquatic animals such as crabs, shrimp, fish, turtles, and ducks [9]. These systems have been widely adopted by 40% of rice-growing countries worldwide due to their significant economic and environmental benefits [10]. China is the world’s leading producer of rice and has the largest area dedicated to rice–animal co-culture systems [11]. In China, the adoption of animal co-culture systems has reached 2.9 million ha [12], accounting for 9.5% of the rice planting area, providing 21.5 × 10⁶ t of rice and 3.9 × 10⁶ t of aquaculture products [13,14,15]. Among these, the rice–crab co-culture (RC) system is particularly notable, covering an area of 1.6 × 10⁵ ha in China [16,17]. In the RC system, crabs can effectively control weeds and reduce the use of fertilizers and pesticides [18,19], thus helping to mitigate the risk of non-point source pollution and pesticide residues [20,21]. By balancing agricultural productivity with environmental sustainability, the RC system provides substantial economic benefits to farmers while protecting ecosystems [22].
Since rice cultivation and Chinese mitten crab (Eriocheir sinensis) aquaculture are integrated into the RC system, residual feed and crab feces serve as organic N sources that meet the N requirements for rice growth [23,24]. The incorporation of these organic N sources throughout the rice growing season extends the N supply period and enhances N use efficiency, thus reducing reliance on N fertilizer application [25]. Traditional N application strategies in RC systems may waste N fertilizer or even lead to over-application, threatening rice production and sustainability. Within the RC system, rice fields provide a crucial source of natural food for crabs, which can be enriched by N application, thereby enhancing crab yields [26,27]. However, excessive N application may degrade surface water quality by increasing harmful components such as ammonia nitrogen (NH4+-N), potentially jeopardizing the survival of crabs [28]. It is noteworthy that the N application rate of the RC systems is increasing every year [16]. According to the surveys in the typical area for the RC systems in China, the average N application rate was about 215 kg ha−1 in 2013 [29], rising to over 250 kg ha−1 in 2019 [25]. Therefore, it is crucial to determine the optimal N application rate for the RC system to ensure economic benefits for farmers, considering the potential impacts on both rice and crab production.
In addition to the uncertainty regarding the effects on rice and crab production, the N fertilizer application rate significantly influences the impact of RC systems on GHG emissions. Some studies have demonstrated that at an N application rate of 210 kg ha−1, methane (CH4) emissions in the RC system were reduced by 5.3–63.6% compared to the RM system due to the bioturbations of crabs [22]. In contrast, other studies have shown that the RC system significantly increased CH4 emissions by 29.2–36.8% at a N application rate of 160 kg ha−1 [30]. While these studies consistently suggest that RC systems reduce nitrous oxide (N2O) emissions, the inclusion of organic N from feed and crab feces may potentially increase N2O emissions [31]. N application stimulates CH4 and N2O emissions in rice paddies, but the synergistic effects of the RC system and N application rates on GHG emissions remain unclear [32]. This may lead to the optimization of N application in RC systems for yield and economic benefits while overlooking environmental costs, resulting in uncertain net ecosystem economic benefit (NEEB). Therefore, both economic and ecological benefits should be considered when developing an optimized N application strategy for RC systems to maximize NEEB.
In this study, a two-year field experiment was conducted in Northeast China to measure the rice and crab yields, GHG emissions, and NEEB of the RC and traditional rice monoculture (RM) system under different N application rates (0, 150, 210, and 270 kg ha−1) to assess the impact of optimizing N application on productivity, sustainability, and economic benefits in the RC systems. The objectives of this study were to (1) assess the effects of N application on rice and crab to determine optimal N application strategies for production, (2) compare GHG emissions of the RC and RM systems under different N application rates, and (3) identify optimal N application strategies for maximizing NEEB in the RC system.

2. Materials and Methods
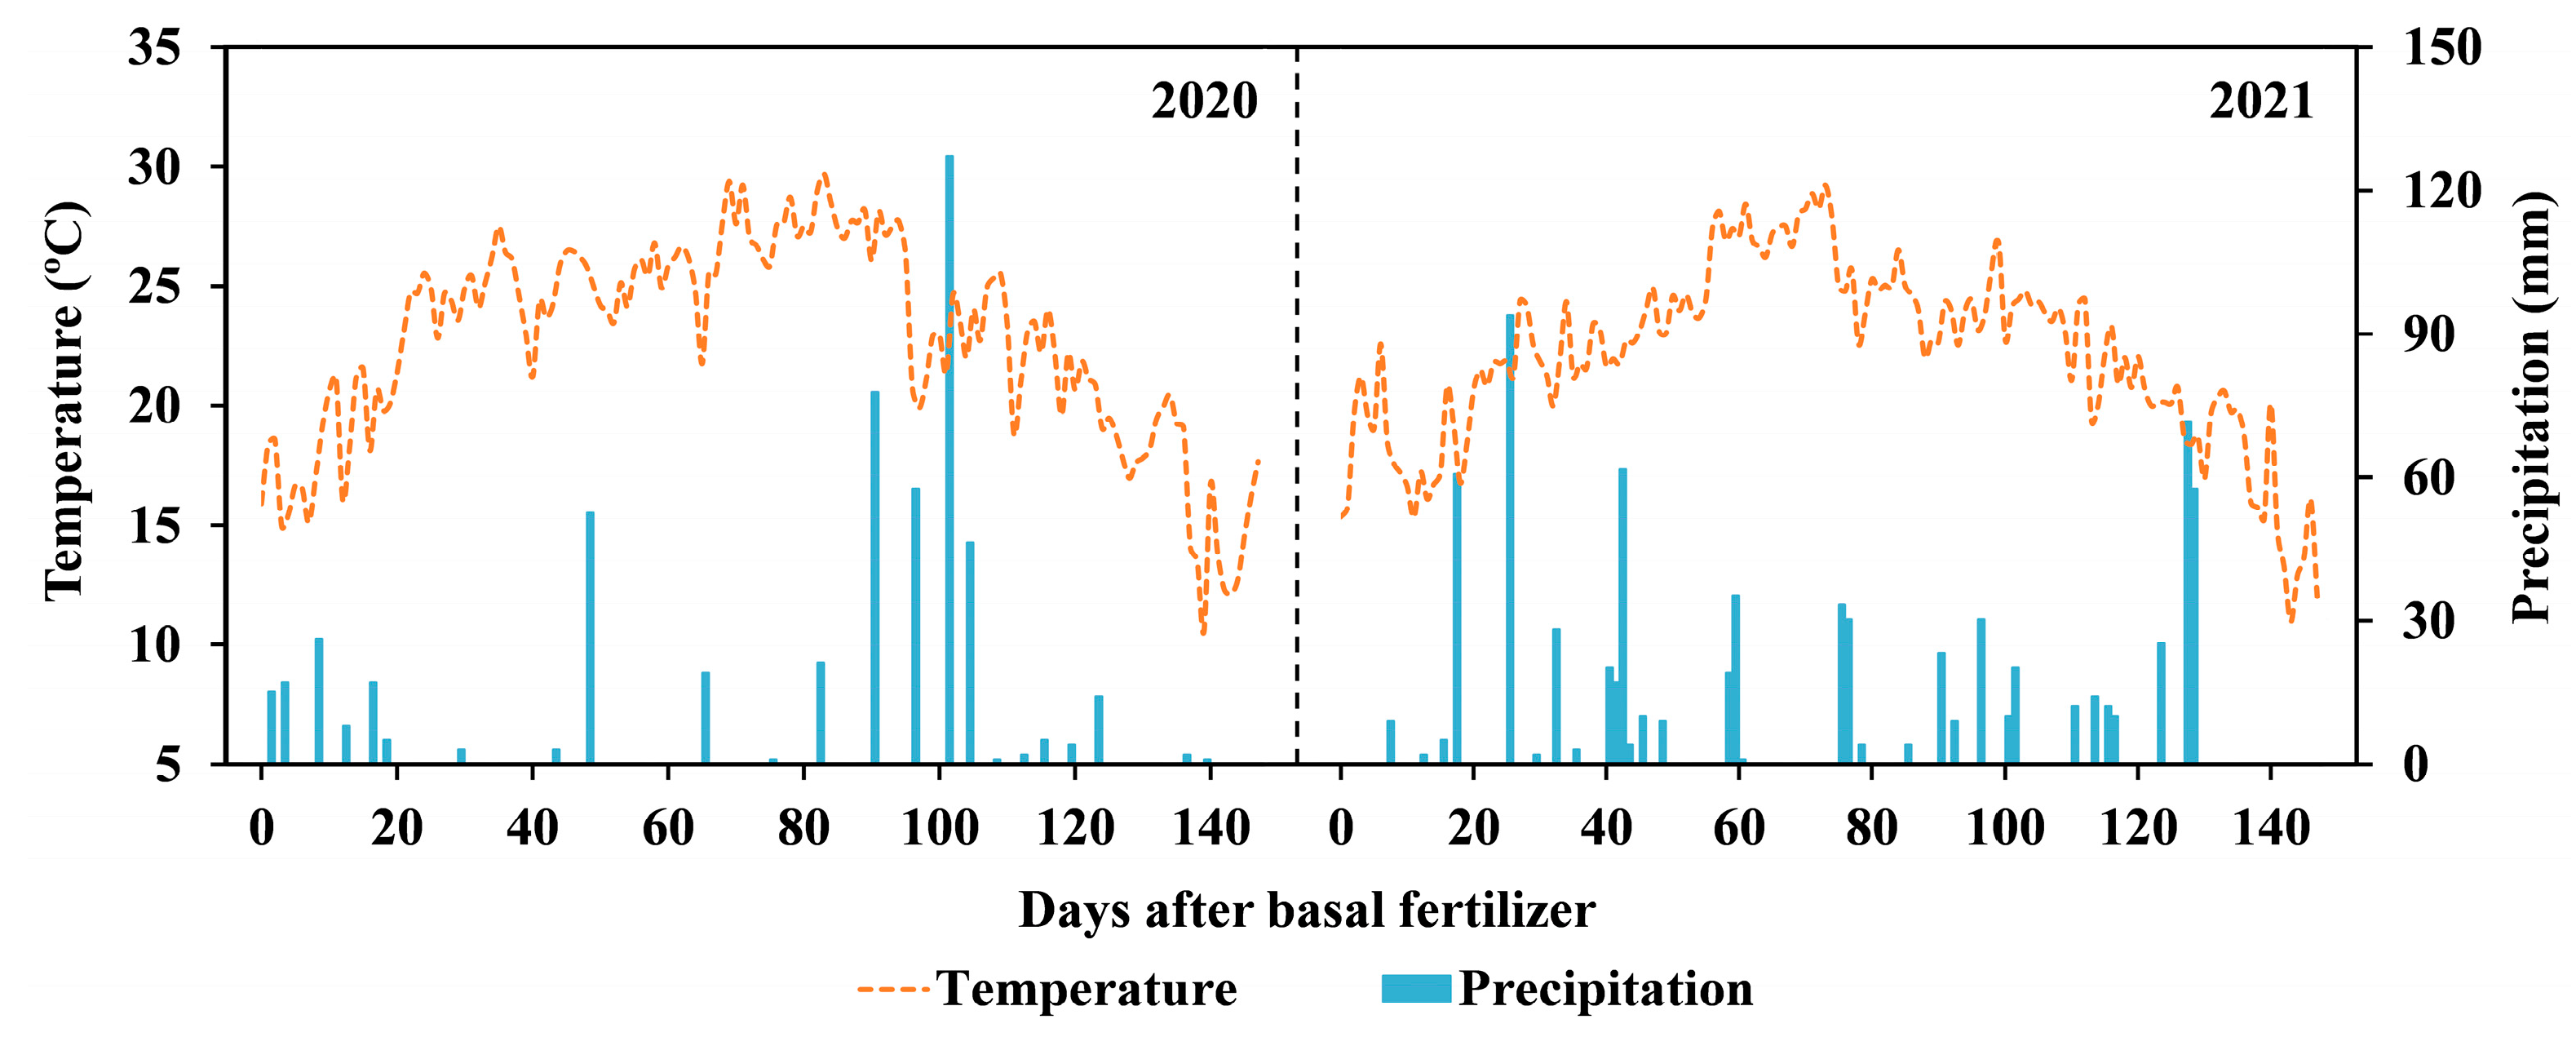
2.1. Study Site

The field experiment was conducted at the experimental farm of the Liaoning Provincial Saline–Alkali Land Utilization and Research Institute (41°04′ N, 122°18′ E) in Panjin, Liaoning Province, China (Figure 1). To increase the reliability of this study, the field experiments were carried out for two years, in 2020 and 2021, respectively. The region experiences a temperate monsoonal climate, with an average temperature of 22.5 °C and total precipitation of 552.3 mm during the rice planting season in 2020, and 21.9 °C and 742.7 mm in 2021 (Figure 2). The soil at the study site is characterized by saline paddy soil with properties of 0–20 cm layer as follows: pH, 7.35; bulk density, 1.28 g cm−3; organic matter, 37.60 g kg−1; total nitrogen (TN), 1.51 g kg−1; total phosphorus (TP), 0.63 g kg−1; Olsen P, 42.56 mg kg−1; and total potassium (TK), 34.58 g kg−1.

2.2. Experimental Design

Two farming systems were implemented: the rice–crab co-culture (RC) system and the rice monoculture (RM) system. The rice variety of Yanfeng 47 was used in the experiments, planted at a spacing of 12 cm × 30 cm. Since the N application rate over 270 kg ha−1 reduces the yield of this rice variety, the N application rates used in this study were 0, 150, 210, and 270 kg ha−1 for RC and RM systems, respectively [33]. The N application rates of RC0 (RM0), RC150 (RM150), RC210 (RM210), and RC270 (RM270) as basal fertilizer were 0, 120, 180, and 240 kg ha−1, respectively. The N application rates of tillering fertilizer were 0 kg ha−1 for RC0 (RM0) and 30 kg ha−1 for RC150 (RM150), RC210 (RM210), and RC270 (RM270). Diammonium phosphate (100 kg P2O5 ha−1) and potassium sulfate (80 kg K2O ha−1) were used as basal fertilizers in all treatments. For irrigation water requirements of rice and crabs, and with reference to local water management experience, all treatments were kept flooded with surface water depth maintained at 5 cm to 10 cm throughout the rice growing season [25,30]. The stocking density of crab for all RC treatments was 9000 individuals ha−1. A nylon net (0.4 m in height) was used around the RC treatment plots to prevent crab escape. To prevent crab escape, nylon nets (0.4 m in height) were placed around the RC treatment plots. Crab feed containing 35.0% crude protein was introduced daily at 17:00 from 1 June to 25 September each year. The feed input was 550 kg ha−1 annually in all RC treatments, containing 54.6 g kg−1 of N, 11.7 g kg−1 of phosphorus, and 8.0 g kg−1 of potassium. Each treatment was replicated three times and randomly distributed in 24 experimental plots measuring 15 m × 8 m (Figure 1). Rice and crab are cultivated in a single season each year, starting in May and ending in October, respectively. Details of the agricultural operations are provided in Table S1.

2.3. Sampling and Measurements

At rice maturity over two years, five randomly selected 1 m2 areas of rice plants within each plot were harvested, threshed, and manually weighed to determine grain and straw yields. Concurrently, 20 rice plants were randomly selected from each plot to assess the following agronomic traits: number of productive tillers (plant−1), number of filled grains (spike−1), seed setting percentage (%), 1000-grain weight (g), and harvest index (%) [25]. The N concentration of the rice plant samples was determined using the Kjeldahl method to assess N use efficiency indicators, including grain N uptake (GNU, kg ha−1), N recovery efficiency (NRE, %), and N partial factor productivity (NPFP, kg kg−1) [34].
Crabs were harvested from all RC plots annually between 25 September and 1 October. The weight and sex of each crab were recorded to determine the yields, average weights, and economic values of crabs across the different RC treatments.
Surface water characteristics were monitored biweekly following the application of basal fertilizer (Figures S1 and S2). A multi-parameter meter (Professional Plus, YSI, Yellow Springs, OH, USA) was used to measure dissolved oxygen (DO) concentration, temperature, and pH. Additionally, surface water depth was measured using a scale. Surface water samples were collected using a five-point sampling method and analyzed for ammonium nitrogen (NH4+-N) and nitrate nitrogen (NO3-N) concentrations with a continuous flow analyzer (Auto-Analyzer 3, Norderstedt, Seal, Germany).
Static dark chambers were used weekly to collect GHGs following the application of basal fertilizer, with the frequency of gas collection being increased during periods of fertilization [30]. Before the first collection, the base of the static chamber was inserted into the soil, leaving the channels uncovered to allow free movement of crabs. During gas collection from 9:00 to 11:00, a static chamber equipped with a fan, which operated during sampling, was placed on the base, and water was used to seal around its channels. Gas samples from each chamber were collected at 10 min intervals (0, 10, 20, and 30 min) and analyzed using a Shimadzu GC-2010 Plus gas chromatograph (GC) equipped with an electron capture detector (ECD) and a flame ionization detector (FID).

2.4. Calculation

GNU, NRE, and NPFP were calculated as follows:
G N U = N g r a i n × Y
N R E = ( T N i T N 0 ) / N a p p l i c a t i o n × 100
N P F P = Y / N a p p l i c a t i o n
where Ngrain indicates grain N content; Y represents rice yield; Napplication indicates the N application rate (kg ha−1); TNi represents the cumulative N uptake (kg ha−1) at N application rate of 150, 210, and 270 kg ha−1; TN0 indicates the cumulative N uptake (kg ha−1) in N application rate of 0 kg ha−1.
GHG emission fluxes were calculated based on the linear least squares fit of the concentration time series at four points in each plot using the following formula:
F = ρ × H × d C / d t × 273 / ( 273 + T )
where F represents the gas emission flux (mg m−2 h−1 for CH4, μg m−2 h−1 for N2O), dC/dt is the rate of change in gas concentration over time as determined by the linear regression equation (μL L−1 h−1 for CH4, nL L−1 h−1 for N2O), and H, ρ, and T denote the height from the water surface to the top of the sample chamber (m), the density of CH4 or N2O (kg m−3) at standard conditions, and temperature (°C), respectively.
Seasonal cumulative CH4 and N2O emissions (kg ha−1) were calculated using the following formula:
E = i = 1 n ( f i + f i + 1 ) / 2 × t t + 1 t i × 24 × 10 2
where f represents the flux of CH4 (mg m−2 h−1) and N2O (mg m−2 h−1), i represents the ith measurement, (ti+1 − ti) represents the time interval between two adjacent measurements, and 24 × 10−2 is used for unit conversion.
The global warming potential (GWP) of CH4 and N2O are 28 and 298 times that of CO2, respectively, over a 100-year time scale [35]. The GWP and greenhouse gas intensity (GHGI) were calculated using the following equations:
G W P k g   C O 2   e q   h a 1 = 28 × C H 4 + 298 × N 2 O
G H G I k g   C O 2   e q   k g 1 = G W P / Y
where CH4 and N2O represent seasonal cumulative emissions of CH4 and N2O, respectively; Y represents the rice yield.
The net ecosystem economic benefit (NEEB) were calculated to comprehensively evaluate both economic and environmental benefits [36]. The NEEB was calculated as follows:
N E E B = N E B G W P   c o s t s
where net economic benefit (NEB) was calculated by subtracting total costs from total incomes. Total costs were calculated by summing expenses for rice seedlings, fertilizers, irrigation, electricity, crab seedlings, feed, pesticides, machinery, land rent, and labor. Expenses were calculated based on local prices for production materials and labor (Table S2). Total incomes were calculated by applying local prices to the sale of grain and crabs. Crab prices varied significantly by sex and individual weight (Table S3). GWP costs refer to the price of total CO2 equivalent emissions, with the current price set at 174.3 CNY ton−1 of CO2 equivalent [37].

2.5. Statistical Analysis

The Shapiro–Wilk test was employed to assess the normality of the data distribution. Pearson correlation analysis was conducted to examine the relationships among crab yield, average crab weight, and surface water characteristics using SPSS (Version 29.0, IBM, Armonk, NY, USA). One-way analysis of variance (ANOVA), Duncan’s post-hoc test, and t-test were used to examine the differences between treatments. Statistical significance was evaluated at the 5% and 1% probability levels (p < 0.05 and p < 0.01). A three-way analysis of variance (year, farming system, and N application rate) was performed to analyze differences in rice yield, agronomic traits, N use efficiency indicators, crab yield, average crab weight, seasonal cumulative GHG emissions, GWP, GHGI, NEB, and NEEB among different treatments [31]. The figures were created using Microsoft Excel (Version 2016, Microsoft, Redmond, WA, USA) and Origin Pro (Version 2024, OriginLab, Northampton, MA, USA).

3. Results

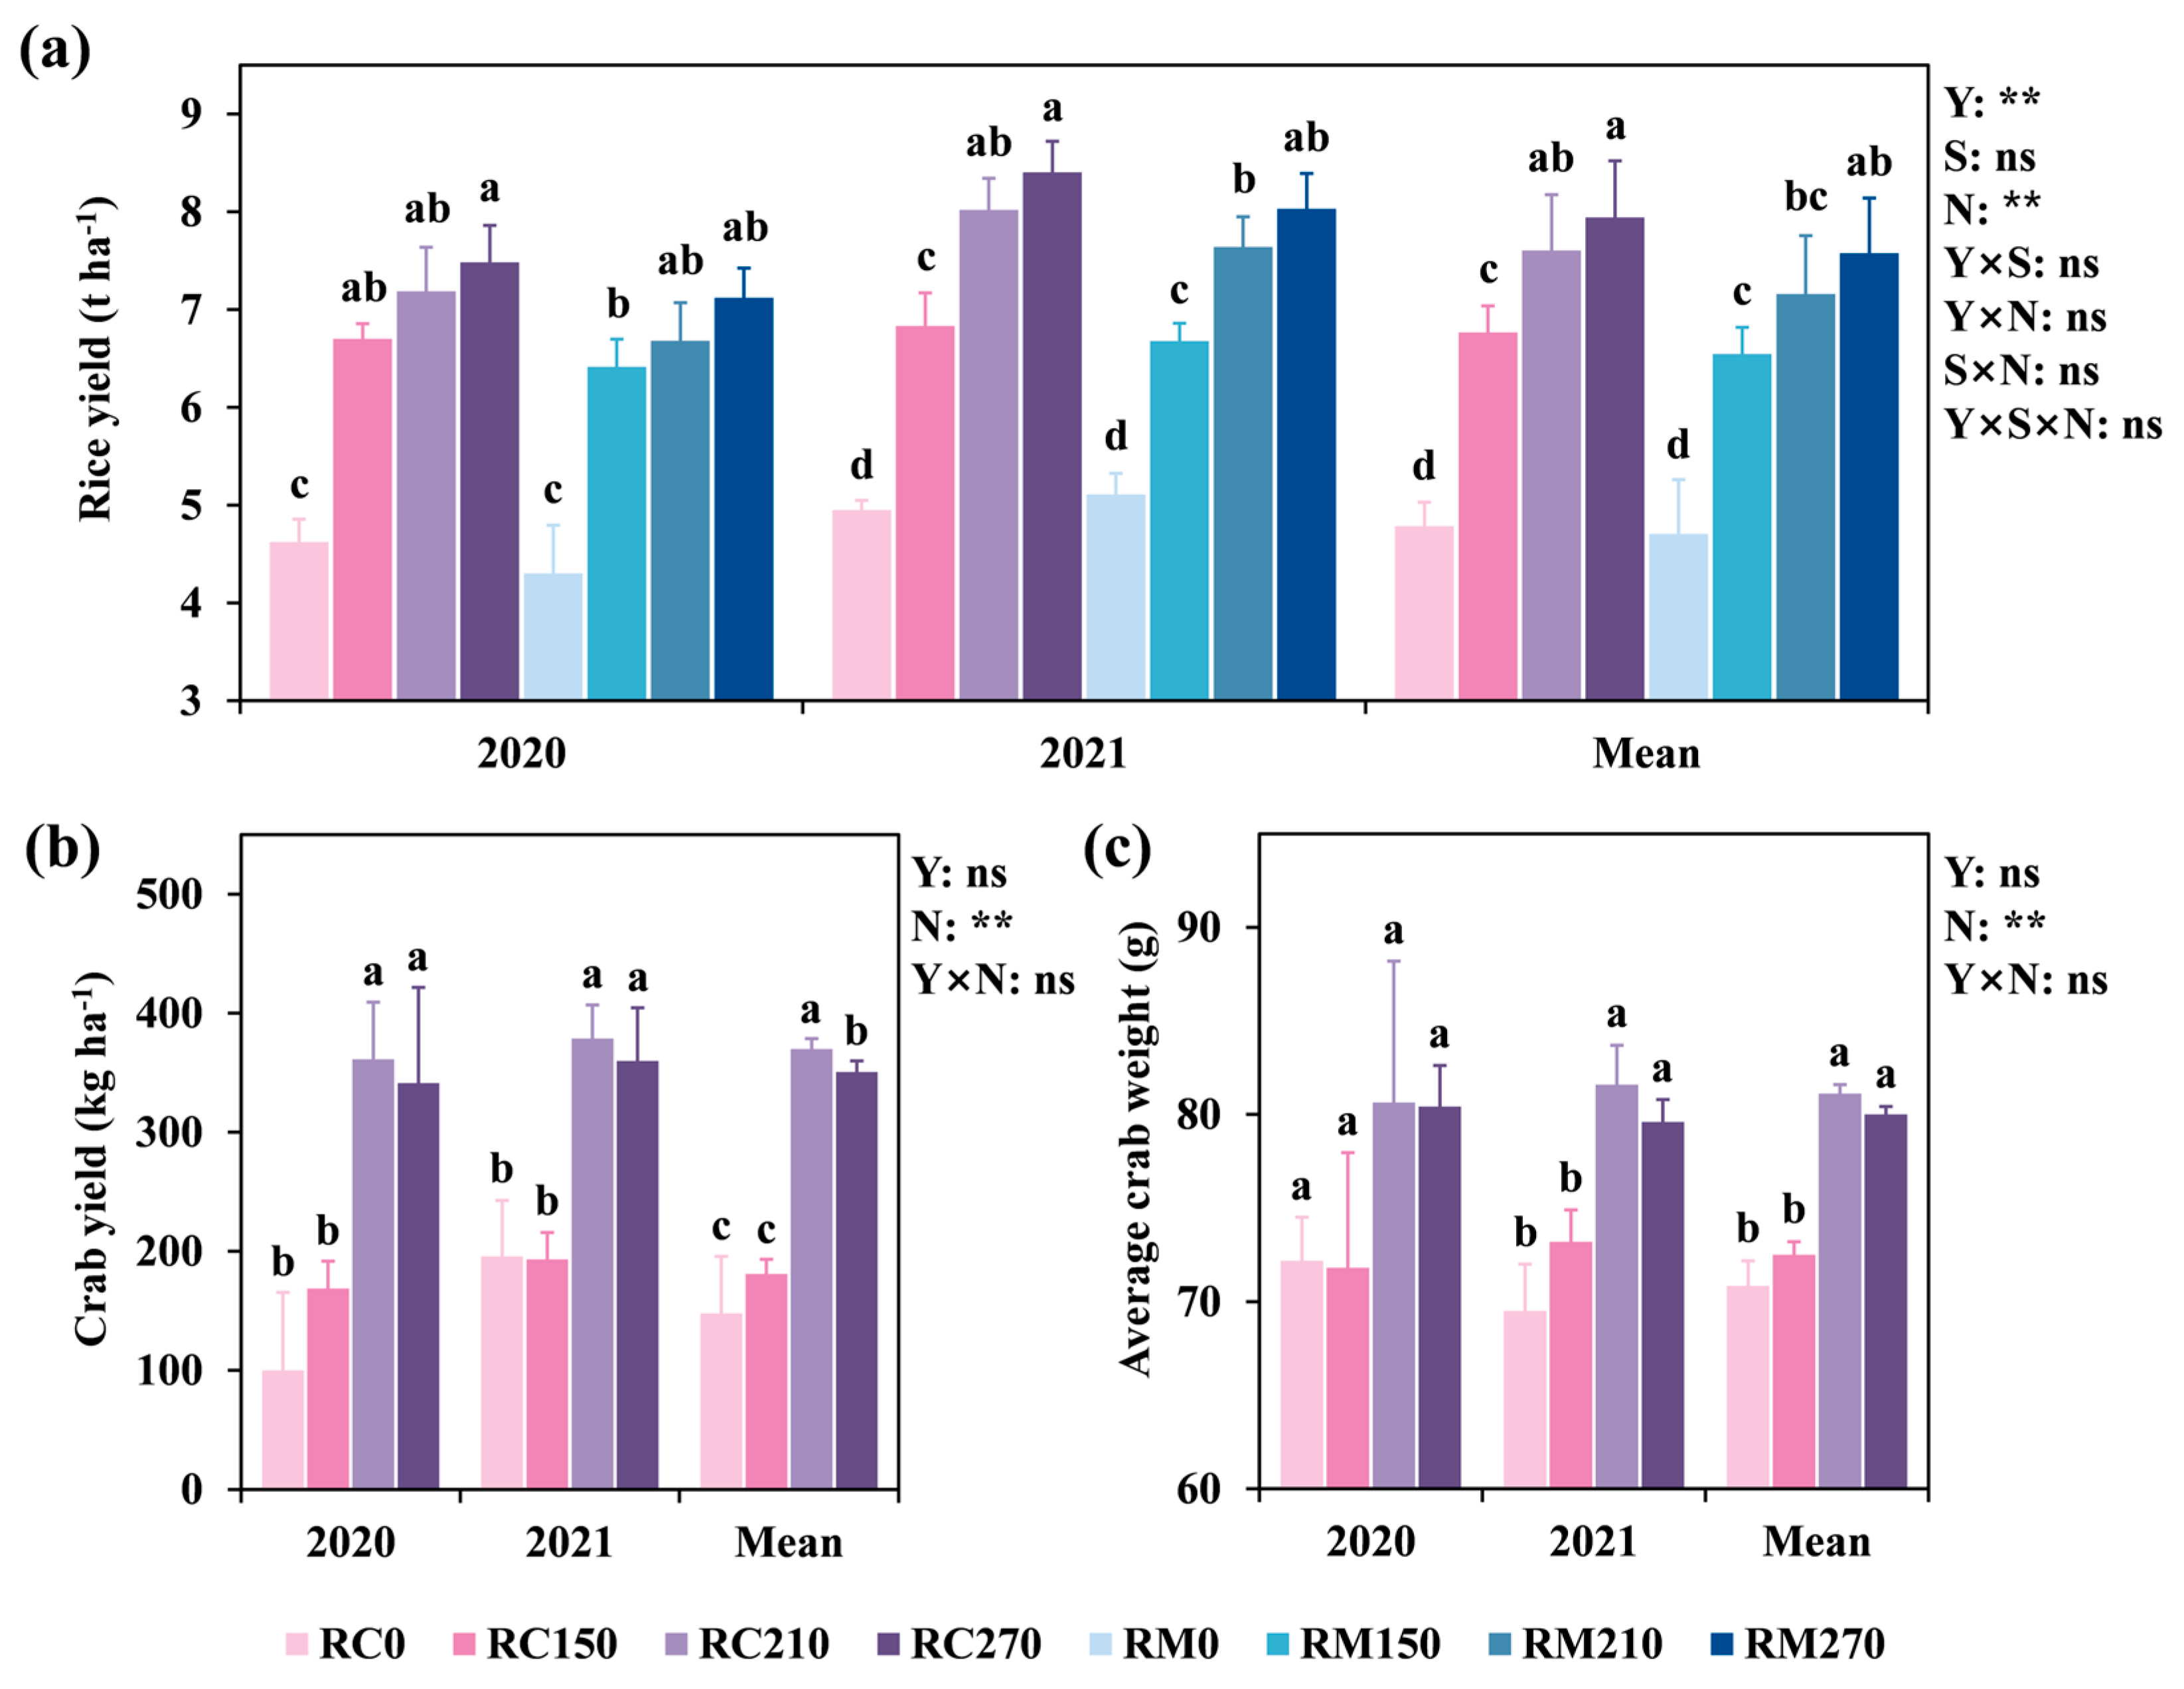
3.1. Rice and Crab Production

Increasing the N application rate linearly increased the rice yield in both the RC and RM systems, with significant differences observed between years (p < 0.01; Figure 3a). Rice yield increased linearly from 4622–4950 kg ha−1 to 7484–8403 kg ha−1 in the RC system and from 4303–5111 kg ha−1 to 7121–8031 kg ha−1 in the RM system, as the N application rate increased from 0 to 270 kg ha−1 over two years. At the same N application rate, the rice yield in the RC system was, on average, 2.2–6.1% higher than in the RM system. Notably, the two-year average yield of RC210 was 0.4% higher than that of RM270, despite having an N application rate that was 60 kg ha−1 lower.
The N application rate had significant effects on agronomic traits, including the number of productive tillers and harvest index (p < 0.01). Additionally, the farming system significantly influenced the number of productive tillers, seed setting percentage, and harvest index (p < 0.01; Table 1). In the RC system, the number of productive tillers, seed setting percentage, and harvest index changed by −1.1–17.2%, −0.3–4.1%, and 6.9–7.0%, respectively, compared to the RM system at the same N application rate over two years.
GNU, NRE, and NPFP were significantly influenced by the farming system and N application rate, with notable variations observed between years (Table 2). GNU increased significantly by 50.3–95.8% for RC270 compared to RC0 and 65.7–76.4% for RM270 compared to RM0 over two years. However, increased N application significantly reduced NRE and NPFP in both the RC and RM systems. On average, GNU, NRE, and NPFP were 4.8–5.0%, 4.7–16.9%, and 4.0–5.7% higher in the RC system compared to the RM system at the same N application rate. Notably, the number of productive tillers, filled grains, seed setting percentage, 1000-grain weight, harvest index, GNU, NRE, and NPFP of RC210 were, on average, 2.8%, 3.2%, 1.3%, 1.8%, 4.8%, 0.5%, 12.3%, and 29.1% higher than those of RM270 over two years, despite having an N application rate was 60 kg ha−1 lower. Overall, the N application enhanced rice yield, with the RC system exhibiting higher yields compared to the RM system. Agronomic traits and N use efficiency were improved in the RC system. Despite a lower N application rate, rice yield in RC210 was higher than in RM270.
N application significantly affected crab yield and average weight, both of which exhibited an increasing and then decreasing trend (p < 0.01; Figure 3b,c). The crab yield and average weight of RC0 were 100.1–195.8 kg ha−1 and 69.5–72.2 g, respectively. Compared to RC0, the crab yield in RC150 changed by −1.3–68.5%, reaching 168.7–193.3 kg ha−1, while the average weight altered by −0.5–5.3%, reaching 71.8–73.2 g. The highest crab yield and average weight were achieved in RC210. As the N application rate increased to 210 kg ha−1, the crab yield increased by 93.4–260.9% compared to RC0, reaching 361.4–378.7 kg ha−1 over two years. Similarly, the average weight of crabs in RC210 increased by 11.7–17.4%, reaching 80.6–81.6 g. The crab yield and average weight in RC270 were 341.3–360.0 kg ha−1 and 80.4–79.6 g, reduced by 4.9–5.5% and 0.3–2.5%, respectively, compared to RC210 over two years. Therefore, the N application rate of 210 kg ha−1 was the most suitable for crab production in the RC system.

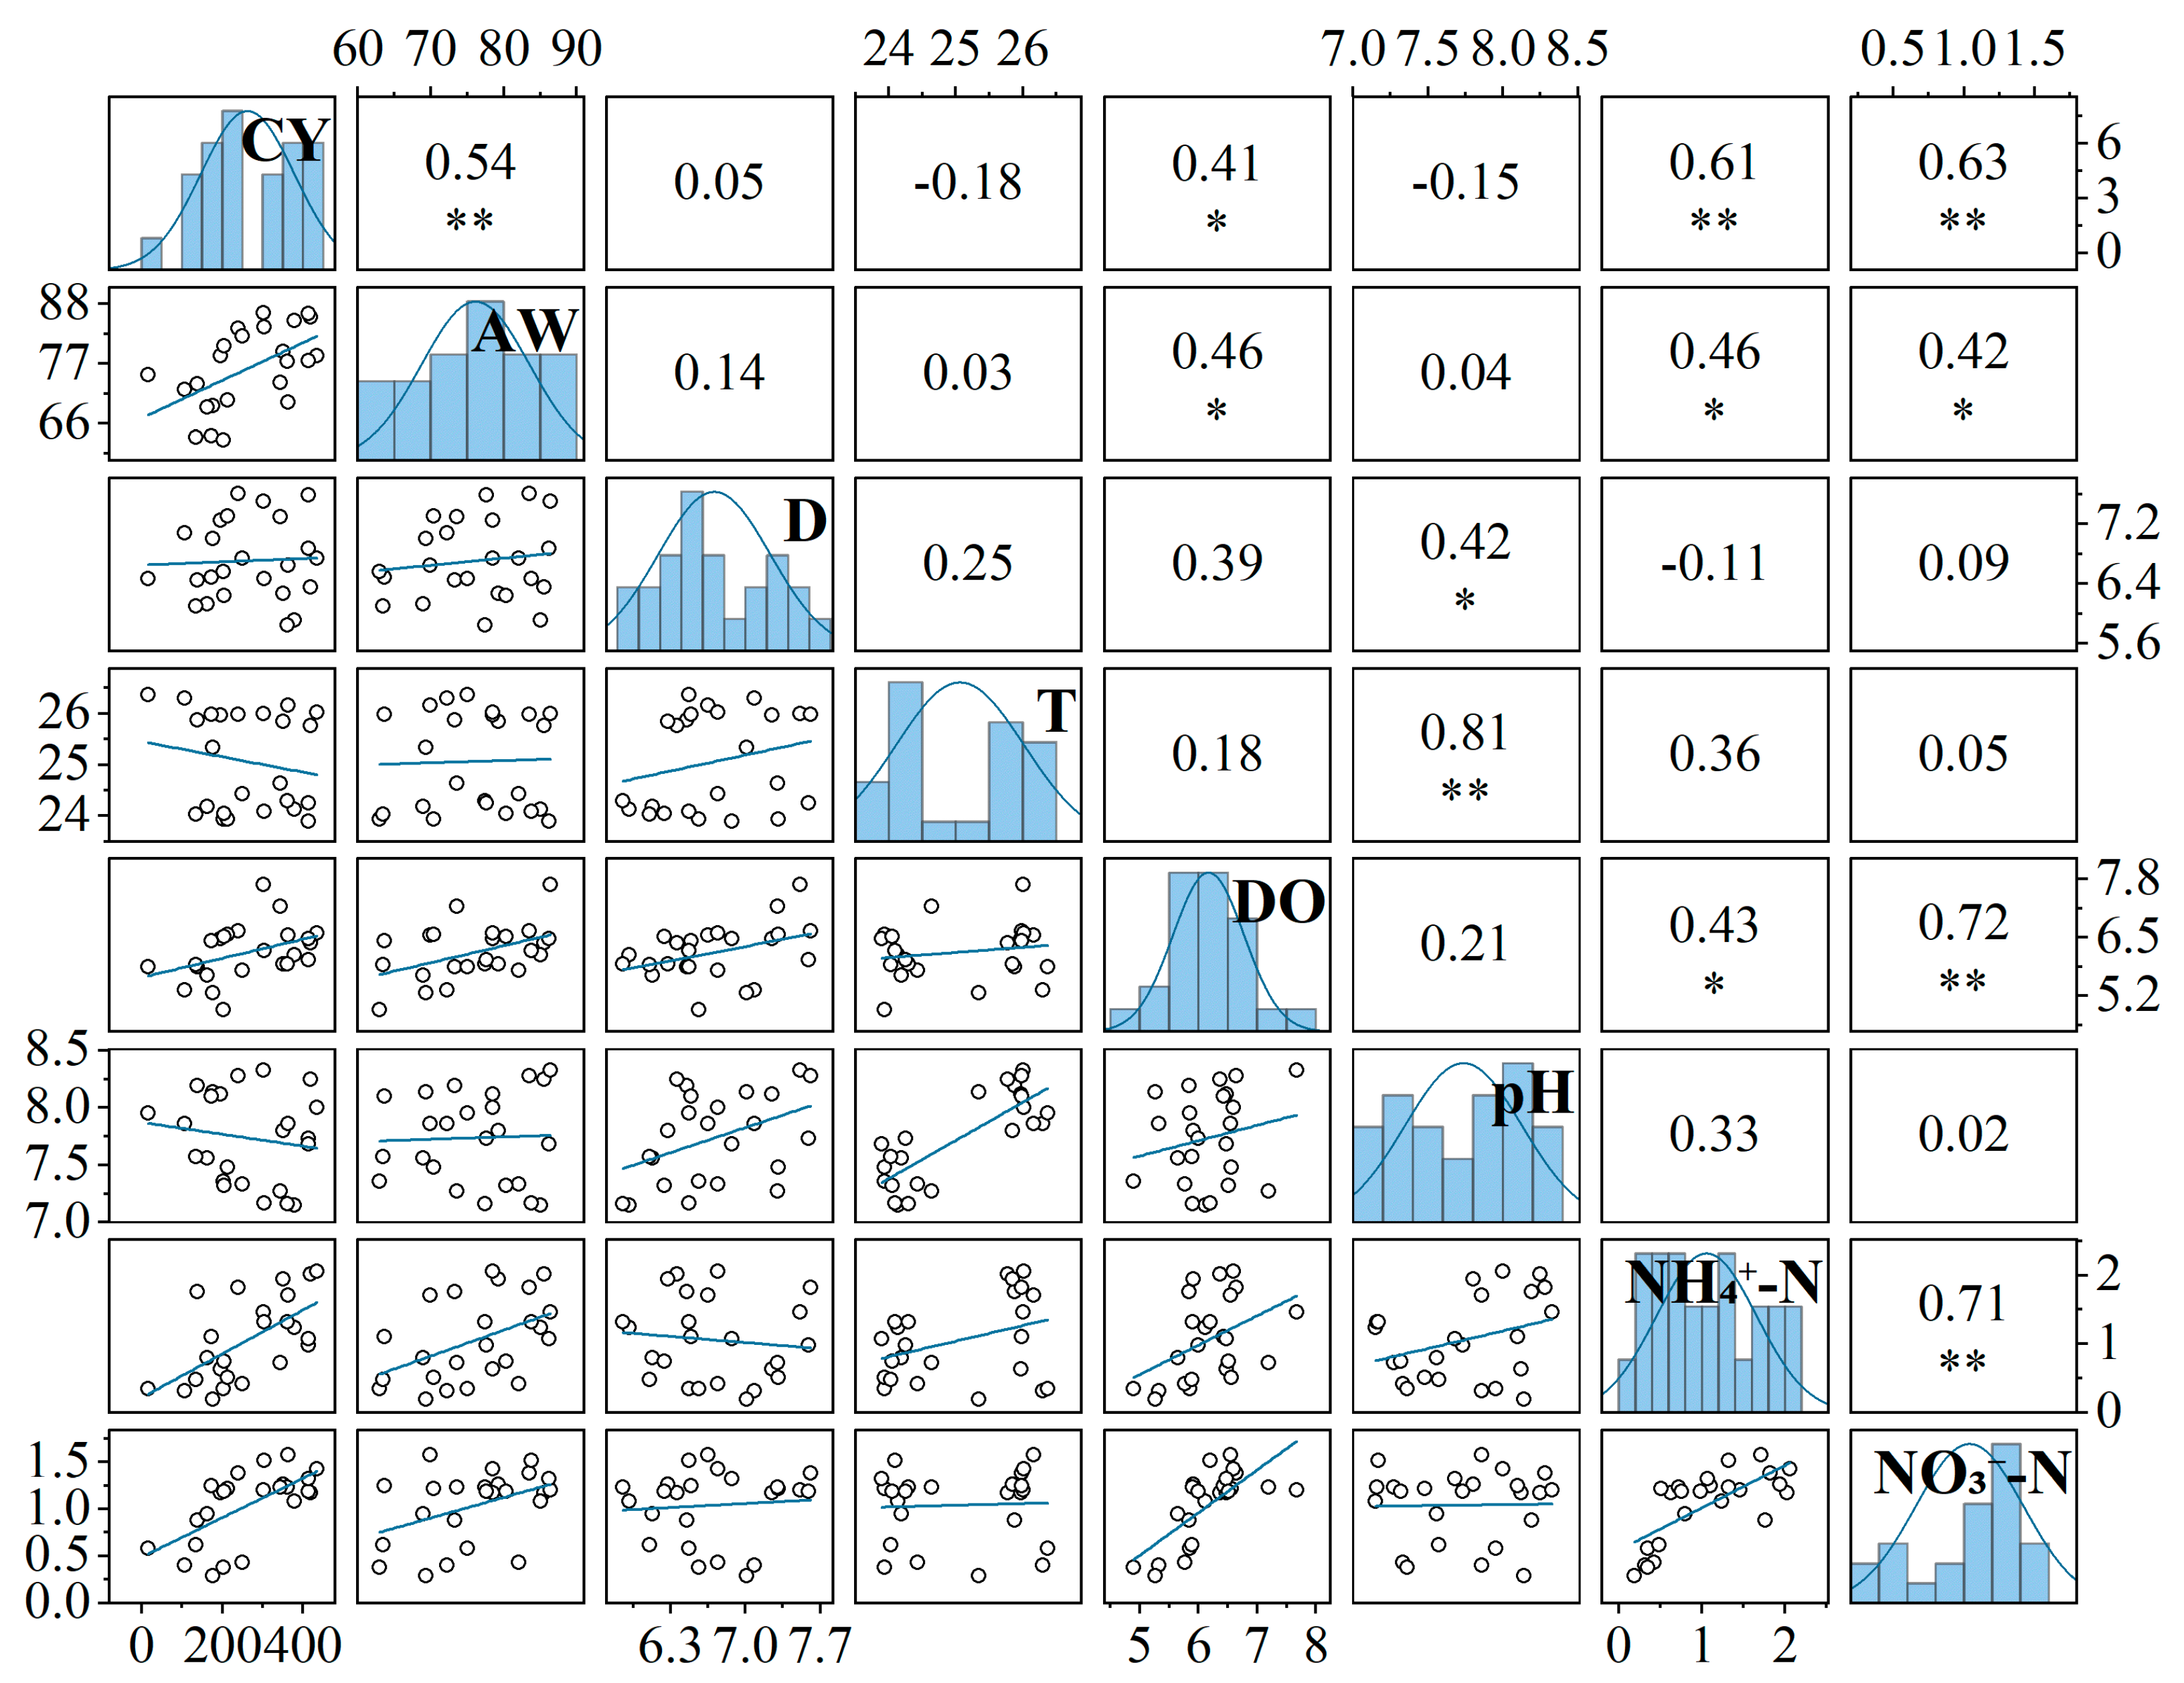
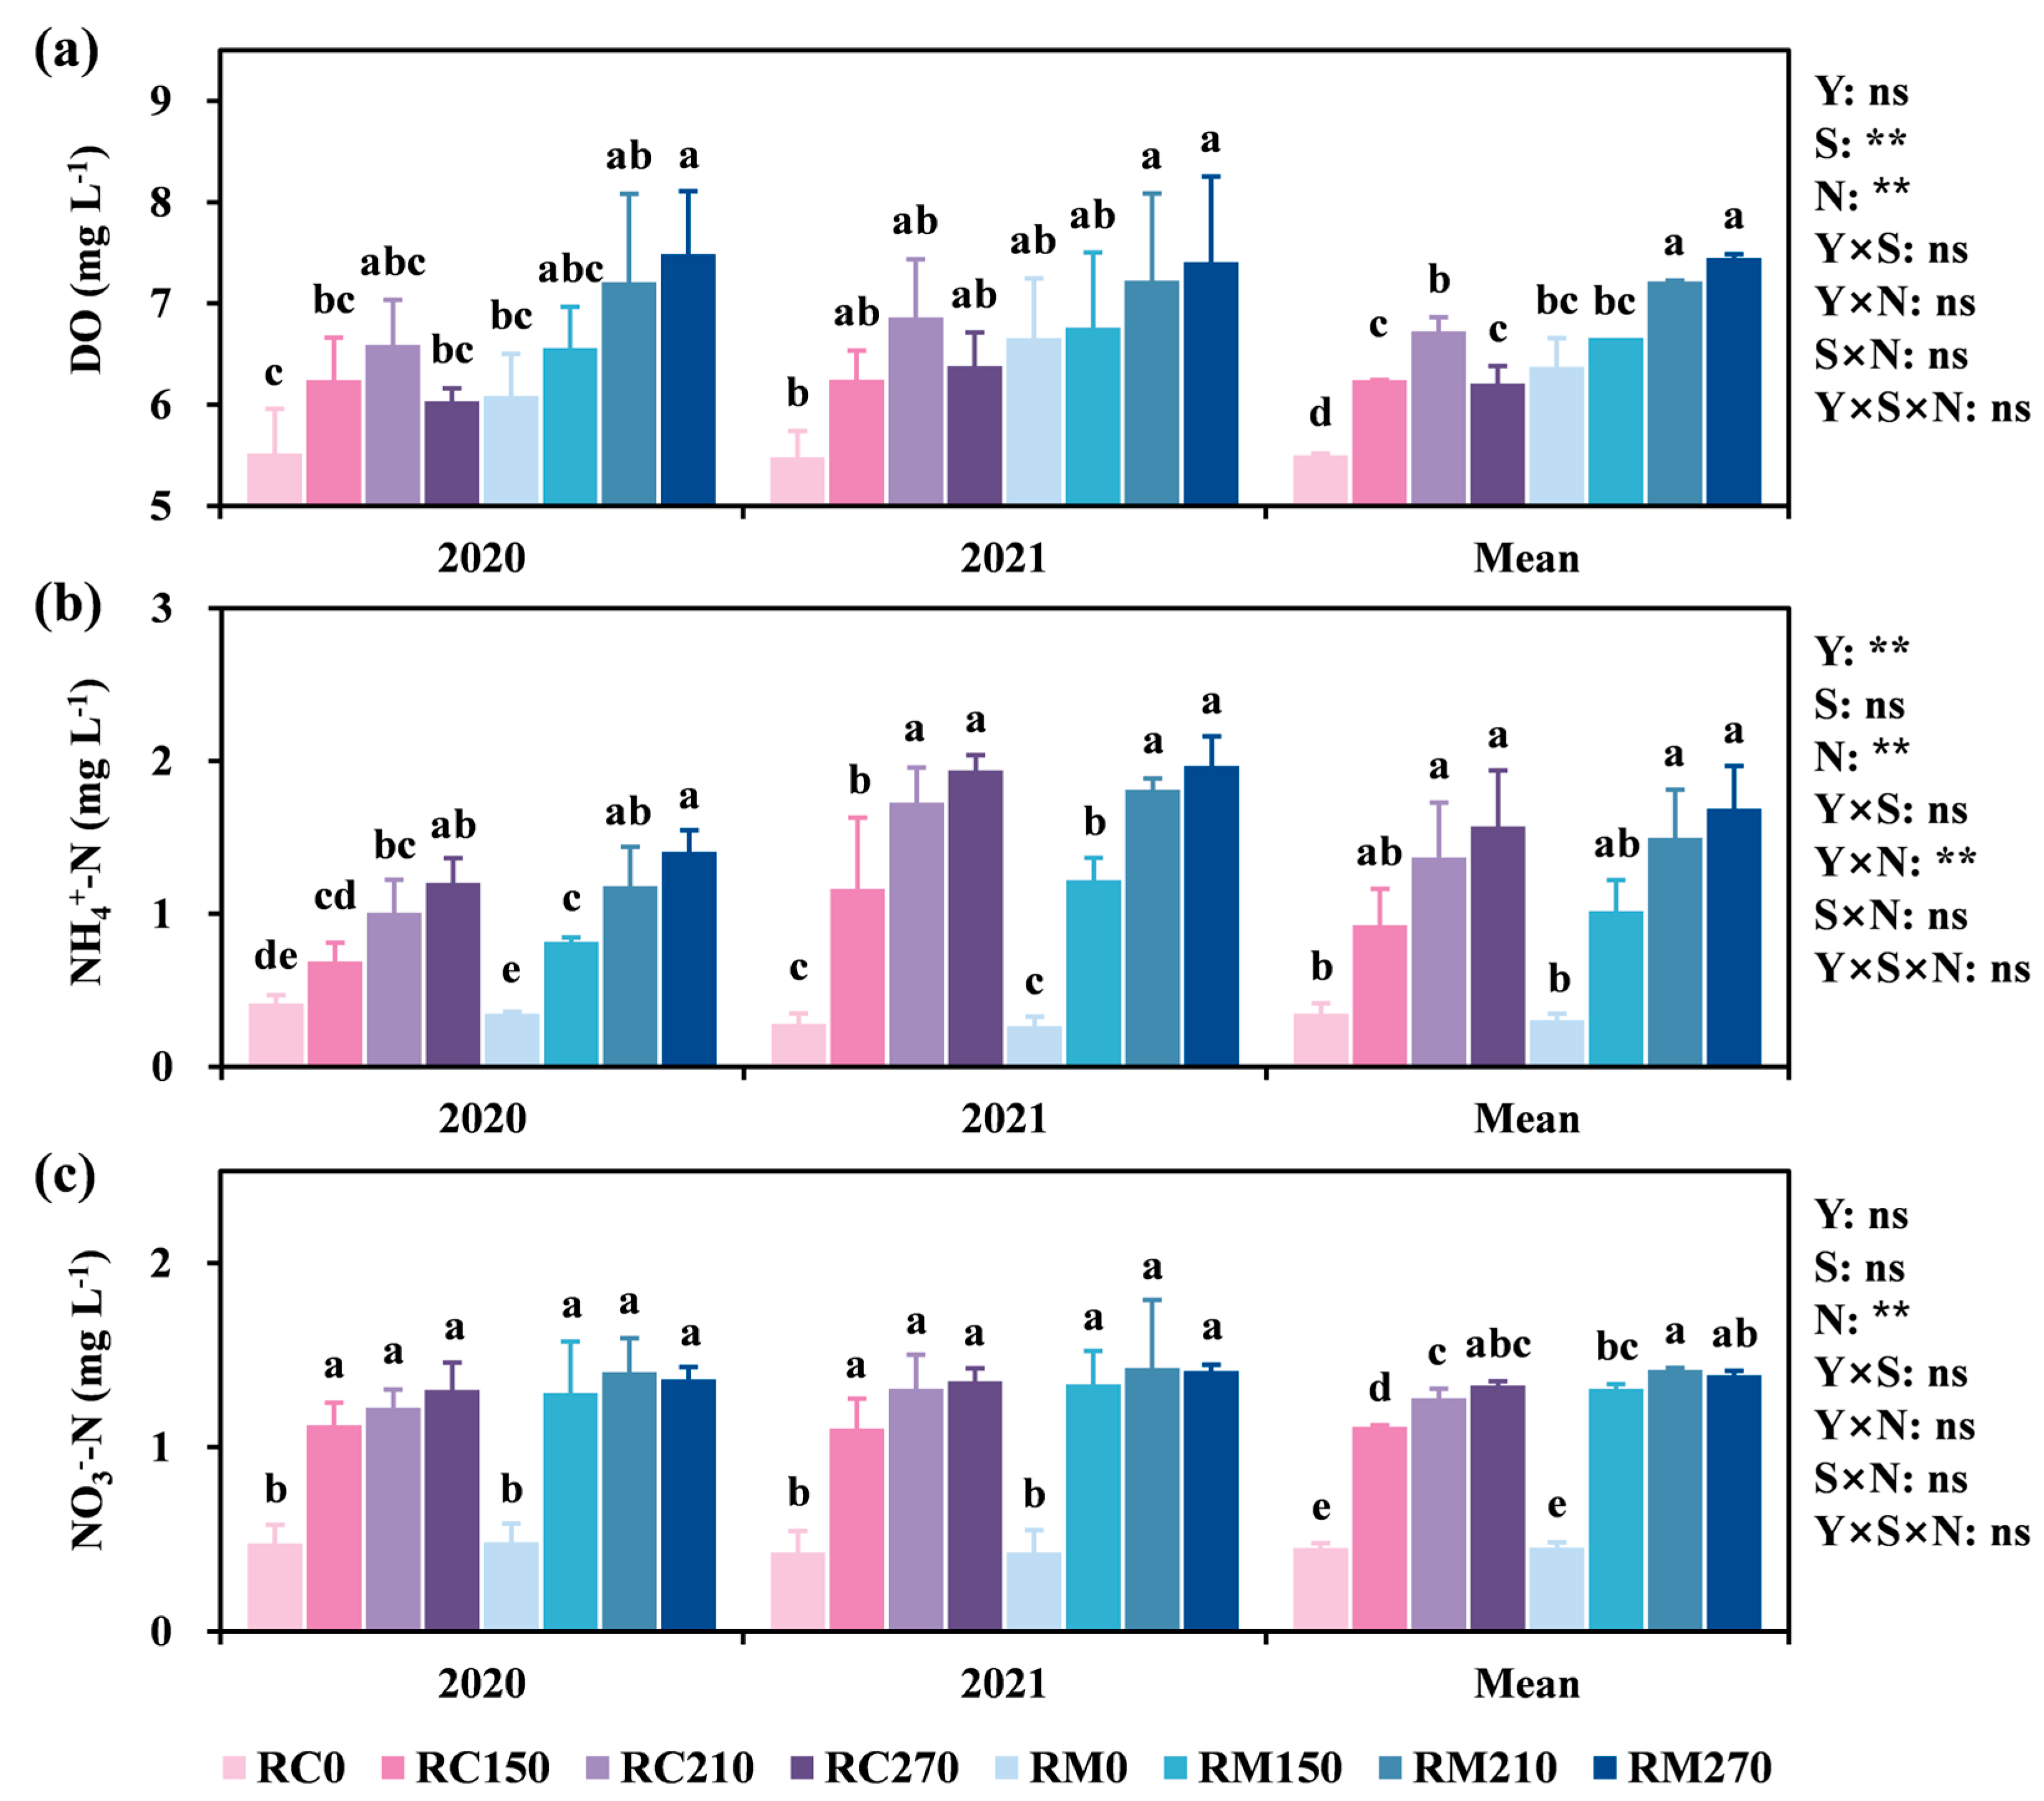
3.2. Effect of Surface Water Characteristics on Crab Production

Crab yield and average weight demonstrated a significant positive correlation with the average concentrations of DO, NH4+-N, and NO3-N in surface water during the crab growing season (Figure 4). N application significantly increased the average concentrations of DO, NH4+-N, and NO3-N in surface water. However, the RC system significantly decreased DO concentration in surface water compared to the RM system (Figure 5a–c). In 2020 and 2021, an N application rate of 210 kg ha−1 resulted in the highest concentration of DO in surface water within the RC system, ranging from 6.6 to 6.9 mg L−1. NH4+-N and NO3-N concentrations in surface water peaked at a N application rate of 270 kg ha−1 in the RC system, reaching 1.2–1.9 mg L−1 and 1.3–1.4 mg L−1, respectively. A N application rate of 210 kg ha−1 resulted in the most favorable DO concentration in surface water for crabs while avoiding excessive NH4+-N and NO3-N levels.

3.3. GHG Emissions, GWP, and GHGI

CH4 emission fluxes for all treatments remained low immediately after the application of the basal fertilizer, gradually increasing after 40 days and peaking around 70 days (Figure 6a). As the N application rate increased from 0 to 270 kg ha−1, the peaks of CH4 emission flux rose linearly from 7.2–15.5 mg m−2 h−1 to 21.3–26.4 mg m−2h−1 in the RC system and from 8.0–17.0 mg m−2 h−1 to 24.5–29.3 mg m−2 h−1 in the RM system. CH4 emission fluxes declined gradually and nearly ceased by the time of crab harvest. After the application of the basal fertilizer, N2O emission fluxes increased rapidly, peaking within 1–2 weeks (Figure 6b). As the N application rate increased from 0 to 270 kg ha−1, the maximum N2O emission flux increased linearly from 19.0–101.1 µg m−2 h−1 to 111.2–285.2 µg m−2 h−1 in the RC system and from 19.8–88.7 µg m−2 h−1 to 111.6–330.0 µg m−2 h−1 in the RM system. N2O emission fluxes declined rapidly, increased again within one week after the application of the tillering fertilizer, and then decreased rapidly to almost zero.
The cumulative emissions of CH4 and N2O were significantly influenced by the N application rate and varied notably between years (p < 0.01; Table 3). The N application rate linearly increased the cumulative emissions of CH4 and N2O in both the RC and RM systems. In 2020 and 2021, the cumulative CH4 emissions of the RC system increased linearly by 82.5–125.0% from 117.8–181.1 kg ha−1 to 265.2–330.6 kg ha−1, as the N application increased from 0 to 270 kg ha−1. CH4 emissions of the RM system increased linearly by 70.5–158.3% from 109.3–199.8 kg ha−1 to 282.5–340.6 kg ha−1. The increase in N2O emissions was more pronounced. The cumulative N2O emissions of the RC system increased linearly by 160.1–648.9% from 0.09–0.36 kg ha−1 to 0.72–0.95 kg ha−1 as N application increased from 0 to 270 kg ha−1. N2O emissions of the RM system increased linearly by 175.6–635.0% from 0.09–0.33 kg ha−1 to 0.69–0.93 kg ha−1. Under the same N application rate, cumulative CH4 emissions in the RC system exhibited average reductions of 3.7–5.8% compared to the RM system over two years. Meanwhile, cumulative N2O emissions of the RC system increased by 1.5–2.1%. RC210 reduced cumulative CH4 and N2O emissions by an average of 13.3% and 12.4%, respectively, compared to the RM270 over two years.
GWP and GHGI were significantly influenced by the N application rate and year, with GHGI showing significantly reduced in the RC system (Table 3). As the N application rate increased from 0 to 270 kg ha−1, the GWP of the RC system increased linearly from 3397–5098 kg CO2-eq ha−1 to 7678–9449 kg CO2-eq ha−1, while that of the RM from 3152–5621 kg CO2-eq ha−1 to 8159–9724 kg CO2-eq ha−1. Similarly, GHGI increased linearly from 0.69–1.10 kg CO2-eq kg−1 to 0.91–1.26 kg CO2-eq kg−1 for the RC system and from 0.62–1.31 kg CO2-eq kg−1 to 1.02–1.37 kg CO2-eq kg−1 for the RM system. At the same N application rate, GWP and GHGI in the RC system exhibited reductions of 3.6–5.7% and 5.5–11.1%, respectively, compared to the RM system over two years. Compared to RM270, RC210 reduced GWP and GHGI by an average of 13.3% and 13.7% over two years. Overall, N application significantly increased the emission fluxes and cumulative emissions of CH4 and N2O. The RC system significantly reduced GHGI compared to the RM system, and RC210 has a greater GHG reduction potential than RM270.

3.4. NEB and NEEB

NEB and NEEB were significantly influenced by the N application and year, with both being significantly higher in the RC system (Figure 7). N application significantly affected the NEB and NEEB in the RC system, both of which exhibited an increasing and then decreasing trend. In 2020 and 2021, as the N application rate increased from 0 to 210 kg ha−1, the NEB of the RC system increased from −4616.7 and −7014.0 CNY ha−1 to 9095.8 and 9725.4 CNY ha−1, reaching the maximum. However, the NEB in the RC system decreased by 14.4% and 10.0% as the N application rate increased from 210 to 270 kg ha−1. Similarly, as the N application rate increased from 0 to 210 kg ha−1, NEEB of the RC system increased from −5505.3 and −7606.1 CNY ha−1 to 7639.9 and 9555.0 CNY ha−1, then decreased by 19.7% and 12.2% as the N application rate increased to 270 kg ha−1. As the N application rate increased from 0 to 270 kg ha−1, the NEB in the RM system increased linearly from −4220.6 and −1877.6 CNY ha−1 to 867.6 and 3508.3 CNY ha−1, and NEEB in the RM system increased linearly from −5200.3 and −2427.0 CNY ha−1 to −827.2 and 2086.3 CNY ha−1 (Figure 7a,b). The maximum NEB and NEEB in the RC system (RC210) were, on average, 354.7% and 1265.7% higher than those in the RM system (RM270), respectively, over two years. Therefore, considering both economic and environmental benefits, the optimal N application rates for the RC and RM systems were 210 kg ha−1 and 270 kg ha−1, respectively, with both NEB and NEEB being significantly higher in the RC system under the optimal N application rate.

4. Discussion

4.1. Optimizing N Application Potential for Improving Rice and Crab Production

Due to the sensitivity of rice and crab yields to N application rates, it is critical to analyze the optimization of N application to guide appropriate N management practices in the RC system [22]. This study demonstrated that the N application rate of 270 kg ha−1 maximized rice yield in the RM system (Figure 3a), consistent with results from the developer of the rice variety Yanfeng 47 [33]. Additionally, the rice yields in the RC system also reached a maximum of 270 kg ha−1, suggesting that rice yields in the RC system responded to the N application in the same way as in the RM system. In the RC system, unutilized feed and crab feces provided supplementary N for rice growth, extending the period of N availability [27,38] and thereby improving GNU, NRE, and NPFP by 4.9%, 10.8%, and 4.8%, respectively, compared to the RM system (Table 2). Furthermore, crabs limit the growth of weeds and ineffective rice tillers by feeding on them [27,39], thereby reducing N fertilizer waste and improving agronomic traits by 1.9–8.1% (Table 1). The increase in rice yield was attributed to enhanced agronomic traits and N use efficiency [40,41], which were enhanced in the RC system (Table 1), leading to higher rice yields in the RC system compared to the RM system (Figure 3a). These improvements are consistent with previous studies [23,25]. Based on earlier research, this study further demonstrates that the agronomic traits and N use efficiency of RC210 were superior to those of RM270 over two years despite the N application rate being 60 kg ha−1 lower (Table 1), resulting in a higher rice yield at 7603.1 kg ha−1 (Figure 3a). Therefore, a judicious reduction in the N application rate in the RC system can yield higher rice production than the maximum yield of the RM system due to improvements in agronomic traits and N use efficiency.
Crabs play a decisive role in enhancing the economic efficiency of the RC system [42]. The application of N enriches the natural food available to crabs in RC systems, especially macrophytes, phytoplankton, zooplankton, and zoobenthos [28,43]. Increased N application rates boost the nutrient supply for crabs, leading to higher crab yields and average weights (Figure 3b,c). Consequently, crab yields and average weights were significantly higher at N application rates of 210 and 270 kg ha−1 compared to 0 and 150 kg ha−1 (Figure 3b,c), indicating that N application is a crucial factor in crab production. Although few studies have investigated the effects of N application on crab production in RC systems, the observed positive impact aligns with the benefits of N application on aquatic production in pond aquaculture systems [44,45].
Unlike the response of rice yield to N application, the increase in N application rate did not linearly increase crab yield and average weight in our research (Figure 3b,c). Since crabs in the RC system inhabit surface water, their respiration consumes oxygen [46], leading to a significant decrease in DO concentration (Figure 5a), which threatens their survival. N is essential for enhancing the photosynthesis of aquatic plants and increasing DO concentrations in surface water [47,48,49]. Consequently, increased N application raises the NH4+-N and NO3-N concentrations in surface water (Figure 5b,c), facilitating algae propagation and increasing DO concentrations (Figure 5a). While these effects led to a linear increase in DO concentrations with increasing N application rates from 0 to 270 kg ha−1 in the RM system, the N application rate of 210 kg ha−1 resulted in the highest DO concentration in surface water in the RC system (Figure 5a). The probable reason is that excessive N application at 270 kg ha−1 resulted in high concentrations of NH4+-N and NO3-N in the surface water (Figure 5b,c), which were toxic to the crabs and led to their mortality. The decomposing crab carcasses consumed oxygen in the surface water, thereby decreasing DO concentration. Additionally, larger crabs have a greater need for oxygen, which resulted in the RC210 having the largest average weight. Therefore, an N application rate at 210 kg ha−1 is a viable strategy to ensure optimal crab production. Meanwhile, the surface water quality at this N application rate was most suitable for crabs, resulting in maximum crab yield and average weight. The N application rate of 210 kg ha−1 is the optimal N application strategy for the RC systems.

4.2. Effects of the Optimizing N Application on GHG Emissions in RC System

During the early stages of the planting season, the application of N resulted in elevated concentrations of N in surface water and soil (Figures S1e,f and S2e,f), along with high levels of DO (Figures S1e and S2e), which enhanced nitrification and denitrification [50,51], leading to a surge in N2O emissions (Figure 6b). In contrast, N2O emission fluxes after the tillering stage were suppressed due to the intensification of anaerobic conditions in the soil as a result of persistent flooding, as well as the lack of N [52]. Anaerobic conditions favored CH4 production [53,54], and the increase in carbon substrates from root secretions and decaying leaves of growing rice [55], along with the formation of advanced aerenchyma [56], led to a gradual increase in CH4 emissions after the tillering stage (Figure 6a). CH4 emission fluxes gradually decreased in the later stages of rice growth as temperature decreased and the ventilation tissues aging and breaking [57]. Similar results were observed in other studies [30,58]. Our research further demonstrated that RC systems can reduce GHG emissions by optimizing N application. This is likely due to the precise application of N fertilizer, which enhances N use efficiency of rice while reducing the carbon substrates available for CH4 production [59]. The availability of substrates for nitrification and denitrification was decreased [60]. Consequently, optimized N application reduced both CH4 and N2O emissions in rice paddies [32,61]. Furthermore, our findings indicate that crabs reduce CH4 emissions from RC systems through physical disturbance, consistent with the results of Khoshnevisan et al. [22]. However, the reduction potential is limited at each N application rate [30]. The limitation may be due to the low population density of crabs and their lack of burrow construction in paddy fields, resulting in minimal disturbance [24,31]. Additionally, the RC system significantly reduced DO in surface water compared to the RM system (Figure 5a), diminishing its potential to reduce CH4 emissions. Another notable finding was that the RC system did not significantly reduce N2O emissions; rather, it slightly increased them (Table 3), contrary to previous studies [22,30]. This discrepancy may be due to the timing of GHG monitoring, which in this study, began with the application of basal fertilizer, whereas previous studies typically started at transplanting, thus overlooking N2O emissions during the initial period. The presence of N in unutilized feed and crab feces increased the N substrate [39], which in turn slightly elevated N2O emissions during this period. Although the RC system did not significantly affect GHG emissions (Table 3), the N application significantly stimulated GHG emissions. Reducing N application to 210 kg ha−1 in the RC system could significantly reduce GHG emissions, resulting in lower GWP and GHGI. Thus, in RC systems, optimized N application at 210 kg ha−1 enhances productivity while more effectively reducing GHG emissions, thereby further decreasing GWP and GHGI.

4.3. Synergize Economic and Ecological Benefits with Optimizing N Application

Taking into account both economic and ecological benefits, the maximum NEEB in RC and RM systems was achieved at N application rates of 210 kg ha−1 and 270 kg ha−1, respectively (Figure 7a). Despite the reduced N application rate, the NEEB of RC210 exhibited an average increase of 1265.7% over a two-year period compared to RM270, attributable to enhanced productivity and reduced GHG emissions. The optimized N application rate resulted in a more significant NEEB enhancement in the RC system compared to previous studies [30]. Although the differences in rice yields at the optimal N application rate were minimal, the crab yield led to a notable 354.7% increase in NEB in RC210 compared to RM270. To ensure food security, the government typically maintains low rice prices through monopoly purchases. In contrast, aquatic products such as crabs are sold in the free market and command higher economic value, aligning with the findings of previous studies [9,62]. Concurrently, the GWP cost of the RC system is reduced due to the lower GHG emissions resulting from decreased N application, thereby maximizing NEEB. Since farmers are primarily interested in NEB, which serves as the intrinsic motivation for the transition from the traditional RM system to the RC system, 210 kg ha−1 represents the optimal N fertilizer application rate that balances economic and environmental benefits, maximizing benefits for farmers’ incomes [30,62]. Based on the technology and experience of existing RC systems, it can be reasonably concluded that the RC system is well-suited for adoption by small farmers [16,22]. This adoption increases farmers’ incomes, thereby supporting China’s poverty alleviation goals. Therefore, it is recommended that farmers be encouraged to adopt the RC system and utilize NEB to guide the optimization of N application, thereby achieving a synergistic increase in economic and ecological benefits.
This study elucidated that optimizing the N application rate improves the productivity, sustainability, and economic efficiency of the RC systems. However, N application may affect the metabolism of nitrogen in both rice and crabs, thus altering the quality and taste; therefore, further research is needed [63,64]. It is worth noting that the RC system used in this study is the most widely accepted model. Innovative RC models, such as the addition of azolla and the construction of aeration devices, could also have the potential to increase crab yield and reduce CH4 emissions by enhancing DO concentrations within the paddy field [65,66]. Compared to other optimization strategies, adjusting the N application rate is the most feasible and easy-to-implement improvement for farmers, as the main constraints to the development of RC systems are the aging labor force and the technical capacity of available technology [22]. Combining optimized N application with other innovative RC models may yield even greater potential, and its productivity, sustainability, and economic efficiency should be further investigated.

5. Conclusions

This study compared productivity, sustainability, and economic benefits between the RC and RM systems at different N application rates. Agronomic traits, N use efficiency, and rice yield were improved in the RC system compared to the RM system, with the rice yield of RC210 still 0.4% higher than RM270 despite a lower N application rate. Additionally, RC210 maximizes crab yields (370.1 kg ha−1) and average weights (81.1 g) by optimizing surface water quality, particularly by maximizing the DO concentration to 6.6–6.9 mg L−1. At the same N application rate, the GHGI was reduced by 5.5–11.1% in the RC system compared to the RM system and further reduced by 13.7% in RC210 compared to RM270. The maximum NEEB in the RC system reached 8597.5 CNY ha−1 at an N application rate of 210 kg ha−1, which was 1265.7% higher than that of the RM system at 270 kg ha−1. In conclusion, the optimized N application rate of 210 kg ha⁻¹ in the RC system was lower than the 270 kg ha⁻1 required in the RM system, while simultaneously enhancing both economic and ecological benefits.

Supplementary Materials

The following supporting information can be downloaded at: https://www.mdpi.com/article/10.3390/agronomy14102219/s1, Figure S1: Surface water parameter dynamics of different treatments in 2020; Figure S2: Surface water parameter dynamics of different treatments in 2021; Table S1: Management practices of different treatments; Table S2: Expenses of different treatments; Table S3: Crab sale price of different sex and weight grading.

Author Contributions

Conceptualization, Y.X. and W.S.; Data curation, Y.X. and H.L. (Hao Li); Formal analysis, H.W., M.A.B. and X.Z.; Investigation, H.L. (Hao Li) and H.W.; Methodology, Y.X., X.D., M.A.B., W.S. and H.L. (Hongbin Liu); Project administration, M.A.; Resources, X.D. and W.S.; Supervision, M.A. and H.L. (Hongbin Liu); Validation, H.L. (Hao Li), X.D. and X.Z.; Visualization, Y.X. and X.Z.; Writing—original draft, Y.X.; Writing—review and editing, H.L. (Hao Li), W.S., M.A. and H.L. (Hongbin Liu). All authors have read and agreed to the published version of the manuscript.

Funding

This research was funded by the Agricultural Science and Technology Innovation Program of Chinese Academy of Agricultural Sciences, the Strategic Priority Research Program of the Chinese Academy of Sciences (No. XDA28130200), and the Earmarked fund for the China Agriculture Research System (No. CARS-01-30).

Data Availability Statement

The data presented in this study are available on request from the corresponding author.

Conflicts of Interest

Author Muhammad Amjad Bashir was employed by the company Department of Agronomy, Engro Fertilizers Ltd. The remaining authors declare that the research was conducted in the absence of any commercial or financial relationships that could be construed as a potential conflict of interest.

References

  1. He, X.; Batary, P.; Zou, Y.; Zhou, W.; Wang, G.; Liu, Z.; Bai, Y.; Gong, S.; Zhu, Z.; Settele, J.; et al. Agricultural diversification promotes sustainable and resilient global rice production. Nat. Food 2023, 4, 788–796. [Google Scholar] [CrossRef] [PubMed]
  2. Chen, S.; Elrys, A.S.; Zhao, C.; Cai, Z.; Zhang, J.; Mueller, C. Global patterns and controls of yield and nitrogen use efficiency in rice. Sci. Total Environ. 2023, 898, 165484. [Google Scholar] [CrossRef] [PubMed]
  3. Tilman, D.; Cassman, K.G.; Matson, P.A.; Naylor, R.; Polasky, S. Agricultural sustainability and intensive production practices. Nature 2002, 418, 671–677. [Google Scholar] [CrossRef] [PubMed]
  4. Zhuang, M.; Caro, D.; Qin, W.; Wang, C.; Yang, X.; Liu, R.; Zhang, L. Spatial heterogeneity of greenhouse gas emissions from cereal crop production in China. Environ. Chem. Lett. 2022, 20, 3371–3376. [Google Scholar] [CrossRef]
  5. Guo, C.; Liu, X.; He, X. A global meta-analysis of crop yield and agricultural greenhouse gas emissions under nitrogen fertilizer application. Sci. Total Environ. 2022, 831, 154982. [Google Scholar] [CrossRef] [PubMed]
  6. Zhen, W.; Qin, Q.; Qian, X.; Wei, Y. Inequality across China’s Staple Crops in Energy Consumption and Related GHG Emissions. Ecol. Econ. 2018, 153, 17–30. [Google Scholar] [CrossRef]
  7. Hussain, S.; Peng, S.; Fahad, S.; Khaliq, A.; Huang, J.; Cui, K.; Nie, L. Rice management interventions to mitigate greenhouse gas emissions: A review. Environ. Sci. Pollut. R. 2015, 22, 3342–3360. [Google Scholar] [CrossRef]
  8. Linquist, B.; Groenigen, K.J.; Adviento-Borbe, M.A.; Pittelkow, C.; Kessel, C. An agronomic assessment of greenhouse gas emissions from major cereal crops. Global Change Biol. 2012, 18, 194–209. [Google Scholar] [CrossRef]
  9. Ge, L.; Sun, Y.; Li, Y.; Wang, L.; Guo, G.; Song, L.; Wang, C.; Wu, G.; Zang, X.; Cai, X.; et al. Ecosystem sustainability of rice and aquatic animal co-culture systems and a synthesis of its underlying mechanisms. Sci. Total Environ. 2023, 880, 163314. [Google Scholar] [CrossRef]
  10. Chen, B.; Guo, L.; Tang, J.; Li, Y.; Li, C. Comprehensive impacts of different integrated rice-animal co-culture systems on rice yield, nitrogen fertilizer partial factor productivity and nitrogen losses: A global meta-analysis. Sci. Total Environ. 2024, 915, 169994. [Google Scholar] [CrossRef]
  11. FAO. FAO Statistical Databases; Food and Agriculture Organization of the United Nations: Rome, Italy, 2021; Available online: http://www.fao.org/faostat/en/#data/QCL (accessed on 1 May 2024).
  12. Qi, Z.; Liu, S.; Ning, B.; Wu, X. The history of rice-fish co-culture in China and its inspiration for the cooperation of the Lancang-Mekong countries. Aquac. Res. 2022, 53, 5761–5770. [Google Scholar] [CrossRef]
  13. Yu, X.; Hao, X.; Dang, Z.; Yang, L. China rice-fishery integrated farming industry development report. Chin. Fish. 2023, 8, 19–26. (In Chinese) [Google Scholar] [CrossRef]
  14. Ge, Y.; Shen, K. Current situation, problems and countermeasures of sustainable development for paddy field fishery in China. Guizhou Agr. Sci. 2021, 49, 78–84. (In Chinese) [Google Scholar] [CrossRef]
  15. Tang, J.; Li, W.; Lv, X.; Wang, Y.; Ding, X.; Tang, Y.; Li, J.; Zhang, J.; Du, J.; You, Y.; et al. Development status and rethinking of the integrated rice-fish system in China. China Rice 2020, 26, 1–10. (In Chinese) [Google Scholar] [CrossRef]
  16. Bao, J.; Jiang, H.; Li, X. Thirty years of rice-crab coculture in China—Research progress and prospects. Rev. Aquacult. 2022, 14, 1597–1612. [Google Scholar] [CrossRef]
  17. Huang, M.; Zhou, Y.; Guo, J.; Dong, X.; An, D.; Shi, C.; Li, L.; Dong, Y.; Gao, Q. Co-culture of rice and aquatic animals mitigates greenhouse gas emissions from rice paddies. Aquacult. Int. 2024, 32, 1785–1799. [Google Scholar] [CrossRef]
  18. Zhang, Z.; Bu, D.; Qiang, S. A field investigation of long-term weed control via different types of rice-aquaculture integrated cultivations. J. Plant Prot. 2022, 49, 693–704. (In Chinese) [Google Scholar] [CrossRef]
  19. Liu, Y.; Ma, X.; Li, C. Study on the effect of rice-crab co-culture on the prevention and control of dominant weeds in Panjin rice area. North Rice 2019, 49, 24–26. (In Chinese) [Google Scholar] [CrossRef]
  20. Liu, C.; Zhu, X.; Xu, Z.; Ren, D.; Meng, Y.; Liu, Y.; Tang, J. Dynamic non-target analysis and occurrence of herbicides residues in rice-crab co-culture systems in Jiangsu Province. J. Ecol. Rural Environ. 2022, 38, 933–943. (In Chinese) [Google Scholar] [CrossRef]
  21. Song, C.; Zhang, J.; Hu, G.; Meng, S.; Fan, L.; Zheng, Y.; Chen, J.; Zhang, X. Risk assessment of chlorantraniliprole pesticide use in rice-crab coculture systems in the basin of the lower reaches of the Yangtze River in China. Chemosphere 2019, 230, 440–448. [Google Scholar] [CrossRef]
  22. Khoshnevisan, B.; Bashir, M.A.; Sun, Q.; Pan, J.; Wang, H.; Xu, Y.; Duan, N.; Liu, H. Optimal rice-crab co-culture system as a new paradigm to air-water-food nexus sustainability. J. Clean. Prod. 2021, 291, 125936. [Google Scholar] [CrossRef]
  23. Lv, W.; Yuan, Q.; Lv, W.; Zhou, W. Effects of introducing eels on the yields and availability of fertilizer nitrogen in an integrated rice-crayfish system. Sci. Rep. 2020, 10, 14818. [Google Scholar] [CrossRef]
  24. Wang, W.; Wu, X.; Deng, Z.; Yin, C.; Xie, Y. Can integrated rice-duck farming reduce CH4 emissions? Environ. Sci. Pollut. R. 2020, 27, 1004–1008. [Google Scholar] [CrossRef]
  25. Bashir, M.A.; Wang, H.; Sun, W.; Zhai, L.; Zhang, X.; Wang, N.; Rehim, A.; Raza, Q.U.A.; Liu, H. The implementation of rice-crab co-culture system to ensure cleaner rice and farm production. J. Clean. Prod. 2021, 316, 128284. [Google Scholar] [CrossRef]
  26. Das, P.; Jena, J.; Mishra, B.; Sarangi, N. Impact of varied frequency of nitrogen fertilization on the grow-out performance of Labeo rohita (Hamilton). Aquac. Res. 2011, 42, 1859–1868. [Google Scholar] [CrossRef]
  27. Guo, K.; Zhao, W.; Li, W.; Zhao, Y.; Zhang, P.; Zhang, C. Food web structure and trophic levels in polyculture rice-crab fields. Chin. J. Oceanol. Limn. 2015, 33, 735–740. [Google Scholar] [CrossRef]
  28. Rahman, M.M.; Nagelkerke, L.A.J.; Verdegem, M.C.J.; Wahab, M.A.; Verreth, J.A.J. Relationships among water quality, food resources, fish diet and fish growth in polyculture ponds: A multivariate approach. Aquaculture 2008, 275, 108–115. [Google Scholar] [CrossRef]
  29. Wang, A. Migration and Transformation of Nitrogen in Rice-Crab Culture Systems. Ph.D. Thesis, Shanghai Ocean University, Shanghai, China, 2018. [Google Scholar]
  30. Wang, A.; Ma, X.; Xu, J.; Lu, W. Methane and nitrous oxide emissions in rice-crab culture systems of northeast China. Aquac. Fish. 2019, 4, 134–141. [Google Scholar] [CrossRef]
  31. Xu, Q.; Dai, L.; Zhou, Y.; Dou, Z.; Gao, W.; Yuan, X.; Gao, H.; Zhang, H. Effect of nitrogen application on greenhouse gas emissions and nitrogen uptake by plants in integrated rice-crayfish farming. Sci. Total Environ. 2023, 905, 167629. [Google Scholar] [CrossRef]
  32. Park, J.R.; Jang, Y.H.; Kim, E.G.; Lee, G.S.; Kim, K.M. Nitrogen Fertilization Causes Changes in Agricultural Characteristics and Gas Emissions in Rice Field. Sustainability 2023, 15, 3336. [Google Scholar] [CrossRef]
  33. Ren, H.; FU, L.; Wang, Y.; LV, X.; Li, X.; Sui, X. Effect of different nitrogen fertilizer application rates on the yield of super rice “Yanfeng 47”. Mod. Agric. Sci. Technol. 2016, 3, 30–31. (In Chinese) [Google Scholar] [CrossRef]
  34. Ma, P.; Lan, Y.; Lyu, T.; Li, F.; Yang, Z.; Sun, Y.; Ma, J. Nitrogen Fate and Efficiency of Fertilizer Application under a Rapeseed-Wheat-Rice Rotation System in Southwest China. Agronomy 2021, 11, 258. [Google Scholar] [CrossRef]
  35. Allan, R.P.; Arias, P.A.; Berger, S.; Canadell, J.G.; Cassou, C.; Chen, D.; Cherchi, A.; Connors, S.L.; Coppola, E.; Abigail Cruz, F.; et al. IPCC 2021: Summary for policymakers in Climate Change 2021. In Contribution of Working Group I to the Sixth Assessment Report of the Intergovernmental Panel on Climate Change; Masson-Delmotte, V., Zhai, P., Pirani, A., Connors, S.L., Péan, C., Berger, S., Caud, N., Chen, Y., Goldfarb, L., Gomis, M.I., et al., Eds.; Cambridge University Press: Cambridge, UK, 2021. [Google Scholar]
  36. Song, K.; Zhang, G.; Yu, H.; Huang, Q.; Zhu, X.; Wang, T.; Xu, H.; Lv, S.; Ma, J. Evaluation of methane and nitrous oxide emissions in a three-year case study on single rice and ratoon rice paddy fields. J. Clean. Prod. 2021, 297, 126650. [Google Scholar] [CrossRef]
  37. He, Z.; Hu, R.; Tang, S.; Wu, X.; Zhang, Y.; Xu, M.; Zhang, W.; Wu, L. New vegetable field converted from rice paddy increases net economic benefits at the expense of enhanced carbon and nitrogen footprints. Sci. Total Environ. 2024, 916, 170265. [Google Scholar] [CrossRef] [PubMed]
  38. Xie, J.; Hu, L.; Tang, J.; Wu, X.; Li, N.; Yuan, Y.; Yang, H.; Zhang, J.; Luo, S.; Chen, X. Ecological mechanisms underlying the sustainability of the agricultural heritage rice-fish coculture system. Proc. Natl. Acad. Sci. USA 2011, 108, E1381–E1387. [Google Scholar] [CrossRef] [PubMed]
  39. Hu, L.; Guo, L.; Zhao, L.; Shi, X.; Ren, W.; Zhang, J.; Tang, J.; Chen, X. Productivity and the complementary use of nitrogen in the coupled rice-crab system. Agr. Syst. 2020, 178, 102742. [Google Scholar] [CrossRef]
  40. Anwar, K.; Joshi, R.; Morales, A.; Das, G.; Yin, X.; Anten, N.P.R.; Raghuvanshi, S.; Bahuguna, R.N.; Singh, M.P.; Singh, R.K.; et al. Genetic diversity reveals synergistic interaction between yield components could improve the sink size and yield in rice. Food Energy Secur. 2022, 11, e334. [Google Scholar] [CrossRef]
  41. Zhou, Q.; Yuan, R.; Zhang, W.; Gu, J.; Liu, L.; Zhang, H.; Wang, Z.; Yang, J. Grain yield, nitrogen use efficiency and physiological performance of indica/japonica hybrid rice in response to various nitrogen rates. J. Integr. Agr. 2023, 22, 63–79. [Google Scholar] [CrossRef]
  42. Sun, N.; Wang, T.; Qi, B.; Yu, S.; Yao, Z.; Zhu, G.; Fu, Q.; Li, C. Inhibiting release of phenanthrene from rice-crab coculture sediments to overlying water with rice stalk biochar: Performance and mechanisms. Sci. Total Environ. 2024, 908, 168385. [Google Scholar] [CrossRef]
  43. Leigh, C.; Hiep, L.H.; Stewart-Koster, B.; Vien, D.M.; Condon, J.; Sang, N.V.; Sammut, J.; Burford, M.A. Concurrent rice-shrimp-crab farming systems in the Mekong Delta: Are conditions (sub)optimal for crop production and survival? Aquac. Res. 2017, 48, 5251–5262. [Google Scholar] [CrossRef]
  44. Chakrabarty, D.; Das, S.K.; Das, M.K.; Bag, M.P. Assessment of vermicompost as direct application manure in fish farming ponds. Turk. J. Fish. Aquat. Sci. 2010, 10, 47–52. [Google Scholar] [CrossRef]
  45. Terziyski, D.; Grozev, G.; Kalchev, R.; Stoeva, A. Effect of organic fertilizer on plankton primary productivity in fish ponds. Aquacult. Int. 2007, 15, 181–190. [Google Scholar] [CrossRef]
  46. Yuan, Q.; Lu, W.; Huang, W.; Sun, X.; Lu, W.; Zhou, W. Effects of different fertilization rates on the growth of loach and rice yield in rice-loach culture system. Acta Agric. 2020, 36, 17–22. (In Chinese) [Google Scholar] [CrossRef]
  47. Bui, E.N.; Henderson, B.L. C:N:P stoichiometry in Australian soils with respect to vegetation and environmental factors. Plant Soil 2013, 373, 553–568. [Google Scholar] [CrossRef]
  48. Malek, S.; Ahmad, S.M.S.; Singh, S.K.K.; Milow, P.; Salleh, A. Assessment of predictive models for chlorophyll-a concentration of a tropical lake. BMC Bioinform. 2011, 12, S12. [Google Scholar] [CrossRef]
  49. Wamboldt, J.J.; Wanamaker, A.D.; Morris, J.E. Commercial Diets in Phase I Palmetto Bass, Morone saxatilisx Morone chrysops, Production in Plastic-lined Ponds: Fertilizer or Feed? J. World Aquacult. Soc. 2015, 46, 490–504. [Google Scholar] [CrossRef]
  50. Song, H.; Zhu, Q.; Blanchet, J.P.; Chen, Z.; Zhang, K.; Li, T.; Zhou, F.; Peng, C. Central role of nitrogen fertilizer relative to water management in determining direct nitrous oxide emissions from global rice-based ecosystems. Global Biogeochem. Cycles 2023, 37, e2023GB007744. [Google Scholar] [CrossRef]
  51. Xing, G.; Shi, S.; Shen, G.; Du, L.; Xiong, Z. Nitrous oxide emissions from paddy soil in three rice-based cropping systems in China. Nutr. Cycl. Agroecosys. 2002, 64, 135–143. [Google Scholar] [CrossRef]
  52. Li, X.; Yuan, W.; Xu, H.; Cai, Z.; Yagi, K. Effect of timing and duration of midseason aeration on CH4 and N2O emissions from irrigated lowland rice paddies in China. Nutr. Cycl. Agroecosyst. 2021, 91, 293–305. [Google Scholar] [CrossRef]
  53. Hou, H.; Yang, S.; Wang, F.; Li, D.; Xu, J. Controlled irrigation mitigates the annual integrative global warming potential of methane and nitrous oxide from the rice-winter wheat rotation systems in Southeast China. Ecol. Eng. 2016, 86, 239–246. [Google Scholar] [CrossRef]
  54. Liu, S.; Zhang, L.; Jiang, J.; Chen, N.; Yang, X.; Xiong, Z.; Zou, J. Methane and nitrous oxide emissions from rice seedling nurseries under flooding and moist irrigation regimes in Southeast China. Sci. Total Environ. 2012, 426, 166–171. [Google Scholar] [CrossRef] [PubMed]
  55. Yuan, Q.; Pump, J.; Conrad, R. Partitioning of CH4 and CO2 production originating from rice straw, soil and root organic carbon in rice microcosms. PLoS ONE 2012, 7, e49073. [Google Scholar] [CrossRef]
  56. Iqbal, M.F.; Liu, S.; Zhu, J.; Zhao, L.; Qi, T.; Liang, J.; Luo, J.; Xiao, X.; Fan, X. Limited aerenchyma reduces oxygen diffusion and methane emission in paddy. J. Environ. Manag. 2021, 279, 111583. [Google Scholar] [CrossRef]
  57. Bhattacharyya, P.; Dash, P.K.; Swain, C.K.; Padhy, S.R.; Roy, K.S.; Neogi, S.; Berliner, J.; Adak, T.; Pokhare, S.S.; Baig, M.J.; et al. Mechanism of plant mediated methane emission in tropical lowland rice. Sci. Total Environ. 2019, 651, 84–92. [Google Scholar] [CrossRef]
  58. Zhao, Z.; Cao, L.; Deng, J.; Sha, Z.; Chu, C.; Zhou, D.; Wu, S.; Lv, W. Modeling CH4 and N2O emission patterns and mitigation potential from paddy fields in Shanghai, China with the DNDC model. Agr. Syst. 2020, 178, 102743. [Google Scholar] [CrossRef]
  59. Rajendran, S.; Park, H.; Kim, J.; Park, S.; Shin, D.; Lee, J.H.; Song, Y.H.; Paek, N.C.; Kim, C.M. Methane emission from rice fields: Necessity for molecular approach for mitigation. Rice Sci. 2024, 31, 159–178. [Google Scholar] [CrossRef]
  60. Arth, I.; Frenzel, P.; Conrad, R. Denitrification coupled to nitrification in the rhizosphere of rice. Soil Boil. Biochem. 1998, 30, 509–515. [Google Scholar] [CrossRef]
  61. Ding, W.; He, P.; Zhang, J.; Liu, Y.; Xu, X.; Ullah, S.; Cui, Z.; Zhou, W. Optimizing rates and sources of nutrient input to mitigate nitrogen, phosphorus, and carbon losses from rice paddies. J. Clean. Prod. 2020, 256, 120603. [Google Scholar] [CrossRef]
  62. Dong, L.; Yang, T.; Ma, L.; Sun, F.; Yu, F.; Li, Z. Evaluation and benefit analysis of rice-crab cultivation modes in coastal rice areas of Liaoning. China Rice 2023, 29, 100–104. (In Chinese) [Google Scholar] [CrossRef]
  63. Wu, B.; Huang, L.; Wu, C.; Chen, J.; Chen, X.; He, J. Comparative Analysis of the Growth, Physiological Responses, and Gene Expression of Chinese Soft-Shelled Turtles Cultured in Different Modes. Animals 2024, 14, 962. [Google Scholar] [CrossRef]
  64. Shi, S.; Ma, Y.; Zhao, D.; Li, L.; Cao, C.; Jiang, Y. The differences in metabolites, starch structure, and physicochemical properties of rice were related to the decrease in taste quality under high nitrogen fertilizer application. Int. J. Biol. Macromol. 2023, 253, 126546. [Google Scholar] [CrossRef] [PubMed]
  65. Zheng, H.; Ying, C. Effect of the rice-azolla imbircata cropping on phosphorus absorption and phosphorus fertilizer use efficiency in Rice. Fujian Agr. Sci. Technol. 2024, 55, 55–59. (In Chinese) [Google Scholar]
  66. Zhang, Y.; Chen, L.; Wang, M.; Lu, J.; Zhang, H.; Heroux, P.; Wang, G.; Tang, L.; Liu, Y. Evaluating micro-nano bubbles coupled with rice-crayfish co-culture systems: A field study promoting sustainable rice production intensification. Sci. Total Environ. 2024, 933, 173162. [Google Scholar] [CrossRef] [PubMed]
Figure 1. Schematic plan of the experimental location.
Agronomy 14 02219 g001
Figure 2. The daily temperature and precipitation of rice growing season in 2020 and 2021.
Agronomy 14 02219 g002
Figure 3. Rice and crab production of different treatments. (a) Rice yields, (b) crab yields, and (c) average weights of crabs. The values mentioned are indicated as mean ± S.D. Diverse lowercase letters within each column stand for differences of statistical significance (p < 0.05). Y: year; S: farming system; N: nitrogen application rate. RCi and RMi indicate rice–crab co-culture and rice monoculture with nitrogen application rates of i kg ha−1, respectively. ** p < 0.01, ns: p > 0.05.
Agronomy 14 02219 g003
Figure 4. Pearson correlation indicating the relationship between crab yield, average weight of crabs, and surface water parameters. CY: crab yield; AW: average weight of crabs; D: surface water depth; T: surface water temperature; DO: surface water dissolved oxygen concentration; pH: surface water pH; NH4+-N and NO3-N: surface water ammonium nitrogen and nitrate nitrogen concentrations. * p < 0.05, ** p < 0.01.
Agronomy 14 02219 g004
Figure 5. Average concentrations of (a) DO, (b) NH4+-N, and (c) NO3-N during rice growing season. Diverse lowercase letters within each column stand for differences of statistical significance (p < 0.05). ** p < 0.01, ns: p > 0.05.
Agronomy 14 02219 g005
Figure 6. Greenhouse gas emission flux under different treatments. (a) CH4 emission flux; (b) N2O emission flux.
Agronomy 14 02219 g006
Figure 7. Economic performance of different treatments. (a) Net economic benefit; (b) net ecosystem economic benefit. Diverse lowercase letters within each column stand for differences of statistical significance (p < 0.05). * p < 0.05, ** p < 0.01, ns: p > 0.05.
Agronomy 14 02219 g007
Table 1. Agronomic traits of different treatments.
YSN
(kg ha−1)
Number of Productive
Tillers (plant−1)
Filled Grains
(spike−1)
Seed Setting
(%)
1000-Grain Weight (g)Harvest Index
(%)
2020RC09.3 ± 0.3 e93.3 ± 2.9 ab93.3 ± 0.7 a28.0 ± 0.2 a45.9 ± 1.1 a
15012.9 ± 0.3 bc97.0 ± 6.5 ab93.3 ± 1.5 a28.4 ± 0.3 a43.9 ± 0.4 ab
21014.2 ± 0.2 ab91.0 ± 1.3 ab93.0 ± 1.0 a28.4 ± 0.2 a44.3 ± 2.7 ab
27014.5 ± 0.4 a87.8 ± 5.3 b94.3 ± 0.9 a28.4 ± 0.2 a41.5 ± 1.1 bc
RM07.7 ± 0.3 f106.0 ± 9.5 a92.7 ± 2.3 a27.8 ± 0.6 a39.8 ± 2.4 c
15010.9 ± 0.2 d100.0 ± 5.3 ab94.7 ± 0.9 a28.3 ± 0.1 a44.2 ± 0.9 ab
21012.1 ± 1.5 cd94.8 ± 3.6 ab93.0 ± 1.2 a28.3 ± 0.4 a41.4 ± 1.3 bc
27012.9 ± 0.4 bc88.1 ± 5.3 b94.7 ± 0.9 a27.7 ± 0.5 a39.1 ± 0.9 c
2021RC08.8 ± 0.2 c113.1 ± 1.7 a91.8 ± 0.1 a26.6 ± 0.6 a47.9 ± 0.8 a
15012.7 ± 0.2 b109.5 ± 9.0 a88.6 ± 0.8 b26.4 ± 0.2 a45.9 ± 0.9 b
21014.6 ± 0.4 a110.9 ± 7.3 a88.7 ± 0.9 b26.5 ± 0.7 a49.4 ± 0.6 a
27015.6 ± 0.8 a110.7 ± 4.3 a88.7 ± 0.6 b26.2 ± 1.0 a44.8 ± 0.8 bc
RM09.4 ± 0.3 c109.5 ± 6.2 a87.2 ± 0.4 c26.6 ± 0.6 a44.8 ± 0.9 bc
15012.8 ± 0.4 b108.5 ± 0.1 a85.8 ± 0.2 d26.4 ± 0.7 a43.3 ± 0.6 cd
21014.5 ± 0.6 a109.3 ± 1.6 a85.8 ± 0.3 d26.3 ± 0.9 a45.0 ± 0.7 bc
27015.3 ± 0.4 a107.6 ± 6.2 a85.0 ± 0.6 d26.2 ± 0.1 a42.5 ± 0.6 d
F valueY23.2 **31.0 **222.7 **24.3 **75.4 **
S12.1 **0.217.6 **0.170.6 **
N106.9 **1.11.30.114.6 **
Y × S14.9 **1.724.6 **0.10.3
Y × N1.10.85.8 **0.15.7 **
S × N0.20.20.90.04.4 *
Y × S × N0.10.30.10.03.4 *
Y: year; S: farming system; N: nitrogen application rate; RC: rice–crab co-culture; RM: rice monoculture. The values mentioned in the herein are indicated as mean ± S.D. Diverse lowercase letters within each column stand for differences of statistical significance (p < 0.05). * p < 0.05, ** p < 0.01.
Table 2. N use efficiency indicators of rice in different treatments.
YSN
(kg ha−1)
GNU
(kg ha−1)
NRE
(%)
NPFP
(kg)
2020RC044.7 ± 2.3 b--
15062.7 ± 1.5 a25.8 ± 1.4 a44.7 ± 1.0 a
21065.4 ± 4.1 a23.3 ± 1.1 a34.2 ± 2.1 b
27067.2 ± 3.4 a22.6 ± 1.4 a27.7 ± 1.4 c
RM040.2 ± 4.6 b--
15060.0 ± 2.6 a24.0 ± 2.1 a42.8 ± 1.9 a
21063.1 ± 3.7 a22.2 ± 1.9 a31.8 ± 1.9 b
27066.6 ± 2.8 a22.2 ± 1.2 a26.4 ± 1.1 c
2021RC042.6 ± 0.5 d--
15065.0 ± 2.6 c31.0 ± 0.6 a45.5 ± 2.3 a
21079.2 ± 2.6 ab28.9 ± 1.0 b38.2 ± 1.5 b
27083.4 ± 3.8 a28.2 ± 1.1 b31.1 ± 1.2 c
RM043.7 ± 1.8 d--
15061.6 ± 3.5 c27.1 ± 1.1 b44.5 ± 1.2 a
21073.6 ± 3.0 b24.1 ± 0.6 c36.4 ± 1.5 b
27077.1 ± 3.4 b24.2 ± 0.5 c29.7 ± 1.3 c
F valueY42.4 **58.2 **21.6 **
S8.0 **27.1 **6.5 *
N163.4 **11.0 **197.4 **
Y × S0.29.6 **0.1
Y × N9.5 **0.11.8
S × N0.20.20.1
Y × S × N1.20.30.0
GNU: grain nitrogen uptake; NRE: nitrogen recovery efficiency; NPFP: nitrogen partial factor productivity. Diverse lowercase letters within each column stand for differences of statistical significance (p < 0.05). * p < 0.05, ** p < 0.01.
Table 3. Seasonal cumulative CH4 and N2O emissions, GWP, and GHGI of different treatments.
YSN
(kg ha−1)
CH4 Emissions
(kg ha−1)
N2O Emissions
(kg ha−1)
GWP
(kg CO2-eq ha−1)
GHGI
(kg CO2-eq kg−1)
2020RC0181.1 ± 16.0 c0.09 ± 0.02 c5098 ± 453 c1.10 ± 0.04 d
150263.0 ± 31.0 b0.48 ± 0.07 b7495 ± 854 b1.12 ± 0.10 cd
210292.0 ± 3.5 ab0.65 ± 0.06 a8353 ± 93 ab1.17 ± 0.08 bcd
270330.6 ± 31.1 a0.72 ± 0.02 a9449 ± 875 a1.26 ± 0.06 abcd
RM0199.8 ± 30.4 c0.09 ± 0.04 c5621 ± 847 c1.31 ± 0.13 abc
150274.3 ± 29.4 b0.49 ± 0.08 b7814 ± 823 b1.22 ± 0.08 abcd
210313.0 ± 15.4 ab0.64 ± 0.06 a8934 ± 438 ab1.34 ± 0.03 ab
270340.6 ± 23.0 a0.69 ± 0.10 a9724 ± 620 a1.37 ± 0.10 a
2021RC0117.8 ± 1.7 d0.36 ± 0.04 c3397 ± 60 d0.69 ± 0.02 b
150207.5 ± 21.1 c0.75 ± 0.07 b6011 ± 579 c0.89 ± 0.12 a
210248.1 ± 12.7 ab0.75 ± 0.06 b7148 ± 377 ab0.89 ± 0.04 a
270265.2 ± 7.5 a0.95 ± 0.08 a7678 ± 194 a0.91 ± 0.04 a
RM0109.3 ± 21.4 d0.33 ± 0.05 c3152 ± 616 d0.62 ± 0.12 b
150228.8 ± 14.2 bc0.69 ± 0.08 b6594 ± 420 bc0.99 ± 0.09 a
210267.5 ± 26.6 a0.82 ± 0.03 ab7711 ± 738 a1.01 ± 0.13 a
270282.5 ± 7.1 a0.93 ± 0.12 a8159 ± 230 a1.02 ± 0.06 a
F valueY63.7 **70.9 **59.9 **135.6 **
S3.50.13.511.9 **
N83.6 **106.6 **90.4 **9.1 **
Y × S0.00.00.01.7
Y × N0.90.90.95.1 **
S × N0.10.10.20.3
Y × S × N0.30.40.31.1
CH4: methane; N2O: nitrous oxide; GWP: global warming potential; GHGI: GHG intensity. Diverse lowercase letters within each column stand for differences of statistical significance (p < 0.05). ** p < 0.01.
Disclaimer/Publisher’s Note: The statements, opinions and data contained in all publications are solely those of the individual author(s) and contributor(s) and not of MDPI and/or the editor(s). MDPI and/or the editor(s) disclaim responsibility for any injury to people or property resulting from any ideas, methods, instructions or products referred to in the content.

