Article

Leveraging Digital Technologies for Carbon Footprint Tracking in Perennial Cultivations: A Case Study of Walnut Orchard Establishment in Central Greece

by
Maria Lampridi
1,2,3,
Dimitrios Kateris
1,*,
Charalampos Myresiotis
1,
Remigio Berruto
4,
Vassilios Fragos
2,
Thomas Kotsopoulos
2 and
Dionysis Bochtis
1,3
1
Institute for Bio-Economy and Agri-Technology (IBO), Centre for Research and Technology-Hellas (CERTH), 6th km Charilaou-Thermi Rd., 57001 Thessaloniki, Greece
2
Faculty of Agriculture, Forestry and Natural Environment, School of Agriculture, Aristotle University of Thessaloniki, 54124 Thessaloniki, Greece
3
farmB Digital Agriculture S.A., Dekatis Evdomis Noemvriou 79, 55534 Pylaia-Thssaloniki, Greece
4
Interuniversity Department of Regional and Urban Studies and Planning, Viale Matttioli 39, 10125 Torino, Italy
*
Author to whom correspondence should be addressed.
Agronomy 2024, 14(10), 2241; https://doi.org/10.3390/agronomy14102241
Submission received: 22 August 2024 / Revised: 20 September 2024 / Accepted: 25 September 2024 / Published: 28 September 2024

Abstract

:
The present paper aims to quantify the carbon emissions associated with the establishment of 15 walnut orchards (“Juglans californica”) in the greater area of Magnisia, Greece, with the use of a carbon footprint tool interconnected to a Farm Management Information System. The data collection spanned the first five years following the planting of the trees, providing a comprehensive view of the emissions during this critical establishment phase. Over the five-year period examined (February 2019–December 2023), the results revealed net carbon emissions amounting to 13.71 tn CO2 eq ha−1, with the calculated emissions showing an increasing trend from the first year through the fifth year. Scope 1 (7.38 tn CO2 eq ha−1) and Scope 2 (3.71 tn CO2 eq ha−1) emissions emerged as the most significant, while irrigation (drip irrigation) and fertilizing practices were identified as the highest contributors to emissions. This study highlights the significance of using integrated digital tools for monitoring the performance of cultivations rather than standalone tools that are currently widely available. Integrated tools that incorporate various applications simplify data collection, encourage accurate record-keeping, and facilitate certification processes. By automating data entry and calculations, these tools reduce human error during agricultural carbon management and save time; thus, the integration of digital monitoring tools is vital in improving data accuracy, streamlining certification processes, and promoting eco-friendly practices, crucial for the evolving carbon market.

1. Introduction

In the contemporary landscape of agriculture, discussions surrounding carbon footprints have intensified and are more relevant than ever. The pressing need for environmental sustainability and the safeguarding of soil organic carbon (SOC), coupled with the call for standardization, input reduction, and the emergence of carbon markets [1], has thrust the agricultural sector into the spotlight of scrutiny. As the urgency to address these challenges escalates, the integration of digital technologies into agriculture emerges as a pivotal avenue for transformative measures [2,3]. The advent of precision farming technologies and monitoring platforms, such as Farm Management Information Systems (FMISs), holds the promise of not only revolutionizing cultivation practices but also providing robust tools for assessing and mitigating the carbon footprint, as well as the carbon sequestration potential, associated with agricultural activities [4].
Several digital tools, available in various forms such as web platforms and spreadsheet-based systems, have been developed for estimating GHG emissions from agricultural practices. The Cool Farm Tool (CFT) [5], for instance, is designed for farm-level assessments, allowing users to estimate both GHG emissions and carbon sequestration from different agricultural practices. Another tool, the EX-Ante Carbon-balance Tool (EX-ACT) [6], developed by the Food and Agriculture Organization (FAO), focuses on assessing the carbon balance of agricultural projects, facilitating the estimation of GHG emissions and their mitigation potential over time. Similarly, the Carbon Benefits Tool [7] provides a platform for assessing the carbon benefits of land use and agricultural practices, offering insights into GHG emissions and carbon sequestration potential across various management scenarios. However, these tools generally function as standalone systems, requiring separate assessments for emissions estimation, and are not integrated into holistic platforms for comprehensive environmental analysis.
Digital technologies, encompassing precision farming tools and FMIS platforms coupled with interconnected carbon footprint calculators, offer a unique opportunity to monitor cultivations holistically [8]. These integrated systems enable the collection and analysis of vast numbers of data, allowing for the identification of weaknesses in agricultural production processes. Simultaneously the environmental assessment of agricultural production, through its quantification with the use of the relevant indicators such as carbon footprint (CF), has become an integral component [9], and the inclusion of a CF calculation tool within such a platform is a significant advancement, increasing its efficiency and its usability as a decision-making tool.
Carbon footprint calculators that are interconnected to FMIS platforms can serve a multitude of purposes that are crucial in the contemporary agricultural landscape [9]. Firstly, they facilitate the tracking of performance in reducing greenhouse gas (GHG) emissions, providing a valuable metric for assessing environmental impact [10]. Secondly, these tools assist in the creation of efficient and standardized procedures for communicating CF information to stakeholders, ensuring transparency and accountability [11]. Moreover, they contribute to a deeper understanding of Carbon Footprints of Products (CFPs), enabling the identification of opportunities for GHG reductions. The benefits of utilizing carbon footprint calculators extend beyond individual farms. The correct and consistent communication of CFPs supports the comparability of products in a free and open market, fostering healthy competition among agricultural products. Additionally, these tools aid in the evaluation of alternative product design and sourcing options, production and manufacturing methods, raw material choices, and end-of-life processes. This comprehensive approach facilitates the development and implementation of GHG management strategies across product life cycles and uncovers efficiencies within the supply chain.
The global carbon market has been focusing lately not only on the mitigation of activity emissions but also on the standardization of the procedures and methods that increase carbon sequestration. With effective management, agricultural lands could potentially sequester up to 66% of historically lost carbon [12]. Planting trees is a proven strategy for enhancing soil organic carbon (SOC) [13]. Additionally, establishing perennial crops can also boost SOC levels and can be implemented without reducing the productive land area. Considering the above, the move from annual to perennial cultivation is gaining ground among the methods used to increase SOC, while the creation of perennial varieties of key grain crops could broaden the available agricultural choices towards ensuring food and ecosystem security [14]. FAO has recommended the “perennialization” of agricultural lands as a strategy to combat climate change, improve food security, and enhance ecosystem services [14]. The establishment of high-value perennial cultivation, such as walnut orchards, serves to mitigate climate change impacts while also improving farmer income compared to other annual cultivations [15]. However, the sequestration potential of the establishment of perennial crops is also linked to the quantification of emissions caused by the cultivation process itself; thus, the accurate estimation of the emissions related to the cultivation process is important [16]. Perennial crops, such as orchards, differ from annual crops (like arable and horticultural systems) in their long-term management and ecological dynamics.
In this context, this study employs an innovative Farm Management Information System (FMIS) interconnected to a dedicated calculation methodology based on the Greenhouse Gas Protocol and the IPCC Guidelines for the quantification of emissions related to walnut production. These emissions encompass the carbon footprint of activities such as land preparation, planting, and initial maintenance, which contribute significantly to the overall emissions during the early years of orchard life. By examining a production system of 15 walnut orchards with varying field sizes and planting densities, we aim to shed light on the specific stages of cultivation, where emissions are most significant, highlighting the fact that the emissions preceding the first yield of product are considerable and should be amortized to the following years of the orchard’s life.
As we delve into the intricacies of this case study, we will explore how the integration of digital technologies and advanced calculation methodologies can illuminate the environmental footprint of agricultural activities. These findings will underscore the critical role of FMIS in providing accurate, real-time data that support informed decision-making, promote sustainable practices, and foster a resilient agricultural future. This approach not only facilitates compliance with environmental standards but also enhances the capacity of growers to optimize their operations for reduced emissions, ultimately contributing to the broader goals of climate change mitigation and sustainable agriculture. Overall, the present study aims to underscore the significance of digital tools in tracking emissions in perennial cultivations. The selected case study focusing on a walnut cultivation system during the initial five years post-establishment is presented to highlight the considerable emissions associated with pre-production processes.

2. Materials and Methods

2.1. Emission Estimation

In the present study, the approach followed utilizes the GHG calculation methodology developed following the guidelines of the GHG Protocol Agricultural Guidance [17] for the calculation of the GHG emissions related to the execution of agricultural tasks. According to the GHG Protocol Agricultural Guidance, operational limits determine whether the emissions are direct (i.e., emissions for which the crop is solely responsible) or whether they are indirect (i.e., it is owned or controlled by another company/supplier, but some of its emissions are a consequence of activities taking place in cultivation). Emission sources are further classified by scope [17]:
  • Scope 1: All direct sources;
  • Scope 2: Consumption of purchased heat, steam, and electricity (indirect source);
  • Scope 3: All other indirect sources;
  • Biogenic carbon: Sources related to land use and soil management.
Scope 1 and biogenic carbon emission sources are further classified as mechanical and non-mechanical depending on the use of mechanical equipment or the agricultural method applied, the field characteristics, the application of materials, and the environmental conditions (Table 1). In the present study, emissions from all three scopes are considered, as presented in detail in Table 1. Direct emissions (Scope 1) include emissions attributable to fuel, land use changes, and the use of fertilizers. Fuel emissions (N2O, CH4, and CO2) are related to their combustion and production, while their consumption is calculated based on ASABE standards [18], as presented in detail in [19]. Fuel emissions include emissions from the operation of the agricultural machinery in the field and also from the farm–field transportation of the equipment. Scope 1 non-mechanical and biogenic carbon emissions are calculated using Tier 1 methods according to IPCC [20]. More specifically, direct and indirect N2O emissions from the use of synthetic fertilizers are calculated. Also, CH4 and N2O emissions related to the assessment of residues are calculated when pruning operations occur.
Emissions from land use change (LUC) are classified as Scope 1 emissions only when they lead to a reduction in carbon stocks. When LUC leads to carbon stock gains, these are considered biogenic carbon and are subtracted from the total emissions, as is the case in the present paper. Emissions related to biogenic carbon include CO2 emissions due to changes in soil carbon from management and land use change, as well as N2O emissions from the mineralization of soil organic carbon, which are calculated according to IPCC guidelines [20]. These emissions are then converted to CO2 equivalents using the relevant conversion factors [21].
Nitrogen is mineralized in mineral soils when soil carbon is lost due to land use or management changes. The inverse relationship—where emissions are reduced when soil organic carbon (SOC) is gained—does not apply. Increased soil organic matter might actually raise emissions because the higher standing stock results in a proportion of it mineralizing. Therefore, the emissions from increased SOC are considered to be zero, as any potential reduction in emissions from increased SOC is too uncertain and context-specific to include [22]. With the above said, the mineralization of SOC is considered only in the case that SOC is decreasing. When it is gained, it is considered as 0. At this point, it should also be noted that changes to the biomass carbon stocks due to the temporary carbon storage of the growing trees were not considered in the present paper, as the five-year time frame of operations that is examined is small and the data with respect to the accumulated biomass of the growing trees were not sufficient for its accurate estimation.
Indirect emissions (Scope 2) for energy consumption concern the consumption of purchased energy, which, mostly in open agricultural systems, mainly concerns the purchase of energy for the operation of the irrigation system. They are calculated based on the equation presented in [23]. For the assessment of Scope 3 emissions, the emission factor approach is utilized for their quantification as a function of the task applied [17].
Table 1. Emission sources and scope.
Emission SourceScopeMechanical/Non-mechanicalEmission Factor Source
FuelScope 1Mechanical[24]
Fertilizer use (direct and indirect)Scope 1Non-mechanical[20]
Crop residue managementScope 1Non-mechanical[20]
Land use changeScope 1Non-mechanical[20]
Irrigation energyScope 2-[24]
Lubricant productionScope 3-[25]
Tractor manufacturingScope 3-[26]
Implement manufacturingScope 3-[25]
Tractor maintenanceScope 3-[26]
Implement maintenanceScope 3-[26]
Tractor housingScope 3-[27]
Implement housingScope 3-[27]
Fertilizer productionScope 3-[25]
Plant protection substance productionScope 3-[25]
Seed productionScope 3-[25]
Seedling productionScope 3-[25]
Irrigation system constructionScope 3-[28]
Soil management and land use changeBiogenic carbonNon-mechanical[20]
Soil organic carbon mineralizationBiogenic carbonNon-mechanical[20]
Indirect emissions (Scope 3) (N2O, CH4, and CO2) are distinguished from the emissions related to the construction of the machinery used during the execution of agricultural tasks, as well as their repair or maintenance, and the emissions related to the production of the materials used during the production process. Indirect emissions also include the emissions related to housing the equipment and are usually reduced to the square footage used per year. The embodied emissions of machinery are the emissions released to manufacture agricultural equipment and are estimated per kilogram of machinery [26,29]. Emissions for repairs and maintenance can be expressed as a percentage of emissions for construction [30,31], or they can be estimated in absolute numbers as attempted in the case of energy expended, as reported by Mantoam et al. [32].
Embodied emissions for housing represent the emission contributions of all the buildings and infrastructure required to house the equipment [30]. It should be noted that the above parameters are usually calculated for the entire lifetime of machinery or buildings [33]. For the present study, the contribution of emissions from construction, repairs, and maintenance, as well as housing, are reduced to the duration of the work performed in relation to the total lifetime of the equipment. Regarding the embodied emissions from the production of the materials, the materials used in the execution of agricultural operations, in addition to fuels that their emissions are considered as direct, include fertilizers, seeds and plant protection substances, lubricants and materials for the construction of the irrigation system. The contribution of all these materials to the total emissions is assessed based on the total amount used. It is worth noting that, especially for fertilizers and plant protection substances, the percentage of the nutrient or active substance is considered as the total quantity.

2.2. Data Collection

The data collected concerned the agricultural tasks applied in the field. For the collection and assessment of data, the farmB® (https://farm-b.com/ accessed on 20 December 2023) FMIS was utilized, while for the calculation, the tool described in the previous section was used. This tool is interconnected to the farmB FMIS with the use of a dedicated Application Programming Interface (API) in order to collect the data and calculate and return the results. The data for the specific study were collected using the dedicated log application farmB.log included in the farmB® Platform.
Through farmB.log, either using the web or mobile interface, the farmer or the person performing the agricultural task, as soon as the task was completed, filled in a form with the required information (Figure 1). Figure 1 presents examples of the data collection forms for tillage and manual fertilization tasks within the farmB platform. Additional information that was not directly inputted by the user was also acquired through the GIS platforms, such as the area of the field and the farm–field distance (Figure 2). Figure 2 presents an example of the field data presentation (a) and results panel (b) within the farmB platform. The parameters collected through the log mechanism are presented in Table 2. The data collected are processed within a dedicated library interconnected to the farmB information system. The results are returned to the user through the interface.
Through the platform, other types of data are also collected. More specifically, the soil and leaf analysis are inserted, for each orchard, based on which the fertilization needs of the crops are determined. Additionally, for certain diseases (e.g., Alternaria leaf spot in the case of walnuts), disease prediction models are available within the platform, while for insects, notifications are available based on the data collected by electronic insect traps located in the fields.

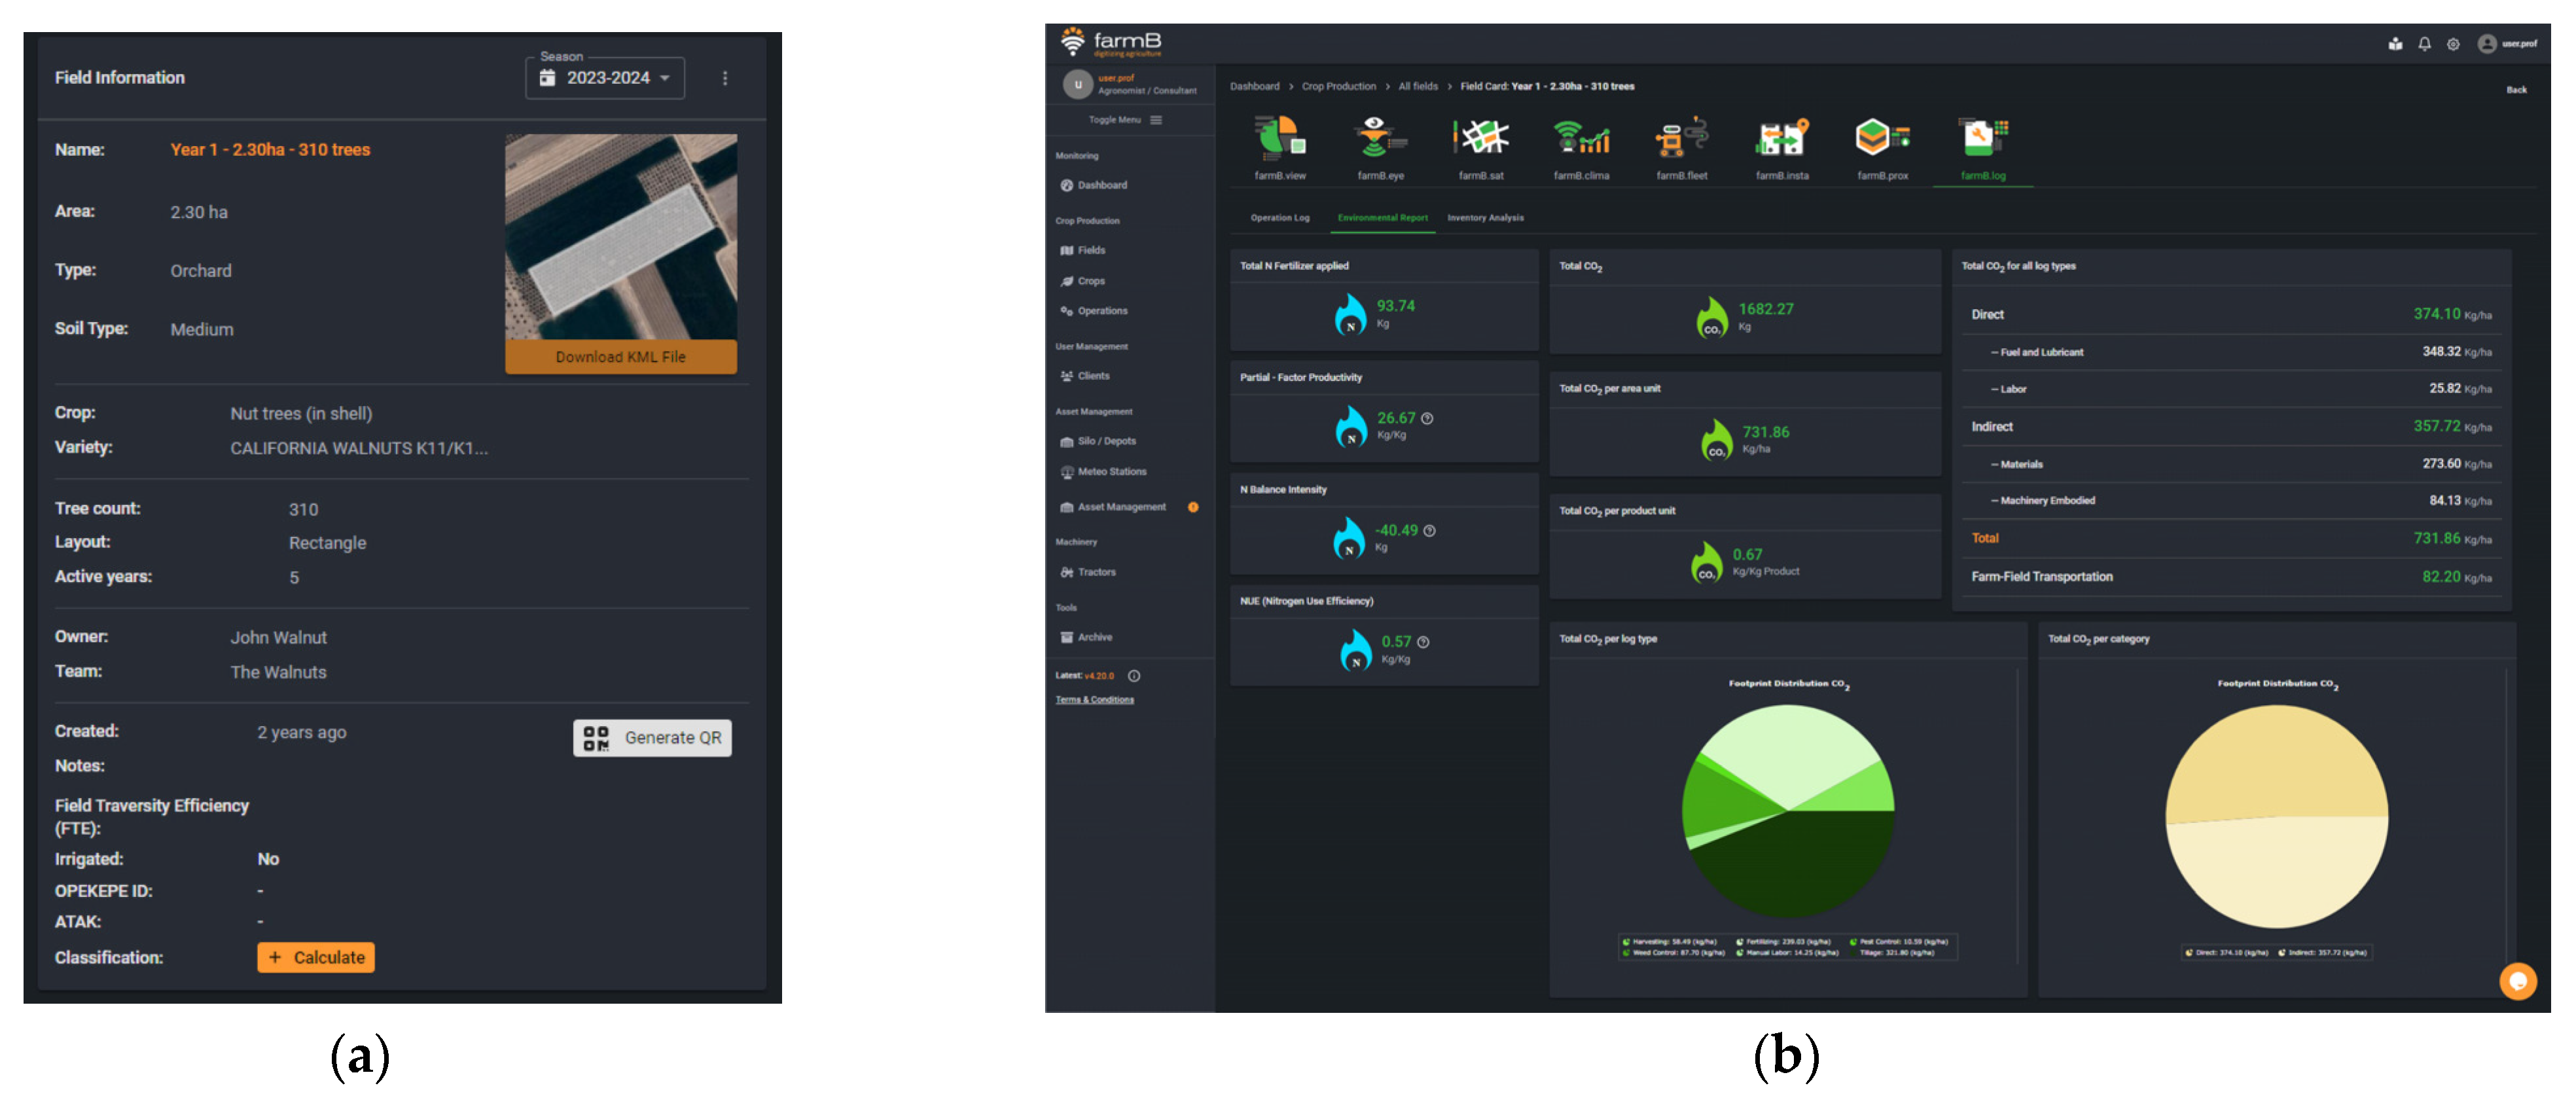
3. Case Study Description

The case study includes the assessment of GHG emissions during the first 5 years (February 2019–December 2023) after the establishment of 15 walnut orchards (Figure 3) with different planting densities, in fields with different sizes (Table 3). The variety of walnut trees planted is California Walnuts (Juglans californica), since it is the most widespread species in Greece due to higher yields and the long productive life of the trees, as well as the light coloring of the crumb, which is accompanied by increased selling prices [34]. Central Greece is also a representative region, since walnut cultivation is indicated in areas with a humid and hot climate and deep soils without severe frost periods during the winter [35]. The fields under examination are located in the greater area of Rizomilos in the prefecture of Magnisia, Greece. The planting density of the fields varied from 140 to 370 trees per hectare [36], considering typical planting distances for walnut cultivation for crop production (9.1 m × 9.1 m to 5.2 m × 5.2 m), with an average planting density of 225 trees per ha. The field size varies from 0.71 ha to 3.53 ha summing up to a total cultivated area of 27.61 ha. The farm where all the mechanical equipment is stored is located in Chloi, Magnisia, Greece; thus, the longest distance traveled for the execution of an agricultural task is 11.1 km, and the shortest is 2 km. Also, according to the farmer, all the fields were cultivated as cropland with arable crops (mostly cotton and wheat) for more than 20 years and have now been converted to orchards.
The most representative agronomic protocol followed for the 15 cultivations is presented in Table 4, which presents the number of operations per type of agricultural task performed within each cultivation period. Soil preparation takes place between the months March-October (usually 1–2 applications per month). The field cultivator is approximately 2.6 m wide, and the operation depth is set at 10 cm. For the disk-harrow, the respective width is 2.4 m and the operation depth is set at 8 cm. Each soil preparation task is usually followed by the manual application of fertilizers, usually between the months of January and August. The fertilizers are applied manually to each tree based on the needs of each field after the soil analysis is performed. Several different products were used throughout the five-year period examined. The variation in yearly total applied nitrogen for the 5 years that are examined is presented in Figure 4a.
The agrochemicals are applied based on the recommendations of the farmB platform with respect to disease prediction; however, there are also additional direct inspections of the orchard to determination the need for further weed and pest protection. Agrochemicals are applied either manually or with the use of dedicated equipment (boom-type sprayer or air carrier sprayer). The tractor used for tillage and spraying operations is 4 WD with an engine power of 115 HP. For the first five years after the establishment of the orchard, no substantial pruning of the trees was performed; thus, this is not included in the operations examined.
All the details with respect to the material applied in the field (type, chemical composition, and quantity) are collected through the log mechanism directly after each application. Irrigation is applied three to four times per month between the months of May and September, with the most demanding months being June, July, and August due to the increased temperatures in Greece. Annual irrigation needs increase with the aging of the orchard, starting from 12.8 m3 per tree per year for the first year and reaching up to 32.9 m3 per tree for the fifth year of monitoring. The variation in yearly total applied water for the 5 years that are examined is presented in Figure 4b. For the irrigation of the model field presented in this case study, a pump is used with a pumping capacity of 55 m3·h−1, a power of 35 HP, and a pumping depth of 90 m, while the in-field distribution of the water drip irrigation in each tree is used.

4. Results

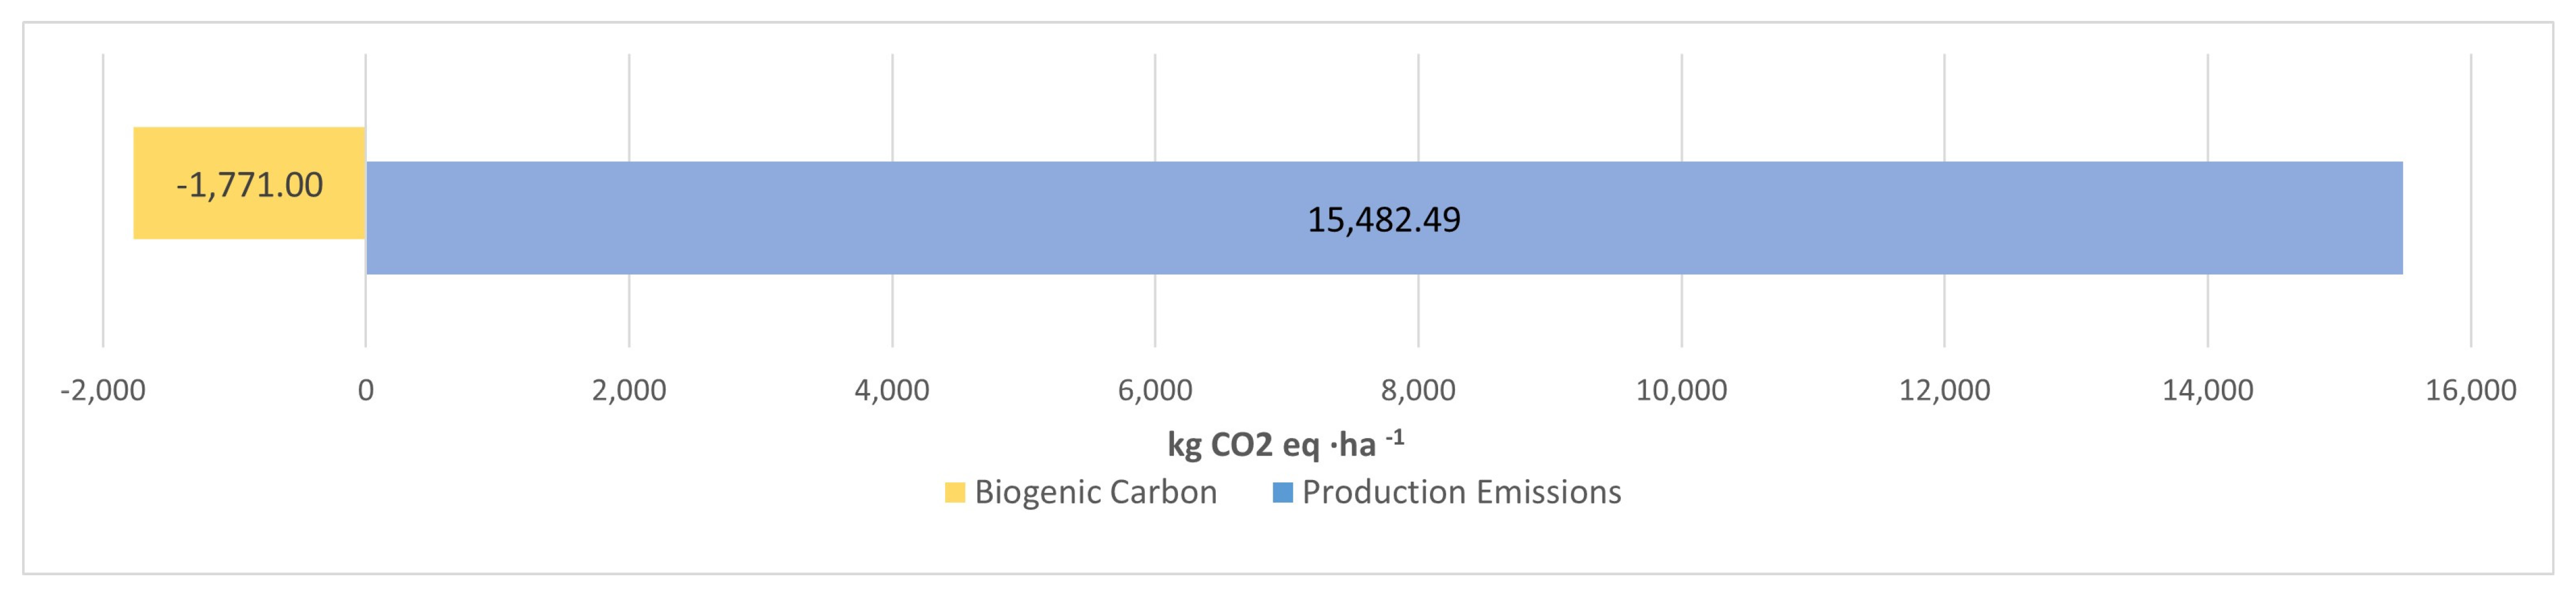
4.1. Total Emissions

This section presents the results of the previously mentioned case study. Figure 5 illustrates the total calculated emissions per hectare over a 5-year cultivation period across 15 fields. Emissions are categorized into emissions attributed to the agricultural operations performed, totaling 15,482.49 kg CO2 eq ha−1, referred to as production emissions, and biogenic carbon emissions, which have a negative value representing carbon sequestration or absorption. Production emissions encompass all scope 1, 2, and 3 emissions, as detailed in the methodology section. Carbon sequestration occurs due to the conversion of cropland to perennial cultivation, helping to mitigate overall carbon emissions by offsetting some of the CO2 produced. Consequently, the net carbon impact of the 5-year cultivation is calculated as Net Carbon Emissions = 15,482.49 kg CO2 eq ha−1−1771.00 kg CO2 eq ha−1 = 13,711.49 kg CO2 eq ha−1.

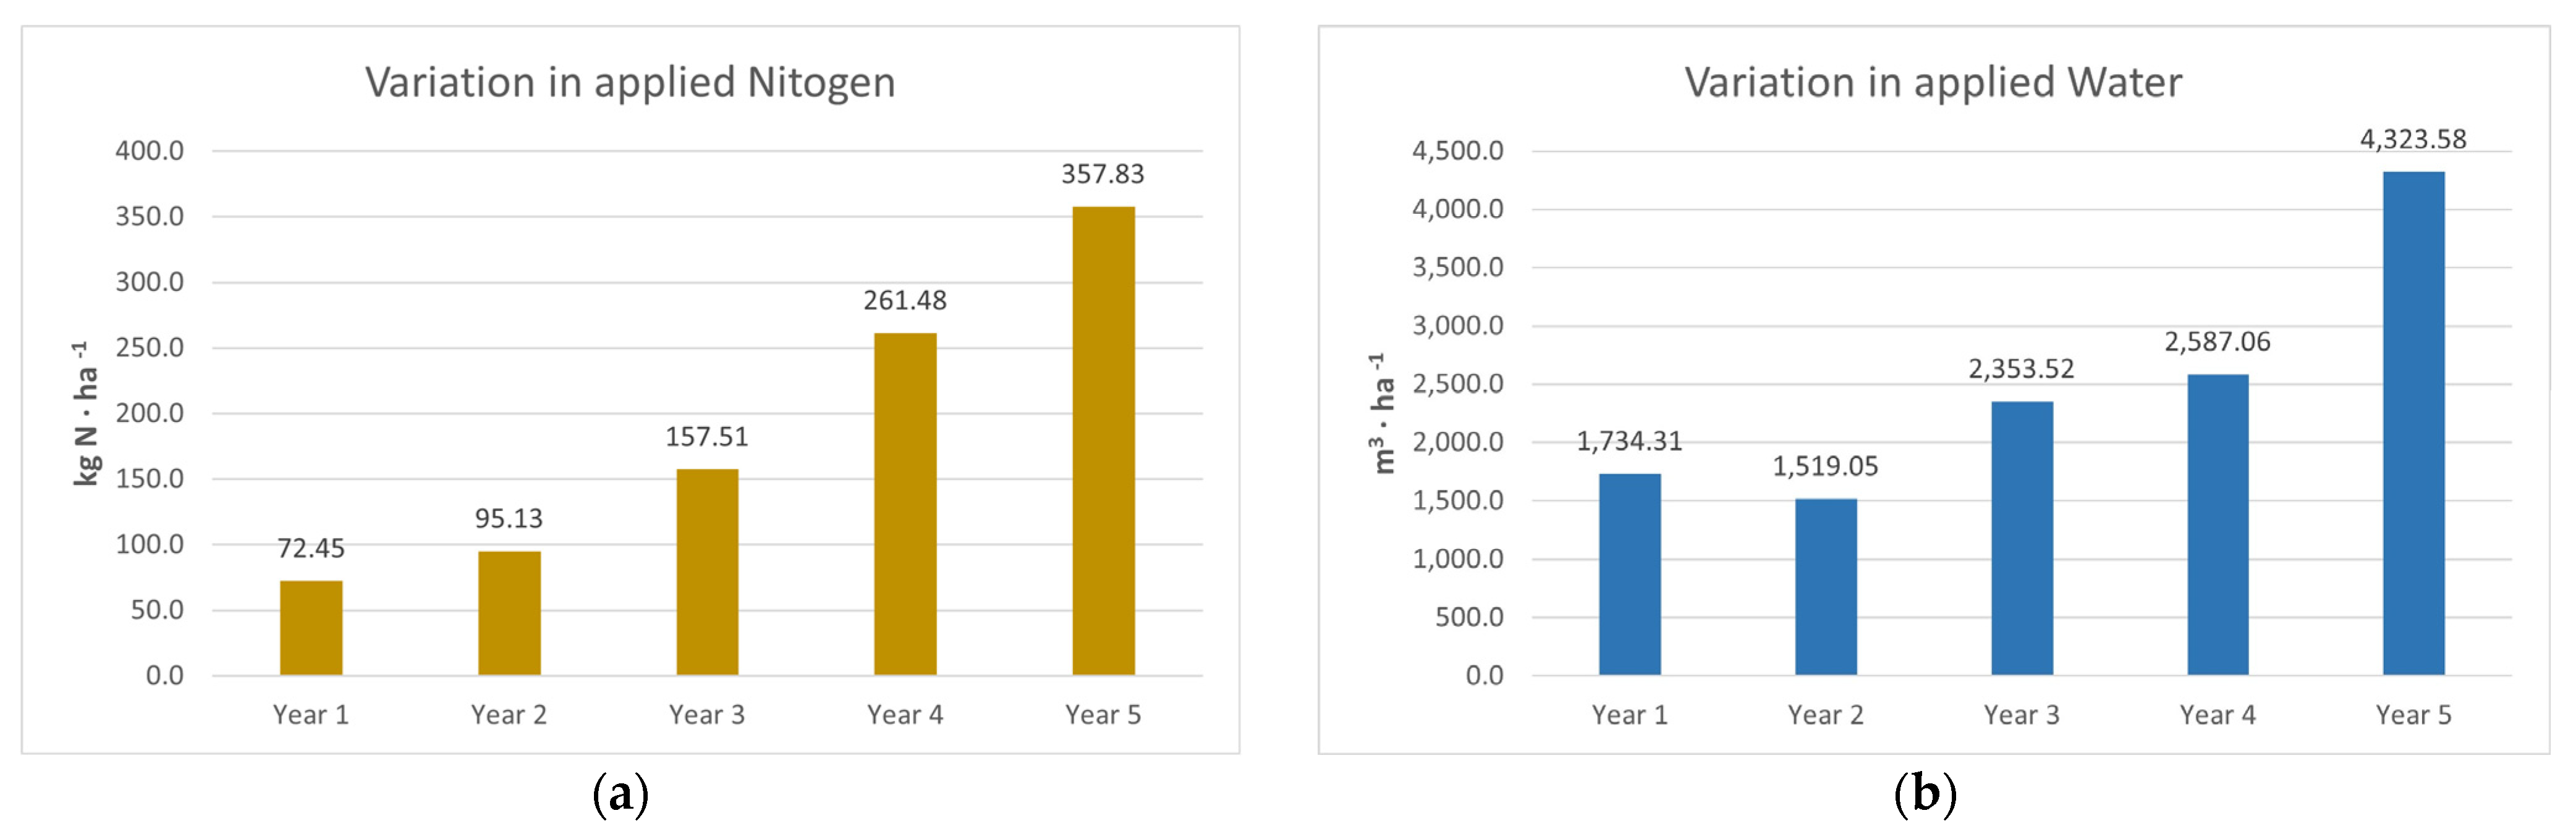
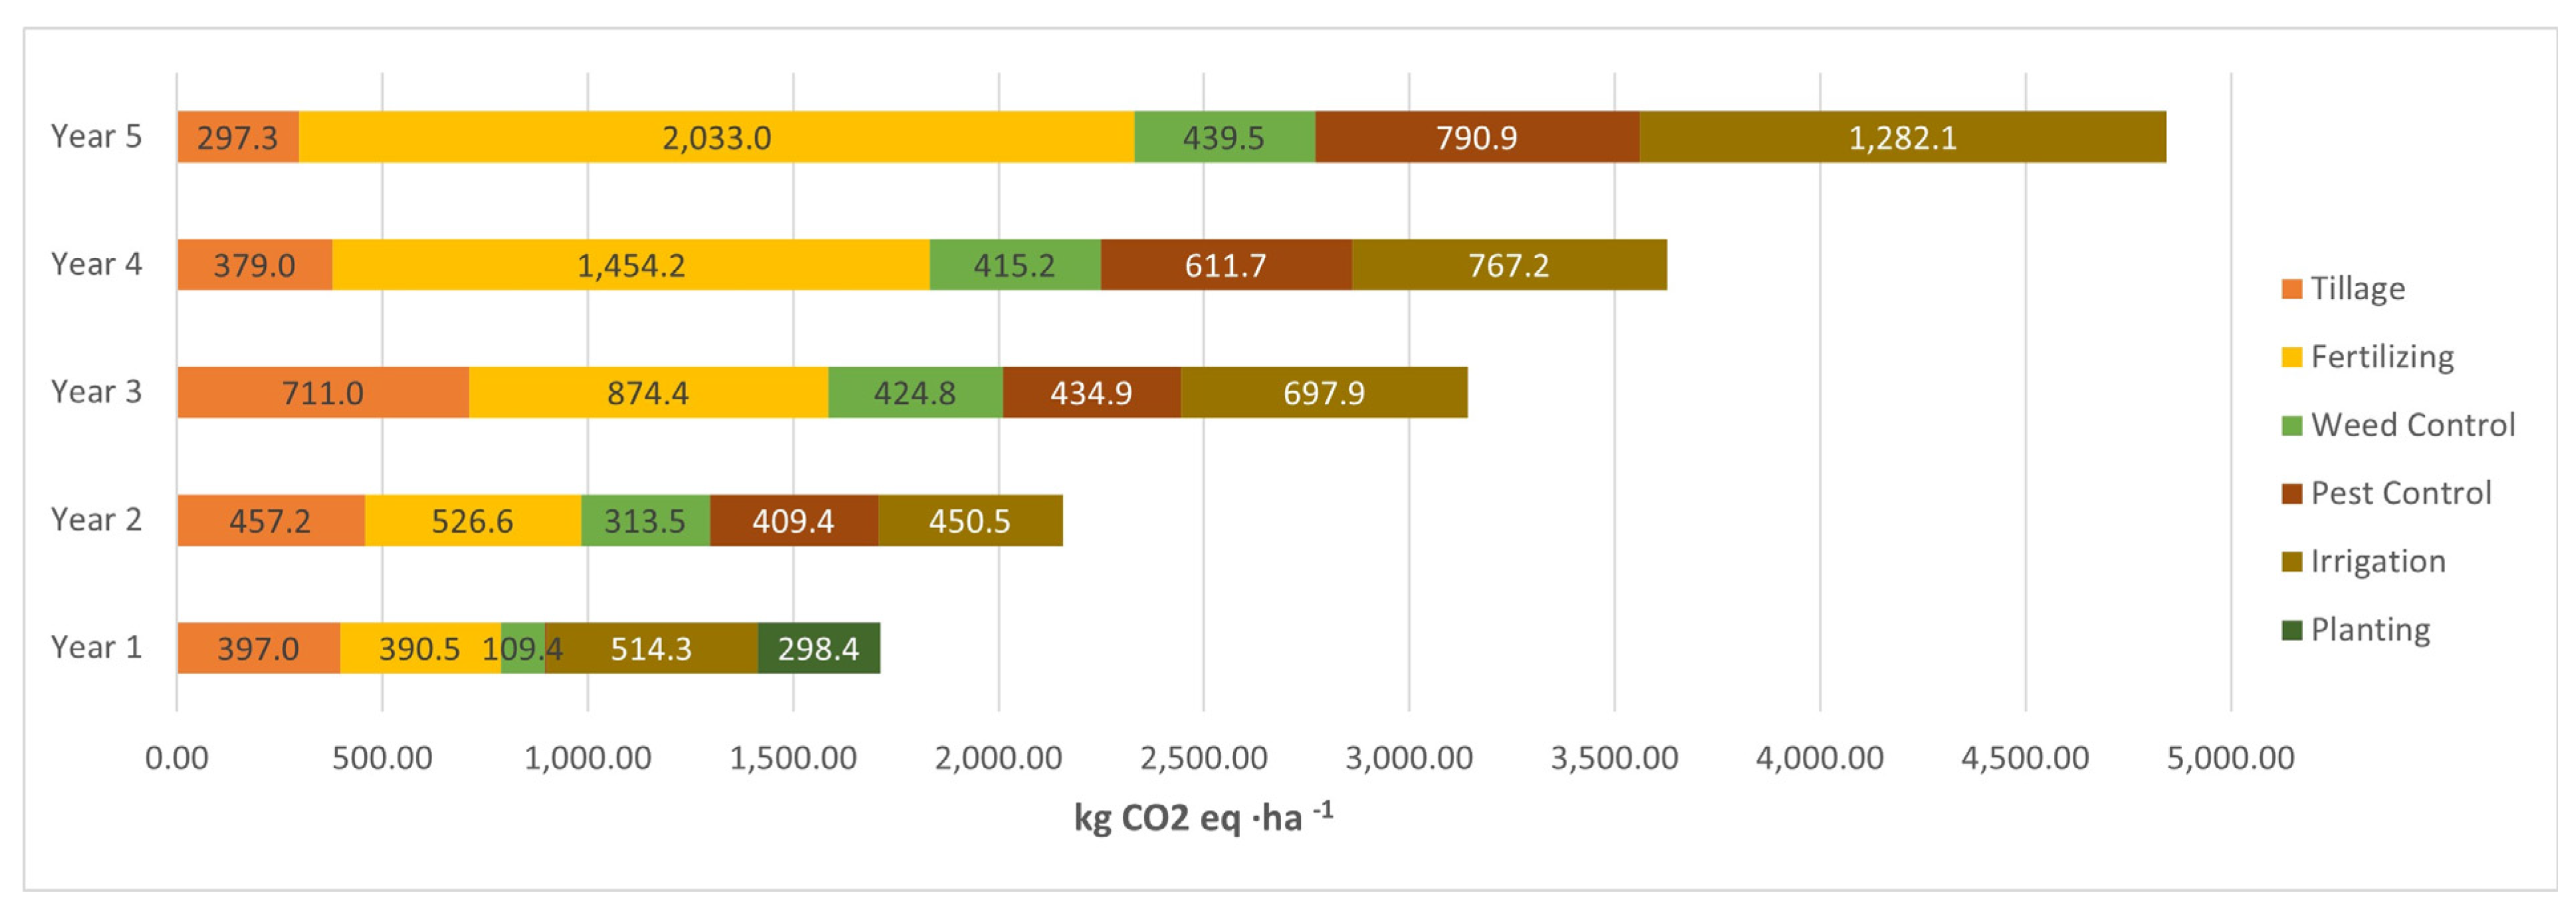
4.2. Emissions Per Year and Agricultural Tasks

Figure 6 illustrates the carbon emissions associated with various agricultural tasks over the 5-year span of the orchard establishment. Each bar represents the total carbon emissions for a particular year, broken down by specific activities such as tillage, fertilizing, weed control, pest control, irrigation, and planting. The yearly evolution of emissions and their distribution by operation reveals significant trends across these agricultural tasks. Overall, emissions increase yearly as the orchard develops from 1712.02 kg CO2 eq ha−1 y−1 for Year 1 to 4842.82 kg CO2 eq ha−1 y−1 in Year 5, reflecting the growing intensity and scale of agricultural activities.
A detailed breakdown of operation emissions show the following trends: tillage emissions increase to a peak of 711 kg CO2 eq ha−1 in Year 3, before declining by Year 5. Fertilizing exhibits a substantial yearly increase to 2033 kg CO2 eq ha−1 in Year 5. Weed control emissions consistently rise to 439.5 kg CO2 eq ha−1 in Year 5, stabilizing after the first year. Pest control emissions, negligible in the first year, increase significantly over the next four years, reaching 790.85 kg CO2 eq ha−1 in Year 5. Irrigation emissions peak dramatically at 1282.10 kg CO2 eq ha−1 in Year 5. Planting emissions are recorded only in Year 1 at 298.38 kg CO2 eq ha−1, as planting occurs only in the first year of cultivation.
These trends indicate significant increases in the contribution of certain activities to total emissions, particularly fertilizing, due to the higher input demands of growing trees. In the first three years of orchard establishment, tillage, fertilization, and irrigation are the most substantial contributors to overall emissions, accounting for 76.04% in Year 1, 66.49% in Year 2, and 72.65% in Year 3 (Figure 7). In the subsequent years leading up to the trees reaching maturity, fertilizing and irrigation remain the most significant contributors, comprising 68.46% of emissions in Year 5 (41.98% for fertilizing and 26.47% for irrigation). This is mainly due to the increasing contribution of fertilizing. While fertilizing emissions rise throughout the five-year monitoring period, the contribution of irrigation remains stable. Weed and pest control show stable contributions over the four years following the orchard′s establishment, while tillage contributions decrease in Years 4 and 5.
With respect to the overall five-year examination period, fertilizing contributes to a total of 34% of the total emissions, followed by irrigation with a total contribution of 24%, as presented in Figure 8. Next come pest control (15%), tillage (14%), and weed control (11%). The task of planting contributes the least to the examined operations (2%).
Figure 9 represents the distribution of greenhouse gas emissions across three scopes: Scope 1, Scope 2, and Scope 3. Scope 1, which accounts for 48% of the emissions, includes direct emissions from owned or controlled sources. Within Scope 1, fuel contributes 33%, while direct and indirect fertilizer use contributes 13% and 2%, respectively. Scope 2, comprising 24% of emissions, represents indirect emissions from the generation of purchased electricity, steam, heating, and cooling consumed by the reporting company, with irrigation energy being the sole contributor in this category. Scope 3 encompasses 28% of the total emissions and includes all other indirect emissions that occur in the value chain of the reporting company, both upstream and downstream. In this scope, fertilizer production is the largest contributor, at 20%. Equipment production, maintenance, and housing add 4%, while agrochemical production and seedling production contribute 3% and 2%, respectively.

4.3. Tool Usability and Lessons Learned

The use of the integrated digital tool for collecting data throughout the cultivation season, though not yet widespread, presents clear benefits in both data accuracy and ease of use. One significant advantage is the registration of machinery and material inputs, such as fertilizers and plant protection substances, which streamlined the data entry process for the farmer. By having a structured system in place for recording these inputs, the farmer found it easier to track and document their agricultural practices, ensuring a more reliable and efficient data collection process. This feature simplifies the farmer’s workload, allowing for more accurate reporting on the inputs that directly affect the carbon footprint of the operation.
Another key finding from the implementation of the tool was the utility of dedicated forms for input collection, which facilitated the timely entry of data immediately after each field operation. The structured approach allowed farmers to capture details of their activities in real time, minimizing the risk of forgotten tasks or misplaced data. Additionally, the use of a calendar-based format for data collection provided farmers with a clear and organized view of their operational history. This organization helped farmers manage their tasks more efficiently and ensured that they had access to a detailed timeline of their field operations, supporting better decision-making and long-term planning.
The cloud storage capabilities offered by the tool further enhanced its usefulness by allowing farmers to upload supporting documents, such as invoices and product labels. This feature not only reduced the need for physical document storage but also provided easy access to records when needed, ensuring that all documentation was securely stored and readily available. Moreover, by providing farmers with a timely overview of their carbon footprint, the tool encouraged the adoption of more environmentally friendly practices. Observing the impact of their operations in real time motivated the farmer to consider reducing their environmental footprint, ultimately leading to more sustainable farming practices.

5. Discussion

The present paper aimed to quantify the carbon emissions associated with the establishment of 15 walnut orchards in the greater area of Magnisia, Greece, with the use of a carbon footprint tool interconnected to a Farm Management Information System. The data collection spanned the first five years following the planting of the trees, providing a comprehensive view of the emissions during this critical establishment phase. Over the five-year period examined, the results revealed net carbon emissions amounting to 13,711.49 kg CO2 eq ha−1. Analyzing the annual data, it is evident that emissions show an increasing trend from the first year through the fifth year. This trend underscores the cumulative impact of various cultivation activities over time, particularly as the orchards mature and require more intensive management. This study′s findings also shed light on the weak spots within the cultivation process that contribute to the generated emissions. This constitutes one of the main advantages of the use of the tool, since it gives users the ability to assess and compare, within a unified framework, the environmental impacts of different strategies, different practices, or even different crops across different regions, facilitating informed decision-making based on specific data. This feature is particularly useful for optimizing environmental performance across various production levels.
This study highlighted the high emissions related to orchard establishment, and the data are supplemented with results from the subsequent cultivation seasons, with the aim of obtaining data about the harvested crop in order to amortize the emissions resulting from the orchard’s establishment. Additionally, further research is needed for the estimation of the carbon gains related to the accumulated biomass of the growing trees. In this direction, data are being collected with the use of unmanned aerial vehicles in order to accurately calculate the biomass increase.
With respect to the resulting emission scopes, Scope 1 and Scope 2 emissions emerged as the most significant. Scope 1 emissions, which are direct emissions from the use of fuel and fertilizers in the field, and Scope 2 emissions, which are indirect emissions from the generation of purchased energy for irrigation, indicate critical areas for potential improvement. These suggest that focusing on reducing fuel use in machinery while also minimizing the use of fertilizers and optimizing energy consumption could yield significant carbon savings.
To continue, despite their lower magnitude compared to Scope 1 and 2, Scope 3 emissions were also notable. Scope 3 emissions encompass all other indirect emissions that occur in the value chain of walnut cultivation, including both upstream and downstream emissions. Although their calculation carries a higher degree of uncertainty, these emissions should not be overlooked. Their inclusion in the overall carbon footprint underscores the need for a holistic approach to emission reduction, considering all stages of the walnut production process. This study highlights the need for targeted strategies to reduce carbon emissions in walnut orchards, focusing on the most significant sources and considering both direct and indirect emissions. The increasing trend in emissions over the five-year period calls for continuous monitoring and adaptation of practices to achieve sustainable cultivation and, for this reason, the use of digital tools for monitoring cultivation becomes imperative.
Irrigation and fertilizing practices were identified as the highest contributors to emissions. This finding is crucial in guiding future efforts in emission reduction. Improved irrigation techniques, such as the use of renewable energy sources for water pumping, could improve the overall efficiency of irrigation. Also, the utilization of digital tools for scheduling irrigation with interconnected meteorological stations in the field allows for targeted irrigation considering a variety of parameters, such as climatic conditions, soil type and texture, or cropping stage. Also, precision fertilization with a tailored crop nutrition plan that also considers various in-field parameters can lead to increased yield and, eventually, lower emissions per unit of product.
The results of this study were also compared with similar research on walnut production to validate the findings. In the present study, the annual emissions, including Scope 3 emissions, were calculated at 2742.30 kg CO2 eq ha−1. In comparison, Eren et al. reported emissions of 1838.34 kg CO2 eq ha−1, considering factors such as human labor, machinery, nitrogen, phosphate, pesticides, fuel, and transportation [37]. Additionally, Marvinnery et al. (2014) developed a process-based life cycle assessment (LCA) model for almond, pistachio, and walnut production in California, which accounted for agrochemical inputs, mechanized operations, soil processes, geospatial variation, and biomass accumulation. Their study calculated the mean annual greenhouse gas (GHG) footprint for walnut production at 2247 kg CO2 eq ha−1 yr−1 from the nursery to the hulling/shelling facility gate [38]. Proietti et al., while evaluating the carbon balance of different tree plantations in Italy, calculated annual emissions of 2031.29 kg CO2 eq ha−1 yr−1 for the first five years after planting [39]. These findings highlight that despite the locality of the data collected within different assessments, the results can be used for generalized recommendations in the field of walnut cultivation.
With respect to the adoption potential of such technologies and tools, data collection and validation in agriculture pose significant challenges due to farmers′ unfamiliarity with advanced technologies. Traditional methods of data gathering are often cumbersome and prone to error, making it difficult for farmers to maintain accurate records. Digital tools, such as farm information management systems, offer a solution by simplifying the data collection process, as was highlighted in the results. These systems are designed to be user-friendly, allowing farmers to input data easily, for example, via their smartphones. This ease of use encourages farmers to consistently update and maintain their records, leading to more accurate and reliable data.
Moreover, these digital tools usually provide a cloud service for data storage, which is particularly beneficial in maintaining the documentation required for certifications, such as ISO standards. These standards often necessitate physical documentation to certify the materials used in farming practices. By storing this information digitally, farmers can ensure it is readily accessible and organized, facilitating smoother certification processes. Another significant advantage of digital monitoring tools is their ability to facilitate the meta-data generation process. By automating data entry and calculations, these tools minimize the risk of human error. This automation not only streamlines operations but also reduces the need for extensive data validation, saving time and resources.
Further automation within these systems can drastically reduce the volume of data that farmers need to manually input. This reduction not only minimizes errors but also lessens the burden on farmers, allowing them to focus more on their core activities rather than administrative tasks. As a result, the overall efficiency and accuracy of farm management are greatly enhanced. Additionally, these tools are invaluable in estimating emissions associated with various farming practices. By analyzing current practices and comparing them with similar cultivations, farmers can identify more sustainable and environmentally friendly alternatives. This capability is crucial in reducing the agricultural sector′s carbon footprint and promoting eco-friendly farming practices.
Considering the above, the integration of digital monitoring tools into agriculture is essential in improving data accuracy, streamlining certification processes, reducing human error, and promoting sustainable practices, especially towards the evolution of the carbon market that has catalyzed the need for standardized emission calculations to validate reductions in emissions and sequestration. This shift demands a transition from theoretical modeling to real, measurable data. Digital monitoring tools are essential for this transition, enabling precise and standardized quantification of emissions. These tools empower farmers to optimize their operations, facilitate certification processes, reduce human error, and promote sustainable practices, ultimately contributing to the standardization and validation of emission reduction efforts in the carbon market.

Author Contributions

Conceptualization, M.L.; methodology, M.L., D.K. and D.B.; software, M.L.; validation, D.K., R.B., T.K. and V.F.; formal analysis, D.B.; investigation, M.L.; resources, C.M.; data curation, C.M.; writing—original draft preparation, M.L.; writing—review and editing, D.K., R.B. and D.B.; supervision, D.B. All authors have read and agreed to the published version of the manuscript.

Funding

This research received no external funding.

Institutional Review Board Statement

Not applicable.

Data Availability Statement

The datasets presented in this article are not readily available because the data are part of an ongoing study. Requests to access the datasets should be directed to the authors of the article.

Conflicts of Interest

Authors Maria Lampridi and Dionysis Bochtis were employed by the company farmB Digital Agriculture S.A. The remaining authors declare that this research was conducted in the absence of any commercial or financial relationships that could be construed as a potential conflict of interest.

References

  1. Kyriakarakos, G.; Petropoulos, T.; Marinoudi, V.; Berruto, R.; Bochtis, D. Carbon Farming: Bridging Technology Development with Policy Goals. Sustainability 2024, 16, 1903. [Google Scholar] [CrossRef]
  2. Mukhamedova, K.R.; Cherepkova, N.P.; Korotkov, A.V.; Dagasheva, Z.B.; Tvaronavičienė, M. Digitalisation of Agricultural Production for Precision Farming: A Case Study. Sustainability 2022, 14, 14802. [Google Scholar] [CrossRef]
  3. Papadopoulos, G.; Arduini, S.; Uyar, H.; Psiroukis, V.; Kasimati, A.; Fountas, S. Economic and Environmental Benefits of Digital Agricultural Technologies in Crop Production: A Review. Smart Agric. Technol. 2024, 8, 100441. [Google Scholar] [CrossRef]
  4. Gabriel, A.; Gandorfer, M. Adoption of Digital Technologies in Agriculture—An Inventory in a European Small-Scale Farming Region. Precis. Agric. 2023, 24, 68–91. [Google Scholar] [CrossRef]
  5. Cool Farm Tool. Available online: https://coolfarmtool.org (accessed on 17 September 2024).
  6. The Ex-Act Tool. Available online: https://www.fao.org/in-action/epic/ex-act-tool/suite-of-tools/ex-act/en/ (accessed on 17 September 2024).
  7. The Carbon Benefits Tool. Available online: https://cbp.nrel.colostate.edu/ (accessed on 17 September 2024).
  8. Brown, R.M.; Dillon, C.R.; Schieffer, J.; Shockley, J.M. The Carbon Footprint and Economic Impact of Precision Agriculture Technology on a Corn and Soybean Farm. J. Environ. Econ. Policy 2016, 5, 335–348. [Google Scholar] [CrossRef]
  9. Lampridi, M.G.; Sørensen, C.G.; Bochtis, D.D. Agricultural Sustainability: A Review of Concepts and Methods. Sustainability 2019, 11, 5120. [Google Scholar] [CrossRef]
  10. Popa, D.C.; Laurent, Y.; Popa, R.A.; Pasat, A.; Bălănescu, M.; Svertoka, E.; Pogurschi, E.N.; Vidu, L.; Marin, M.P. A Platform for GHG Emissions Management in Mixed Farms. Agriculture 2024, 14, 78. [Google Scholar] [CrossRef]
  11. Carlson, B.R.; Carpenter-Boggs, L.A.; Higgins, S.S.; Nelson, R.; Stöckle, C.O.; Weddell, J. Development of a Web Application for Estimating Carbon Footprints of Organic Farms. Comput. Electron. Agric. 2017, 142, 211–223. [Google Scholar] [CrossRef]
  12. Lal, R. Soil Carbon Sequestration Impacts on Global Climate Change and Food Security. Science 2004, 304, 1623–1627. [Google Scholar] [CrossRef]
  13. Laganière, J.; Angers, D.A.; Paré, D. Carbon Accumulation in Agricultural Soils after Afforestation: A Meta-Analysis. Glob. Chang. Biol. 2010, 16, 439–453. [Google Scholar] [CrossRef]
  14. Glover, J.D.; Reganold, J.P.; Bell, L.W.; Borevitz, J.; Brummer, E.C.; Buckler, E.S.; Cox, C.M.; Cox, T.S.; Crews, T.E.; Culman, S.W.; et al. Increased Food and Ecosystem Security via Perennial Grains. Science 2010, 328, 1638–1639. [Google Scholar] [CrossRef] [PubMed]
  15. Zhang, M.Y.; Xu, Y.; Xiang, K.; Wang, X.L. Review of Walnut Breeding Research at the Shandong Institute of Pomology. Acta Hortic. 2014, 1050, 55–60. [Google Scholar] [CrossRef]
  16. Chettri, V.; Ghosh, C. Tea Gardens, A Potential Carbon-Sink for Climate Change Mitigation. Curr. Agric. Res. J. 2024, 11, 695–704. [Google Scholar] [CrossRef]
  17. World Resources Institute and World Business Council for Sustainable Development. GHG Protocol Agricultural Guidance: Interpreting the Corporate Accounting and Reporting Standard for the Agricultural Sector; World Resources Institute: Washington, DC, USA, 2014; pp. 1–150. Available online: https://ghgprotocol.org (accessed on 10 October 2023).
  18. ASABE. ASAE D497.5 FEB 2006 Agricultural Machinery Management Data; ASABE: St. Joseph, MI, USA, 2006. [Google Scholar]
  19. Lampridi, M.; Kateris, D.; Sørensen, C.G.; Bochtis, D. Energy Footprint of Mechanized Agricultural Operations. Energies 2020, 13, 769. [Google Scholar] [CrossRef]
  20. IPCC. 2019 Refinement to the 2006 IPCC Guidelines for National Greenhouse Gas Inventories; IPCC: Geneva, Switzerland, 2019. [Google Scholar]
  21. IPCC. IPCC 2021; IPCC: Geneva, Switzerland, 2021. [Google Scholar]
  22. Calvo Buendia, E.; Tanabe, K.; Kranjc, A.; Baasansuren, J.; Fukuda, M.; S., N.; Osako, A.; Pyrozhenko, Y.; Shermanau, P.; Federici, S. 2019 Refinement to the 2006 IPCC Guidlines for National Greenhouse Gas Inventories; Volume 2: Energy. Chapter 2: Stationary Combustion; 2019 Refinement to 2006 IPCC Guidel. Natl. Greenh. Gas Invent; IPCC: Geneva, Switzerland, 2019. [Google Scholar]
  23. Handa, D.; Frazier, R.S.; Taghvaeian, S.; Warren, J.G. The Efficiencies, Environmental Impacts and Economics of Energy Consumption for Groundwater-Based Irrigation in Oklahoma. Agriculture 2019, 9, 27. [Google Scholar] [CrossRef]
  24. Ministry of Environment and Energy. National Inventory Report of Greece For Greenhouse and Other Gases for the Years 1990–2022; Ministry of Environment and Energy: Athens, Greece, 2024. [Google Scholar]
  25. Saunders, C.; Barber, A.; Taylor, G. Food Miles—Comparative Energy/Emissions Performance of New Zealand’s Agriculture Industry; Agribusiness & Economics Research Unit, Lincoln University: Canterbury, New Zealand, 2006; ISBN 0909042713. [Google Scholar]
  26. Mantoam, E.J.; Romanelli, T.L.; Gimenez, L.M. Energy Demand and Greenhouse Gases Emissions in the Life Cycle of Tractors. Biosyst. Eng. 2016, 151, 158–170. [Google Scholar] [CrossRef]
  27. Wells, C. Total Energy Indicators of Agricultural Sustainability: Dairy Farming Case Study; MAF: Wellington, New Zealand, 2001. [Google Scholar]
  28. Alsabri, A.; Al-Ghamdi, S.G. Carbon Footprint and Embodied Energy of PVC, PE, and PP Piping: Perspective on Environmental Performance. Energy Rep. 2020, 6, 364–370. [Google Scholar] [CrossRef]
  29. Lee, J.; Cho, H.J.; Choi, B.; Sung, J.; Lee, S.; Shin, M. Life Cycle Assessment of Tractors. Int. J. Life Cycle Assess. 2000, 5, 205–208. [Google Scholar] [CrossRef]
  30. Aguilera, E.; Guzmán, G.I.; Infante-amate, J.; García-ruiz, R.; Herrera, A.; Villa, I.; Soto, D.; Torremocha, E.; Carranza, G.; de Molina, M.G. Embodied Energy in Agricultural Inputs. Incorporating a Historical Perspective. Available online: https://econpapers.repec.org/paper/sehwpaper/1507.htm (accessed on 10 June 2022).
  31. Audsley, E.; Stacey, K.; Parsons, D.J.; Williams, A.G. Estimation of the Greenhouse Gas Emissions from Agricultural Pesticide Manufacture and Use. Available online: https://dspace.lib.cranfield.ac.uk/bitstream/handle/1826/3913/Estimation_of_the_greenhouse_gas_emissions_from_agricultural_pesticide_manufacture_and_use-2009.pdf;jsessionid=DC4D51F03A8C73E065940B464D68BDBD?sequence=1 (accessed on 5 December 2019).
  32. Mantoam, E.J.; Mekonnen, M.M.; Romanelli, T.L. Energy, water and material footprints of agricultural machinery industry. Agric. Eng. Int. CIGR J. 2018, 20, 132–140. [Google Scholar]
  33. Kitani, O. CIGR Handbook of Agricultural Engineering, Volume 5: Energy and Biomass Engineering. Am. Soc. Agric. Eng. 1999, 6–11. [Google Scholar]
  34. Walnut Cultivation with California Varieties. Available online: https://blog.farmacon.gr/katigories/texniki-arthrografia/pollaplasiastiko-yliko/item/800-i-kalliergeia-tis-karydias-me-poikilies-kalifornias (accessed on 17 September 2024).
  35. Lampridi, M.; Kougioumtzidis, G.; Tousi, M.A.; Kalognomou, E.-A.; Bochtis, D. Towards the Sustainability Assessment of Walnut Production in Greece. In Proceedings of the International Conference on Green Supply Chain-GSC’ 2018, Thessaloniki, Greece, 2–4 July 2018. [Google Scholar]
  36. Wikifarmer. Planting Walnut Trees. Available online: https://wikifarmer.com/planting-walnut-trees/ (accessed on 15 December 2023).
  37. Eren, O.; Baran, M.F.; Gokdogan, O. Determination of Greenhouse Gas Emissions (GHG) in the Production of Different Fruits in Turkey. Fresenius Environ. Bull. 2019, 28, 464–472. [Google Scholar]
  38. Marvinney, E.; Kendall, A.; Brodt, S. A Comparative Assessment of Greenhouse Gas Emissions in California Almond, Pistachio, and Walnut Production. In Proceedings of the 9th International Conference on Life Cycle Assessment in the Agri-Food Sector, San Francisco, CA, USA, 8–10 October 2014; Volume 1, p. 11. [Google Scholar]
  39. Proietti, P.; Sdringola, P.; Brunori, A.; Ilarioni, L.; Nasini, L.; Regni, L.; Pelleri, F.; Desideri, U.; Proietti, S. Assessment of Carbon Balance in Intensive and Extensive Tree Cultivation Systems for Oak, Olive, Poplar and Walnut Plantation. J. Clean. Prod. 2016, 112, 2613–2624. [Google Scholar] [CrossRef]
Figure 1. Example of data collection for tillage and manual fertilization tasks inside the farmB platform.
Agronomy 14 02241 g001
Figure 2. Example of field data presentation (a) and results panel (b) inside the farmB platform.
Agronomy 14 02241 g002
Figure 3. Typical orchard from the case study for Year 1 (a) and Year 5 (b).
Agronomy 14 02241 g003
Figure 4. Variation in applied nitrogen and water for the examined orchards.
Agronomy 14 02241 g004
Figure 5. Total emissions for the 5-year cultivation.
Agronomy 14 02241 g005
Figure 6. Yearly evolution of emissions by operation.
Agronomy 14 02241 g006
Figure 7. Yearly distribution of emissions by operation.
Agronomy 14 02241 g007
Figure 8. Distribution of operations for five years.
Agronomy 14 02241 g008
Figure 9. Distribution of emissions per scope and emission categories.
Agronomy 14 02241 g009
Table 2. User calculation parameters.
ParameterUnitParameterUnitParameterUnit
Field aream2Fertilizer masskg·lt−1Irrigation water volumem2
Operation type-Nitrogen (N) content in fertilizer%Fuel type-
Farm–field distancemPhosphorus content (Ρ) in fertilizer%Irrigation tube material-
Farm–field transportation speedkm·h−1Potassium content (Κ) in fertilizer%Irrigation tube lengthm
Tractor powerhpSeed quantity-Pipe inner diametercm
Transmission type-Seedling quantitykgPipe wall thicknesscm
Implement type-Plant protection substance quantitykg·lt−1Irrigation durationh
Operation widthmPercentage of active substance%Manual laborh
Operation depthcmYieldkgResidue management method-
Implement mass kgWater pumping heightm
Table 3. Field characteristics.
Area
(ha)
Number of TreesFarm–Field Distance
(km)
Field 12.33107
Field 21.72896.6
Field 31.264667.7
Field 40.911238.3
Field 51.311776.4
Field 62.042766.8
Field 71.542082
Field 80.711212.5
Field 91.42388.5
Field 103.15274
Field 111.7529810.1
Field 121.736407.5
Field 132.9610965.9
Field 141.375072.3
Field 153.53130711.1
Table 4. In-field operations (number of events) for a 5-year cultivation period following the orchard estab-lishment (baseline scenario).
TillagePlant Protection
YearField CultivatorDisk-harrowManual Weed ControlWeed ControlPest ControlPlantingFertilization
(manual)
Irrigation
1165191710
236638-79
3310648-613
4464411-512
5457412-616
Disclaimer/Publisher’s Note: The statements, opinions and data contained in all publications are solely those of the individual author(s) and contributor(s) and not of MDPI and/or the editor(s). MDPI and/or the editor(s) disclaim responsibility for any injury to people or property resulting from any ideas, methods, instructions or products referred to in the content.

