Article

Physiological and Transcriptomic Characterization of Rice Genotypes under Drought Stress

1
Rice Research Institute, Anhui Academy of Agricultural Sciences, Hefei 230031, China
2
State Key Laboratory of Crop Gene Exploration and Utilization in Southwest China, Sichuan Agricultural University, Chengdu 611130, China
3
Anhui Province Key Laboratory of Rice Germplasm Innovation and Molecular Improvement, Hefei 230031, China
*
Authors to whom correspondence should be addressed.
Agronomy 2024, 14(10), 2247; https://doi.org/10.3390/agronomy14102247
Submission received: 5 September 2024 / Revised: 23 September 2024 / Accepted: 25 September 2024 / Published: 29 September 2024
(This article belongs to the Special Issue Rice Germplasm Innovation and Tolerance to Abiotic Stress)

Abstract

:
Drought is a primary abiotic stress that inhibits rice (Oryza sativa L.) growth and development, and during the reproductive stage it has a negative impact on the rice seed-setting rate. This research study examined two rice lines, La-96 (drought sensitive) and La-163 (drought resistant), for drought stress treatment (with soil moisture at 20% for 7 days) and control (normal irrigation and kept soil moisture ≥40%). To elucidate the photosynthesis and molecular mechanisms underlying drought tolerance in rice, leaf photosynthetic traits and transcriptome sequencing were used to compare differences between two contrasting recombinant inbred lines (RIL) during drought and subsequent recovery at the booting stage. The rice line La-96 showed a significant decrease in seed-setting rate after being treated for seven days’ drought stress (from 86.64% to 22.75%), while La-163 was slightly affected (from 89.04% to 79.33%). The photosynthetic activities of both lines significantly decreased under the drought treatment, and these traits of La-163 recovered to a comparable level with the control after three days of rewatering. The transcriptome of both lines in three treatments (the control, drought stress, and subsequent recovery) were tested, and a total of 16,051 genes were identified, among which 10,566 genes were differentially expressed in various treatments and rice lines. Comprehensive gene expression profiles revealed that the specifically identified DEGs were involved in the ribosome synthesis and the metabolic pathway of photosynthesis, starch, and sucrose metabolism. The DEGs that are activated and respond quickly, as seen during recovery in the tolerant rice line, may play essential roles in regulating subsequent growth and development. This study uncovered the molecular genetic pathways of drought tolerance and extended our understanding of the drought tolerance mechanisms and subsequent recovery regulation in rice.

1. Introduction

Rice (Oryza sativa L.) is an integral part of the global food industry and is a staple food for half of the world’s population [1,2]. It is the second most widely grown crop after wheat, occupying 162.06 million hectares of arable land and producing 685.35 million metric tons annually; its average output is 4662 kg/ha [3]. Despite being cultivated worldwide, Asian countries, including China, India, Pakistan, Bangladesh, Thailand, Cambodia, and Vietnam, contribute more than 50% of the world’s rice production [4]. According to Simkhada and Thapa [5], China is the leading global rice market, with an annual production of 206 million metric tons, accounting for 28% of worldwide rice production. Rice has a larger share in China’s grain production; therefore, rice plays a significant role in China’s national economy. Rice is a highly water-consuming crop, and for every kilogram of rice yield, it is anticipated that 3000 L of water will be required [6]. When precipitation is insufficient or evaporation rates are higher, drought is the resulting meteorological phenomenon that induces water deficit conditions and limits plant growth. Drought-induced water-deficient conditions negatively influence the rice’s growth and development, restricting the essential physiological processes that ultimately cause a severe reduction in rice productivity [7]. Sandhu and Kumar [8] reported that a 25.4% decline in rice yield was recorded due to drought stress. Rice under drought stress is characterized by reduced leaf water potential, poor turgor pressure, stomatal closure, and decreased cell expansion and proliferation. Thus, it inhibits photosynthesis, respiration, translocation, ion uptake, carbohydrate synthesis, nutritional metabolism, and so on, all contributing to reduced plant growth [9].
Drought stress has varying impacts on rice growth depending on the drought intensity, frequency, and sensitivity of the cultivar towards stress. Rice has varying water requirements at different growth stages; therefore, each stage’s vulnerability to drought stress varies. Rice plant growth is divided into three phases: vegetative (germination to panicle initiation), reproductive (panicle initiation to flowering), and ripening (flowering to maturity). Drought stress during vegetative stages causes diminished germination, poor stand establishment, and plant degeneration, ultimately affecting the plant’s ability to grow and develop optimally [10]. It has been reported that rice plants are highly susceptible to water deficit conditions during the reproductive stage, which includes booting, flowering, and panicle initiation [8,11,12]. Drought during the reproductive and ripening stages causes a reduction in plant height, grain number, grain weight, and rice crop yield [13]. The yield decline is up to 60% if drought occurs during the flowering stage [14]. In a case study, a poor grain-filling rate was observed in drought-affected paddy fields; as a result, a diminished seed-setting rate (SR) led to a significant yield reduction [15]. Anhui Province is located in the lower reaches of the Yangtze and Huaihe Rivers, China’s main rice production region [16]. Every year, during the rice-growing season in July and August, there are frequent drought incidents in this region [17]; this is a crucial time of panicle initiation and seed setting that is critical in defining the final grain yield of the rice.
Till now, numerous research studies have been performed to understand the effect of drought stress on rice growth and drought tolerance (DT) response in rice. The DT is a complex phenomenon characterized both genetically and physiologically and is typically influenced by relative expressions of different genes [9]. The primary DT mechanisms include cellular changes, physiological acclimation, and morphological adaptations and are regulated by various gene expressions [18,19,20]. Exploring the methodology of system biology via transcriptome, proteome, metabolome, etc., is a powerful tool to explain the complex mechanisms of plants. The comparative transcriptome analysis revealed a number of differentially expressed genes (DEGs) in response to drought stress. It includes the genes related to reactive oxygen species (ROS) and polyamines (Pas) [21,22], some genes regulating different hormones such as abscisic acid (ABA), cytokinin (CK), jasmonic acid (JA), and ethylene. Furthermore, the genes involved in carbohydrate metabolism, secondary metabolite metabolism, cellular transportation, and photosynthesis [23,24] were also reported to be differentially expressed under drought stress. However, according to the large number of candidate genes proposed by transcriptomic studies on DT, few candidates have been functionally characterized. Moreover, its role in physio-chemical changes during recovery after drought remains poorly understood, which is fundamental to understanding stress resilience and tolerance enhancements.
In our previous studies, we developed a DT recombinant inbred line (RIL) population of 120 lines [7]. In comparative transcriptome analysis, the RIL lines with contrasting performance on the target trait might significantly reduce the genetic background noise compared to the entirely different genotypes. The present study used two rice lines with varying DT capacities as plant material to analyze their transcriptomic changes under drought stress and subsequent recovery at the booting stage. The primary objective of this study was to evaluate the molecular performance of both rice lines under drought conditions. Moreover, it enhanced our understanding of the genetic mechanisms of DT and subsequent recovery in rice. It will be a solid foundation in future breeding programs because it is paramount to maximize rice yield by enhancing the potential of DT.

2. Materials and Methods

2.1. Plant Material and Experiment Conditions

A drought-sensitive rice line La-96 and a drought-resistant line La-163 were used as plant material, derived from the population of DT-RIL. The DT-RIL was obtained from a cross between dryland (Lvhan-1) and drought-sensitive rice varieties (Aixian-1). The research investigation was conducted in a mobile-shelter field station of the Rice Research Institute, Anhui Academy of Agricultural Sciences in Hefei, China (31°53′15.713″ N, 117°14′45.758″ E). The shelter can be closed on rainy days to keep rainfall out of the experimental site.
The experiments were conducted from May to October 2023. Rice seeds were planted in a seedling nursery on 20 May. The representative seedlings with five leaves were transplanted on 10 June into pots (24 cm × 24 cm × 27 cm) with three replicates. Each pot contained two plants under the same treatment and was considered one experimental unit. There was a hole with a plug 1 cm off the ground on the wall of each pot. Ten kilograms of sieved, air-dried loam soil were put into pots collected from 0–20 cm topsoil layers in a rice paddy field. The soil contained 11.54 g/kg organic material, 1.32 total nitrogen, 0.68 g/kg total phosphorus, 54.48 mg/kg available N, 75.41 mg/kg available P, and 420 mg/kg available K, with a pH of 6.02. All pots were watered using drip irrigation to maintain soil moisture content at ~70% and applied with 20 g of (NH4)2HPO4 before transplanting.
Two water treatments were applied: drought stress (soil moisture at 20% for seven days) and control (normal water supply to keep the soil moisture around 40%). To avoid the variations in soil due to drought stress, it was made sure that the soil-water content in each pot was well-homogenized; each pot was monitored by employing a system of real-time monitoring and adjustment, containing an RS-WS-N01-TR-1 sensor and an RS-YK-R08 network relay (Shandong Renke measurement and Control Technology Co., Ltd., Jinan, China) along with a water tube. The sensor probe was inserted 15 cm below the top portion of the pot, where the root system is primarily proliferated. Water was supplemented, and the soil moisture was measured after every 30 min. Previous drought stress experiments showed that the sensitive period of rice to drought was the booting stage, which occurred around 73~78 days after seeding and around one week before initial heading. The drought stress treatment was applied at the booting stage, which was determined by phenotype. A threshold of 20% was set 3~4 days before rice heading; in the meantime, the hole plug at the bottom of each pot was removed to make the water content drain away naturally, and stress days were counted once the moisture content reached 20% ± 1.5%. The main panicle reached the booting stage and was labeled in each pot for testing. After seven days of water deficit conditions with 20% moisture, the threshold was set as 40% to rewater and recover to normal water management.

2.2. Sampling and Measurements

Samples were immediately taken after seven days of 20% moisture stress (D), and the control treatment (C) samples were taken. In addition, on the 3rd day after rewatering, samples were also taken and defined as recovery treatment (R). The flag leaves of labeled panicles were used for sampling and measurement. Three biological replicates, one from each plant, were sampled for further analysis.

2.2.1. Yield Components

Upon reaching the harvesting maturity, two panicles were sampled from each pot, and their total seeds per panicle (TS) and total filled seeds (TF) per panicle were computed.

2.2.2. Chlorophyll Contents

Five plants of consistent growth from each treatment were chosen for measuring the photosynthetic traits. The Chl contents were quantified using the SPAD meter (SPAD-502, Konica-Minolta Inc., Osaka, Japan).

2.2.3. Relative Water Contents

The flag leaf’s fresh mass (FW) was measured through an electronic scale. Then, leaves were put into the deionizing water for 12 h, and the turgid mass (TM) was quantified. The leaf’s dry mass (DM) was determined after drying at 105 °C for half an hour and then at 80 °C for 48 h to achieve a consistent mass. After that, the relative water content (RWC) was computed using the formula:
RWC (%) = (FM − DM)/(TM − DM) × 100.

2.2.4. Gaseous Exchange

A portable photosynthetic analyzer, model LI-6800 (LI-COR, Lincoln, NE, USA), was used to measure the rate of photosynthesis within the leaves. The flag leaf, which is the highest fully grown leaf, was used to measure the net photosynthetic rate (Pn), intercellular CO2 concentration (Ci), stomatal conductance (Gs), and transpiration rate (Tr) on bright days between 9:00 and 11:00 a.m. The instrument leaf chamber was 30 °C, the air relative humidity was 60%, the leaf chamber CO2 flow rate was 500 µmol s−1, and the intensity of the integrated red and blue light source (LI-6800-02) was 1200 µmol (photon) m−2 s−1.

2.3. RNA-Seq Analysis

2.3.1. Extracting Total RNA and Constructing mRNA Libraries

Following rinsing in deionized water, samples were extracted from each biological replicate of each treatment and preserved in liquid nitrogen. A TRIzol kit (Invitrogen, Carlsbad, CA, USA) was used to extract total RNA from leaf tissues. Agarose gel and the NanoDrop 2500 (Thermo Fisher Scientific, Waltham, MA, USA) have been used to assess the quality and quantification of RNA. The quality and validity of RNA were evaluated using the Agilent 2100 bioanalyzer (Agilent Tech. Inc., Santa Clara, CA, USA). A total RNA of 1 μg, a concentration of ≥30 ng/μL, an RQN > 6.5, and an OD260/280 between 1.8 and 2.2 were utilized for constructing a single library. The mRNA was purified using magnetized beads with Oligo (dT) attachments. After that, RNA fragmentation was used to obtain clean mRNA samples. Random hexamer-directed transcription (RT) produced the first cDNA strand using fragmented mRNA as a template. Next, the two-strand is added to a reaction system to generate cDNA with two strands, and the double-stranded cDNA is purified using the kit. RNA Index Adapters and an A-Tailing Mix were added to a sequencing junction to facilitate the end repair of the purified double-stranded cDNA. The AMPure-XP bead-based reagent was utilized to purify the following cDNA fragment amplification via PCR, and the resulting EB solution was then dissolved. Validation was performed using the Agilent Technologies 2100 Bioanalyzer (Agilent Tech. Inc., Santa Clara, CA, USA) as a quality control. After the quality check, the Illumina HiSeq-TM 2500 (Illumina Inc., San Diego, CA, USA) or Illumina HiSeq-X Ten sequencers (Illumina Inc., San Diego, CA, USA) created the library sequencing, producing 125 bp or 150 bp of double-ended data. Furthermore, additional analysis was performed on the collected data. The Chinese company, Majorbio (Shanghai, China), constructed the libraries and RNA sequencing.

2.3.2. Quality Control, Mapping of RNA Sequencing Reads, and Gene Annotations

The Illumina platform has produced a significant amount of sampling double-ended sequencing data. Because data error rates affect the results, Trimmomatic has been utilized [25]. The software counts the number of reads throughout the quality control process and performs quality preprocessing on the original data using statistical methods. Preprocessing for quality control comprises the following steps: (1) adaptor; (2) removal of poor-quality reads; (3) various methods for removing low-quality bases from the 3′ and 5′ ends; (4) quantifying of the original sequencing and adequate sequencing amount; GC content; Q30; and (5) thorough evaluation. Before analysis, high-quality reads were obtained using fastp “http://github.com/OpenGene/fastp (accessed on 5 September 2024)”, which allowed for quality control over the raw sequence data; and then validated the accuracy of subsequent analytic results using the reference rice genome, indica. To assemble transcripts and compute mapping data for expression, we employed the TopHat.2 software (v.2.1.1) “http://ccb.jhu.edu/software/tophat/index.shtml (accessed on 5 September 2024)”. StringTie software (v.2.2.3) “http://ccb.jhu.edu/software/stringtie/ (accessed on 5 September 2024)” was used to read link map readings. The link map reading was taken using the StringTie tool “http://ccb.jhu.edu/software/stringtie/ (accessed on 5 September 2024)”. Using RSEM software (v.1.3.3) “http://deweylab.github.io/RSEM/ (accessed on 5 September 2024)”, which adopts the FPKM (Fragments Per Kilobase of Transcript Per Million Fragments Mapped) method for quantitative analysis of gene expression level, functional annotation and transcript statistics were performed on the databases of Swiss-PROT “http://web.expasy.org/docs/swiss-prot_guideline.html (accessed on 5 September 2024)” and NCBI_NR database “http://www.ncbi.nlm.nih.gov (accessed on 5 September 2024)” and NCBI. Venn and principal component analysis (PCA) were then used to examine the correlation between the samples. Protein interaction predictions were made via the string website “https://cn.string-db.org/ (accessed on 5 September 2024)”.

2.4. Statistical Analysis

The data reported in this research investigation are the mean of 3 biological replicates. An analysis of variance (ANOVA) and a least significant difference test (p < 0.05) were used. Statistical analysis was used to compute and analyze the differences between treatments. The statistical analysis was conducted using SPSS 20 software, whereas the figure design was designed using Origin 2021.

3. Results

3.1. Seed Yield, Yield Components, and Panicle Traits of a Single Plant

The rice booting stage is susceptible to soil drought stress. Although treated only for 7 days, the damage seemed irreversible, leading to a final loss of biomass and yield. Figure 1A,B shows the main panicle performance of two rice lines under drought stress compared with the control at maturity. Both lines’ (La-163, La-96) total seed number (TS) and filled seed number (FS) were reduced under drought conditions compared to control conditions. The SR of La-96 declined significantly from 86.64% under control to 22.75% after drought stress during the booting stage, while La-163 showed a slight reduction from 89.04% to 79.33%, stating a contrasting response to drought stress (Figure 1C,D).

3.2. Leaf Chlorophyll Content and Relative Water Content (RWC) under Drought Stress and Recovery

Seven days’ drought stress significantly decreased the Chl contents of La-163, and the effect was irreversible (Figure 2). The leaves treated by drought stress also showed a significant change in their RWC. The RWC for both rice lines was significantly decreased under drought stress compared to the control. For La-96 and La-163, RWC decreased from 83.6% and 82.2% in the control (C) treatment to 67.3% and 67.1% in the drought (D) treatment, respectively. After 3 days of rewatering (R), the RWC of La-163 recovered to 79.1% and showed no significant difference with C treatment.

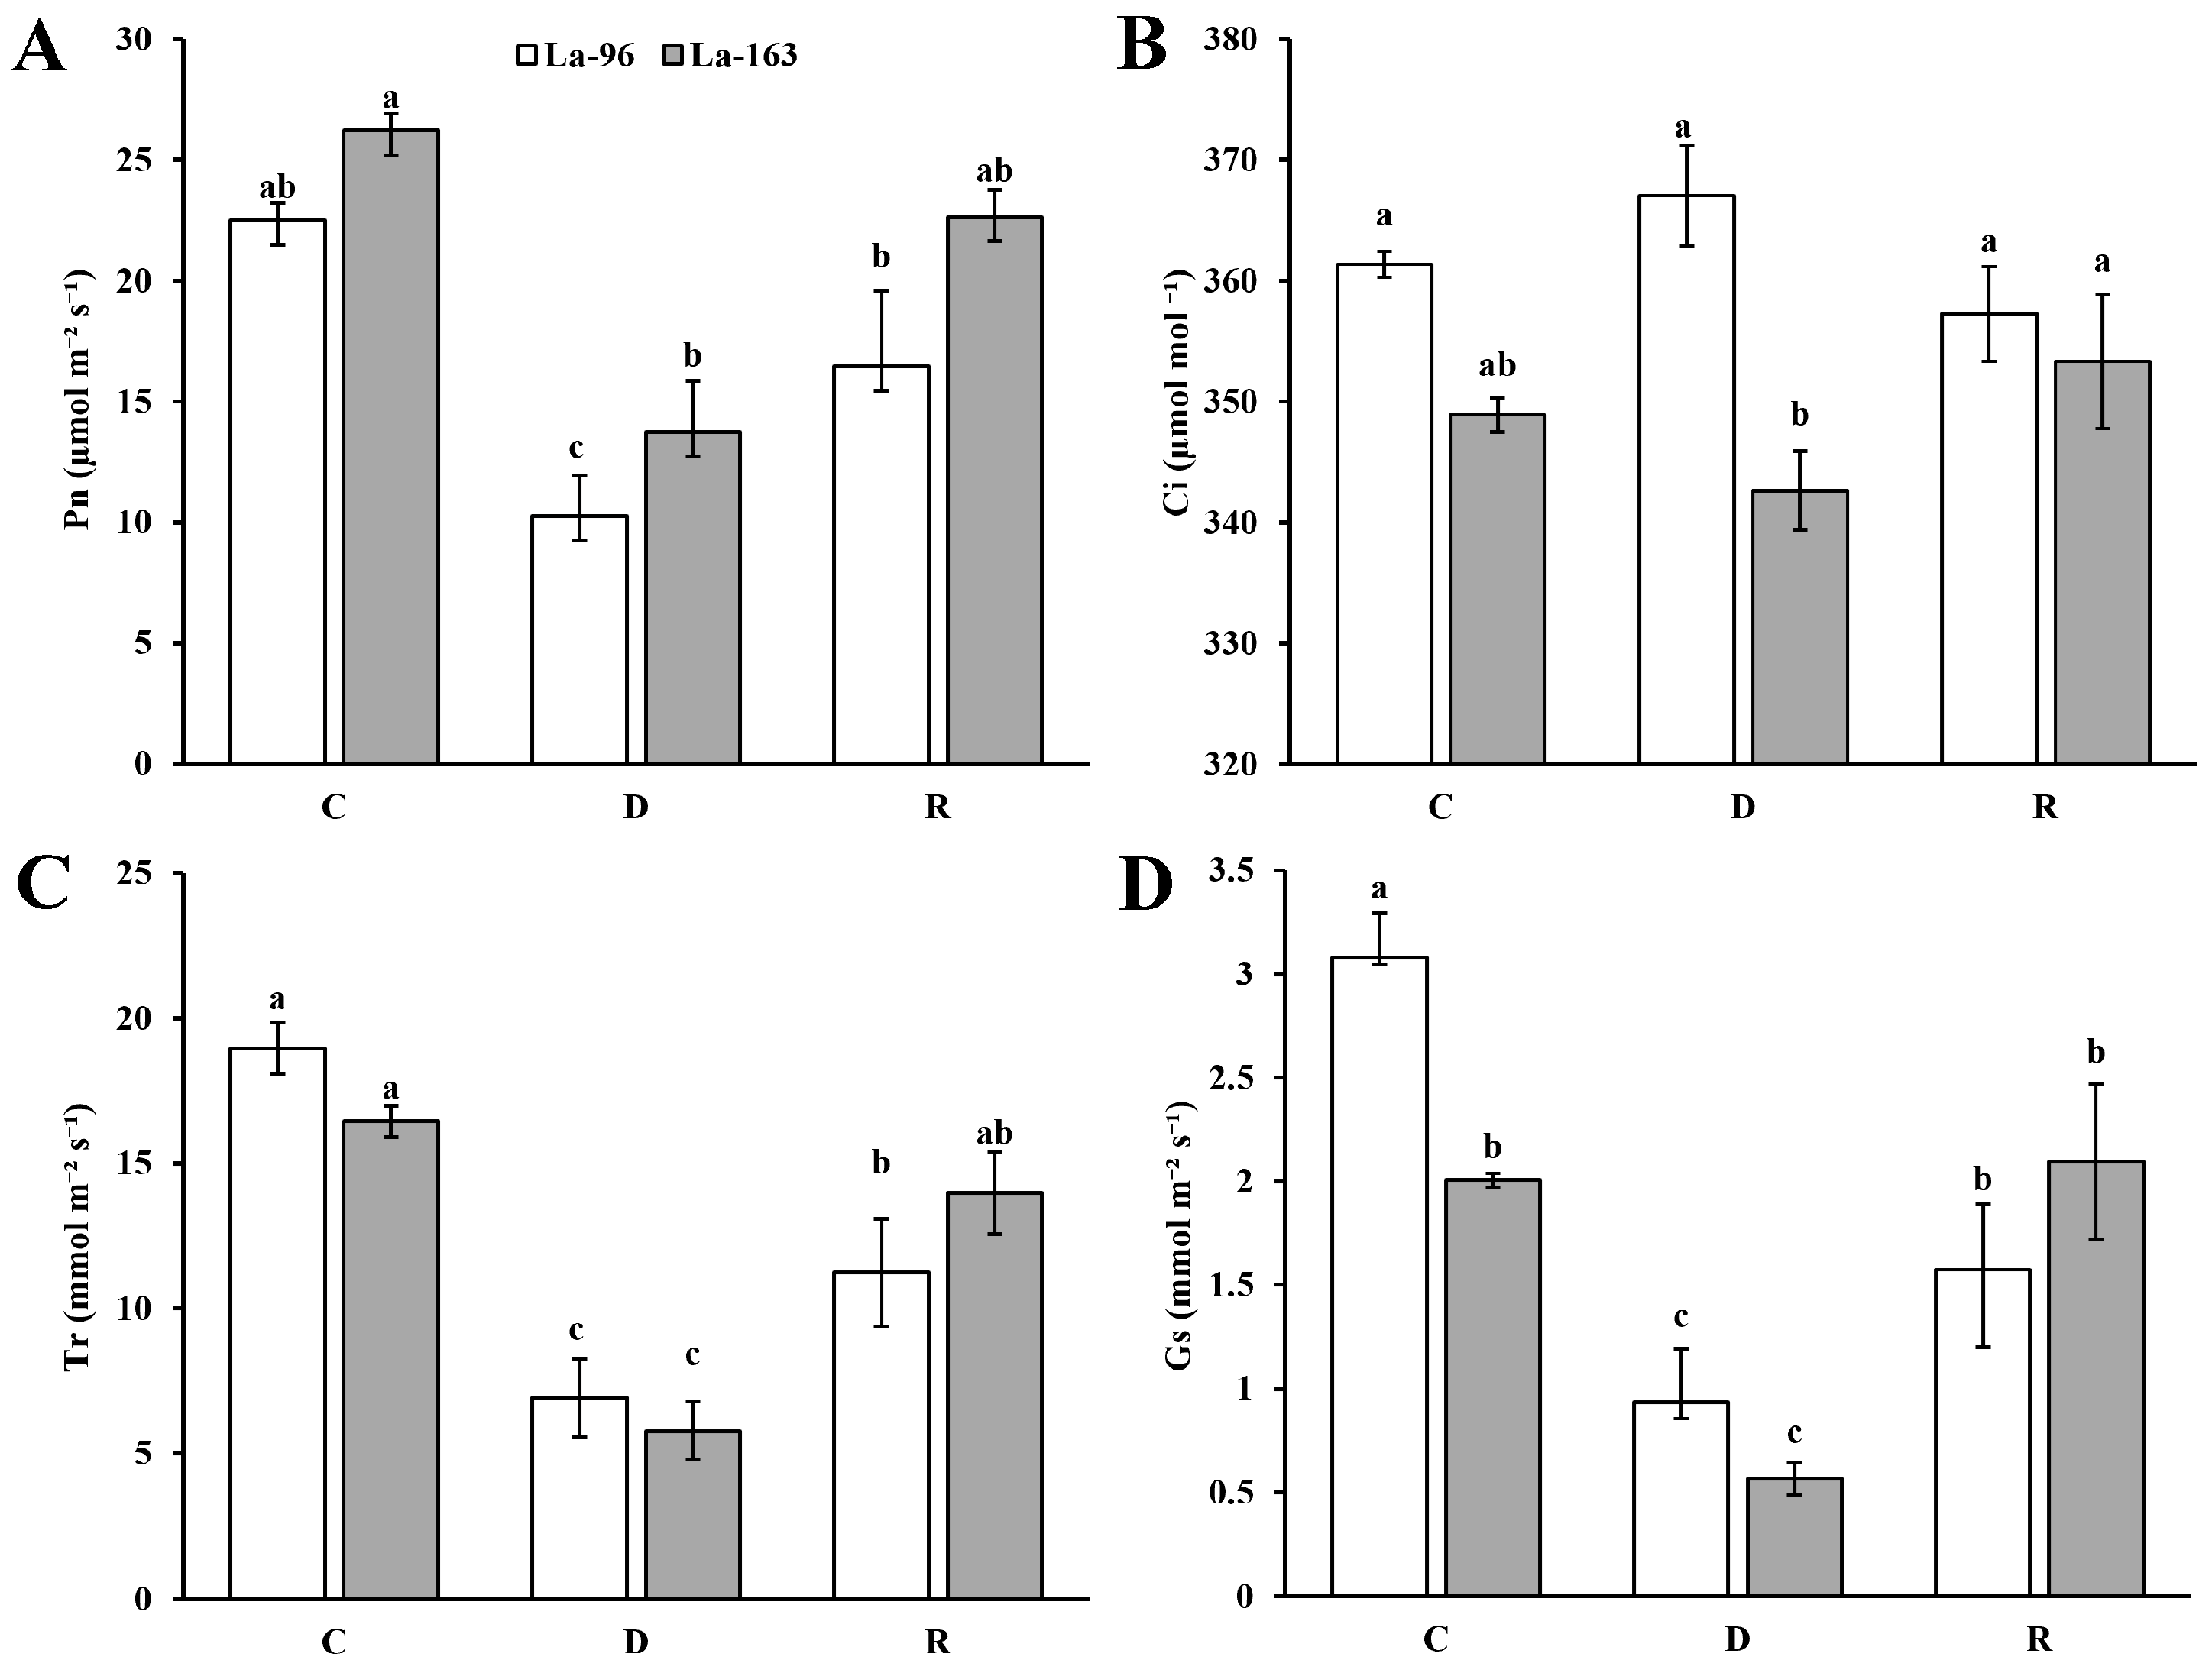
3.3. Photosynthetic Traits of Flag Leaves under Drought Stress and Recovery from Drought Treatment

Usually, drought tolerance was related to rice’s early response and photosynthesis. Drought treatment showed a significant effect on the photosynthetic traits of flag leaves (Figure 3). For both rice lines, the net photosynthesis rate (Pn), stomatal conductance (Gs), and transpiration rate (Tr) were significantly decreased under drought stress, which was recovered to some extent after rewatering. Compared to the control, the Pn, Tr, and Gs of La-96 reduced by 54.4%, 63.6%, and 69.7% under drought stress, respectively (Figure 3A,C,D). Rewatering increased these traits but was still lower than the control, 26.9%, 40.8%, and 48.9% lower than the control. Similarly, the Pn, Tr, and Gs of La-163 significantly decreased by 47.7%, 64.8%, and 71.8% due to drought stress and rewatering recovered them, comparable to the control level. Both lines’ intercellular CO2 concentration (Ci) changed slightly under drought or recovery treatments, and no significant difference was observed (Figure 3B).

3.4. RNA Sequencing Analysis

To analyze the impacts of drought stress and successive recovery response on the transcriptome of rice leaves, we used samples under drought and recovery with three biological replicates for RNA-seq. A total of 849,999,944 library reads were obtained from among 18 samples. Their Q30 base distribution and average GC contents were 94.84~95.30% and 48.68%, respectively (Table S1). After comparing readings to the reference genome, the genomic alignment of every sample was found to be 94.61~96.08%. The comparative findings were used to characterize the expression of genes encoding proteins (Table S2). The reference genome sequence was aligned with the clean reads from each sample.

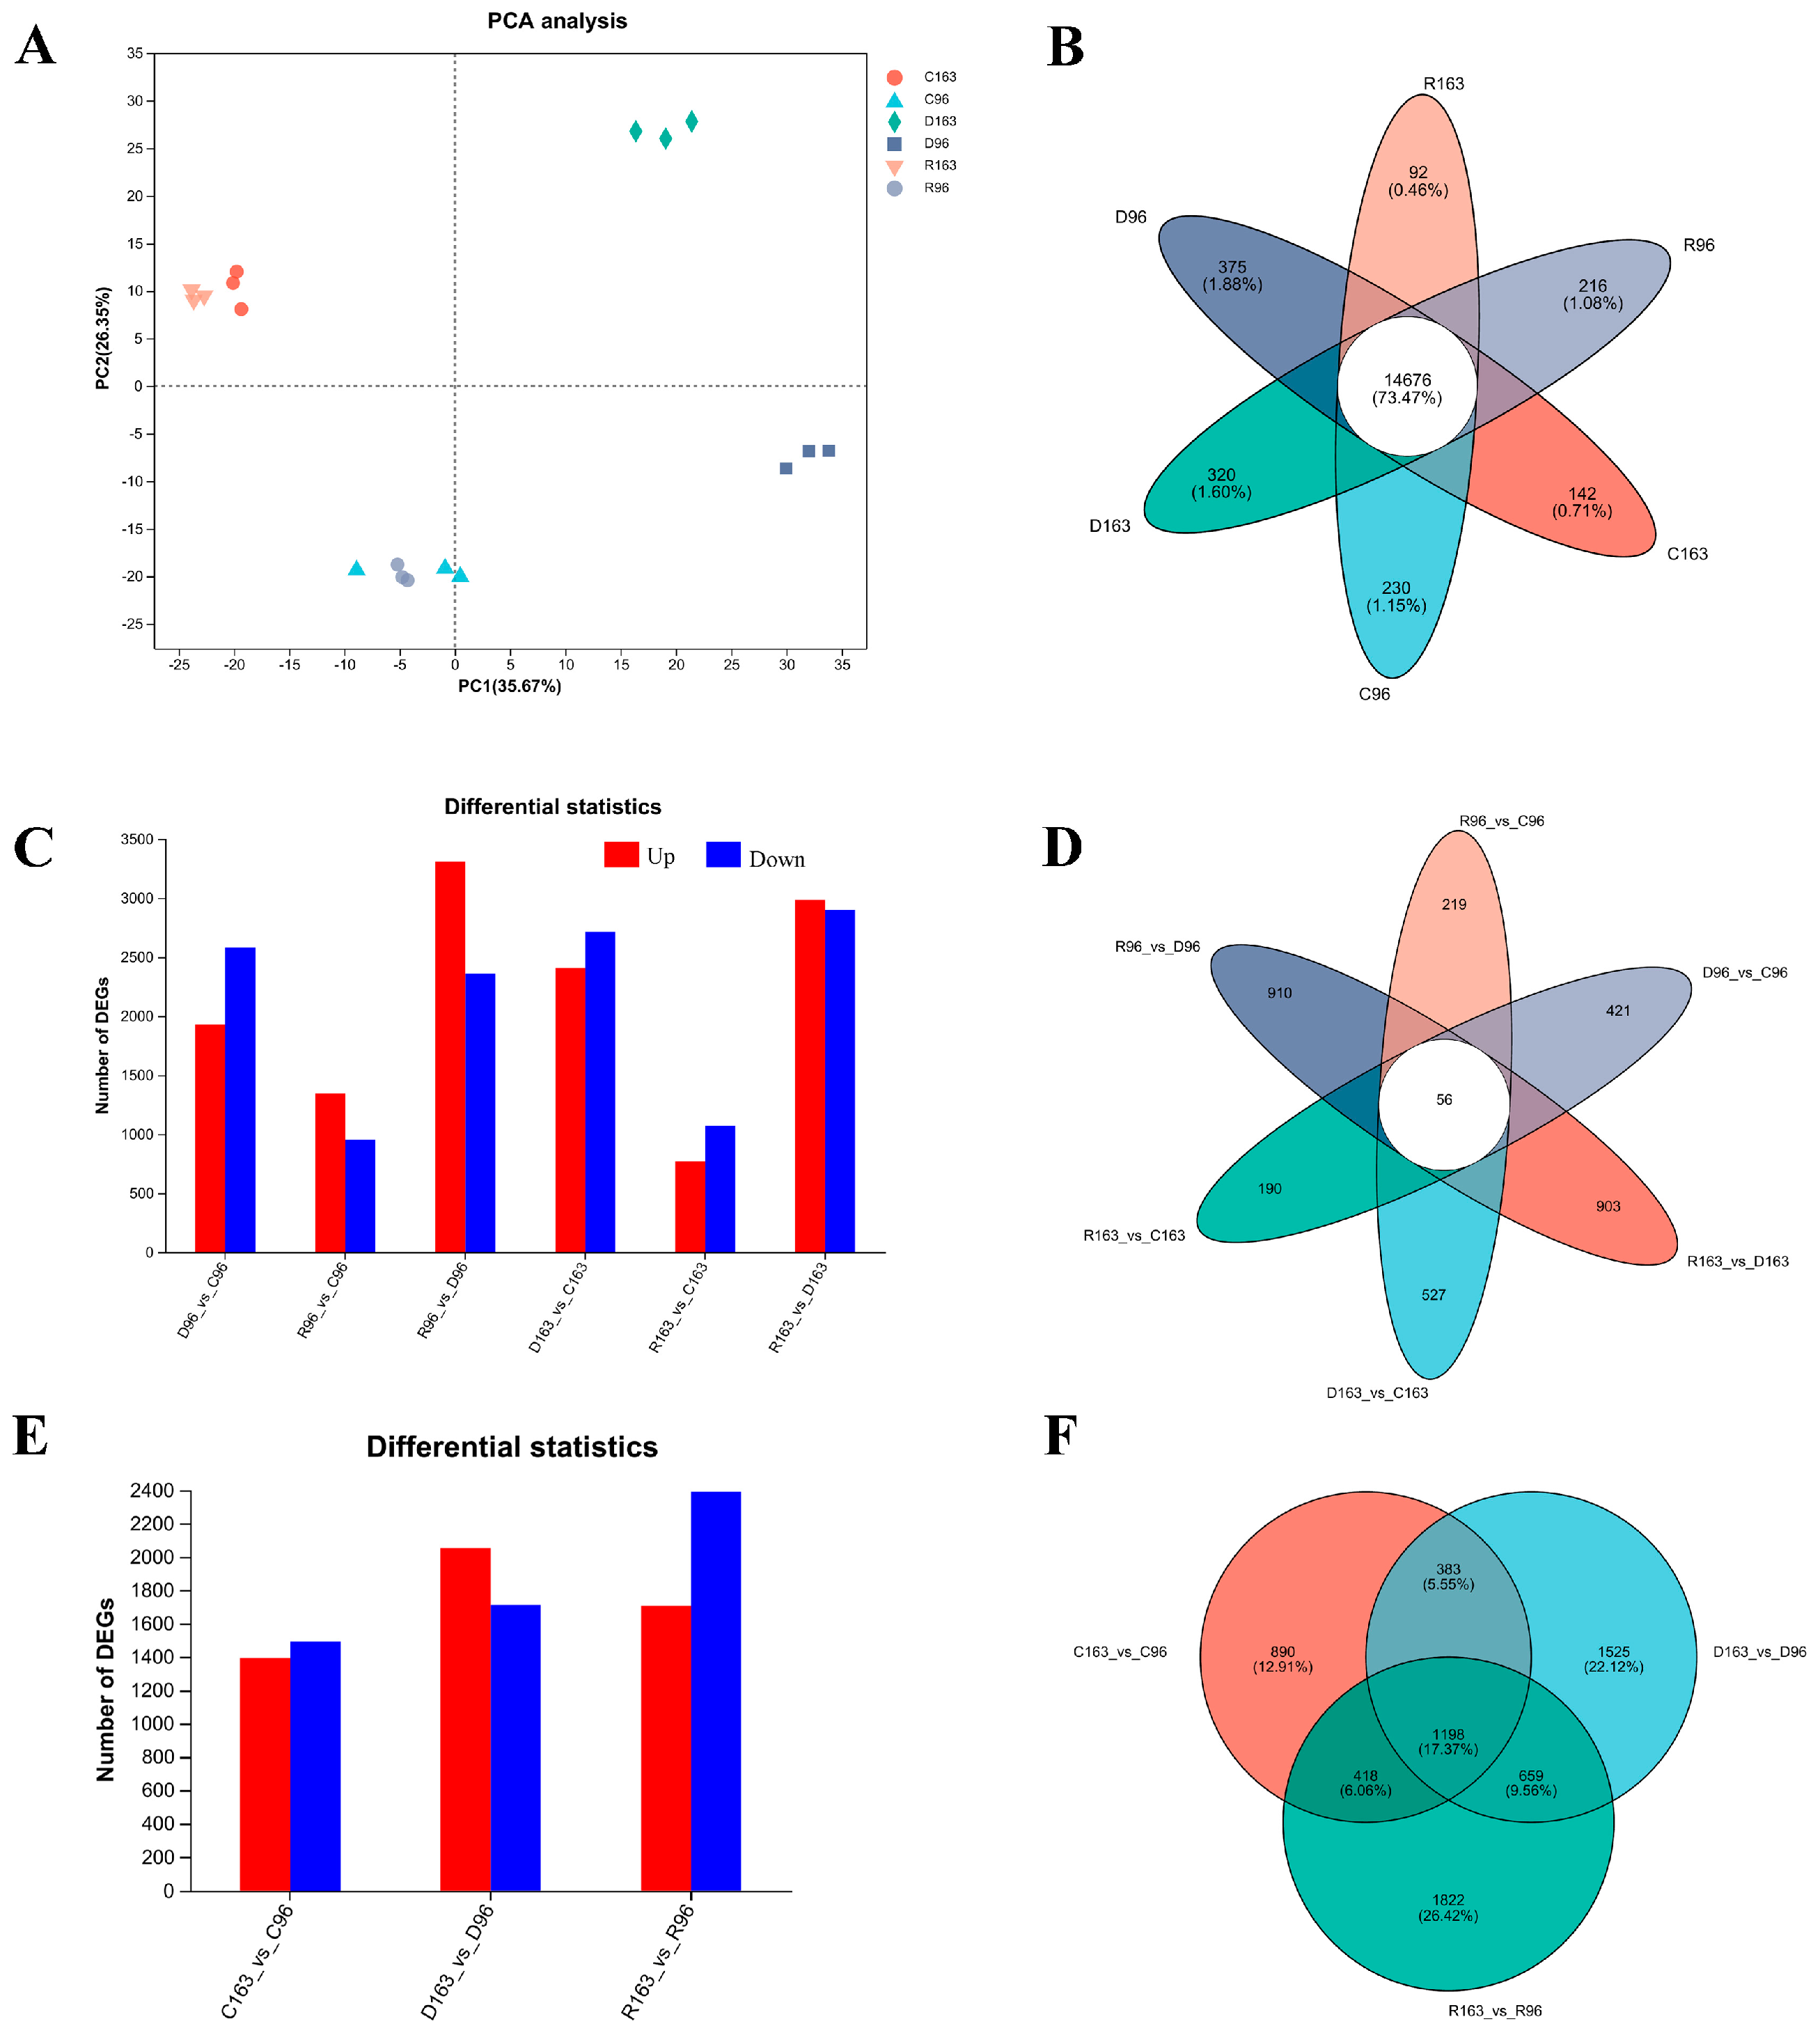
3.4.1. Transcriptome Responses to Drought and Rewatering Recovery Response in the Leaves

The transcriptome of rice significantly altered under drought stress, as shown by the principal component analysis (PCA) (Figure 4A) of the three treatments, which showed good consistency in transcriptomic data and substantial variations between the drought and control samples. However, the difference between R and C treatments was little, suggesting that rewatering efficiently mitigated drought damage on rice. There was also a significant difference in transcriptomic data between the two rice lines, indicating the different metabolism responses of both rice lines under drought stress at the booting stage.
FPKM measurements were used further to analyze the gene expression patterns of two rice lines, aiming to understand the variations between lines that underwent the same water treatment and lines that underwent different water treatments. There were 16,051 genes identified in all samples (Figure 4B). Among these, 14,676 (73.47%) genes were commonly identified in six samples, and 230, 142, 375, 320, 216, and 92 genes were characteristically identified in C96, C163, D96, D163, R96, and R163, respectively.
Table S3, Figure 4C shows that 10,566 genes were differently expressed by expression ratio > 2.0 and p < 0.05 between three treatments and two rice lines. Among those DEGs, 4511 and 5121 were found up and downregulated by drought in La-96 and La-163, respectively. From drought recovery to normal water conditions, 5673 and 5885 DEGs were identified in La-96 and La-163, respectively (Figure 4C). Compared with the control, there were 2302 and 1844 DEGs in La-96 and La-163 after recovery, respectively. The Venn showed 56 common genes were differentially expressed in these six comparisons (Figure 4D). Furthermore, 421, 527, 910, 903, 219 and 190 DEGs were uniquely identified in the comparisons of D96_vs_C96, D163_vs_C163, R96_vs_D96, R163_vs_D163, R96_vs_C96 and R163_vs_C163, respectively.
The DEGs between La-96 and La-163 were analyzed under three treatments to identify which genes were differentially expressed between the rice lines. There were 6895 genes differentially expressed in total (Figure 4E). Among them, 2889 DEGs in C163_vs_C96, 3765 DEGs in D163_vs_D96, and 4097 DEGs in R163_vs_R96 showed an increase in DEGs between two rice lines from normal conditions to drought stress and subsequent recovery treatments. Within these DEGs, 1198 were commonly identified in C163_vs_C96, D163_vs_D96, and R163_vs_R96 (Figure 4F). There were 890, 1525 and 1822 DEGs uniquely identified in C163_vs_C96, D163_vs_D96, and R163_vs_R96, respectively. The increasing DEGs between the two rice lines from normal conditions to drought stress and following rewatering treatment might be part of the reason for the differences in their response to drought stress.

3.4.2. GO Annotation under Drought Stress and Subsequent Recovery

GO annotation showed three classifications: biological process, cellular component, and molecular function (Figure S1). Most DEGs were enriched in metabolic and cellular processes in biological processes for six comparisons.

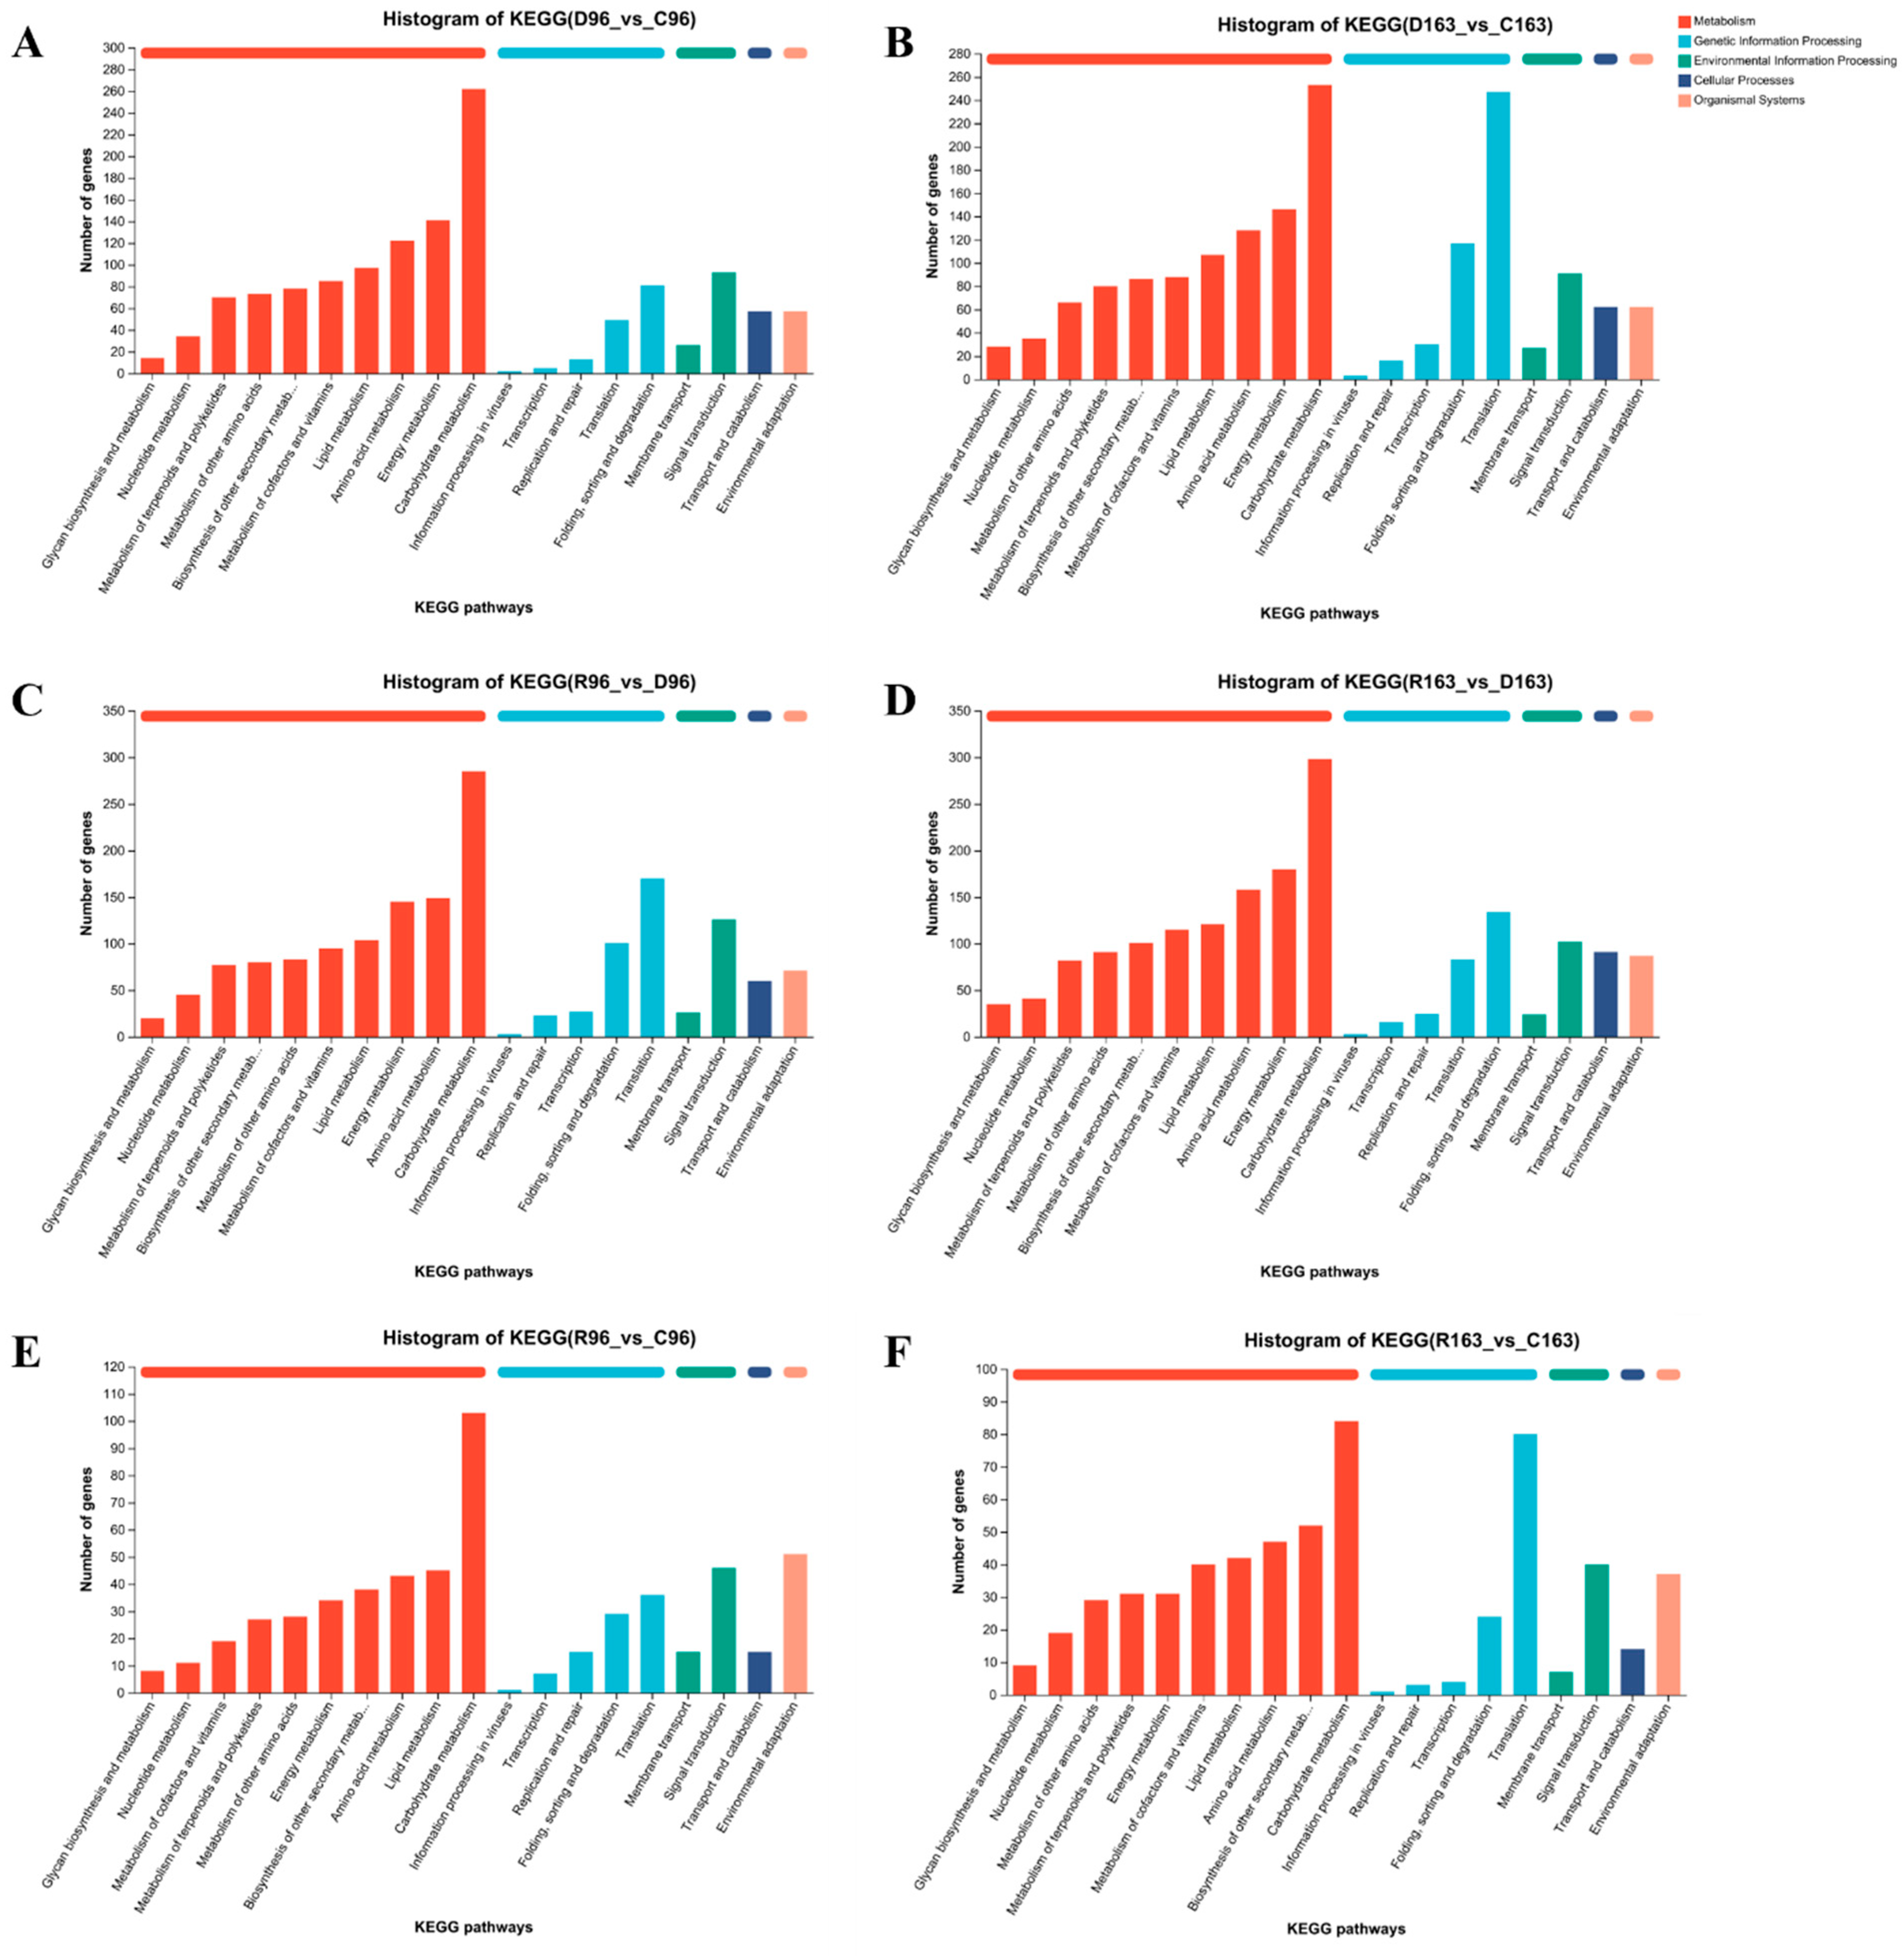
3.4.3. KEGG Pathway Annotation under Drought Stress and Subsequent Recovery

The KEGG is a database for systematically analyzing gene function, associated genome, and functional information. Using an R script, KEGG analysis of pathway enrichment was carried out on genes in gene concentration. In ten metabolism pathways under different water treatments or between rice lines, the KEGG pathway was significantly enriched, where the p-value was less than 0.05 (Figure 5). Several DEGs were also involved in genetic information processing (especially the translation pathway), environmental data processing, the cellular process, and organismic systems. Among the DEGs involved in physiological metabolisms, 60% were categorized into four metabolism pathways: carbohydrate metabolism, amino acid metabolism, energy metabolism, and lipid metabolism.

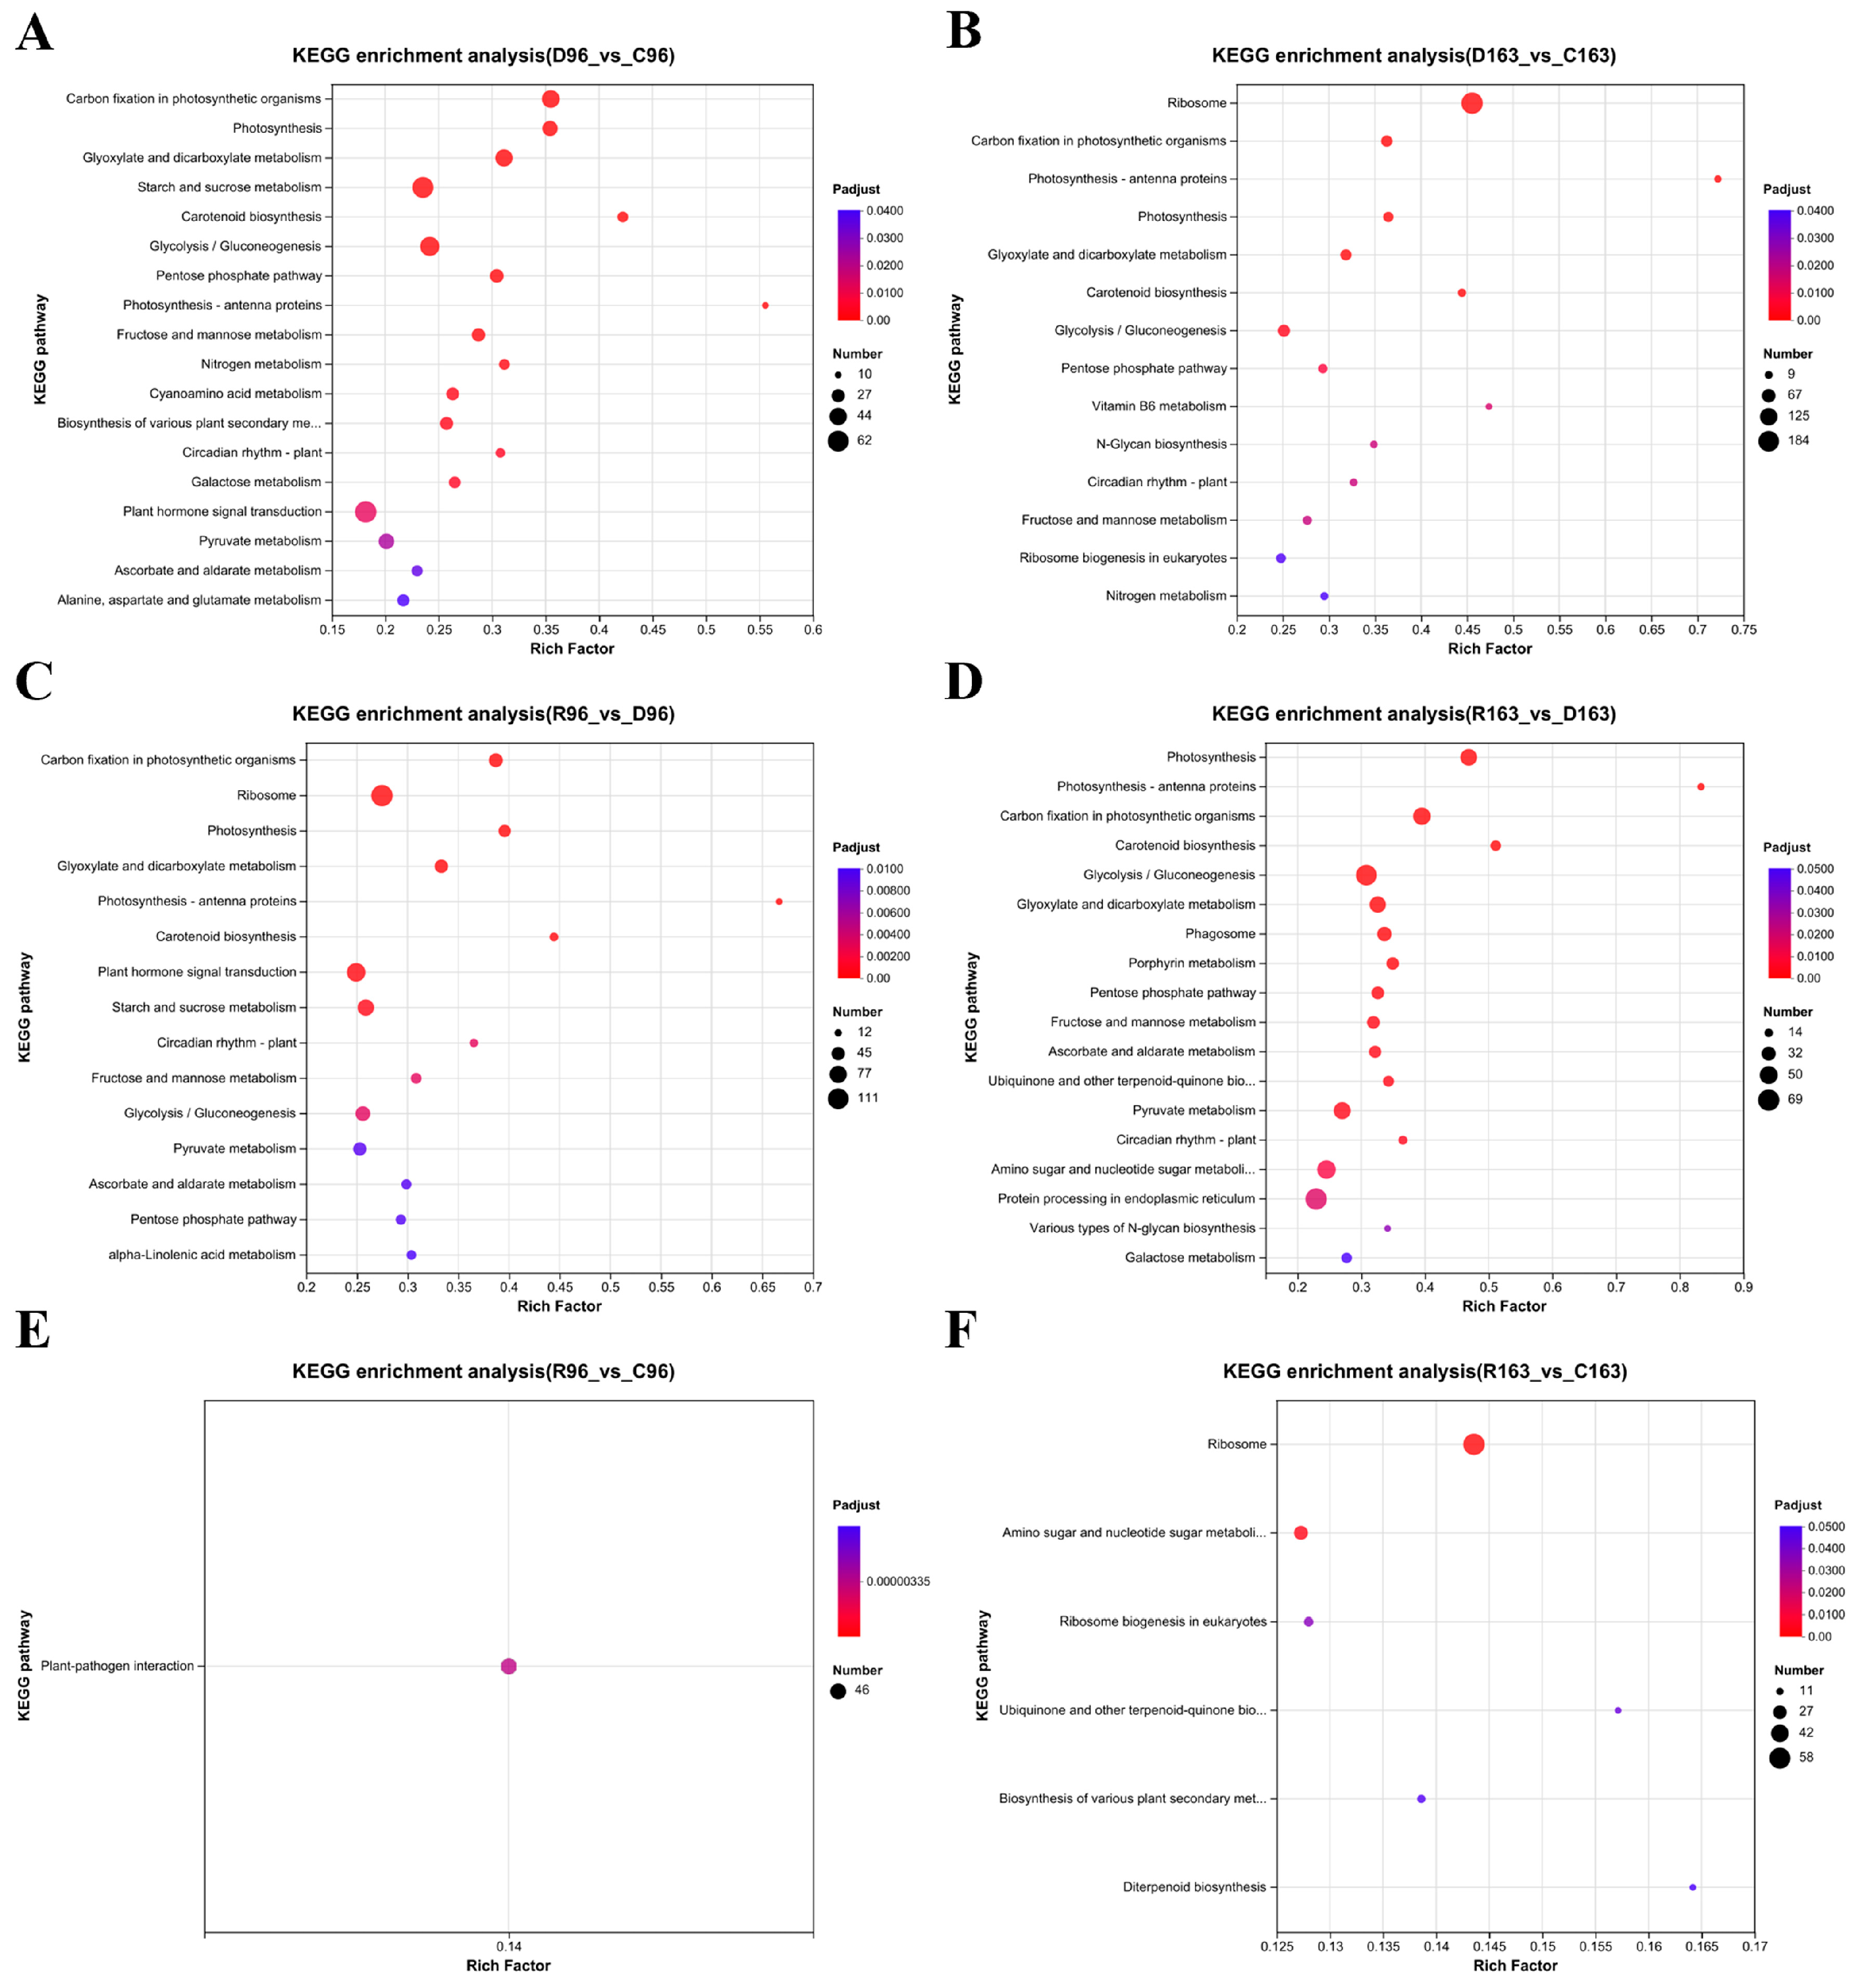
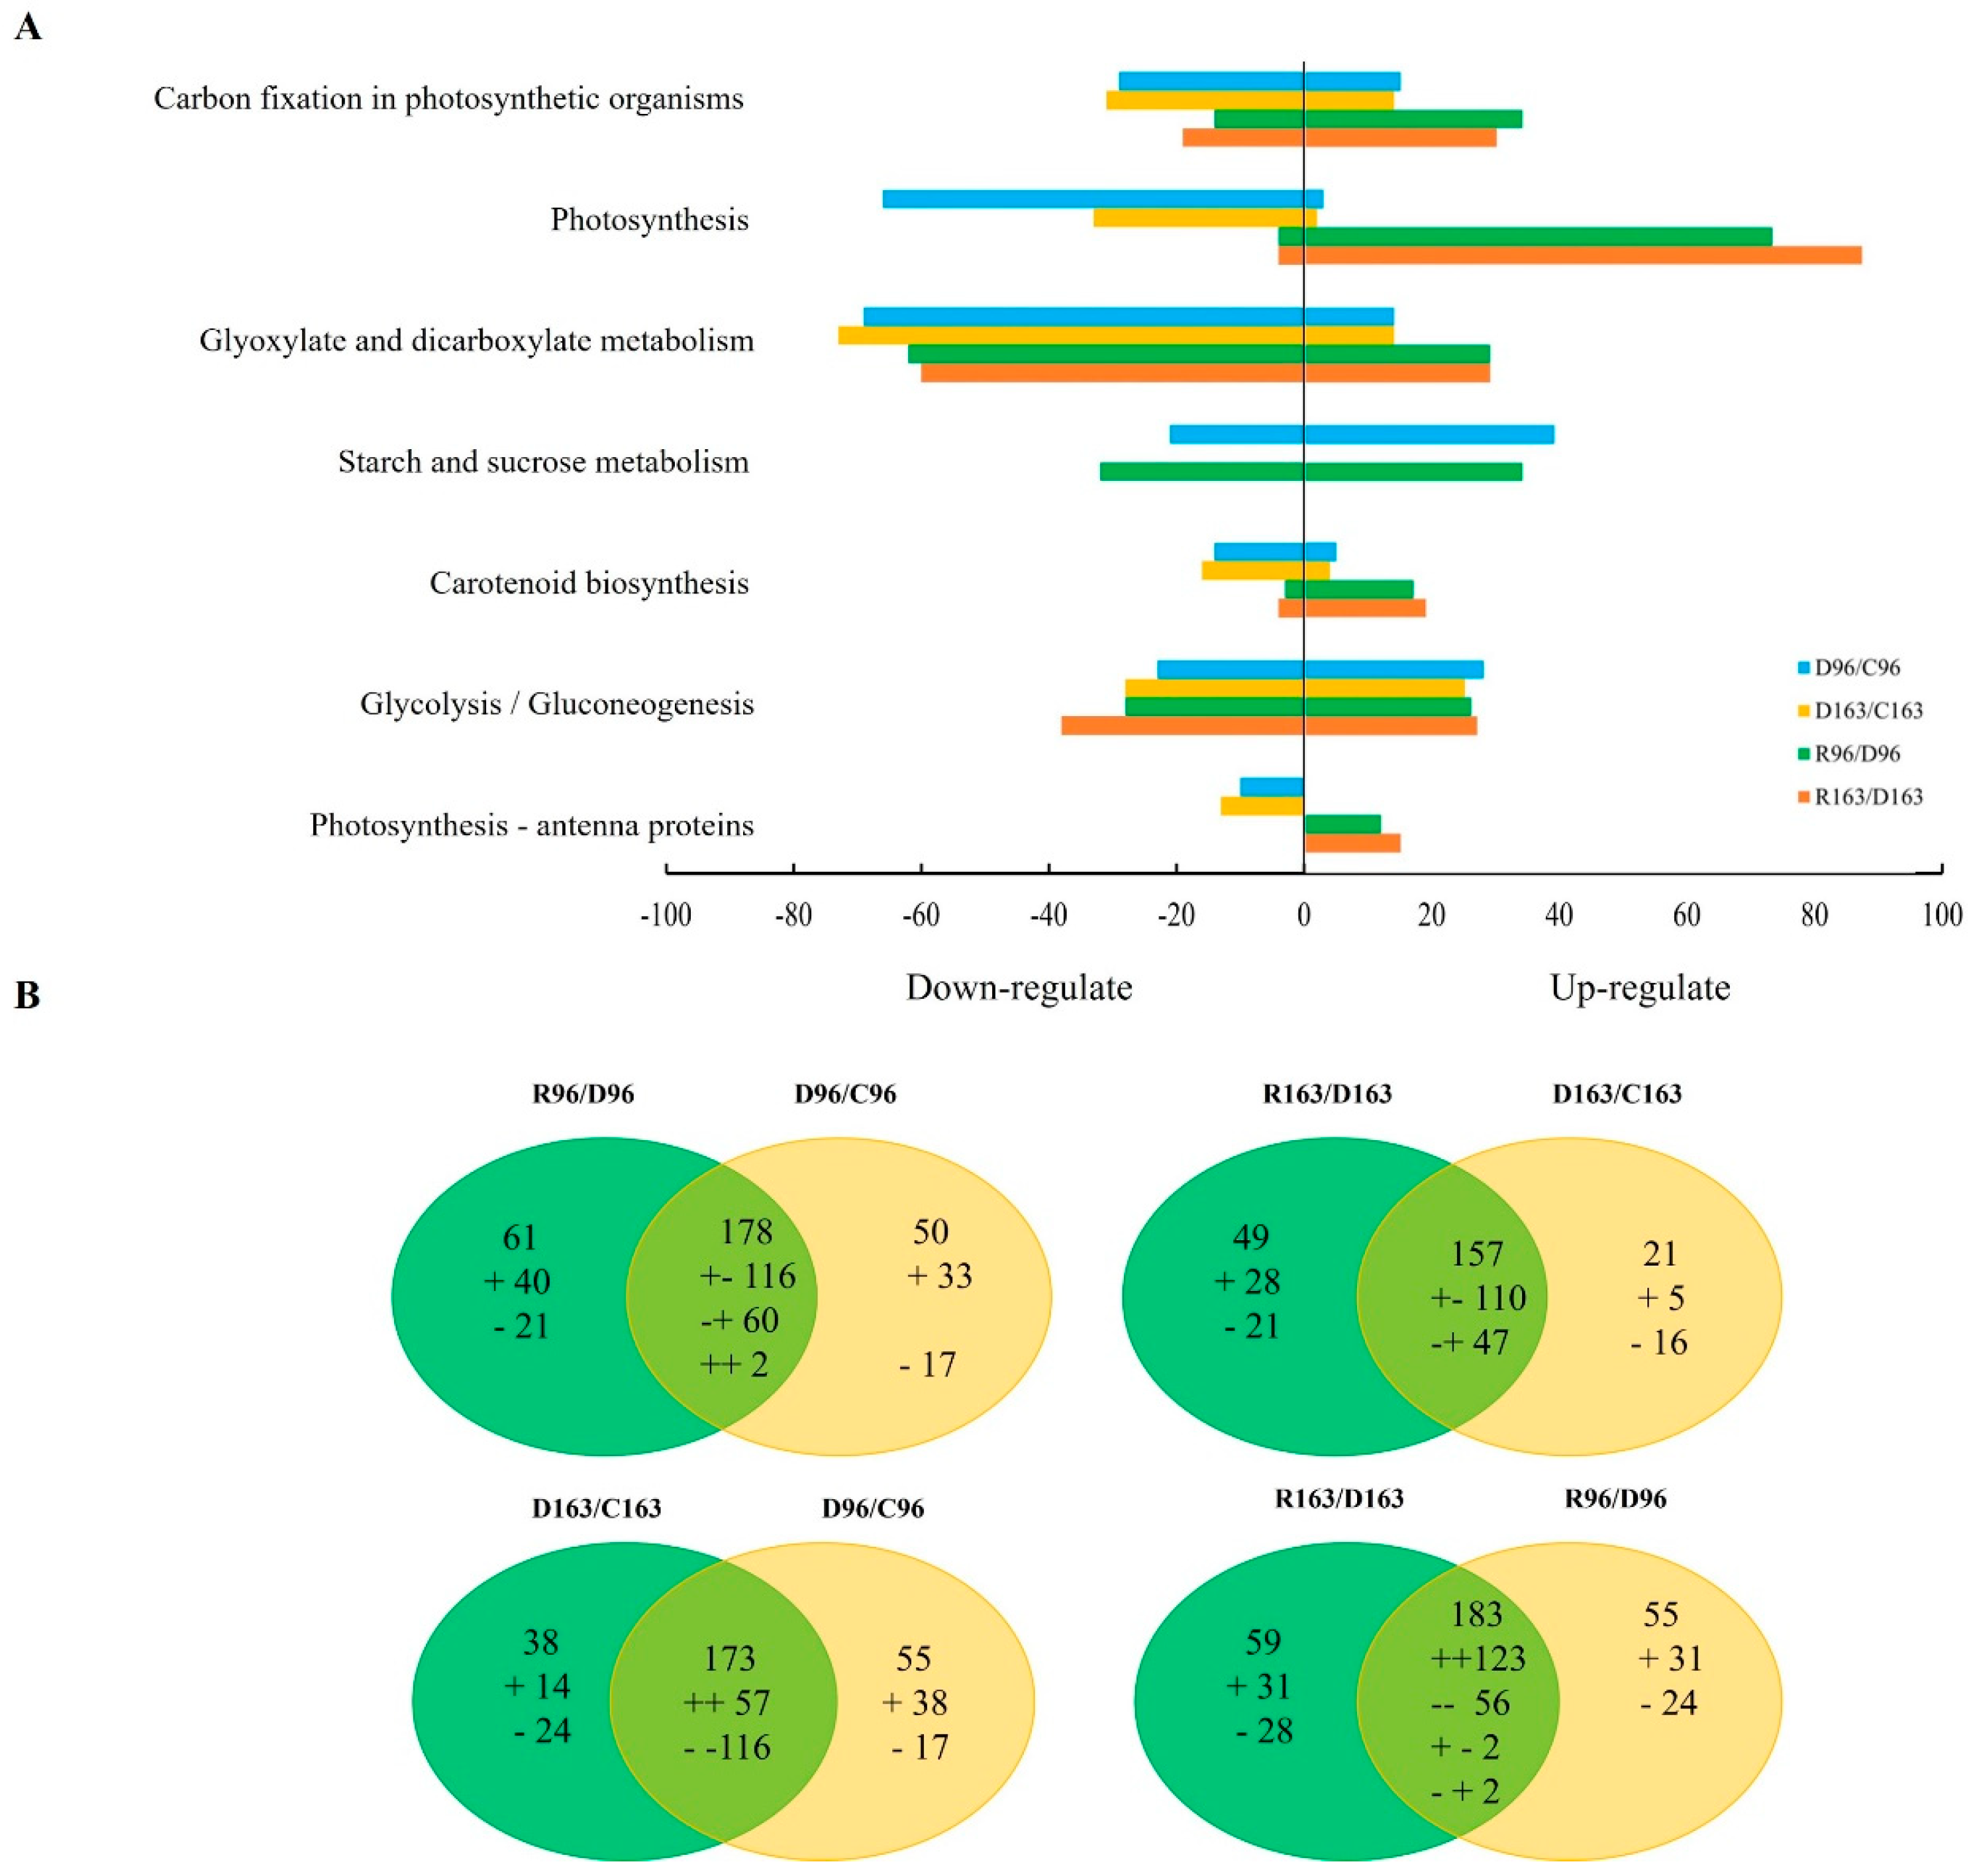
3.4.4. KEGG Pathway Enrichment under Drought Stress and Subsequent Recovery

We used KEGG pathways and KEGG annotations to map the DEGs and identify the major pathways in the leaves of two rice lines subjected to varying water treatments. The results showed differences in KEGG enrichment genes between rice lines under different water treatments when the p value was less than 0.05 (Figure 6). From normal conditions to drought stress, 563 DEGs were significantly enriched in eighteen pathways in La-96, including sixteen metabolisms, one organismal system, and one environmental information processing (Figure 6A). The same KEGG analysis exhibited that 536 DEGs in La-163 were enriched in fourteen pathways, including thirteen metabolisms, two genetic information processing, and one organismal system (Figure 6B). It is worth mentioning that 184 DEGs involved in the ribosome pathway in La-163 were not identified in La-96. Among them, 168 DEGs were upregulated in D163/C163, function in translation, ribosomal structure, and biogenesis (Table S4). From drought recovery to normal water conditions, a number of DEGs overlapped in two rice lines. A total of 648 DEGs were significantly involved in fifteen pathways in La-96, including twelve metabolisms (Figure 6C). 644 DEGs were enriched in eighteen pathways in La-163 (Figure 6D).
KEGG enrichment analysis showed that only 46 DEGs were significantly enriched in the plant–pathogen interaction pathway in La-96 under recovery compared to the control, while 138 DEGs were identified in La-163 and enriched in six pathways, including ribosome, amino-sugar, and nucleotide-sugar metabolisms, ribosomic biogenesis in eukaryotes, and so on (Figure 6E,F). We hypothesized that these genes might comprise a significant part of recovery to normal growth and development after drought stress.

3.4.5. Enriched DEGs for KEGG Pathway under Drought Stress and Successive Recovery

In recognition of the critical metabolic pathways that responded to recovery and drought, the enrichment analysis was conducted and verified that responsive DEGs were primarily enriched to seven metabolic pathways: carbon fixation in the photosynthetic plants (map00710), photosynthesis (map00195), dicarboxylate and glyoxylate metabolism (map00630), starch-sucrose metabolism (map00500), biosynthesis of carotenoids (map00906), glycolysis/gluconeogenesis (map00010), and photosynthesis-antenna proteins (map00196). In D96_vs_C96, 228 DEGs (95 up and 133 downregulated) and D163_vs_C163, 178 DEGs (52 up and 126 downregulated), respectively (Figure 7A). From drought recovery to normal water treatment, there were 219 DEGs (151 up and 68 downregulated) and 206 DEGs (138 up and 68 downregulated) in R96_vs_D96 and R163_vs_D163, respectively. Drought stress and recovery induced a set of DEGs. To find out the transcriptomic dynamics from drought to recovery, we analyzed the common and specific DEGs in drought and recovery of La-96 and La-163.

3.4.6. DEGs Induced by Drought Stress and Subsequent Recovery in La-96

There were 178 genes commonly regulated by drought and subsequent recovery in La-96 (Figure 7B). Among them, 116 genes were downregulated by drought and upregulated by the recovery in La-96, and 33 were categorized as related to photosynthesis. There were 60 genes upregulated and downregulated, respectively, by drought and recovery, and 22 were involved in starch and sucrose metabolism. Moreover, two genes were commonly upregulated by drought and recovery: an abscisic acid 8′-hydroxylase gene and an ATP-dependent 6-phosphofructokinase gene. In total, these results displayed a decline of gene expression under drought stress, especially those genes involved in photosynthesis metabolism, and an increase when recovering to normal water conditions.
When comparing the DEGs between the above two comparisons, the expression of a total of 50 genes was significantly changed and detected explicitly in D96_vs_C96 rather than in R96_vs_D96, showing that those genes induced by drought stress exhibited a signficant expression level or a little changed during recovery to normal water conditions (Figure 7B). Among these genes, 19 out of 33 were upregulated and categorized into starch, sucrose metabolism, and glycolysis/gluconeogenesis, including nine glucosidase genes. Eighteen genes related to several metabolic pathways were downregulated by drought stress, and the expression increased little during recovery. Conversely, there were 40 upregulated and 21 downregulated genes in R96_vs_D96 rather than D96_vs_C96 (Figure 7B). One-third of those genes are categorized to be related to starch and sucrose metabolism, and the upregulated genes include six glucosidase genes. The primary function of the significant class of enzymes known as glucosidases (belong to the glycoside hydrolase family) is to hydrolyze glucoside bonds and release glucose as an outcome. The enzyme glucosidase is crucial in the metabolic process of sugars in organisms. These results showed that the carbohydrate hydrolytic metabolism increased in La-96 under drought and subsequent recovery.

3.4.7. DEGs Induced by Drought Stress and Subsequent Recovery in La-163

There were 157 DEGs commonly induced by drought and recovery in La-163 (Figure 7B). Within them, 110 genes were downregulated by drought stress but upregulated by recovery; half of them were involved in the pathway of photosynthesis and photosynthesis-antenna proteins. Forty-seven genes were upregulated by drought and downregulated by recovery, containing 22 DEGs related to the glycolysis/gluconeogenesis pathway.
In addition, 21 DEGs, including 16 downregulated genes, were detected in La-163 only under drought stress. From drought recovery to normal water conditions, 49 more DEGs were explicitly identified in R163_vs_D163. Among those genes, there were 28 upregulated genes mainly categorized into the photosynthesis and carotenoid biosynthesis pathways, while the downregulated genes were primarily classified into the glycolysis/gluconeogenesis pathway. These results displayed that drought stress depressed photosynthesis but activated the glycolysis/gluconeogenesis metabolic pathway; from drought recovery to normal water conditions, genes involved in the above two pathways showed opposite regulation.

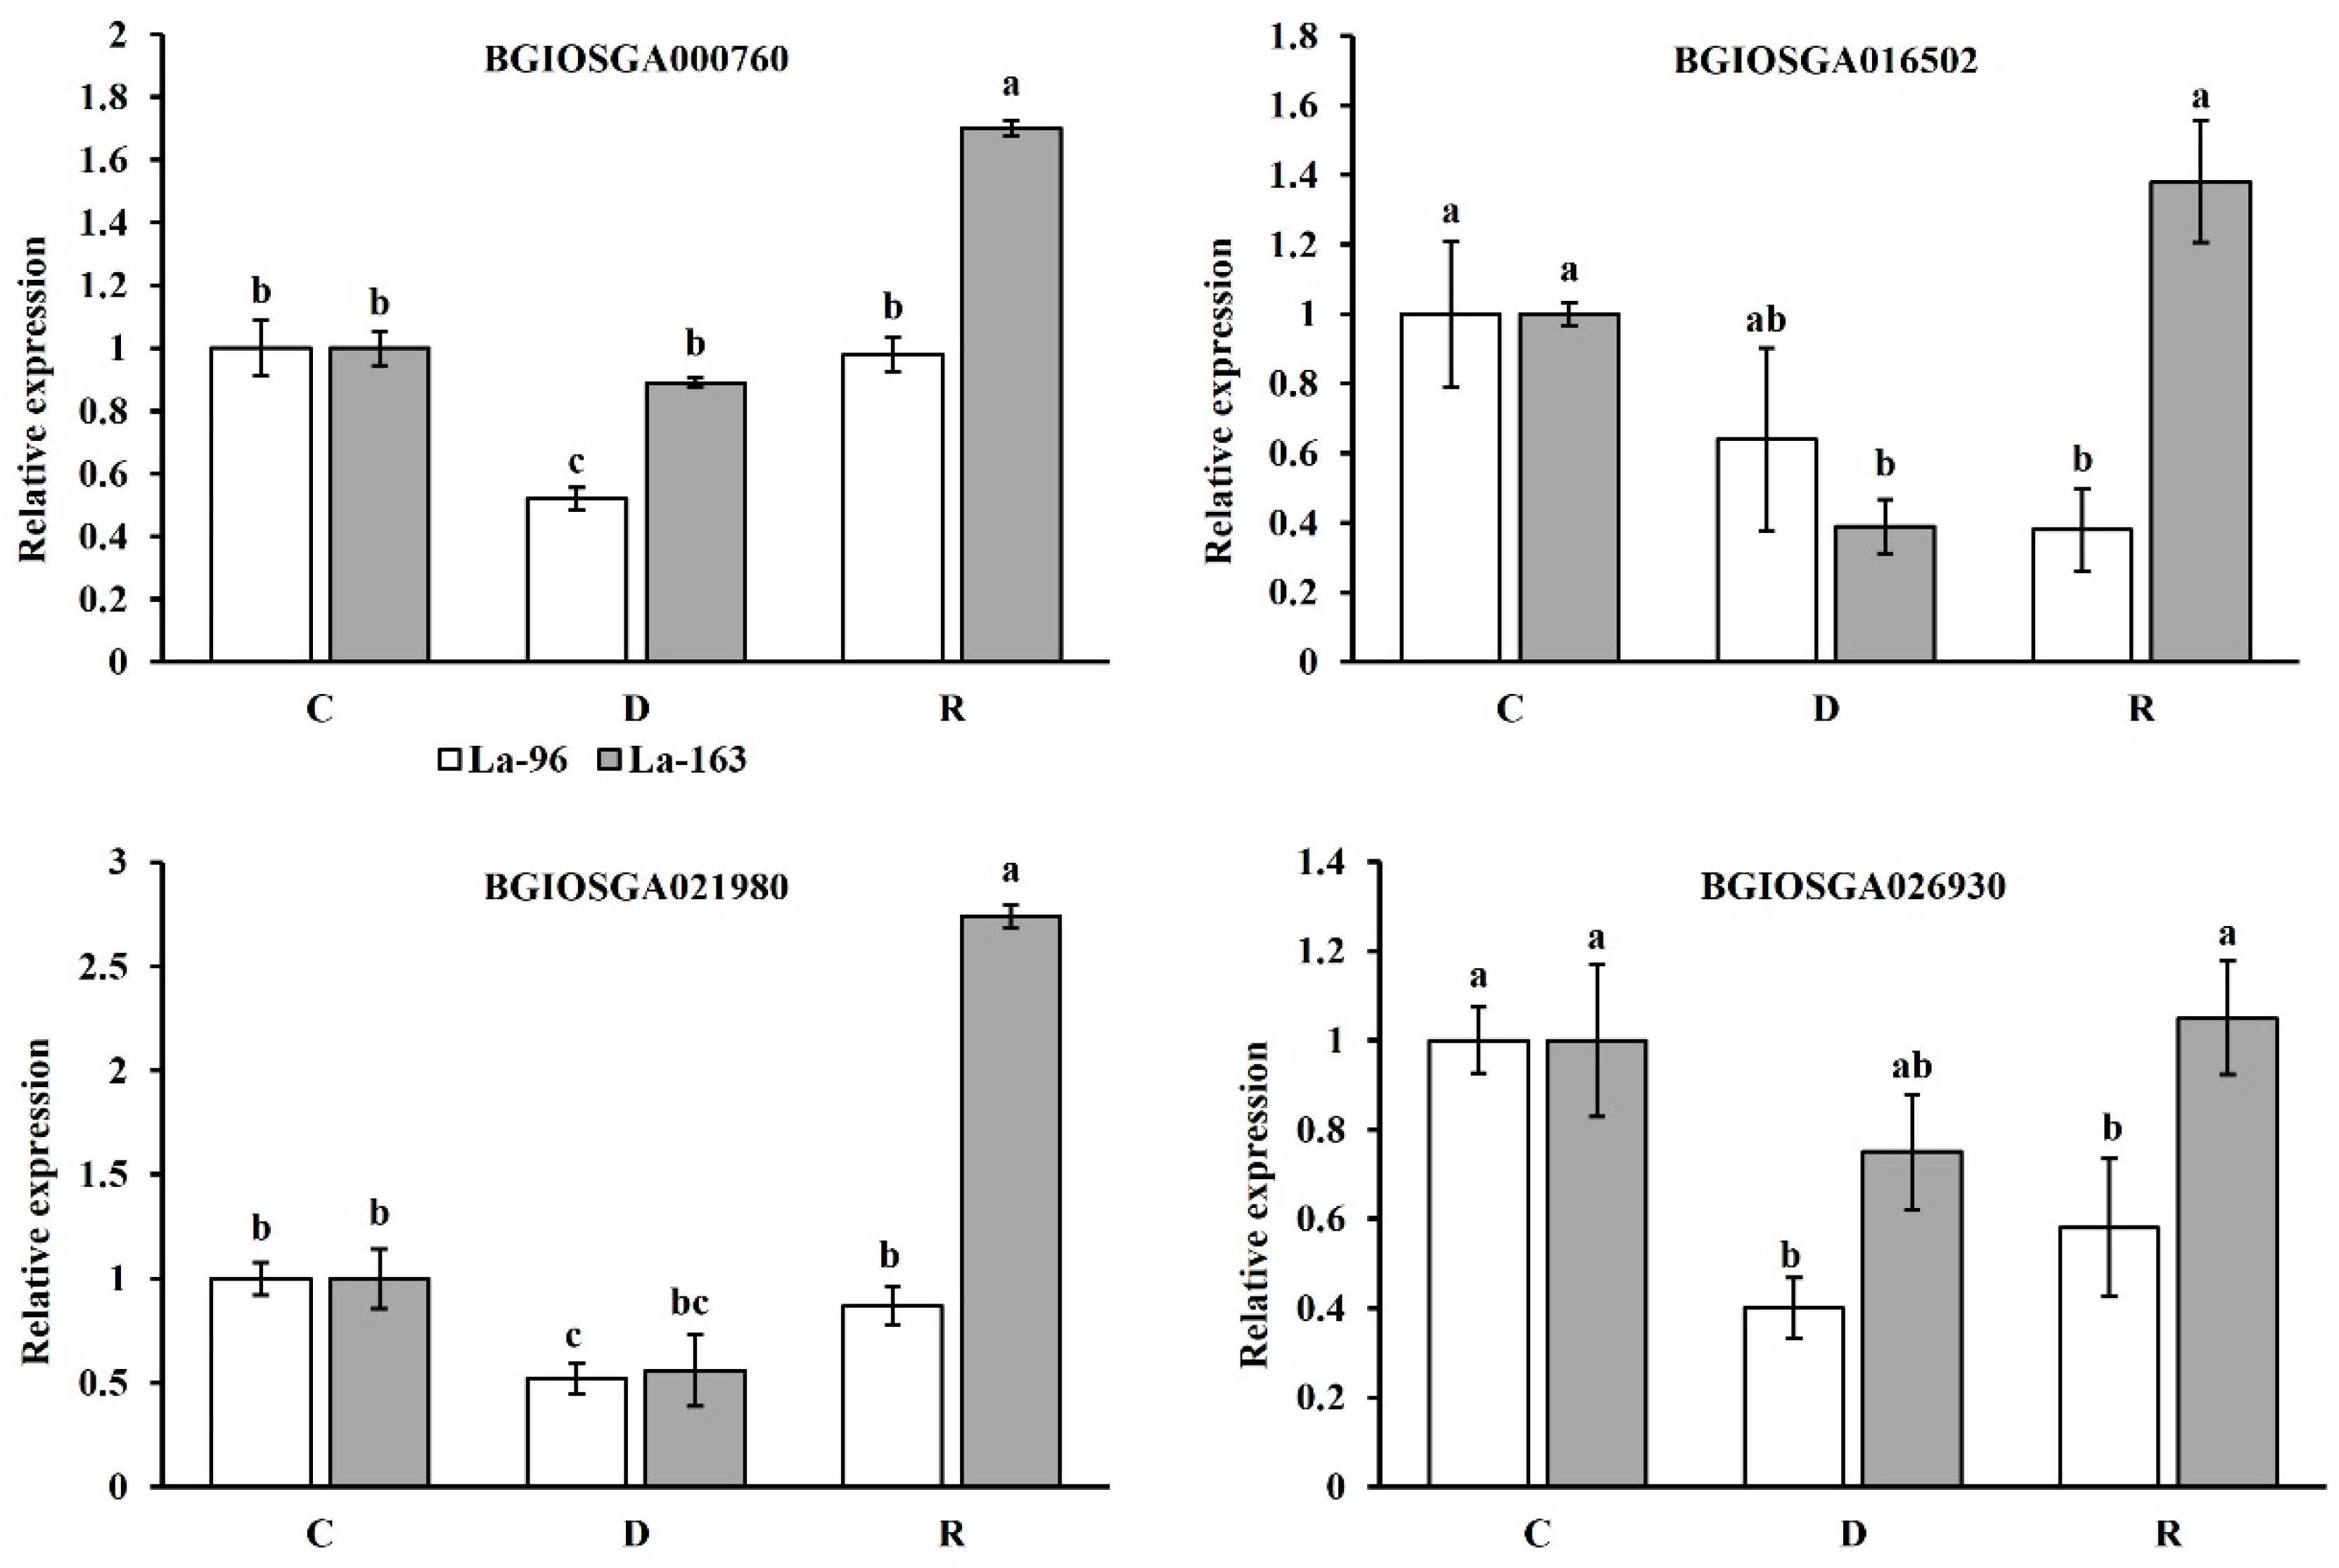
3.4.8. Common DEGs in Two Rice Lines under Drought and Recovery

DEGs from all samples were further analyzed to identify the common genes up or downregulated by drought and the subsequent recovery in various rice lines. In both rice lines, we identified 173 genes often induced by drought stress (Figure 7B, Table S5), comprising 116 downregulated and 57 upregulated genes. Among them, 39 downregulated DEGs were involved in the photosynthesis pathway, and 19 downregulated DEGs were involved in glyoxylate and dicarboxylate metabolism, indicating a common suppression of the photosynthetic process on rice by drought stress. Otherwise, 19 out of 57 upregulated DEGs were categorized into starch and sucrose metabolism pathways, which functioned on carbohydrate transport and metabolism.
From drought recovery to normal water conditions, most genes were upregulated to recover to growth. Altogether, 123 upregulated and 56 downregulated genes were commonly detected in two rice lines (Table S6). Forty-five of these upregulated genes were functionally classified to photosynthesis metabolism, indicating a rebooting in photosynthesis.

3.4.9. Specific DEGs in Two Rice Lines under Drought and Recovery

We compared DEGs under drought and recovery between two rice lines to identify rice line-specific regulated genes. Fifty-two DEGs were detected explicitly under drought stress in La-96 (Table S7). Among them, 18 upregulated genes were categorized into starch and sucrose metabolic pathways, including six beta-glucosidases and three isoamylases. An ADP-glucose pyrophosphorylase small subunit (ACY56064.1) gene (BGIOSGA030039) was upregulated with more than five time changes. Eleven upregulated genes were categorized to glycolysis/gluconeogenesis pathway, including four ATP-dependent 6-phosphofructokinases and two pyruvate kinases. These findings established that drought stress in La-96 reduced energy and carbohydrate metabolism and downregulated most genes linked to carbon fixation in photosynthetic plants, photosynthesis, glyoxylate, and dicarboxylate metabolism pathways.
From drought stress recovery to normal water conditions, 49 DEGs were identified explicitly in La-96 (Table S8) compared with La-163, and 26 of those genes were related to starch and sucrose metabolism, including 16 upregulated genes and 10 downregulated genes. In other words, 38 DEGs (14 upregulated and 24 downregulated) were identified explicitly in La-163 (Table S9) under drought stress compared to La-96. The downregulated genes are mainly categorized into photosynthesis, glycolysis/gluconeogenesis, glyoxylate, and dicarboxylate metabolism. An NADP-dependent malic enzyme gene (BGIOSGA004372) and one phosphoenolpyruvate carboxylase 2 gene (BGIOSGA027083) were surprisingly upregulated in D163_vs_C163. The NADP-dependent malic enzyme gene is located in the chloroplast and functions by oxidizing malic acid to pyruvate. It simultaneously produces NADPH (NADH), which could eliminate the photorespiratory loss of CO2 that occurs under abiotic stress. The phosphoenolpyruvate carboxylase 2 gene (PPC2) is located in the cytoplasm. Phosphoenolpyruvate (PEP) is carbonylated to produce oxaloacetate, a four-carbon dicarboxylic acid supply for the tricarboxylic cycle.
For the specially identified 56 DEGs under recovery in La-163, all DEGs related to photosynthesis and carotenoid biosynthesis pathways were upregulated, including 11 DEGs categorized to photosynthesis and 6 to carotenoid biosynthesis (Table S10). Among them were fourteen hypothetical protein genes, two chlorophyll a-b binding protein genes, and a cytochrome-c6 gene (which performs the role of an electron carrier in oxygenic photosynthesis, transferring electrons between membrane-bound cytochrome b6-f and photosystem I).
Furthermore, among the specifically detected DEGs in La-163 under recovery, five four-time changed DEGs were simultaneously identified under drought stress in both rice lines. These genes encode five proteins, namely, formamidase (BGIOSGA000760), enolase (BGIOSGA011046), chlorophyll a-b binding protein P4 (BGIOSGA026930), zeaxanthin epoxidase (BGIOSGA016502), and enolase 1 (BGIOSGA021980). Except for the enolase gene, four were significantly downregulated by drought stress for both rice lines and only upregulated in La-163 from drought to recovery. qRT-PCR results also confirmed that the expression of those genes was consistent with the transcriptome results (Figure 8). As a light receptor, the chlorophyll a-b binding protein P4 takes in and transfers excitation energy to photosystems that it is intimately connected to.

4. Discussion

Drought stress affects the crucial growth stages of rice plants and extensively hinders physiological processes, growth, and development, resulting in a significant reduction in yield. Drought at maximum tillering, panicle initiation, and grain filling increased the spikelet sterility percentage, leading to less crop yield and seed-setting rate [26]. Zhang et al. [27] reported that the decrease in seed-setting rate (SR) induced by drought stress contributed to an increased rice yield reduction. In the present study, after seven days of drought stress in the booting stage, the SR of two comparative RIL rice lines decreased to 22.75% and 79.33%, respectively. This effect on SR could result in a decline in the ability to assimilate translation into reproductive parts [28]. Drought tolerance depends on how the plants receive the stimulus, transmit it, and respond to it through different cellular and metabolic modifications to acclimate the stress [29]. Drought stress decreased the RWC and photosynthesis efficiency of rice leaves. This study found that the RWC, Pn, Tr, and Gs of La-163 recovered to normal levels after rewatering for three days. The quick recovery metabolism may determine the seed-filling results.
RNA-seq analysis was conducted using the above contrasting rice lines under drought and subsequent recovery to identify the key metabolisms in response to drought at the booting stage. A total of 16,051 genes were identified, and a total of 10,566 genes were differentially expressed among three treatments and two rice lines. The KEGG pathway showed DEGs were significantly enriched in ten metabolism pathways under different treatments or between rice lines, and 60% of them were categorized into four metabolism pathways, including carbohydrate metabolism, energy metabolism, amino acid metabolism, and lipid metabolism. Several DEGs were also involved in genetic information processing (especially the translation pathway), environmental information processing, cellular processes, and organismal systems.
KEGG annotations showed differences in KEGG enrichment genes between rice lines under different treatments when the p-value was less than 0.05. The results mentioned many DEGs annotated ribosomal-related pathways in La-163 under drought stress. Ribosome synthesis is necessary for plant growth and environmental adaptation. For instance, Yang et al. [30] found the upregulated non-coding RNA involved in the ribosome pathway in the upland rice genotype to enhance drought tolerance. Ribosome protein genes are specific and are known for playing a universal part in developing ribosomal complexes and facilitating protein synthesis [31]. Ribosomal complex needs 60–80 genes for encoding in all the eukaryotes [32,33]. The genes are differently controlled by the ecological factors that directly or indirectly affect plant development and transcriptional regulation of ribosome protein genes and, ultimately, ribosome biogenesis [34]. Ribosomes are a vital part of cell replication, needed for protein synthesis, and are integral to control cell development and growth [35]. Our study has focused on the upregulation of multiple ribosome proteins in La-163 under abiotic stress, like 60S ribosomal protein L36, 60S ribosomal protein L37, 40S ribosomal protein S21, etc., that accelerates the protein synthesis and lessens the damage of drought stress.
Furthermore, the main metabolic processes that respond to drought stress and subsequent recovery were analyzed. Most DEGs were identified as involved in seven metabolic pathways: photosynthesis, carbon fixation in photosynthetic organisms, glyoxylate and dicarboxylate metabolism, starch and sucrose metabolism, carotenoid biosynthesis, glycolysis/gluconeogenesis and photosynthesis-antenna proteins. This study found that most DEGs involved in the pathway of photosynthesis, carbon fixation in photosynthetic organisms, and glyoxylate and dicarboxylate metabolism were significantly downregulated in both rice lines by drought. When rewatering, those or more DEGs involved in the pathways of photosynthesis carbon fixation in photosynthesis organisms were upregulated.
Photosynthesis is the most significant metabolic process in carbon assimilation in plants. Reduced or downregulated photosynthesis is the significant response of plants towards drought stress [36,37]. The photosynthesis of both rice lines was depressed by drought but upregulated when rewatering. From drought recovery to normal water conditions, eleven more DEGs were specifically upregulated (recovered to basal levels) in La-163 compared with La-96. This result demonstrates that inhibition of photosynthesis is the major effect of drought responsiveness in rice leaves; the photosynthesis pathway of La-163 was more activated than La-96 under drought and subsequent recovery. The reactivated genes after rewatering in La-163 included a photosystem II repair protein PSB27-H1, photosystem II 10 kDa polypeptide, photosystem I reaction center subunit XI, PsbP-like proteins, and chlorophyll a-b binding proteins. PSB27 is involved in the repair of photodamaged photosystem II [38], and the chlorophyll a-b binding proteins function as light receptors, working on capturing and delivering excitation energy to photosystems with which it is closely associated. Those upregulated DEGs can partially alleviate the inhibition of drought on photosynthesis and ensure the material demand of plant growth under recovery. In addition, all genes involved in the pathway of photosynthesis-antenna proteins were downregulated by drought and upregulated by recovery (Table S10). La-163 displayed more DEGs in this pathway, showing a more activated response to drought and rapid recovery after rewatering, which may play an important role in the subsequent plant growth.
A number of DEGs detected in La-96 compared to La-163 were involved in starch and sucrose metabolism. Two-thirds were upregulated under drought or recovery, including genes encoding beta-glucosidases, isoamylases, probable trehalose-phosphate phosphatases, endoglucanases, trehaloses, etc. Glucosidase is an indispensable enzyme in the sugar metabolism pathway of organisms. A large class of enzymes in the glycoside hydrolase family function as hydrolyzing glucoside bonds, releasing glucose as a product. Beta-glucosidase is a widely present enzyme in organisms, which can specifically catalyze beta-glucoside hydrolysis to release glucose in beta-glucoside. Trehalose was linked with drought tolerance [39,40]. Over-expression of trehalose-6-phosphate phosphatase, a primary enzyme gene of the trehalose metabolism, enhanced trehalose accumulation in rice and maize and subsequently increased their drought tolerance significantly, as well as their performance under well-watered conditions via regulating photosynthesis [39,40]. These upregulated genes function in starch and sucrose metabolism La-96 metabolism, enhancing carbohydrate hydrolytic metabolism and helping release extra soluble sugars (sucrose, glucose, and fructose) to resist drought. Soluble sugars help conserve leaf water concentration and osmotic adjustments in plants that survive drought stress [41,42]. Xu et al. [42] also found that drought particularly increases soluble sugar concentration in the leaves and roots of rice varieties prone to drought but not in drought-resistant varieties, which is coherent with our results.

5. Conclusions

In this study, two contrasting rice RIL lines, including La-96 with low SR induced by drought (the susceptible one) and La-163 with high SR under drought (the tolerant one), were used to characterize the differences of leaf transcriptome dynamics under seven days of drought at the booting stage and three days after rewatering using high-throughput RNA sequencing. Most DEGs were commonly detected in both rice lines under drought and recovery treatments. The specific identified DEGs between the two rice lines are primarily involved in the ribosome and the metabolic pathway of photosynthesis, starch, and sucrose metabolism. The activated and rapidly responsive DEGs characteristically detected under recovery in the tolerant rice line might play a key role in regulating subsequent growth. The results obtained in this study could extend our understanding of the molecular mechanisms of drought tolerance and recovery regulation in rice.

Supplementary Materials

The following supporting information can be downloaded at: https://www.mdpi.com/article/10.3390/agronomy14102247/s1, Figure S1. GO annotation analysis. Table S1. Summary of RNA sequencing data and mapped reads to the reference genome (Oryza sativa L.). Table S2. Statistical table of RNA-seq data. Table S3. Different expressed gene (DEGs) statistic. Table S4. Specific DEGs involved in the pathway of ribosome identified in La-163 under drought stress. Table S5. Common DEGs in two rice lines under drought. Table S6. Common DEGs in two rice lines under recovery. Table S7. Specific DEGs in La-96 under drought. Table S8. Specific DEGs in La-96 under recovery. Table S9. Specific DEGs in La-163 under drought. Table S10. Specific DEGs in La-163 under recovery.

Author Contributions

Conceptualization, Q.Z.; Data curation, M.A.H. and W.F.; Formal analysis, J.W.; Funding acquisition, S.W.; Investigation, W.F. and M.A.H.; Methodology, Q.Z. and Y.L.; Project administration, S.W. and J.W.; Software, Y.L.; Supervision, S.W. and J.W.; Validation, Q.Z. and M.A.H.; Visualization, Y.L. and W.F.; Writing—original draft, Q.Z.; Writing—review & editing, Q.Z., M.A.H. and S.W. All authors have read and agreed to the published version of the manuscript.

Funding

The research was supported by the Anhui Provincial Key Research and Development Program (2022h11020011), Anhui Natural Science Foundation Project (2208085QC82), Young Talent Project of Anhui Academy of Agricultural Sciences (QNYC-202208, QNYC-202109), and the open project program (SKL-KF202301) of State Key Laboratory of Crop Gene Exploration and Utilization in Southwest China.

Data Availability Statement

The raw data supporting the conclusions of this article will be made available by the authors on request.

Conflicts of Interest

The authors declare no conflicts of interest.

References

  1. Hassan, M.A.; Dahu, N.; Hongning, T.; Qian, Z.; Yueming, Y.; Yiru, L.; Shimei, W. Drought Stress in Rice: Morpho-Physiological and Molecular Responses and Marker-Assisted Breeding. Front. Plant Sci. 2023, 14, 1215371. [Google Scholar] [CrossRef] [PubMed]
  2. Zhu, Q.; Li, Y.; Hassan, M.A.; Fang, W.; Wang, S. Comparative Physiological and Transcriptomic Characterization of Rice (Oryza Sativa L.) Root Seedlings under Phosphorus Deficiency. Plant Stress. 2024, 12, 100508. [Google Scholar] [CrossRef]
  3. At, L.; Core, T.H.E.; Disruption, O.F.; Action, P. Responding to the Impact of the COVID-19 Outbreak on Food Value Chains through Efficient Logistics; FAO: Rome, Italy, 2020. [Google Scholar] [CrossRef]
  4. Donde, R.; Kumar, J.; Gouda, G.; Gupta, M.K.; Mukherjee, M.; Baksh, S.Y.; Mahadani, P.; Sahoo, K.K.; Behera, L.; Dash, S.K. Assessment of Genetic Diversity of Drought Tolerant and Susceptible Rice Genotypes Using Microsatellite Markers. Rice Sci. 2019, 26, 239–247. [Google Scholar] [CrossRef]
  5. Simkhada, K.; Thapa, R. Rice Blast, A Major Threat to the Rice Production and Its Various Management Techniques. Turk. J. Agric.-Food Sci. Technol. 2022, 10, 147–157. [Google Scholar] [CrossRef]
  6. Oladosu, Y.; Rafii, M.Y.; Samuel, C.; Fatai, A.; Magaji, U.; Kareem, I.; Kamarudin, Z.S.; Muhammad, I.; Kolapo, K. Drought Resistance in Rice from Conventional to Molecular Breeding: A Review. Int. J. Mol. Sci. 2019, 20, 3519. [Google Scholar] [CrossRef] [PubMed]
  7. Yi, Y.; Hassan, M.A.; Cheng, X.; Li, Y.; Liu, H.; Fang, W.; Zhu, Q.; Wang, S. QTL Mapping and Analysis for Drought Tolerance in Rice by Genome-Wide Association Study. Front. Plant Sci. 2023, 14, 1223782. [Google Scholar] [CrossRef]
  8. Sandhu, N.; Kumar, A. Bridging the Rice Yield Gaps under Drought: QTLs, Genes, and Their Use in Breeding Programs. Agronomy 2017, 7, 27. [Google Scholar] [CrossRef]
  9. Bhandari, U.; Gajurel, A.; Khadka, B.; Thapa, I.; Chand, I.; Bhatta, D.; Poudel, A.; Pandey, M.; Shrestha, S.; Shrestha, J. Morpho-Physiological and Biochemical Response of Rice (Oryza Sativa L.) to Drought Stress: A Review. Heliyon 2023, 9, e13744. [Google Scholar] [CrossRef]
  10. Yang, X.; Wang, B.; Chen, L.; Li, P.; Cao, C. The Different Influences of Drought Stress at the Flowering Stage on Rice Physiological Traits, Grain Yield, and Quality. Sci. Rep. 2019, 9, 3742. [Google Scholar] [CrossRef]
  11. Lum, M.S.; Hanafi, M.; Rafii, Y.M.; Akmar, A. Effect of Drought Stress on Growth, Proline and Antioxidant Enzyme Activities of Upland Rice. J. Anim. Plant Sci. 2014, 24, 1487–1493. [Google Scholar]
  12. Sabin, K.; Bijay, S.; Amrit, B.; Raman, G.D.; Bhuwan, S.; Priyanka, N.; Man, S.S.; Prasad, G. Screening of Different Rice Genotypes against (Pyricularia Grisea) Sacc. InNatural Epidemic Condition at Seedling Stage in Chitwan, Nepal. Adv. Crop Sci. Technol. 2016, 4, 1–6. [Google Scholar] [CrossRef]
  13. Rahman, M.T.; Islam, M.T.; Islam, M.O. Effect of Water Stress at Different Growth Stages on Yield and Yield Contributing Characters of Transplanted Aman Rice. Pak. J. Biol. Sci. 2002, 5, 169–172. [Google Scholar] [CrossRef]
  14. Boonjung, H.; Fukai, S. Effects of Soil Water Deficit at Different Growth Stages on Rice Growth and Yield under Upland Conditions. 2. Phenology, Biomass Production and Yield. Field Crops Res. 1996, 48, 47–55. [Google Scholar] [CrossRef]
  15. Zhang, C.X.; Feng, B.H.; Chen, T.T.; Fu, W.M.; Li, H.B.; Li, G.Y.; Jin, Q.Y.; Tao, L.X.; Fu, G.F. Heat Stress-Reduced Kernel Weight in Rice at Anthesis Is Associated with Impaired Source-Sink Relationship and Sugars Allocation. Environ. Exp. Bot. 2018, 155, 718–733. [Google Scholar] [CrossRef]
  16. Xi, M.; Xu, Y.; Li, Z.; Hu, R.; Cheng, T.; Zhou, Y.; Tu, D.; Ji, Y.; Xu, X.; Sun, X.; et al. Progress and Challenges of Rice Ratooning Technology in Anhui Province, China. Crop Environ. 2023, 2, 81–86. [Google Scholar] [CrossRef]
  17. Xing, L.; Zhao, R.; Sun, H.; Li, M.; Tan, Z. Analysis of Drought Characteristics and Comparison of Historical Typical Years with 2022 Drought in the Yangtze River Basin. Nat. Hazards 2024, 120, 3699–3718. [Google Scholar] [CrossRef]
  18. Pantuwan, G.; Fukai, S.; Cooper, M.; Rajatasereekul, S.; O’Toole, J.C. Yield Response of Rice (Oryza Sativa L.) Genotypes to Drought under Rainfed Lowland: 3. Plant Factors Contributing to Drought Resistance. Field Crops Res. 2002, 73, 181–200. [Google Scholar] [CrossRef]
  19. Thalmann, M.; Pazmino, D.; Seung, D.; Horrer, D.; Nigro, A.; Meier, T.; Kölling, K.; Pfeifhofer, H.W.; Zeeman, S.C.; Santelia, D. Regulation of Leaf Starch Degradation by Abscisic Acid Is Important for Osmotic Stress Tolerance in Plants. Plant Cell 2016, 28, 1860–1878. [Google Scholar] [CrossRef]
  20. Dien, D.C.; Mochizuki, T.; Yamakawa, T. Effect of Various Drought Stresses and Subsequent Recovery on Proline, Total Soluble Sugar and Starch Metabolisms in Rice (Oryza Sativa L.) Varieties. Plant Prod. Sci. 2019, 22, 530–545. [Google Scholar] [CrossRef]
  21. Ravikumar, G.; Manimaran, P.; Voleti, S.R.; Subrahmanyam, D.; Sundaram, R.M.; Bansal, K.C.; Viraktamath, B.C.; Balachandran, S.M. Stress-Inducible Expression of AtDREB1A Transcription Factor Greatly Improves Drought Stress Tolerance in Transgenic Indica Rice. Transgenic Res. 2014, 23, 421–439. [Google Scholar] [CrossRef]
  22. Jin, J.; Duan, J.; Shan, C.; Mei, Z.; Chen, H.; Feng, H.; Zhu, J.; Cai, W. Ethylene Insensitive3-Like2 (OsEIL2) Confers Stress Sensitivity by Regulating OsBURP16, the β Subunit of Polygalacturonase (PG1β-like) Subfamily Gene in Rice. Plant Sci. 2020, 292, 110353. [Google Scholar] [CrossRef] [PubMed]
  23. Esmaeilzadeh-Moridani, M.; Esfahani, M.; Aalami, A.; Moumeni, A.; Khaledian, M. Profiling the Physiological Response of Upland and Lowland Rice (Oryza Sativa L.) Genotypes to Water Deficit. J. Crop Sci. Biotechnol. 2022, 25, 289–300. [Google Scholar] [CrossRef]
  24. Wang, X.; Du, H.; Chen, X.; Li, M.; Wang, J.; Xu, Z.; Feng, Z.; Chen, Z.; Zuo, S. Analysis of Blast Resistance Genes and Neck Blast Resistance of Japonica Rice Varieties/Lines Recently Developed in Jiangsu Province. Chin. J. Rice Sci. 2020, 34, 413–424. [Google Scholar] [CrossRef]
  25. Bolger, A.M.; Lohse, M.; Usadel, B. Trimmomatic: A Flexible Trimmer for Illumina Sequence Data. Bioinformatics 2014, 30, 2114–2120. [Google Scholar] [CrossRef] [PubMed]
  26. Moonmoon, S.; Islam, M. Effect of Drought Stress at Different Growth Stages on Yield and Yield Components of Six Rice (Oryza Sativa L.) Genotypes. Fundam. Appl. Agric. 2017, 2, 285–289. [Google Scholar] [CrossRef]
  27. Yang, J.; Zhang, J. Grain-Filling Problem in ‘Super’ Rice. J. Exp. Bot. 2010, 61, 1–5. [Google Scholar] [CrossRef]
  28. Poethig, R.S. Vegetative Phase Change and Shoot Maturation in Plants. Curr. Top. Dev. Biol. 2013, 105, 125–152. [Google Scholar] [CrossRef]
  29. Mirshad, P.P.; Puthur, J.T. Drought Tolerance of Bioenergy Grass Saccharum Spontaneum L. Enhanced by Arbuscular Mycorrhizae. Rhizosphere 2017, 3, 1–8. [Google Scholar] [CrossRef]
  30. Yang, X.; Liu, C.; Niu, X.; Wang, L.; Li, L.; Yuan, Q.; Pei, X. Research on LncRNA Related to Drought Resistance of Shanlan Upland Rice. BMC Genom. 2022, 23, 336. [Google Scholar] [CrossRef]
  31. Moin, M.; Bakshi, A.; Madhav, M.S.; Kirti, P.B. Expression Profiling of Ribosomal Protein Gene Family in Dehydration Stress Responses and Characterization of Transgenic Rice Plants Overexpressing RPL23A for Water-Use Efficiency and Tolerance to Drought and Salt Stresses. Front. Chem. 2017, 5, 97. [Google Scholar] [CrossRef]
  32. Ban, N.; Nissen, P.; Hansen, J.; Moore, P.B.; Steitz, T.A. The Complete Atomic Structure of the Large Ribosomal Subunit at 2.4 A Resolution. Science 2000, 289, 905–920. [Google Scholar] [CrossRef] [PubMed]
  33. Hanson, C.L.; Videler, H.; Santos, C.; Ballesta, J.P.G.; Robinson, C.V. Mass Spectrometry of Ribosomes from Saccharomyces Cerevisiae: Implications for Assembly of the Stalk Complex. J. Biol. Chem. 2004, 279, 42750–42757. [Google Scholar] [CrossRef] [PubMed]
  34. Fromont-Racine, M.; Senger, B.; Saveanu, C.; Fasiolo, F. Ribosome Assembly in Eukaryotes. Gene 2003, 313, 17–42. [Google Scholar] [CrossRef]
  35. Barakat, A.; Szick-Miranda, K.; Chang, I.F.; Guyot, R.; Blanc, G.; Cooke, R.; Delseny, M.; Bailey-Serres, J. The Organization of Cytoplasmic Ribosomal Protein Genes in the Arabidopsis Genome. Plant Physiol. 2001, 127, 398–415. [Google Scholar] [CrossRef]
  36. Chaves, M.M.; Flexas, J.; Pinheiro, C. Photosynthesis under Drought and Salt Stress: Regulation Mechanisms from Whole Plant to Cell. Ann. Bot. 2009, 103, 551–560. [Google Scholar] [CrossRef] [PubMed]
  37. Saibo, N.J.M.; Lourenço, T.; Oliveira, M.M. Transcription Factors and Regulation of Photosynthetic and Related Metabolism under Environmental Stresses. Ann. Bot. 2009, 103, 609–623. [Google Scholar] [CrossRef]
  38. Chen, H.; Zhang, D.; Guo, J.; Wu, H.; Jin, M.; Lu, Q.; Lu, C.; Zhang, L. A Psb27 Homologue in Arabidopsis Thaliana Is Required for Efficient Repair of Photodamaged Photosystem II. Plant Mol. Biol. 2006, 61, 567–575. [Google Scholar] [CrossRef]
  39. Nuccio, M.L.; Wu, J.; Mowers, R.; Zhou, H.P.; Meghji, M.; Primavesi, L.F.; Paul, M.J.; Chen, X.; Gao, Y.; Haque, E.; et al. Expression of Trehalose-6-Phosphate Phosphatase in Maize Ears Improves Yield in Well-Watered and Drought Conditions. Nat. Biotechnol. 2015, 33, 862–869. [Google Scholar] [CrossRef]
  40. Garg, A.K.; Kim, J.K.; Owens, T.G.; Ranwala, A.P.; Do Choi, Y.; Kochian, L.V.; Wu, R.J. Trehalose Accumulation in Rice Plants Confers High Tolerance Levels to Different Abiotic Stresses. Proc. Natl. Acad. Sci. USA 2002, 99, 15898–15903. [Google Scholar] [CrossRef]
  41. Koster, K.L.; Leopold, A.C. Sugars and Desiccation Tolerance in Seeds. Plant Physiol. 1988, 88, 829–832. [Google Scholar] [CrossRef]
  42. Xu, W.; Cui, K.; Xu, A.; Nie, L.; Huang, J.; Peng, S. Drought Stress Condition Increases Root to Shoot Ratio via Alteration of Carbohydrate Partitioning and Enzymatic Activity in Rice Seedlings. Acta Physiol. Plant 2015, 37, 9. [Google Scholar] [CrossRef]
Figure 1. The phenotype of the main panicle of two contrasting rice lines under drought treatment and control. Main panicle of La-96 (A), main panicle of La-163 (B), statistical analysis of seed setting rate in La-96 (C) and La-163 (D). Here, TS is the total seed number, FS is the filled seed number, and SR is the seed-setting rate.
Agronomy 14 02247 g001
Figure 2. Leaf chlorophyll value (Chl) and relative water content (RWC) of two contrasting rice lines under drought treatment (D), recovery (R), and control (C). Different letters indicate a significant difference (p < 0.05). The standard error (SE) of three biological replications is shown by error bars.
Agronomy 14 02247 g002
Figure 3. Photosynthetic traits of flag leaves of two contrasting rice lines under drought (D), recovery (R), and control (C) treatments. Different letters indicate a significant difference (p < 0.05). The standard error (SE) of three biological replications is shown by error bars. Here, Pn: net photosynthesis rate (A), Ci: intercellular CO2 concentration (B), Tr: transpiration rate (C), Gs: stomatal conductance (D).
Agronomy 14 02247 g003
Figure 4. (A) The principal component analysis (PCA) between different treatments and rice lines. The samples have relative coordination points on the principal components following dimensionality reduction analysis. Each sample point’s distance indicates the sample distance; the higher the similarities between samples, the closer the distance is. In the two-dimensional graph of the distinct samples, the contribution degree of principal component 1 (PC1) is illustrated by the horizontal axis, and the vertical axis depicts the contribution degree of principal component 2 (PC2). C96, D96, and R96 represent La-96 under control, drought treatment, and recovery, respectively, and C163, D163, and R163 represent La-163 under control, drought treatment, and recovery, respectively. (B) The Venn diagram between different treatments of two rice lines. Different colored circles represent different gene sets, and numerical values exhibit the number of shared and unique genes between different gene sets. (C) Histogram of DEGs among different treatments. The horizontal axis illustrates the individual comparison groups; the vertical axis displays the number of differential genes in each comparison group, denoting the number of genes upregulated for significant differences and the number of genes downregulated for significant differences. The horizontal axis displays the individual comparison groups. (D) The Venn diagram among comparisons of different treatments. (E) Histogram of differentially expressed genes between rice lines. (F) The Venn diagram among comparisons of different rice lines.
Agronomy 14 02247 g004
Figure 5. KEGG annotation analysis of D96_vs_C96 (A), D163_vs_C163 (B), R96_vs_D96 (C), R163_vs_D163 (D), R96_vs_C96 (E), R163_vs_C163 (F). The horizontal axis exhibits the KEGG metabolism pathway, and the vertical axis illustrates the number of annotated genes in the different pathways. Five categories of KEGG metabolic pathways were included: Metabolism, Environmental Information Processing, Genetic Information Processing, Organismal Systems, and Cellular Processes. C96, D96, and R96 represent La-96 under control, drought treatment, and recovery, respectively, and C163, D163, and R163 represent La-163 under control, drought treatment, and recovery, respectively.
Agronomy 14 02247 g005
Figure 6. KEGG enrichment analysis of D96_vs_C96 (A), D163_vs_C163 (B), R96_vs_D96 (C), R163_vs_D163 (D), R96_vs_C96 (E), R163_vs_C163 (F). The pathway name is displayed vertically, and the Rich factor (the ratio of the sample number of genes enriched in this pathway to the background number of annotated genes) is displayed horizontally—the greater the Rich factor, the greater the degree of enrichment. The size of the dots indicates the number of genes in this pathway, and the color of the dots corresponds to different Padjust ranges. C96, D96, and R96 represent La-96 under control, drought treatment, and recovery, respectively, and C163, D163, and R163 represent La-163 under control, drought treatment, and recovery, respectively.
Agronomy 14 02247 g006
Figure 7. (A) Characterization of the functionality of drought- and recovery-responsive genes under drought and successive recovery. D96/C96, La-96 from normal water to drought, D163/C163, La-163 from normal water to drought, R96/D96, La-96 from drought recovery to normal water treatment, R163/D163, La-163 from drought recovery to normal water treatment. (B) Common and specific DEGs were identified in different treatments and rice lines. + represents upregulated, - represents downregulated.
Agronomy 14 02247 g007
Figure 8. The analysis using qRT-PCR exhibits gene expression under drought (D), recovery (R), and control (C) treatments. Different letters indicate a significant difference (p < 0.05). The standard error (SE) of three biological replications is shown by error bars.
Agronomy 14 02247 g008
Disclaimer/Publisher’s Note: The statements, opinions and data contained in all publications are solely those of the individual author(s) and contributor(s) and not of MDPI and/or the editor(s). MDPI and/or the editor(s) disclaim responsibility for any injury to people or property resulting from any ideas, methods, instructions or products referred to in the content.

