Article

Remote-Sensed Determination of Spatiotemporal Properties of Drought and Assessment of Influencing Factors in Ordos, China

1
Yinshanbeilu Grassland Eco-Hydrology National Observation and Research Station, China Institute of Water Resources and Hydropower Research, Beijing 100038, China
2
Institute of Water Resources of Pastoral Area Ministry of Water Resources, Hohhot 010020, China
3
Water Resources Research Institute of Shandong Province, Jinan, 250014, China
*
Author to whom correspondence should be addressed.
Agronomy 2024, 14(10), 2265; https://doi.org/10.3390/agronomy14102265
Submission received: 12 August 2024 / Revised: 25 September 2024 / Accepted: 26 September 2024 / Published: 1 October 2024
(This article belongs to the Section Grassland and Pasture Science)

Abstract

:
Ordos drought impacts are complex; the Geodetector model is able to explore the interaction between impact factors. Based on the drought severity index (DSI), this study explored the spatio-temporal dynamics and changing trends of drought, and analyzed the driving factors of DSI spatial differentiation by using the Geodetector model. The results show that: the evapotranspiration (ET) and normalized difference vegetation index (NDVI) in Ordos showed a significant increasing trend (p < 0.05). The increasing rates were ET (4.291 mm yr−1) and NDVI (0.004 yr−1). In addition, the interannual variation of the DSI also showed a significant increase, with a trend change rate of 0.089. The spatial pattern of ET and the NDVI was low in the southwest and high in the northeast, and the spatial pattern of potential evapotranspiration (PET) was high in the southwest and low in the northeast, while the distribution of the DSI was dry in the west and wet in the east. The spatial differentiation of the DSI was mainly affected by five factors: air temperature, precipitation, land use type, soil type, and the digital elevation model (DEM), with q exceeding 0.15, which were the main driving factors of drought in the Loess Plateau. Under the interaction of multiple factors, the four combinations of temperature and the DEM, precipitation and the DEM, sunshine duration and the DEM, and relative humidity and the DEM jointly drive drought, in which precipitation (0.156) ∩ DEM (0.248) has the strongest influence on drought occurrence, and q reaches 0.389. This study directly informs specific drought management strategies or ecological conservation efforts in the region.

1. Introduction

Among natural disasters, drought represents one of the most frequently occurring and damaging, with detrimental effects on human wellbeing and agriculture, primarily due to increased temperatures and reduced rainfall [1,2,3]. Droughts also stunt vegetation growth, and can result in forest fires and reduced crop yields [4,5,6]. Hence, accurate and rapid determinations of drought conditions in an area of interest can guide management of agricultural production and drought mitigation.
Initial attempts at drought monitoring through the calculation of a drought index have predominantly relied on ground-based meteorological information or manual measurements. However, this approach suffers from the low numbers of stations, uncertainty through interpolation, and limited representativeness and spatiotemporal coverage [7]. In addition, raster meteorological data is used to calculate drought index [8]. In comparison, remote-sensed data through satellite technology offers rapidly accessible data characterized by a wide spatiotemporal coverage and continuous measurements at both spatial and temporal scales. Consequently, remote-sensed data offer clear advantages for regional-scale drought assessments [9,10,11]. Widely used contemporary remote-sensing drought monitoring indices include the conditional vegetation temperature index (VTCI) [12], the vegetation water supply index (VSWI) [13], the crop water scarcity index (CWSI) [14], the perpendicular drought index (PDI) [15], the modified perpendicular drought index (MPDI) [16], the temperature vegetation drought index (TVDI) [17], and the drought severity index (DSI) [18]. Among the above indices, the DSI integrates surface evapotranspiration information and vegetation response, and is highly accurate with a clear physical definition. Consequently, the DSI is recognized as offering important advantages over other drought indices [19] and has been widely applied and validated in large- and mesoscale drought monitoring studies [19,20,21]. The DSI is a type of agricultural drought [22]. Past drought assessment studies include Gang et al. (2019) [23], who assessed the drought conditions of global grassland ecosystems from 2000 to 2011, determining that most remained in a near-normal condition. Khan et al. (2021) [24] applied the DSI to determine that droughts show repeating patterns at a global scale, with droughts more extreme and frequent in Australia, Africa, and Asia than in South America and North America. Wang et al. (2020) [25] identified the relationship between evapotranspiration and soil moisture to mainly determine the relationship between DSI and soil moisture, thereby accurately describing typical drought processes in Inner Mongolia. An analysis of drought characteristics in Shanxi using the corrected DSI by Liu et al. (2020) [26] showed that the corrected DSI was highly correlated with drought in the study area. While there have been many past studies on remote-sensed drought indices, there has been very little focus on Ordos, China. This has contributed to a reduced accuracy of meteorological drought monitoring in Ordos, exacerbated by limited stations with an uneven spatial distribution. The application of the DSI remote-sensing drought index represents on approach to overcoming the above barriers to assessing drought in Ordos. In addition, the traditional correlation analysis method cannot accurately describe the complex response of drought to driving factors. The Geodetector model can detect the differentiation of space, but also can reveal the driving force behind it, is not limited by the time lag effect, and can be coupled with natural and other influencing factors for analysis [27,28,29]. At present, drought research in Ordos mainly focuses on short periods, while long-term drought monitoring research mainly focuses on the influence of meteorological factors such as precipitation and temperature, and rarely considers the influence of landform or human activities on the occurrence and distribution of drought.
The drought characteristics and drought vulnerability of Ordos City are mainly manifested in aspects such as sparse precipitation, high evaporation, drought climate, and water resource shortages, etc. These characteristics produce local water resource shortages, agricultural production limitations, ecological environment deterioration, and the limitation of social and economic activities under drought conditions. Therefore, it is necessary to take comprehensive measures to deal with the problem of drought, improve the capacity for disaster prevention and reduction, and ensure the sustainability of local economic and social development and the ecological environment. The aim of the present study was to assess the spatiotemporal properties of drought in Ordos and the influencing factors. The main objectives of the current study were to: (1) characterize the spatiotemporal evolution of drought in Ordos and seasonal changes; (2) quantitatively evaluate the influence of each factor on the DSI and their interactions, and; (3) identify the influences of major climatic factors on the DSI. The results of the present study can help further understand changes to the drought status in Ordos, with the broader contribution of acting as a scientific reference for regional disaster prevention and mitigation.

2. Materials and Methods

2.1. Study Area

Ordos City is in southwest Inner Mongolia Autonomous Region, hinterland of the Ordos Plateau, between 37°35′24″~40°51′40″ N and 106°42′40″~111°27′20″ E. The city falls in a typical temperate arid and semi-arid continental climate zone, with multi-year mean temperature and precipitation of 6.2 °C and 348.3 mm, respectively, and 70% of precipitation concentrated between July and September. As shown in Figure 1, the dominant land-use types in the study area are grassland.

2.2. Data Sources

For remote-sensing data, the moderate-resolution imaging spectroradiometer (MODIS) data products were MOD16A2 and MOD13A3, respectively, from the U.S. National Aeronautics and Space Administration (NASA) (https://ladsweb.modaps.eosdis.nasa.gov/, accessed on 1 February 2024). The ET, PET, and NDVI data were extracted, respectively. The spatial resolution of ET and PET was 0.5 km, and the temporal resolution was 8 days; the spatial resolution of the NDVI data was 1 km, and the temporal resolution was 16 days. The grid data of temperature, precipitation, sunshine duration, relative humidity, and wind speed were obtained from the National Earth System Science Data Center, National Basic Conditions Platform for Science and Technology (http://www.geodata.cn/). The spatial resolution of the data was 1 km and the temporal resolution was 1 month. Data for the digital elevation model, land use type, soil type, and surface roughness were obtained from the National Earth System Science Data Center (https://www.geodata.cn/). Among them, slope was extracted according to DEM. Finally, ARCGIS and MRT were mainly used to realize data concatenation, projection conversion, resampling and clipping, and maximum value synthesis. The spatial resolution was unified to 1 km, and the temporal resolution was 1 month.

2.3. Methods

2.3.1. DSI

The DSI integrates the NDVI:PET and ET:PET ratios to consider the state of vegetation and deficits in crop water. Previous studies have applied the DSI to monitor meteorological and agricultural drought. The DSI was calculated as follows [30]:
Z N D V I = N D V I N D V I ¯ δ N D V I
Z E T / P E T = E T / P E T E T / P E T ¯ δ E T / P E T
Z = Z N D V I + Z E T / P E T
D S I = Z Z ¯ δ Z
where the NDVI and ET/PET are for a set period during the study period; N D V I ¯ and δ N D V I represent the mean and standard deviation of the NDVI during the study period, respectively; those for ET/PET are E T / P E T ¯ and δ E T / P E T ; those for deviation in Z are Z ¯ and δ Z . The DSI is proportional to the degree of wetness.

2.3.2. Linear Trend Estimation

Trend analysis through linear regression has been widely applied in drought assessment, and can be calculated as follows [31]:
θ S l o p e = n × i = 1 n i × A i i = 1 n i × i = 1 n A i n i = 1 n i 2 i = 1 n i 2
where Ai represents the mean value of a particular factor in year i, including the ET, PET, NDVI, and DSI; n is the study length.

2.3.3. Geodetector Model

The Geodetector model is an emerging statistical method which identifies the interaction between multiple elements based on spatial differentiation, and reveals the influencing factors behind the above relationships. The core idea of this model is that if an independent variable has a significant impact on the dependent variable, then they should have similar distribution characteristics in space.
The main methods of this study included analyzing the spatial distribution of the DSI in the study area and the influencing factors of the DSI. In order to achieve this goal, the methods of differentiation and factor detector, and interaction detector were adopted in this paper. The differentiation and factor detector aims to investigate the spatial differentiation of dependent variable factor Y, and the explanatory ability of independent variable factor X to the spatial differentiation of dependent variable factor Y [32]:
q = 1 1 N σ 2 h = 1 L N h σ h 2
where L represents stratification of Y or X; N and σ2 represent the total samples in the study area and the discrete variance of the entire area, respectively; and Nh and σ h 2 represent the sample number and the discrete variance of area h, respectively, with h = 1, 2, 3, …, n. Interaction detectors are predominantly applied to detect interactions between influencing factors and whether these interactions act synergistically, antagonistically, or independently on the dependent variable.
The interaction detector was used to identify the interaction between different influence factors, in short, to explore whether the combined action of two factors increased or decreased the explanatory power of the dependent variable factor Y. First of all, the exploration also needed to calculate the explanatory power q value of the two independent variable factors X for Y, then calculate the q value after the interaction of the two independent variable factors, and finally compare the two q values. The results are divided into the following 5 categories (Table 1)—q(X1∩X2): q(X1) interacts with q(X2); min[q(X1), q(X2)], the minimum value of q(X1) and q(X2); max[q(X1), q(X2)], the maximum value between q(X1) and q(X2); q(X1) + q(X2): sum of q(X1) and q(X2).

3. Results

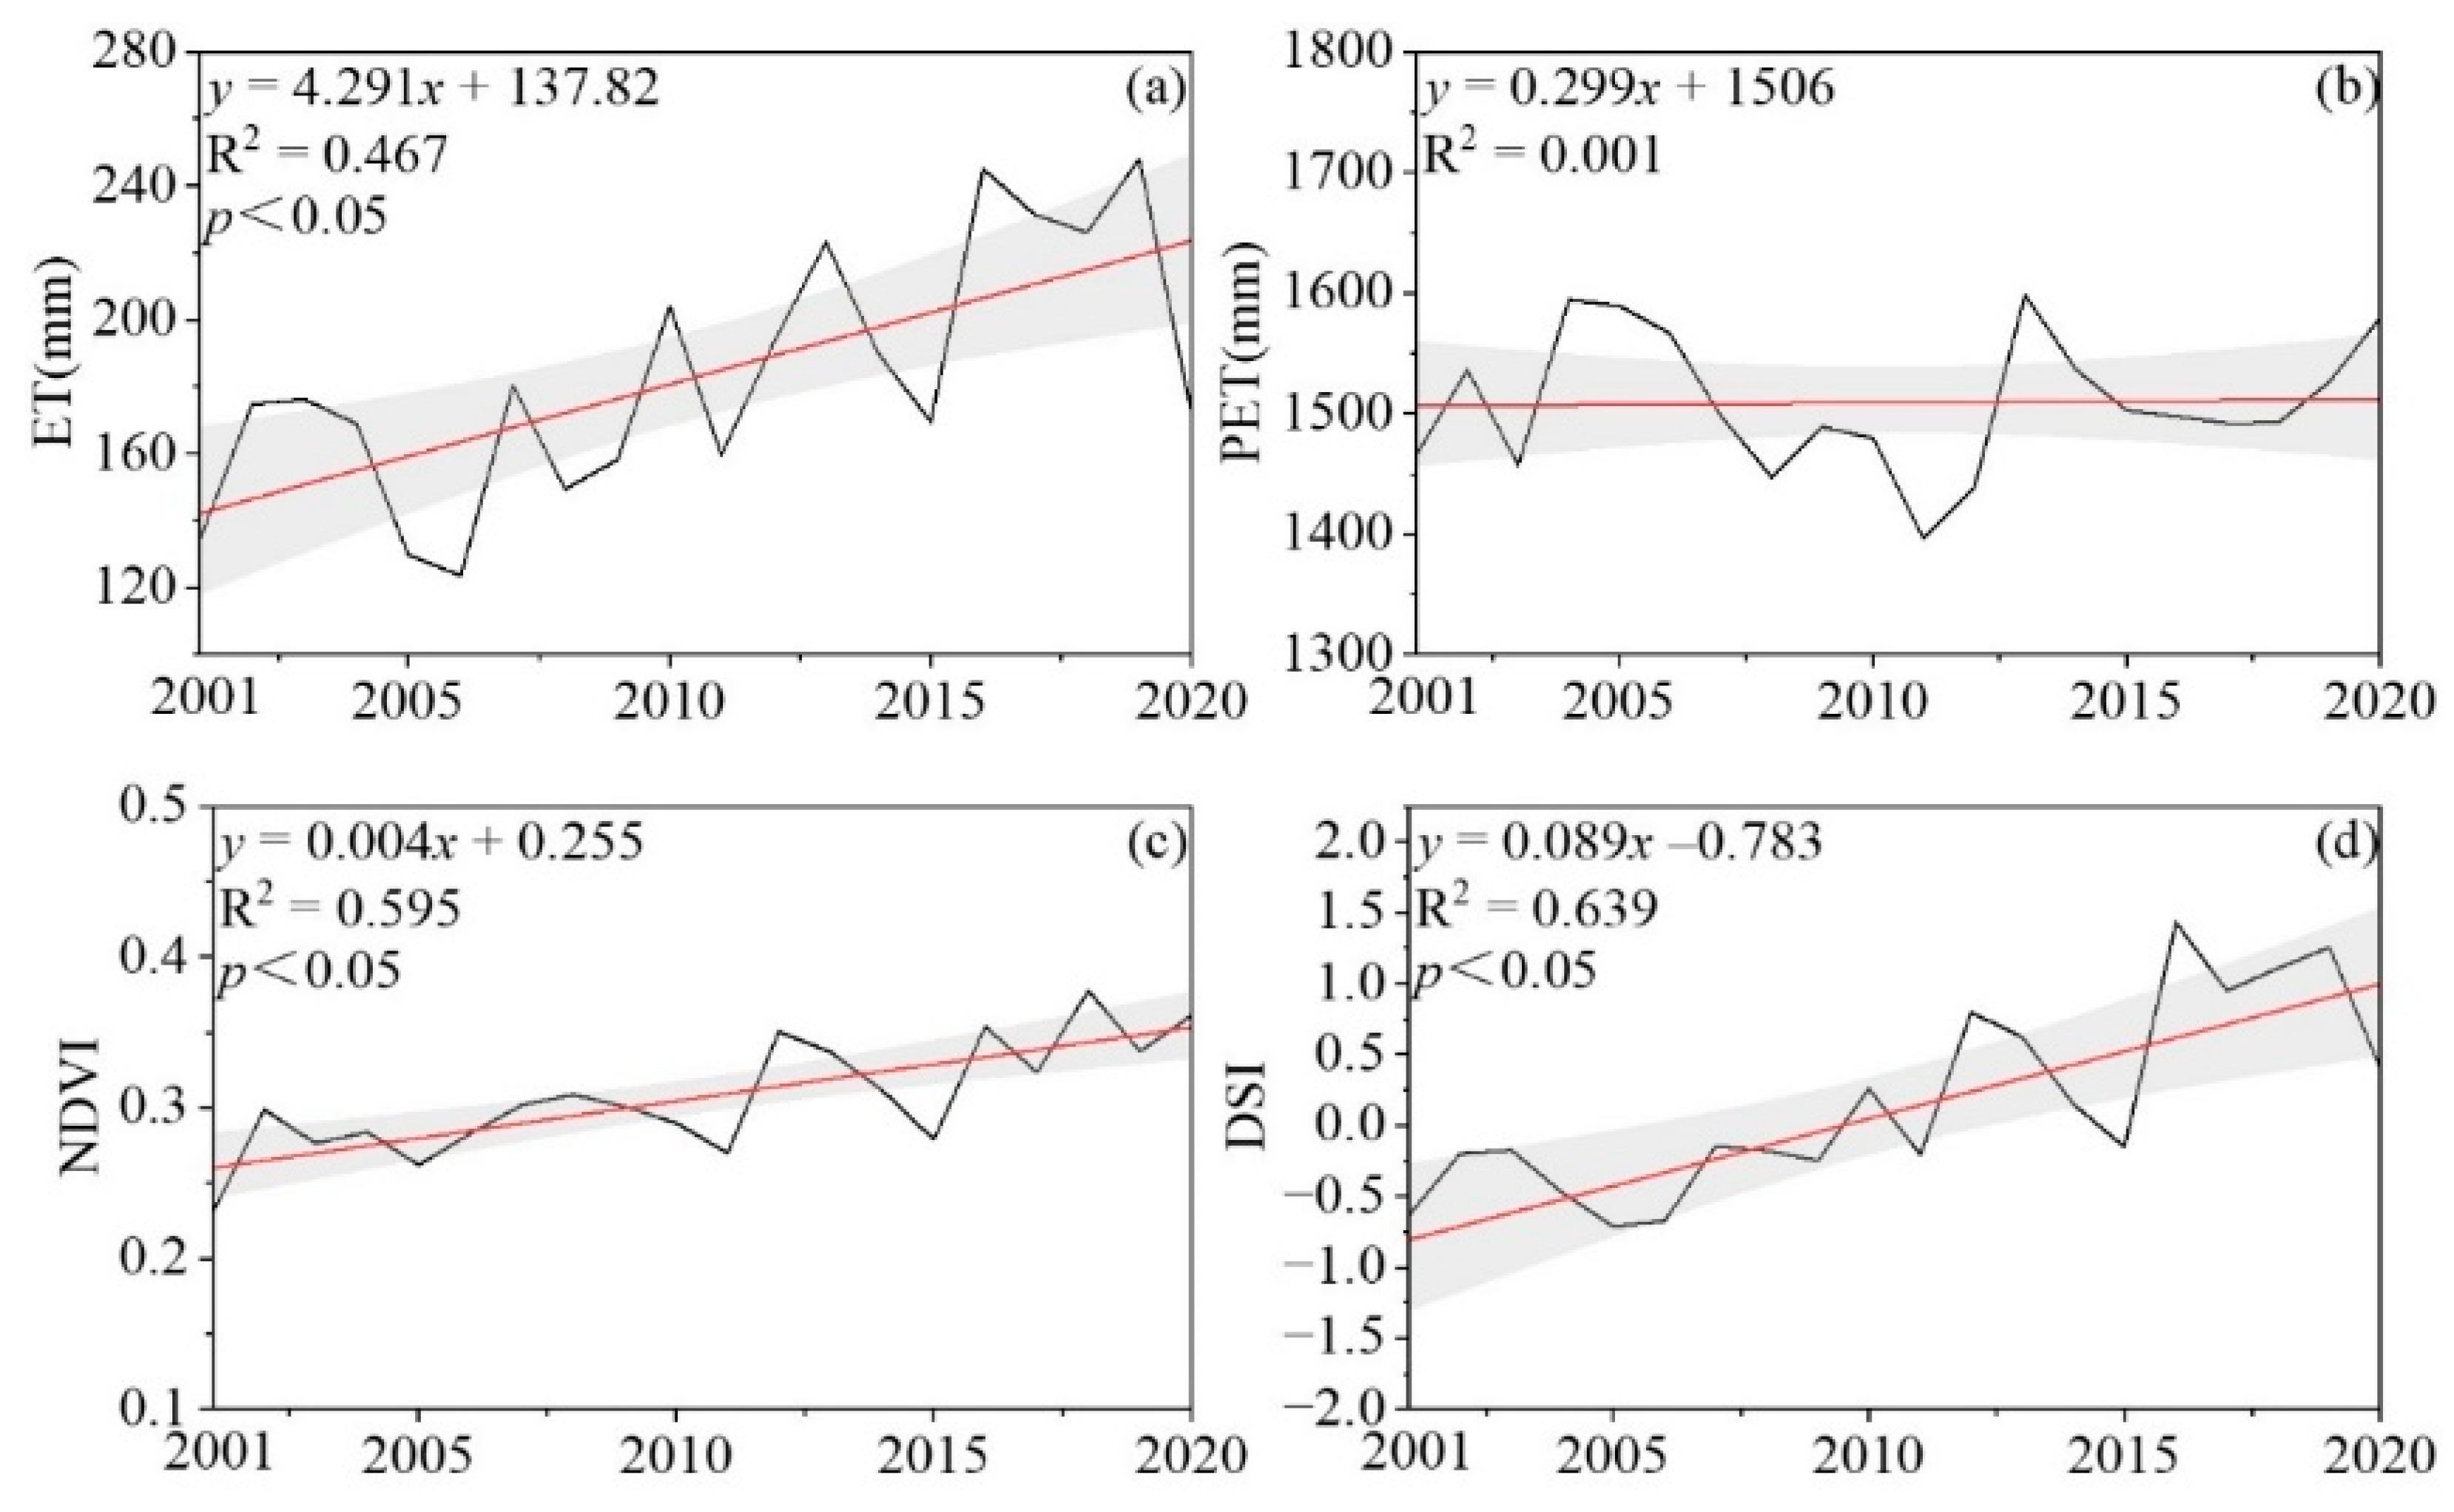
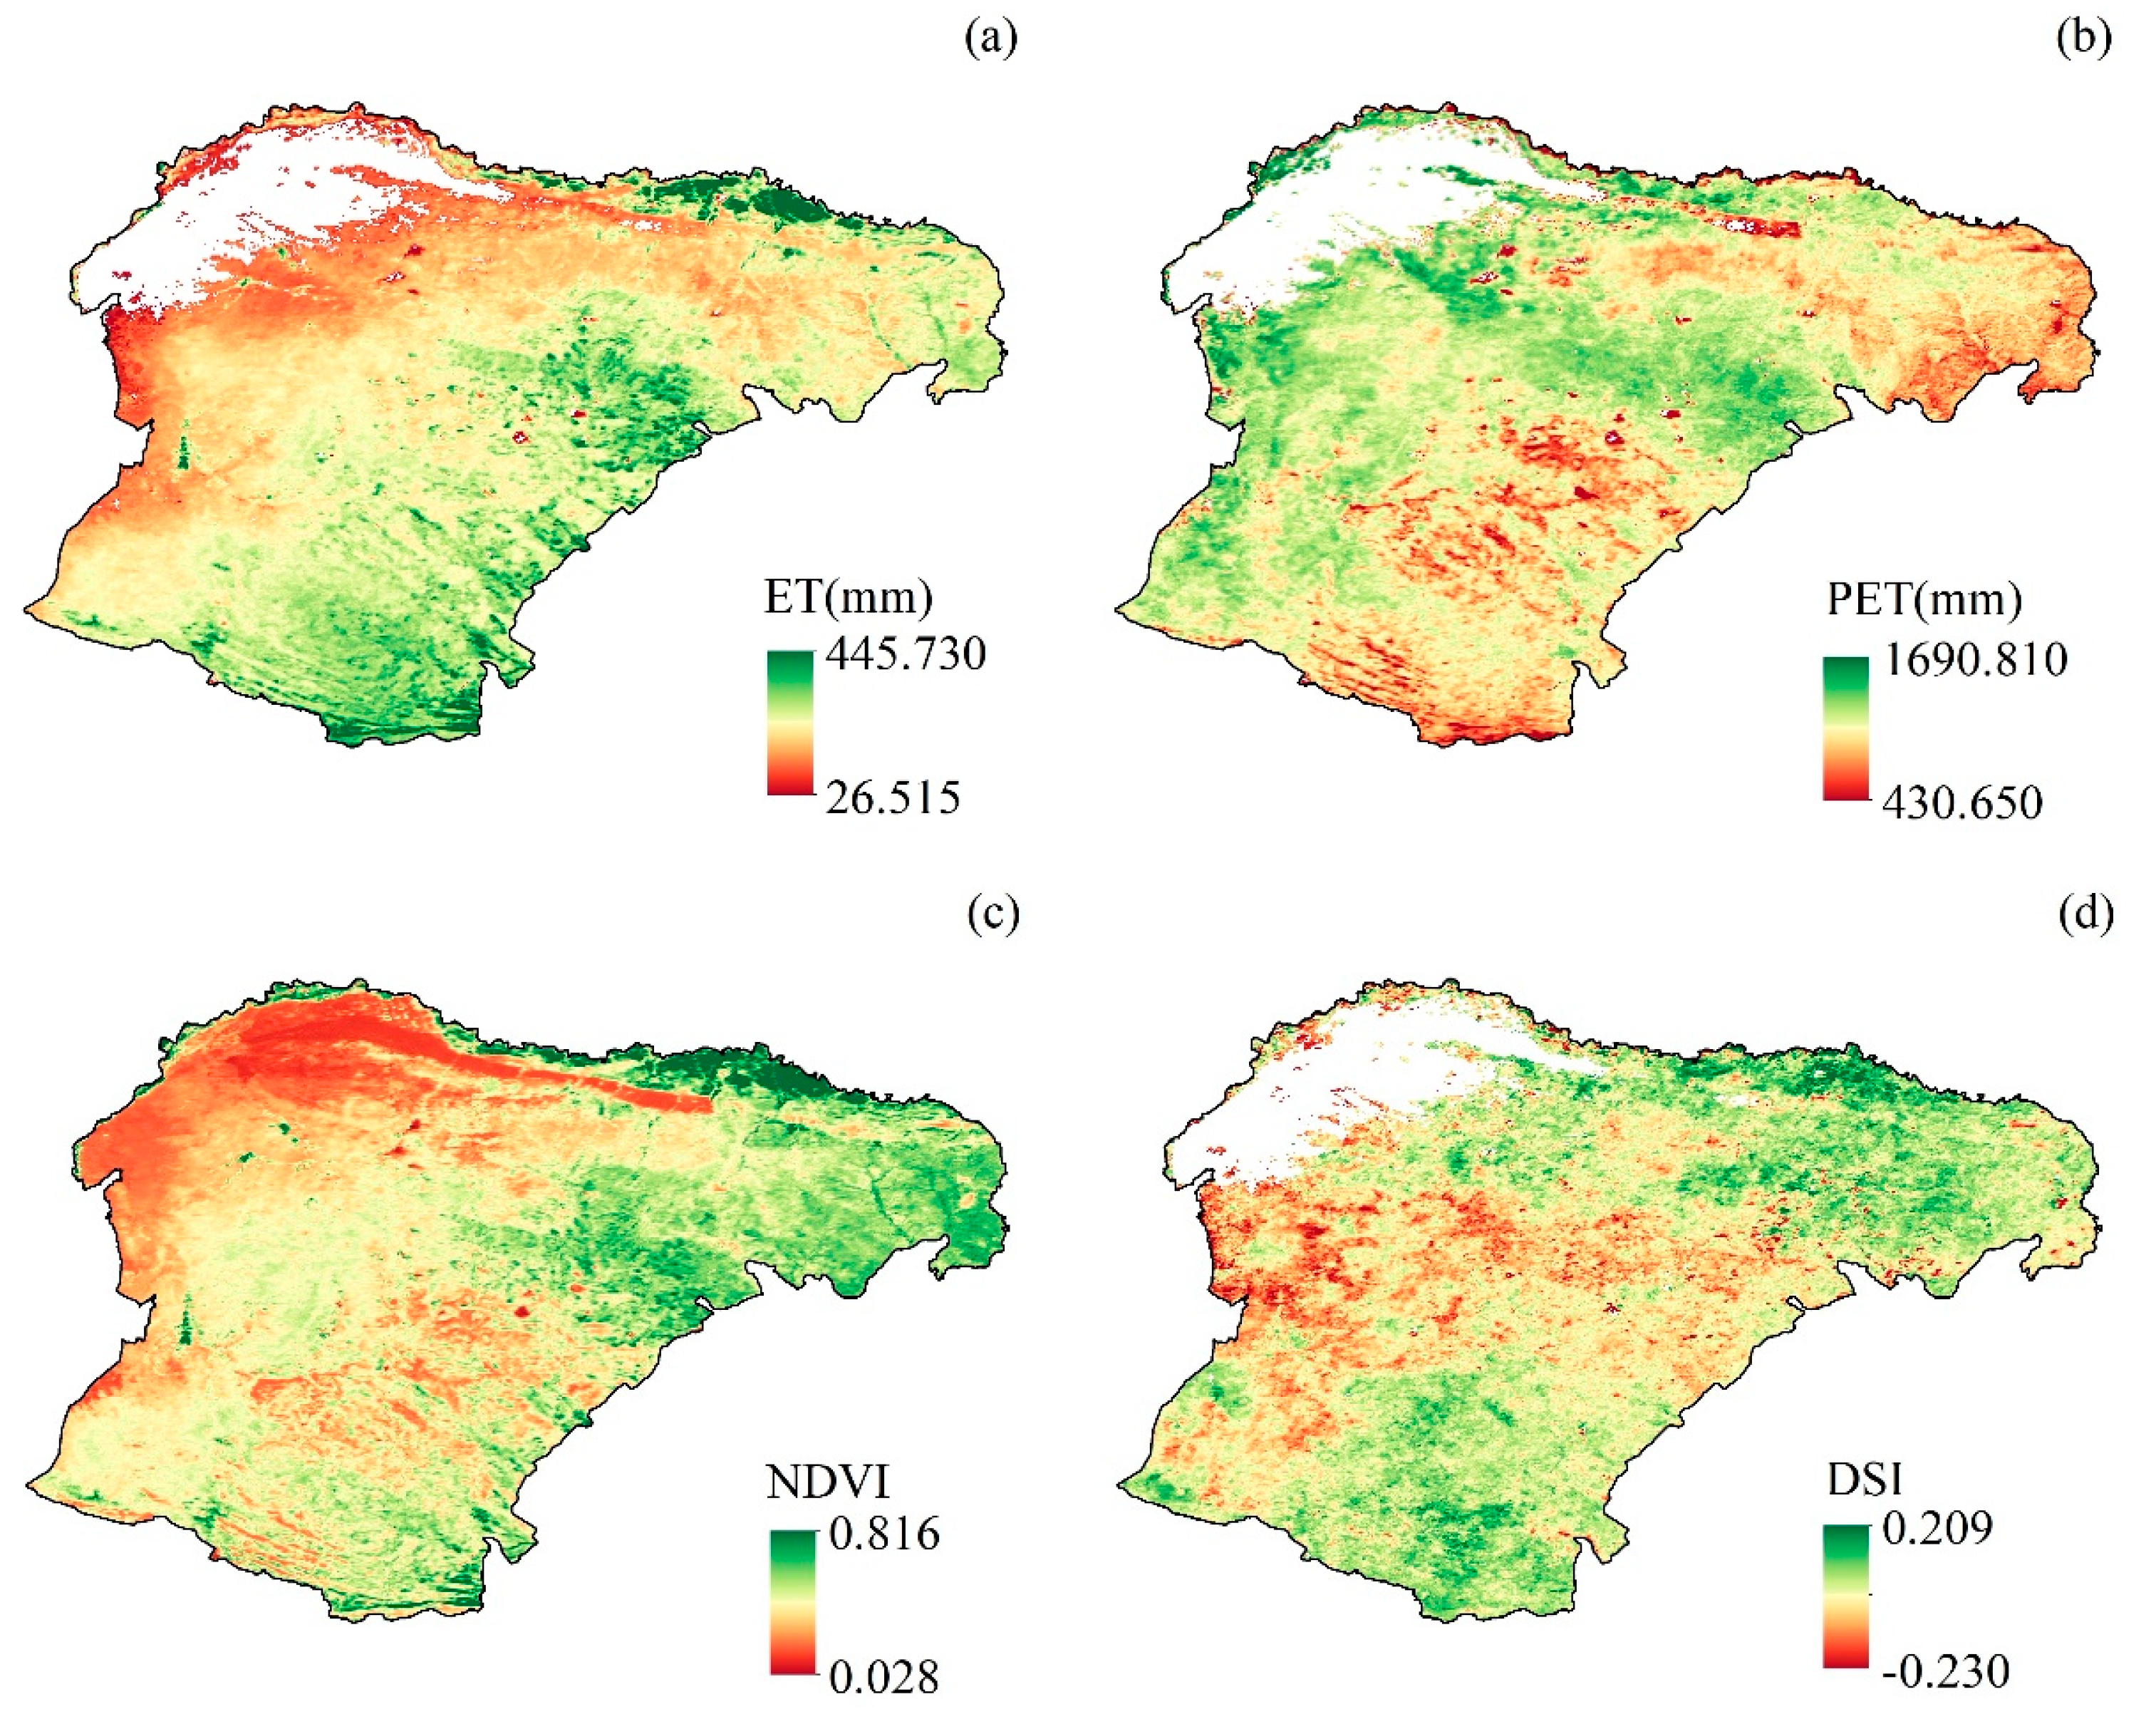
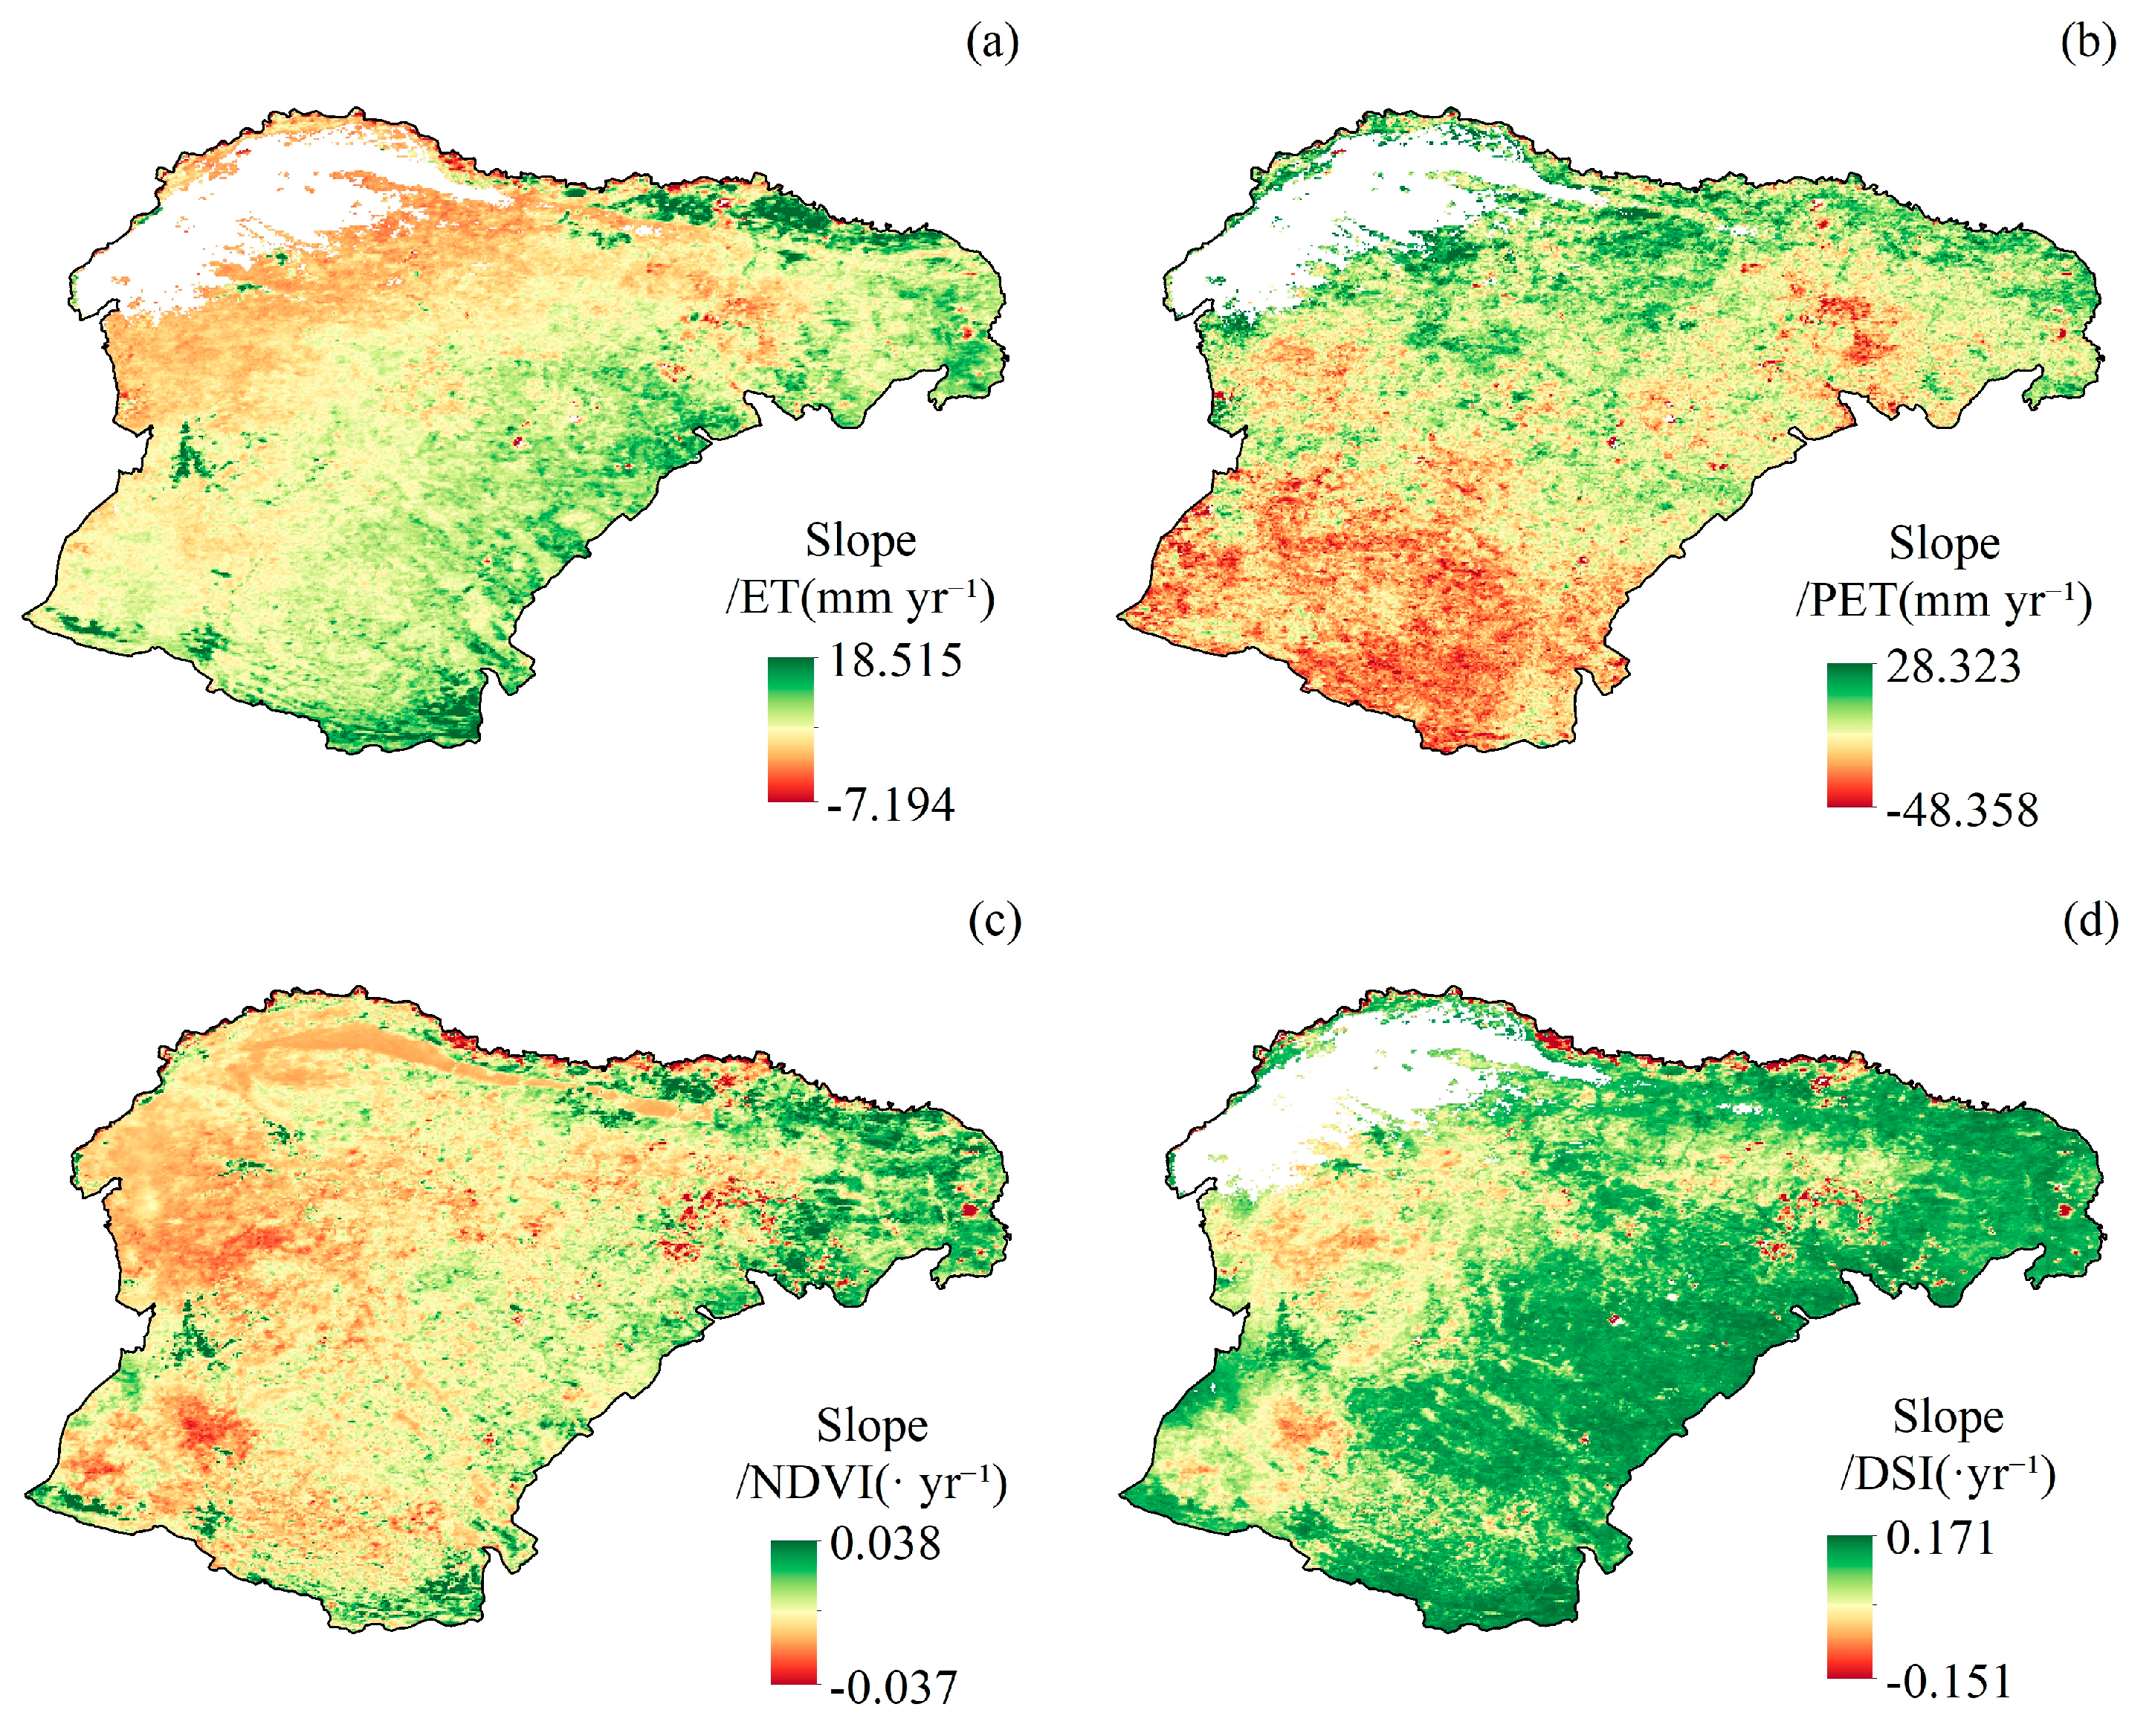
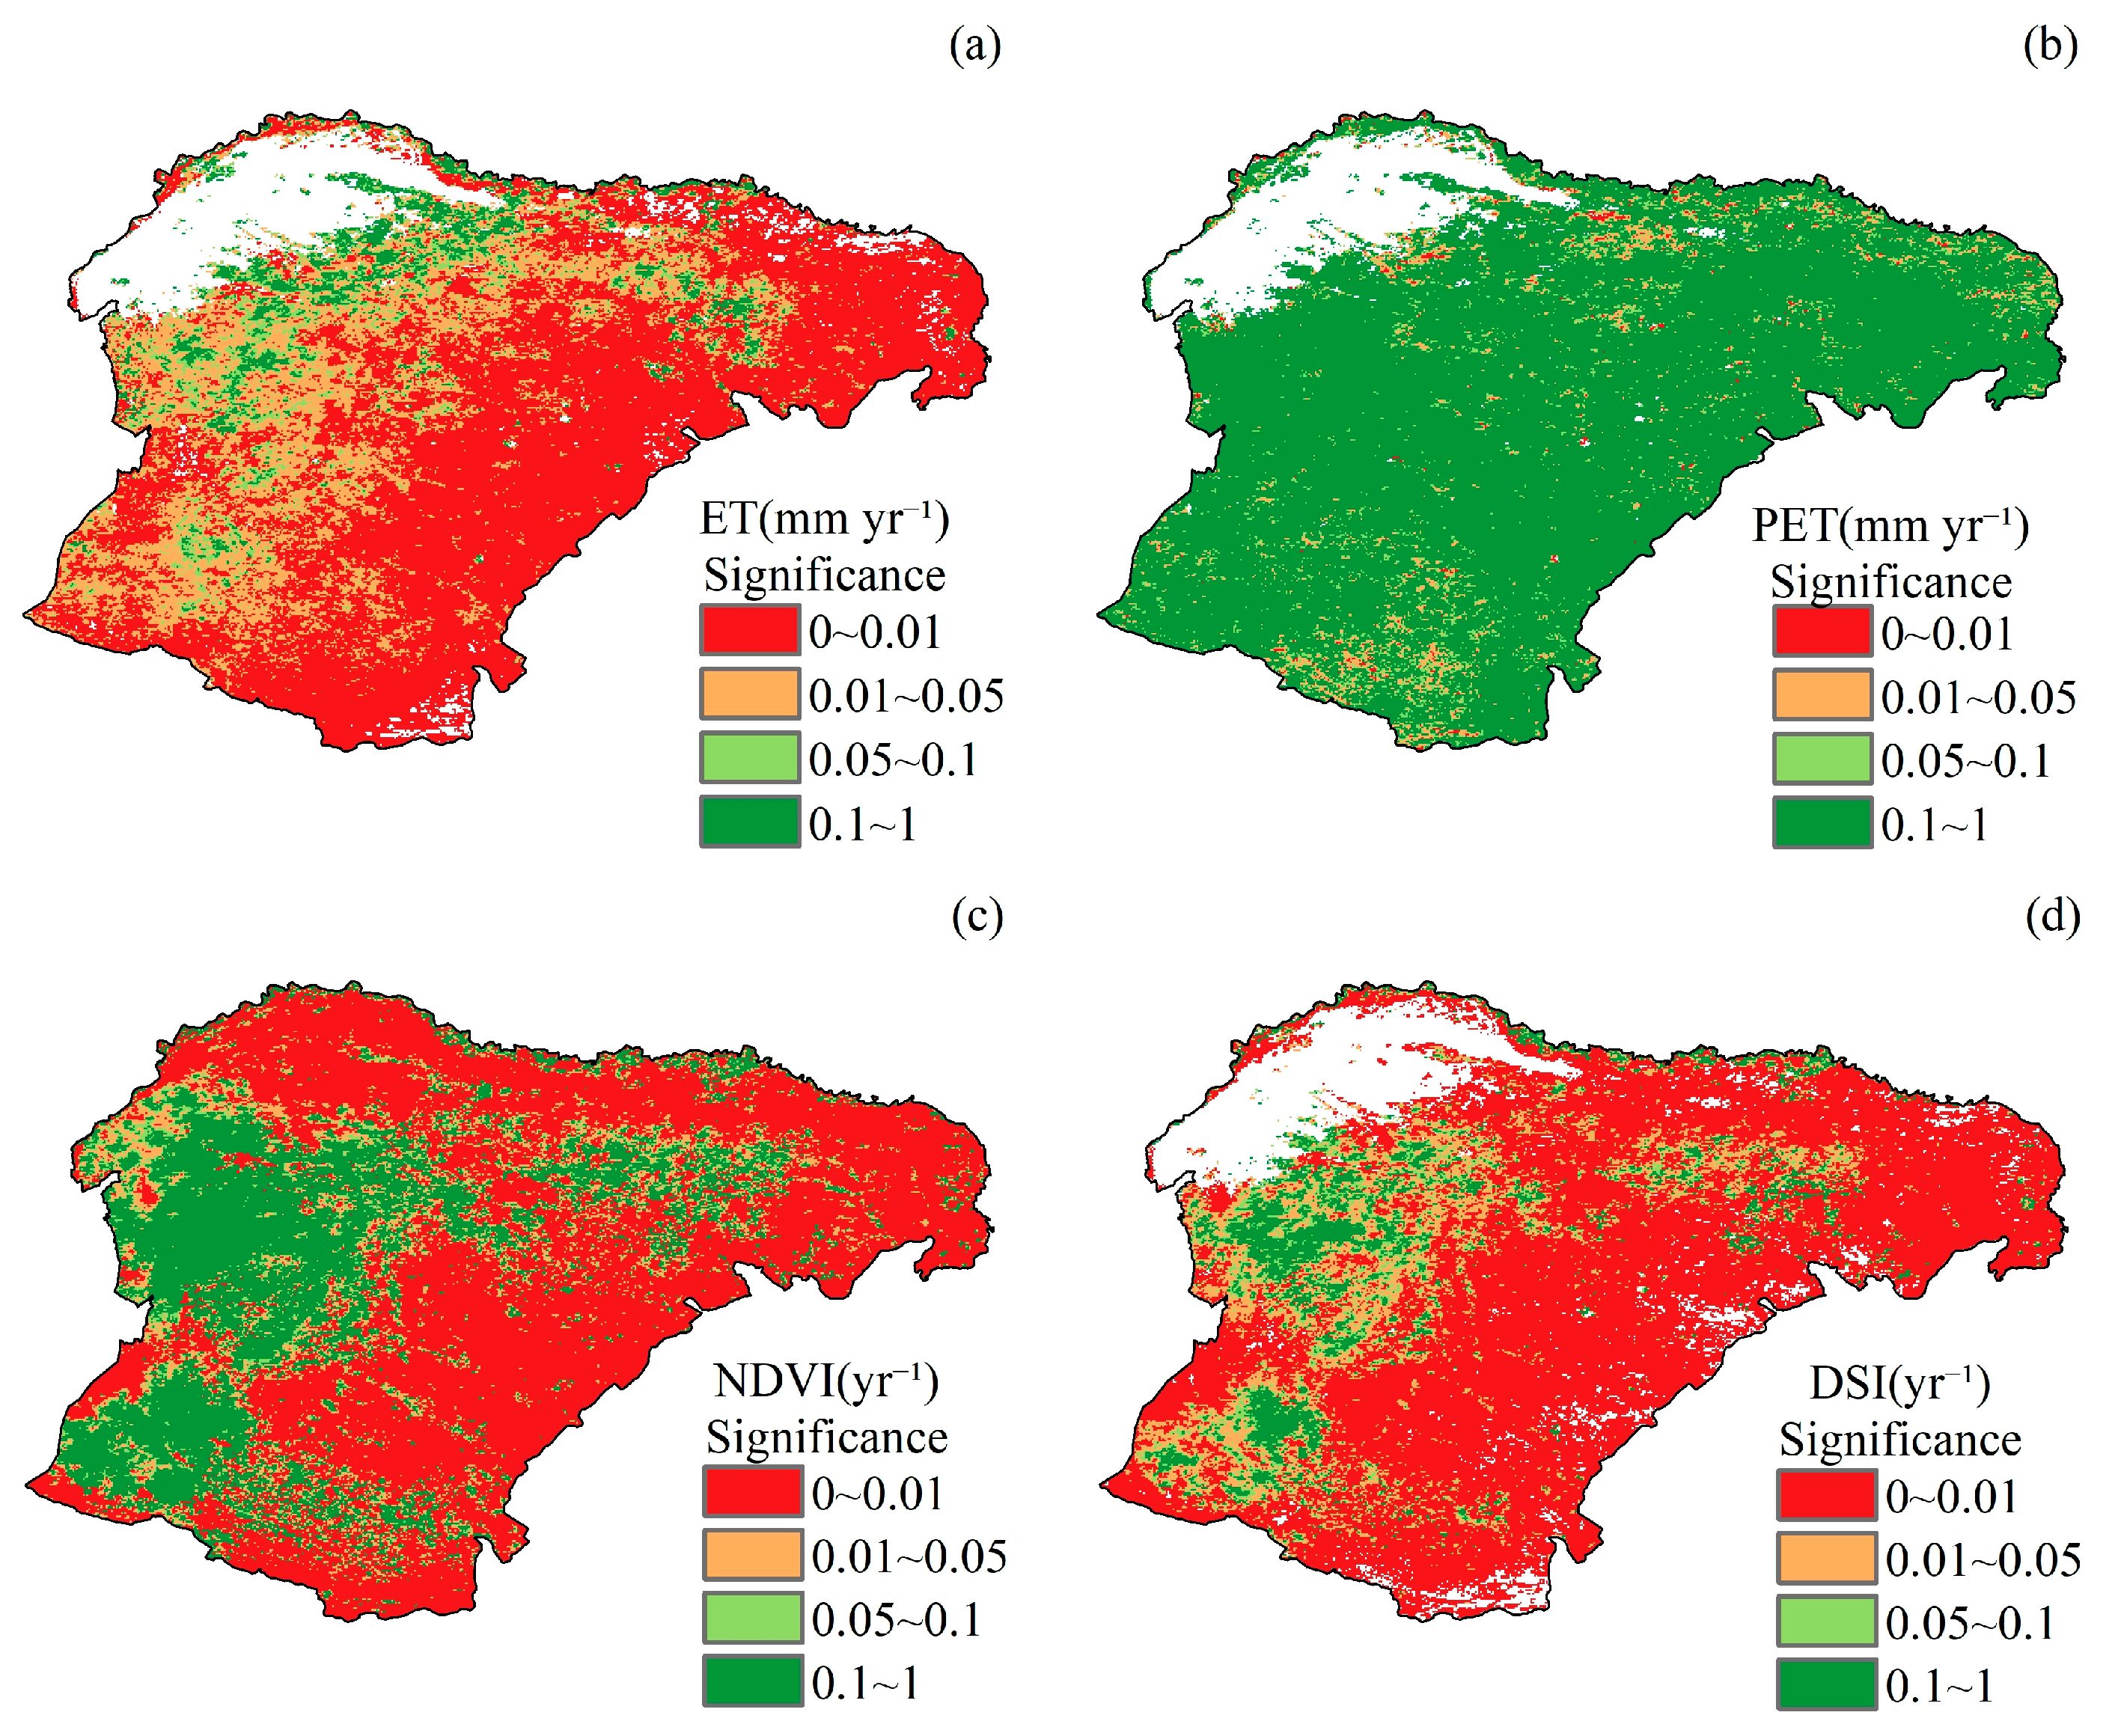
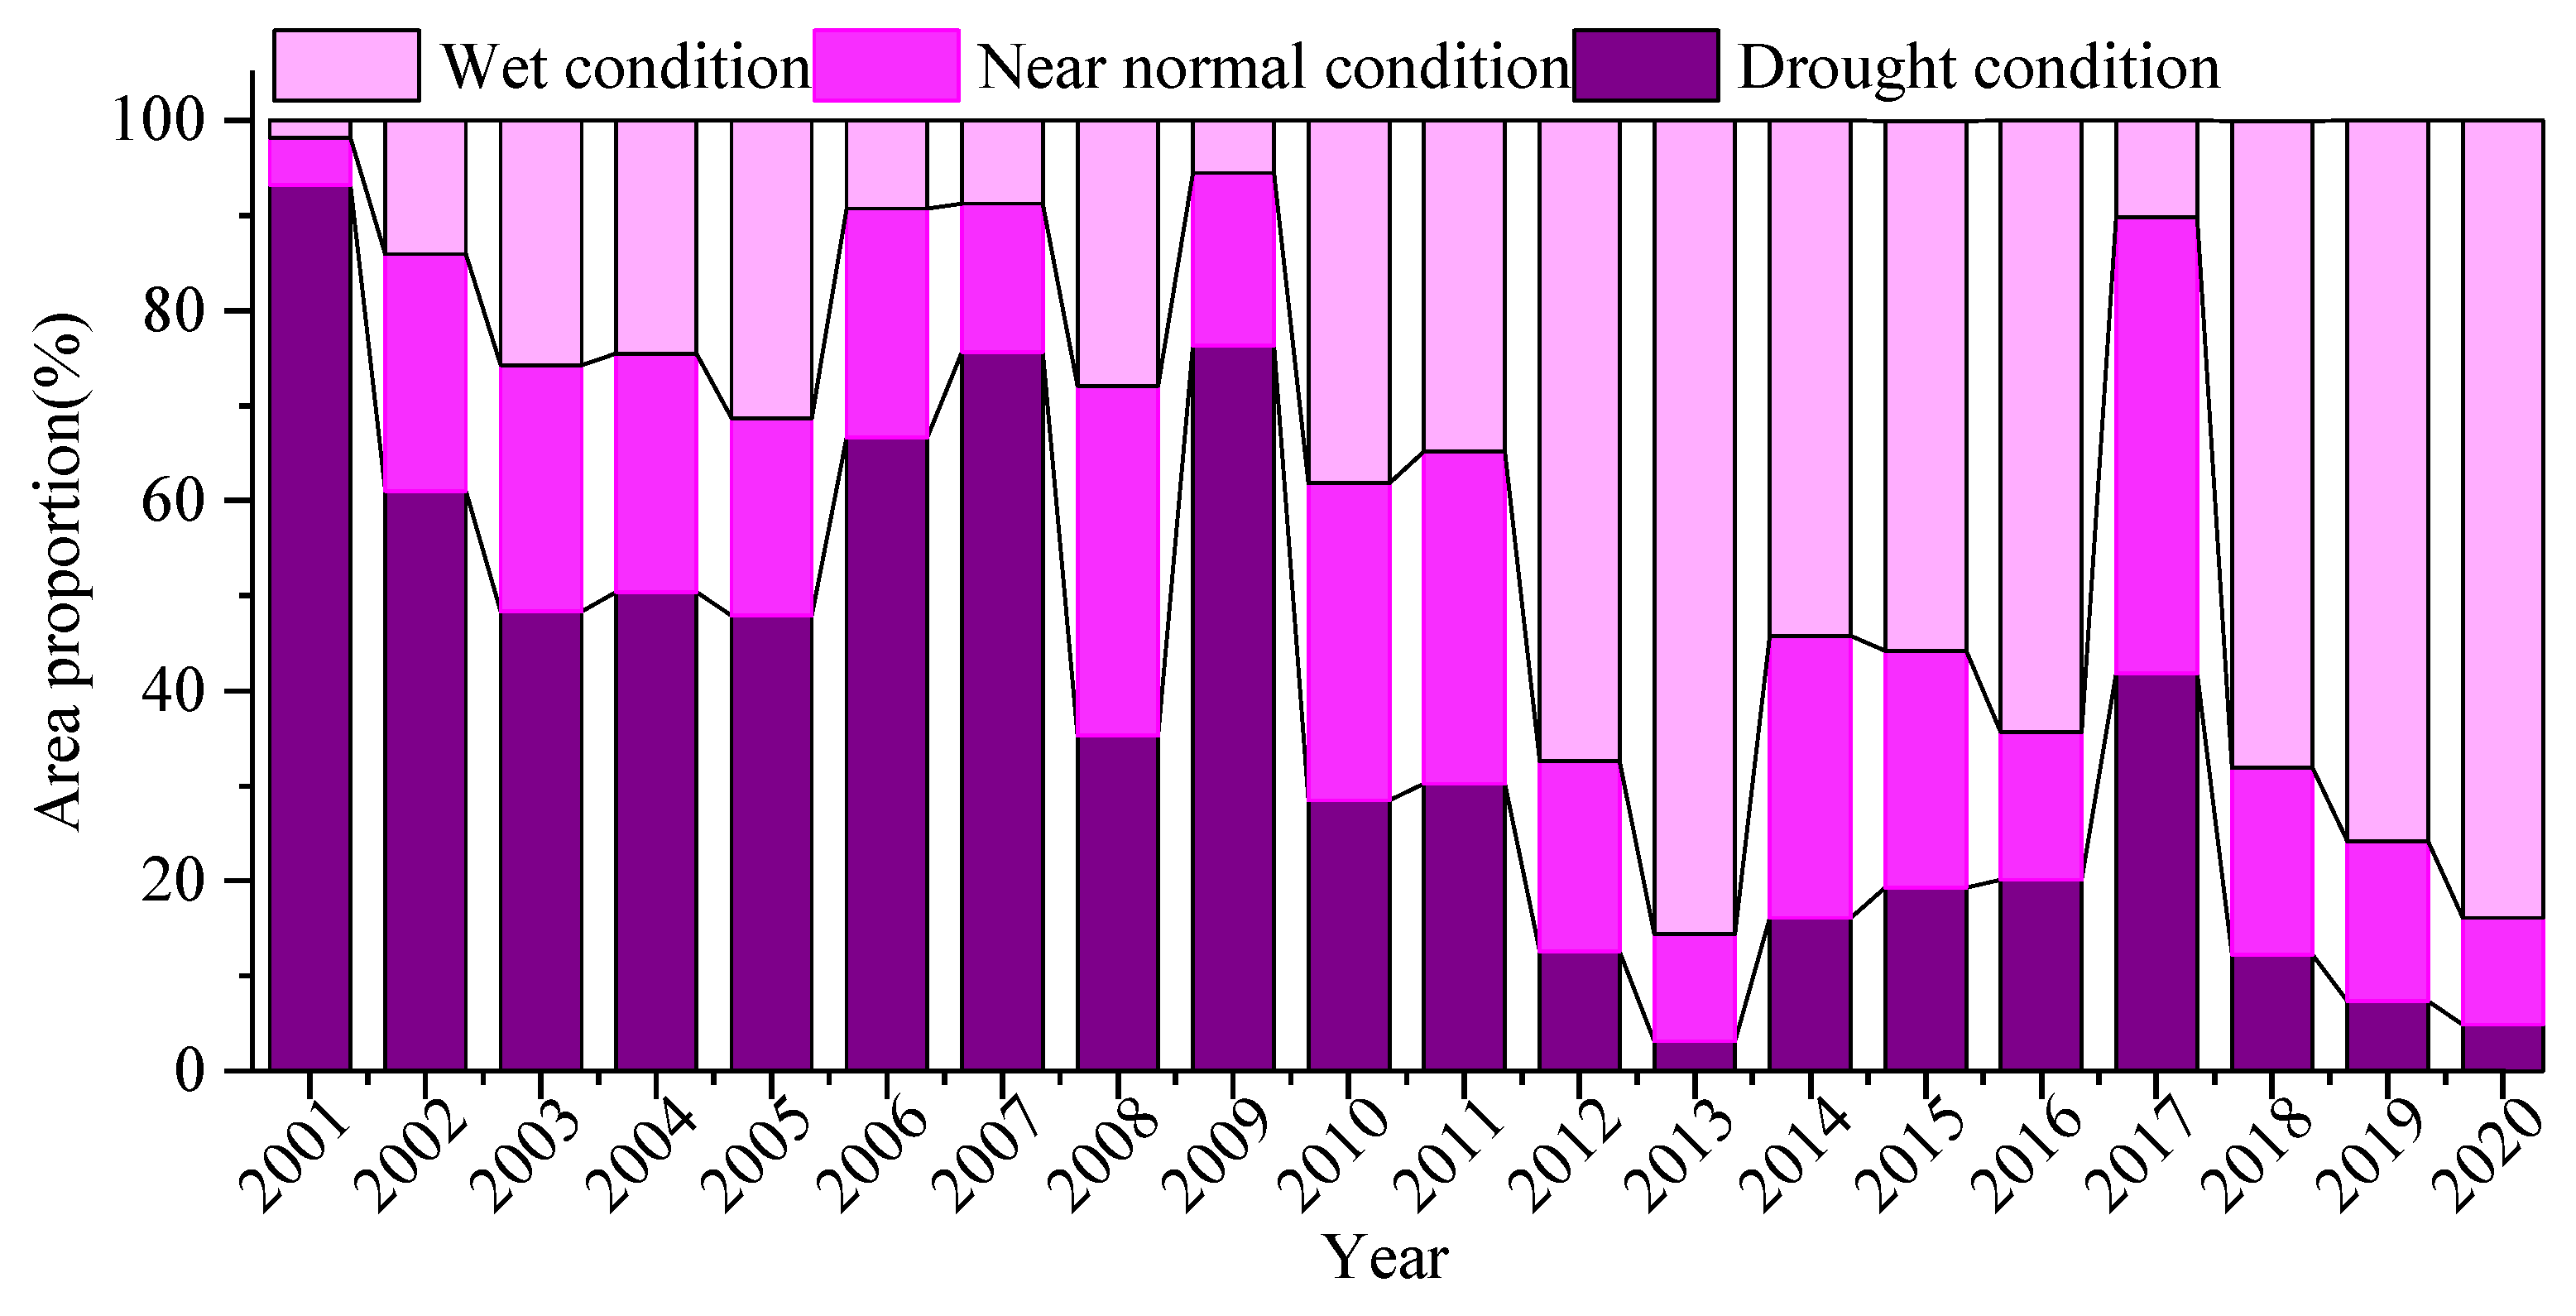
3.1. Characteristics of Spatial and Temporal Variability of Drought

As shown in Figure 2, there were no significant inter-year fluctuations in the ET, PET, NDVI, and DSI in Inner Mongolia during the study period, with significant increasing trends in the ET, PET, and NDVI in Ordos from 2001 to 2020 (p < 0.05) of 4.291 mm yr−1, 0.299 mm yr−1, and 0.004 yr−1, respectively. There was an overall significant increasing trend in the inter-year variation in the DSI; a good fitting linear regression with a slope of 0.089 and R2 of 0.639. This result could be attributed to the positive correlation between the DSI and degree of wetness, and suggests that Ordos experienced reduced drought conditions during the study period.
Clear spatial heterogeneity was evident in the distributions of the multi-year mean ET, PET, NDVI, and DSI in Ordos from 2001 to 2020 (Figure 3), with the ET and NDVI increasing from southwest to northeast, PET showing the opposite pattern, and DSI increasing from west to east. The multi-year average ET, PET, NDVI, and DSI varied from 26.515 to 445.730 mm, 430.650 to 1.690.810 mm, 0.028 to 0.816, and −0.230 to 0.209, respectively. The DSI representing drought conditions (low DSI) were mainly concentrated in central Ordos, whereas ET and PET showed the opposite spatial distribution. Areas of higher vegetation cover were mainly in the Yellow Belt and in eastern Ordos.
As shown in Figure 4, ET varied spatially from −7.194 to 18.515 mm yr−1 (Figure 4a), with an increasing trend in ET evident in 72.35% of the area covered by vegetation, and this trend was significant in 67% of the area (p < 0.05) (Figure 5a); a decreasing trend in ET was evident in 27.65% of the area. Spatial variability of PET ranged from −48.358 to 28.323 mm yr−1 (Figure 4b), with an increasing trend in PET in 64.36% of the area covered by vegetation, with this trend significant in 19.34% of this area (p < 0.05) (Figure 5b); and there was a decreasing trend in PET in 35.64% of the area, concentrated in the southwest near the Maowusu Sandland. The spatial variability of the NDVI in Inner Mongolia ranged from −0.037 to 0.038 mm yr−1 (Figure 4c), with an increasing trend in the NDVI concentrated in east Ordos and a decreasing trend concentrated in central and western Inner Mongolia, with this trend significant in 28.94% of this area (p < 0.05) (Figure 5c). The rate of change in DSI ranged from −0.151 to 0.171 yr−1 (Figure 4d), with an increasing trend in DSI in 86.98% of the area covered by vegetation, with this trend significant in 74.65% of this area (p < 0.05) (Figure 5d); and a decreasing trend in DSI was evident in 13.02% of the area, concentrated in central Ordos.
As shown in Figure 6, the spatial change in the DSI indicated varying degrees of drought in Ordos over the last two decades, as well as a decreasing trend in drought. The year in which drought encompasses the largest area of 93.23% was 2001; there was a decreasing trend in normal drought years, with maximal normal drought conditions encompassing 34.95% of the total area in 2011; there was an increasing trend in wet area, with the maximum wet area of 85.57% in 2013. The results showed that droughts dominated Ordos until 2009, after which wet conditions have dominated; maximum areas of drought and normal conditions occurred in 2017, after which there were slight decreasing trends in drought and normal conditions.

3.2. Analysis of Drought Drivers

3.2.1. Detection Factor Impact Analysis

The factor detector can identify the effect of each factor on the DSI, expressed as a power of determinant (PD) value which is proportional to the relationship between the factor and the DSI, and a p-value identifying the significance of the relationship (Figure 7). The results identified temperature and precipitation to be the climate factors with the strongest relationships with the DSI, with a PD of 0.141 and 0.156, respectively, and mean explanatory power exceeding 10%. Sunshine hours and relative humidity had lower relationships with the DSI, with explanatory power of 2.8% and 5.7%, respectively. The DEM and soil type were the surface factors with the strongest relationships with the DSI, with PD values of 0.248 and 0.189, respectively. The temperature, precipitation, soil type, land use type, and DEM showed the strongest relationships with the DSI, indicating the importance of these factors in regulating drought.

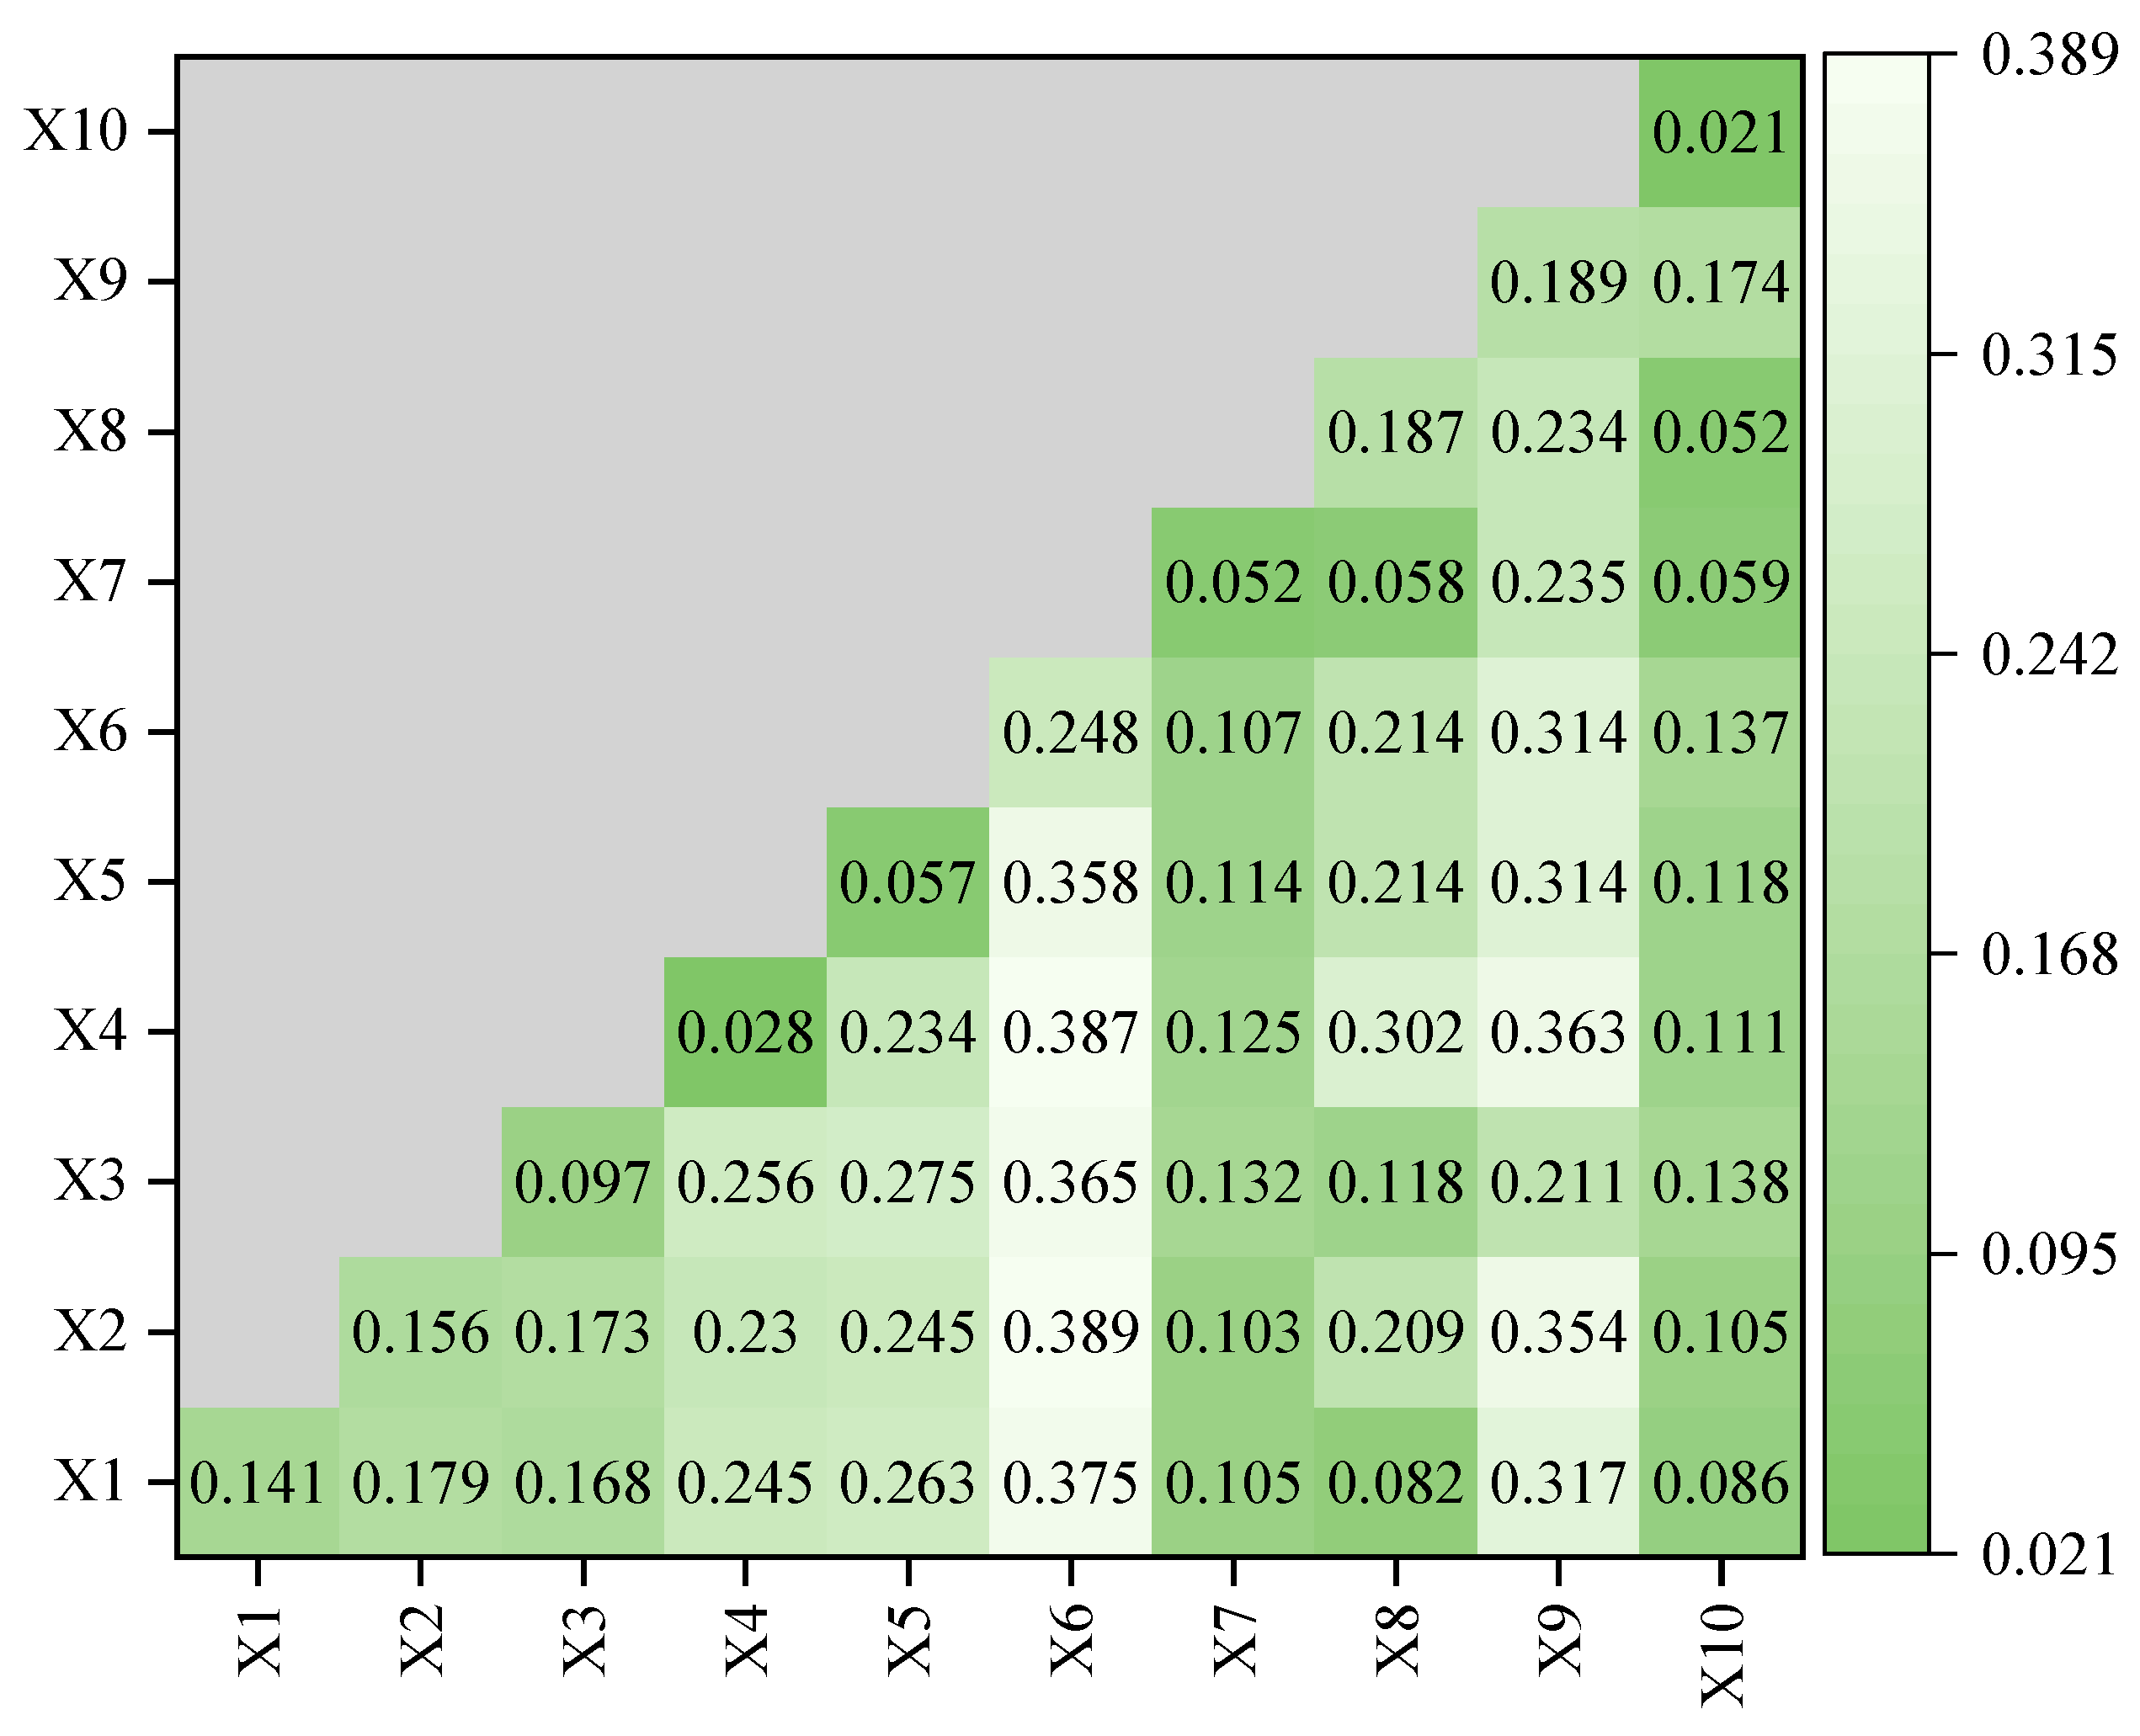
3.2.2. Interaction of the Drivers

While the explanatory power of temperature on the DSI was 14.1% (Figure 8), the interactions between temperature and other factors showed nonlinear increasing explanatory power on the DSI. The explanatory factor for the DSI of temperature (0.141) ∩ relative humidity (0.057) was 0.263; temperature (0.141) ∩ DEM (0.248) was 0.375; and temperature (0.141) ∩ soil type (0.189) was 0.317. All above interactions had a DSI explanatory power exceeding 20%. The DSI explanatory power of precipitation of 15.6% was enhanced through interactions with the wind speed, sunshine hours, relative humidity, DEM, land use type and soil type; precipitation (0.156) ∩ DEM (0.248) was 0.389; and precipitation (0.156) ∩ soil type (0.189) was 0.354. The DSI explanatory power of the above two interactions exceeded 35%. While the DSI explanatory power of surface roughness was 2.1%, this was increased through interactions with soil type and wind speed to above 10%. These results stress the important effects of interactions between factors in regulating the DSI.

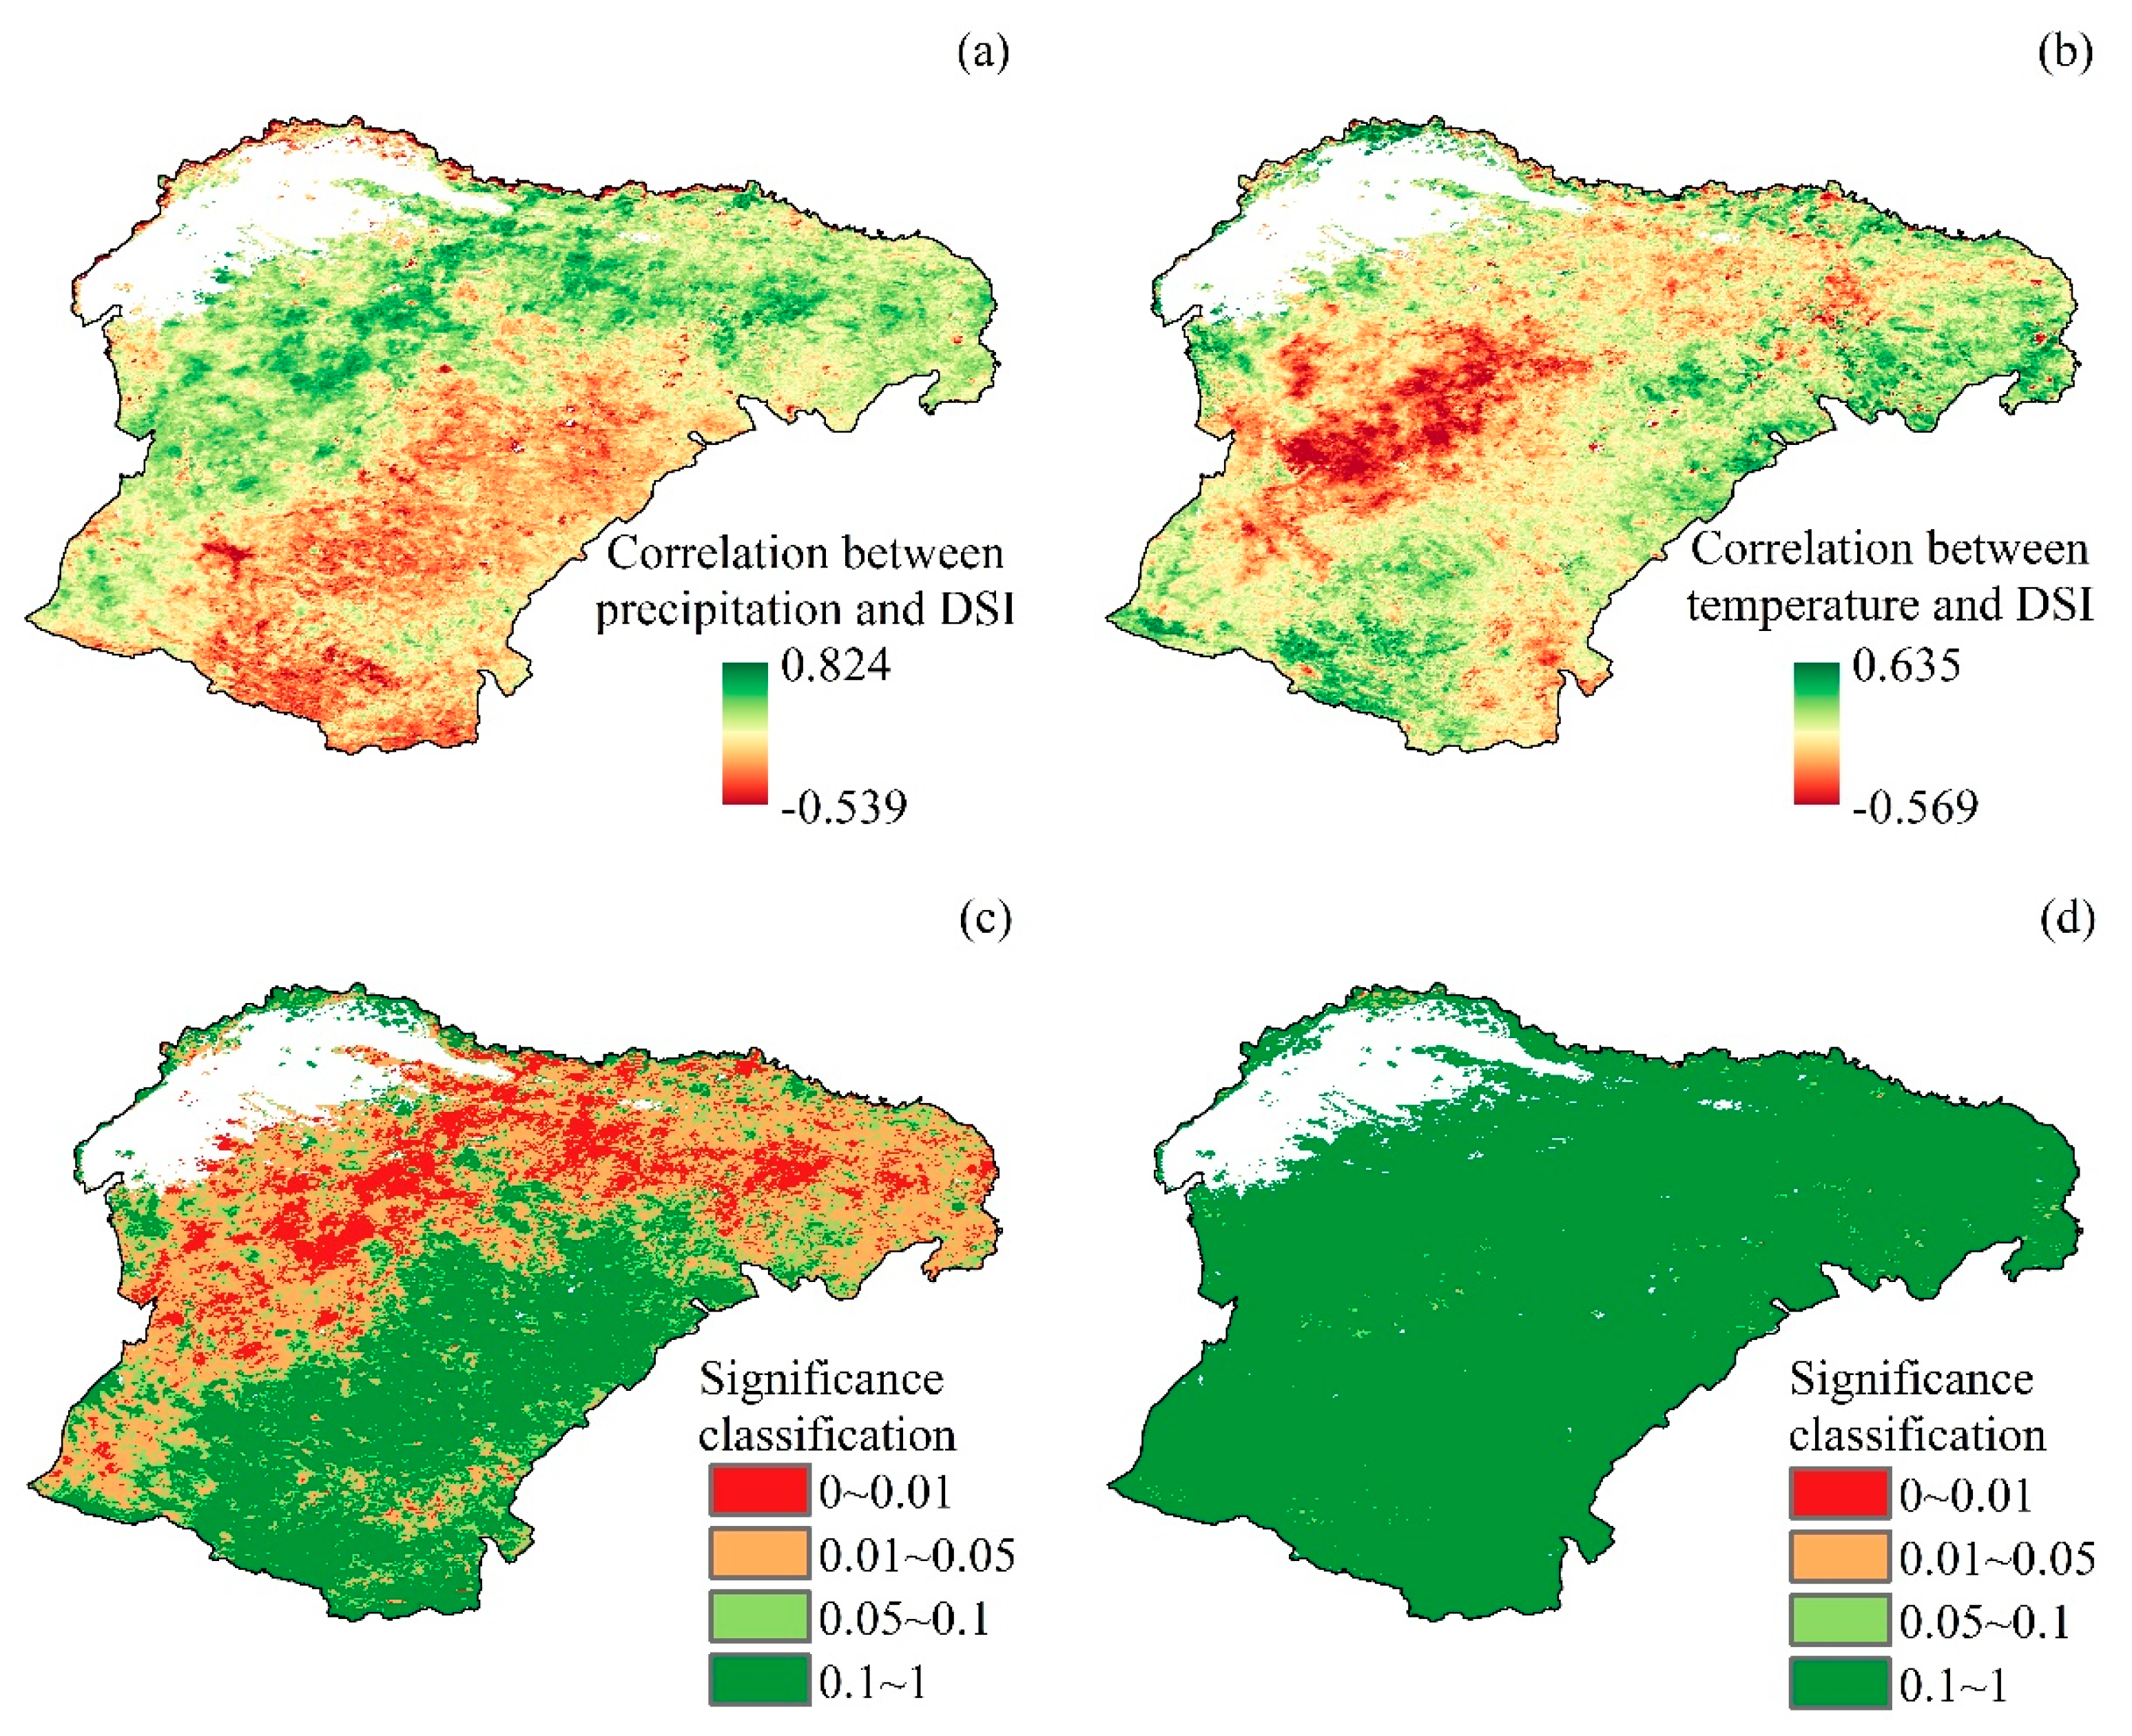
3.2.3. Impact of Climatic Factors on DSI

As shown in Figure 9, the DSI mainly showed a negative correlation with precipitation in 69.64% of the study area, with the remaining area showing a positive correlation, and these correlations significant in 43.58% of the area (p < 0.05). While the DSI mainly displayed a positive correlation with temperature, a large area in the center of the study area showed a negative correlation. Temperature increases in moisture-deficient areas cannot contribute to evaporation resulting in an increase in PET, and a greater disparity between PET and ET and a reduced DSI. While the DSI showed positive and negative correlations with temperature in 72.25% and 27.75% of the total area, respectively, these correlations were significant in only 0.2% of the area (p < 0.05).

4. Discussion

4.1. Characteristics of Spatial and Temporal Variations of Drought in Ordos

Global warming has led to frequent extreme weather events [33,34,35], and Ordos City is no exception. Climate warming has enhanced evapotranspiration, further aggravating the trend of aridification, and significantly changing the regional ecological environment. Using the DSI to study the characteristics of drought change and its influencing factors is helpful to promote the sustainable development of Ordos agriculture and the ecological environment. The assessment of drought in Ordos from 2001 to 2020 in the present study highlighted the performance of drought mitigation over the last two decades. The results of the present study showed decreasing and increasing trends in the DSI in the west and east, respectively, consistent with the findings of Liang et al. (2019) [36]. The results suggest the highest probability of drought in central-western Ordos, with this probability decreasing outward. In contrast, the highest probabilities of mild drought were in the southwest and east, which contradicts the findings of Peng et al. (2023) [37] who identified the highest probability of drought in the west based on the standardized precipitation index (SPI). This conflicting result can possibly be attributed to differences in the drought evaluation indices used, the basis of the drought class classification, and the study period [38,39,40]. A previous study assessed spatiotemporal properties of drought in Inner Mongolia based on the standardized precipitation-evapotranspiration index (SPEI) according to data obtained from meteorological stations. This approach may not be able to accurately describe drought at regional scales or in areas with very few meteorological stations. Therefore, the present study applied the DSI integrating the ET, PET, and NDVI to evaluate drought. This integration of ET, PET, and the NDVI into the DSI can likely explain the contradictions [41,42,43,44]. The results of the present study indicated mild drought in Yijinhuoluoqi Banner, Dalateqi Banner, Dongsheng City, Hangjin Banner, and Ertok Banner; moderate drought was identified in areas with dominant land use types of grassland, desert grassland, sand, and desert, including eastern Hangjin Banner, northeastern Ertok Banner, and Yijinhuoluoqi Banner. Severe drought was identified in Yijinhuoluoqi Banner and the surrounding areas, which could be attributed to a low rainfall and high temperature. This high evapotranspiration influences the vertical flux of energy and soil moisture, thereby changing soil filtration and triggering drought [45]. Zhungeer Banner and northern Wushenqi Banner were unique, with typical grassland in the former and sandy land in the latter preventing conditions of low rainfall and high temperature causing drought.

4.2. Analysis of the Drivers of the Ordos Drought

The present study considered vegetation within the assessment of drought in Ordos since drought has considerable and complex impacts on vegetation [46,47,48]. This is because drought reduces soil moisture, thereby influencing vegetation growth and development [49]. The knock-on effects are reductions in the productivity and carbon fixation capacity of vegetation [50] as well as changes to vegetation structure and function. This can lead to a disruption of vegetation stability and diversity [51] and to degradation of the ecosystem through interference with energy and material cycles [52]. The responses of vegetation to drought differ among the different vegetation types, including regulation of water absorption, movement, and transpiration by changing root depth, leaf size, stomatal conductance, and osmotic pressure [53]. There is also a negative relationship between altitude and drought given the increase in precipitation at higher altitudes [54]. However, this positive relationship between altitude and precipitation only occurs up to a certain altitude, above which the relationship becomes negative [55]. Consequently, the influences of various factors on drought are complex, and drought can be regulated by climate factors, vegetation, topography, and geographic location [56,57,58]. Especially in the quantitative study of multifactor interactions, the existing methods often lack in-depth quantitative analysis of data, and it is difficult to reveal the interaction between multiple variables, multicollinearity and heteroscedasticity, and ignore the complex interaction between drought and the environment. In order to reveal the driving mechanism of drought change more accurately, the Geodetector model can understand the complex relationship between drought and environment more comprehensively and deeply. Some previous studies examining correlations between soil moisture and climate factors in Ordos found that increasing precipitation and temperature promotes ET, resulting in an increase in the DSI. Their findings suggest increases in precipitation and temperature act to mitigate drought, with the former having the larger impact in Ordos, consistent with the conclusions of Zhong et al. [59]. Given the patterns of change in climate in Ordos from warm-drying to warm-humidification, the dependency of soil moisture on precipitation has decreased. The influence of air temperature on soil condition in the human zone exceeded that of precipitation, and directly regulated water vapor evaporation from the soil and evapotranspiration.

4.3. Uncertainties and Limitations

The results of the present study can act as a reference for effective drought mitigation measures in the future, and can guide management of ecological risk to Ordos posed by climate change. The DSI currently uses 0.5 as the weight coefficient of ET/PET and the NDVI based on experience, without considering the differences in their respective contributions to drought in time and space. There is a time lag in the response of the NDVI to drought, and soil moisture reflects the comprehensive effect of surface precipitation and evapotranspiration, which is one of the key indicators of drought monitoring. Subsequent studies should link the NDVI and ET/PET with soil moisture data to improve the synchronicity of the three responses to drought, and further study the difference in the three contributions to drought in time and space. Based on this, the weight coefficients of the three should be adjusted, and the DSI should be optimized to improve the accuracy of drought monitoring. Given the complexity of drought and the large number of influencing factors, the application of simple meteorological indicators or remote sensing monitoring methods cannot comprehensively reflect the dynamic characteristics of drought. In contrast, the DSI can be considered an effective indicator of drought due to its consideration of remote-sensed indicators and meteorological drought indices. Future research should further improve the utilization rate of remote-sensing data. These studies can help alleviate future agricultural droughts.

5. Conclusions

Drought is a meteorological phenomenon characterized by significant impacts on human activities. In this work, Ordos showed different degrees of drought over the last two decades, with a decreasing trend in drought area, the largest area of drought in 2001 (93.23%), and a decreasing trend in normal drought conditions, with the largest area of normal drought area in 2011 (34.95%). Temperature, precipitation, soil type, land use type, and elevation were the main factors driving aridification in the study area. Interactions between elevation and temperature, precipitation, sunshine hours, and relative humidity were the dominant interactions driving aridification. To sum up, the process of the study area is a multifactor, multilevel complex system. A comprehensive consideration of the drivers and their interaction mechanisms is needed to fully understand and effectively address the problem of drought. The influence of the DEM on temperature, precipitation and other factors is helpful to further study the formation mechanism of drought in Ordos. Through the study of these interactions, a more accurate meteorological drought prediction model can be established to provide a scientific basis for coping with drought disasters. There are desertification problems in some areas of Ordos. The interaction between the DEM and climate factors has an important influence on the development of desertification. The government will be able to formulate corresponding desertification prevention and control policies according to the degree of desertification and climate characteristics in different elevations. For example, in the low DEM and dry areas, the construction of windproof and sand-fixing projects could be strengthened to control the expansion of desertification; in areas with high DEM and relatively high rainfall, afforestation and other measures could be adopted to improve the ecological environment and reduce soil erosion.

Author Contributions

Writing—original draft, S.W.; methodology, Y.W.; writing—review & editing, M.L.; formal analysis, Q.Z.; software, W.L. All authors have read and agreed to the published version of the manuscript.

Funding

This study was patronized by the Key Special Project of ‘Science and Technology Revitalizing Inner Mongolia’ Action in Inner Mongolia Autonomous Region (2022EEDSKJXM004); the Major Science and Technology Innovation Pilot Project for Water Resources Protection and Integrated-Saving Utilization in the Yellow River Basin of Inner Mongolia Autonomous Region (Grant No. 2023JBGS0007); the Inner Mongolia Natural Science Youth Foundation (Grant No. 2023QN05003).

Data Availability Statement

The original contributions presented in this study are included in the article. Further inquiries can be directed to the corresponding author.

Acknowledgments

Thanks to the reviewers and editors for their contributions to this manuscript.

Conflicts of Interest

The authors declare no conflicts of interest.

References

  1. Xu, L.; Chen, N.; Yang, C.; Zhang, C.; Yu, H. A parametric multivariate drought index for drought monitoring and assessment under climate change. Agric. For. Meteorol. 2021, 310, 108657. [Google Scholar] [CrossRef]
  2. Xu, L.; Abbaszadeh, P.; Moradkhani, H.; Chen, N.; Zhang, X. Continental drought monitoring using satellite soil moisture, data assimilation and an integrated drought index. Remote. Sens. Environ. 2020, 250, 112028. [Google Scholar] [CrossRef]
  3. Yang, B.; Cui, Q.; Meng, Y.; Zhang, Z.; Hong, Z.; Hu, F.; Li, J.; Tao, C.; Wang, Z.; Zhang, W. Combined multivariate drought index for drought assessment in China from 2003 to 2020. Agric. Water Manag. 2023, 281, 108241. [Google Scholar] [CrossRef]
  4. Javed, T.; Li, Y.; Rashid, S.; Li, F.; Hu, Q.; Feng, H.; Chen, X.; Ahmad, S.; Liu, F.; Pulatov, B. Performance and relationship of four different agricultural drought indices for drought monitoring in China’s mainland using remote sensing data. Sci. Total Environ. 2021, 759, 143530. [Google Scholar] [CrossRef] [PubMed]
  5. Liu, Q.; Zhang, S.; Zhang, H.; Bai, Y.; Zhang, J. Monitoring drought using composite drought indices based on remote sensing. Sci. Total Environ. 2020, 711, 134585. [Google Scholar] [CrossRef]
  6. Bageshree, K.; Abhishek; Kinouchi, T. A multivariate drought index for seasonal agriculture drought classification in semiarid regions. Remote Sens. 2022, 14, 3891. [Google Scholar] [CrossRef]
  7. Alahacoon, N.; Edirisinghe, M. A comprehensive assessment of remote sensing and traditional based drought monitoring indices at global and regional scale. Geomat. Nat. Hazards Risk 2022, 13, 762–799. [Google Scholar] [CrossRef]
  8. Mao, X.; Ren, H.L.; Liu, G. Primary Interannual Variability Patterns of the Growing-Season NDVI over the Tibetan Plateau and Main Climatic Factors. Remote Sens. 2022, 14, 5183. [Google Scholar] [CrossRef]
  9. Jiang, W.; Wang, L.; Zhang, M.; Yao, R.; Chen, X.; Gui, X.; Sun, J.; Cao, Q. Analysis of drought events and their impacts on vegetation productivity based on the integrated surface drought index in the Hanjiang River Basin, China. Atmos. Res. 2021, 254, 105536. [Google Scholar] [CrossRef]
  10. Dikshit, A.; Pradhan, B.; Alamri, A.M. Temporal hydrological drought index forecasting for New South Wales, Australia using machine learning approaches. Atmosphere 2020, 11, 585. [Google Scholar] [CrossRef]
  11. Doshi, S.C.; Shanmugam, M.S.; Akib, S. Assessment of artificial neural network through drought indices. Eng 2022, 4, 31–46. [Google Scholar] [CrossRef]
  12. Kukunuri, A.N.J.; Murugan, D.; Singh, D. Variance based fusion of VCI and TCI for efficient classification of agriculture drought using MODIS data. Geocarto Int. 2022, 37, 2871–2892. [Google Scholar] [CrossRef]
  13. Liu, Q.; Zhang, J.; Zhang, H.; Yao, F.; Bai, Y.; Zhang, S.; Meng, X.; Liu, Q. Evaluating the performance of eight drought indices for capturing soil moisture dynamics in various vegetation regions over China. Sci. Total. Environ. 2021, 789, 147803. [Google Scholar] [CrossRef] [PubMed]
  14. Park, S.; Ryu, D.; Fuentes, S.; Chung, H.; O’connell, M.; Kim, J. Dependence of CWSI-based plant water stress estimation with diurnal acquisition times in a nectarine orchard. Remote Sens. 2021, 13, 2775. [Google Scholar] [CrossRef]
  15. Nie, Y.; Tan, Y.; Deng, Y.; Yu, J. Suitability Evaluation of Typical Drought Index in Soil Moisture Retrieval and Monitoring Based on Optical Images. Remote Sens. 2020, 12, 2587. [Google Scholar] [CrossRef]
  16. Lu, X.; Zhao, H.; Huang, Y.; Liu, S.; Ma, Z.; Jiang, Y.; Zhang, W.; Zhao, C. Generating Daily Soil Moisture at 16 m Spatial Resolution Using a Spatiotemporal Fusion Model and Modified Perpendicular Drought Index. Sensors 2022, 22, 5366. [Google Scholar] [CrossRef]
  17. Yuan, L.; Li, L.; Zhang, T.; Chen, L.; Zhao, J.; Hu, S.; Cheng, L.; Liu, W. Soil moisture estimation for the Chinese Loess Plateau using MODIS-derived ATI and TVDI. Remote Sens. 2020, 12, 3040. [Google Scholar] [CrossRef]
  18. Sun, P.; Ma, Z.; Zhang, Q.; Singh, V.P.; Xu, C.-Y. Modified drought severity index: Model improvement and its application in drought monitoring in China. J. Hydrol. 2022, 612, 128097. [Google Scholar] [CrossRef]
  19. Tong, D.; Bai, Y.; Zhang, S.; Liu, Q.; Yang, J. Applicability of drought severity index (DSI) in remote sensing monitoring of drought in Shandong Province. Chin. J. Agrometeorol. 2020, 41, 102–112. [Google Scholar]
  20. Huang, J.; Zhuo, W.; Li, Y.; Huang, R.; Sedano, F.; Su, W.; Dong, J.; Tian, L.; Huang, Y.; Zhu, D. Comparison of three remotely sensed drought indices for assessing the impact of drought on winter wheat yield. Int. J. Digit. Earth 2020, 13, 504–526. [Google Scholar] [CrossRef]
  21. Angearu, C.-V.; Ontel, I.; Boldeanu, G.; Mihailescu, D.; Nertan, A.; Craciunescu, V.; Catana, S.; Irimescu, A. Multi-temporal analysis and trends of the drought based on MODIS data in agricultural areas, Romania. Remote Sens. 2020, 12, 3940. [Google Scholar] [CrossRef]
  22. Liu, X.; Wang, S.; Wu, Y. Remote Sensing Identification and the Spatiotemporal Variation of Drought Characteristics in Inner Mongolia, China. Forests 2023, 14, 1679. [Google Scholar] [CrossRef]
  23. Gang, C.; Zhang, Y.; Guo, L.; Gao, X.; Peng, S.; Chen, M.; Wen, Z. Drought-induced carbon and water use efficiency responses in dryland vegetation of northern China. Front. Plant Sci. 2019, 10, 224. [Google Scholar] [CrossRef] [PubMed]
  24. Khan, M.S.; Liaqat, U.W.; Baik, J.; Choi, M. Stand-alone uncertainty characterization of GLEAM, GLDAS and MOD16 evapotranspiration products using an extended triple collocation approach. Agric. For. Meteorol. 2018, 252, 256–268. [Google Scholar] [CrossRef]
  25. Wang, F.; Wang, Z.; Yang, H.; Di, D.; Zhao, Y.; Liang, Q. A new copula-based standardized precipitation evapotranspiration streamflow index for drought monitoring. J. Hydrol. 2020, 585, 124793. [Google Scholar] [CrossRef]
  26. Liu, H.; Li, X.; Mao, F.; Zhang, M.; Zhu, D.; He, S.; Huang, Z.; Du, H. Spatiotemporal evolution of fractional vegetation cover and its response to climate change based on MODIS data in the subtropical region of China. Remote Sens. 2021, 13, 913. [Google Scholar] [CrossRef]
  27. Ji, B.; Qin, Y.; Zhang, T.; Zhou, X.; Yi, G.; Zhang, M.; Li, M. Analyzing Driving Factors of Drought in Growing Season in the Inner Mongolia Based on Geodetector and GWR Models. Remote Sens. 2022, 14, 6007. [Google Scholar] [CrossRef]
  28. Zhang, S.; Zhou, Y.; Yu, Y.; Li, F.; Zhang, R.; Li, W. Using the geodetector method to characterize the spatiotemporal dynamics of vegetation and its interaction with environmental factors in the qinba mountains, China. Remote Sens. 2022, 14, 5794. [Google Scholar] [CrossRef]
  29. Wang, W.; Samat, A.; Abuduwaili, J.; Ge, Y. Quantifying the influences of land surface parameters on LST variations based on GeoDetector model in Syr Darya Basin, Central Asia. J. Arid Environ. 2021, 186, 104415. [Google Scholar] [CrossRef]
  30. Cheng, G.; Liu, T.; Wang, S.; Wu, Y.; Zhang, C. Responses to the Impact of Drought on Carbon and Water Use Efficiency in Inner Mongolia. Land 2023, 12, 583. [Google Scholar] [CrossRef]
  31. Wang, S.; Li, R.; Wu, Y.; Zhao, S. Effects of multi-temporal scale drought on vegetation dynamics in Inner Mongolia from 1982 to 2015, China. Ecol. Indic. 2022, 136, 108666. [Google Scholar] [CrossRef]
  32. Song, Y.; Wang, J.; Ge, Y.; Xu, C. An optimal parameters-based geographical detector model enhances geographic characteristics of explanatory variables for spatial heterogeneity analysis: Cases with different types of spatial data. GIScience Remote Sens. 2020, 57, 593–610. [Google Scholar] [CrossRef]
  33. Lenton, T.M.; Xu, C.; Abrams, J.F.; Ghadiali, A.; Loriani, S.; Sakschewski, B.; Zimm, C.; Ebi, K.L.; Dunn, R.R.; Svenning, J.-C. Quantifying the human cost of global warming. Nat. Sustain. 2023, 6, 1237–1247. [Google Scholar] [CrossRef]
  34. Zhang, X.; Hao, Z.; Singh, V.P.; Zhang, Y.; Feng, S.; Xu, Y.; Hao, F. Drought propagation under global warming: Characteristics, approaches, processes, and controlling factors. Sci. Total Environ. 2022, 838, 156021. [Google Scholar] [CrossRef]
  35. Vicente-Serrano, S.M.; Quiring, S.M.; Peña-Gallardo, M.; Yuan, S.; Domínguez-Castro, F. A review of environmental droughts: Increased risk under global warming? Earth-Sci. Rev. 2020, 201, 102953. [Google Scholar] [CrossRef]
  36. Liang, Y.; Zhang, Z.; Lu, L.; Cui, X.; Qian, J.; Zou, S.; Ma, X. Trend in Satellite-Observed Vegetation Cover and Its Drivers in the Gannan Plateau, Upper Reaches of the Yellow River, from 2000 to 2020. Remote Sens. 2022, 14, 3849. [Google Scholar] [CrossRef]
  37. Peng, J.; Wu, C.; Zhang, X.; Wang, X.; Gonsamo, A. Satellite detection of cumulative and lagged effects of drought on autumn leaf senescence over the Northern Hemisphere. Glob. Chang. Biol. 2019, 25, 2174–2188. [Google Scholar] [CrossRef]
  38. An, Q.; He, H.; Nie, Q.; Cui, Y.; Gao, J.; Wei, C.; Xie, X.; You, J. Spatial and Temporal Variations of Drought in Inner Mongolia, China. Water 2020, 12, 1715. [Google Scholar] [CrossRef]
  39. Pei, Z.; Fang, S.; Wang, L.; Yang, W. Comparative Analysis of Drought Indicated by the SPI and SPEI at Various Timescales in Inner Mongolia, China. Water 2020, 12, 1925. [Google Scholar] [CrossRef]
  40. Yu, D.; Li, Y.; Yin, B.; Wu, N.; Ye, R.; Liu, G. Spatiotemporal variation of net primary productivity and its response to drought in Inner Mongolian desert steppe. Glob. Ecol. Conserv. 2022, 33, e01991. [Google Scholar] [CrossRef]
  41. Wei, Y.; Zhu, L.; Chen, Y.; Cao, X.; Yu, H. Spatiotemporal Variations in Drought and Vegetation Response in Inner Mongolia from 1982 to 2019. Remote Sens. 2022, 14, 3803. [Google Scholar] [CrossRef]
  42. Wang, Y.; Zhang, C.; Meng, F.-R.; Bourque, C.P.A.; Zhang, C. Evaluation of the suitability of six drought indices in naturally growing, transitional vegetation zones in Inner Mongolia (China). PLoS ONE 2020, 15, e0233525. [Google Scholar] [CrossRef] [PubMed]
  43. Han, L.; Zhang, Q.; Zhang, Z.; Jia, J.; Wang, Y.; Huang, T.; Cheng, Y. Drought area, intensity and frequency changes in China under climate warming, 1961–2014. J. Arid Environ. 2021, 193, 104596. [Google Scholar] [CrossRef]
  44. Li, L.; Qian, R.; Liu, W.; Wang, W.; Biederman, J.A.; Zhang, B.; Kang, X.; Wen, F.; Ran, Q.; Zheng, Z.; et al. Drought timing influences the sensitivity of a semiarid grassland to drought. Geoderma 2022, 412, 115714. [Google Scholar] [CrossRef]
  45. Shi, Y.; Cao, Y.; Wu, H.; Xu, C.; Yu, Q.; Zuo, X.; Han, X.; Smith, M.D.; Knapp, A.K.; Wang, C. The responses of photosynthetic rate of dominant species to extreme drought in Inner Mongolia grasslands. J. Plant Ecol. 2024, 17, rtae027. [Google Scholar] [CrossRef]
  46. Ding, Y.; He, X.; Zhou, Z.; Hu, J.; Cai, H.; Wang, X.; Li, L.; Xu, J.; Shi, H. Response of vegetation to drought and yield monitoring based on NDVI and SIF. CATENA 2022, 219, 106328. [Google Scholar] [CrossRef]
  47. Wang, H.; Li, Z.; Cao, L.; Feng, R.; Pan, Y. Response of NDVI of natural vegetation to climate changes and drought in China. Land 2021, 10, 966. [Google Scholar] [CrossRef]
  48. Nejadrekabi, M.; Eslamian, S.; Zareian, M.J. Spatial statistics techniques for SPEI and NDVI drought indices: A case study of Khuzestan Province. Int. J. Environ. Sci. Technol. 2022, 19, 6573–6594. [Google Scholar] [CrossRef]
  49. Li, J.; Xi, M.; Pan, Z.; Liu, Z.; He, Z.; Qin, F. Response of NDVI and SIF to Meteorological Drought in the Yellow River Basin from 2001 to 2020. Water 2022, 14, 2978. [Google Scholar] [CrossRef]
  50. Zhong, F.; Cheng, Q.; Wang, P. Meteorological drought, hydrological drought, and NDVI in the Heihe River basin, Northwest China: Evolution and propagation. Adv. Meteorol. 2020, 2020, 2409068. [Google Scholar] [CrossRef]
  51. Tao, L.; Ryu, D.; Western, A.; Boyd, D. A new drought index for soil moisture monitoring based on MPDI-NDVI trapezoid space using MODIS data. Remote Sens. 2020, 13, 122. [Google Scholar] [CrossRef]
  52. Gaikwad, S.V.; Vibhute, A.D.; Kale, K.V. Assessing meteorological drought and detecting LULC dynamics at a regional scale using SPI, NDVI, and random forest methods. SN Comput. Sci. 2022, 3, 458. [Google Scholar] [CrossRef]
  53. Pompa-García, M.; Camarero, J.J.; Colangelo, M.; González-Cásares, M. Inter and intra-annual links between climate, tree growth and NDVI: Improving the resolution of drought proxies in conifer forests. Int. J. Biometeorol. 2021, 65, 2111–2121. [Google Scholar] [CrossRef] [PubMed]
  54. Jiao, K.; Gao, J.; Liu, Z. Precipitation drives the NDVI distribution on the Tibetan Plateau while high warming rates may intensify its ecological droughts. Remote Sens. 2021, 13, 1305. [Google Scholar] [CrossRef]
  55. Liu, X.; Sun, G.; Fu, Z.; Ciais, P.; Feng, X.; Li, J.; Fu, B. Compound droughts slow down the greening of the Earth. Glob. Chang. Biol. 2023, 29, 3072–3084. [Google Scholar] [CrossRef]
  56. Cartwright, J.M.; Littlefield, C.E.; Michalak, J.L.; Lawler, J.J.; Dobrowski, S.Z. Topographic, soil, and climate drivers of drought sensitivity in forests and shrublands of the Pacific Northwest, USA. Sci. Rep. 2020, 10, 18486. [Google Scholar] [CrossRef]
  57. Ding, Y.; Xu, J.; Wang, X.; Peng, X.; Cai, H. Spatial and temporal effects of drought on Chinese vegetation under different coverage levels. Sci. Total Environ. 2020, 716, 137166. [Google Scholar] [CrossRef]
  58. Liu, L.; Peng, J.; Li, G.; Guan, J.; Han, W.; Ju, X.; Zheng, J. Effects of drought and climate factors on vegetation dynamics in Central Asia from 1982 to 2020. J. Environ. Manag. 2023, 328, 116997. [Google Scholar] [CrossRef]
  59. Zhong, Y.; Lei, L.; Liu, Y.; Hao, Y.; Zou, C.; Zhan, H. The influence of large-scale climate phenomena on precipitation in the Ordos Basin, China. Theor. Appl. Climatol. 2017, 130, 791–805. [Google Scholar] [CrossRef]
Figure 1. Geographic location of study area: (a) digital elevation model, (b) land use type.
Agronomy 14 02265 g001
Figure 2. Inter-year changes in evapotranspiration (ET) (a), potential evapotranspiration (PET) (b), normalized difference vegetation index (NDVI) (c) and drought severity index (DSI) (d) in Ordos from 2001 to 2020.
Agronomy 14 02265 g002
Figure 3. Spatial distributions in mean evapotranspiration (ET) (a), potential evapotranspiration (PET) (b), normalized difference vegetation index (NDVI) (c) and drought severity index (DSI) (d) in Ordos from 2001 to 2020.
Agronomy 14 02265 g003
Figure 4. Spatial change characteristics of evapotranspiration (ET) (a), potential evapotranspiration (PET) (b), normalized difference vegetation index (NDVI) (c) and drought severity index (DSI) (d) in Ordos from 2001 to 2020.
Agronomy 14 02265 g004
Figure 5. Significant spatial changes in evapotranspiration (ET) (a), potential evapotranspiration (PET) (b), normalized difference vegetation index (NDVI) (c) and drought severity index (DSI) (d) in Ordos from 2001 to 2020.
Agronomy 14 02265 g005
Figure 6. Area variations in drought degree classification.
Agronomy 14 02265 g006
Figure 7. Explanatory power of each driving factor to DSI. Note: q value is power of determinant (PD).
Agronomy 14 02265 g007
Figure 8. Explanatory powers of factors and their interactions on drought severity index (DSI) in Ordos from 2001 to 2020.
Agronomy 14 02265 g008
Figure 9. Spatial distribution of correlations between climate factors (a), precipitation; (b), temperature and drought severity index (DSI) as well as their significant ((c), precipitation; (d), temperature) in Ordos from 2001 to 2020.
Agronomy 14 02265 g009
Table 1. Classification of interaction detector interaction types.
Basis of JudgmentInteraction
q(X1∩X2) < min[q(X1), q(X2)]Nonlinearity attenuation
min[q(X1), q(X2)] < q(X1∩X2) < max[q(X1), q(X2)]Single-factor nonlinearity decreases
(X1∩X2) > max[q(X1), q(X2)]Two-factor enhancement
q(X1∩X2) = q(X1) + q(X2)Independent
q(X1∩X2) > q(X1) + q(X2)Nonlinear enhancement
Disclaimer/Publisher’s Note: The statements, opinions and data contained in all publications are solely those of the individual author(s) and contributor(s) and not of MDPI and/or the editor(s). MDPI and/or the editor(s) disclaim responsibility for any injury to people or property resulting from any ideas, methods, instructions or products referred to in the content.

