Article

Strategic Light Use Efficiency Optimization of Hydroponic Lettuce Exposed to Different Photosynthetic Photon Flux Densities

by
Peyton Lou Palsha
1,†,
Marc W. van Iersel
1,†,
Ryan William Dickson
2,
Lynne Seymour
3,
Melanie Yelton
4,
Kuan Qin
1 and
Rhuanito Soranz Ferrarezi
1,*
1
Department of Horticulture, University of Georgia, 1111 Miller Plant Sciences, Athens, GA 30602, USA
2
Department of Horticulture, University of Arkansas, 316 Plant Sciences Building, Fayetteville, AR 72701, USA
3
Department of Statistics, University of Georgia, 310 Herty Drive, Athens, GA 30602, USA
4
Grow Big Consultants, San Francisco, CA 94105, USA
*
Author to whom correspondence should be addressed.
These authors contributed equally to this work.
Agronomy 2024, 14(10), 2281; https://doi.org/10.3390/agronomy14102281
Submission received: 19 July 2024 / Revised: 27 September 2024 / Accepted: 30 September 2024 / Published: 4 October 2024

Abstract

:
Light use efficiency characterizes the ability of a crop to convert radiation into biomass. Determining optimum cultivar-specific photosynthetic photon flux density (PPFD) values from sole-source lighting can be used to optimize leaf expansion, maximize biomass, and shorten the production period. This study evaluated the growth of hydroponic lettuce (Lactuca sativa) ‘Rex’ cultivated under different PPFD levels using sole-source lighting. At lower PPFD levels of 201 to 292 µmol·m−2·s−1, the plant projected canopy size (PCS) and specific leaf area increased to enhance light capture by 36.2% as compared to higher PPFD levels (333 and 413 µmol·m−2·s−1), while plants exhibited 10.3% lower canopy overlap ratio and 27.8% lower shoot dry weights. Both low and high PPFD conditions lead to a similar trend in PCS among plants. Light use efficiency was not a major factor in influencing lettuce growth. Instead, the critical factor was the total incident light the plants received. This study showcased the importance of incident light and PPFD on the growth, morphology, and biomass accumulation in lettuce.

1. Introduction

Many steps of plant development are driven by the presence of light in terms of its quantity (light intensity), quality (wavelength or light spectrum), direction or distribution, and duration (photoperiod) due to photoreceptors (e.g., phytochromes and cryptochromes) present in plants [1,2]. For most greenhouse-grown vegetable and ornamental crops, a 1% increment in light quantity through photoperiod or light intensity will result in a 0.5% to 1% increase in their harvestable production. This dependence on light has encouraged the widespread use of supplemental light to increase plant production [3].
Not all the spectral wavelengths from sunlight can be absorbed and used by plants for photosynthesis; instead, only photosynthetically active radiation (PAR)—which falls within the 400 to 700 nm range—can be absorbed by chlorophyll and other pigments within the photosynthetic apparatus [4]. Photosynthetic photon flux density (PPFD) is a quantitative light intensity unit representing the total photons of PAR incident on a unit surface per unit time, expressed as micromoles per meter square per second [5]. Photoperiod is the duration of light per 24 h period, while daily light integral (DLI) is the total sum of PAR in 24 h [6]. Commercial greenhouse leafy vegetables (e.g., lettuce Lactuca sativa L. and basil Ocimum basilicum L.) production typically achieves a DLI of 10–16 mol·m–2·d–1 by adding daily 16–20 h of 100–200 μmol·m–2·s–1 supplemental light [1,7].
Maintaining the PPFD value between the maximum photosynthetic rate per unit PPFD and the light saturation point leads to a shorter production time, with reductions in light, electrical requirements and costs; and, consequently, generating higher profits for commercial growers [8]. Normally, a low PPFD causes plant elongation and leaf expansion to augment light absorption by plants, while a high PPFD tends to cause plant compactness due to light avoidance [8]. Crop-specific PPFD levels achieved through supplemental lighting can optimize biomass production by increasing leaf area and amplifying the light captured by the canopy.
Crop growth is also influenced by the quantity of incident light penetrating the canopy or projected canopy size (PCS), and light use efficiency (LUE). While daily PCS can be measured through nondestructive digital imaging methods [9], LUE measures how efficiently a crop converts the total incident light a plant receives throughout its entire growing cycle into plant growth and biomass production [10]. A larger PCS and a higher LUE will lead to faster plant growth. This concept is important in controlled environmental agriculture (CEA, e.g., greenhouses and vertical farms/plant factories) because identifying rapid early development in a crop’s growth cycle can guide the efficient use of supplemental lighting [5,11].
To improve LUE, plants have morphological strategies to enhance their access to the light source; for example, elongating stems, elevating and expanding leaves, reducing branching, and accelerating flowering [12]. Several strategies may be used to improve LUE, such as: (1) using light-emitting diodes (LEDs) with high PAR efficiency [11,13,14]; (2) modifying the position and design of the lighting fixtures to minimize shadows while tailoring the light spectrum for enhanced plant growth [15]; (3) using a sensor-based biofeedback system to control light requirements precisely [16]; (4) optimizing light direction from the top, side, and bottom to improve LUE [17], among other strategies; and (5) using models to predict plant growth under different light intensities and photoperiods with optimal adjustments [18].
Vertical farms/plant factories in which plants are grown in vertically stacked layers under a sole-source LED light carry the potential to optimize LUE for maximum production, potentially offsetting the high energy cost required. The average LUE in these facilities is 41% and 96% higher than greenhouse-grown and field-grown lettuce [19]. To maximize crop yield utilizing LUE, it is crucial to understand plants’ morphological, photosynthetic, and photochemical responses to different light levels [20].
This study aimed to evaluate the effects of PPFD on plant morphology, growth, and LUE in hydroponic lettuce. We hypothesized that elevating PPFD rates through sole-source supplemental lighting would increase biomass production by increasing the total incident light captured by the canopy, potentially at the expense of reduced LUE. Additionally, we aimed to explore how lettuce morphology can adapt under different PPFD conditions to enhance its light capture capacity.

2. Materials and Methods

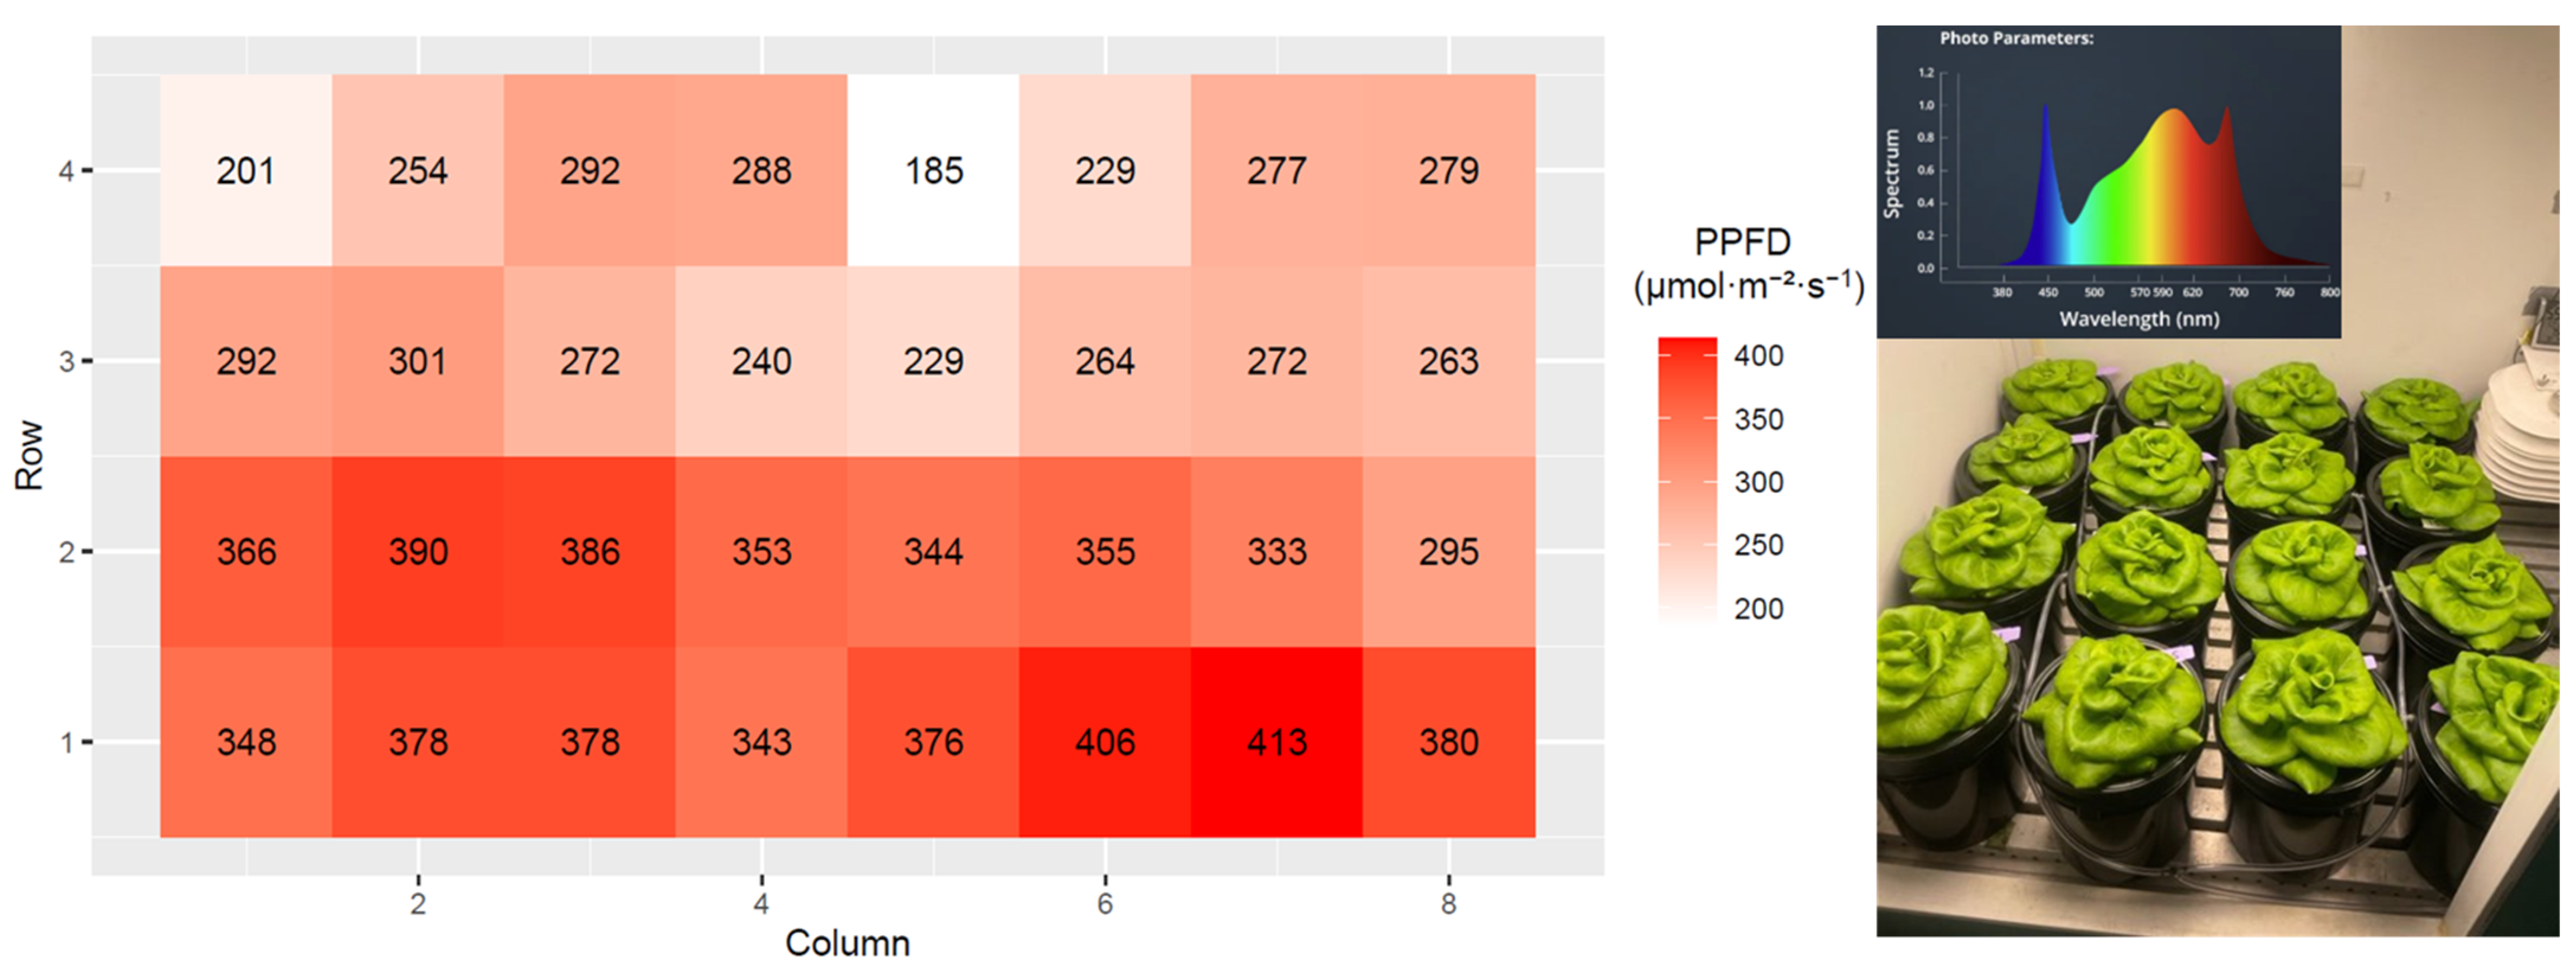
2.1. Experimental Configuration and Environmental Conditions

This study was performed in a growth chamber (PGR15 Conviron Controlled Environment Chamber, Winnipeg, MB, Canada) at the Horticultural Physiology Laboratory (University of Georgia) in Athens, GA, USA (latitude: 33.9480° N, longitude: 83.3773° W), from 20 April to 27 May 2022. Plants were grown with a bench space of 1.4 m2. The lighting sources for the growth chamber were sole-source LED panels (P1000-300-02, ViparSpectra, Richmond, CA, USA) including 660 nm red light, 3000 K–5000 K white light, and 730 nm far red (infrared) to promote plant growth. The average temperature was 20 ± 1.4 °C, the vapor pressure deficit 1.2 ± 0.2 kPa, the relative humidity 38.0% ± 2.1, and the ambient carbon dioxide (CO2) 400 µmol mol−1.

2.2. Seedling Production in a Walk-In Vertical Farm

Pelleted ‘Rex’ lettuce seeds (Johnny’s Selected Seeds, Winslow, ME, USA) were sowed in 2.5 × 2.5 × 4 cm rockwool plugs (A0 25/40; Grodan Rockwool BV, Roermond, The Netherlands) for seedling production. The 120-plug tray was placed in double-stacked black rectangular plastic mesh trays (50.8 cm long × 12.7 cm wide × 5.08 cm tall) and then covered with transparent plastic domes for 4 days to maintain high humidity during germination. Plants were placed under 1.1 m-long white LED light fixtures (RAY with Physiospec indoor spectrum; Fluence, Arlington, VA, USA), which provided 250 µmol·m−2·s−1 of PAR over a 16 h photoperiod. The tray was subirrigated daily for 5 min using an ebb-and-flow system that contained a 15N–2.2P–12.45K water-soluble fertilizer solution using 100 mg·L−1 nitrogen (N) (15–5–15 Cal-Mag Jack’s Professional LX; J. R. Peters, Allentown, PA, USA).

2.3. Transplant to Growth Chambers

Eleven days after seeding, the most uniform seedlings were transplanted into a deep water culture hydroponic system using 4.8 cm tall × 4.5 cm (top-diameter) × 3.3 cm (bottom-diameter) net pots (Teku G46; Pöppelmann, Lohne, Germany), and placed into individual 3.78 L black buckets. Matching lids were placed on the buckets with a 4.1 cm hole drilled through the middle of the lid to hold each net pot and plant. The same hydroponic fertilizer solution was used for each 3.78 L bucket and was a combination of three different water-soluble fertilizers: Blend 9-7-37 (Hydroponic Fertilizer; HortAmericas, Bedford, TX, USA); calcium nitrate or Ca(NO3) (YaraTera Calcinit; Yara, Oslo, Norway); and magnesium sulfate or MgSO4 (EPSOTop; K + S Minerals and Agriculture, Kassel, Germany). This fertilizer blend resulted in a final nutrient concentration, as shown in Table 1.
Plastic tubing and air stones (Pawfly Aquarium Air Stone, Guangzhou, China) were placed in each bucket to provide proper aeration to the fertilizer solution using an air pump (EcoPlus-7 with 0.48 bar 3.0 A 120 V tube size 12.7 mm in diameter; Hawthorne Gardening Company, Vancouver, WA, USA). The initial solution pH was 6.36, and electrical conductivity (EC) was 1.46 mS cm−1 before transplanting. 1 M H3PO4 solution was used to maintain a 5.5 to 6.5 solution pH during the study. The pH varied over time, and the pH levels exceeded 6.5, with the highest recorded pH reaching 7.64 before being adjusted back to within the desired range.

2.4. Treatments

Sole-source LED illumination in the growth chamber with different PPFD levels spanning from 201 to 413 µmol·m−2·s−1 was used as light quantity treatments to provide a range from average to high light levels within what is considered economically feasible. Values higher than 413 µmol·m−2s−1 have high installation and operation costs and were not used. Treatments were imposed by changing how light was distributed within the growth chamber, resulting in varying PPFD values across different locations inside the chamber, from 201 to 413 µmol·m−2·s−1, where individual plants grew (Figure 1). This was designed to allow multiple light regimens inside the chamber, the light level was carefully measured using a light mapper and maintained to be constant throughout the experiment. Light levels were measured using an extended PAR 400–750 nm light sensor (MQ-200X Series; Apogee Instruments, Logan, UT, USA), which quantified the PPFD provided to each plant. The photoperiod was 16 h from 6:00–22:00, yielding a DLI between 11.6 and 23.8 mol·m−2·d−1.

2.5. Projected Canopy Size Imaging

An imaging system based on chlorophyll fluorescence was used to determine PCS to predict lettuce biomass accumulation throughout a growing cycle [9]. Chlorophyll fluorescence makes up 1–2% of absorbed light, which helps visualize only plant area tissue without background interference [21]. Plants were individually imaged upon transplanting. The imaging system setup required a light-proof grow tent (0.6 m wide × 0.6 m long × 1.2 m tall) with a Mylar reflective interior lining on the inside sides of the tent. A monochrome camera (Chameleon® 3; FLIR, Wilsonville, OR, USA) was mounted and centered at the top of the grow tent between two blue LED light panels (Pro 650e; LumiGrow, Emeryville, CA, USA) facing downwards. The camera had a 650–1100 nm long-pass filter (SP700-R45X2; Midwest Optical Systems, Palatine, IL, USA). The plants were lifted out of the hydroponic solution and brought to the chlorophyll fluorescence imaging system, where they were placed in an empty black bucket to be imaged [22]. The black buckets were placed in the middle, rested on black shade cloth, and exposed to blue LED light (450–490 nm), allowing the camera to capture only the fluorescence from the chlorophyll in the plants [5]. On day 11, when the seedlings were transplanted, each plant was photographed in the center of the system and then put back into the growth chamber in the same position and orientation. Therefore, the planting position always remained the same. After the initial transplant and calibration images, plant images were taken twice weekly to determine the PCS from 20 April to 27 May 2022.

2.6. Data Collection

The study utilized 32 plants, with 16 (half) harvested midway through the growth cycle. Data acquired from the first harvest were not considered in the analysis, as their primary purpose was to allow growing space for the remaining 16 plants, mitigating crowding issues.
We conducted destructive measurements (harvesting to measure the biomass) on the plants, concluding the growing cycle 23 days after transplanting on 27 May 2022. Measurements were taken to identify each plant’s responses to varying PPFDs, including shoot and root fresh and dry weights for each plant. Additionally, we assessed each plant’s leaf area and PCS using a commercial imaging system (Topview; Aris, Eindhoven, The Netherlands). Before the destructive measurements, plants were subjected to imaging to determine the final PCS. Individual leaves were carefully separated from the plants to gauge the total leaf area using a leaf area meter (LI-3100; LI-COR, Lincoln, NE, USA). Subsequently, shoots and roots were dried in an oven at 80 °C for 5 days for dry weight determination. Comprehensive tissue nutrient analysis on dried plant tissue was performed at Waters Agriculture Labs, Camilla, GA, USA (Supplementary Material S1). Plants’ water content was calculated by (fresh weight-dry weight)/fresh weight.
Total incident light was calculated by multiplying the DLI and the individual PCS (∫DLI × PCS). By analyzing PCS measurements from the chlorophyll fluorescence imaging system, we quantified the daily PCS of each plant and converted the measurements from cm2/pixels to m2/plant. We then multiplied the DLI by daily PCS for each plant to determine the incident light each plant received. The incident light for each day was summed to calculate the total incident light for each plant. LUE was calculated by dividing the total plant dry weight by the total incident light.

2.7. Experimental Design and Statistical Analysis

After setting up the light levels (variations in PPFD) and distributions in the growth chamber, plants were randomly picked from the seedlings’ pool and placed under a PPFD level (Figure 1). Light levels were continuous variables, with each plant being one replication. Each experimental unit comprised one plant, with 16 plants measured in total. Statistical analyses were conducted using single linear regression analysis utilizing statistical software (SigmaPlot version 11.0; Systat Software, San Jose, CA, USA). Regression analyses were used to evaluate the effects of varying PPFD on shoot and root fresh and dry weights per plant, total leaf area per plant (TLA), water content, specific leaf area (SLA), PCS, canopy overlap ratio (COR), LUE, and total incident light.

3. Results

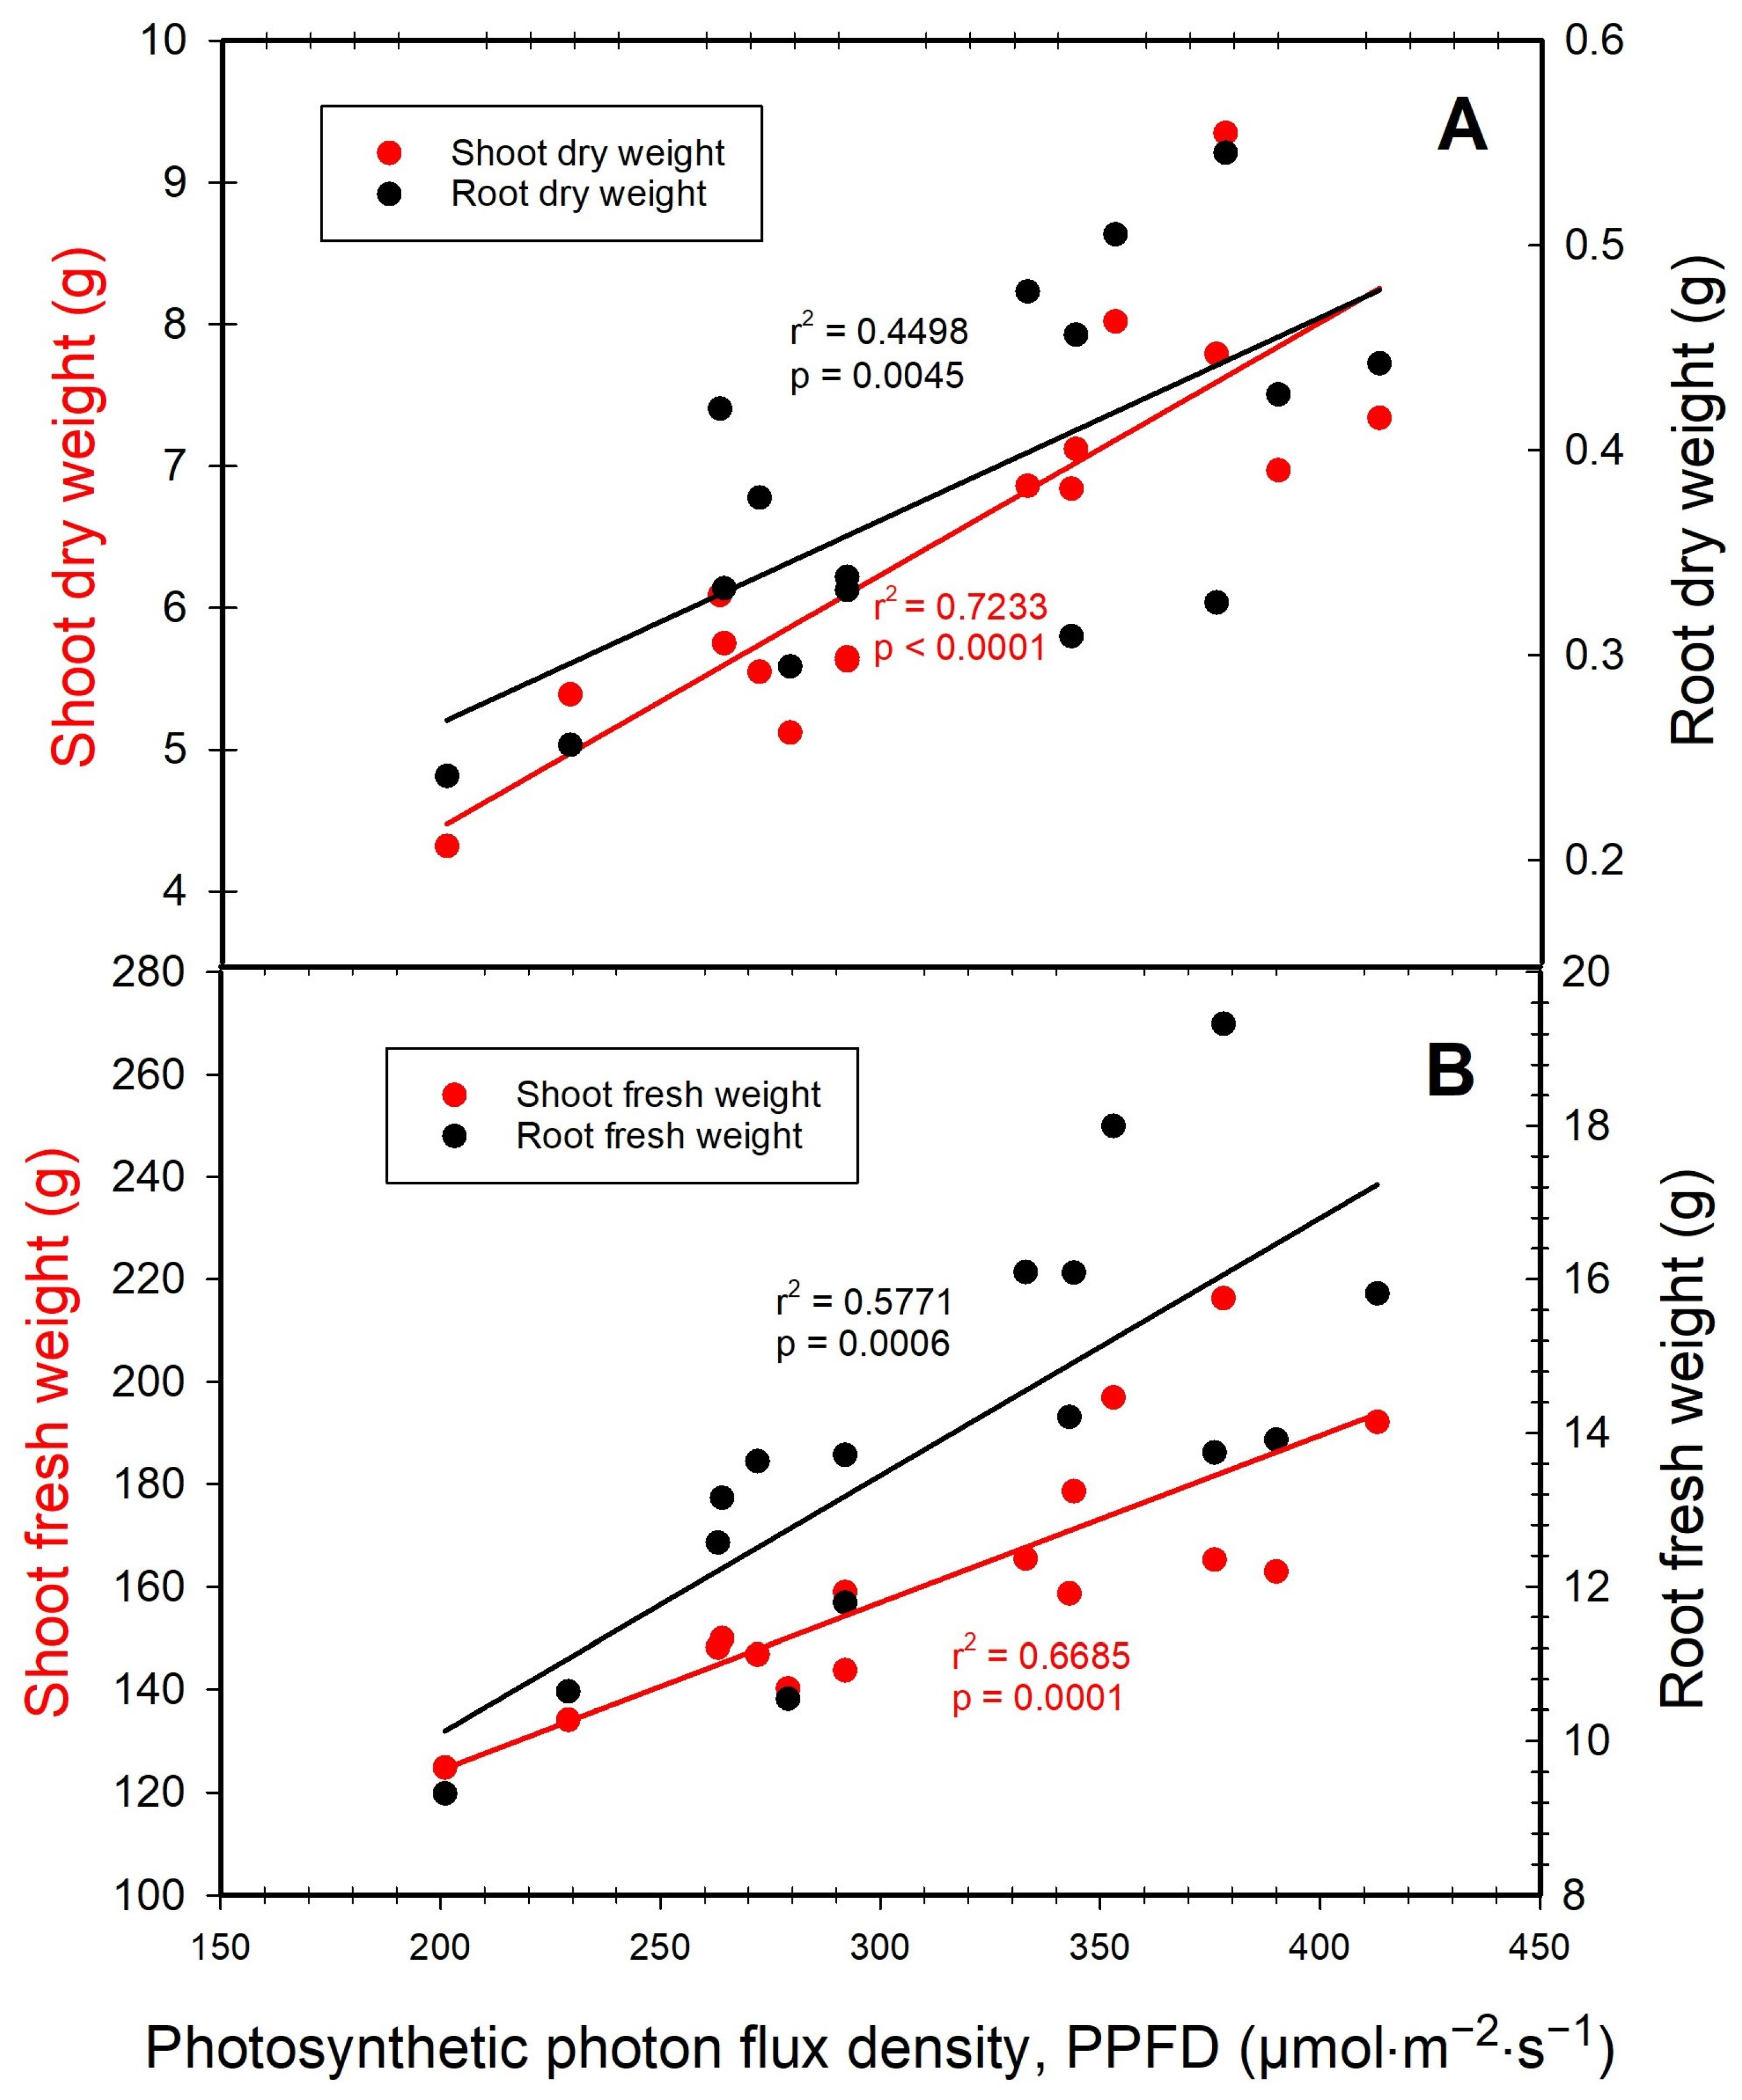
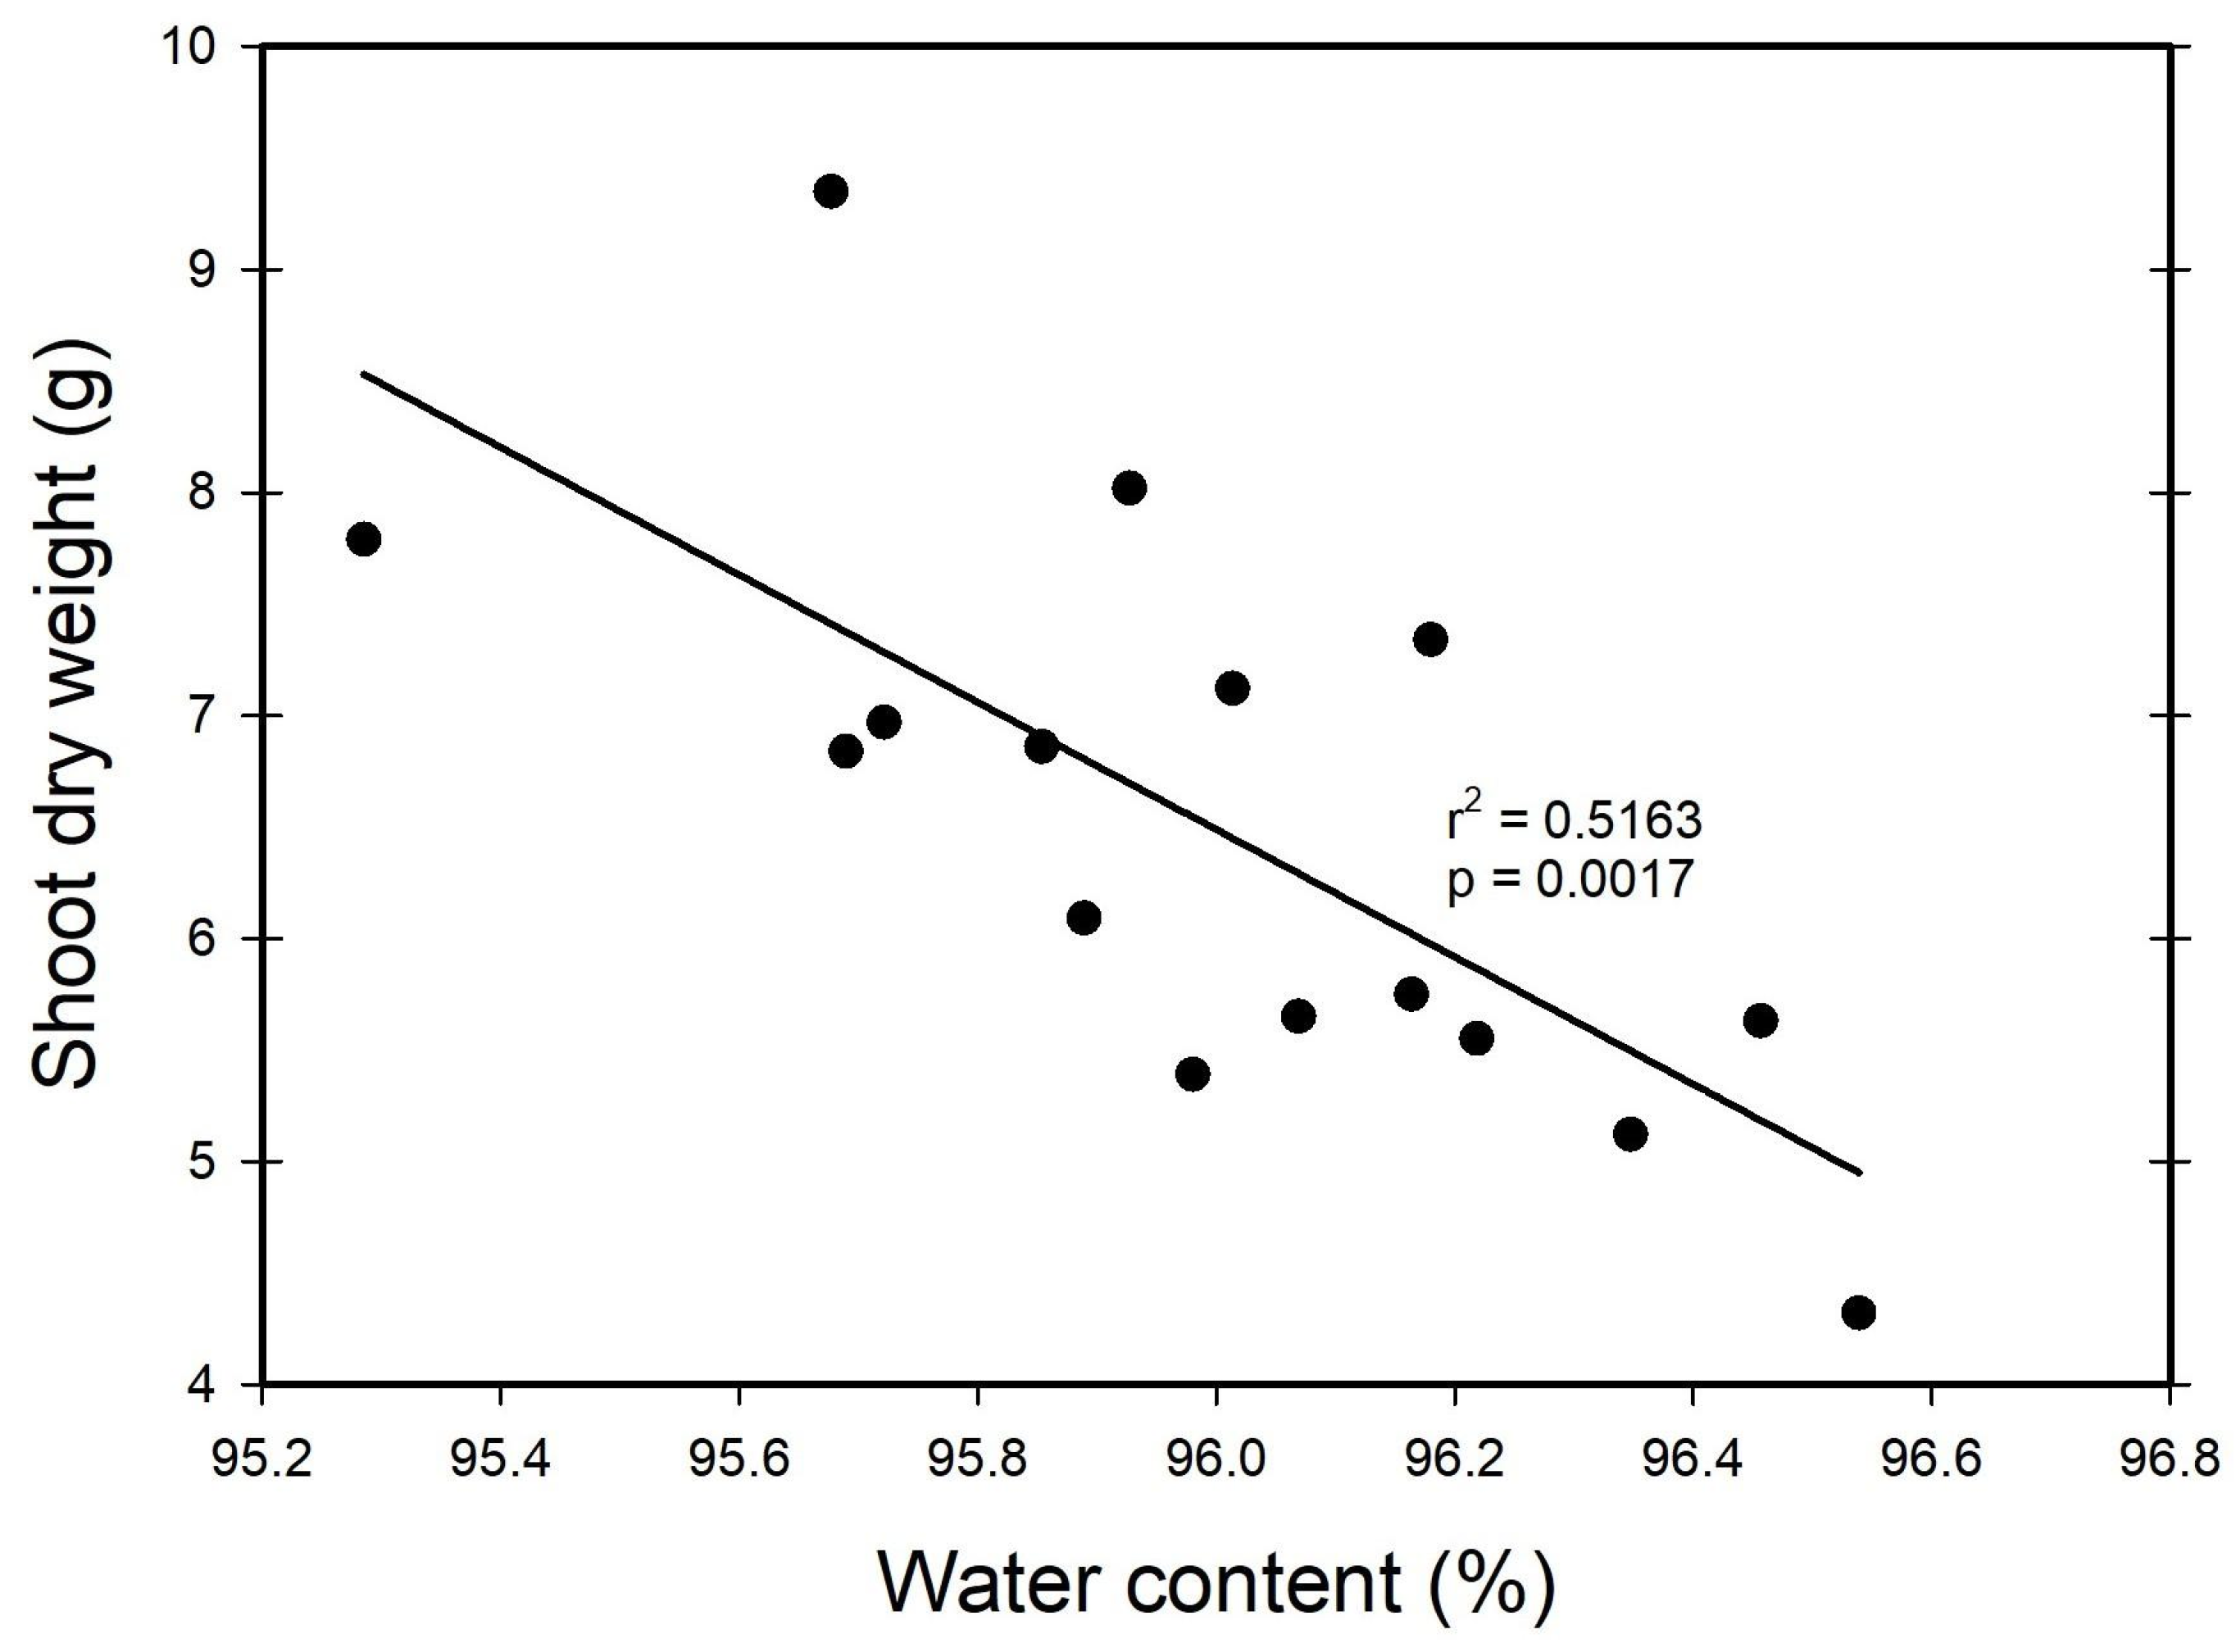
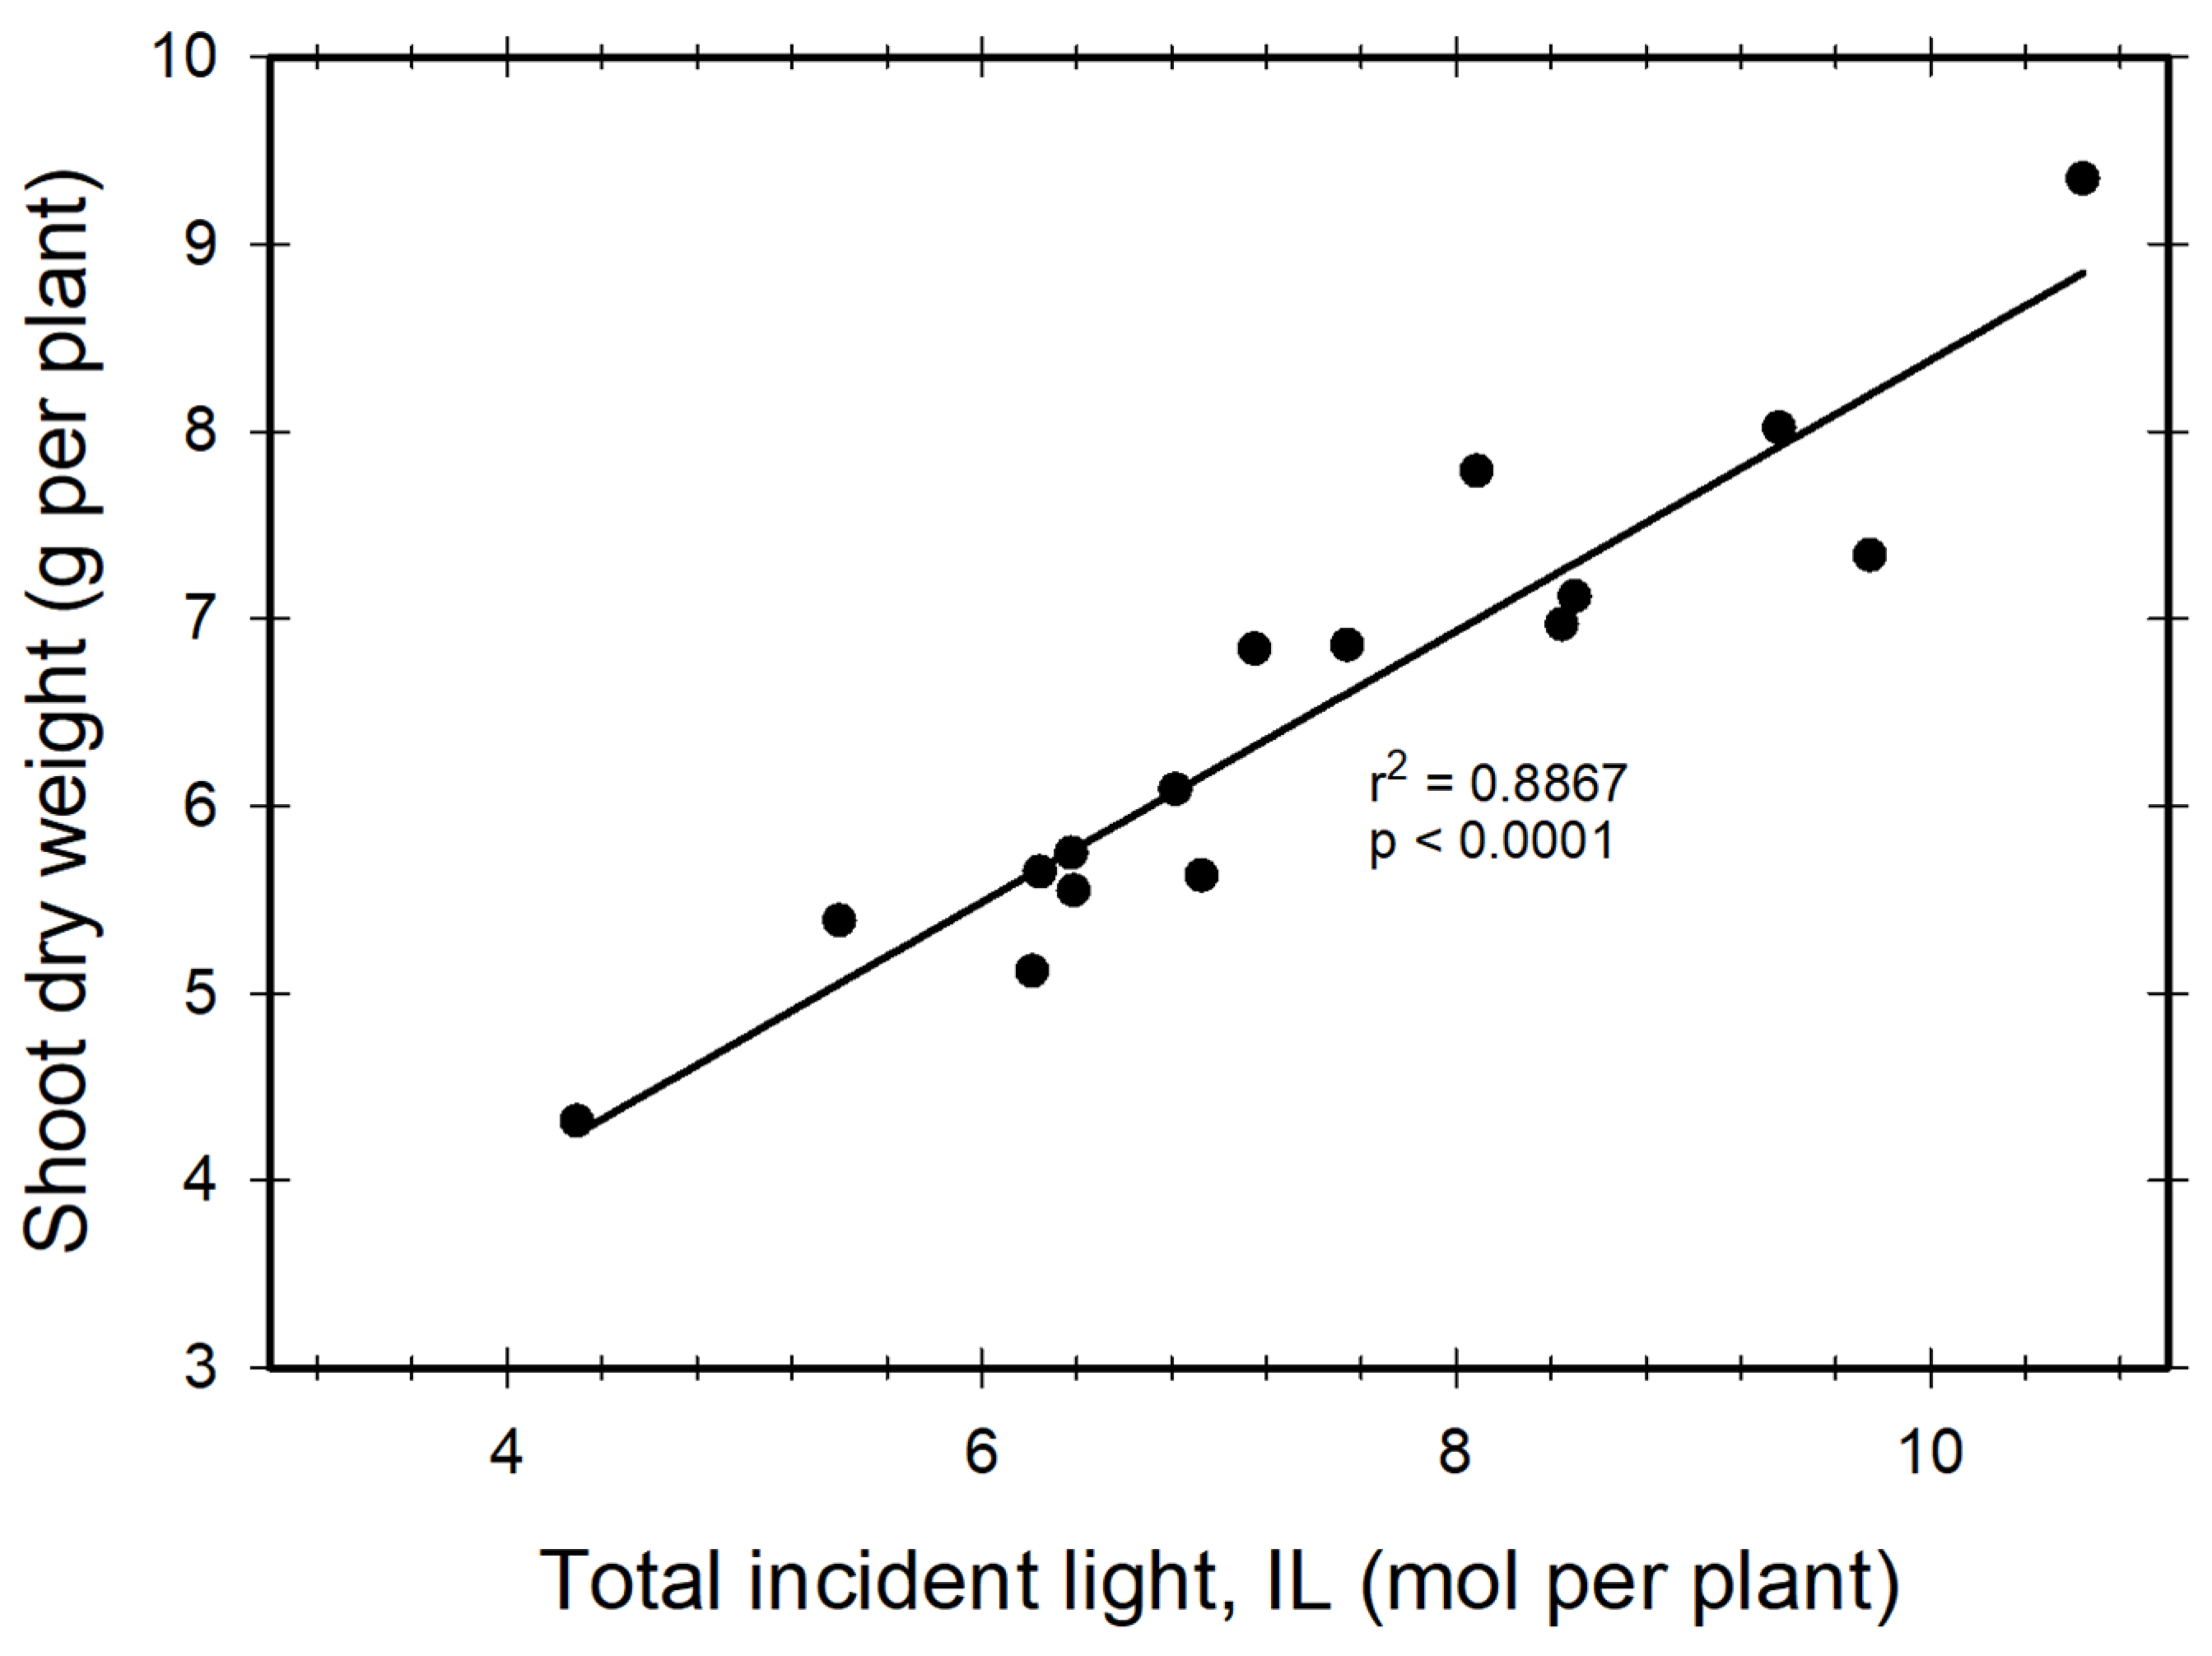
3.1. Dry and Fresh Weights
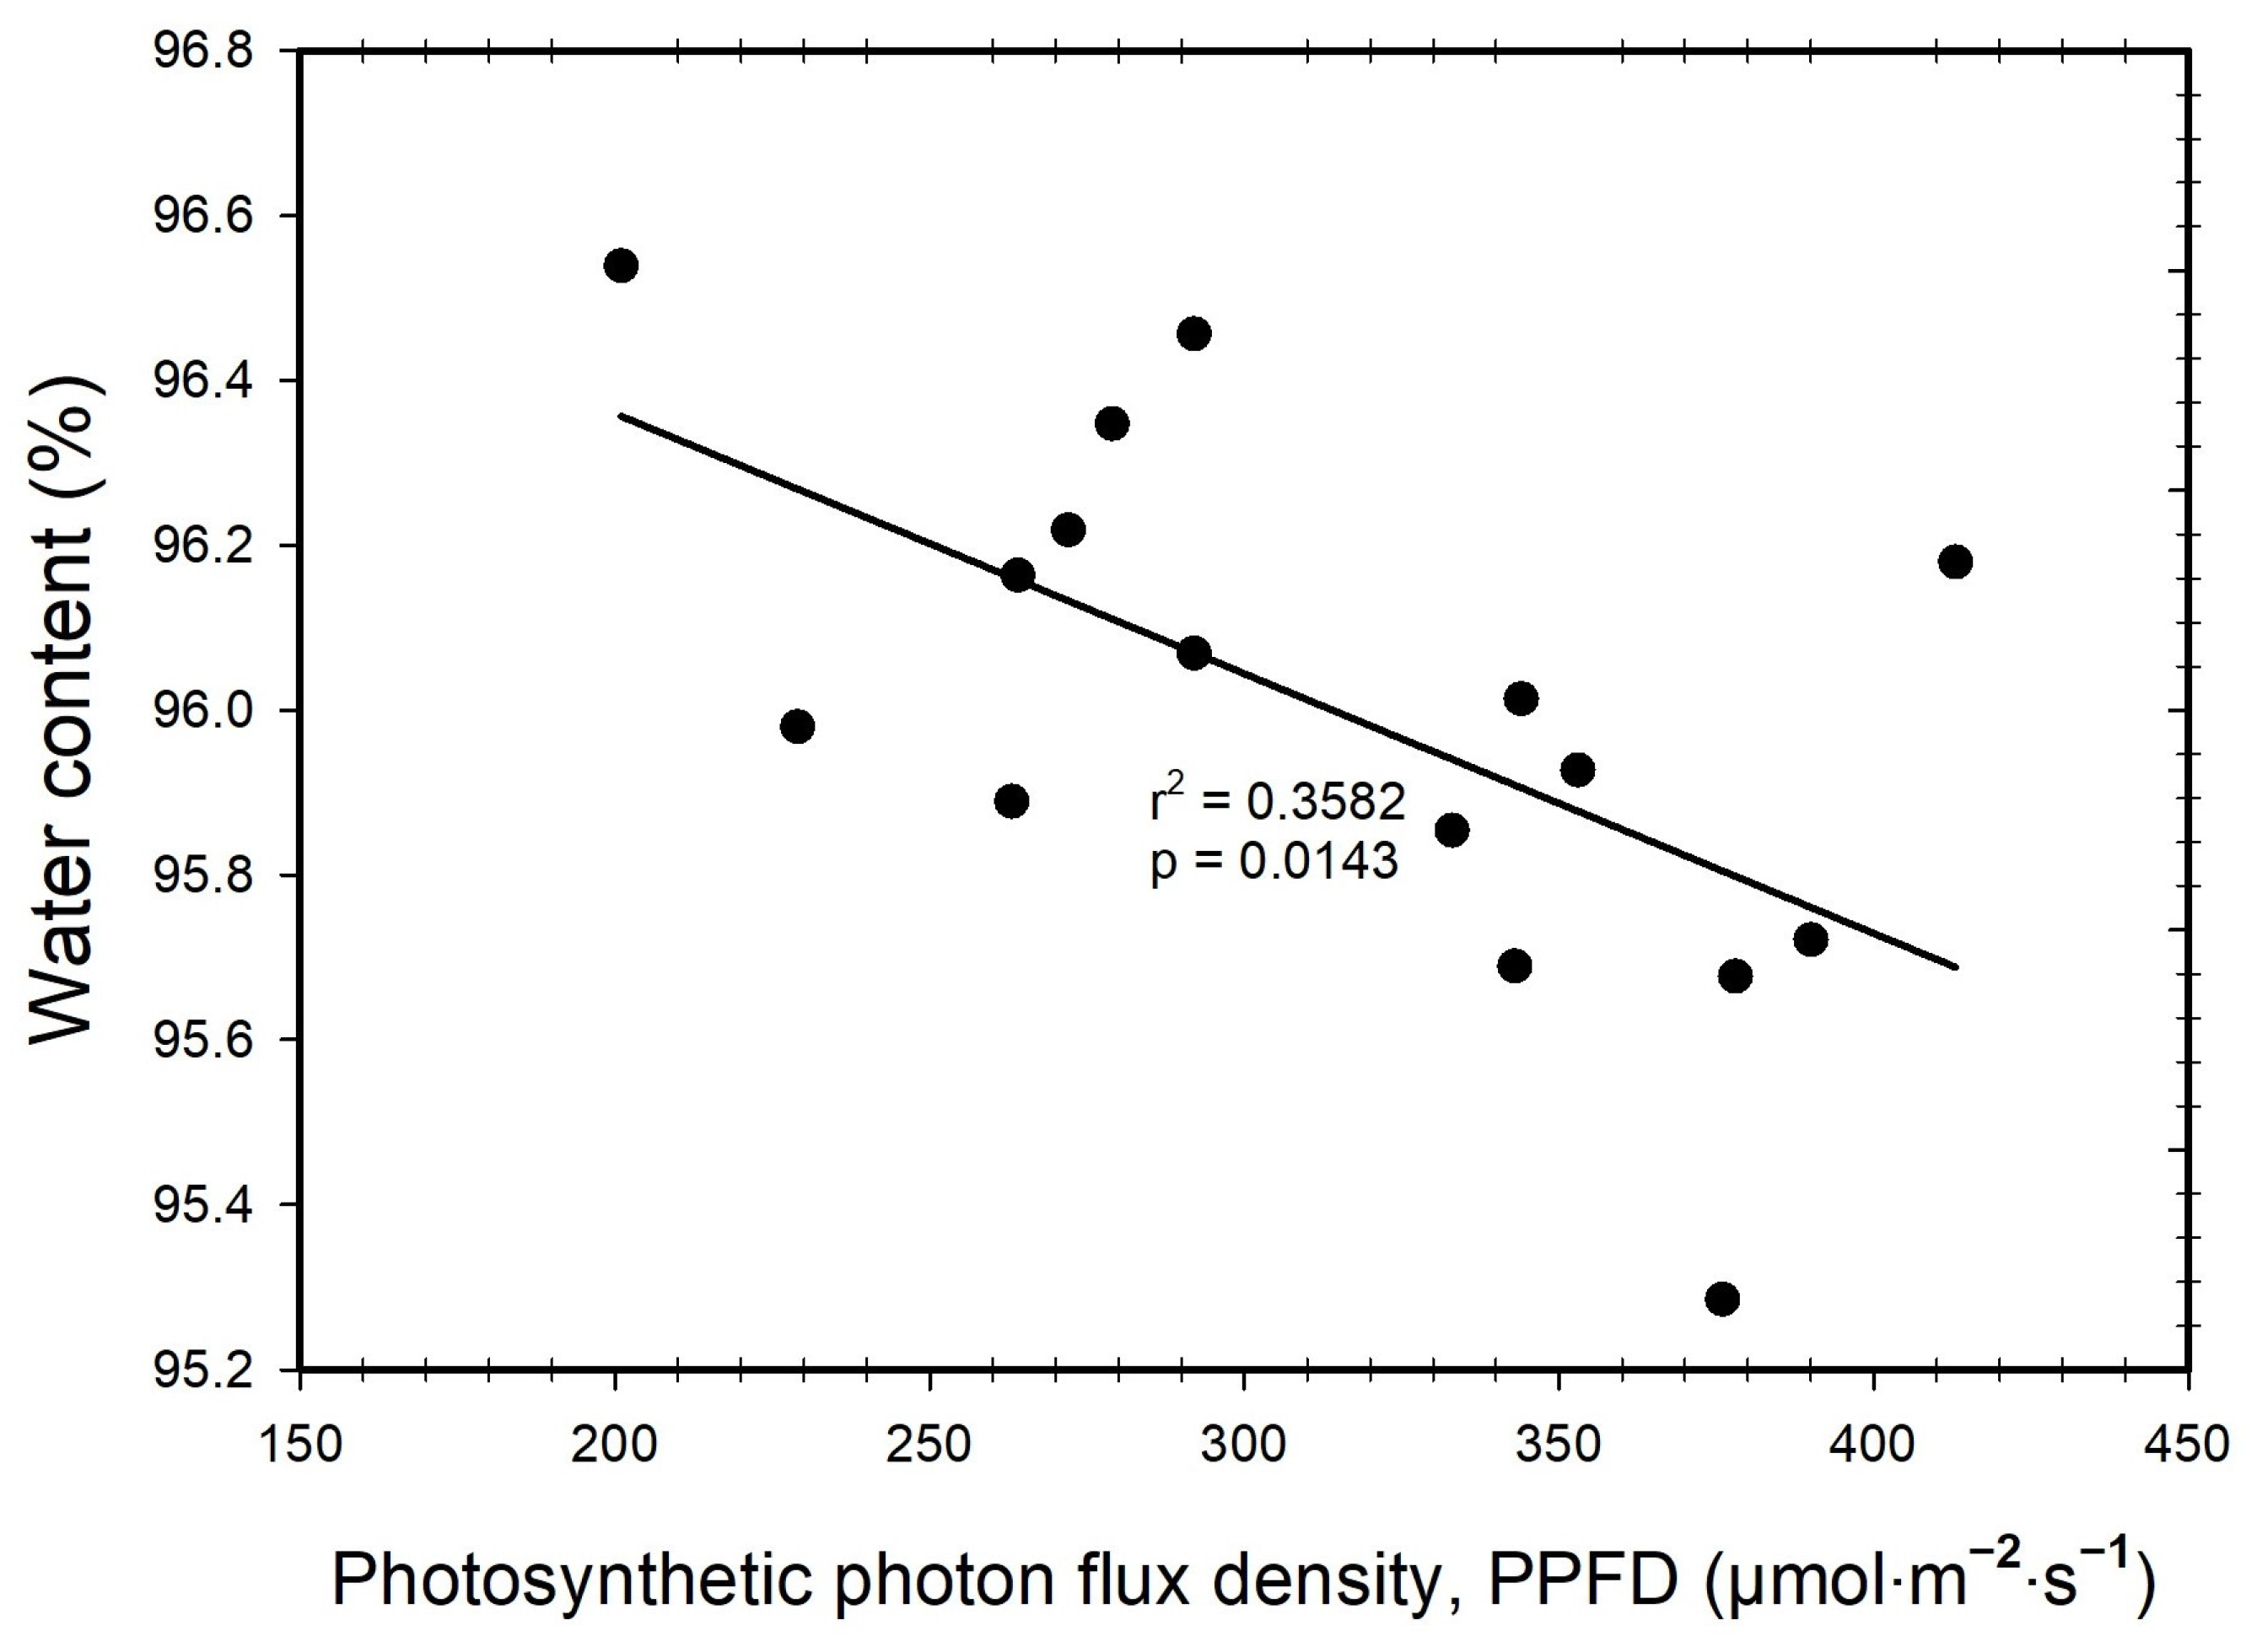
As the PPFD increased, positive responses in shoot (p < 0.0001) and root (p = 0.0045) dry weights were observed (Figure 2A). Shoot dry weight under PPFD between 201 and 292 µmol·m−2·s−1 was 16.13% lower compared to the shoot dry weight recorded under higher PPFDs of 333 to 413 µmol·m−2·s−1. Similarly, under the lower PPFD conditions, there was a 14.7% reduction in root dry weight compared to higher PPFD. The relationship between fresh weight and varying PPFD levels was parallel to the shoot and root dry weight (Figure 2B). As PPFD increased from 201 to 413 µmol·m−2·s−1, there was a significant increase in shoot fresh weight (p = 0.0001), accompanied by a corresponding rise in root fresh weight (p = 0.0006). Under the lower PPFD conditions ranging from 201 to 292 µmol·m⁻²·s⁻1, there was an 11.3% reduction in shoot fresh weight compared to higher PPFD conditions of 333 to 413 µmol·m−2·s−1, while root fresh weight was reduced by 14.3% under low PPFD conditions.

3.2. Water Content

Plant water content decreased with increasing PPFD levels (p = 0.0143) (Figure 3). Notably, the contrasts in water content between plants cultivated under PPFDs ranging from 333 to 413 µmol·m−2·s−1 and those grown under PPFDs spanning 201 to 292 µmol·m−2·s−1 were relatively subtle. A negative correlation was evident, where plants with greater shoot dry weights exhibited lower water content (p = 0.0017), ranging from 96.1% to 95.2% (Figure 4).

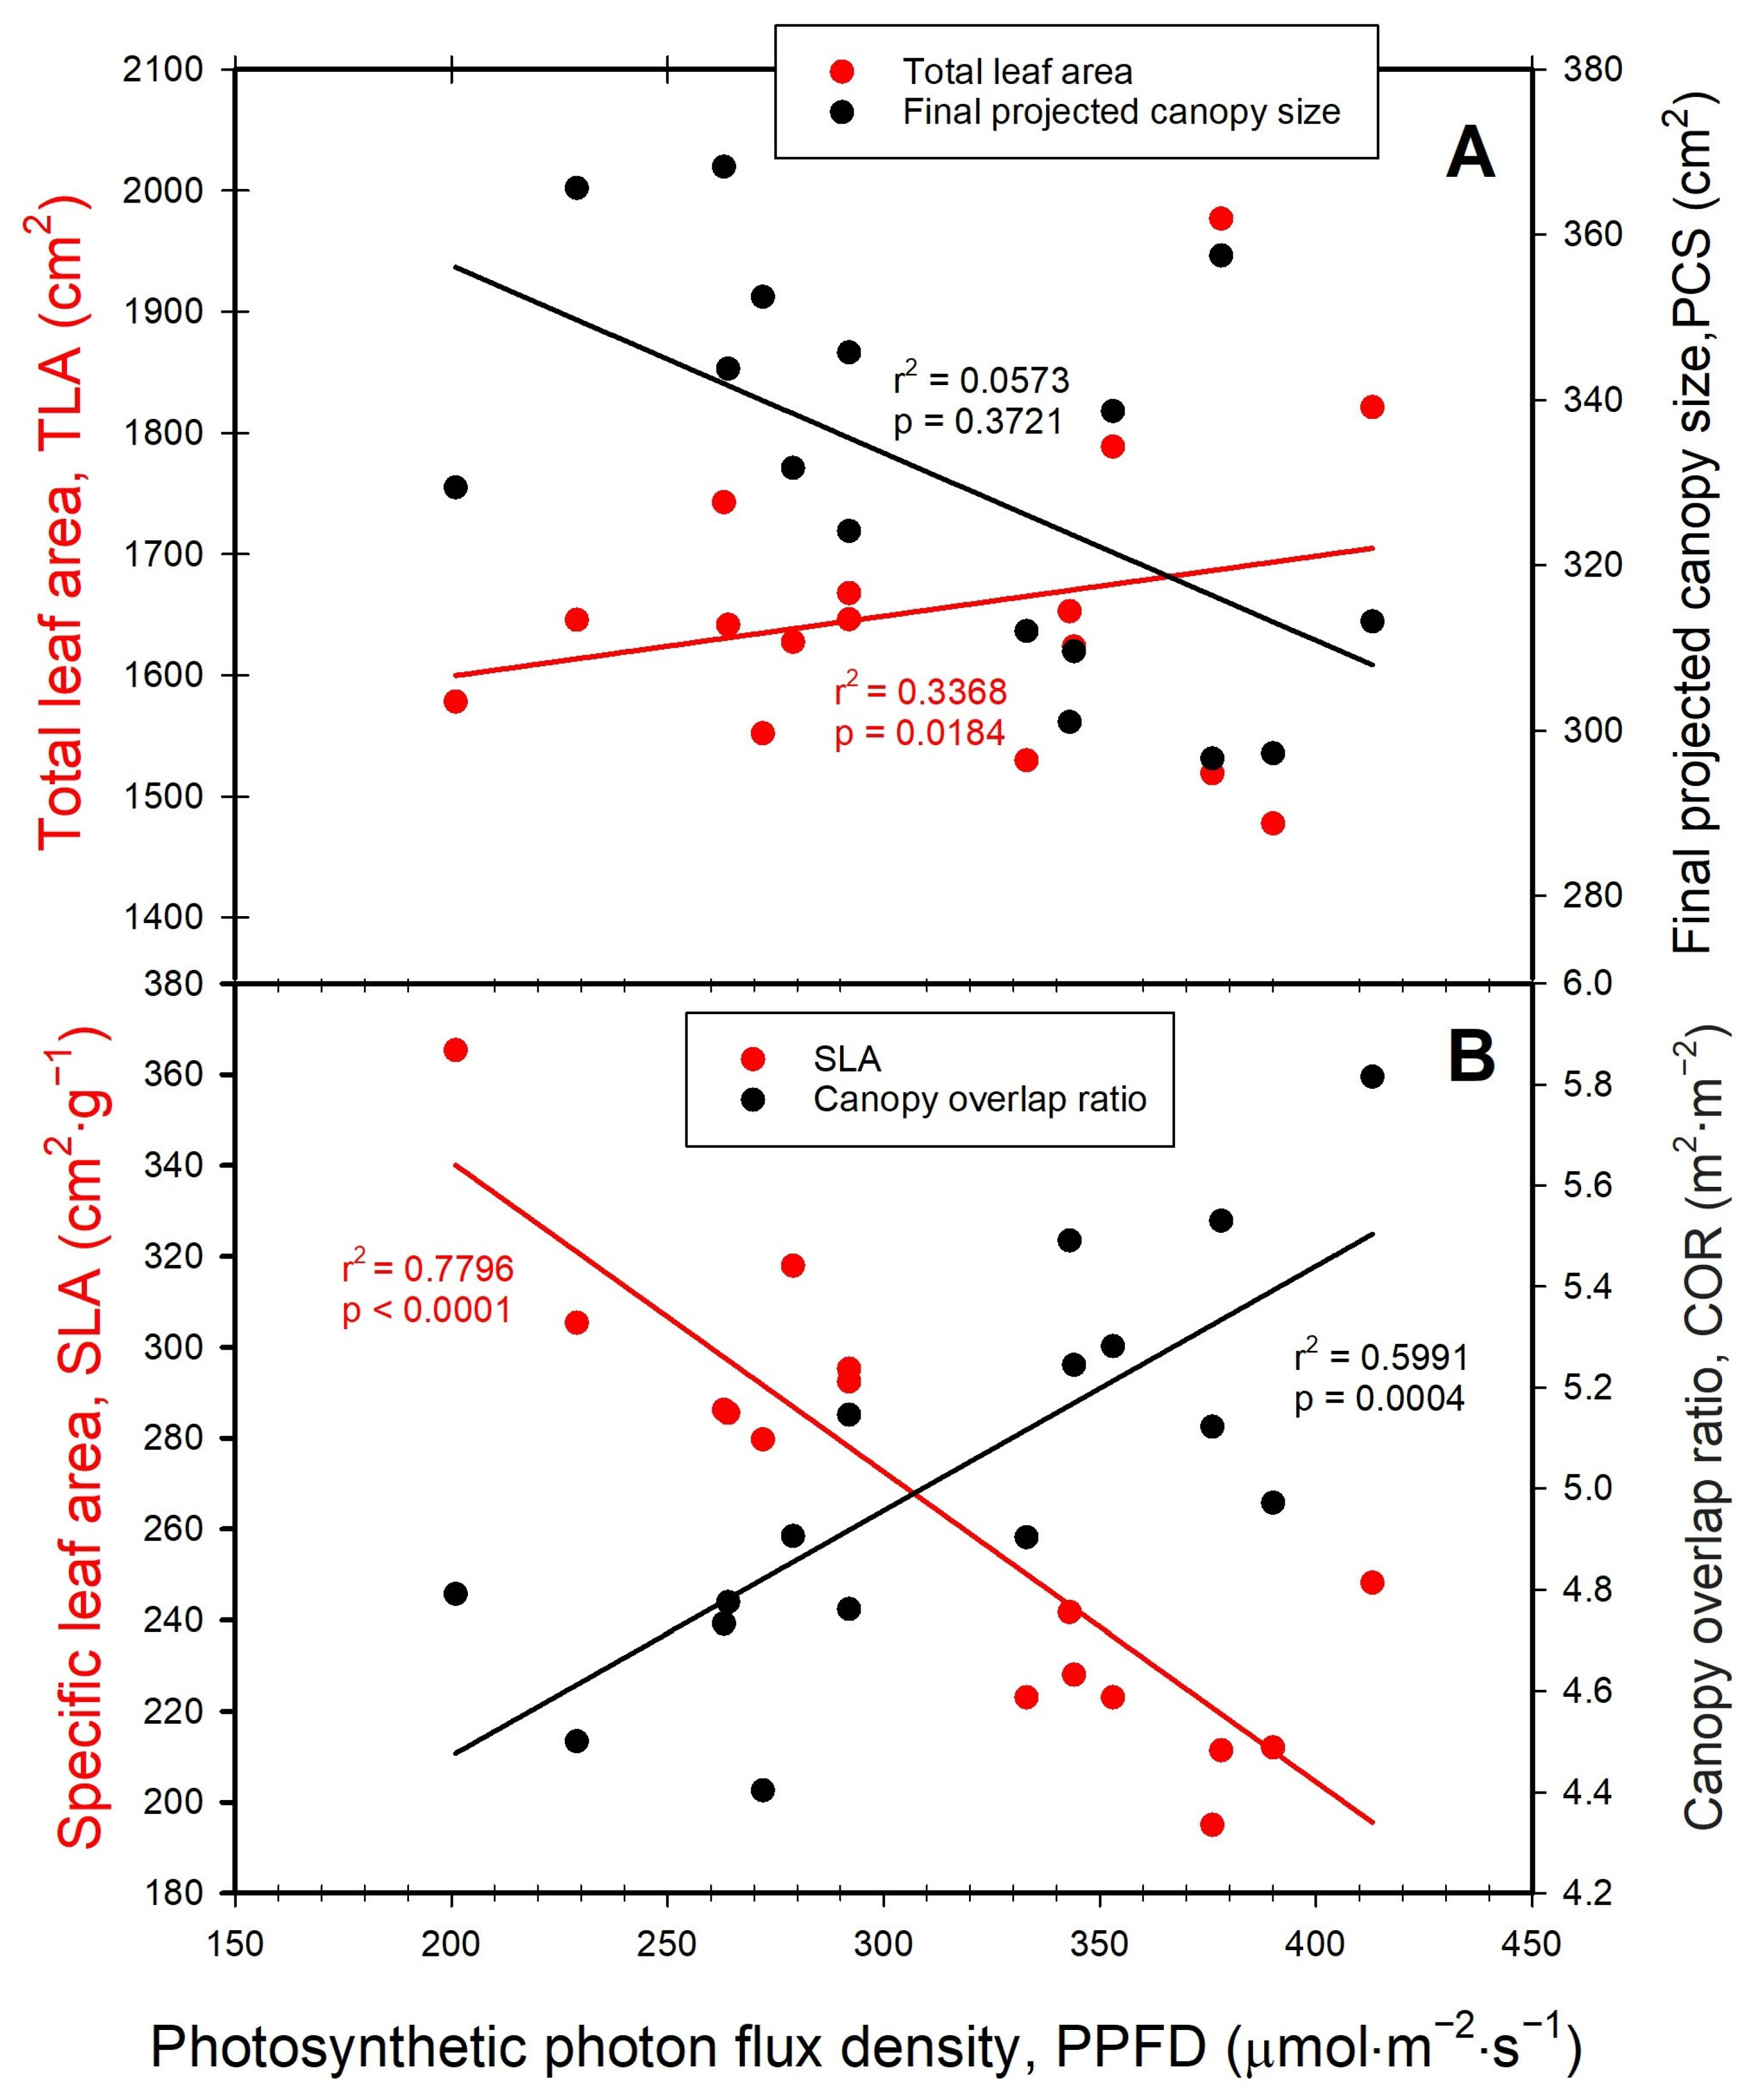
3.3. Leaf Area, Projected Canopy Size, Canopy Overlap Ratio

The analysis of the relationship between TLA and the final PCS relative to PPFD indicated that the final PCS remained consistent across all plants cultivated within 201 to 413 µmol·m⁻²·s⁻¹ (p = 0.3721) (Figure 5A). However, in contrast, the TLA displayed a positive trend with increasing PPFDs (p = 0.0184) (Figure 5A). The SLA demonstrated higher values under PPFD levels ranging from 201 to 292 µmol·m⁻²·s⁻¹; subsequently decreasing with increasing PPFD (p < 0.0001) (Figure 5B). Conversely, plants grown under elevated PPFD levels, specifically within the range of 333 to 413 µmol·m⁻²·s⁻¹, exhibited the lowest SLA (p < 0.0001). Additionally, with increased PPFD values, lettuce plants exhibited a significant positive linear correlation (p = 0.0004) with canopy overlap ratio (Figure 5B), suggesting the growth of leaves in a more vertically stacked and overlapping arrangement. This pattern clarifies the rationale for their smaller SLA than plants grown under lower PPFDs ranging from 201 to 413 µmol·m⁻²·s⁻¹. The smaller PCS observed in plants grown under higher PPFDs resulted in more leaves and reduced stretching of plant structures compared to those grown under lower PPFDs. Consequently, these plants developed thicker leaves which, in turn, contributed to higher shoot fresh and dry weights.

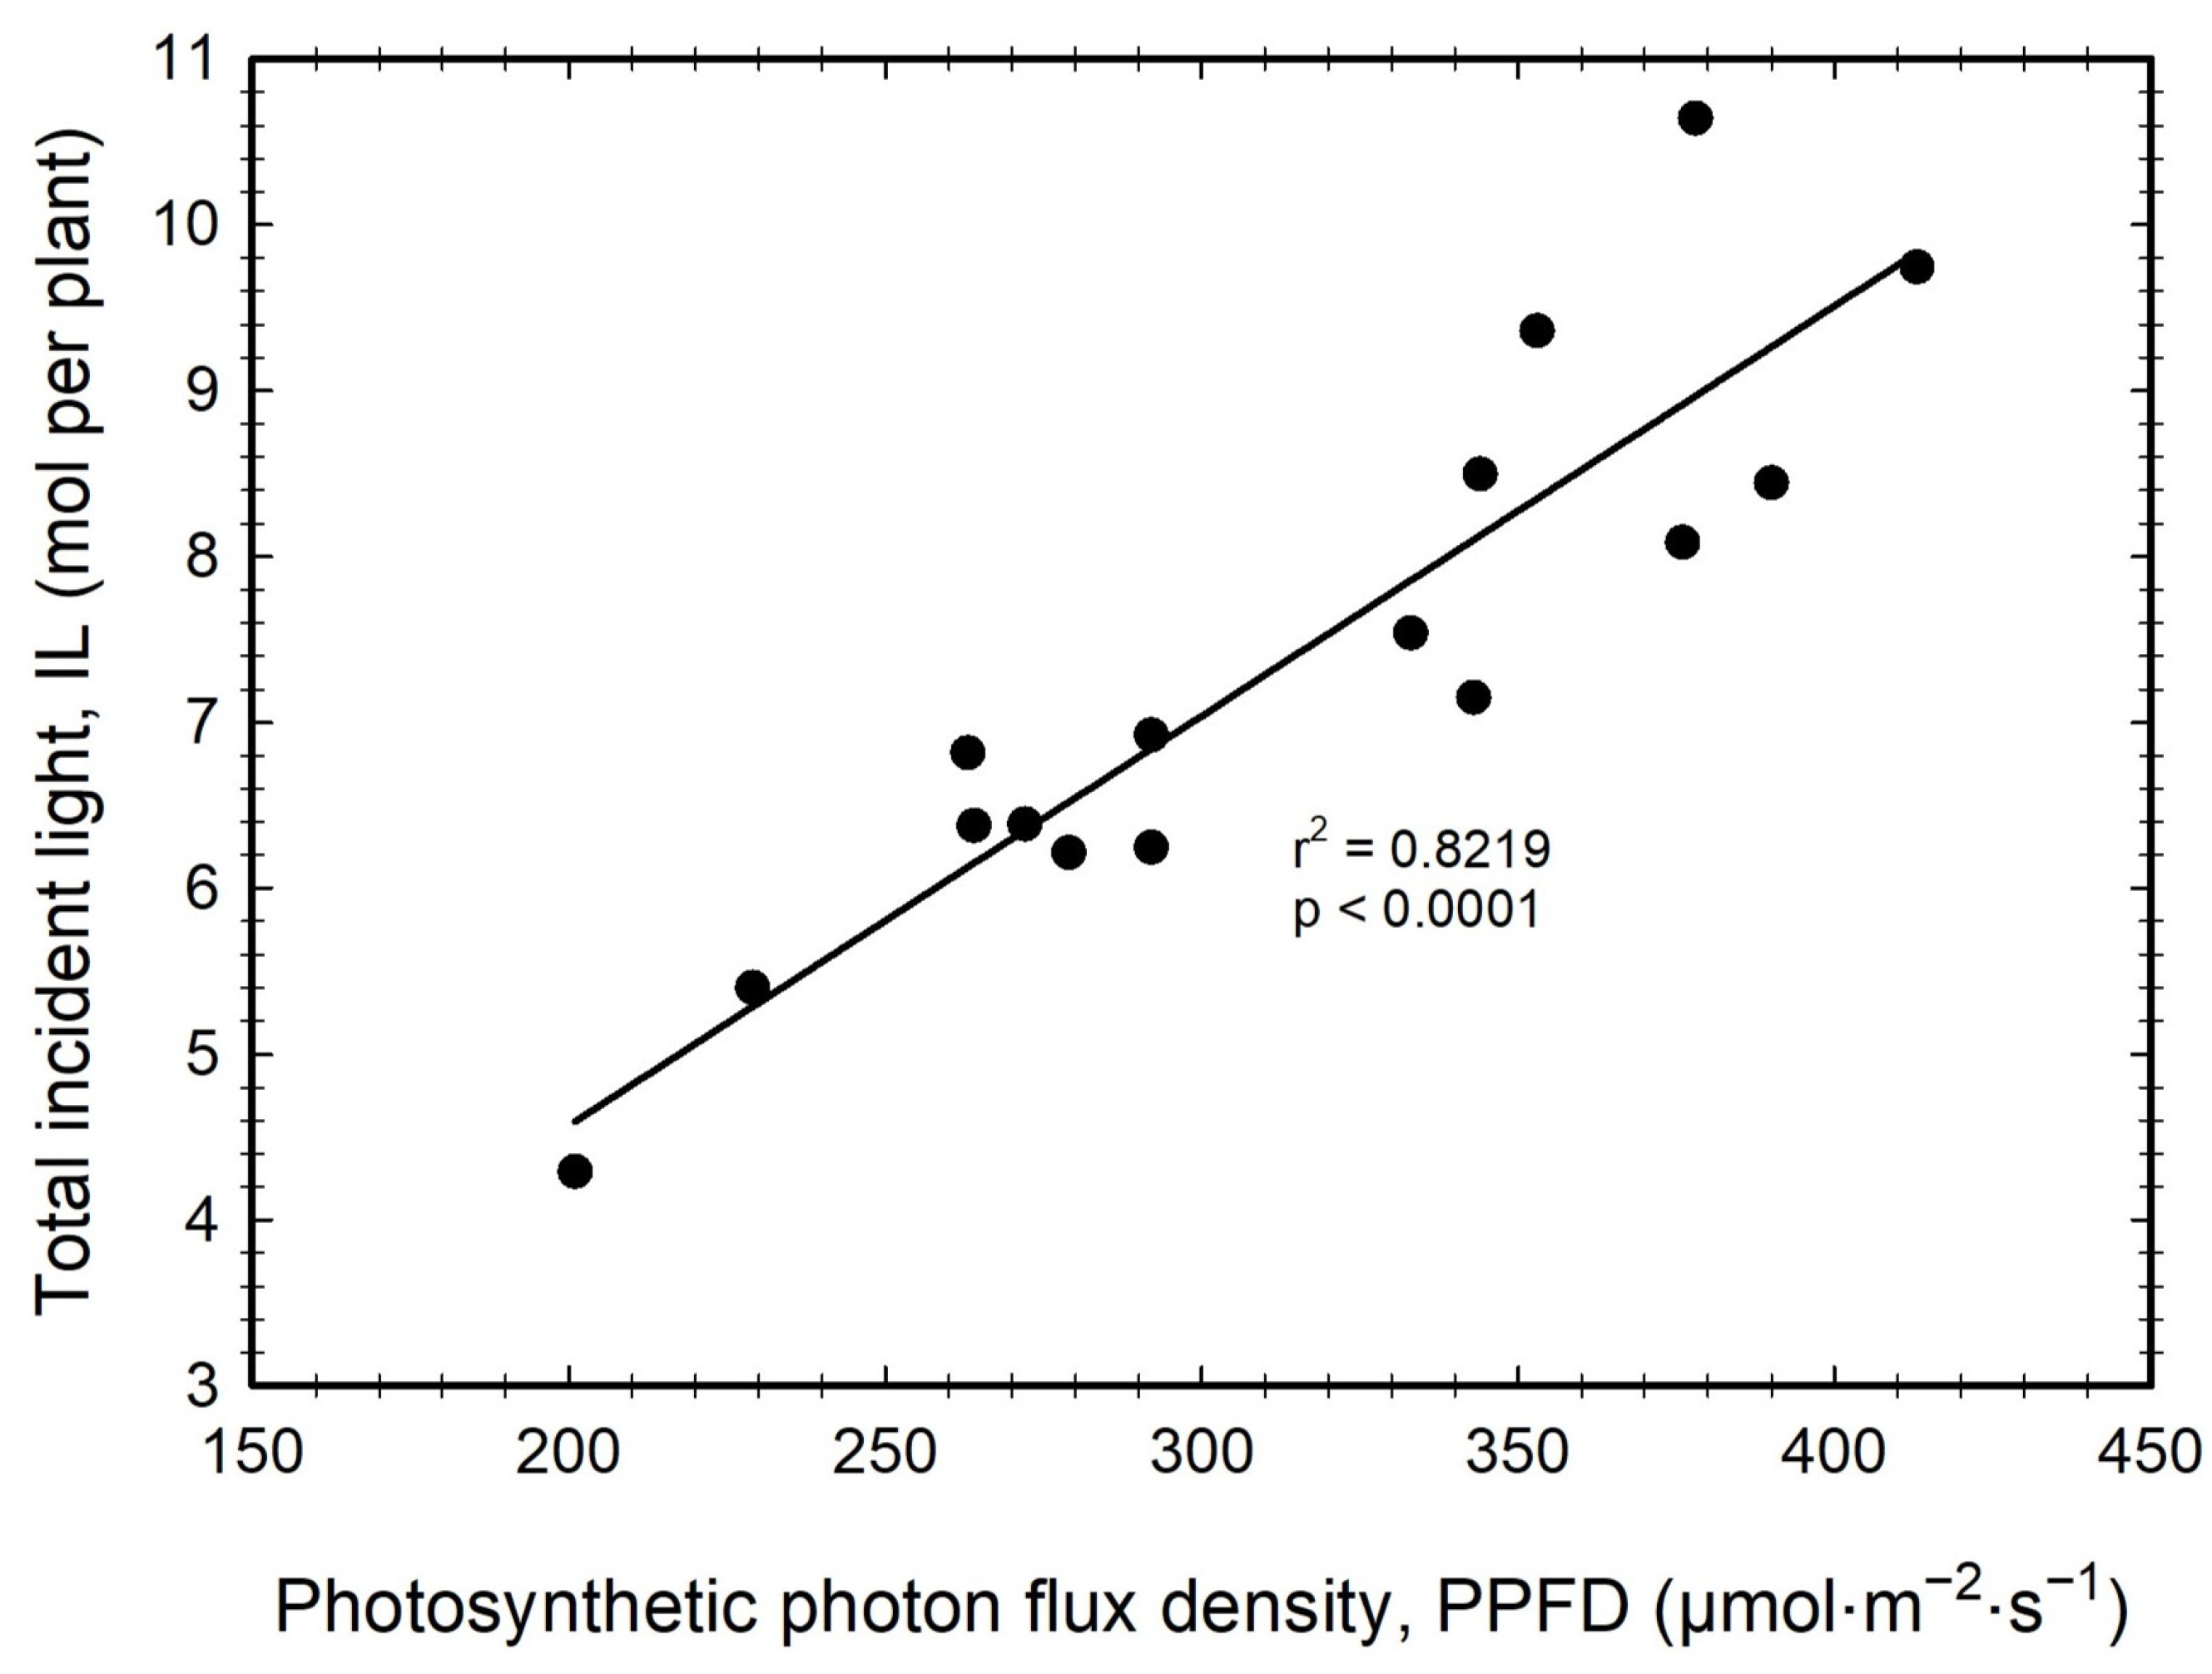
3.4. Total Incident Light

Total incident light exhibited a positive linear correlation with increasing PPFD from 201 to 413 µmol·m⁻²·s⁻¹ (p < 0.0001) (Figure 6). Analyzing shoot dry weight in relation to total incident light revealed a positive linear correlation (Figure 7). As shoot dry weight increased, total incident light also increased (p < 0.0001). Given that the highest shoot dry weights were attained under elevated PPFD levels, a strong positive correlation was observed between shoot dry weight and total incident light (p < 0.0001). The positive correlation between total incident light and the subsequent increase in shoot dry weight indicates a rise of 102% in shoot dry weight.

3.5. Light Use Efficiency

Our initial hypothesis postulated that increasing PPFD would increase growth through heightened incident light exposure despite a potential decrease in LUE. Our results, however, indicated that LUE was not a significant factor influencing growth with increasing PPFD (p = 0.6060) (Figure 8).

4. Discussion

As expected, shoot fresh and dry weights increased with increasing PPFD (Figure 2A,B), which agrees with [23]. Under a constant temperature, medium and high PPFD levels could help plants maintain a high photosynthesis capacity and increase biomass [24,25]. Compared to plants receiving high light intensity, low light plants have a reduced CO2 saturation point and increased CO2 compensation [26]. In our study, the highest PPFD level (413 µmol·m⁻²·s⁻¹) did not show reduced biomass, indicating that the light saturation point for plant growth was not reached.
Water content decreased with increasing PPFD (Figure 3), most likely due to higher transpiration caused by increased photosynthesis, as indicated by other studies; especially because light intensity affects the assimilation rate and consequently many physiological parameters, such as carbohydrates partitioning, as shown in spinach (Spinacia oleracea L.) grown in controlled environments [27].
TLA increased with increasing PPFD, while the final PCS did not increase with increasing PPFD (Figure 5A). A similar study demonstrated that the increase in leaf area was due to greater total incident light [28]. The final PCS did not show significant differences in plants grown under low or high PPFDs, which suggested that plants can achieve similar canopy sizes early in development. Previous studies showed that lettuce plants in the later stages of development began to see a decline in PCS due to overlapping leaves [9]. The Kim and van Iersel study was conducted over a longer growing cycle (7 weeks) than this one (5 weeks).
Plants grown under lower PPFDs had a higher SLA than those grown under higher PPFDs (Figure 5B). Potentially, the plants grown under low PPFDs achieved an increased incident light capture. Plants could alter their morphology by stretching out to capture more incident light, causing them to have thinner leaves and contributing to their higher SLA [28]. This pattern was also seen in [9], where higher SLA was attributed to plants having thinner leaves, allowing the lower leaves to capture enough light, thereby contributing to the overall canopy carbon balance. Another study showed that plants [e.g., soybean (Glycine max)] grown under lower PPFDs had longer leaves [28], possibly due to the expansion of the lower leaves to increase light capture further. Plants with low SLA were observed under higher PPFDs (Figure 5B). Kim and van Iersel [9] observed that low SLA occurred due to leaves in the upper part of the plant canopy not allowing enough light to be transmitted onto the lower leaves.
The COR increased with the decrease in SLA under increasing PPFD (Figure 5B); this can be attributed to a reduction in light interception by the leaves beneath the plant canopy since the upper leaves create more shade due to higher leaf number caused by higher PPFD, causing more overlapping. Increased PPFD could also cause decreased plant-specific leaf area, thinner leaves, and reduced photosynthetic activities due to photoinhibition [29].
Since crop growth primarily hinges on the total incident light absorbed by the plants, it is essential to note that incident light was quantified through PCS in conjunction with DLI measurements. In this study, plants subjected to high PPFD levels exhibited the highest incident light exposure (Figure 6). As total incident light increased, plants under elevated PPFD levels of 333 to 413 µmol·m−2·s−1 produced higher dry weights (Figure 7). The strong correlation between growth and incident light stems from their growing interdependence. Kim and van Iersel [9] showed that the total incident light was also positively correlated with shoot dry weight in green lettuce cultivars. Different species and studies have reported positive correlations between total incident light and biomass [30].
LUE represents the efficiency with which crops harness incident light for plant growth and biomass production. Normally, extremely low or high light intensities (100 or 800 µmol·m−2·s−1) will lead to low chlorophyll fluorescence performance and LUE, while moderate light intensities (200–600 µmol·m−2·s−1) will trigger a better LUE [31]. However, the observed correlation between crop growth and LUE in plants subjected to either low or high PPFD conditions during this experiment was not significant (p = 0.6060) (Figure 8). Kim and van Iersel previously showed that LUE was not a valuable parameter when screening for rapid growth integrated over a cropping cycle [9]. A plausible explanation for this weak association may be the plants nearing their light saturation point under high light levels. Studies suggested that light intensities higher than 600 µmol·m−2·s−1 will cause lettuce plants light stress, and lower biomass and soluble protein content [32]; continuous and high light intensity could also improve plant reactive oxygen species production and lipid peroxidation level [33], while our study did not reach that high light intensity level. A review suggested that using 95R:5B or 80R:20B light with a total 200–250 µmol·m−2·s−1 light intensity is the optimal light configuration to improve lettuce biomass and LUE [34,35]. Our study showed that half of the growth chamber locations could reach optimal growth conditions.
In contrast, plants in lower light conditions adjusted their morphology to increase light capture, even though their incident light capture did not significantly increase [17]. This change in morphology allowed them to enhance light capture in low incident light conditions while improving their PCS. Comparing PPFD to the final canopy size, despite not showing statistical significance (p = 0.3721), implies that plants maintain similar PCS regardless of the PPFD levels towards the end of the growing cycle. This consistency in PCS suggests that the total incident light primarily relies on PPFD rather than PCS. Plants grown at a lower PPFD can have a similar PCS to plants grown at high PPFD, despite much lower dry weight, with higher SLA. Higher SLA in plants grown under low PPFDs allowed them to increase their leaf area to capture more light. However, the consequence of having a high SLA is that the leaves became thinner, resulting in lower shoot fresh and dry weights. The COR is another contributing factor that influences PCS. Plants under higher PPFD make a more significant TLA, but the leaves largely overlap, causing an increase in COR, thus not increasing PCS.
Plants grown under low PPFDs subsequently changed the total incident light they received during their growing cycle, altering the weights and morphology. It is known that the distribution of light can significantly influence the plant’s growth characteristics. This study showed that people can manipulate lettuce’s appearance by adjusting the PPFD levels to increase or decrease the total incident light the crops receive, which greatly affects biomass accumulation, especially under sole-source lighting conditions in vertical farms. Growers should check both the plants that are farthest and closest to the light source to ensure that they are effectively monitoring the light exposure of all their plants. This is important for maintaining consistency and understanding how different positions relative to the light source may impact plant growth and development.

5. Conclusions

Plant morphology at lower PPFD levels (201 to 292 µmol·m−2·s−1) increased SLA and PCS to enhance light capture. At higher PPFD levels (333 and 413 µmol·m−2·s−1), the ‘Rex’ plants exhibited a rise in COR and had higher shoot and root fresh and dry weights. Low and high PPFD conditions led to a similar trend in PCS among plants, suggesting that the total incident light primarily relies on PPFD rather than PCS. Plants with the highest shoot dry weight were grown under higher PPFDs, and as shoot dry weight increased, total incident light increased. LUE did not play a significant role in determining the ‘Rex’ lettuce growth. Instead, the key factor was a strong and positive correlation between growth and total incident light that the plants received.
This study showcased the importance of incident light and PPFD on the growth, morphology, and biomass accumulation in lettuce. To gain deeper insights into the influence of incident light on growth, it would be valuable to explore additional cultivars to see how the morphology changes with increasing total incident light. Using PCS imaging is essential for selecting crops that will thrive efficiently in CEA as a part of the phenotype screening process. This concept is reinforced by the observation that plants typically produce more shoot biomass with increasing total incident light, indicating a valuable phenotyping strategy.

Supplementary Materials

The following supporting information can be downloaded at https://doi.org/10.5281/zenodo.10841711, Figure S1: Nutrient concentration of lettuce (Lactuca sativa ‘Rex’) plants grown at different total incident light levels in deep water culture hydroponics. Lines show multiple regression analysis results, indicating no significant interactions. Each data point represents one plant. N = nitrogen, P = phosphorus, K = potassium, Ca = calcium, Mg = magnesium, S = sulfur, B = boron, Cu = copper, Fe = iron, Mn = manganese, and Zn = zinc.

Author Contributions

Conceptualization, P.L.P., M.W.v.I., R.W.D., L.S., M.Y. and R.S.F.; methodology, P.L.P., M.W.v.I. and R.S.F.; software, P.L.P.; validation, P.L.P., M.W.v.I., R.W.D., L.S., M.Y. and R.S.F.; formal analysis, P.L.P.; investigation, P.L.P., M.W.v.I. and R.S.F.; resources, M.W.v.I. and R.S.F.; data curation, P.L.P.; writing—original draft preparation, P.L.P., M.W.v.I. and R.S.F.; writing—review and editing, P.L.P., M.Y., K.Q. and R.S.F.; visualization, P.L.P., M.W.v.I., R.W.D., L.S., M.Y. and R.S.F.; supervision, M.W.v.I. and R.S.F.; project administration, M.W.v.I. and R.S.F.; funding acquisition, M.W.v.I. and R.S.F. All authors have read and agreed to the published version of the manuscript.

Funding

This research was funded by the USDA-NIFA-SCRI, award number 2018-51181-28365, project ‘LAMP: Lighting Approaches to Maximize Profits’, the Department of Horticulture, the College of Agricultural and Environmental Sciences, and the Office of the Senior Vice President for Academic Affairs and Provost.

Data Availability Statement

The original contributions presented in the study are included in the article/Supplementary Material, further inquiries can be directed to the corresponding author.

Acknowledgments

We thank the Horticultural Physiology and Controlled Environment Agriculture Lab members for the technical support they provided. We also thank Cari Peters and J. R. Peters for the fertilizer donation.

Conflicts of Interest

Author Melanie Yelton was employed by the company Grow Big Consultants. The remaining au-thors declare that the research was conducted in the absence of any commercial or financial rela-tionships that could be construed as a potential conflict of interest.

References

  1. Ouzounis, T.; Rosenqvist, E.; Ottosen, C.-O. Spectral Effects of Artificial Light on Plant Physiology and Secondary Metabolism: A Review. HortSci. Horts 2015, 50, 1128–1135. [Google Scholar] [CrossRef]
  2. Rai, N.; Morales, L.O.; Aphalo, P.J. Perception of solar UV radiation by plants: Photoreceptors and mechanisms. Plant Physiol. 2021, 186, 1382–1396. [Google Scholar] [CrossRef] [PubMed]
  3. Marcelis, L.F.M.; Broekhuijsen, A.G.M.; Meinen, E.; Nijs, E.M.F.M.; Raaphorst, M.G.M. Quantification of the growth response to light quantity of greenhouse grown crops. Acta Hortic. 2006, 711, 97–104. [Google Scholar] [CrossRef]
  4. Taiz, L.; Zeiger, E.; Møller, I.M.; Murphy, A. Plant physiology and Development, 6th ed.; Sinauer Associates: Sunderland, MA, USA, 2015. [Google Scholar]
  5. Cabrera-Bosquet, L.; Fournier, C.; Brichet, N.; Welcker, C.; Suard, B.; Tardieu, F. High-throughput estimation of incident light, light interception and radiation-use efficiency of thousands of plants in a phenotyping platform. New Phytol. 2016, 212, 269–281. [Google Scholar] [CrossRef] [PubMed]
  6. Kelly, N.; Choe, D.; Meng, Q.; Runkle, E.S. Promotion of lettuce growth under an increasing daily light integral depends on the combination of the photosynthetic photon flux density and photoperiod. Sci. Hortic. 2020, 272, 109565. [Google Scholar] [CrossRef]
  7. Gavhane, K.P.; Hasan, M.; Singh, D.K.; Kumar, S.N.; Sahoo, R.N.; Alam, W. Determination of optimal daily light integral (DLI) for indoor cultivation of iceberg lettuce in an indigenous vertical hydroponic system. Sci. Rep. 2023, 13, 10923. [Google Scholar] [CrossRef]
  8. Jishi, T. LED Lighting Technique to Control Plant Growth and Morphology. In Smart Plant Factory: The Next Generation Indoor Vertical Farms; Kozai, T., Ed.; Springer: Singapore, 2018; pp. 211–222. [Google Scholar]
  9. Kim, C.; van Iersel, M.W. Morphological and Physiological Screening to Predict Lettuce Biomass Production in Controlled Environment Agriculture. Remote Sens. 2022, 14, 316. [Google Scholar] [CrossRef]
  10. Pei, Y.; Dong, J.; Zhang, Y.; Yuan, W.; Doughty, R.; Yang, J.; Zhou, D.; Zhang, L.; Xiao, X. Evolution of light use efficiency models: Improvement, uncertainties, and implications. Agric. For. Meteorol. 2022, 317, 108905. [Google Scholar] [CrossRef]
  11. Warner, R.; Wu, B.-S.; MacPherson, S.; Lefsrud, M. How the Distribution of Photon Delivery Impacts Crops in Indoor Plant Environments: A Review. Sustainability 2023, 15, 4645. [Google Scholar] [CrossRef]
  12. Fiorucci, A.-S.; Fankhauser, C. Plant Strategies for Enhancing Access to Sunlight. Curr. Biol. 2017, 27, R931–R940. [Google Scholar] [CrossRef]
  13. Paradiso, R.; Proietti, S. Light-Quality Manipulation to Control Plant Growth and Photomorphogenesis in Greenhouse Horticulture: The State of the Art and the Opportunities of Modern LED Systems. J. Plant Growth Regul. 2022, 41, 742–780. [Google Scholar] [CrossRef]
  14. Zhang, X.; Bian, Z.; Yuan, X.; Chen, X.; Lu, C. A review on the effects of light-emitting diode (LED) light on the nutrients of sprouts and microgreens. Trends Food Sci. Technol. 2020, 99, 203–216. [Google Scholar] [CrossRef]
  15. Cocetta, G.; Casciani, D.; Bulgari, R.; Musante, F.; Kołton, A.; Rossi, M.; Ferrante, A. Light use efficiency for vegetables production in protected and indoor environments. Eur. Phys. J. Plus 2017, 132, 43. [Google Scholar] [CrossRef]
  16. van Iersel, M.W.; Weaver, G.; Martin, M.T.; Ferrarezi, R.S.; Mattos, E.; Haidekker, M. A chlorophyll fluorescence-based biofeedback system to control photosynthetic lighting in controlled environment agriculture. J. Am. Soc. Hortic. Sci. 2016, 141, 169–176. [Google Scholar] [CrossRef]
  17. Yang, J.; Song, J.; Jeong, B.R. Lighting from Top and Side Enhances Photosynthesis and Plant Performance by Improving Light Usage Efficiency. Int. J. Mol. Sci. 2022, 23, 2448. [Google Scholar] [CrossRef] [PubMed]
  18. Sukhova, E.; Yudina, L.; Zolin, Y.; Popova, A.; Sukhov, V. Development, Verification, and Analysis of Simple Mathematical Model of Lettuce Productivity under Different Light Conditions. Horticulturae 2023, 9, 1259. [Google Scholar] [CrossRef]
  19. Jin, W.; Formiga Lopez, D.; Heuvelink, E.; Marcelis, L.F.M. Light use efficiency of lettuce cultivation in vertical farms compared with greenhouse and field. Food Energy Secur. 2023, 12, e391. [Google Scholar] [CrossRef]
  20. Li, R.; He, Y.; Chen, J.; Zheng, S.; Zhuang, C. Research Progress in Improving Photosynthetic Efficiency. Int. J. Mol. Sci. 2023, 24, 9286. [Google Scholar] [CrossRef]
  21. Fernandez-Jaramillo, A.A.; Duarte-Galvan, C.; Contreras-Medina, L.M.; Torres-Pacheco, I.; Romero-Troncoso, R.d.J.; Guevara-Gonzalez, R.G.; Millan-Almaraz, J.R. Instrumentation in Developing Chlorophyll Fluorescence Biosensing: A Review. Sensors 2012, 12, 11853–11869. [Google Scholar] [CrossRef]
  22. Wacker, K.; Kim, C.; van Iersel, M.W.; Sidore, B.; Pham, T.; Haidekker, M.; Seymour, L.; Ferrarezi, R.S. Development of an Automated Low-Cost Multispectral Imaging System to Quantify Canopy Size and Pigmentation. Sensors 2024, 24, 5515. [Google Scholar] [CrossRef]
  23. Ghorbanzadeh, P.; Aliniaeifard, S.; Esmaeili, M.; Mashal, M.; Azadegan, B.; Seif, M. Dependency of Growth, Water Use Efficiency, Chlorophyll Fluorescence, and Stomatal Characteristics of Lettuce Plants to Light Intensity. J. Plant Growth Regul. 2021, 40, 2191–2207. [Google Scholar] [CrossRef]
  24. He, J.; Jawahir, N.K.B.; Qin, L. Quantity of supplementary LED lightings regulates photosynthetic apparatus, improves photosynthetic capacity and enhances productivity of Cos lettuce grown in a tropical greenhouse. Photosynth Res. 2021, 149, 187–199. [Google Scholar] [CrossRef] [PubMed]
  25. Zhou, J.; Li, P.; Wang, J. Effects of Light Intensity and Temperature on the Photosynthesis Characteristics and Yield of Lettuce. Horticulturae 2022, 8, 178. [Google Scholar] [CrossRef]
  26. He, C.; Davies, F.T., Jr.; Lacey, R.E. Separating the effects of hypobaria and hypoxia on lettuce: Growth and gas exchange. Physiol. Plant 2007, 131, 226–240. [Google Scholar] [CrossRef] [PubMed]
  27. Proietti, S.; Paradiso, R.; Moscatello, S.; Saccardo, F.; Battistelli, A. Light Intensity Affects the Assimilation Rate and Carbohydrates Partitioning in Spinach Grown in a Controlled Environment. Plants 2023, 12, 804. [Google Scholar] [CrossRef]
  28. Slattery, R.A.; Ort, D.R. Perspectives on improving light distribution and light use efficiency in crop canopies. Plant Physiol. 2020, 185, 34–48. [Google Scholar] [CrossRef]
  29. Fan, X.-X.; Xu, Z.-G.; Liu, X.-Y.; Tang, C.-M.; Wang, L.-W.; Han, X.-l. Effects of light intensity on the growth and leaf development of young tomato plants grown under a combination of red and blue light. Sci. Hortic. 2013, 153, 50–55. [Google Scholar] [CrossRef]
  30. Keller, B.; Zimmermann, L.; Rascher, U.; Matsubara, S.; Steier, A.; Muller, O. Toward predicting photosynthetic efficiency and biomass gain in crop genotypes over a field season. Plant Physiol. 2022, 188, 301–317. [Google Scholar] [CrossRef]
  31. Fu, W.; Li, P.; Wu, Y. Effects of different light intensities on chlorophyll fluorescence characteristics and yield in lettuce. Sci. Hortic. 2012, 135, 45–51. [Google Scholar] [CrossRef]
  32. Fu, W.; Li, P.; Wu, Y.; Tang, J. Effects of different light intensities on anti-oxidative enzyme activity, quality and biomass in lettuce. Hortic. Sci. 2012, 39, 129–134. [Google Scholar] [CrossRef]
  33. Zha, L.; Liu, W.; Zhang, Y.; Zhou, C.; Shao, M. Morphological and Physiological Stress Responses of Lettuce to Different Intensities of Continuous Light. Front. Plant Sci. 2019, 10, 1440. [Google Scholar] [CrossRef] [PubMed]
  34. Ahmed, H.A.; Yu-Xin, T.; Qi-Chang, Y. Optimal control of environmental conditions affecting lettuce plant growth in a controlled environment with artificial lighting: A review. S. Afr. J. Bot. 2020, 130, 75–89. [Google Scholar] [CrossRef]
  35. Kang, J.H.; KrishnaKumar, S.; Atulba, S.L.S.; Jeong, B.R.; Hwang, S.J. Light intensity and photoperiod influence the growth and development of hydroponically grown leaf lettuce in a closed-type plant factory system. Hortic. Environ. Biotechnol. 2013, 54, 501–509. [Google Scholar] [CrossRef]
Figure 1. Light distribution indicating the photosynthetic photon flux density (PPFD) inside the growth chamber (four rows × eight columns) for each individual plant growth space, represented by red squares (left), and a picture of the study layout and light spectrum ranges (right).
Agronomy 14 02281 g001
Figure 2. (A) Shoot and root dry weight and (B) shoot and root fresh weight of lettuce (Lactuca sativa ‘Rex’) grown at different PPFDs in deep water culture hydroponics. The lines represent single regression analyses, indicating significant PPFD interactions (p < 0.05). Each data point represents one plant subjected to varied PPFD levels.
Agronomy 14 02281 g002
Figure 3. Water content of lettuce (Lactuca sativa ‘Rex’) grown at different PPFDs in deep water culture hydroponics. The line represents the single regression analysis indicating significant PPFD interactions (p < 0.05). Each data point represents one plant subjected to varied PPFD levels.
Agronomy 14 02281 g003
Figure 4. Shoot dry weight of lettuce (Lactuca sativa ‘Rex’) grown at different water contents in deep water culture hydroponics. The line represents the single regression analysis, indicating significant water content interactions (p < 0.05). Each data point represents one plant subjected to varied PPFD levels.
Agronomy 14 02281 g004
Figure 5. (A) Total leaf area (TLA) and final projected canopy size (PCS), (B) specific leaf area (SLA) and canopy overlap ratio (COR) of lettuce (Lactuca sativa ‘Rex’) grown at different PPFDs in deep water culture hydroponics. SLA was calculated by dividing the leaf area by the plant’s dry weight. COR was calculated by dividing the TLA by the final projected canopy size (the final canopy size measurement was from the last image taken before harvest). The lines represent the single regression analyses, which indicate significant PPFD interactions for all but the PCS (p < 0.05).
Agronomy 14 02281 g005
Figure 6. Total incident light of lettuce (Lactuca sativa ‘Rex’) grown at different PPFDs in deep water culture hydroponics. The line represents the single regression analysis, indicating significant PPFD interactions (p < 0.05). Each data point represents one plant subjected to varied PPFD levels.
Agronomy 14 02281 g006
Figure 7. Shoot dry weight of lettuce (Lactuca sativa ‘Rex’) grown at different total incident light levels in deep water culture hydroponics. IL was calculated by multiplying DLI by the projected canopy size. The line represents the single regression analysis, indicating significant IL interactions (p < 0.05). Each data point represents one plant subjected to varied PPFD levels.
Agronomy 14 02281 g007
Figure 8. Light use efficiency of lettuce (Lactuca sativa ‘Rex’) grown at different PPFDs in deep water culture hydroponics. The line represents the single regression analysis, indicating significant PPFD interactions (p < 0.05). Each data point represents one plant subjected to varied PPFD levels.
Agronomy 14 02281 g008
Table 1. Detailed nutrient concentrations used in this study.
Nutrients (mg/L)
NO3-NNH4+-NPKCaMgSBCuFeMnMoZn
773101006242570.290.161.630.620.030.62
Disclaimer/Publisher’s Note: The statements, opinions and data contained in all publications are solely those of the individual author(s) and contributor(s) and not of MDPI and/or the editor(s). MDPI and/or the editor(s) disclaim responsibility for any injury to people or property resulting from any ideas, methods, instructions or products referred to in the content.

