Article

Control of the Field Herbicide Dissipation by Cover Crop Mulch in Conservation Agriculture

by
Marwa Douibi
,
María José Carpio
,
M. Sonia Rodríguez-Cruz
,
María J. Sánchez-Martín
and
Jesús M. Marín-Benito
*
Institute of Natural Resources and Agrobiology of Salamanca (IRNASA-CSIC), Cordel de Merinas 40-52, 37008 Salamanca, Spain
*
Author to whom correspondence should be addressed.
Agronomy 2024, 14(10), 2284; https://doi.org/10.3390/agronomy14102284
Submission received: 8 August 2024 / Revised: 21 September 2024 / Accepted: 2 October 2024 / Published: 4 October 2024
(This article belongs to the Section Innovative Cropping Systems)

Abstract

:
The effects of mulch on the dissipation of S-metolachlor-SMOC, foramsulfuron-FORAM, and thiencarbazone-methyl-TCM and the formation of their main degradation metabolites were studied here. The herbicides were jointly applied in preemergence of maize on two separate occasions to two agricultural soils under conventional tillage (CT) and non-tillage (NT) over two wheat-maize cycles. Herbicide concentrations were determined in topsoil samples at different times after both applications, and they were fitted to kinetic models. The half-life (DT50) values for SMOC were higher under CT management than under NT (mean values: 25.6 and 7.38 days, respectively) in both soils over the two years. The faster herbicide dissipation with mulch could be because it is partially intercepted and strongly adsorbed/retained through different potential pathways, especially biodegradation, which was supported by the detection of SMOC-ESA and SMOC-OA metabolites. The mean DT50 values for FORAM (6.15 and 6.07 days, respectively) were very close for both soils under NT and CT management over the two-year experiment. The mulch had a lesser impact than for SMOC due to the former’s higher water solubility and lower adsorption, with dissipation being controlled mainly by biodegradation and likely also by leaching. TCM recorded intermediate DT50 values (mean value 20.8 days) in both soils+CT in the two-year experiment compared to SMOC and FORAM. The mulch effect on TCM dissipation was observed only after the second application because the DT50 values were higher in soils+NT after the first application (mean value: 26.9 days) than after the second one (mean value: 5.9 days). The amount of soil surface covered by the mulch controlled the herbicide dissipation, and soil and herbicide properties determine their adsorption behaviour by both mulch and soils.

1. Introduction

Conservation soil management practices are being implemented and developed to meet the increased demand for food, preserve the sustainability of agricultural systems, and overcome the negative impact of intensive conventional agriculture [1].
Conservation agriculture is a set of agronomic practices designed to optimise agroecosystem management, conserve and improve natural resources, and enhance productivity [1,2,3]. It is based on three interlinked principles: minimum soil tillage or non-tillage (NT), the maintenance of a permanent soil cover using crop residues (mulching), and diversified crop rotation [2]. This farming system differs from conventional agriculture in several key ways. While conventional agriculture often involves intensive soil tilling (CT), which may lead to soil degradation and erosion, conservation agriculture minimises soil disturbance and preserves soil structure and soil organic matter through NT [4,5]. Additionally, the maintenance of a permanent soil cover, such as cover crops or crop residues, helps reduce erosion, increase organic carbon (OC), improve water infiltration, and raise soil moisture content, as opposed to conventional agriculture, which may leave the soil bare between crop cycles, making it more susceptible to erosion and moisture loss [6,7].
Mulch (crop residue) is one of the main changes resulting from the implementation of NT compared to conventional methods, as crop residues on the soil surface heavily influence the dissipation processes of the herbicides applied, as most of these agrochemicals are intercepted by the mulch before reaching the soil [8,9]. Depending on the nature and interaction of crop residues, the herbicide intercepted may be susceptible to adsorption, photodegradation, volatilisation, and degradation by microorganisms because of its high microbial activity compared to soil [8,10,11,12]. Studies have shown that mulch characteristics such as the chemical composition and the degree of decomposition are the main components involved in the adsorption of herbicides [13,14,15]. The herbicides retained could subsequently be leached from crop residues depending on their characteristics and the timing and intensity of the first irrigation or rainfall [10,16].
In addition, changes in the biochemical composition of crop residues and associated microbial activity during decomposition could significantly alter herbicide degradation [17,18]. Herbicide dissipation in mulch residues therefore remains a contradictory process, as some studies have indicated that herbicide degradation is higher in mulch than in soils [15,17,18], while other studies report lower or slower degradation [9,14,19].
Nevertheless, herbicides are not retained permanently in the mulch because they are leached by the action of irrigation and precipitation: once they reach the soil, their dissipation is governed by a combination of factors. Minimal soil disturbance and the accumulation of spent crop residues increase the OC content in the topsoil, which heavily influences the soil’s chemical and biological properties [8]. The higher OC content under conservation agriculture management tends to increase the abundance and activity of microbial biomass compared to conventional agriculture and therefore increases herbicide degradation [19,20,21,22]. However, some studies have reported the opposite effect, as herbicide degradation by microorganisms decreased under conservation agriculture due to the high adsorption that lowered herbicide bioavailability [23].
The behaviour of herbicides under conservation agriculture is contradictory and poorly understood, with few studies on their dissipation and persistence in soils under NT under real field conditions. There is therefore a need to understand the mechanisms of herbicides in soils under conservation agriculture to determine their persistence and environmental risks.
The herbicides S-metolachlor (SMOC), foramsulfuron (FORAM), and thiencarbazone-methyl (TCM) are used to control grasses and broadleaf weeds in crops [24]. SMOC is a selective chloroacetamide herbicide, with moderate solubility in water and high hydrophobicity. FORAM is a sulfonylurea herbicide with high water solubility and low hydrophobicity. TCM belongs to the triazolone group with moderate solubility in water and low hydrophobicity. The three herbicides are considered to be non-persistent in agricultural fields, with half-live values (DT50) of less than 23.2 days [24]. Based on these and other additional properties, SMOC and TCM require a moderate alert in terms of environmental fate and ecotoxicity, and a high alert in terms of human health. FORAM presents a high, moderate, or low warning in terms of environmental fate, ecotoxicity, and human health, respectively [24]. These compounds are widely used today in agricultural soils under conservation management, and because there are few or no studies on their behaviour at a real field scale under different management practices, particularly in conservation agriculture, understanding their dissipation processes is therefore necessary to determine their environmental footprint.
The dissipation and persistence of SMOC have been widely evaluated in soils under CT [12,24,25,26], with fewer studies on soils subject to NT management, influenced by the presence of mulch and soil properties [15,27]. As far as we know, there are no field dissipation studies on FORAM and TCM under either management practice, only at a laboratory scale for TCM in soils [28].
This study pursued the following objectives: (i) the evaluation of the dissipation kinetics of the herbicides SMOC, FORAM, and TCM and the formation of their main degradation metabolites in agricultural soils under CT and NT management after two applications in a two-year field experiment; and (ii) the fitting of herbicide dissipation to the simplest and most acceptable kinetic model through statistical indexes for their description, as well as the determination of the half-lives of compounds under the different soil managements.

2. Materials and Methods

2.1. Experimental Site, Soil Sampling, and Processing

A field experiment was conducted for two years in experimental plots of 9 m × 9 m at Muñovela farm belonging to the Institute of Natural Resources and Agrobiology of Salamanca (IRNASA-CSIC), Spain, in an Eutric-Chromic Cambisol [29]. The design consists of eight plots randomly distributed with four treatments combining two soil management systems (CT and NT) and two sandy-loam-textured soils with different OC contents in the top 10 cm, labelled as soil S1 (0.69% OC) and soil S2 (1.01% OC) (Table S1 in Supplementary Materials), each with two repetitions. The CT system corresponded to conventional tillage (25–28 cm depth) (S1+CT and S2+CT), and the NT system corresponded to non-tillage (S1+NT and S2+NT) over two successive winter wheat-maize cycles. The soils’ physicochemical characteristics were determined by standard analytical methods [30] (Table S1).
In the first year, winter wheat was sown as a cover crop in S1+NT and S2+NT on 29 October 2019, chemically destroyed by glyphosate on 24 April 2020, and cut and deposited on the surface of NT plots as mulch, covering 65–70% of the soil surface before planting maize. The soil was kept bare in S1+CT and S2+CT during this period. Maize was sown by direct seeding in the experimental plots on 8 June 2020. It was harvested on 2 December 2020 (first crop cycle). The procedure was similar in the second year. The soil was again kept bare after the maize harvest in soils+CT, while winter wheat was sown (26 February 2021) as cover crop in soils+NT over the fallow period, destroyed by glyphosate (on 17 May 2021), and cut and left as a mulch layer on NT plots, covering more than 85% of the soil surface. The period corresponding to the second maize cycle was 3 June–19 November 2021.
Commercial formulations of the herbicides SMOC, FORAM, and TCM were applied jointly in all the experimental plots using a sprayer attached to a tractor during the preemergence of maize: Efica 960 EC®, SMOC 96% w/v (ADAMA Agriculture Spain S.A., Madrid, Spain) and Monsoon Active®, and FORAM 3.15% w/v + TCM 1% w/v (Bayer Crop Science S.L., Valencia, Spain). The first application was on 9 June 2020, at the rates of 0.621, 0.621, and 0.197 kg a.i ha−1, respectively, and the second was on 8 June 2021, at the rates of 0.975, 0.840, and 0.267 kg a.i ha−1, respectively. Herbicide dissipation was evaluated in both periods after application.
All the experimental plots were irrigated weekly (~26 mm week−1) by sprinklers between June and September 2020 (333 mm total irrigation) for the first maize cycle and between July and August 2021 for the second maize cycle (~26 mm week−1, 234 mm total irrigation). The first irrigation was carried out 7 and 35 days after the first and second herbicide applications, respectively (Figure S1 in Supplementary Materials).
Meteorological data (precipitation and maximum, minimum, and average air temperature) were recorded daily at an AEMET automatic weather station located at the experimental site. The temperatures ranged from −2 °C to 37.4 °C and from −1 °C to 38.8 °C (18.4 °C mean temperature) during the first and second field dissipation experiments, respectively, and the accumulated precipitation was 110.2 mm and 178.8 mm after the first and second herbicides applications, respectively (Figure S1).
Topsoil (0–10 cm) samples were collected from all the experimental plots at 18 different times between 1 and 139 or 1 and 153 days after the first and second herbicide applications, respectively. At each sampling time, five soil sub-samples were randomly taken from each plot and then uniformly mixed to obtain a representative average soil sample for each plot. The composite samples were homogenised, sieved (<2 mm), and stored at −18 °C until their analysis.

2.2. Herbicide Extraction and Analysis

Merck Life Science S.L. (Madrid, Spain) supplied the analytical standards of SMOC (≥99.1% purity), FORAM (≥98.5% purity), and TCM (≥99.8% purity); the major metabolites of SMOC: ethane sulfonic acid (SMOC-ESA), sodium salt (≥96.2% purity), and oxanilic acid (SMOC-OA) (≥99.3% purity); and the metabolite of FORAM, 2,4-dimethoxypyrimidine-2-amine (FORAM-MET) (≥97.5% purity) (Table S2).
Duplicate wet soil samples (40 g) were taken from each soil segment and plot and sonicated (1 h at 20 °C) and intermittently shaken (24 h at 20 °C) with 80 mL of methanol: Milli-Q ultrapure water 50:50. The samples were then centrifuged (30 min at 5045× g) and passed through nylon filters (<0.22 µm). Subsequently, the herbicides in the extract were concentrated by solid-phase extraction (SPE), whereby 50 mL of the extract was mixed with 445 mL Milli-Q ultrapure water and 5 mL formic acid. The mixture was passed through Bond Elut Plexa polymeric cartridges (60 mg, Agilent, Santa Clara, CA, USA) using a Gilson MINIPULS 3 peristaltic pump (Gilson, Inc., Middleton, WI, USA) at a constant flow rate of 1 mL min1. The cartridges were previously conditioned with 5 mL of methanol and 5 mL of deionised water. The herbicides retained by the cartridges were eluted with 5 mL of methanol and evaporated to dryness under a nitrogen stream using an EVA-EC2-L evaporator (VLM GmbH, Bielefeld, Germany). Finally, the residue was redissolved in 0.75 mL of methanol and transferred to glass vials for analysis. The mean recovery values recorded by this extraction and concentration procedure with analytical grade herbicide and metabolites were 84% for SMOC, 79% for SMOC-ESA and SMOC-OA, 80% for FORAM, 67% for FORAM-MET, and 75% for TCM.
The herbicides/metabolites were quantitatively determined by UHPLC-QTOF-MS [31]. The positive molecular ions (m/z) [M+H]+ 284.14 (SMOC), 391.39 (TCM), and 453.12 (FORAM) and 156.08 (FORAM-MET), 280.15 (SMOC-OA), and 330.14 (SMOC-ESA) were monitored for the quantification process. The herbicides and metabolites were observed at the retention times of 2.90 (FORAM), 3.17 (TCM), and 3.81 (SMOC) min and 1.45 (FORAM-MET), 2.58 (SMOC-ESA), and 3.20 (SMOC-OA) min. The limits of detection (LOD) and quantification (LOQ) in the two soils assayed varied in the range of 0.00020.0003 and 0.00070.0008 μg mL−1 for SMOC, 0.00010.0003 and 0.00040.0010 μg mL−1 for SMOC-ESA, 0.00020.0005 and 0.00050.0015 μg mL−1 for SMOC-OA, 0.00070.0031 and 0.00220.0094 μg mL−1 for FORAM, 0.00010.0003 and 0.00020.0008 μg mL−1 for FORAM-MET, and 0.00010.0005 and 0.00020.0016 μg mL−1 for TCM, respectively.

2.3. Data Analysis

The dissipation curves of SMOC, FORAM, and TCM in the different treatments assayed were determined by measuring the remaining concentrations of herbicides in the soils over time. These amounts were expressed as a percentage of the herbicide determined one day after the first or second application in the topsoil of soils+CT, which was considered 100% of the herbicide applied under CT or NT management. The experimental data were fitted to the single first-order (SFO) and first-order multi-compartment (FOMC) kinetic models, according to FOCUS work group guidelines for selecting the best kinetic model describing the dissipation results. The coefficient of determination and the chi-squared test were calculated as indicators of the goodness of fit. The times required for the herbicide concentration to fall to 50% (DT50, days) and 90% (DT90, days) of the initial amount applied were calculated both to compare variations in dissipation rates in different soil treatments and to characterise the dissipation curves. The kinetic model parameters were estimated using the Excel Solver Add-in Package v. 2019 [32].
Standard deviation (SD) was used to indicate variability in the dissipation coefficient values among replicates. One-way ANOVA was performed to determine significant differences between dissipation coefficients. Means were compared by the Tukey post-hoc test (p < 0.05). IBM SPSS Statistics v. 29.0 software (IBM Inc., Chicago, IL, USA) was used.

3. Results and Discussion

3.1. Dissipation Kinetics of S-Metolachlor in Soils under Conventional Tillage and Non-Tillage

The dissipation kinetics of SMOC was fitted to either the SFO model or the FOMC model after the first and second herbicide applications to field plots (Figure 1, Table 1), indicating an exponential decline, consistent with previous results in agricultural soils under field conditions [12,16,25,33]. At the end of the first experimental year (139 days), concentrations of SMOC ≤ 5% of the amount initially applied were detected in all the experimental plots (Figure 1). The DT50 values were 30 (S1+CT) and 21.3 (S2+CT) days (Table 1), which are consistent with DT50 values ranging from 11 to 31 days in European soils and a mean value of 23.2 days [12,15,24,33,34]. The DT50 values decreased in soils under NT, ranging from 9.50 (S1+NT) to 14.7 (S2+NT) days (Table 1).
In soils+CT, 30.4 ± 6.2% of SMOC (mean value of both soils) was dissipated 13 days after its first application, increasing this percentage to 54 ± 11% in soils+NT (relative to the true amounts of herbicide applied and initially determined in soils+CT). This high dissipation rate under both systems could be due to the high initial leaching of the herbicide through the soil profile because of the short time lapse (seven days) between the application date and the first irrigation event (52 mm, Figure S1). The effect of rainfall on the mobility of hydrophobic herbicides such as SMOC shortly after their application to the soil has been already reported [9,16,35,36].
The dissipation of SMOC increased 1.4–3.2 times in soils+NT compared to soils+CT, and significantly lower DT50 values (p < 0.001) were obtained in these soils (Table 1). The mulch partially intercepted the herbicide applied, where it was strongly adsorbed/retained because of its high adsorption coefficient (Kf = 45.6) [31] and/or dissipated through different potential pathways [10,15,24,33], as not all the herbicide applied reached the soils+NT surface (only 41 ± 12% of SMOC initially did so), even after the herbicide was washed off from the mulch surface by the irrigation (maximum 59.3 ± 0.5% at t = 8 days).
S1+CT recorded a higher SMOC DT50 value than S2+CT (p < 0.05) (Table 1), with a higher SMOC Kf adsorption coefficient for S2 (Kf = 2.00) than for S1 (Kf = 1.34) (Table S1), which may decrease the bioavailability of SMOC to be degraded and increase its DT50 in S2 [16,34,37]. However, the higher DOC content in S2+CT than in S1+CT topsoil (Table S1) facilitated the formation of SMOC-DOC mobile complexes in S2 [38,39], enhancing the dissipation of the herbicide remaining in the solution via its mobility to deeper soil horizons. Moreover, this leaching process would have been favoured by the promptness of the first irrigation events after the herbicide application.
The DT50 and DT90 values in soils+NT were higher in S2 than in S1 (Table 1). The higher OC content in S2 controlled the adsorption and bioavailability of the herbicide when it reached the soil surface after its initial retention and subsequent washing from the mulch surface by irrigation. Contrary to the results for soils+CT, the irrigation did not control SMOC dissipation as intensively, as the mulch layer might have dampened the irrigation’s impact and reduced its access to the soil [6,40]; it would have meant the SMOC mobility was more slow regarding deeper soil horizons.
As in the first experimental year, significantly lower DT50 values (p < 0.001) were recorded after the second herbicide application in soils+NT than in soils+CT (up to 5.8 times in S1 and 18 times in S2). The mulch layer fully controlled the dissipation of SMOC in soils+NT after the second application because the initial amount in the topsoil was less than 1.5% of the herbicide initially applied. The peak concentration was 18.4 ± 7.8% of the herbicide initially applied and was observed eight days after the application and 28 mm of precipitation (Figure 1 and Figure S1). The different behaviour observed in soils+NT after the first and second applications is explained by the mulch layer, which was more extensive in the second year (>85%) than in the first one (~65–70%).
The low SMOC leaching through the CT and NT soil profiles reported by Douibi [41] does not explain the high herbicide dissipation. A very high percentage of SMOC was intercepted by the mulch layer and probably dissipated in situ through other potential pathways. The residual level or rate at which a pesticide declines by 50% (RL50) on and in a specified plant matrix including leaves, fruit, roots, seeds, grains, etc. reported for SMOC (RL50 of 11.6 days) indicates a rapid dissipation of this herbicide ranging between 5.8 and 20.3 days [24]. This supports the hypothesis of in situ SMOC dissipation. Wołejko et al. [12] and Cao et al. [42] have also reported low DT50 values for SMOC in maize, ranging between 9.6 and 13.9 days and 4.84 and 6.68 days, respectively.
The dissipation of SMOC over this second year was not so affected by irrigation or precipitation, along with the formation of SMOC-DOC mobile complexes, as indicated previously for the first experimental year. The SMOC DT50 value was significantly higher in S2+CT (30.2 days) than in S1+CT (20.9 days) (Table 1). The higher adsorption by S2 than by S1 enhanced, in this case, a decrease in its bioavailability to be degraded. This was probably due to the lower accumulated precipitation recorded between 4 and 12 days after the second application (44 mm) compared to the irrigation applied shortly after the first application (52 mm in two 26 mm events at seven and ten days) and to its different intensity (44 mm in eight days) compared to that of the irrigation (26 mm in 2.5 h). Fernandez et al. [16] have reported SMOC DT50 values up to 2.3 times higher in the rainiest year, and Aslam et al. [10] have observed lower SMOC leaching in repacked soil columns covered with a mulch of maize and lablab residues in a light but frequent rainfall regime compared to less frequent but more intense precipitation.
The dissipation of SMOC via microbial degradation reported in soils [25,26,43] or under laboratory conditions with sterilised and non-sterilised soils [44] was also consistent with the detection of two metabolites from SMOC (SMOC-ESA and SMOC-OA) in the soils under CT and NT management over the two experimental periods (Figures S2 and S3). The concentration of both SMOC metabolites increased in all the soil treatments from the first day of the experiment to a peak concentration, whereupon it decreased progressively to the end of the first year (139 days) and the second one (153 days), when traces of both metabolites were still detected in the topsoil.
The peak concentration of SMOC-ESA in the first experimental year was detected at 41 days in soils+CT and at 27 days in soils+NT, consistent with the faster dissipation (lower DT50 values) in soils+NT (Figure S2, Table 1). The peak for SMOC-OA was recorded at 27 days in all cases except in S2+CT, where it was detected at 48 days. In the second experimental year, the peak concentrations for SMOC-ESA were detected at 57 days (S1+CT and S1+NT) and at 41 days (S2+CT and S2+NT) (Figure S3). For SMOC-OA, the peak concentrations were detected at 41 and 48 days in S2+CT and S1+CT, respectively, and at 34 days in S1+NT and S2+NT. The maximum concentrations of SMOC-OA were higher than for SMOC-ESA in all cases after the first herbicide application, while the opposite was observed after the second [15]. A lower persistence of both metabolites in the topsoil of S1+CT and S2+CT was observed under field conditions compared to controlled laboratory conditions [44]. This highlights the losses through metabolite leaching, which is consistent with their very high water solubility and high GUS index (Table S2) [24].
Mineralisation, the formation of bound residues, and/or the volatilisation of SMOC on the mulch surface might also have occurred simultaneously with microbial degradation, as reported by Aslam et al. [10] for a mulch of maize and lablab residues. By contrast, weak (2%) 14C-SMOC mineralisation for both cover crop mulches and bare soil has been reported by Cassigneul et al. [15], indicating that SMOC was rapidly dissipated in mulches through degradation to SMOC-ESA and SMOC-OA and the formation of bound residues (up to 53.6% of the dosage applied). 14C-SMOC mineralisation varies greatly in soils from fields with different CT systems, ranging from 0.8% to 28.3% after 113 days [27], while SMOC dissipation is favoured by the increased formation of soil-bound residues in saturated soils compared to unsaturated soils [45]. This process might also have occurred on the surface of soils+NT after irrigation according to the higher Kf adsorption coefficients of mulch than those of soils [31]. Other studies have also reported significant losses of SMOC by volatilisation (up to 25%) from both bare soil and soil cover with crop residues, with the loss of the herbicide being highly correlated with increasing surface soil water content [11,46,47,48].
At the end of the second experiment (153 days), SMOC concentrations ≤6% of the initial amount were detected in the soil surface under the different treatments (Figure 1).

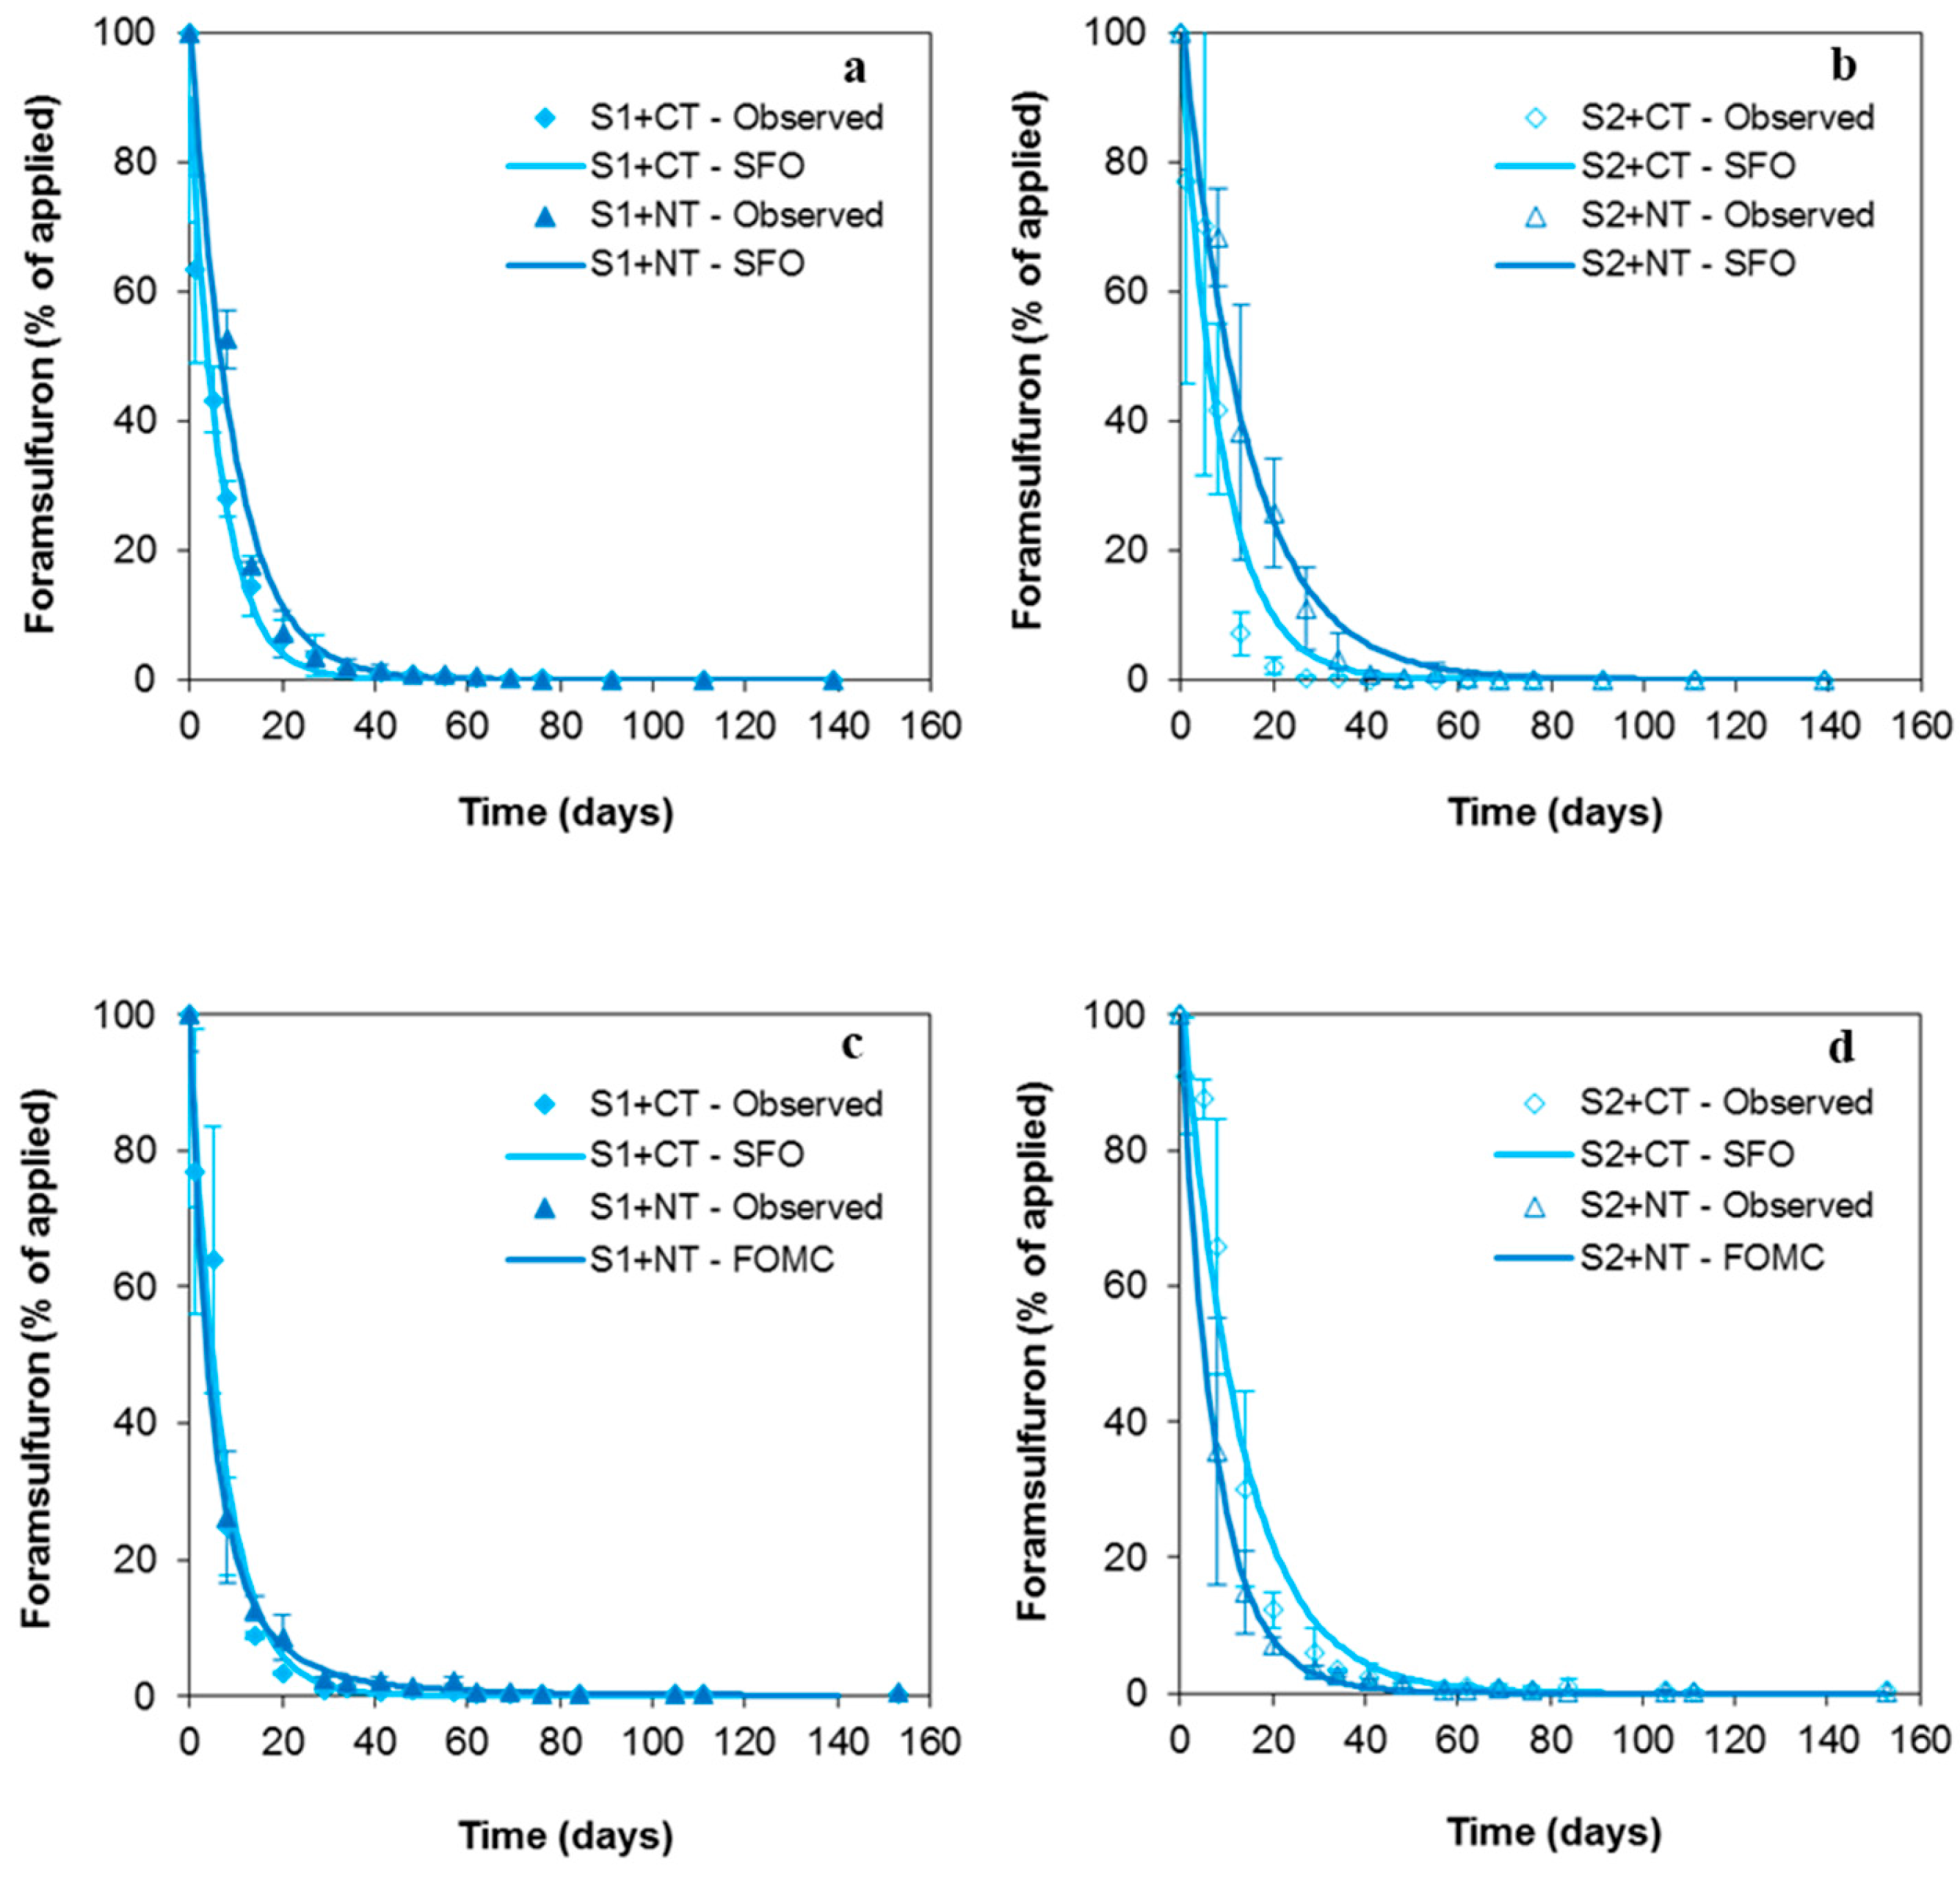
3.2. Dissipation Kinetics of Foramsulfuron in Soils under Conventional Tillage and Non-Tillage

The dissipation kinetics of FORAM fitted the SFO model well for all the soil treatments after the first herbicide application and the SFO and FOMC models after the second one to soils under CT or NT management, respectively (Figure 2, Table 2). The degradation rates of FORAM were higher than those of SMOC in all cases (Table 1 and Table 2), with DT50 values ≤9.5 days. This agrees with the lower Kf adsorption coefficients determined for FORAM by S1 and S2 soils compared to those of SMOC (Table S1). Furthermore, the herbicide’s characteristics favoured its rapid dissipation because FORAM is more water-soluble and less hydrophobic than SMOC (Table S2), which enhances its bioavailability for degradation, surface run-off, and/or leaching. The DT50 value of FORAM in soils+CT was lower in S1 (4.5 days) than in S2 (6.0 days), consistent with its higher adsorption by S2 (Kf = 0.09) than by S1 (Kf = 0) (Table S1) and, therefore, with its lower bioavailability for degradation in S2. The lack of field dissipation studies involving FORAM [49] does not allow for comparing these results with others, although they were in the same order of magnitude as those determined under laboratory conditions at 24 °C by Douibi et al. [44] or reported by EFSA [49] (1.1–9.2 days at 20–25 °C and 9–32% of the maximum soil moisture). The rapid dissipation of FORAM, a highly water-soluble herbicide, was probably controlled by leaching due to the promptness of the first irrigation events after its application.
As opposed to SMOC, higher FORAM DT50 values (p < 0.024) were determined for soils+NT than for the corresponding soils+CT. This difference is consistent with the much lower mulch Kf adsorption coefficient for FORAM (Kf = 5.48) than for SMOC (Kf = 45.6) [31], together with the higher water solubility of FORAM. These properties facilitated its leaching into the soils, with subsequent dissipation according to the corresponding Kf values in S1 and S2 (Table S1). The percentages of FORAM reaching the topsoil in soils+NT one day after herbicide application (42 ± 23%, Figure 2) were similar to those previously indicated for SMOC. However, the first irrigation event allowed for the leaching of a higher amount of FORAM than of SMOC, increasing its concentration in the soil to 61 ± 11% (eight days after its application) against 59.3 ± 0.5% observed for SMOC. Once in the soil, the herbicide was protected by the mulch layer against the direct impact of irrigation events, and the different soil adsorption behaviour (Kf) controlled the dissipation of FORAM (lower dissipation or higher DT50 and DT90 values in S2+NT than in S1+NT), as previously observed for SMOC.
The DT50 values after the second application fell within a similar range (3.7–8.8 days) as those in the first year, although these values (p < 0.015) were lower for soils+NT than for the corresponding soils+CT, as shown for SMOC. As previously explained, the mulch layer fully controlled herbicide dissipation, mainly by its almost complete retention after its application and until the beginning of its wash-off through precipitation. In this case, the initial amount of FORAM in the topsoil of soils+NT was 2.7 ± 1.9% of the herbicide initially applied (similar to that of SMOC). The peak concentration at a 0–10 cm depth was observed eight days after the application and after 28 mm of precipitation, similar to SMOC, although the percentage of FORAM reaching the topsoil was higher (30.9 ± 6.7%) (Figure 1 and Figure 2). This behaviour is consistent with the FORAM characteristics already mentioned (higher water solubility, lower hydrophobicity, and lower adsorption by mulch compared to SMOC). These specific characteristics also explain why the mulch layer did not have the same pronounced impact as for SMOC. In fact, the DT50 values for FORAM decreased to only 1.4–1.7 times in soils+NT compared to those in soils+CT (Table S1 and Table 2).
According to Douibi [41], the amount of FORAM leached below the topsoil in soils+NT (relative to the amount initially applied) was low, although it was higher than for SMOC. Therefore, a significant percentage of FORAM intercepted by the mulch layer may also have been dissipated through different pathways. Contrary to the available information for SMOC, there are no data in the literature on FORAM RL50 on and in the plant matrix. However, the dissipation of FORAM via degradation was supported here by the detection of the metabolite FORAM-MET in the soils under CT and NT management over the entire experimental period (Figures S2 and S3).
In all cases, the concentration of FORAM-MET increased from the first day of the experiment to a peak concentration and then decreased rapidly, although traces were still detected in all the topsoils at the end of both the first year (139 days) and the second one (153 days). This means FORAM-MET behaved in a similar way to the SMOC metabolites, although the time at which the peaks were observed and the corresponding concentrations varied in agreement with the different dissipation rates of their respective parent compounds. In the first year, the peak concentrations were detected at eight days in S1+CT and S1+NT and at five days in S2+CT and S2+NT (Figure S2), which is consistent with the slightly faster dissipation (lower DT50) observed in S1 than in S2 (Figure 2, Table 2). In the second experimental year, the concentration peaks were detected at eight days in all cases (Figure S3). The peaks for FORAM-MET were generally higher in the second year, consistent with the higher FORAM concentrations applied in the second year. The peak concentrations of FORAM-MET in soils+NT were lower than those detected in its corresponding CT soil only in the second year.
According to the EFSA report [49], the dissipation of FORAM can also occur via mineralisation and the formation of bound residues, reaching levels of 16.3% and 93% of the 14C-FORAM applied after 107 days and incubation under laboratory conditions, respectively. The dissipation of FORAM on the soil surface via photolysis has also been reported [49], which might also be expected on the mulch surface.
No residual amounts of FORAM were detected in the soil surface under any of the treatments at the end of the first year (139 days) or second one (153 days), which agrees with the low DT90 value (<32 days) (Table 2).

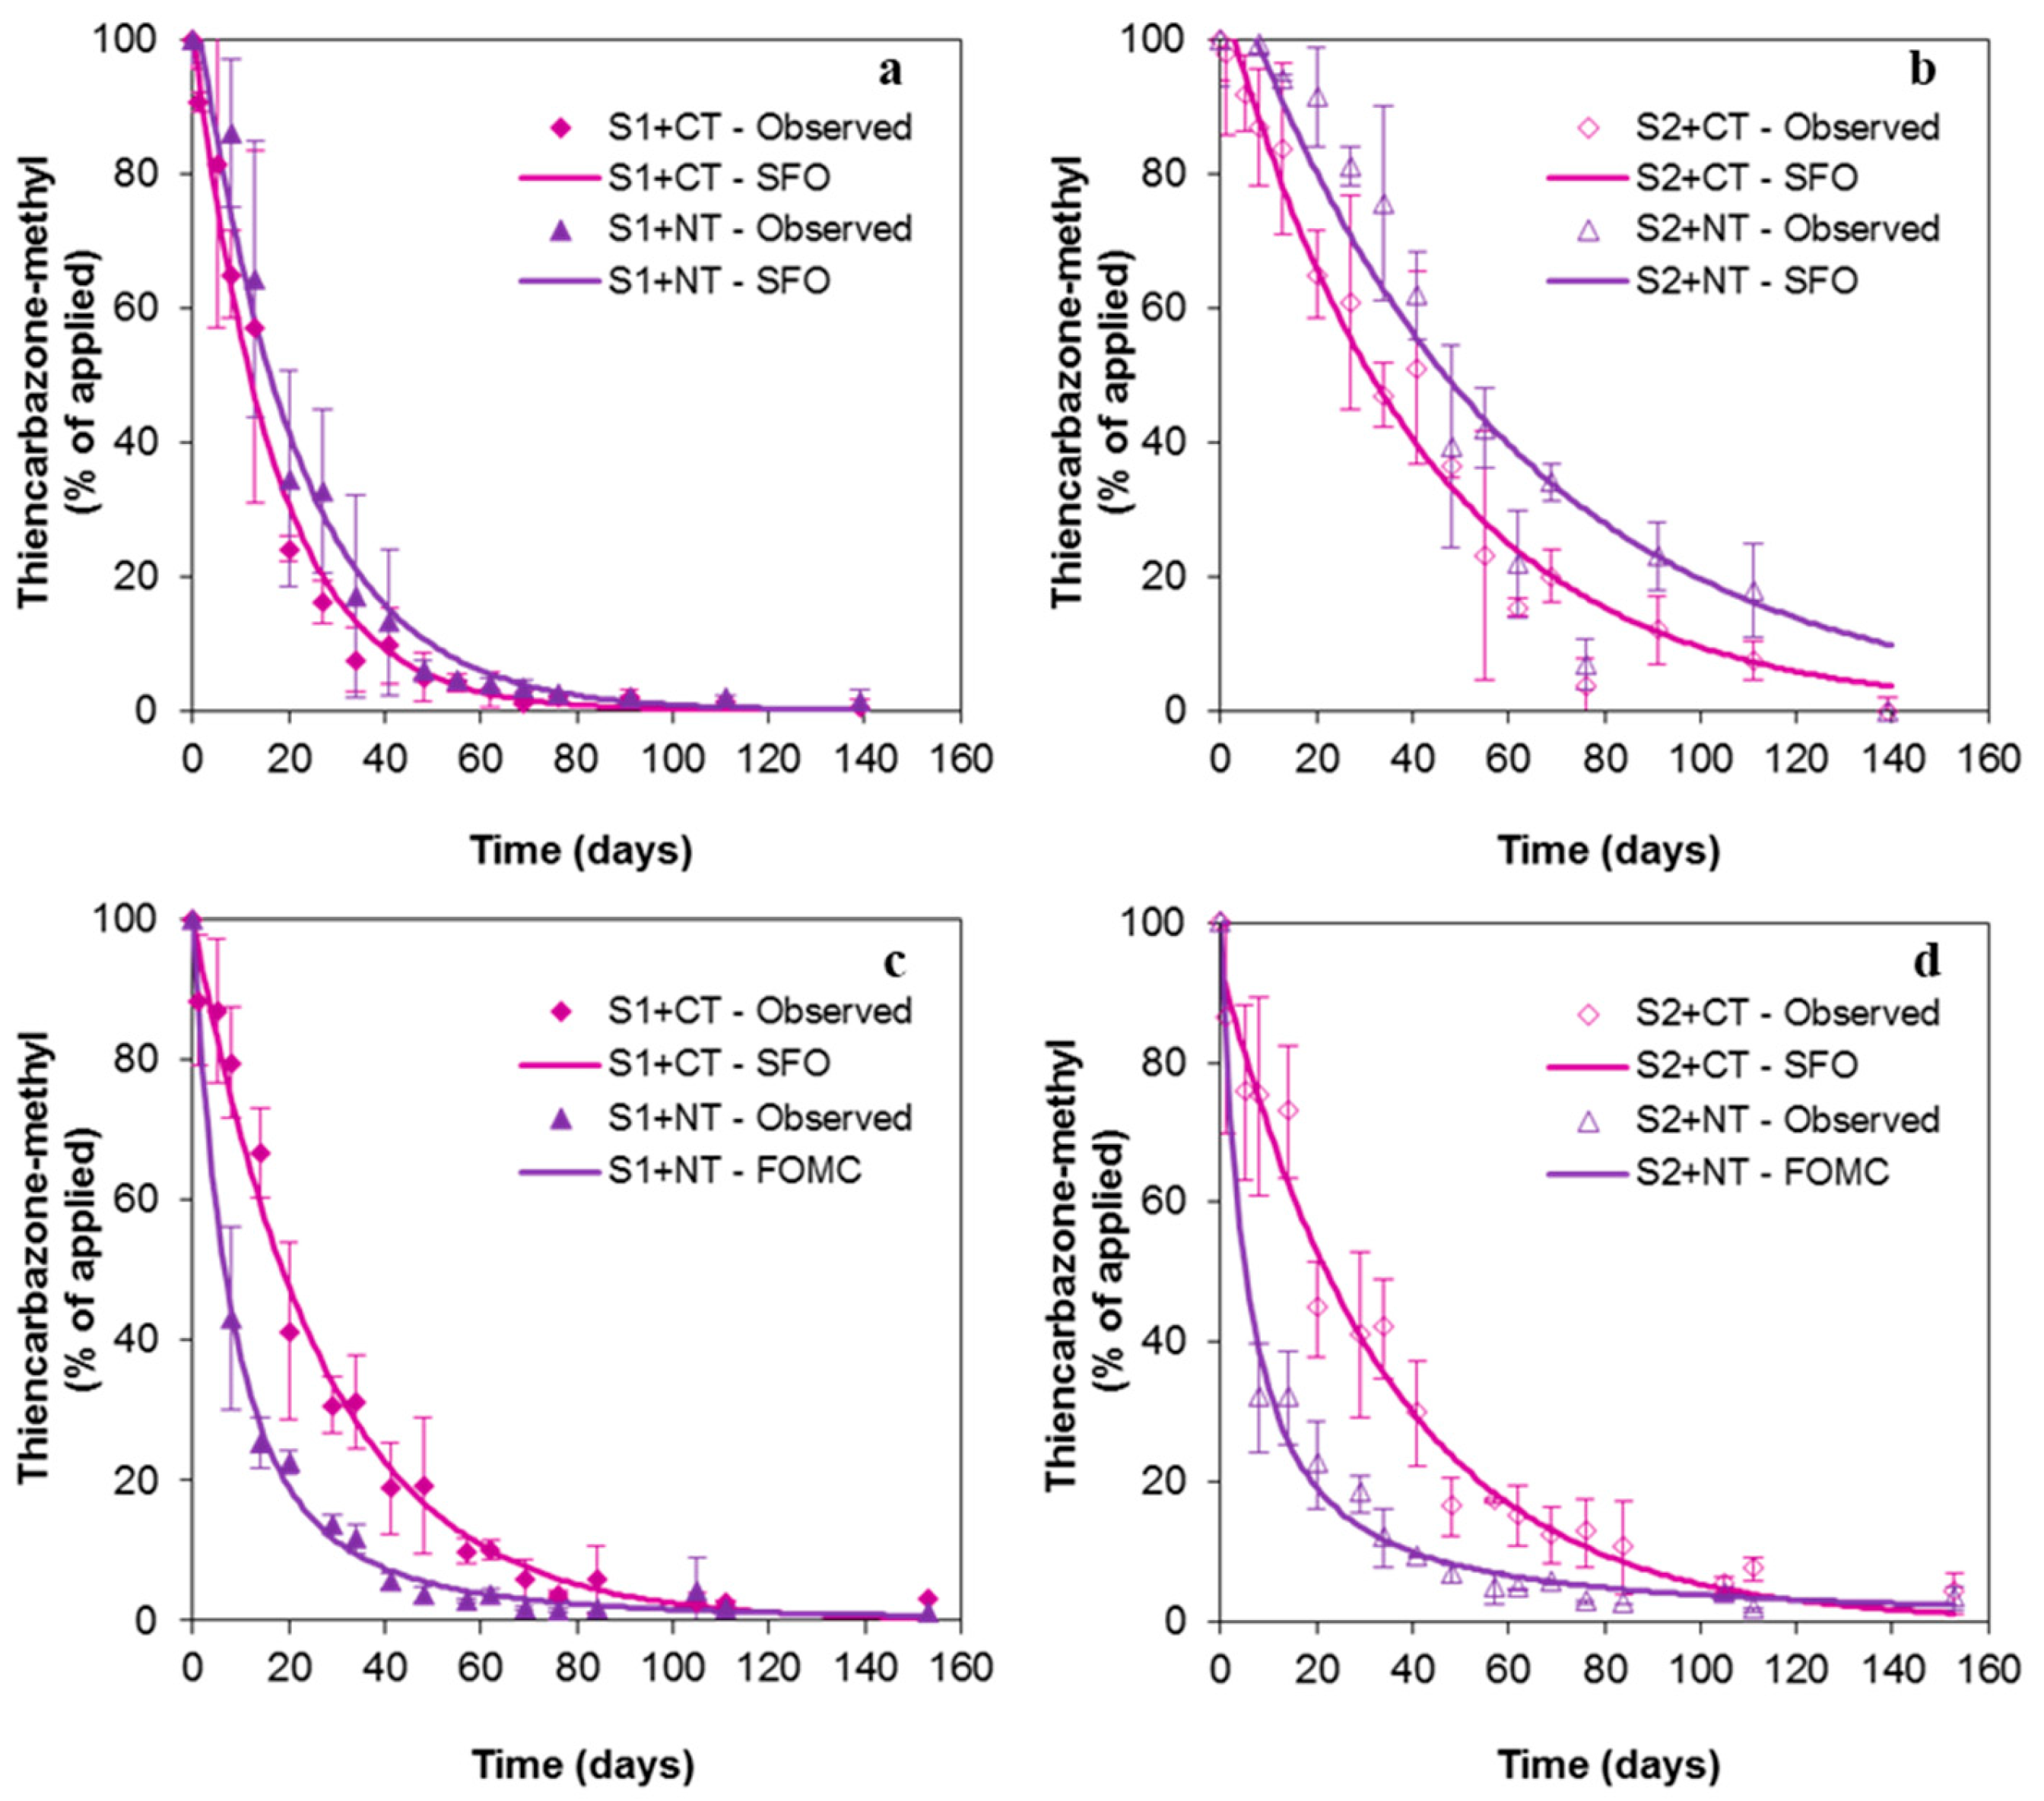
3.3. Dissipation Kinetics of Thiencarbazone-Methyl in Soils under Conventional Tillage and Non-Tillage

TCM had a similar dissipation behaviour to FORAM over the two experimental periods, with the SFO model generally providing the best fit with the dissipation kinetics (Figure 3, Table 3). In soils+CT, the DT50 values ranged from 11.6 to 28.6 days and between 18.7 and 24.3 days after the first and second applications, respectively (Table 3). They were always significantly higher in S2+CT than in S1+CT (p < 0.004) according to the higher Kf adsorption coefficient of TCM by S2 (Kf = 0.40) than by S1 (Kf = 0.01) (Table S1). These values were consistent with those reported for agricultural soils under CT and field conditions (average of 17 days and maximum of 45 days) [24]. However, they were lower than those obtained under laboratory conditions at 24 °C [44], highlighting the importance of changing environmental conditions, mainly irrigation/precipitation, on the TCM dissipation process. The DT50 values for TCM in the soils+CT over the two experimental years were intermediate compared to those of SMOC and FORAM (Table 1, Table 2 and Table 3) according to the variation order of the soil adsorption coefficients (Kf) of the three herbicides in question.
In soils+NT, the DT50 values varied in the ranges of 14.4–39.5 days and 5.2–6.6 days after the first and second applications, respectively (Table 3). Higher DT50 values were determined for soils+NT than for the corresponding soils+CT after the first application, although the opposite occurred after the second application of FORAM. The differences recorded between the DT50 values of TCM for the different treatments and experimental years are explained by the promptness, volume, and intensity of the first irrigation/precipitation events after the applications, as already explained in detail for SMOC and FORAM. Furthermore, the amount of soil surface covered by the mulch layer in each year, herbicide characteristics, and soil physicochemical properties, which inform the adsorption behaviour of the herbicides by mulch and soils, help to explain the results obtained, as previously indicated for the other herbicides studied.
After the second application, the initial amount of TCM in the topsoil of NT plots was 1.9 ± 1.3% (similar to SMOC and FORAM). The peak concentration in the topsoil of soils+NT was again observed eight days after the application and after 28 mm of precipitation. The percentage of TCM (37.6 ± 7.8%) reaching the topsoil was the highest compared to the other two herbicides (Figure 3), as explained for the first year, when almost all the TCM (92.7 ± 9.4%) initially applied reached the topsoil in soils+NT after its wash-off by irrigation (eight days after the application).
The low percentages of TCM leached below the topsoil in soils+NT [41] suggest that other dissipation pathways, such as the formation of bound residues, mineralisation, photodegradation, and microbial degradation, could be involved in its dissipation, being intercepted by the mulch layer in the second year, as reported for soils [28,50]. The losses of 14C-TCM in soils by mineralisation and the formation of bound residues can reach levels of up to 62.2% and 60%, respectively, of the applied dosage after 120 days of being incubated under dark aerobic laboratory conditions [50]. However, as for FORAM, there are no data in the literature on TCM RL50 on and in the plant matrix.
The dissipation of TCM was almost complete at the end of the first year (139 days) and the second one (153 days), when the residual amounts of TCM in the soil surface in all cases were lower than 1.3% and 4%, respectively, of the herbicide initially applied, with a DT90 of less than 131 days (Table 3).

4. Conclusions

The dissipation kinetics of the herbicide S-metolachlor in soil under CT and NT management and field conditions were best fitted by the SFO model, and those of the herbicides foramsulfuron and thiencarbazone-methyl were best fitted by the FOMC model after their first application, while the dissipation fit was more heterogeneous after the second application in NT treatments, when a higher amount of mulch on the soil surface controlled the herbicide dissipation mechanism. The dissipation of foramsulfuron and thiencarbazone-methyl was delayed or accelerated under NT compared to CT management after the first and second applications, respectively, while it was always accelerated for SMOC. The soil physicochemical characteristics (OC and DOC) and herbicide properties (solubility and hydrophobicity) played a key role in the delayed or accelerated dissipation of the herbicides under CT and NT management because they control herbicide adsorption by soils and mulch. The dissipation of S-metolachlor and foramsulfuron was also explained by biodegradation supported by the detection of some of their metabolites in the soils under both managements over the two experimental periods. In all cases, the relevant herbicide dissipation was likely via leaching, due to the irrigation (first year) and precipitation (second year) events recorded shortly after the application. The amount of mulch on the soil surface had a major impact on herbicide dissipation, with more than 56% occurring on the mulch surface before reaching the soil through different potential pathways (mineralisation, formation of bound residues, photodegradation, and/or volatilisation) in addition to degradation, which accelerated this process in soils under NT compared to those under CT management. These results show the need for optimising the amount of crop residues left as mulch on the soil surface to preserve the soil as well as to avoid the environmental pollution by herbicides without reducing their effect in controlling weeds.

Supplementary Materials

The following supporting information can be downloaded at: https://www.mdpi.com/article/10.3390/agronomy14102284/s1, Table S1: Main physicochemical characteristics of soils (S1, S2) under conventional tillage (CT) and non-tillage (NT); Figure S1: Rainfall, irrigation, and average temperature monitored over the 2-year experiment (a) and after the first (b) and second (c) applications of herbicides; Table S2: Chemical structure and main physicochemical characteristics of herbicides and their corresponding metabolites; Figure S2: Formation of metolachlor ethane sulfonic acid (SMOC-ESA), metolachlor oxanilic acid (SMOC-OA) and 2-amino-4,6-dimethoxypyrimidine (FORAM-MET) metabolites in soils under conventional tillage (S1+CT, S2+CT) and non-tillage (S1+NT, S2+NT) over time after the first application of herbicides to field plots. Bars indicate the standard deviation of the mean value (n = 4); Figure S3: Formation of metolachlor ethane sulfonic acid (SMOC-ESA), metolachlor oxanilic acid (SMOC-OA), and 2-amino-4,6-dimethoxypyrimidine (FORAM-MET) metabolites in soils under conventional tillage (S1+CT, S2+CT) and non-tillage (S1+NT, S2+NT) over time after the second application of herbicides to field plots. Bars indicate the standard deviation of the mean value (n = 4).

Author Contributions

Conceptualisation, J.M.M.-B.; methodology, J.M.M.-B.; validation, J.M.M.-B.; formal analysis, M.S.R.-C., M.J.S.-M. and J.M.M.-B.; investigation, M.D. and M.J.C.; resources, M.S.R.-C., M.J.S.-M. and J.M.M.-B.; data curation, J.M.M.-B.; writing—original draft preparation, M.D. and J.M.M.-B.; writing—review and editing, M.D., M.S.R.-C., M.J.S.-M. and J.M.M.-B.; visualisation, M.D., M.J.S.-M. and J.M.M.-B.; supervision, J.M.M.-B.; project administration, J.M.M.-B.; funding acquisition, J.M.M.-B. All authors have read and agreed to the published version of the manuscript.

Funding

This research was funded by MCIN/AEI/10.13039/501100011033/ERDF A way of making Europe, grant number RTI2018-101587-J-I00, and by the European Union, grant number EOM4Soil-862695.

Data Availability Statement

The original contributions presented in the study are included in the article/Supplementary Materials; further inquiries can be directed to the corresponding author.

Acknowledgments

We give thanks to Project CLU-2019-05—IRNASA/CSIC Unit of Excellence, funded by the regional government, the Junta of Castilla y León (Spain), and co-financed by the European Union (ERDF—Europe drives our growth). Marwa Douibi thanks the Algerian Ministry of Higher Education and Scientific Research for her predoctoral scholarship. The authors thank J.M. Ordax for his technical assistance.

Conflicts of Interest

The authors declare no conflicts of interest.

References

  1. Jayaraman, S.; Dang, Y.P.; Naorem, A.; Page, K.L.; Dalal, R.C. Conservation agriculture as a system to enhance ecosystem services. Agriculture 2021, 11, 718. [Google Scholar] [CrossRef]
  2. Kassam, A.; Friedrich, T.; Derpsch, R. Global spread of Conservation Agriculture. Int. J. Environ. Stud. 2019, 76, 29–51. [Google Scholar] [CrossRef]
  3. Perego, A.; Rocca, A.; Cattivelli, V.; Tabaglio, V.; Fiorini, A.; Barbieri, S.; Schillaci, C.; Chiodini, M.E.; Brenna, S.; Acutis, M. Agro-environmental aspects of conservation agriculture compared to conventional systems: A 3-year experience on 20 farms in the Po valley (Northern Italy). Agric. Syst. 2019, 168, 73–87. [Google Scholar] [CrossRef]
  4. Kassam, A.; Friedrich, T.; Derpsch, R.; Kienzle, J. Overview of the worldwide spread of conservation agriculture. Field Actions Sci. Rep. 2015, 8, 8. Available online: https://journals.openedition.org/factsreports/3966 (accessed on 15 November 2023).
  5. Thierfelder, C.; Matemba-Mutasa, R.; Bunderson, W.T.; Mutenje, M.; Nyagumbo, I.; Mupangwa, W. Evaluating manual conservation agriculture systems in southern Africa. Agr. Ecosyst. Environ. 2016, 222, 112–124. [Google Scholar] [CrossRef]
  6. Choudhary, M.; Ghasal, P.C.; Kumar, S.; Yadav, R.P.; Singh, S.; Meena, V.S.; Bisht, J.K. Conservation agriculture and climate change: An overview. In Conservation Agriculture: An Approach to Combat Climate Change in Indian Himalaya, 1st ed.; Bisht, J.K., Meena, V.S., Mishra, P.K., Pattanayak, A., Eds.; Springer: Singapore, 2016; pp. 1–37. [Google Scholar] [CrossRef]
  7. Ravichandran, M.; Samiappan, S.C.; Pandiyan, R.; Velu, R.K. Improvement of crop and soil management practices through mulching for enhancement of soil fertility and environmental sustainability: A review. J. Exp. Biol. Agric. Sci. 2022, 10, 4. [Google Scholar] [CrossRef]
  8. Alletto, L.; Coquet, Y.; Benoit, P.; Heddadj, D.; Barriuso, E. Tillage management effects on pesticide fate in soils. A review. Agron. Sustain. Dev. 2010, 30, 367–400. [Google Scholar] [CrossRef]
  9. Aslam, S.; Iqbal, A.; Lafolie, F.; Recous, S.; Benoit, P.; Garnier, P. Mulch of plant residues at the soil surface impact the leaching and persistence of pesticides: A modelling study from soil columns. J. Contam. Hydrol. 2018, 214, 54–64. [Google Scholar] [CrossRef]
  10. Aslam, S.; Iqbal, A.; Deschamps, M.; Recous, S.; Garnier, P.; Benoit, P. Effect of rainfall regimes and mulch decomposition on the dissipation and leaching of S-metolachlor and glyphosate: A soil column experiment. Pest Manag. Sci. 2015, 71, 278–291. [Google Scholar] [CrossRef]
  11. Bedos, C.; Alletto, L.; Durand, B.; Fanucci, O.; Brut, A.; Bourdat-Deschamps, M.; Giuliano, S.; Loubet, B.; Ceschia, E.; Benoit, P. Observed volatilization fluxes of S-metolachlor and benoxacor applied on soil with and without crop residues. Environ. Sci. Pollut. Res. 2017, 24, 3985–3996. [Google Scholar] [CrossRef]
  12. Wołejko, E.; Kaczyński, P.; Łozowicka, B.; Wydro, U.; Borusiewicz, A.; Hrynko, I.; Konecki, R.; Snarska, K.; Dec, D.; Malinowski, P. Dissipation of S-metolachlor in plant and soil and effect on enzymatic activities. Environ. Monit. Assess. 2017, 189, 355. [Google Scholar] [CrossRef] [PubMed]
  13. Aslam, S.; Garnier, P.; Rumpel, C.; Parent, S.E.; Benoit, P. Adsorption and desorption behavior of selected pesticides as influenced by decomposition of maize mulch. Chemosphere 2013, 91, 1447–1455. [Google Scholar] [CrossRef] [PubMed]
  14. Cassigneul, A.; Benoit, P.; Bergheaud, V.; Dumeny, V.; Etiévant, V.; Goubard, Y.; Maylin, A.; Justes, E.; Alletto, L. Fate of glyphosate and degradates in cover crop residues and underlying soil: A laboratory study. Sci. Total Environ. 2016, 545–546, 582–590. [Google Scholar] [CrossRef] [PubMed]
  15. Cassigneul, A.; Benoit, P.; Nobile, C.; Bergheaud, V.; Dumeny, V.; Etiévant, V.; Maylin, A.; Justes, E.; Alletto, L. Behaviour of S-metolachlor and its oxanilic and ethanesulfonic acids metabolites under fresh vs. partially decomposed cover crop mulches: A laboratory study. Sci. Total Environ. 2018, 631–632, 1515–1524. [Google Scholar] [CrossRef] [PubMed]
  16. Fernandez, J.V.; Odero, D.C.; MacDonald, G.E.; Ferrell, J.A.; Sellers, B.A.; Wilson, P.C. Field dissipation of S-metolachlor in organic and mineral soils used for sugarcane production in Florida. Weed Technol. 2020, 34, 362–370. [Google Scholar] [CrossRef]
  17. Aslam, S.; Benoit, P.; Chabauty, F.; Bergheaud, V.; Geng, C.; Vieublé-Gonod, L.; Garnier, P. Modelling the impacts of maize decomposition on glyphosate dynamics in mulch. Eur. J. Soil Sci. 2014, 65, 231–247. [Google Scholar] [CrossRef]
  18. Rampoldi, E.A.; Hang, S.; Barriuso, E. The fate of glyphosate in crop residues. Soil Sci. Soc. Am. J. 2011, 75, 553–559. [Google Scholar] [CrossRef]
  19. Cueff, S.; Alletto, L.; Dumény, V.; Benoit, P.; Pot, V. Adsorption and degradation of the herbicide nicosulfuron in a stagnic Luvisol and Vermic Umbrisol cultivated under conventional or conservation agriculture. Environ. Sci. Pollut. Res. 2021, 28, 15934–15946. [Google Scholar] [CrossRef]
  20. Locke, M.A.; Zablotowicz, R.M.; Bauer, P.J.; Steinriede, R.W.; Gaston, L.A. Conservation cotton production in the southern United States: Herbicide dissipation in soil and cover crops. Weed Sci. 2005, 53, 717–727. [Google Scholar] [CrossRef]
  21. Yousefi, M.; Kamkar, B.; Gherekhloo, J.; Faez, R. Sulfosulfuron persistence in soil under different cultivation systems of wheat (Triticum aestivum). Pedosphere 2016, 26, 666–675. [Google Scholar] [CrossRef]
  22. Zablotowicz, R.M.; Locke, M.A.; Gaston, L.A. Tillage and cover effects on soil microbial properties and fluometuron degradation. Biol. Fert. Soils 2007, 44, 27–35. [Google Scholar] [CrossRef]
  23. Bedmar, F.; Gimenez, D.; Costa, J.L.; Daniel, P.E. Persistence of acetochlor, atrazine, and S-metolachlor in surface and subsurface horizons of 2 typic argiudolls under no-tillage. Environ. Toxicol. Chem. 2017, 36, 3065–3073. [Google Scholar] [CrossRef] [PubMed]
  24. Lewis, K.A.; Tzilivakis, J.; Warner, D.J.; Green, A. An international database for pesticide risk assessments and management. Hum. Ecol. Risk Assess. 2016, 22, 1050–1064. [Google Scholar] [CrossRef]
  25. Kouame, K.B.-J.; Savin, M.C.; Willett, C.D.; Bertucci, M.B.; Butts, T.R.; Grantz, E.; Roma-Burgos, N. S-metolachlor persistence in soil as influenced by within-season and inter-annual herbicide use. Environ. Adv. 2022, 9, 100318. [Google Scholar] [CrossRef]
  26. Si, Y.; Takagi, K.; Iwasaki, A.; Zhou, D. Adsorption, desorption and dissipation of metolachlor in surface and subsurface soils. Pest Manag. Sci. 2009, 65, 956–962. [Google Scholar] [CrossRef]
  27. Alletto, L.; Benoit, P.; Bolognési, B.; Couffignal, M.; Bergheaud, V.; Dumény, V.; Longueval, C.; Barriuso, E. Sorption and mineralisation of S-metolachlor in soils from fields cultivated with different conservation tillage systems. Soil Till. Res. 2013, 128, 97–103. [Google Scholar] [CrossRef]
  28. Gul, P.; Ahmad, K.S.; Gul, M.M. Herbicide thiencarbazone-methyl pedospheric disposition through sorption and degradation mechanisms in heterogenous soils. Environ. Earth Sci. 2020, 79, 478. [Google Scholar] [CrossRef]
  29. IUSS Working Group WRB. World Reference Base for Soil Resources. International Soil Classification System for Naming Soils and Creating Legends for Soil Maps, 4th ed.; International Union of Soil Sciences (IUSS): Vienna, Austria, 2022. [Google Scholar]
  30. Sparks, D.L. Methods of Soil Analysis. Part 3: Chemical Methods; SSSA Series; Wiley: Hoboken, NJ, USA, 1996. [Google Scholar]
  31. Douibi, M.; Krishtammagari, A.; Sánchez-Martín, M.J.; Rodríguez-Cruz, M.S.; Marín-Benito, J.M. Mulching vs. organic soil amendment: Effects on adsorption-desorption of herbicides. Sci. Total Environ. 2023, 892, 164749. [Google Scholar] [CrossRef]
  32. FOCUS, FOrum for Co-Ordination of Pesticide Fate Models and Their Use Guidance. Document on Estimating Persistence and Degradation Kinetics from Environmental Fate Studies on Pesticides in EU Registration. The Final Report of the Work Group on Degradation Kinetics of FOCUS: Sanco/10058/2005, Version 2. 2006. Available online: https://esdac.jrc.ec.europa.eu/public_path/projects_data/focus/dk/docs/finalreportFOCDegKinetics.pdf (accessed on 1 March 2024).
  33. EFSA, European Food Safety Authority. Conclusion on the peer review of the pesticide risk assessment of the active substance S-metolachlor exluding the assessment of the endocrine disrupting properties. EFSA J. 2023, 21, 7851. [Google Scholar] [CrossRef]
  34. Marín-Benito, J.M.; Herrero-Hernández, E.; Ordax, J.M.; Sánchez-Martín, M.J.; Rodríguez-Cruz, M.S. The role of two organic amendments to modify the environmental fate of S-metolachlor in agricultural soils. Environ. Res. 2021, 195, 110871. [Google Scholar] [CrossRef]
  35. Carpio, M.J.; Rodríguez-Cruz, M.S.; García-Delgado, C.; Sánchez-Martín, M.J.; Marín-Benito, J.M. Mobility monitoring of two herbicides in amended soils: A field study for modeling applications. J. Environ. Manag. 2020, 260, 110161. [Google Scholar] [CrossRef] [PubMed]
  36. Willkommen, S.; Pfannerstill, M.; Ulrich, U.; Guse, B.; Fohrer, N. How weather conditions and physico-chemical properties control the leaching of flufenacet, diflufenican, and pendimethalin in a tile-drained landscape. Agr. Ecosyst. Environ. 2019, 278, 107–116. [Google Scholar] [CrossRef]
  37. Ghosh, R.K.; Singh, N.; Singh, S.B. Effect of fly ash amendment on metolachlor and atrazine degradation and microbial activity in two soils. Environ. Monit. Assess. 2016, 188, 482. [Google Scholar] [CrossRef] [PubMed]
  38. Carpio, M.J.; Sánchez-Martín, M.J.; Rodríguez-Cruz, M.S.; Marín-Benito, J.M. Effect of organic residues on pesticide behavior in soils: A Review of laboratory research. Environments 2021, 8, 32. [Google Scholar] [CrossRef]
  39. Peña, D.; Albarrán, A.; Gómez, S.; Fernández-Rodríguez, D.; Manuel Rato-Nunes, J.; López-Piñeiro, A. Effects of olive mill wastes with different degrees of maturity on behaviour of S-metolachlor in three soils. Geoderma 2019, 348, 86–96. [Google Scholar] [CrossRef]
  40. Rusinamhodzi, L. Crop rotations and residue management in conservation agriculture. In Conservation Agriculture, 1st ed.; Farooq, M., Siddique, K.H.M., Eds.; Springer: Cham, Switzerland, 2015; pp. 21–37. [Google Scholar] [CrossRef]
  41. Douibi, M. Coupling Pesticides Fate Modelling and Conservation Cropping Systems to Reduce the Agriculture Footprints on Ecosystems. Ph.D. Thesis, University of Salamanca, Salamanca, Spain, 2023. Available online: http://hdl.handle.net/10261/350430 (accessed on 18 March 2024).
  42. Cao, P.; Wang, X.; Liu, F.; Zhao, E.; Han, L. Dissipation and residue of S-metolachlor in maize and soil. Bull. Environ. Contam. Toxicol. 2008, 80, 391–394. [Google Scholar] [CrossRef]
  43. Zemolin, C.R.; Avila, L.A.; Cassol, G.V.; Massey, J.H.; Camargo, E.R. Environmental fate of S-Metolachlor: A review. Planta Daninha 2014, 32, 655–664. [Google Scholar] [CrossRef]
  44. Douibi, M.; Sánchez-Martín, M.J.; Rodríguez-Cruz, M.S.; Marín-Benito, J.M. Sustainable agricultural practices influence S-metolachlor, foramsulfuron and thiencarbazone-methyl degradation and their metabolites formation. Sci. Total Environ. 2024, 945, 174039. [Google Scholar] [CrossRef]
  45. Rice, P.; Anderson, T.; Coats, J. Degradation and persistence of metolachlor in soil: Effects of concentration, soil moisture, soil depth, and sterilization. Environ. Toxicol. Chem. 2002, 21, 2640–2648. [Google Scholar] [CrossRef]
  46. Gish, T.; McKee, L.; Kustas, W. Solar radiation, relative humidity, and soil water effects on metolachlor volatilization. Environ. Sci. Technol. 2005, 39, 5219–5226. [Google Scholar] [CrossRef]
  47. Gish, T.J.; Prueger, J.H.; Kustas, W.P.; Daughtry, C.S.T.; McKee, L.G.; Russ, A.; Hatfield, J.L. Soil moisture and metolachlor volatilization observations over three years. J. Environ. Qual. 2009, 38, 1785–1795. [Google Scholar] [CrossRef] [PubMed]
  48. Prueger, J.H.; Hatfield, J.L.; Sauer, T.J. Field-scale metolachlor volatilization flux estimates from broadcast and banded application methods in Central Iowa. J. Environ. Qual. 1999, 28, 75–81. [Google Scholar] [CrossRef]
  49. EFSA, European Food Safety Authority. Conclusion on the peer review of the pesticide risk assessment of the active substance foramsulfuron. EFSA J. 2016, 14, 4421. [Google Scholar]
  50. EFSA, European Food Safety Authority. Conclusion on the peer review of the pesticide risk assessment of the active substance thiencarbazone-methyl. EFSA J. 2013, 11, 3270. [Google Scholar]
Figure 1. Observed and fitted (single first-order model, SFO; or first-order multi-compartment model, FOMC) dissipation kinetics of S-metolachlor (SMOC) in soils under conventional tillage (S1+CT, S2+CT) and non-tillage (S1+NT, S2+NT) after the first (a,b) and second (c,d) application of herbicides to field plots. Bars indicate the standard deviation of the mean value (n = 4).
Agronomy 14 02284 g001
Figure 2. Observed and fitted (single first-order model, SFO; or first-order multi-compartment model, FOMC) dissipation kinetics of foramsulfuron (FORAM) in soils under conventional tillage (S1+CT, S2+CT) and non-tillage (S1+NT, S2+NT) after the first (a,b) and second (c,d) application of herbicides to field plots. Bars indicate the standard deviation of the mean value (n = 4).
Agronomy 14 02284 g002
Figure 3. Observed and fitted (single first-order model, SFO; or first order multi-compartment model, FOMC) dissipation kinetics of thiencarbazone-methyl (TCM) in soils under conventional tillage (S1+CT, S2+CT) and non-tillage (S1+NT, S2+NT) after the first (a,b) and second (c,d) application of herbicides to field plots. Bars indicate the standard deviation of the mean value (n = 4).
Agronomy 14 02284 g003
Table 1. Kinetic parameters (k, α, β, DT50, DT90) for the dissipation of S-metolachlor (SMOC) in soils under conventional tillage (S1+CT, S2+CT) and non-tillage (S1+NT, S2+NT) according to the best fitting model (single first-order, SFO; or first-order multi-compartment model, FOMC). Goodness-of-fit parameters (χ2 and r2) obtained from the best fitting of dissipation curves to the kinetic model.
TreatmentFitting
Model
k (Days−1)
α/β 1
DT50
(Days) 2,3
DT90
(Days)
χ2r2
First experimental year
S1+CTSFO1.7030.0 ± 0.5 a99.6 ± 2.8 a12.70.956
S1+NTFOMC4.26/54.09.50 ± 0.3 d38.7 ± 1.4 d7.500.996
S2+CTFOMC3.46/96.221.3 ± 1.0 b90.8 ± 2.9 b11.30.974
S2+NTFOMC6.12/12214.7 ± 0.8 c55.9 ± 2.30 c11.30.984
Second experimental year
S1+CTSFO1.5220.9 ± 1.8 b69.5 ± 3.3 b14.00.968
S1+NTSFO0.643.60 ± 0.2 c11.9 ± 0.2 c9.400.996
S2+CTFOMC3.23/12630.2 ± 2.2 a131 ± 4 a13.00.947
S2+NTFOMC1.37/2.521.70 ± 0.1 d11.0 ± 0.3 d6.800.998
1 α and β values from the fitting of the dissipation curve to the FOMC model. 2 DT50 = ln2/k from the fitting of the dissipation curve to the SFO model. 3 DT50 = β × [2(1/α) − 1] from the fitting of the dissipation curve to the FOMC model. DT50 and DT90 followed by the same letter were not significantly different for the first and second experimental years individually considered.
Table 2. Kinetic parameters (k, α, β, DT50, DT90) for the dissipation of foramsulfuron (FORAM) in soils under conventional tillage (S1+CT, S2+CT) and non-tillage (S1+NT, S2+NT) according to the best fitting model (single first-order, SFO; or first-order multi-compartment model, FOMC). Goodness-of-fit parameters (χ2 and r2) were obtained from the best fitting of dissipation curves to the kinetic model.
TreatmentFitting
Model
k (Days−1)
α/β 1
DT50
(Days) 2,3
DT90
(Days)
χ2r2
First experimental year
S1+CTSFO0.754.50 ± 0.1 b14.9 ± 0.2 a14.70.920
S1+NTSFO0.926.30 ± 0.2 ab20.9 ± 0.6 a14.30.978
S2+CTSFO0.906.00 ± 1.0 ab20.0 ± 7.8 a14.30.893
S2+NTSFO1.139.50 ± 1.6 a31.6 ± 5.2 a12.90.982
Second experimental year
S1+CTSFO0.805.00 ± 0.2 b16.4 ± 0.7 a14.90.960
S1+NTFOMC2.81/13.13.70 ± 1.3 b16.6 ± 3.3 a4.801.000
S2+CTSFO1.098.80 ± 2.3 a29.3 ± 7.6 a14.60.960
S2+NTFOMC13.4/96.85.10 ± 0.8 b18.1 ± 0.3 a5.701.000
1 α and β values from the fitting of the dissipation curve to the FOMC model. 2 DT50 = ln2/k from the fitting of the dissipation curve to the SFO model. 3 DT50 = β × [2(1/α) − 1] from the fitting of the dissipation curve to the FOMC model. DT50 and DT90 followed by the same letter were not significantly different for the first and second experimental years individually considered.
Table 3. Kinetic parameters (k, α, β, DT50, DT90) for the dissipation of thiencarbazone-methyl (TCM) in soils under conventional tillage (S1+CT, S2+CT) and non-tillage (S1+NT, S2+NT) according to the best-fitting model (single first-order, SFO; or first-order multi-compartment model, FOMC). Goodness-of-fit parameters (χ2 and r2) obtained from the best fitting of dissipation curves to the kinetic model.
TreatmentFitting
Model
k (Days−1)
α/β 1
DT50
(Days) 2,3
DT90
(Days)
χ2r2
First experimental year
S1+CTSFO1.2311.6 ± 2.8 c38.4 ± 9.3 c13.40.986
S1+NTSFO1.3314.4 ± 2.2 bc47.8 ± 7.5 bc14.80.972
S2+CTSFO1.6828.6 ± 3.0 ab95.1 ± 10.0 ab13.70.939
S2+NTSFO1.8439.5 ± 5.4 a131 ± 18 a13.70.830
Second experimental year
S1+CTSFO1.4618.7 ± 0.4 b62.1 ± 1.2 a8.400.986
S1+NTFOMC2.20/17.76.60 ± 0.5 c32.7 ± 1.7 b8.600.996
S2+CTSFO1.6024.3 ± 0.8 a80.8 ± 4.7 a10.40.978
S2+NTFOMC1.15/6.305.20 ± 2.1 c40.2 ± 9.5 b14.50.984
1 α and β values from the fitting of the dissipation curve to the FOMC model. 2 DT50 = ln2/k from the fitting of the dissipation curve to the SFO model. 3 DT50 = β × [2(1/α) − 1] from the fitting of the dissipation curve to the FOMC model. DT50 and DT90 followed by the same letter were not significantly different for the first and second experimental years individually considered.
Disclaimer/Publisher’s Note: The statements, opinions and data contained in all publications are solely those of the individual author(s) and contributor(s) and not of MDPI and/or the editor(s). MDPI and/or the editor(s) disclaim responsibility for any injury to people or property resulting from any ideas, methods, instructions or products referred to in the content.

