Article

Long-Term Effects of Nitrogen and Tillage on Yields and Nitrogen Use Efficiency in Irrigated Corn

by
Jorge A. Delgado
1,*,
Robert E. D’Adamo
1,
Alexis H. Villacis
2,
Ardell D. Halvorson
1,†,
Catherine E. Stewart
1,
Bradley A. Floyd
1,
Stephen J. Del Grosso
1,
Daniel K. Manter
1 and
Jeffrey Alwang
3
1
USDA-ARS Soil Management and Sugar Beet Research Unit, Fort Collins, CO 80526, USA
2
Department of Agricultural, Environmental and Development Economics, The Ohio State University, Columbus, OH 43210, USA
3
Department of Agricultural and Applied Economics, Virginia Polytechnic and State University, Blacksburg, VA 24061, USA
*
Author to whom correspondence should be addressed.
Retired.
Agronomy 2024, 14(10), 2304; https://doi.org/10.3390/agronomy14102304
Submission received: 14 August 2024 / Revised: 24 September 2024 / Accepted: 27 September 2024 / Published: 7 October 2024
(This article belongs to the Section Innovative Cropping Systems)

Abstract

:
By tonnage, corn (Zea mays L.) is the #1 crop produced globally, and recent research has suggested that no-till (NT) systems can lead to reduced yields of this important crop. Additionally, there is a lack of long-term data about the effects of tillage and N management on cropping systems. Corn is the most nitrogen (N)-fertilized crop in the USA, and N losses to the environment contribute to significant impacts on air and water quality. We conducted long-term studies on conventional tillage (CT) and conservation tillage systems, such as strip tillage (ST) and NT, under different N rates. We found that immediately after conversion to NT, yields from NT were significantly lower than yields from CT (p < 0.1), but after five years of NT, the NT yields were 1.5% higher than the CT yields (p < 0.1). Initially, the NT yields were lower than the ST (p < 0.01), but after seven years of NT, the NT yields were comparable to ST grain yields. Although the total aboveground N uptake with NT immediately after conversion to NT was lower than with CT and ST, these differences were not significant in the long run. The nitrogen use efficiency (NUE) with NT increased over time. The present work highlights the importance of long-term research for determining the cumulative impacts of best management practices such as NT. We found that NT becomes a more viable practice after five or seven years of implementation, demonstrating the high importance of long-term research.

1. Introduction

Nitrogen (N) use efficiencies (NUE) in corn have been reported to be around 50%, and there is a need to increase NUE and reduce N losses to the environment [1]. A recently published long-term study found that the N losses from the no-till system ranged from 12 to almost 50% depending on the application rate of the N fertilizer [1]. In a 30-year study using an N balance approach in the Loess Plateau of China, Fu et al. found that over 100% of the applied N fertilizer was taken up and removed with the harvested corn crop [2]. However, another long-term conventional tillage study in Zhangye, Gansu, China that spanned 22 years and also used an N balance approach found only 34% of the applied N was being recovered with the harvested fraction and that up to 60% of the applied N fertilizer was being lost to the environment [3]. Iragavarapu and Randall found in an 11-year study conducted on a poorly drained soil in Minnesota that N uptake and removal can be higher with conventional till (CT) than with no till (NT) [4]. Lower N uptake in NT systems may be due to higher N immobilization and higher denitrification losses with the NT system [5,6].
A rainfed continuous corn study was established in Kentucky in 1970 that monitored the effects of conventional till and no-till systems across different N rates [7]. Canisares et al. monitored the N uptake from 2018 to 2019 and harvested grain yields from 2015 to 2019 [7]. They found that no till had higher N uptake and harvested grain yields across N rates than the conventional till system; however, the agronomic optimum N rate did not differ among tillage treatments [7]. In Colorado, using a quadratic regression model, Jantalia and Halvorson reported on the effect of N rates on the yields of the CT plots presented here from 2001 to 2007 plus the 2008 plots that were severely impacted by hail [8]. They found that under CT, irrigated corn yields and stover increased with N rate and maximized at about 177 kg N ha−1 and 185 kg N ha−1 of applied N fertilizer, respectively.
Few long-term studies have been conducted to assess the N balance and N losses from the system for a continuous corn rotation and/or to assess the long-term effects of tillage and N rates on NUE. Among the few that exist in the global literature, results conflict. For example, the N losses from a continuous corn rotation could range from 0 [2] to as high as 50 to 60% [1,3]. Although it is well known that there are factors that affect the potential for N losses from agricultural systems (e.g., there is higher leaching potential with a coarse-textured soil than with a finely-textured soil) and that other factors could affect losses of N via denitrification [5,6], all these studies show that for a given site, N losses increase with higher N rates, reducing NUE and highlighting the importance of managing N input rates as a key tool to increase NUE and significantly reduce long-term N losses from the system while maximizing yields [1,4,5,6,7]. Specifically, there is a lack of long-term studies assessing the effects of tillage and N rates on yields and NUE, and how the NUE of NT compares to that of more intensive cultivation systems such as ST and CT.
Pittelkow et al. conducted a global metadata analysis and reported that for cereals, implementation of NT creates negative agronomic impacts that contribute to reduced grain yields, with a yield reduction of 2.6% for wheat, and yield reductions of 7.5 and 7.6% for rice and corn, respectively [9]. They reported that for corn specifically, the grain yields after incorporation of NT declined during the first two years and continued to decrease with time, except when corn was grown in rainfed, dry climates that decreased initially but over time matched the yields of conventionally tilled systems. They also reported that for corn, N fertilizer is important to ameliorate the negative effects of NT with higher yields at higher N levels. Ogle et al. also conducted a meta-analysis of studies on NT and tillage effects and found that NT yields were lower than yields of conventional tillage systems, particularly in cooler and/or wetter climatic conditions [10].
Besides these in-depth metadata analyses, there have been studies that have found that NT can increase or maintain corn grain yields in comparison to other tillage systems. Sindelar et al. conducted a 28-year tillage study measuring the effects of tillage (chisel, tandem disk, moldboard plow, NT, ridge-tillage, and subsoil tillage) on grain yields in dryland Nebraska for continuous corn (CC) and corn and soybean rotations [11]. They reported that average corn yields for NT were consistently higher during the last 16 years of the study (1997 to 2013) [11]. Since they conducted a 28-year study and measured a positive response to NT that was consistent for 16 years, they determined there was a need to conduct long-term studies to identify these trends.
In contrast to findings by Sindelar et al. [11], a 26-year corn–soybean rotation study in Quebec, Canada conducted by Gagnon et al. found that the yield differences between NT and conventional till (moldboard plow) systems were not significantly different the first 10 years, but over time NT yields gradually declined, and during the last eight years, NT yields were lower than those of the conventional till system [12]. Gagnon et al. concluded that at northern latitudes, clay soil was not appropriate for NT, since over the 26-year period, the system that was conventionally tilled by moldboard plow produced 15% higher yields than the NT system [12]. These findings agree with other reports that NT reduces corn grain yields more than other crops, especially in cooler areas and areas with high precipitation or with poorly drained soils [13,14,15]. However, in the black soil region of northeast China, Zhang et al. found in a 12-year study that for a rotation of corn and soybean, corn grain yields were higher with NT, and that the lower soil temperatures with NT and ridge tillage did not affect grain yields [16]. These findings agree with other studies that have reported increased grain yields in warm, dry climates or in well-drained soils [17,18,19,20]. In contrast, Chen et al. found lower yields in a maize-soybean rotation under NT compared to a maize–soybean rotation under CT in a 2004 to 2010 study in Hailun City, China [21].
Previous results from the global literature about the effects of tillage on corn grain yields have been conflicting, and there is a continued need for assessments of the long-term effects of tillage systems on yield, especially under sprinkler irrigation in temperate systems where there is a lack of studies and long-term data. Although there is a lack of long-term data, metadata analysis of tillage studies has shown that NT yields are lower than CT yields [9,10], and N uptake studies have shown greater N uptake with CT than NT. Recent research has shown the need for additional long-term studies on these topics [1,7,12]. In our review of the literature, we did not find any long-term study comparing the effects of NT versus ST and/or CT on yields and/or NUE in a continuous corn system receiving irrigation with a conventional linear-move sprinkler, nor did we find a study that conducted a robust analysis using the linear-plus-plateau model and the likelihood ratio test to assess the long-term effects of NT, ST, and CT on yields and NUE, together with a year-by-year confidence interval analysis to address changes with time.
The first goal of the present work was to assess the effects of N fertilizer rates and tillage on yields and recovery of N by the grain, stalks and leaves, and cob compartments, total aboveground N recovery, removal of N with the harvested grain, N cycled back to the system, and NUEs. The second goal was to make all of these databases available to the scientific community, students, and the general public. Considering recent research comparing NT and CT in a humid system in Kentucky [7], we hypothesized that systems with less soil disturbance, such as irrigated systems under NT, would have higher yields, N uptake, and NUE than systems with more soil disturbance, such as ST and CT. The justification for this study was the need to test this hypothesis to advance scientific understanding of long-term impacts of these practices to help us develop best management practices that contribute to reduced losses of N to the environment while increasing and sustaining productivity.

2. Materials and Methods

2.1. Site and Management Information

Tillage studies were conducted at the Halvorson long-term research experimental area established in 2000 at Colorado State University’s Agricultural Research, Development and Education Center (ARDEC) in Fort Collins, Colorado (40°39′6″ N, 104°59′57″ W, 1535 m above sea level) on a Fort Collins clay loam soil (fine-loamy, mixed, mesic Aridic Haplustalfs) with a 1 to 2% slope. The site’s average minimum, mean, and maximum air temperatures; growing degree days (GDD); and precipitation were 10.1 °C, 18.3 °C, 26.6 °C, 1303 GDD and 194.7 mm, respectively for the planting to physiological maturity (R6, black layer) stages during the 2001 to 2017 growing seasons. The averages for these weather variables for the growing seasons of 2001 to 2007, 2006 to 2007, and 2006 to 2017 are presented in the Supplemental Materials (Table S1).
The area where the tillage treatments were established was under the same management for several years before this study started and the soil was very uniform. Prior to the start of these studies in 2000, the experimental unit’s areas were in continuous corn for seven years. Due to resource constraints, we conducted these tillage by N rate studies at only one site with one soil type (Fort Collins clay loam soil [fine-loamy, mixed, mesic Aridic Haplustalfs]) with a 1 to 2% slope. To determine whether the soil properties were still uniform, at about midyear in 2012, soil samples were collected from the surface soil depth (0 to 7.6 cm) in the NT plots (the plot area under NT from 2000 to 2017) and ST plots (this includes the plots that were under CT from 2000 to 2008 and then under ST from 2009 to 2017; as well as the plots that were under NT from 2000 to 2017 but were split into an east and west area from 2006 to 2016, with the west area under ST; Table S2). For these areas, the control (non-fertilized) and the plots fertilized with 202 kg N ha−1 were composite sampled by treatment and sent to the CSU Soil, Water, and Plant Testing Laboratory (Table S3). The results were similar among all the tillage treatments. The control (non-fertilized) plots have a sandy clay loam texture, with an average pH of 7.6 ± 0.03, an average electroconductivity (EC) of 1.1 ± 0.2 dS m−1, an average of 23 ± 3 g kg−1 organic matter, and average NO3-N, P, and K concentrations of 6 ± 3 mg kg−1, 11 ± 2 mg kg−1, and 227 ± 15 mg kg−1, respectively (Table S3). The plots receiving 202 kg N ha−1 also have a sandy clay loam texture, with an average pH of 7.6 ± 0.03, an average EC of 0.9 ± 0.1 dS m−1, an average of 25 g kg−1 ± 6 g kg−1 organic matter, and average NO3-N, P, and K concentrations of 17 ± 5 mg kg−1, 9 ± 6 mg kg−1, and 216 ± 3 mg kg−1, respectively (Table S3). Although we did not conduct statistical analysis on these composite samples, the soil properties suggest that the plots were still relatively uniform, except in NO3-N, where there was a clear increase in NO3-N concentrations due to N fertilizer for all the treatments.
The experimental units used for this tillage and N budget study were from CC under NT (2000 to 2017) in a randomized block design with six N treatments and three replicates (n = 3), 21.9 m wide by 137.2 m long each, that had been managed similarly since 2000. These NT plots were split into NT and ST in east and west sides, respectively, for seven years (2006 to 2012) and then returned to completely NT plots. The NT plots on the east side were monitored continuously from 2000 to 2017 as the NT plots that were never tilled from 2000 to 2017. A set of plots 45 m away from the NT plots were under cultivation and were monitored under the same management as the NT plots. These plots were the fully conventional till plots (CT) monitored from 2000 to 2008. These conventional tillage plots were changed to strip tillage plots (ST) in December 2008 and were another site of strip plots under the same management monitored from 2008 to 2017.
The full cultivation from 2001 to 2008 and the strip plots from 2009 to 2017 were in a completely randomized design with four replicates and different N rates. The N rates per experiment are described in detail in the Supplementary Materials (see Table S2). Since the initial N rates established in 2000 for NT were 0, 34, 67, 101, 134, and 202 kg N ha−1, which were different from the initial N rates established in 2000 with CT of 0, 75, 125, and 200 kg N ha−1, we started the analysis for the data presented in the present work in 2001. In 2001 the N rates were changed to 0, 67, 134, and 168 kg N ha−1 [22], similar to the 2001 N rates for NT. Additionally, since the N application rate of one of the lower N rate NT plots that initially was receiving 34 kg N ha−1 was changed to 246 kg N ha−1 in 2007, changed to 202 kg N ha−1 in 2009, changed to 0 kg N ha−1 in 2013, and returned to 34 kg N ha−1 in 2014, only data from 2001 to 2006 and from 2014 to 2017 were used to represent the yields and N uptake at 34 kg N ha−1 with NT.
For additional information about the N fertilizer applications, including N rates, see Tables S2 and S3 in the Supplementary Materials. All planting, fertilization, irrigation, pesticide applications, and harvest actions were kept the same between tillage treatments (Tables S3 and S4). A detailed description of tillage management operations is included in Table S3 as well as the calibration of the instruments used for plant nitrogen analysis. Details about the plant analysis conducted with the Elementar C & N analyzer from 2001 to 2017 are reported in Table S3. From 2001 to 2005, plant samples were analyzed with a Carlo Erba elemental analyzer and from 2005 to 2017 with the Elementar instrument. Calibration analysis to test for differences between the two analytical instruments were conducted by Jantalia and Halvorson, who reported the differences to be non-significant [8]. Additionally, we used different standards to assess the accuracy and precision of the Elementar instrument over time (from 2005 to 2017) by running the same chemical standards and plant and soil samples standards each time that plant samples were run. We found that the procedure continued to produce accurate and precise results over time (Table S3; Figure S2).
Throughout the study, a Valley® linear-move sprinkler irrigated the corn as needed. Planting was done around end of April and beginning of May, and plant biomass was harvested at R6 (physiological maturity), which was usually in September. The plant biomass at R6 was divided into stalks, leaves, cobs, and grain. Throughout the present work, we refer to the biomass of the stalks, leaves, and cobs as crop residue since this plant material was collected at physiological maturity. The drydown process occurred in October. Details about pest and weed management are provided in Table S3. Details of plant, soil, and irrigation sampling and analysis are also shown in Tables S3 and S4.

2.2. Statistical Analysis

Statistical analysis of the harvested grain, crop residue, and N uptake of different crop compartments was performed with a linear-plus-plateau model. Plant crop residue outliers were removed to assess the effects of tillage and N rates on the yields and crop residue production as well as the N uptake dynamics. The 2008 yields were not used to assess changes in corn crop residue production and N uptake since yields were significantly reduced due to a large hailstorm that resulted in heavy damage. Due to crop damage from slugs (order Pulmonata), yields from 8 experimental units in the NT study affected in 2009 were ignored. Additionally, due to crop damage from spider mites (family Tetranychidae), yields from 2 experimental units in each of the split NT and split ST studies and 1 experimental unit in the ST study in 2011 were removed. For the 2012 data, 6 experimental units in the split NT study, 5 in the split ST study, and 4 in the ST study were also ignored. Moreover, one experimental unit in the ST study at the lower N fertilizer rate in 2013 with an unusually large yield was ignored. Additionally, the experimental units from 2007 to 2013 where the N application rate was changed from 34 kg N ha−1 to 246, 202, and 0 kg N ha−1, were also removed as outliers during 2007 to 2013 (see Table S2 for N rates and tillage methods used for this study).
The linear-plus-plateau model was used to determine differences in yield or N uptake at the plateau ( Y ^ p ), the N fertilizer rate at the plateau ( N p ), and the intercept of the linear-plus-plateau ( β 0 ) for the data covering CT and NT from 2001 to 2007; CT, NT, and ST from 2006 to 2007; and NT and ST from 2006 to 2017. A detailed description of the linear-plus-plateau model analysis is also included in Table S3. Additionally, to assess if there were statistically significant differences occurring with time, we conducted a confidence interval analysis to test for statistical significance at p < 0.05 and p < 0.10. We calculated the mean and standard deviation by year, N rate, and treatment for each study. Confidence intervals (CI) were calculated using the formula, CI = x ¯   ± Z * σ/√n, where x ¯ is the sample mean, Z is the distribution critical value, σ is the sample standard deviation, and √n is the square root of the sample size. The values of Z used were 1.96 and 1.64 for p < 0.05 and p < 0.10, respectively. Tillage yields or N content means by year and N rates with CI that did not overlap were significantly different at p < 0.05 or p < 0.10 from 2001 to 2007 (CT vs. NT), 2006 to 2007 (CT vs. NT; CT vs. ST; ST vs. NT), and from 2006 to 2017 (ST vs. NT).
The harvested grain agronomic N use efficiency (ANUEHG) (Equation (S9) in Table S3), the crop residue agronomic N use efficiency (ANUECR) (Equation (S10) in Table S3), the NUE of the harvested grain at the linear-plus-plateau (NUELPPHG) (Equation (S11) in Table S3), the NUE of the aboveground crop residue N content at the linear-plus-plateau (NUELPPCR) (Equation (S12) in Table S3), and the NUE of the total aboveground biomass (stalks, leaves, cobs and grain) N content at the linear-plus-plateau (NUELPPTB) (Equation (S13) in Table S3) were calculated.

3. Results

3.1. Effect of Long-Term Tillage on Grain Yield

When we compared NT and CT data for the 2001 to 2007 period with the linear plus-plateau model, we found that the NT grain yield at the plateau (HG Y ^ p ) of 9445 kg ha−1 was significantly lower than the HG Y ^ p of CT, which was 9852 kg ha−1 (p < 0.01; Figure 1a; Table 1 and Table 2). However, in the last two years (2006 to 2007), the NT HG Y ^ p of 9410 kg ha−1 was higher than the CT HG Y ^ p of 9270 kg ha−1 (p < 0.05; Figure 1b; Table 1 and Table 3). Additionally, during the 2006 to 2007 period, the ST HG Y ^ p of 9898 kg ha−1 was higher than the NT HG Y ^ p of 9410 kg ha−1 and the CT HG Y ^ p of 9270 kg ha−1 (p < 0.05; Figure 1b; Table 1 and Table 3). The NT HG Y ^ p of 10,067 kg ha−1 for the 2006 to 2017 period was higher than the HG Y ^ p of 9410 kg ha−1 for the 2006 to 2007 period, and this relative increase in yields was no different from the HG Y ^ p of 10,328 kg ha−1 achieved with ST during the 2006 to 2017 period (Figure 1c; Table 1 and Table 4). These results suggest that the HG Y ^ p of NT increased with time with respect to more intensive systems such as CT and ST (Table 1).

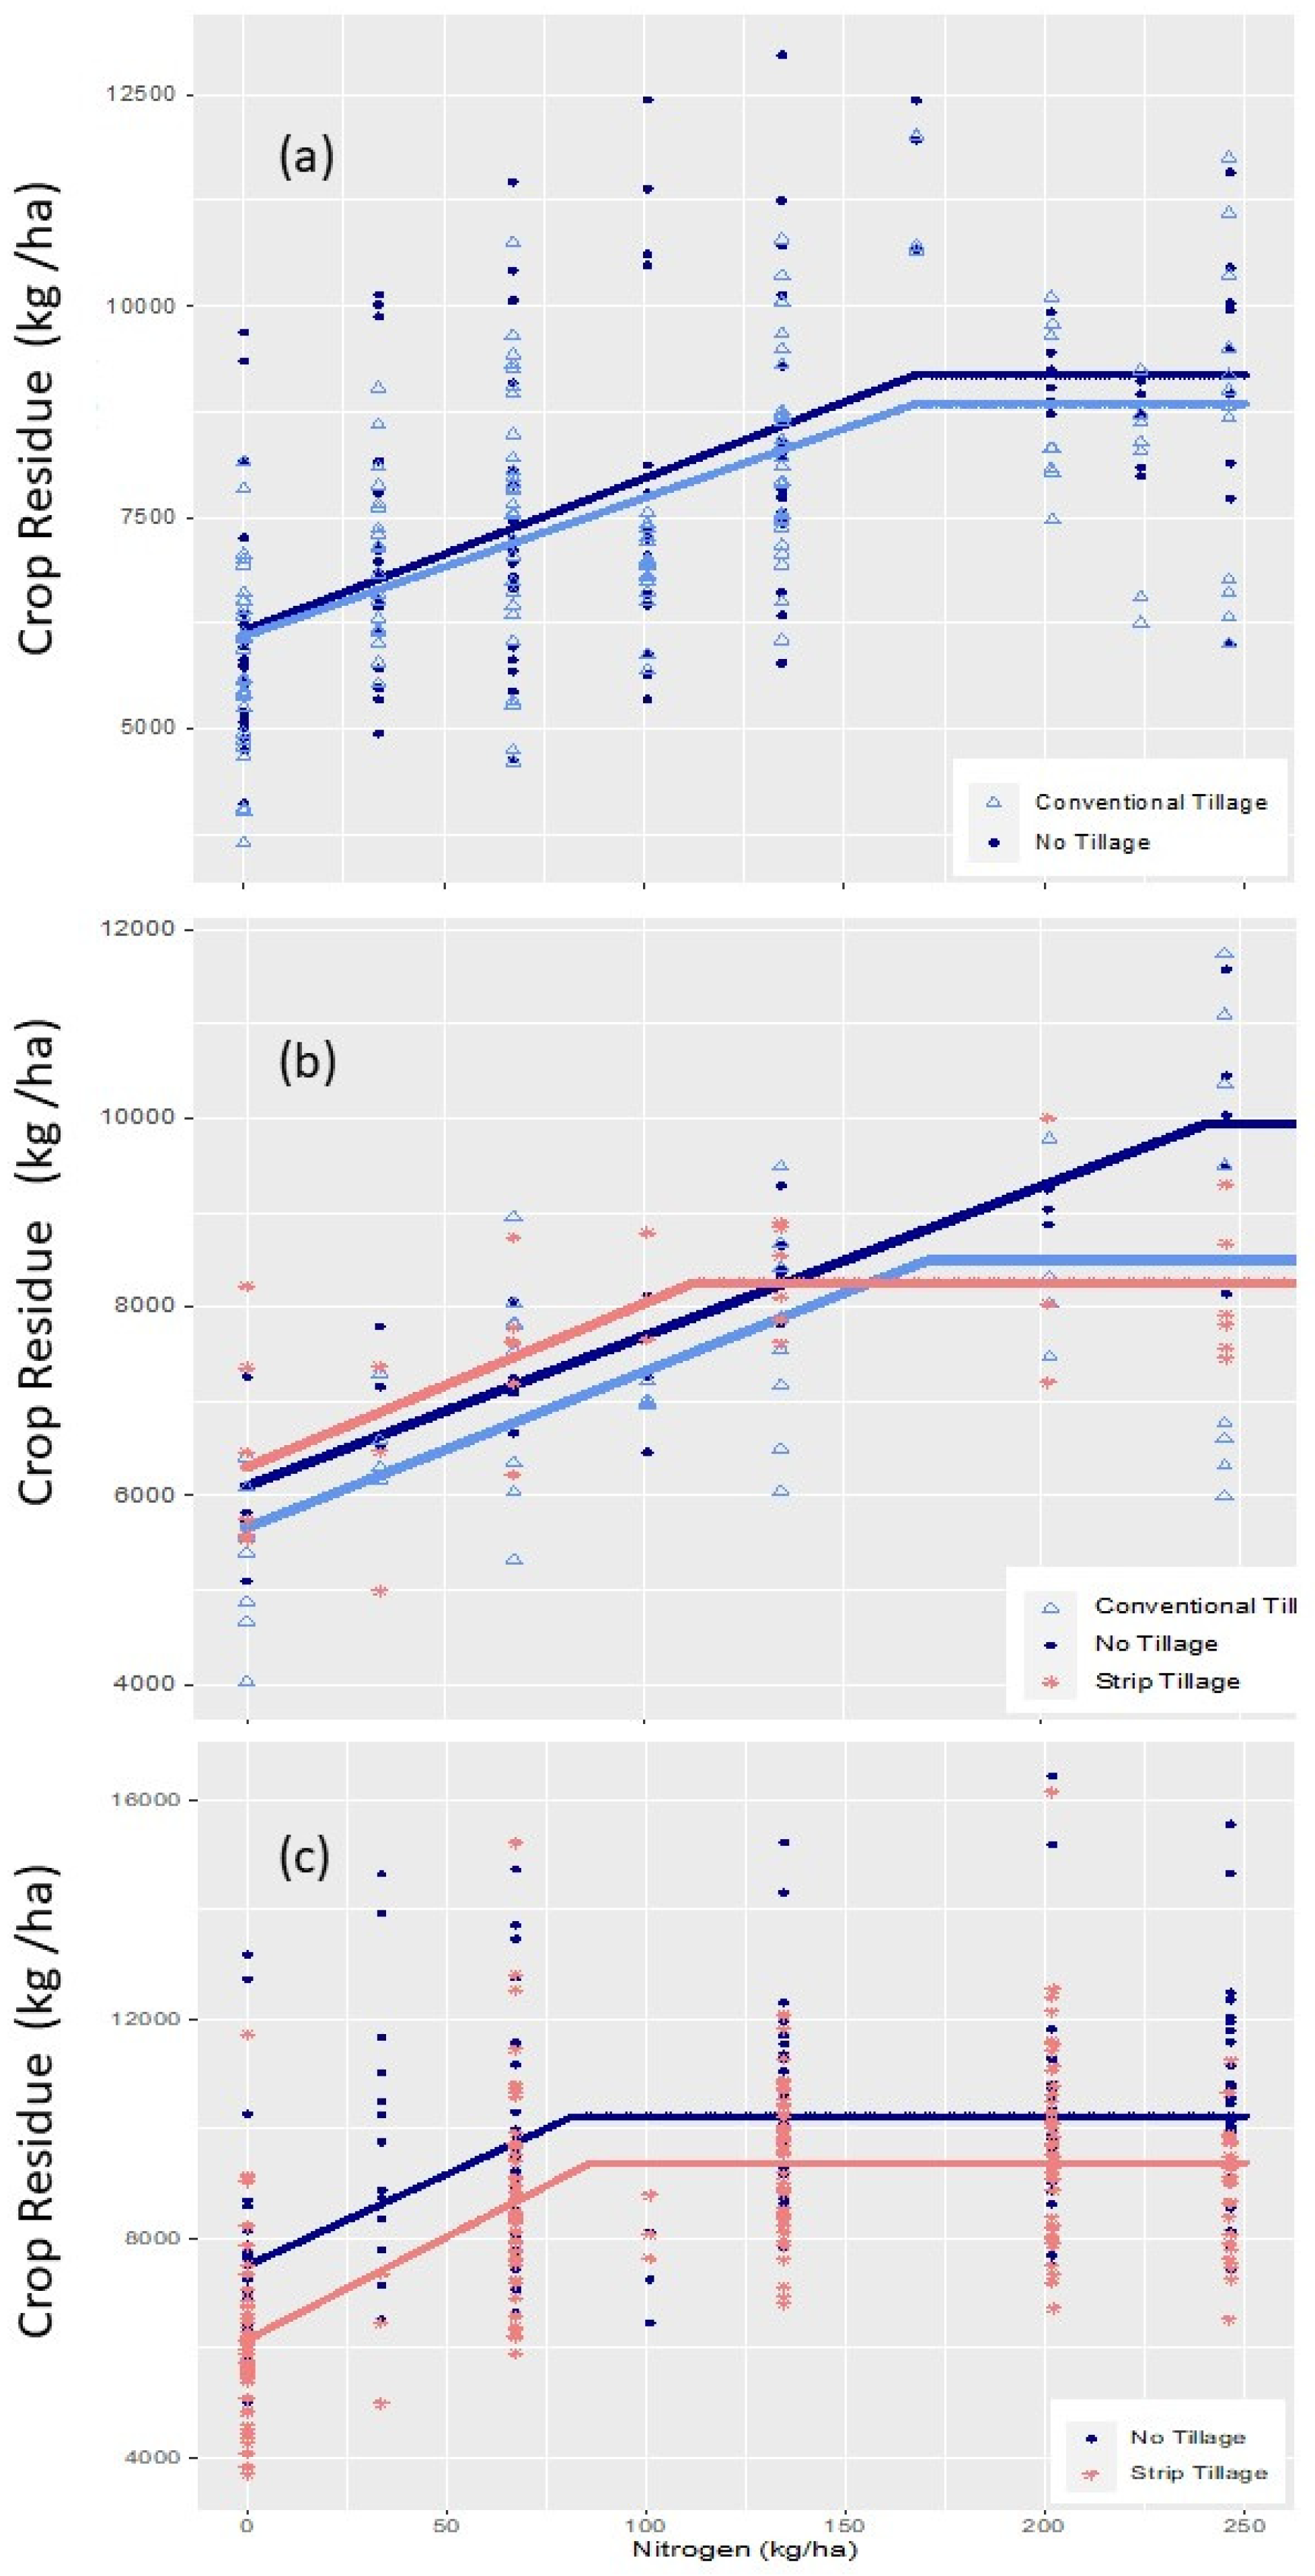
3.2. Effect of Long-Term Tillage on Crop Residue

The crop residue production at the plateau (CR Y ^ p ) from 2001 to 2007 (9187 kg ha−1) for NT was no different from the 8845 kg ha−1 produced with the CT (Figure 2a; Table 1 and Table 2). For the 2006 to 2007 period, the NT CR Y ^ p of 9944 kg ha−1 and the CT CR Y ^ p of 8500 kg ha−1 were no different (Figure 2b; Table 1 and Table 5). During this period, the NT crop residue of 6101 kg ha−1 at 0 kg N ha−1 (CR β 0 ) was not different from the ST CR β 0 production of 6300 kg ha−1 (p < 0.05; Figure 2b; Table 1 and Table 3). However, the NT CR Y ^ p for 2006 to 2007 (9944 kg ha−1) was higher than the ST CR Y ^ p of 8256 kg ha−1, but the CT CR Y ^ p (8500 kg ha−1) was not different than the ST CR Y ^ p of 8256 kg ha−1 (p < 0.05; Figure 2b; Table 1). The production of CT CR β 0 (5659 kg ha−1) was not different than ST CR β 0 (6300 kg ha−1; p < 0.05; Figure 2b; Table 1 and Table 3). Comparison of NT and ST crop residue production from 2006 to 2017 revealed that the NT CR Y ^ p of 10,233 kg ha−1 was higher than the CR Y ^ p with ST (9379 kg ha−1; p < 0.01; Figure 2c; Table 1 and Table 4). These results show that the CR Y ^ p of NT increased with time with respect to CT and ST CR Y ^ p , similar to the results seen with HG Y ^ (Table 1).

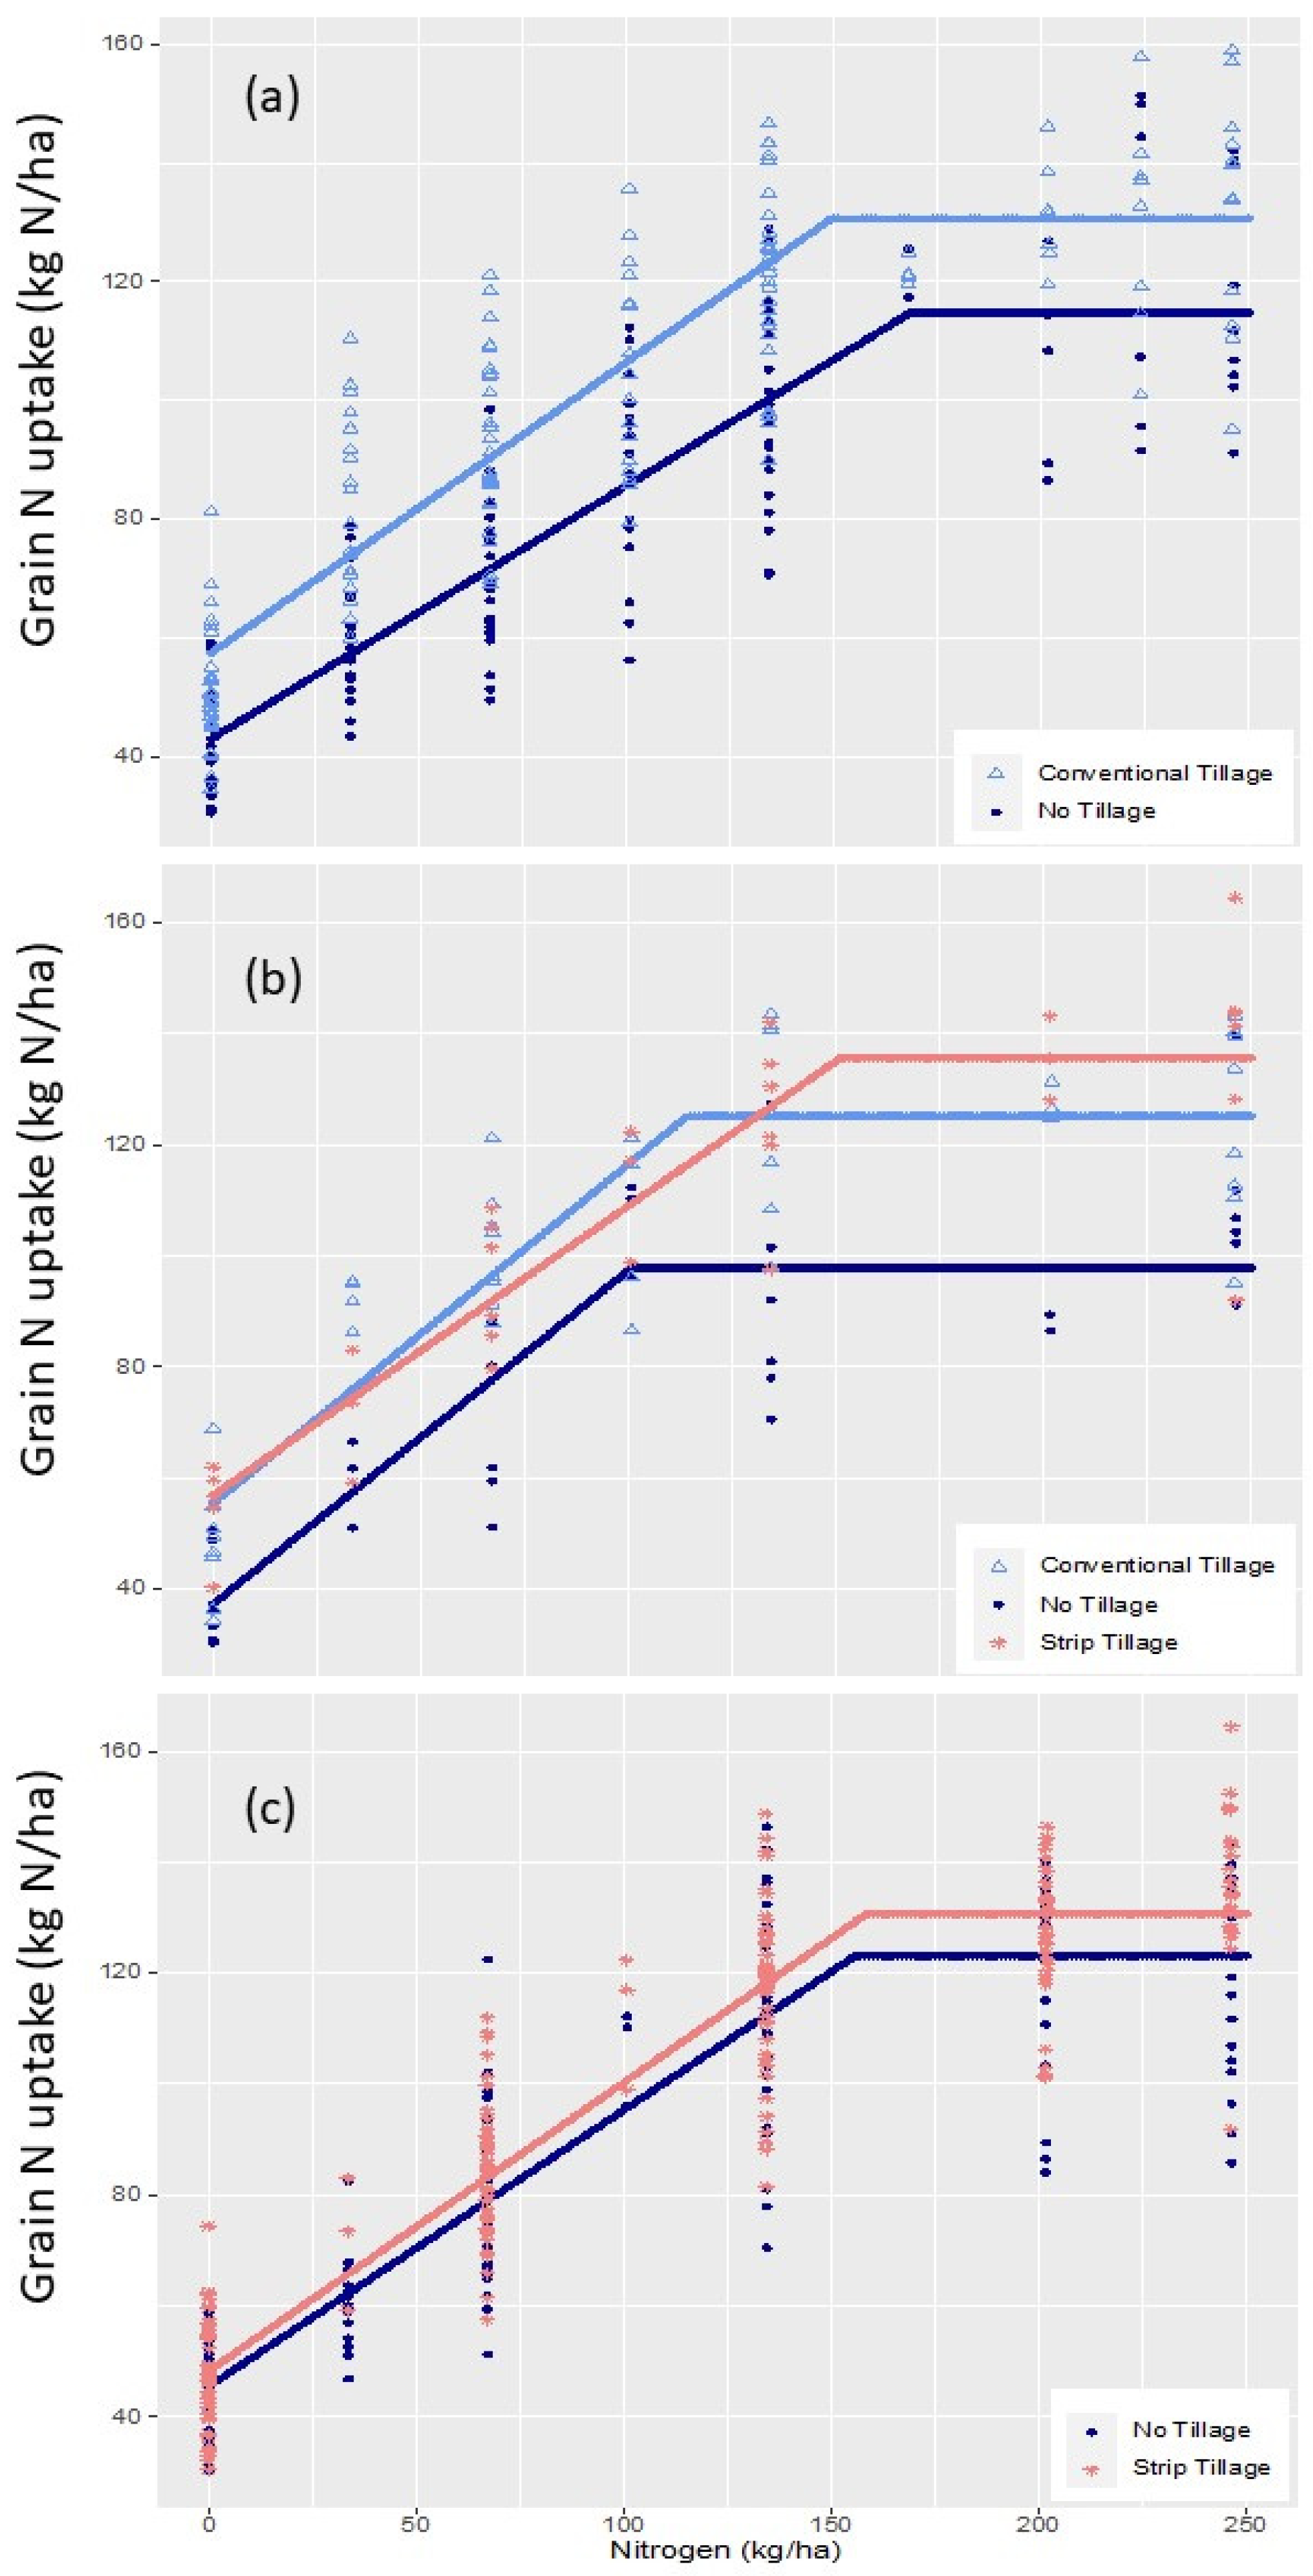
3.3. Effect of Long-Term Tillage on Grain N Uptake

A comparison of NT and CT for the 2001 to 2007 period using the linear-plus-plateau model revealed that the simulated harvested grain N content at the plateau (HGNC Y ^ p ) for CT was 130 kg N ha−1, which was greater than the HGNC Y ^ p of 115 kg N ha−1 with corn grain grown under NT (p < 0.01; Figure 3a; Table 1 and Table 2). The HGNC β 0 of the non-fertilized CT treatment during this period of 57 kg N ha−1 at the intercept was higher than the HGNC β 0 of the NT (43 kg N ha−1; p < 0.01; Figure 3a; Table 1 and Table 2). In the last two years of this period (2006 to 2007), the HGNC Y ^ p of the CT (125 kg N ha−1) was still higher than the HGNC Y ^ p of the NT (98 kg N ha−1; p < 0.01; Figure 3b; Table 1 and Table 3). However, the HGNC Y ^ p values of the NT and CT were lower than the HGNC Y ^ p of the ST (136 kg N ha−1; p < 0.01; Figure 3b; Table 1 and Table 3). The HGNC β 0 for the CT and ST were 56 and 57 kg N ha−1, respectively, and were both higher than the HGNC β 0 of 37 kg N ha−1 with the NT (p < 0.01 Figure 3b; Table 1 and Table 3). For the 2006 to 2017 growing period, the HGNC Y ^ p of the ST (131 kg N ha−1) was still higher than the HGNC Y ^ p of 123 kg N ha−1 with NT (p < 0.10; Figure 3c, Table 1 and Table 4).

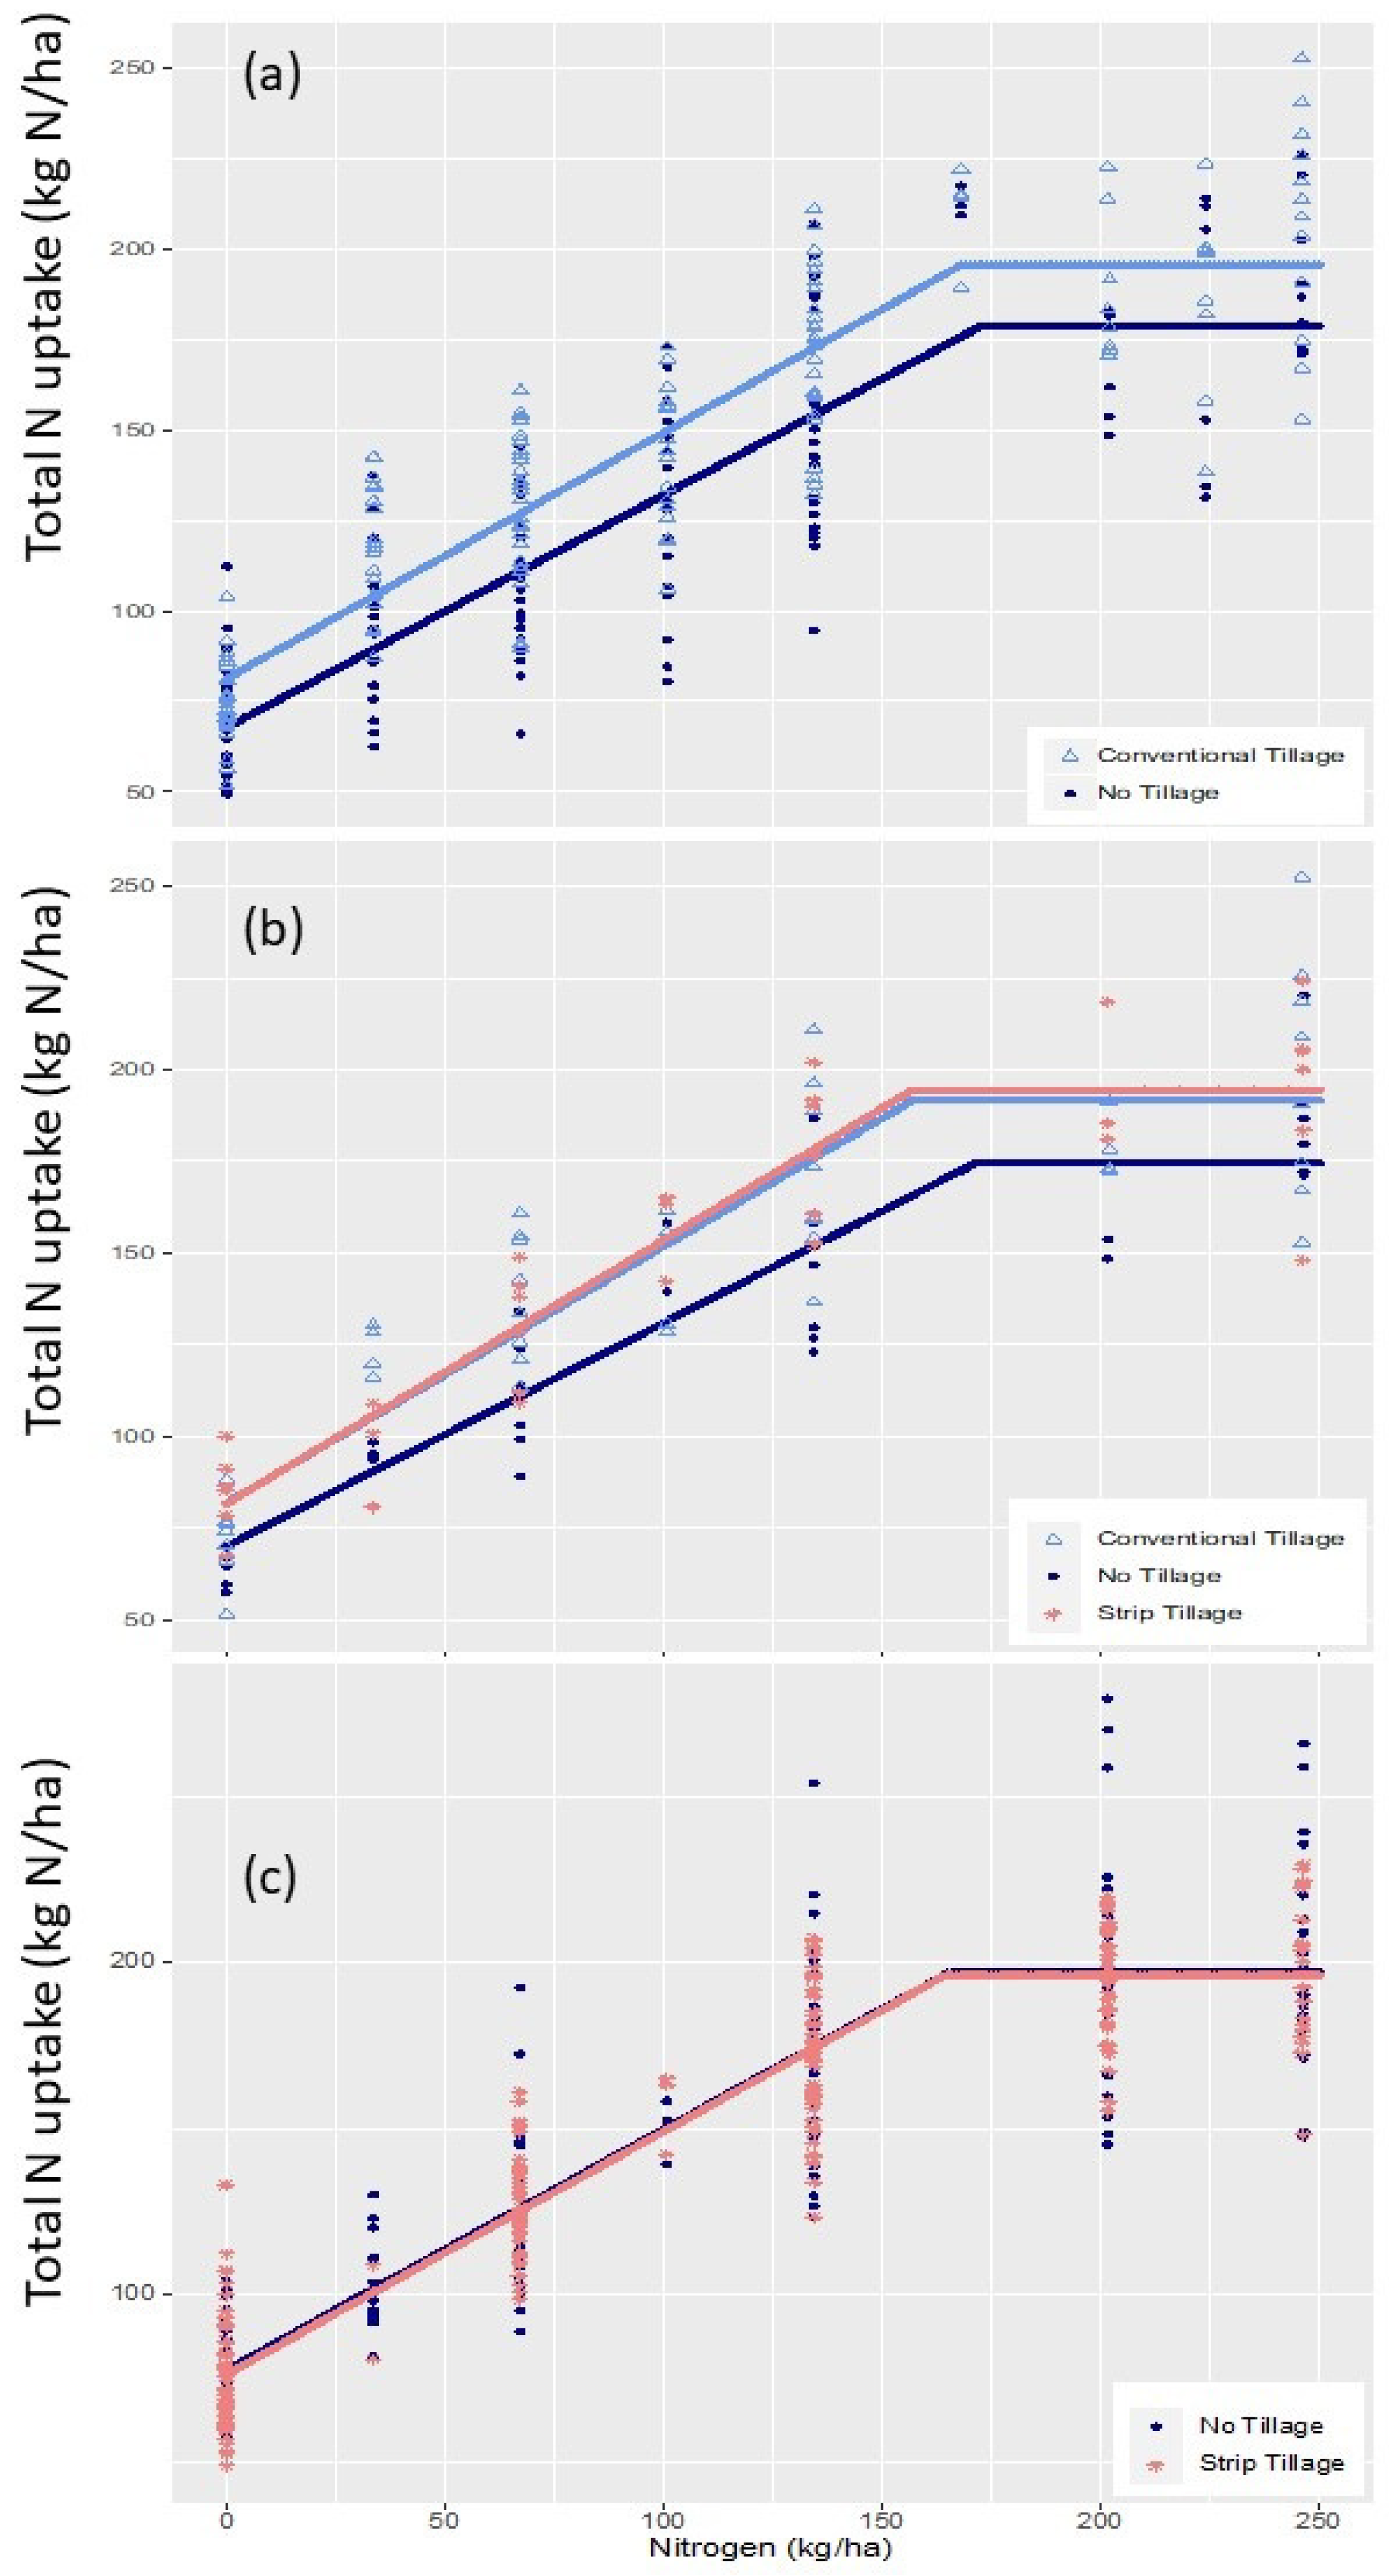
3.4. Effect of Long-Term Tillage on Total N Uptake

For the 2001 to 2007 growing period, the total aboveground N uptake at the plateau (TBNC Y ^ p ) of 196 kg N ha−1 with the CT treatment was higher than the TBNC Y ^ p of 179 kg N ha−1 with the NT (p < 0.01; Figure 4a; Table 1 and Table 2). From 2006 to 2007, the TBNC Y ^ p of the CT (192 kg N ha−1) was not significantly different from the TBNC Y ^ p of 175 kg N ha−1 with the NT (Figure 4b; Table 1 and Table 3) and was also not significantly different from the TBNC Y ^ p of 195 kg N ha−1 with the ST. However, during 2006 to 2007 the TBNC Y ^ p with the ST of 195 kg N ha−1 was significantly higher than the TBNC Y ^ p of 175 kg N ha−1 with the NT (p < 0.10; Figure 4b; Table 1 and Table 3). From 2006 to 2017, the TBNC Y ^ p values for ST and NT were similar and averaged 196.5 kg N ha−1 (Figure 4c; Table 1 and Table 4). The TBNC Y ^ p of the NT from 2001 to 2007 (179 kg N ha−1; Figure 4a; Table 1) increased from 179 to 197 kg N ha−1 from 2006 to 2017 (Figure 4c; Table 1 and Table 4). In both time periods, the CT (2001 to 2007) as well as the NT and ST (2006 to 2017) had TBNC Y ^ p values that were above 190 kg N ha−1 (Table 1). For the 2001 to 2007 period, the TBNC β 0 was significantly higher with the CT (81 kg N ha−1) than the TBNC β 0 with the NT (68 kg N ha−1) (p < 0.01; Figure 4a; Table 1 and Table 2).

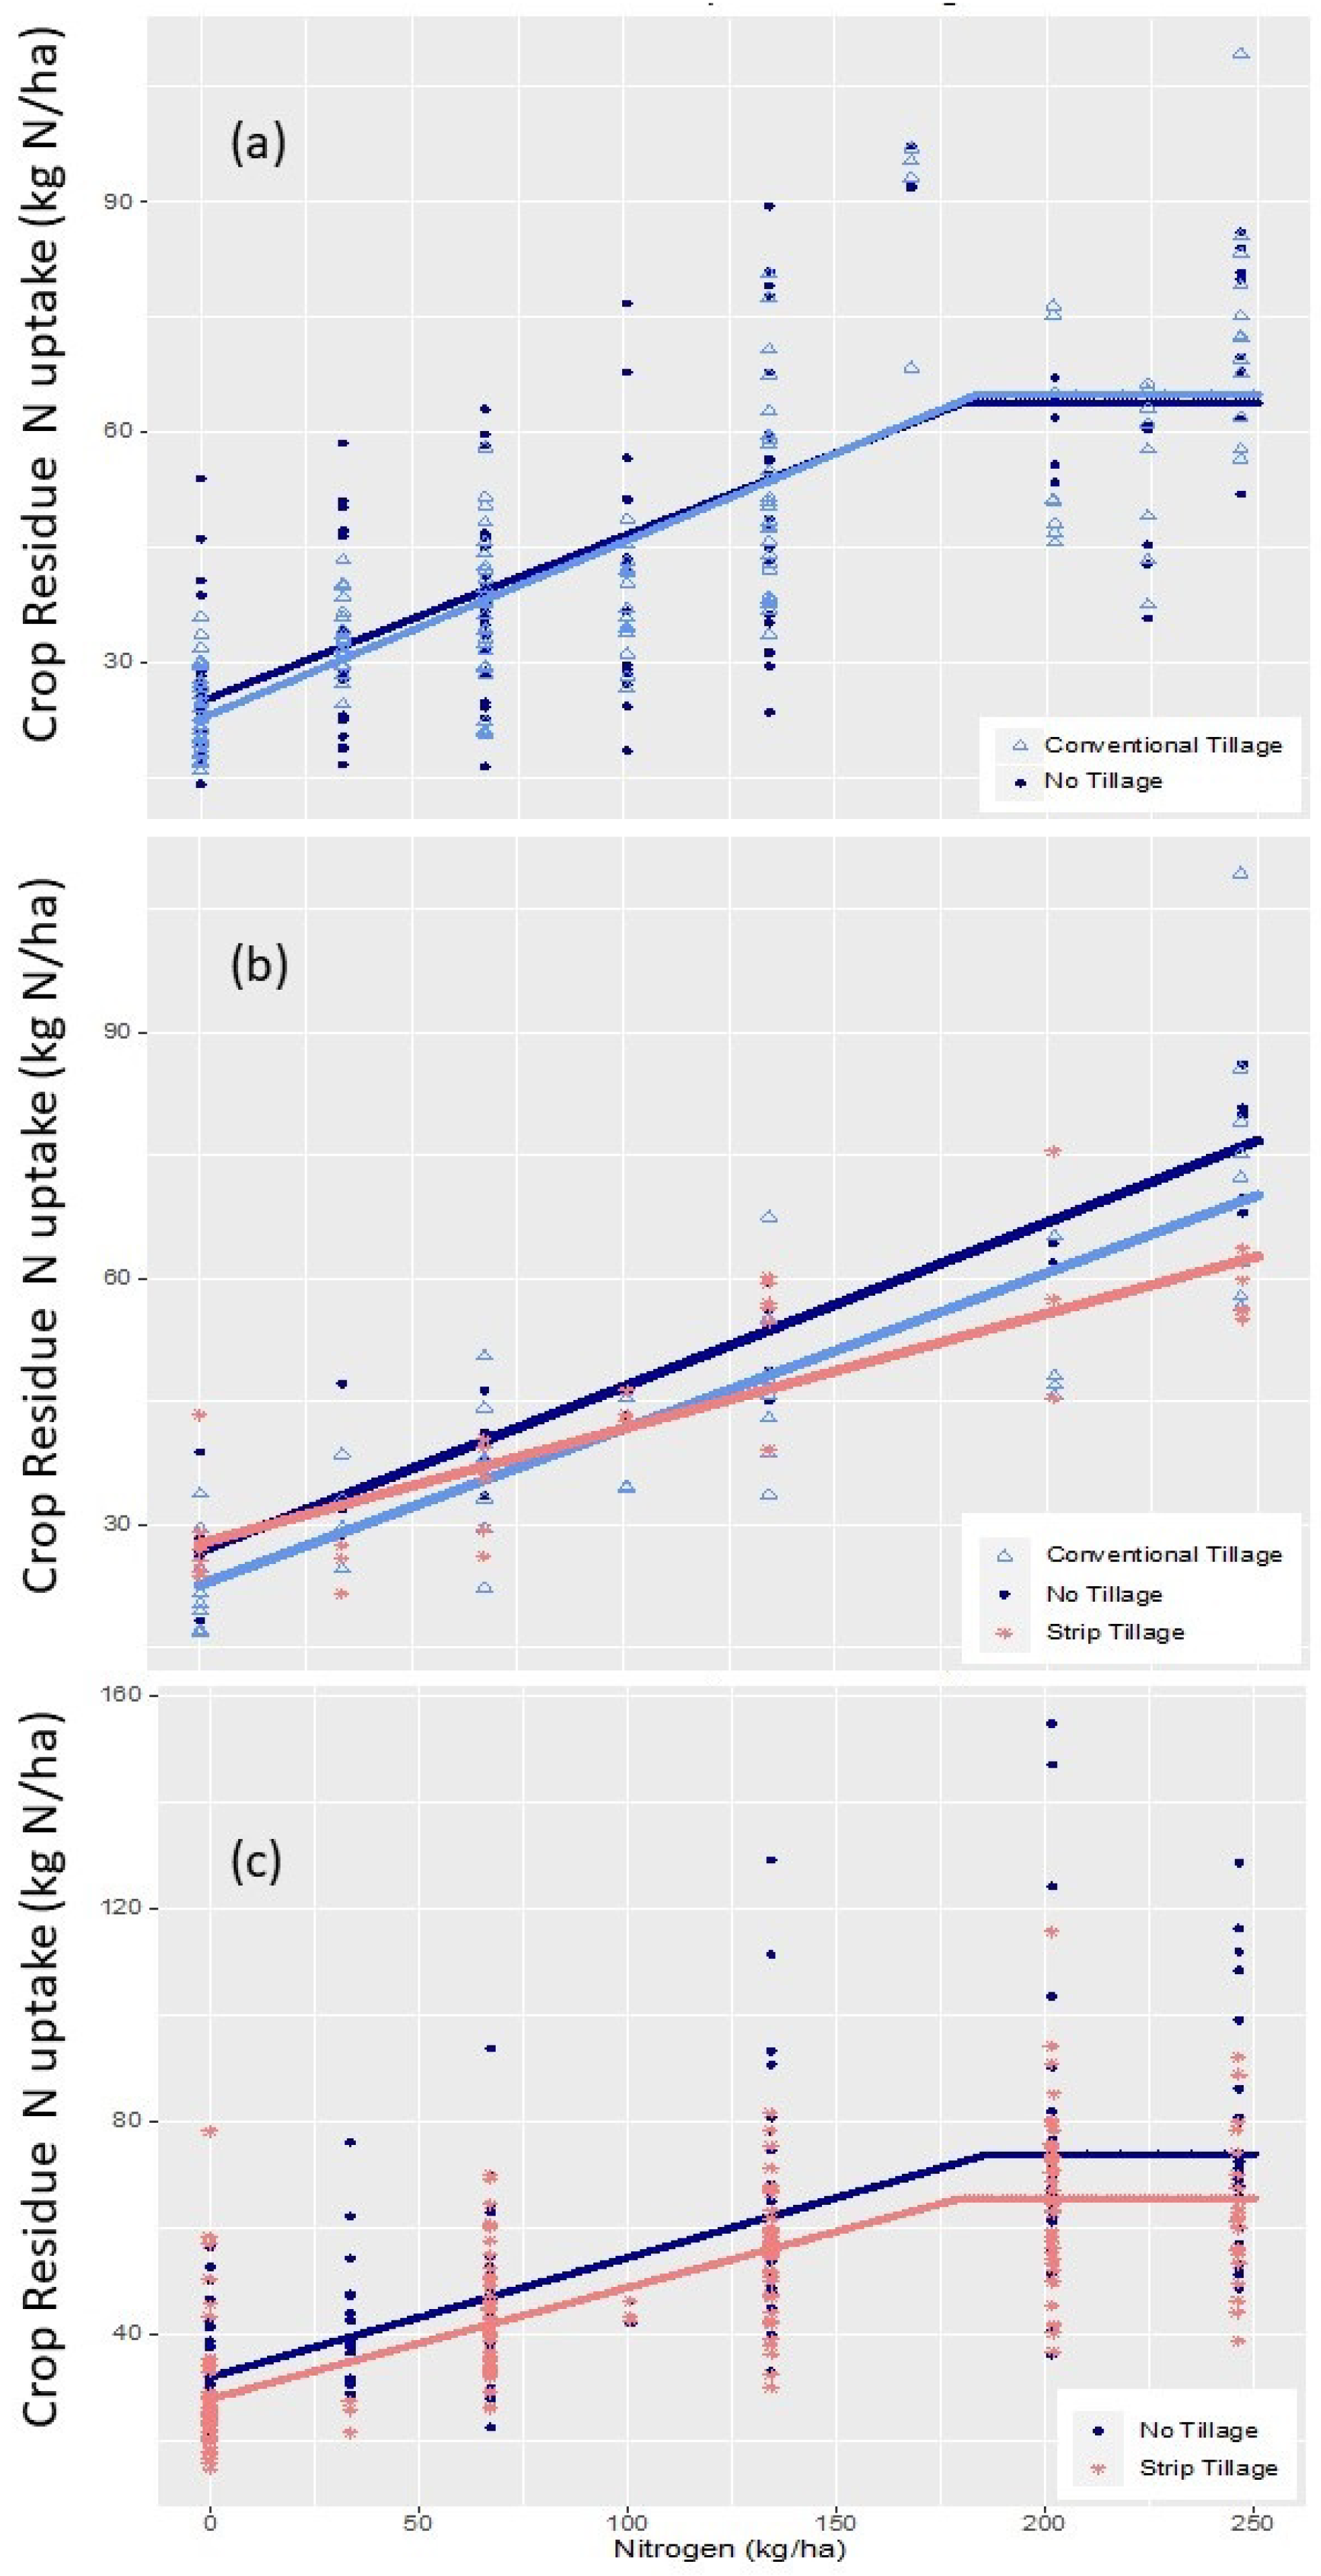
3.5. Effect of Long-Term Tillage on Crop Residue N Uptake

There were no significant differences between tillage treatments as far as the crop residue N uptake at the plateau (CRNC Y ^ p ) during 2001 to 2007 (Figure 5a; Table 1 and Table 2). The average CRNC Y ^ p during the 2001 to 2007 period was 64 kg N ha−1 for the CT and NT treatments (Figure 5a; Table 1 and Table 2). The 2001 to 2007 CRNC β 0 for the CT and NT systems was not significant and averaged 24 kg N ha−1. From 2006 to 2007, the CRNC Y ^ p was 76 with the NT and 69 kg N ha−1 with the CT, both of which were higher than the CRNC Y ^ p of 62 kg N ha−1 with ST (p < 0.05; Figure 5b; Table 1 and Table 5). The CRNC β 0 values of the non-fertilized plots for the NT, CT, and ST were not significantly different and averaged 26 kg N ha−1. For the 2006 to 2017 period, the CRNC Y ^ p of 65 kg N ha−1 with ST was lower than the CRNC Y ^ p of 74 kg N ha−1 with NT (p < 0.10; Figure 5c, Table 1 and Table 4). The crop residue of the NT treatment estimated with the CRNC Y ^ p tended to return larger quantities of N to the soil (ranging from 64 to 76 kg N ha−1) than the crop residue of the CT and ST systems estimated at CRNC Y ^ p , which tended to return 62 to 69 kg N ha−1.

4. Discussion

4.1. CT Had Higher ANUE than NT and ST

The higher grain yield (9852 kg ha−1) with CT from 2001 to 2007 was obtained with a lower N rate of 88 kg N ha−1 (Figure 1a) compared to the NT grain yield of 9852 kg ha−1 with a higher N rate of 161 kg N ha−1 (p < 0.01). Thus, the ANUEHG of 112 kg grain kg N−1 with the CT was almost double the efficiency of that of the NT (58.7 kg grain kg N−1). The data suggest that during the last two years of this 2001 to 2007 period, the NT yields were improving with time with respect to the CT since from 2006 to 2007 the ANUEHG of the NT increased from 58.7 kg grain kg N−1 (2001 to 2007) to 83.7 kg grain kg N−1 (2006 to 2007). Predicted plateau NT yields were achieved with 161 and 112 kg N ha−1 for the 2001 to 2007 and 2006 to 2007 periods, respectively. However, the 2006 to 2007 ANUEHG for NT was still significantly lower than the ANUEHG for CT of 123.7 kg grain kg N−1. The ANUEHG with the CT was also higher than the ANUEHG with the ST from 2006 to 2007 (87.4 kg grain kg N−1). Our findings also agree with other reports of lower grain yields with NT compared to CT systems [21,22,23,24,25]; however, they conflict with recent long-term research that found NT had higher yields than CT [7]. Our findings also agree with other reports of lower grain yields with NT compared to CT systems [21,22,23,24,25].

4.2. Improvement of NT Performance with Time with Respect to Other Tillage Systems

The predicted plateau yields with ST from 2006 to 2007 were achieved with 113 kg N ha−1. Since from 2006 to 2007, predicted plateau yields for the NT and ST conservation systems were obtained at the same N rate of about 113 kg N ha−1, the ANUEHG of 87.4 kg grain kg N−1 with the ST was higher than the ANUEHG of 83.7 kg grain kg N−1 with the NT during this period. It is important to note that these higher yields observed with the ST were in a system that was transitioning from NT to ST, most likely adding N into the system. However, although the ST was likely cycling more N from the soil system, the higher yields were obtained at the same level of N fertilizer application (close to 113 kg N ha−1).
For the 2006 to 2017 period there were no differences between NT and ST for the needed N rate to achieve predicted plateau grain yields. The N rates at the plateau of 121 kg N ha−1 with NT and 116 kg N ha−1 with ST from 2006 to 2017, for an average of 119 kg N ha−1, were not significantly different. These results suggest that the NT grain yield continued to improve with respect to other tillage systems with time during the 2001 to 2017 period.
Since NT, CT, and ST responded significantly to N fertilizer additions, these long-term responses in ANUEHG also suggest that N cycling could also have been a factor in increasing the yields with NT with time. The responses of the control (zero N fertilizer) plots during these time periods suggest that N cycling and/or N recovered was increasing with time in the NT system with respect to other tillage systems (Figure 3, Figure 4 and Figure 5; Table 1). Similarly to how the differences between NT and tillage systems such as ST disappeared with time (Figure 1, Figure 2, Figure 3, Figure 4 and Figure 5), the differences in the non-fertilized plot between the NT and other tillage systems such as ST also disappeared with time during this 2001 to 2017 period (Figure 1, Figure 2, Figure 3, Figure 4 and Figure 5). The long-term linear plus plateau analysis also suggests that although the N fertilizer rate of the NT system at the plateau is decreasing with time (2006 to 2017; 156 kg N ha−1; for a HG Y ^ p of 10,067 kg N ha−1; Table 1), initially the highest grain nitrogen content was reached with a higher N rate at the plateau (2001 to 2007; 169 kg N ha−1; for a HG Y ^ p of 9445 kg N ha−1; Table 1).
The NT yields were increasing with time at this site, and during the 2006 to 2007 period the NT grain yields were higher than the CT, although they were lower than the ST (Figure 1 and Table 1). However, in the long term (2006 to 2017), both NT and ST systems had the same grain yields, so these increases in yields in NT with respect to the other tillage systems agree with the 25-year study conducted by Dick et al. that found initially lower grain yields with NT during the first 18 years and then similar CT and NT yields afterwards [26].
The positive effect of increasing yields with time as a function of N fertilizer for the NT with respect to other tillage systems was also seen in the non-fertilized grain yields with the NT, CT, and ST systems. The NT grain yield of 4866 kg ha−1 with the control (intercept) during the 2001 to 2007 period was significantly lower than the yield with the non-fertilized CT (5694 kg ha−1; p < 0.01; Figure 1a; Table 1). The non-fertilized NT grain yield of the control (4762 kg ha−1) during the last two years of this period (2006–2007) was significantly lower than the 5593 and 5643 kg ha−1 for the ST and CT, respectively (p < 0.01). However, for the 2006 to 2017 period, the non-fertilized NT grain yield of 5216 kg ha−1 was no different from the 5405 kg ha−1 with ST (Figure 1c; Table 1).

4.3. ANUECR for NT Increased with Time with Respect to Other Tillage Systems

The NT and CT crop residue production from the 2001 to 2007 period were no different and were achieved with the same N rate of 168 kg N ha−1 (Figure 2a; Table 1). Since there was no difference between the NT and CT crop residue production achieved at the same N rate, the ANUECR of 53.7 kg residue kg N−1 was the same for this plant compartment from 2001 to 2007 with these two tillage systems. For the last two years of this period, there was also no difference in crop residue production or N rate for predicted plateau production between the NT and CT systems, but the agronomic efficiency of the predicted plateau crop residue production was lower at 45.2 kg residue kg N−1 than the ANUECR of 53.7 kg residue kg N−1 from 2001 to 2007. The ANUECR of the ST at predicted plateau yield was higher at 73.1 kg residue kg N−1 than the 2001 to 2007 average crop residue agronomic efficiency. The ANUECR of the NT continued to increase with time since the ANUECR with NT of 138.3 kg residue kg N−1 was higher from 2006 to 2017, and ST also had a similarly high crop residue agronomic efficiency of 144.3 kg residue kg N−1. These increases in crop residue production and ANUECR suggest a higher efficiency of the applied N with time for the NT, supporting the idea that the N cycling of NT is increasing with time with respect to ST and CT.
These results of lower N uptake with NT than CT agree with published findings from long-term research conducted in Minnesota [4]. The lower N uptake observed with NT in the present work may have been due to greater immobilization of N and denitrification with the crop residue [5,6]. We suggest that the lower N uptake of the control (non-fertilized) NT plots than for the control CT and ST plots for the 2001 to 2007 and 2006 to 2007 periods was due to soil background N being cycled at a faster rate with NT than with ST or CT. This suggests that perhaps the N immobilization of NT may have been higher than that of ST and CT, especially as the NT was being established, similarly to the responses observed in Minnesota [5,6]. However, our results contrast with a 40-year study conducted in Kentucky [7] that found higher yields and higher N uptake with NT than ST, and similar agronomic optimum N rates between the two systems. While we did not find higher yields and higher N uptake with NT compared to ST, we did find that the ANUEHG of NT (78.8 kg grain kg N−1) was similar to that of ST (81.8 kg grain kg N−1). This suggests that the NUE of NT increases with time with respect to NUE of CT and ST. However, the positive response in NT grain yield relative to CT and ST was seen after only 5 to 7 years of NT, which is a much faster response than the 18 years observed in the 25-year study conducted by Dick et al. [26]. Our findings highlight the importance of conducting long-term yield studies to determine the responses of tillage systems with time.

4.4. The Year by Year Confidence Interval Analyses Are in Sync with the Linear-Plus-Plateau Model Analyses

The above discussion sections summarize all the periods monitored from 2001 to 2017. An additional detailed discussion, arranged by the 2001 to 2007 (NT and CT); 2006 and 2007 (NT, ST, and CT) and 2006 to 2017 (NT and ST) periods, is also included in the Supplementary Materials (Tables S20 and S21). Additionally, all of the datasets used for these analyses can be found in the Supplementary Materials. The confidence interval analyses conducted by year and nitrogen rate for HGY, CRB, HGNC, TBNC, and CRNC are in sync with the determination of CRB Y ^ p and CRB β 0 made with the linear-plus-plateau model for the 2001 to 2007, 2006 to 2007, and 2006 to 2017 periods (Tables S5–S21). Some readers may wish to use these datasets to conduct additional analyses and/or to facilitate modeling simulations of the tillage systems studied at this site for further interpretations of the 17 years of research data collected at this site.
We conducted a confidence interval analysis by year and N rate for each period to assess the effects of N rate and tillage on grain yields, dry aboveground biomass production, N uptake by grain, N content in crop residue, and total aboveground N uptake. The results from of our confidence interval analysis are in sync with the results of the linear plateau model and the likelihood ratio test. For example, the confidence interval analysis shows that although the average HGY with CT was higher than that of NT when considering the 2001 to 2007 period, when we examine the last two years (2006 to 2007), the average HGY of NT was higher than that of CT.
Similarly, the confidence interval analysis found that although during the 2006 to 2007 period the HGY of ST was higher than that of NT, over the longer period (2007 to 2017), the HGYs of NT and ST were quite similar. The confidence interval analysis found out that the HGY of the NT increased with time with respect to the HGYs of CT and ST (Tables S5–S21), which is supported by our similar findings with the linear-plus-plateau model. Similarly, the aboveground biomass production, HGYN, CRN, and TBN responses determined with confidence interval analysis were similar to the responses obtained with the linear-plus-plateau model and the likelihood ratio test. These results also show that the linear-plus-plateau model based on a general non-linear regression, which is a robust method of analysis and uses the very well-known likelihood ratio test, makes our assessment approach robust in determining differences in tillage system performance due to nitrogen rates.

4.5. Need for Long-Term Research

The present work found that short-term (two-to-three-year, or even five-year) studies will not necessarily reflect the changes that affect long-term NUE and the potential for N losses for a given tillage system, and that long-term studies are necessary to assess how a given cropping system under a given tillage system like NT could change with time (e.g., increased NUE and increased N cycling). Our assessment of NUE for the NT system, which used the linear-plus-plateau model, is in agreement with the N balance study conducted by Delgado et al. that found that the long-term N losses from this irrigated NT system ranged from 20 to 50% [1]. The present work is further evidence of the importance of conducting long-term research studies since the responses to treatment effects such as tillage systems are dynamic and change with time, and the initial responses are not necessarily the same responses that would be expected in long-term applications of best management practices (BMPs). This illustrates the importance of long-term research and shows there is a need for long-term research across the USA.
Although total N removal with grain was higher for CT and ST than NT, the total N uptake by aboveground crop biomass was not significantly different between NT, ST, and CT after five years, when the total uptake of the NT increased to levels comparable to ST and CT. More crop residue N was cycled back to the field with NT than with ST, and even initially when NT had lower total N uptake than CT, the N cycled back with NT was not significantly less than the N cycled back with CT. The N fertilizer rate at the harvested grain plateau was 161 kg N ha−1 in the first seven years following establishment of NT (from 2001 to 2007) and 121 kg N ha−1 during the final 11 years (from 2006 to 2017; Table 1).
The present work contributes to scientific understanding of the long-term impacts of these practices. Although yields and N uptake of NT increased with time with respect to ST and CT systems, since the long-term HGY of NT was similar to the long-term HGY of ST (2007 to 2017) and the HGYN and agronomic N use efficiency of NT were lower than the HGYN of CT (2001 to 2007), we rejected our hypothesis (Table 1). We found that although NT increased yields and N uptake with time compared to more intensive systems such as ST and CT, NT did not have higher yields and higher N uptake than CT and ST (Table 1), contrasting with results found in research on humid systems in Kentucky [7], where NT had higher yields and higher N uptake than CT. Additionally, we found that the agronomic N use efficiency was lower for NT than CT, which also contrasts with findings of similar agronomic optimum N rates with CT and NT in humid systems in Kentucky [7]. Thus, we rejected the hypothesis.

5. Conclusions

We conclude that NT systems initially reduce yields compared to more intense tillage systems such as CT and ST, and with time, NT reaches at least similar yield responses to CT and ST under irrigation at this site in Colorado. Additionally, the present work on tillage effects shows that the agronomic efficiency of the N applied to the NT system was increasing with time with respect to CT and ST, suggesting that N cycling in the NT system increased over time. NT has the potential to be a viable management tool with similar agronomic efficiencies to other tillage systems like ST. However, the agronomic efficiencies were lower than those observed with CT.
The crop residue results suggest that if we want to continue N cycling that supplies N to the soil system at high levels with the crop residue, we may have to apply N in greater quantities (Table 1; 180 to 246 kg N ha−1) than needed for achieving grain production at the linear plus plateau N rate; otherwise, the N cycling with the crop residue may be reduced in the long term. The long-term studies and comparison with other tillage systems show that NT is a potential viable practice as far as recoveries of N, and the long-term total aboveground biomass NUE of about 70% is comparable to the long-term total aboveground biomass NUE with CT and ST (about 4% difference). These long-term studies show that NT harvested grain recoveries are lower at about 50% and that there is a need to continue developing BMPs to increase harvested grain N recoveries and yields of NT, ST, and CT systems.

Supplementary Materials

Supporting information (datasets and metadata) can be downloaded at: https://www.mdpi.com/article/10.3390/agronomy14102304/s1.

Author Contributions

Conceptualization: J.A.D., R.E.D. and A.H.V.; methodology: J.A.D., A.H.V. and R.E.D.; software, J.A.D., R.E.D. and A.H.V.; validation, J.A.D., R.E.D. and A.H.V.; formal analysis, J.A.D., R.E.D. and A.H.V.; investigation: J.A.D., R.E.D., A.H.V., A.D.H., C.E.S., J.A., S.J.D.G., D.K.M. and B.A.F.; data curation, J.A.D., R.E.D. and A.D.H.; writing—original draft: J.A.D.; writing—review and editing: J.A.D., R.E.D., A.H.V., A.D.H., C.E.S., J.A., S.J.D.G., D.K.M. and B.A.F.; visualization: J.A.D., A.H.V. and R.E.D.; supervision: J.A.D., A.D.H., C.E.S., S.J.D.G. and D.K.M.; project administration: J.A.D., A.D.H., C.E.S., S.J.D.G., D.K.M., B.A.F. and R.E.D. All authors have read and agreed to the published version of the manuscript.

Funding

This research received no external funding.

Data Availability Statement

The datasets associated with this paper will be made available in the AgData Commons repository at a later date (https://agdatacommons.nal.usda.gov/) and are also included as Supplementary Materials to this paper.

Conflicts of Interest

The authors declare no conflicts of interest.

References

  1. Delgado, J.A.; Halvorson, A.D.; D’Adamo, R.; Stewart, C.E.; Floyd, B.; Del Grosso, S. Long-term nitrogen balance of an irrigated no-till soil-corn system. Nutr. Cycl. Agroecosyst. 2023, 126, 229–243. [Google Scholar] [CrossRef]
  2. Fu, X.; Wang, J.; Sainju, U.M.; Liu, W. Soil nitrogen fractions under long-term crop rotations in the loess plateau of China. Soil Tillage Res. 2019, 186, 42–51. [Google Scholar] [CrossRef]
  3. Yang, S.-M.; Malhi, S.S.; Li, F.-M.; Suo, D.-R.; Xu, M.-G.; Wang, P.; Xiao, G.-J.; Jia, Y.; Guo, T.-W.; Wang, J.-G. Long-term effects of manure and fertilization on soil organic matter and quality parameters of a calcareous soil in NW China. J. Plant Nutr. Soil Sci. 2007, 170, 234–243. [Google Scholar] [CrossRef]
  4. Iragavarapu, T.K.; Randall, G.W. Yield and nitrogen uptake of monocropped maize from a long-term tillage experiment on a poorly drained soil. Soil Tillage Res. 1995, 34, 145–156. [Google Scholar] [CrossRef]
  5. Kitur, B.K.; Smith, M.S.; Blevins, R.L.; Frye, W.W. Fate of N-depleted ammonium nitrate applied to no tillage and conventional tillage corn. Agron. J. 1984, 76, 240–242. [Google Scholar] [CrossRef]
  6. Meisinger, J.J.; Bandel, V.A.; Stanford, G.; Legg, J.O. Nitrogen utilization of corn under minimal tillage and moldboard plow tillage. I. Four-year results using labeled N fertilizer on an Atlantic Coastal Plain Soil. Agron. J. 1985, 77, 602–611. [Google Scholar] [CrossRef]
  7. Canisares, L.P.; Grove, J.; Miguez, F.; Poffenbarger, H. Long-term no-till increases soil nitrogen mineralization but does not affect optimal corn nitrogen fertilization practices relative to inversion tillage. Soil Tillage Res. 2021, 213, 105080. [Google Scholar] [CrossRef]
  8. Jantalia, C.P.; Halvorson, A.D. Nitrogen fertilizer effects on irrigated conventional tillage corn yields and soil carbon and nitrogen pools. Agron. J. 2011, 103, 871–878. [Google Scholar] [CrossRef]
  9. Pittelkow, C.M.; Linquist, B.A.; Lundy, M.E.; Liang, X.; van Groenigen, K.J.; Lee, J.; van Gestel, N.; Six, J.; Venterea, R.T.; van Kessel, C. When does no-till yield more? A global meta-analysis. Field Crops Res. 2015, 183, 156–168. [Google Scholar] [CrossRef]
  10. Ogle, S.M.; Swan, A.; Paustian, K. No-till management impacts on crop productivity, carbon input and soil carbon sequestration. Agric. Ecosyst. Environ. 2012, 149, 37–49. [Google Scholar] [CrossRef]
  11. Sindelar, A.J.; Schmer, M.R.; Jin, V.L.; Wienhold, B.J.; Varvel, G.E. Long-term corn and soybean response to crop rotation and tillage. Agron. J. 2015, 107, 2241–2252. [Google Scholar] [CrossRef]
  12. Gagnon, B.; Ravelojaona, N.; St. Luce, M.; Ziadi, N. Agronomic and economic performance of 26-year corn–soybean rotation affected by tillage and fertilization in eastern Canada. Agron. J. 2022, 114, 1447–1460. [Google Scholar] [CrossRef]
  13. Van den Putte, A.; Govers, G.; Diels, J.; Langhans, C.; Clymans, W.; Vanuytrecht, E.; Merckx, R.; Raes, D. Soil functioning and conservation tillage in the Belgian loam belt. Soil Tillage Res. 2012, 122, 1–11. [Google Scholar] [CrossRef]
  14. Toliver, D.K.; Larson, J.A.; Roberts, R.K.; English, B.C.; De La Torre Ugarte, D.G.; West, T.O. Effects of no-till on yields as influenced by crop and environmental factors. Agron. J. 2012, 104, 530–541. [Google Scholar] [CrossRef]
  15. Rusinamhodzi, L.; Corbeels, M.; van Wijk, M.; Rufinio, M.C.; Nyamangara, J.; Giller, K.E. A meta-analysis of long-term effects of conservation agriculture practices on maize yields under rain-fed conditions. Agron. Sustain. Dev. 2011, 31, 657–673. [Google Scholar] [CrossRef]
  16. Zhang, S.; Chen, X.; Jia, S.; Liang, A.; Zhang, X.; Yang, X.; Wei, S.; Sun, B.; Huang, D.; Zhou, G. The potential mechanism of long-term conservation tillage effects on maize yield in the black soil of Northeast China. Soil Tillage Res. 2015, 154, 84–90. [Google Scholar] [CrossRef]
  17. Govaerts, B.; Sayre, K.D.; Deckers, J. Stable high yields with zero tillage and permanent bed planting. Field Crops Res. 2005, 94, 33–42. [Google Scholar] [CrossRef]
  18. He, J.; Li, H.W.; Rasaily, R.G.; Wang, Q.J.; Cai, G.H.; Su, Y.B.; Qiao, X.D.; Liu, L.J. Soil properties and crop yields after 11 years of no tillage farming in wheat–maize cropping system in North China Plain. Soil Tillage Res. 2011, 113, 48–54. [Google Scholar] [CrossRef]
  19. Verhulst, N.; Nelissen, V.; Jespers, N.; Haven, H.; Sayre, K.D.; Raes, D.; Deckers, J.; Govaerts, B. Soil water content, maize yield and its stability as affected by tillage and crop residue management in rainfed semi-arid highlands. Plant Soil 2011, 344, 73–85. [Google Scholar] [CrossRef]
  20. Cullum, R.F. Influence of tillage on maize yield in soil with shallow fragipan. Soil Tillage Res. 2012, 119, 1–6. [Google Scholar] [CrossRef]
  21. Chen, Y.; Liu, S.; Li, H.; Li, X.F.; Song, C.Y.; Cruse, R.M.; Zhang, X.Y. Effects of conservation tillage on corn and soybean yield in the humid continental climate region of Northeast China. Soil Tillage Res. 2011, 115, 56–61. [Google Scholar] [CrossRef]
  22. Griffith, D.R.; Kladivko, E.J.; Mannering, J.V.; West, T.D.; Parsons, S.D. Long-term tillage and rotation effects on corn growth and yield on high and low organic matter, poorly drained soils. Agron. J. 1988, 80, 599–605. [Google Scholar] [CrossRef]
  23. Potter, K.N.; Morrison, J.E.; Torbert, H.A. Tillage intensity effects on corn and grain sorghum growth and productivity on a Vertisol. J. Prod. Agric. 1996, 9, 385–390. [Google Scholar] [CrossRef]
  24. Wilhelm, W.W.; Wortmann, C.S. Tillage and rotation interactions for corn and soybean grain yield as affected by precipitation and air temperature. Agron. J. 2004, 96, 425–432. [Google Scholar] [CrossRef]
  25. Sims, A.L.; Schepers, J.S.; Olson, R.A.; Power, J.F. Irrigated corn yield and nitrogen accumulation response in a comparison of no-till and conventional till: Tillage and surface-residue variables. Agron. J. 1998, 90, 630–637. [Google Scholar] [CrossRef]
  26. Dick, W.A.; McCoy, E.L.; Edwards, W.M.; Lal, R. Continuous application of no-tillage to Ohio soils. Agron. J. 1991, 83, 65–73. [Google Scholar] [CrossRef]
Figure 1. Effect of N fertilizer rates on yields of irrigated corn grain (oven-dried weight) grown on a clay loam soil (fine-loamy, mixed, mesic Aridic Haplustalfs) with a 1 to 2% slope at the Agricultural Research, Development, and Education Center (ARDEC) from 2001 to 2007 under CT and NT systems (a); from 2006 to 2007 under CT, NT, and ST systems (b); and from 2006 to 2017 under ST and NT systems (c). Data fitted with a linear-plus-plateau model.
Agronomy 14 02304 g001
Figure 2. Effect of N fertilizer rates on crop residue biomass (stalks, leaves, and cobs) yields (oven-dried weight) of irrigated corn grain grown on a clay loam soil (fine-loamy, mixed, mesic Aridic Haplustalfs) with a 1 to 2% slope at the Agricultural Research, Development, and Education Center (ARDEC) from 2001 to 2007 under CT and NT systems (a); from 2006 to 2007 under CT, NT, and ST systems (b); and from 2006 to 2017 under ST and NT systems (c). Data fitted with a linear-plus-plateau model.
Agronomy 14 02304 g002
Figure 3. Effect of N fertilizer rates on N uptake of irrigated corn grain grown on a clay loam soil (fine-loamy, mixed, mesic Aridic Haplustalfs) with a 1 to 2% slope at the Agricultural Research, Development, and Education Center (ARDEC) from 2001 to 2007 under CT and NT systems (a); from 2006 to 2007 under CT, NT, and ST systems (b); and from 2006 to 2017 under ST and NT systems (c). Data fitted with a linear-plus-plateau model.
Agronomy 14 02304 g003
Figure 4. Effect of N fertilizer rates on total aboveground N uptake (grain, stalks, leaves, and cobs) of irrigated corn grain grown on a clay loam soil (fine-loamy, mixed, mesic Aridic Haplustalfs) with a 1 to 2% slope at the Agricultural Research, Development, and Education Center (ARDEC) from 2001 to 2007 under CT and NT systems (a); from 2006 to 2007 under CT, NT, and ST systems (b); and from 2006 to 2017 under ST and NT systems (c). Data fitted with a linear-plus-plateau model.
Agronomy 14 02304 g004
Figure 5. Effect of N fertilizer rates on N uptake of crop residue biomass (stalks, leaves, and cobs) of irrigated corn grain grown on a clay loam soil (fine-loamy, mixed, mesic Aridic Haplustalfs) with a 1 to 2% slope at the Agricultural Research, Development, and Education Center (ARDEC) from 2001 to 2007 under CT and NT systems (a); from 2006 to 2007 under CT, NT, and ST systems (b); and from 2006 to 2017 under ST and NT systems (c). Data fitted with a linear-plus-plateau model.
Agronomy 14 02304 g005
Table 1. Summary table of growing period and tillage (GPT) for compartment (yield or N content) assessed: yield of harvested grain, crop residue biomass (stalks, leaves, and cobs) yield, N content of harvested grain, N content of crop residue, and total aboveground N content (sum of harvested N with grain and N content in crop residue). The slope ( β 1 ), intercept ( β 0 ), N at plateau ( N p ), and predicted plateau Y ^ p for each modeled compartment (yield or N content) as a function of N fertilizer rate applied in kg N ha−1 in irrigated corn grown on a clay loam soil, are shown. The effects of tillage and N rates on harvested grain and crop residue yields, as well as the effects of tillage and N rates on N content of harvested grain, crop residue and total aboveground N content, were assessed with a linear-plus-plateau model or a linear relationship model.
GPT $CompartmentModel β 1 β 0 N p Y ^ p
NT 2001–2007Harvested GrainLPPM 28.5 b ***4866 b ***161 a ***9445 b ***
CT 2001–2007Harvested GrainLPPM 47.1 a ***5694 a ***88 b ***9852 a ***
NT 2001–2007Crop Residue
Biomass
LPPM 18.0 n.s.6163 n.s.168 n.s.9187 n.s.
CT 2001–2007Crop Residue
Biomass
LPPM 16.4 n.s.6093 n.s.168 n.s.8845 n.s.
NT 2001–2007Harvested
Grain N
LPPM 0.43 b *43 b ***169 * a115 b ***
CT 2001–2007Harvested
Grain N
LPPM 0.49 a *57 a ***150 * b130 a ***
NT 2001–2007Aboveground
Biomass N
LPPM 0.64 n.s.68 b ***173 n.s.179 b ***
CT 2001–2007Aboveground
Biomass N
LPPM 0.68 n.s.81 a ***168 n.s.196 a ***
NT 2001–2007Crop Residue
Biomass N
LPPM 0.22 n.s.25 n.s.181 n.s.64 n.s.
CT 2001–2007Crop Residue Biomass NLPPM 0.23 n.s.23 n.s.184 n.s.64 n.s.
NT 2006–2007Harvested GrainLPPM 41.5 n.s.4762 b **112 a ***9410 b **
CT 2006–2007Harvested GrainLPPM 48.4 n.s.5643 a **75 b ***9270 c **
ST 2006–2007Harvested GrainLPPM 38.0 n.s.5593 a **113 a ***9898 a **
NT 2006–2007Crop Residue
Biomass
LPPM 15.9 n.s.6101 n.s.242 a **9944 a **
CT 2006–2007Crop Residue
Biomass
LPPM 16.6 n.s.5659 n.s.172 ab **8500 ab **
ST 2006–2007Crop Residue
Biomass
LPPM 17.4 n.s.6300 n.s.113 b **8256 b **
NT 2006–2007Harvested
Grain N
LPPM 0.60 n.s.37 b ***101 b **98 c ***
CT 2006–2007Harvested
Grain N
LPPM 0.61 n.s.56 a ***114 b *125 b ***
ST 2006–2007Harvested
Grain N
LPPM 0.52 n.s.57 a ***151 a **136 a ***
NT 2006–2007Aboveground
Biomass N
LPPM 0.61 n.s.70 b *172 n.s.175 b *
CT 2006–2007Aboveground Biomass NLPPM 0.70 n.s.82 b157 n.s.192 ab
ST 2006–2007Aboveground
Biomass N
LPPM 0.72 n.s.82 a *157 n.s.195 a *
NT 2006–2007Crop Residue
Biomass N
LR ¥0.20 a ***27 a246 n.s.76 a ***
CT 2006–2007Crop Residue
Biomass N
LR ¥0.19 a *23 a246 n.s.69 a *
ST 2006–2007Crop Residue
Biomass N
LR ¥0.14 b ***28 a246 n.s.62 b ***
NT 2006–2017Harvested GrainLPPM 40.3 n.s.5216 n.s.121 n.s.10,067 n.s.
ST 2006–2017Harvested GrainLPPM 42.4 n.s.5405 n.s.116 n.s.10,328 n.s.
NT 2006–2017Crop Residue
Biomass
LPPM 33.3 n.s.7514 a ***82 n.s.10,233 a ***
ST 2006–2017Crop Residue
Biomass
LPPM 37.5 n.s.6161 b ***86 n.s.9379 b ***
NT 2006–2017Harvested
Grain N
LPPM 0.49 n.s.46 n.s.156 n.s.123 n.s.
ST 2006–2017Harvested
Grain N
LPPM 0.52 n.s.48 n.s.159 n.s.131 n.s.
NT 2006–2017Aboveground
Biomass N
LPPM 0.72 n.s.78 n.s.165 n.s.197 n.s.
ST 2006–2017Aboveground
Biomass N
LPPM 0.73 n.s.76 n.s.165 n.s.196 n.s.
NT 2006–2017Crop Residue
Biomass N
LPPM 0.23 n.s.32 a *186 a74 a *
ST 2006–2017Crop Residue
Biomass N
LPPM 0.21 n.s.28 b180 a65 b
$ No-till (NT); conventional till (CT); strip till (ST); GPT and compartments with different letters were significantly different; ***, ** and * are significant at p < 0.01, p < 0.05 and p < 0.10, respectively; non-significant (n.s.). Linear-plus-plateau model (LPPM). ¥ The linear-plus-plateau model could not be identified as a response function for describing crop residue biomass N versus N. Due to this, a linear regression model (LR) was used.
Table 2. Likelihood ratio test statistics for the estimated linear-plus-plateau model parameters of harvested grain, crop residue biomass, harvested grain N content, crop residue biomass N content, and total aboveground N content responses to N rates for NT and CT comparison from 2001 to 2007.
Parameter EstimateGrain
Response
Biomass ResponseGrain
N Uptake
Total
Aboveground
N Uptake
Crop Residue
N Uptake
Intercept14.367 ***1.05218.219 ***8.099 ***1.554
Slope10.328 ***1.2363.379 *1.6091.074
N at Plateau17.176 ***1.0193.645 *1.1711.016
*** Significant at the 0.01 level; * significant at the 0.10 level.
Table 3. Likelihood ratio test statistics for the estimated linear-plus-plateau model parameters of harvested grain, harvested grain N content, crop residue biomass N content, and total aboveground N content responses to N rates for NT, CT, and ST system comparisons from 2006 to 2007.
Parameter EstimatesCompartmentNT vs. CTNT vs. STCT vs. ST
InterceptHarvested grain5.892 **4.438 **1.015
SlopeHarvested grain1.8091.2062.588
N at PlateauHarvested grain6.555 ***1.0055.274 **
InterceptBiomass1.9291.2862.503
SlopeBiomass 1.0181.0751.011
N at PlateauBiomass2.4987.653 ***2.176
InterceptGrain N uptake7.550 ***8.360 ***1.054
SlopeGrain N uptake1.0011.6911.899
N at PlateauGrain N uptake1.7165.206 **3.556 *
InterceptTotal N uptake2.6782.927 *1.001
SlopeTotal N uptake1.6872.1851.030
N at PlateauTotal N uptake1.4041.5201.000
*** Significant at the 0.01 level; ** significant at the 0.05 level; * significant at the 0.10 level.
Table 4. Likelihood ratio test statistics for the estimated linear-plus-plateau model parameters of harvested grain, crop residue biomass, harvested grain N content, crop residue biomass N content, and total aboveground N content responses to N rates for NT and ST comparison from 2006 to 2017.
Parameter EstimateGrain ResponseBiomass ResponseGrain
N Uptake
Total Aboveground
N Uptake
Crop Residue
N Uptake
Intercept2.14412.984 ***2.0931.1022.821 *
Slope1.3311.2391.4041.0011.245
N at Plateau1.2561.1041.1041.0051.063
*** Significant at the 0.01 level; * significant at the 0.10 level.
Table 5. Likelihood-ratio test statistics for the estimated linear model parameters of crop residue biomass (stalks, leaves, and cobs) response to N rates for NT, CT, and ST system comparisons from 2006 to 2007.
Parameter EstimatesNT vs. CTNT vs. STCT vs. ST
Intercept1.572 0.110 1.997
Slope0.074 7.491 *** 3.593 *
*** Significant at the 0.01 level; * Significant at the 0.10 level.
Disclaimer/Publisher’s Note: The statements, opinions and data contained in all publications are solely those of the individual author(s) and contributor(s) and not of MDPI and/or the editor(s). MDPI and/or the editor(s) disclaim responsibility for any injury to people or property resulting from any ideas, methods, instructions or products referred to in the content.

