Article

Key Microorganisms Influencing Mineral-Protected Organic Carbon Formation in Soils with Exogenous Carbon Addition

by
Limin Zhang
1,2,
Yuanhong Luo
2,
Yang Wang
3,
Chengfu Zhang
4,
Guojun Cai
4,
Weici Su
4 and
Lifei Yu
1,*
1
College of Life Sciences, Guizhou University, Guiyang 550025, China
2
Guizhou Academy of Testing and Analysis, Guiyang 550000, China
3
School of Ecological Engineering, Guizhou University of Engineering Science, Bijie 551700, China
4
Institute of Mountain Resources of Guizhou Academy of Sciences, Guiyang 550001, China
*
Author to whom correspondence should be addressed.
Agronomy 2024, 14(10), 2333; https://doi.org/10.3390/agronomy14102333
Submission received: 10 September 2024 / Revised: 1 October 2024 / Accepted: 7 October 2024 / Published: 10 October 2024
(This article belongs to the Section Soil and Plant Nutrition)

Abstract

:
The formation of mineral-protected organic carbon (MPOC) is a vital process for soil organic carbon (SOC) accumulation and stabilization, influenced by factors such as exogenous carbon (C) input and soil microorganisms. However, the dynamics of MPOC and soil microorganisms following exogenous C input, and the key microorganisms driving MPOC formation, remain poorly understood. To address this, we conducted exogenous C addition culture experiments to investigate changes in MPOC and soil microorganisms and identify the primary microorganisms influencing MPOC formation. We observed that the MPOC content in treated soils increased over time, ranging from 0.43 to 2.06 g kg−1. MPOC showed a significant positive correlation with soil bacterial diversity and a significant negative correlation with fungal diversity. Soil samples contained 248 bacterial families and 189 fungal genera, with Oxalobacteraceae (7.42%) and unclassified_k__Fungi (24.82%) being the most abundant, respectively. Using FAPROTAX and FunGuild ecological function prediction methods, we analyzed soil bacteria and fungi functional profiles and abundances. We identified the main bacterial families influencing MPOC formation as Microbacteriaceae, Mycobacteriaceae, Pseudomonadaceae, Streptomycetaceae, and Xanthomonadaceae. The primary fungal genera were Cylindrocarpon, Leohumicola, Metarhizium, Neobulgaria, Neopestalotiopsis, Olpidium, and Tetracladium. These findings provide theoretical support for understanding microbial regulation mechanisms in soil C sequestration and emission reduction.

1. Introduction

The soil carbon (C) pool, being the largest in terrestrial ecosystems, is crucial in regulating climate change and the global C cycle [1,2]. Understanding the mechanisms of soil organic carbon (SOC) formation, transformation, and stabilization is vital for predicting future trends in terrestrial C cycling [3,4] and supports China’s goal of achieving “carbon neutrality” by 2060 [5]. SOC can be categorized into labile organic carbon (OC) and stable OC based on its decomposition ability [6]. Labile OC facilitates exchange with the external environment and is readily decomposed and utilized, while stable OC is sequestered through processes such as ligand exchange, bridging by high-valence cations, van der Waals forces, and complexation. Mineral-protected organic carbon (MPOC) is a relatively stable form of OC [7,8], whose formation is influenced by exogenous C, soil microorganisms, and other factors, contributing significantly to SOC accumulation and stability [9]. SOC is mainly derived from exogenous and endogenous organic matter [10], such as plant residues, manure, sewage waste, waste from the fruit and vegetable industry, etc., all of which can be used as sources of organic matter [11,12].
Numerous studies have shown that when exogenous C enters the soil, “microbial activation” occurs first. This is because new organic substances provide sufficient C sources and energy for microorganisms, rapidly promoting microbial metabolism and biomass growth [13,14]. Bacteria and fungi, the two main groups of microbial communities, both decompose organic matter. The introduction of exogenous C creates a “carbon pump” in the soil, directly participating in SOC transformation [15,16]. Soil microorganisms are affected by seasonal changes, moisture, temperature, and other factors, and seasonal variations have significant impacts on fungal communities and their biodeterioration activities. The fungal diversity in the communities of fungi in the dry season was higher than that in the wet season, and the functional group was more diverse in the dry season than that in the wet season as well [17]. Soil microbial activity plays a crucial role in nutrient recovery, highlighting its importance in post-fire ecosystem restoration [18]. Soil microorganisms, which provide essential geo-biochemical cycling functions and regulate soil ecosystem functions, have their processes determined by the microbial community [19,20]. While numerous studies have examined ecosystem functions and community structure, these have largely focused on grassland and agricultural ecosystems, with few investigating the ecological functions of microorganisms in C cycling within karst forest ecosystems. The functional groups of bacteria involved in C cycling include chemoheterotrophs, C cyclers, and nitrogen cyclers, whereas those of fungi include saprotrophic, endophytic, and parasitic fungi [21].
This study hypothesizes that the addition of exogenous C affects the activity, composition, and diversity of soil microorganisms, consequently influencing the formation of MPOC [22,23]. Based on this hypothesis, an exogenous C addition culture experiment was conducted. Utilizing the FAPROTAX and FunGuild ecological function databases, this study primarily addresses the following key questions: (1) What is the impact of exogenous C addition on MPOC? (2) What is the effect of exogenous C addition on the structure and function of the soil microbial community? (3) Which microorganisms are the main contributors to MPOC formation following the addition of exogenous C?

2. Materials and Methods

2.1. Study Site and Sample Collection

Given consistent habitat conditions (slope position, gradient, and direction), zonal yellow soil and non-zonal limestone soil were selected as the tested soils in June 2020 from a maize field and a shrub forest in the Dashahe Nature Reserve in the southern Chinese province of Guizhou. This natural area is a humid monsoon climate in the transition from the north subtropical zone to the temperate zone, with an average altitude of 1252 m, an average annual temperature of 12.1 °C, annual precipitation of 1194 mm, and an annual sunshine duration of 1134 h. The average temperature in June 2020 was 24.6 °C, with a highest temperature of 29.2 °C and a lowest temperature of 20.7 °C.
“S”-shaped soil sampling is a commonly used soil sampling method, the basic principle of which is to ensure that the collected soil samples can represent the properties and characteristics of the soil in a certain area. During sample collection, an “S”-shaped sampling method was used to collect eight surface soil samples (0–20 cm) from each site, which were then mixed into one sample. After removing dead branches, fallen leaves, residual roots, and stones, the samples were placed into sterile zipper bags and brought back to the laboratory. They were then passed through a 2 mm sieve and partly stored at 4 °C and room temperature for mineralization culture and determining the soil’s physicochemical indicators (Table 1).
The litter was mainly koelreuteria koelreuteria, a dominant species of karst forest in southwest China. The seedlings of koelreuteria were potted from August to October 2020. The stems and leaves of koelreuteria were harvested three months later, and after drying and pulverizing, the material was passed through a 5 mm sieve to create litter samples. The litter’s carbon content was 500.66 g kg−1, and the nitrogen content was 19.70 g kg−1. Calcium carbonate was purchased from Zhenzhen Biotechnology Co., Ltd., in Shanghai, China.

2.2. Design of Experimental Treatments

This experiment consists of six treatments: (1) yellow soil (CY), (2) yellow soil with added litter (LY), (3) yellow soil with added calcium carbonate (CCY), (4) limestone soil (CL), (5) limestone soil with added litter (LL), and (6) limestone soil with added calcium carbonate (CCL). Each treatment has 18 replicates (6 sampling times, 3 samples each time), totaling 108 microcosms for mineralization culture (2 types of tested soils × 3 treatments × 18 replicates) (Figure 1).

2.3. Preparation of Litter and CaCO3 Addition

Soil samples stored in the refrigerator were titrated with 0.01 M HCl until no bubbles were observed, eliminating the inorganic C. Subsequently, the soil was dried and rinsed with distilled water to about 60% of the field water holding capacity. It was then placed at 25 °C for a pre-cultivation period of one week. The soil sample was removed and spread evenly on a plastic film. Crushed litter and CaCO3 were evenly sprinkled over the soil sample at a rate of 0.1 g per 50 g of soil [24]. The mixture was thoroughly mixed with a glass rod, and then, the plastic film was folded and gently shaken to ensure the added materials were fully mixed with the soil sample.

2.4. Incubation Experiment

SOC mineralization culture was conducted using the alkali absorption method. First, 50 g of the processed soil sample was placed into a 50 mL beaker, with the moisture adjusted to ~60% of the field’s water holding capacity using deionized water. The beaker was then placed at the bottom of a 1000 mL wide-mouth bottle. The sample was pre-cultured in an incubator at 25 °C for 7 days, sealed with a lid, and cultured in the dark at a constant temperature of 25 °C. Soil samples were collected at 5, 10, 20, 40, 60, and 80 days of culture, totaling 108 samples (6 treatments × 6 samplings × 3 replicates). Including the 4 samples taken before the culture, there were 112 samples in total. These samples were divided into two parts: one part was stored in a −70 °C freezer for soil microbial analysis (112 samples), and the other part was air-dried and finely ground for SOC fractionation (112 samples).

2.5. SOC Fractionation

SOC fractionation was carried out using the wet-sieving method described previously [25]. After air-drying and passing through a 2 mm sieve, soil samples were weighed and placed, together with 15 glass beads, on the top sieve of a microaggregate separator sieve set (top sieve mesh size: 250 μm; bottom sieve mesh size: 53 μm). The separator sieve set was allowed to vibrate vertically for 30 min; aggregates >250 μm remained on the top sieve, and microaggregates 53~250 μm remained on the bottom sieve, whereas clay and silt particles passed through the 53 μm sieve. Then, 25 mL of a 0.25 M CaCl2 solution was added to the bucket below the inferior sieve and centrifuged at 1730× g for 15 min to separate the clay from the silt particle fraction. Each fraction was transferred to an aluminum box and then steam-dried using a water bath, followed by drying in an oven at 60 °C for 12 h and fine grinding and passing through a 0.25 mm sieve. The >250 μm, 53~250 μm, and <53 μm fractions consisted of macroaggregates, microaggregates, and MPOC, respectively. The SOC content of each fraction was determined using an elemental analyzer (EA3000, Stockholm, Sweden, Shanghai Wolong Instrument Co., Ltd.).

2.6. Soil Physicochemical Measurement

The soil’s physicochemical properties were determined as described in the “Soil Agricultural Analysis” methods by Bao [26]. Soil pH was measured using the potentiometric method with a soil-to-liquid ratio of 1:2.5. Soil bulk density was determined using the cutting ring weighing method. SOC was measured using the oil bath heating potassium dichromate oxidation volumetric method. Total soil nitrogen was determined using the Kjeldahl distillation method. Total soil phosphorus was measured using the molybdenum antimony anti-colorimetric method.

2.7. Soil Microbial Determination and Treatment

2.7.1. DNA Extraction and PCR Amplification

Total DNA was extracted using the E.Z.N.A.® soil DNA kit (Omega Bio-tek, Norcross, GA, USA) according to the manufacturer’s instructions. DNA concentration and purity were determined using NanoDrop2000, and extraction quality was verified via 1% agarose gel electrophoresis. The bacterial 16S rRNA gene V3-V4 variable region was amplified using the primers 806R (5′-GGACTACHVGGTWTCTAAT-3′) and 338F (5′-ACTCCTACGGGGAGGCAGCAG-3′) [27], while the fungal ITS1 region was amplified using the primers ITS1F (5′-CTTGGTCATTTAGAGGAAGTAA-3′) and ITS2R (5′-GCTGCGTTCTTCATCGATGC-3′) [28]. PCR products were purified using the AxyPrep DNA Gel Extraction Kit (Axygen Biosciences, Union City, CA, USA) and quantified using the QuantiFluor™-ST assay (Promega, Madison, WI, USA). Purified products were double-end sequenced using the IlluminaMiSeq platform (Illumina, San Diego, CA, USA) at Shanghai Meiji BioPharmaceuticals Science and Technology Co., Ltd., Beijing, China.

2.7.2. Sequence Data Processing

Paired-end sequences were merged using FLASH V.1.2.11 and quality filtered using Trimmomatic V.0.33 (average quality score > 20). The Uchime algorithm removed chimeric sequences, yielding valid reads. Operational Taxonomic Units (OTUs) were identified using Uparse V.7.0 at a 97% similarity threshold. To reduce spurious OTUs, those with fewer than two sequences were discarded, and representative sequences for each OTU were selected. Bacterial and fungal taxonomic information was annotated using the RDP Ribosomal Database Project classifier based on the Silva 132 and Unite 8.0 databases, respectively, with a 70% confidence threshold. To minimize the read variability among samples, all samples were normalized based on the minimum sequence count.

2.7.3. Prediction of Soil’s Microbial and Ecological Functions

The soil bacterial community’s ecological function was assessed using FAPROTAX (http://www.ehbio.com/ImageGP/index.php/Home/Index/FAPROTAX.html, accessed on 9 September 2024). The bacterial OTU table, generated via high-throughput sequencing (338F and 806R), was compared with the functionally annotated FAPROTAX database to categorize functional ecological groups. Similarly, the soil fungal community’s ecological functions were estimated using FunGuild (http://www.funguild.org/, accessed on 9 September 2024). Common fungi obtained through high-throughput sequencing (ITS1T and ITS2R) were compared with the functionally annotated FunGuild database to identify eco-functional taxa.

2.8. Statistical Analysis

Statistical analysis was performed using SPSS (16.0). A two-way analysis of variance (ANOVA) was conducted to analyze the effects of exogenous matter addition and incubation time on MPOC. Means were compared using the least significant difference test and Student t-test, with the level of significance (α) set at 0.05. Linear regression in R (http://www.r-project.org/, accessed on 9 September 2024) was performed to investigate whether the soil’s microbial characteristics significantly predicted the MPOC estimate [29]. The decision coefficient R2 depended on the optimal simulation models. Ecological functions were applied to predict the main drivers of MPOC.

3. Results

3.1. Effect of Exogenous C Addition on MPOC

The MPOC content in calcareous soil was significantly higher than in yellow soil (Table 2). Among treatments with different exogenous C additions, those with litter addition (LL and LY) exhibited the highest MPOC contents, at 6.63 and 3.27 g kg−1, respectively. Those with calcium carbonate addition (CCL and CCY) followed, at 5.95 and 3.16 g kg−1, respectively. The treatments without exogenous carbon addition (CL and CY) displayed the lowest contents, at 5.37 and 2.83 g kg−1, respectively. From day 5 to day 80 of incubation, the MPOC contents in treatments CY, LY, CCY, CL, LL, and CCL increased by 0.43, 1.41, 1.24, 0.96, 2.06, and 1.38 g kg−1, respectively, with the LL and LY treatments showing the largest increases.

3.2. Effect of Exogenous C Addition on Soil Microorganisms

3.2.1. Impact of Exogenous C Addition on Soil’s Microbial Diversity and Community Composition

Significant differences in the soil’s bacterial and fungal diversity were observed among different treatments at various incubation periods (Table 3). As the incubation time extended, the soil’s bacterial diversity under each treatment showed an increasing trend, with the most significant increases observed in treatments LY, CCY, LL, and CCL (0.35, 0.36, 0.79, and 0.43, respectively). Meanwhile, the soil’s fungal diversity exhibited a decreasing trend, with the most significant reductions being found in treatments LY and LL (25.88% and 45.38%, respectively).
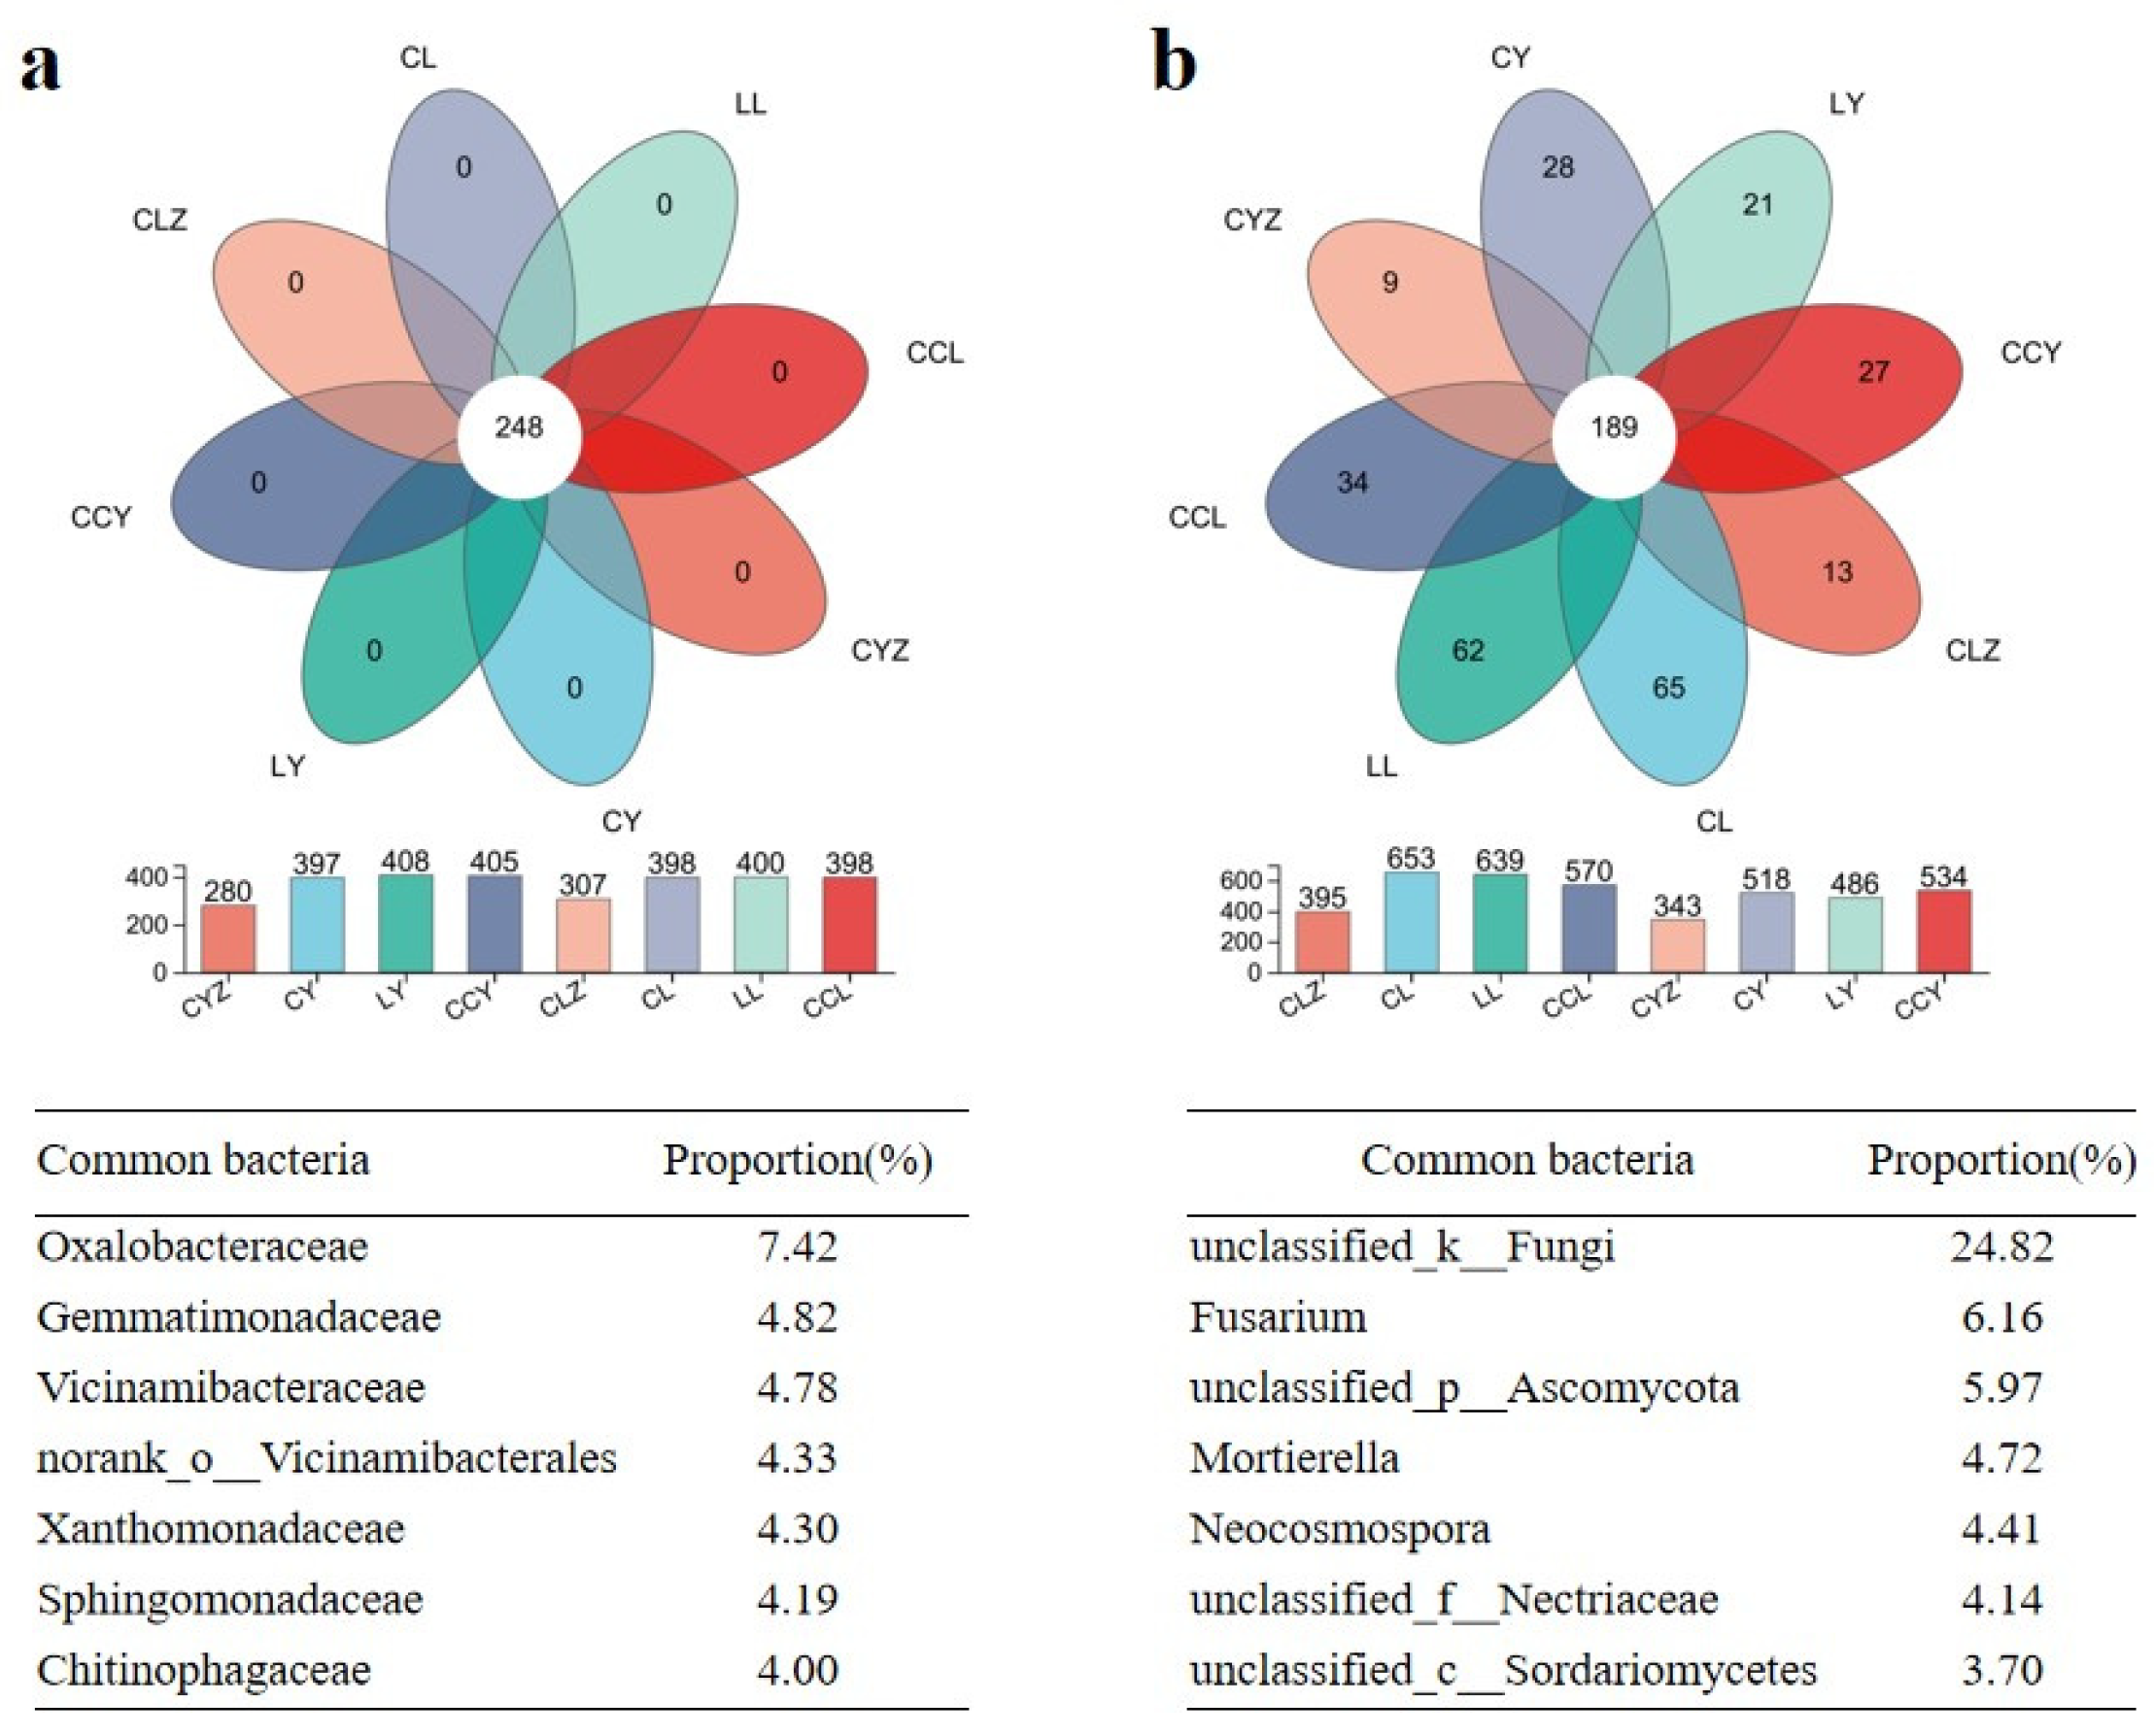
The soil contained a total of 248 common bacterial families and 189 common fungal genera. After incubation, the number of soil microbial communities in each treatment was higher than before (Figure 2). Among the bacterial communities, the Oxalobacteraceae family had the highest proportion, at 7.42%, followed by the Gemmatimonadaceae and Vicinamibacteraceae families, at 4.82% and 4.78%, respectively (Figure 2a). In the fungal communities, the unclassified_k_Fungi genus had the largest proportion, at 24.82%, followed by the Fusarium genus and the unclassified_p_Ascomycota genus, at 6.16% and 5.97%, respectively (Figure 2b).

3.2.2. Composition and Functions of the Common Microbial Communities

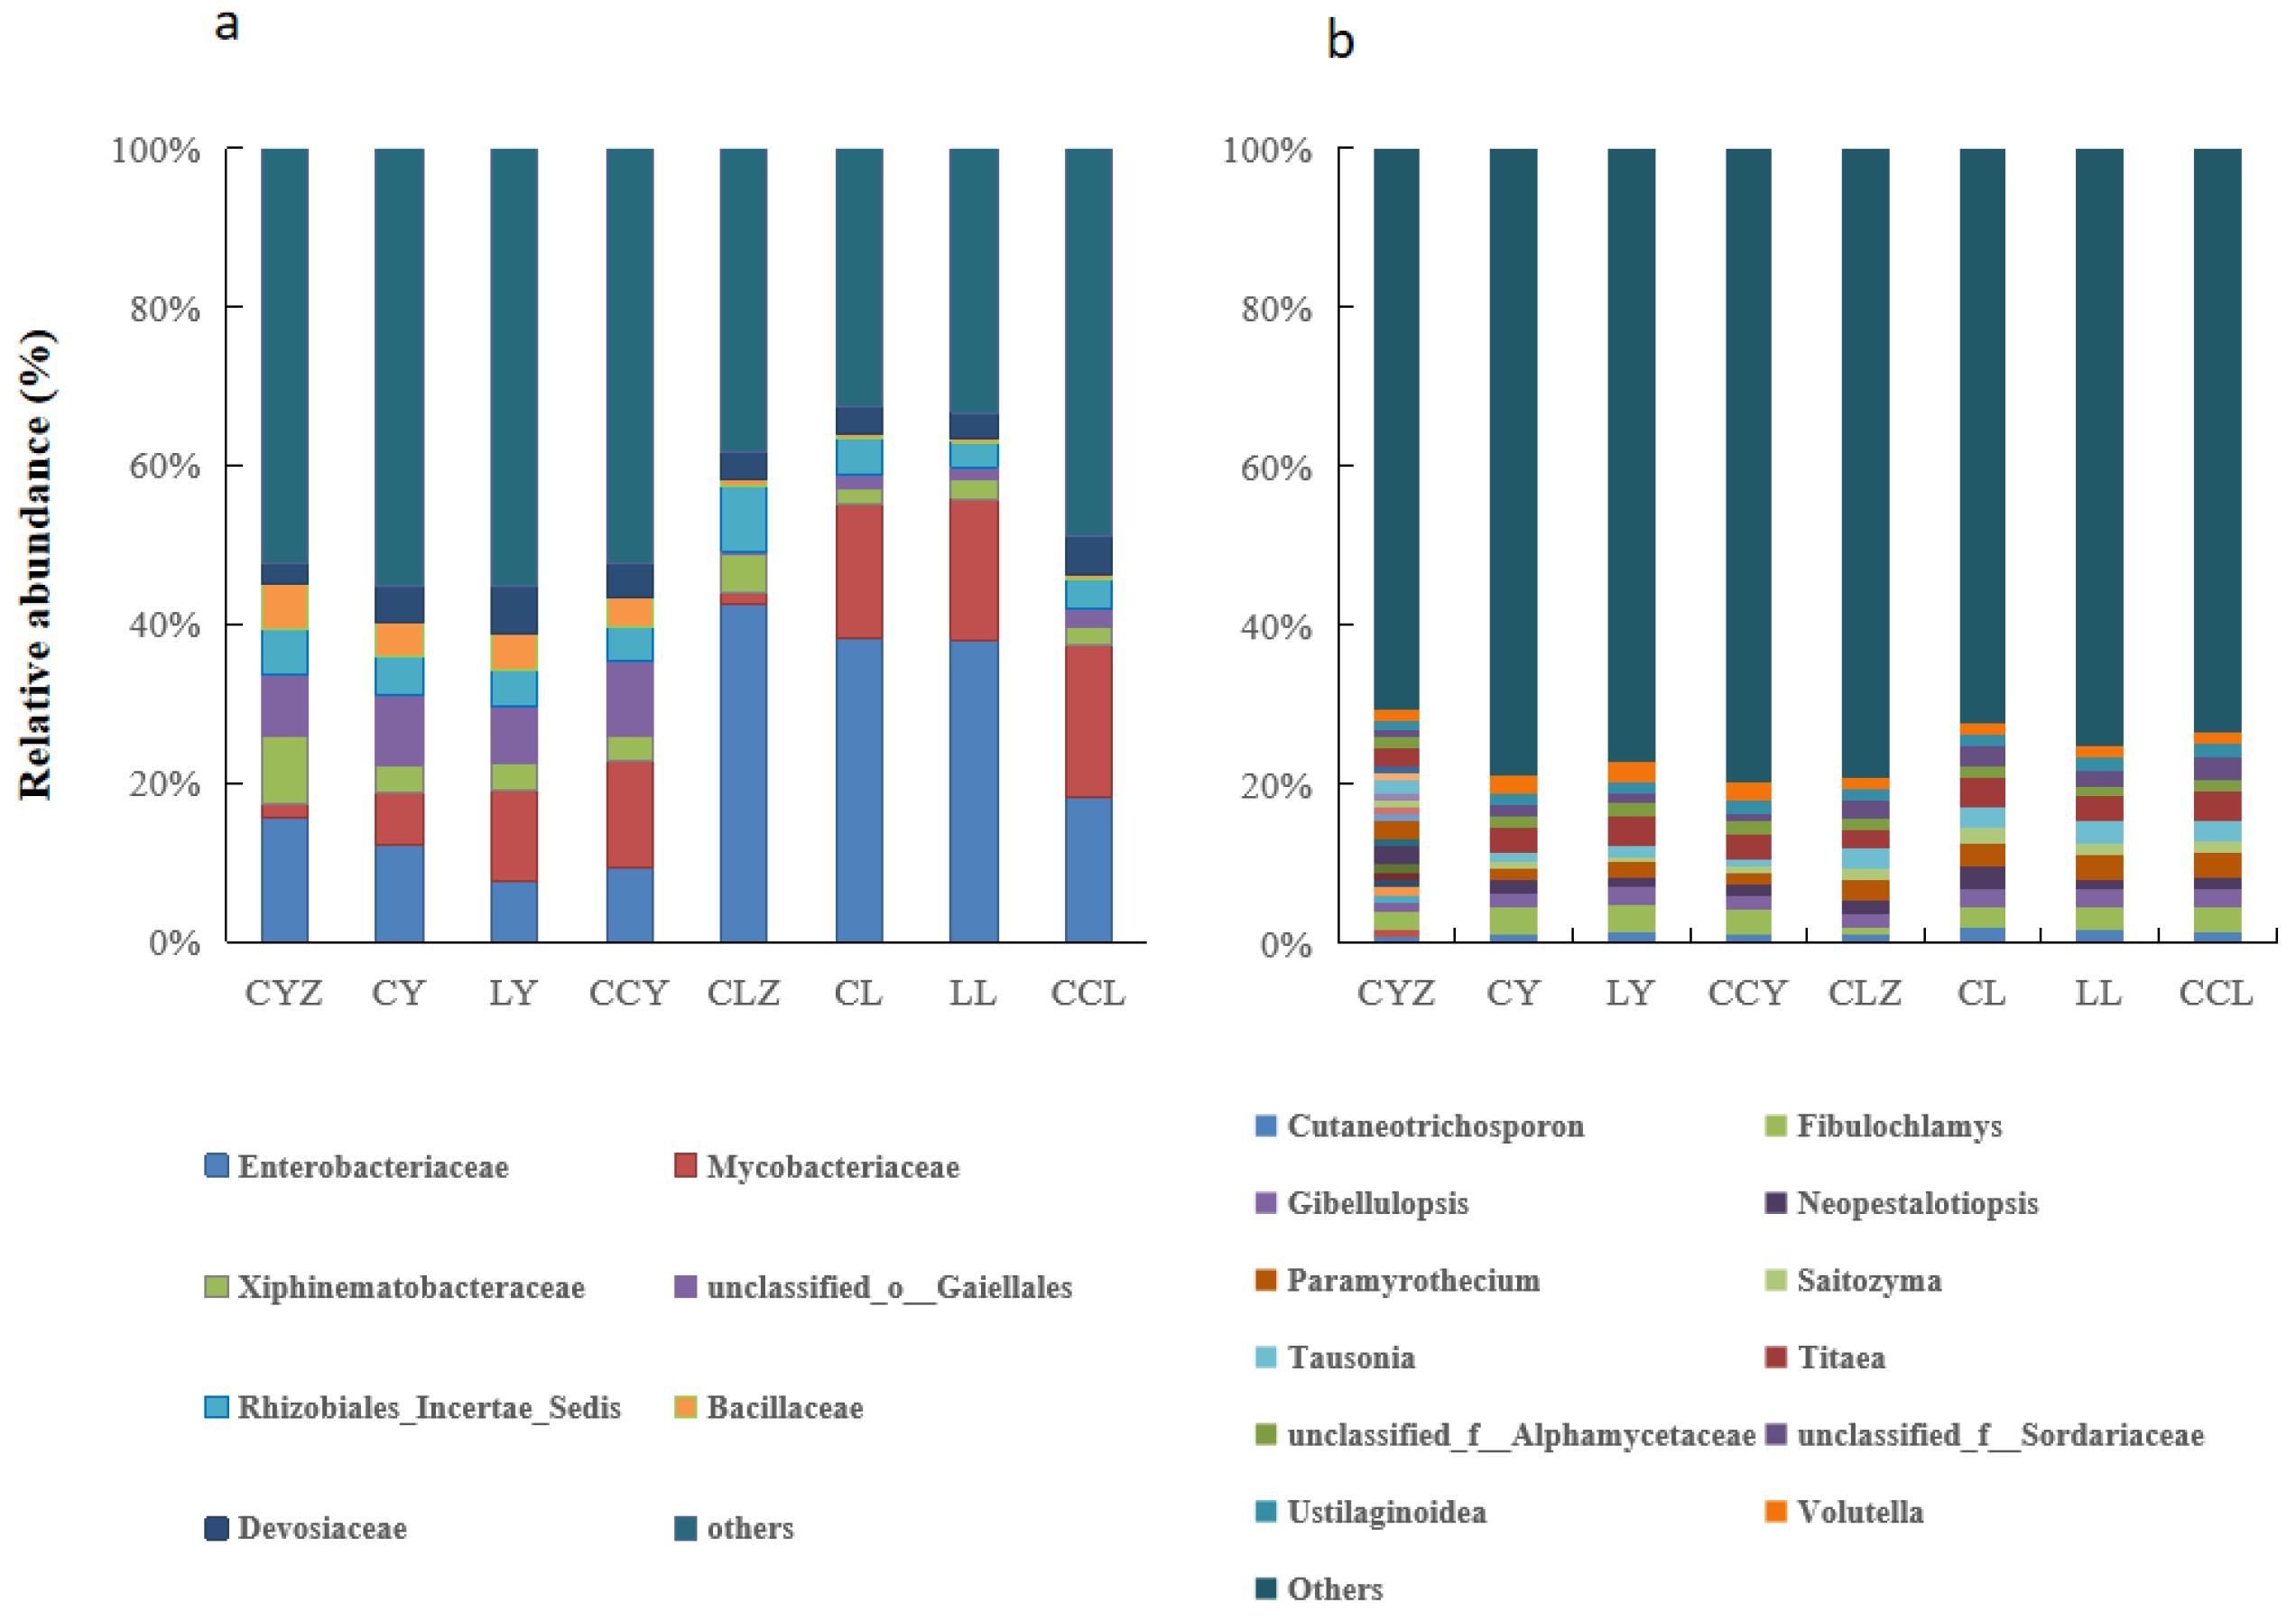
The proportion of common bacterial and fungal genera varied across treatments. Enterobacteriaceae was predominant in the CLZ, CL, and LL treatments, with proportions of 42.36%, 38.16%, and 37.76%, respectively. Mycobacteriaceae was predominant in the CL, LL, and CCL treatments, accounting for 16.73%, 17.63%, and 19.23%, respectively. The dominant bacterial families in each treatment were Enterobacteriaceae, Mycobacteriaceae, unclassified_o__Gaiellales, and Rhizobiales_Incertae_Sedis (Figure 3a). Fibulochlamys was the most dominant fungal genus in the CY, LY, and CCY treatments, with proportions of 3.04%, 3.31%, and 2.95%, respectively. Titaea was the most dominant in the CY, LY, and CCL treatments, with proportions of 3.04%, 3.31%, and 3.02%, respectively. The dominant fungal genera in each treatment were Fibulochlamys, Purpureocillium, Lecythophora, Paramyrothecium, Tausonia, and Titaea (Figure 3b).
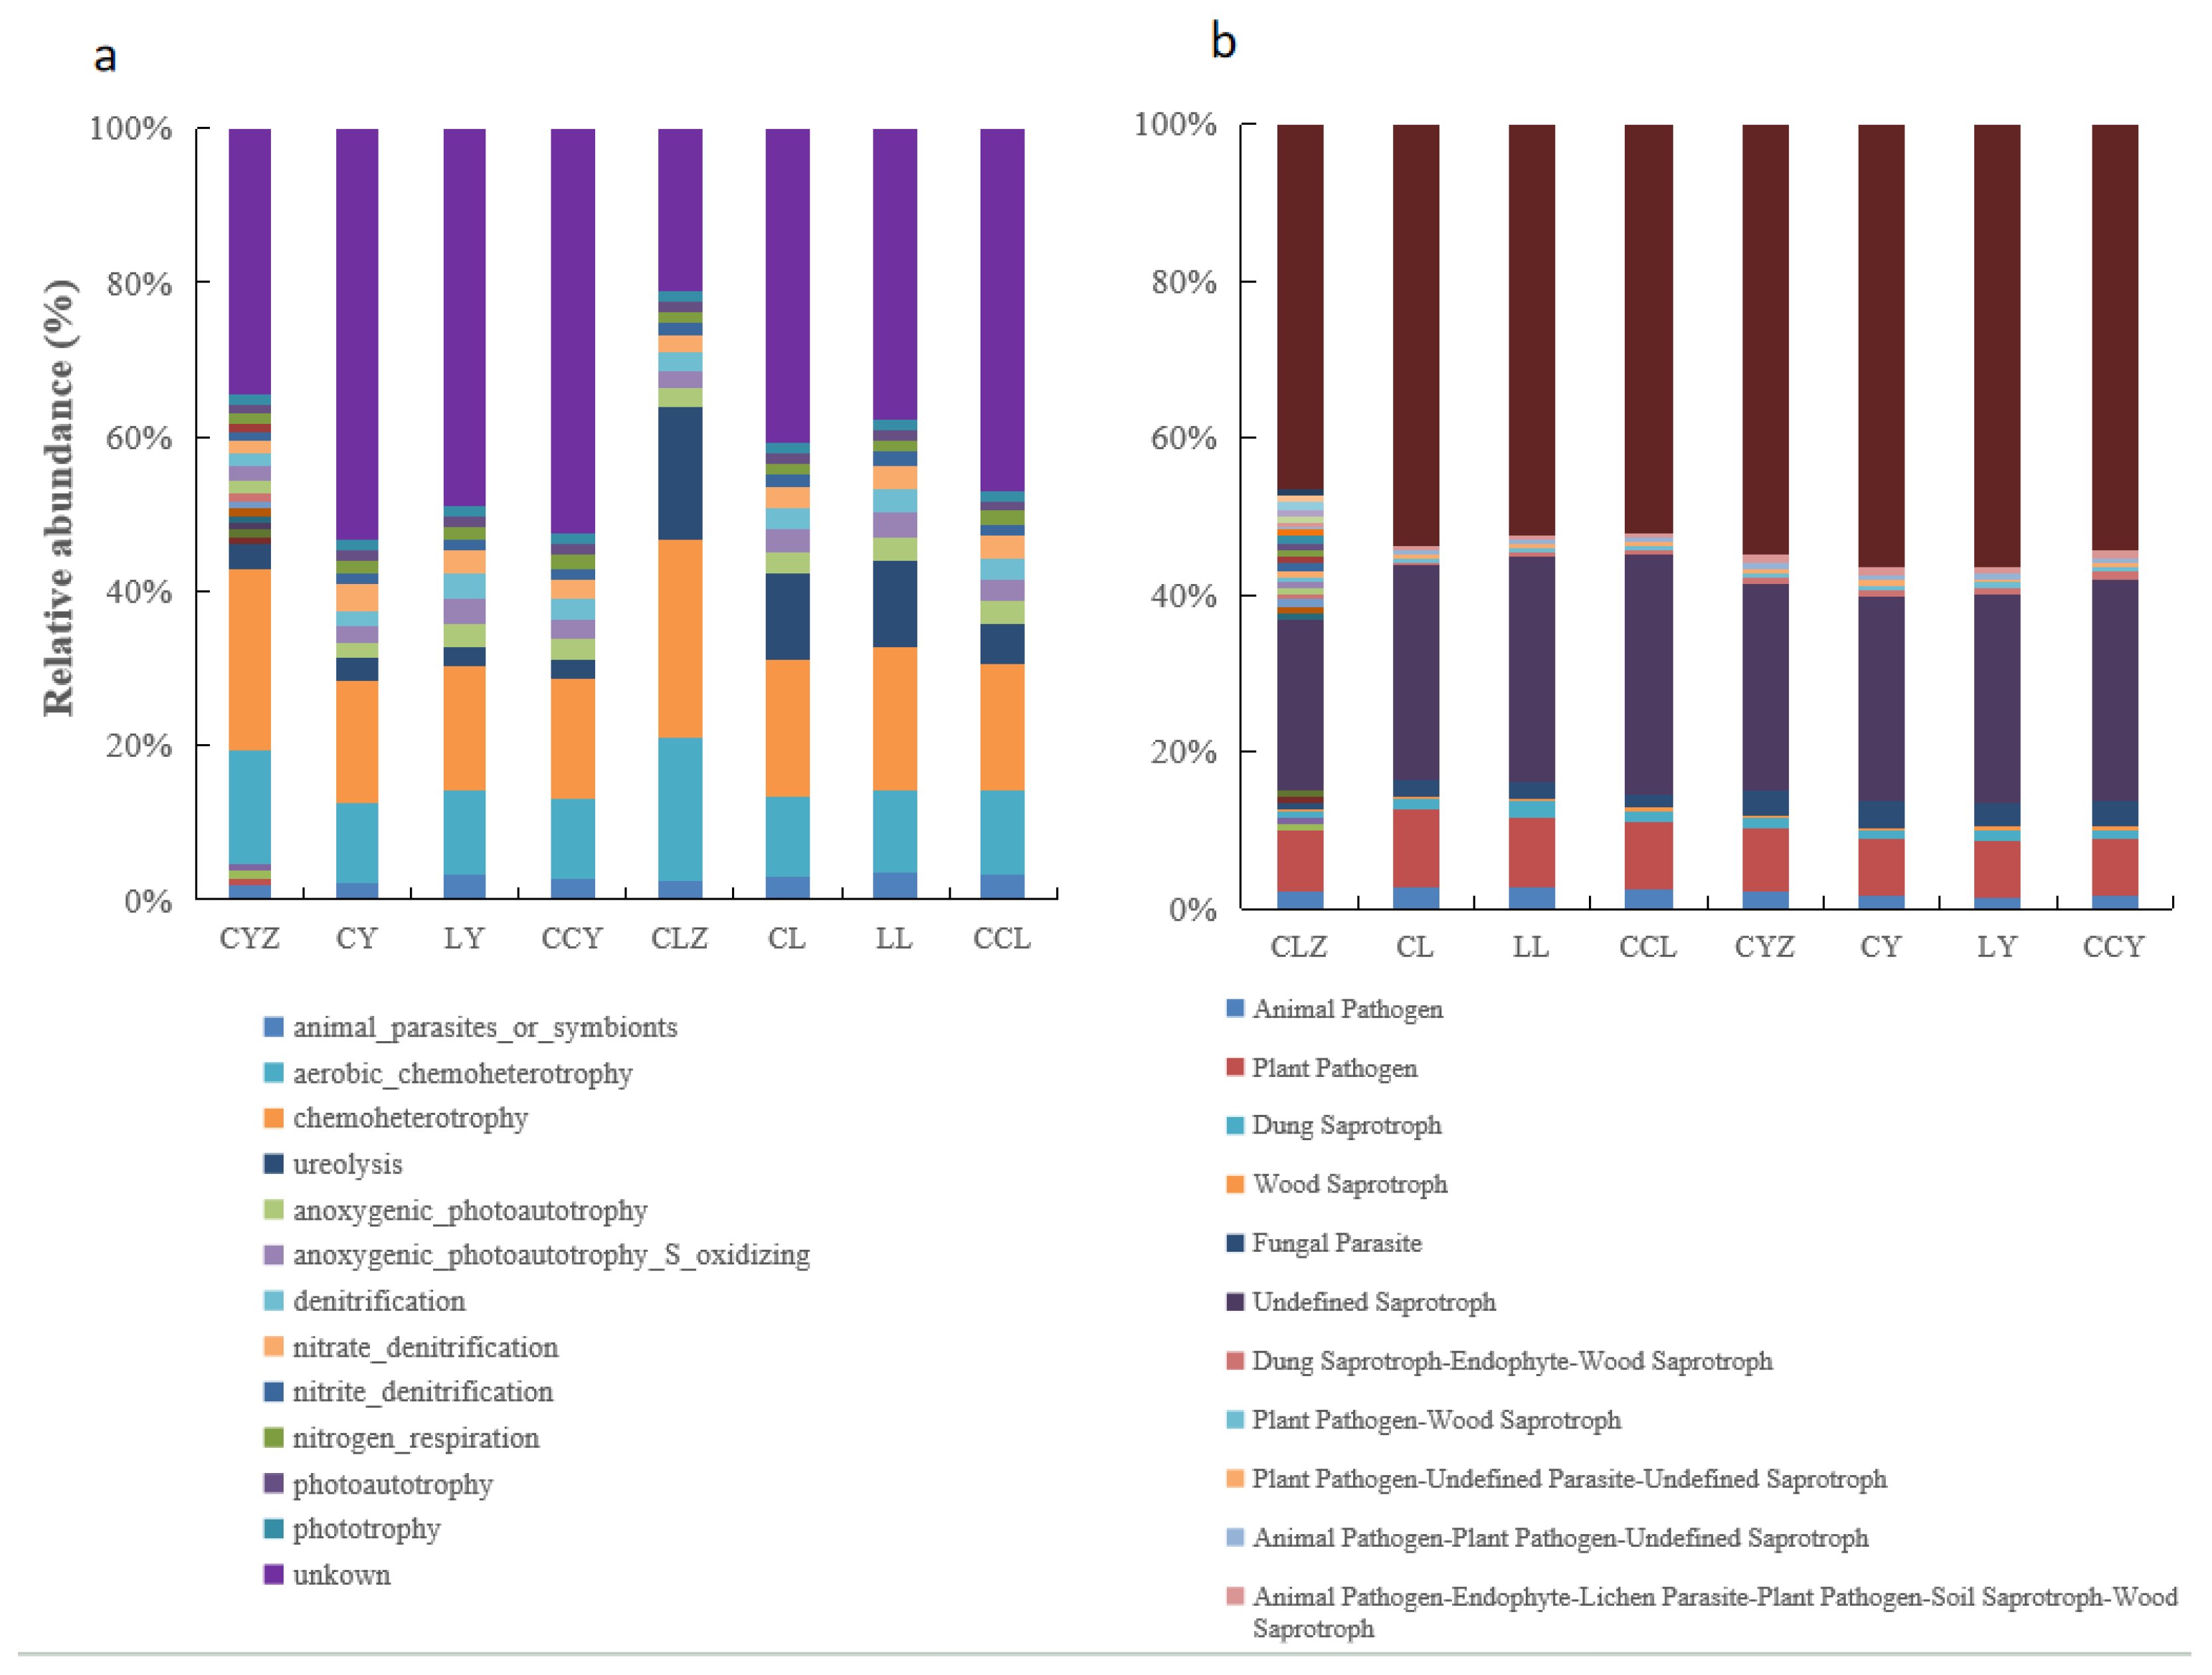
In predicting the bacterial ecological functions, 24 common bacterial families were found to have related functions (Table 4). Microbacteriaceae, Mycobacteriaceae, Streptomycetaceae, and Pseudomonadaceae families exhibited aerobic chemoheterotrophy and chemoheterotrophy. Planococcaceae had manganese oxidation, Oxalobacteraceae had ureolysis, and Polyangiaceae had cellulolysis. Acetobacteraceae and Xiphinematobacteraceae were animal parasites and human pathogenic bacteria. Nocardiaceae degraded hydrocarbons and carbohydrates, and Xanthomonadaceae participated in C and nitrogen cycles. Based on the similarity of ecological functions and abundance, the bacterial ecological functions were categorized into five groups: chemoheterotrophic, carbon cycle, nitrogen cycle, animal parasites and human pathogenic bacteria, and hydrocarbon and carbohydrate degradation functions, with relative abundances of 30.39%, 7.64%, 16.03%, 3.73%, and 0.94%, respectively (Figure 4a).
In the exploration of fungal ecological roles, 87 prevalent fungal genera were identified, each associated with specific functions (Table 5). Among these, three are animal pathogens (Metarhizium and others), eight are plant pathogens (Olpidium, Cylindrocarpon, and others), and three are ectomycorrhizal fungi (Lactarius and others), while three are fecal saprotrophs (Zopfiella and others), forty-one are undefined saprotrophs (Arthrobotrys, Emericellopsis, and others), and twenty-one are saprotrophic fungi (Mortierella, Didymella, and others). These ecological functions are grouped into eight categories: pathogen, saprotroph, fungal parasite, endophyte–saprotroph, pathogen–saprotroph, endophyte–fungal parasite–saprotroph, and endophyte–lichen parasite–pathogen–saprotroph, with respective proportions of 9.87%, 28.65%, 2.18%, 3.73%, 1.55%, 1.88%, 0.94%, and 1.01% (Figure 4b).

3.3. Effect of Soil Microbial Communities on MPOC

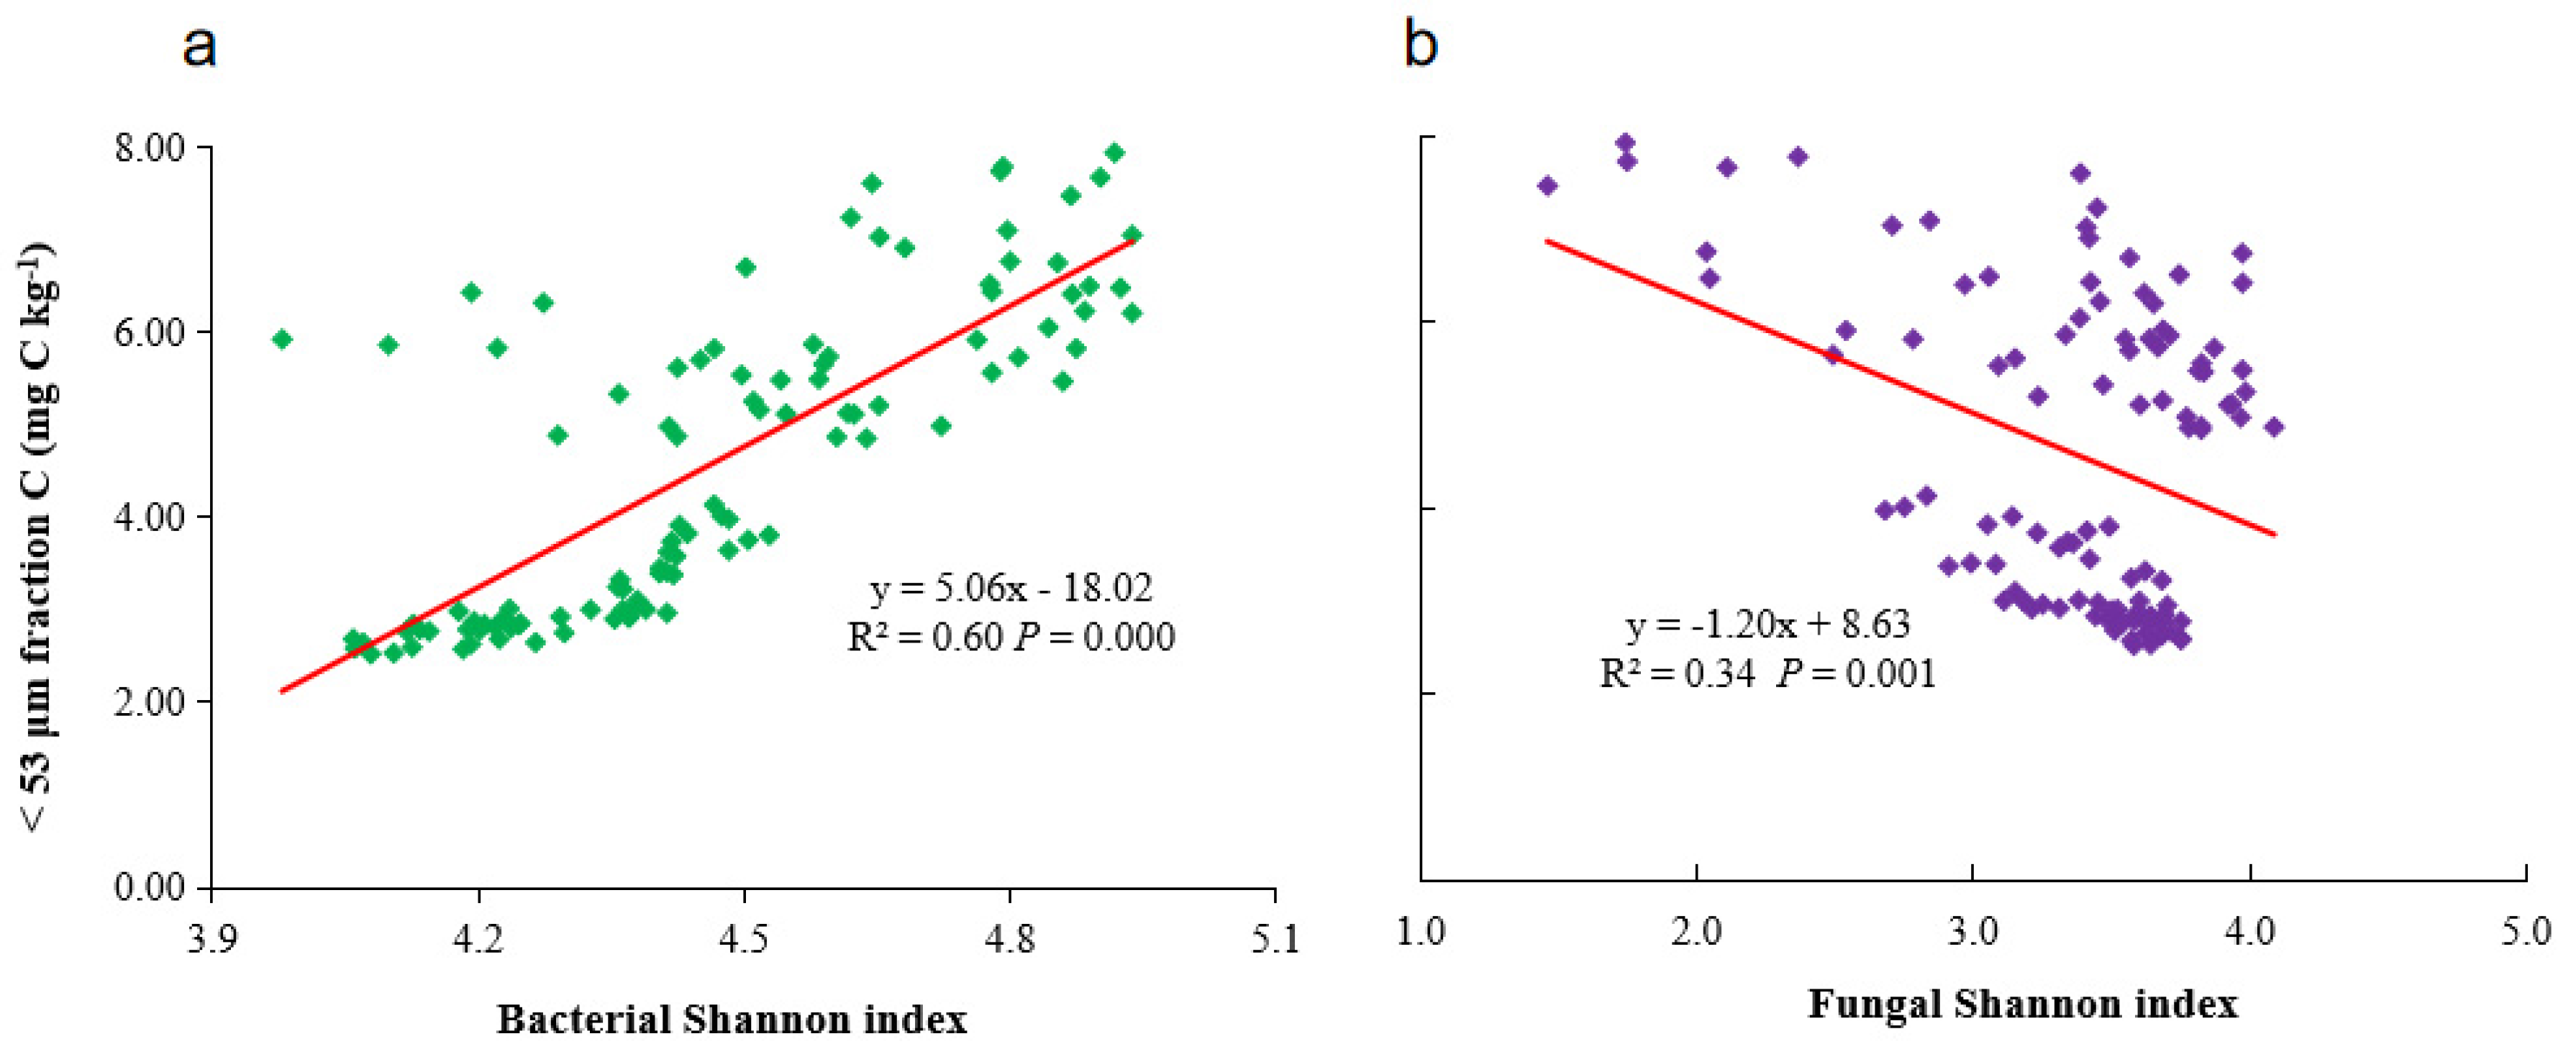
The relationship between MPOC and the soil’s bacterial Shannon diversity is significantly positively correlated (Figure 5a), with the correlation function relationship expressed as y = 5.06x − 18.02 (R2 = 0.60, p = 0.000), suggesting that as the bacterial diversity increases, so does MPOC. Conversely, the relationship between MPOC and the soil’s fungal Shannon diversity is significantly negatively correlated (Figure 5b), with the correlation function relationship expressed as y = −1.20x + 8.63 (R2 = 0.34, p = 0.001), indicating that as the fungal diversity increases, MPOC tends to decrease.

3.4. Ecological Functions of Major Microorganisms Affecting MPOC

A correlation analysis was performed on the abundance and MPOC of 248 common bacterial families and 189 common fungal genera, revealing significant correlations in 69 bacterial families and 72 fungal genera (Tables S1 and S2). Comparing the related functions of these families and genera (Table 4 and Table 5), 16 common bacterial families and 40 common fungal genera were found to have related functions (Table 6 and Table 7). All 16 bacterial families participated in five ecological functional groups, while the 40 fungal genera participated in seven groups. By considering the three MPOC-related functional groups and the composition proportions of common bacteria and fungi (Figure 3a,b), five main bacterial families (Microbacteriaceae, Mycobacteriaceae, Pseudomonadaceae, Streptomycetaceae, and Xanthomonadaceae) and seven major fungal genera (Cylindrocarpon, Leohumicola, Metarhizium, Neobulgaria, Neopestalotiopsis, Olpidium, and Tetracladium) were identified as significant contributors to the soil’s mineral particulate organic carbon.

4. Discussion

4.1. Changes in MPOC under Exogenous C Addition

The dynamics of soil C stocks rely on the balance between the inputs and outputs of exogenous C. As a significant contributor to the soil C pool, even minor changes in exogenous C addition can affect the stability and equilibrium of this pool. The effect of exogenous C on the soil C pool is primarily influenced by its inherent quality and external environmental changes [30,31]. In the current study of limestone and yellow soils, litter addition significantly increased the MPOC content compared to calcium carbonate addition, indicating that litter serves as a major source of SOC. This occurs because litter introduces its own microorganisms into the soil, and the soil had a slightly acidic pH (pH = 6.34), which favored the development of microorganisms, accelerating decomposition [32,33] and promoting organic matter fixation, which in turn increases the MPOC content. Additionally, litter provides various nutrient elements, enhancing the abundance and activity of soil microorganisms and further facilitating MPOC accumulation. Moreover, the quality and decomposition rates of litter and calcium carbonate differ. Litter, as a macromolecular substance, is readily decomposed by microorganisms, whereas calcium carbonate, composed of smaller molecules encapsulated by calcium ions, resists decomposition and release [34,35].
This study observed an increase in MPOC content over the incubation period. As a stable and resistant component of SOC, MPOC is not easily decomposed or utilized, functioning as a key contributor to SOC stability [23,36]. When exogenous carbon is incorporated into MPOC, it becomes fixed, leading to an increase in stable SOC fractions, particularly in limestone soils treated with litter [37]. The MPOC forms organo–mineral complexes through interactions with clay minerals, which, due to their strong physical, chemical, and biochemical properties [38], protect these complexes from microbial degradation, allowing them to persist in the soil as refractory SOC. The addition of exogenous C increases the aromaticity of the matrix, thereby reducing its degradability. This results in suppressed microbial abundance and enzyme activity, lowering the soil respiration and limiting the microbial C pump efficiency. Consequently, the intracellular and extracellular processes involved in carbon transformation and modification are weakened, ultimately leading to reduced microbial decomposition and a net accumulation of OC and microbial C [39]. Moreover, microorganisms combine with soil mineral particles through extracellular polymeric substances and/or protect OC through filamentous growth by forming metabolites with long turnover times (e.g., polyhydroxybutyrate) or cellular components (e.g., melanin) [40]. These small-molecule compounds, such as non-methanogenic volatile organic compounds, readily bind to mineral surfaces, where they are shielded from mineralization [41], further enhancing MPOC storage in the soil.

4.2. Effects of Exogenous C Addition on Soil Microbial Communities

Soil microorganisms play a pivotal role in the soil biological system, shaped by both the soil’s habitat and the overlying vegetation. Their species diversity and community composition are key indicators of microbial community stability, making them essential metrics for assessing soil quality and ecological restoration efforts [42,43]. Exogenous C input is a primary source of nutrients in soil microecosystems. The type, amount, and frequency of this input, along with soil’s physical and chemical properties, create distinct environments for soil microorganisms. These conditions directly affect soil’s microbial biomass and quantity [44], microbial diversity [45], species composition, and community structure [46], establishing a synergistic relationship between exogenous C, soil, and microorganisms [47].
In this study, as the culture duration increased, the Shannon index of soil bacteria in each treatment exhibited an upward trend, while the soil fungi demonstrated a downward trend. Previous research has consistently shown that the introduction of exogenous C enhances soil’s bacterial diversity [45,48], whereas the trend in fungal diversity is less consistent [49]. This disparity is attributed to the initial stage of culture, where the addition of exogenous C to the soil facilitated the rapid dissolution of readily available OC, providing ample C and nitrogen sources for soil microorganisms to decompose and utilize, thereby promoting microbial growth and diversity [44]. As the incubation period extended, the availability of easily decomposable organic matter in the soil decreased, with a concurrent increase in the proportion of more complex substances such as cellulose and lignin. This led to limited nutrient availability for soil microorganisms [50]. However, at the onset of matrix utilization in the soil, fungi took the lead, actively decomposing suitable nutrients within the matrix. With an abundance of nutrients, these fungi grew rapidly, and their hyphae penetrated plant cell walls to decompose complex substances, subsequently providing energy for the growth and reproduction of bacteria during the later stages of incubation [51,52]. Consequently, the bacterial diversity was sustained or increased throughout the incubation period, while specific functional groups of fungi perished after completing their respective tasks and when these unique nutrients were depleted [53], resulting in a decline in fungal diversity as the incubation period extended.
In this study, Oxalobacteraceae and unclassified_k_Fungi dominate in the karst soil. This is mainly because some bacteria in the Oxalobacteraceae family can promote the dissolution of carbonate rocks by producing oxalic acid, which helps in the formation and evolution of karst landforms. Additionally, these bacteria can utilize and metabolize organic acids such as oxalic acid, which not only aids in their own growth and survival but also affects the chemical properties of the soil and the cycling of organic matter. Moreover, these bacteria can tolerate the extreme environmental conditions of karst soil, contributing to the stability of the soil ecosystem [54]. The unclassified_k_Fungi microorganisms play a key role in the carbon fixation process in karst soil. Through decomposition and synthesis metabolism, they can both release carbon into the atmosphere and store external carbon in the soil in the form of microbial residues. This process helps maintain the stability and sequestration of soil organic carbon, which is of great significance for the carbon cycle in an ecosystem [55].
A significant positive correlation was observed between MPOC and the soil’s bacterial Shannon diversity, suggesting that increased bacterial diversity leads to a significant increase in MPOC, enhancing the stability of SOC and particularly accelerating MPOC content. Conversely, the MPOC content showed a significant negative correlation with the soil’s fungal Shannon diversity across various treatments, indicating that as the fungal diversity increased, MPOC decreased. This suggests that soil fungi expedite the mineralization and decomposition of SOC, consequently reducing MPOC. Sheng and Zhu [56] found that adding biochar increased the bacterial community diversity, reduced CO2 emissions, and enhanced soil C fixation. Gai et al. [57] also observed a decreasing trend in fungal diversity and an increased risk of soil C loss with the addition of organic matter under subtropical bamboo forests, aligning with this study’s results. However, Li et al. [30] conducted a short-term incubation study that revealed contrasting findings: the soil’s bacterial diversity positively contributed to both C emission and C storage, while the soil’s fungal diversity promoted C storage and inhibited C emission. These disparities may stem from variations in experimental design, soil types, environmental conditions, or the specific organic materials added to the soil. The complex interplay between soil microorganisms and C cycling is influenced by numerous factors and requires further investigation to fully comprehend the underlying mechanisms.

4.3. Main Microorganisms Affecting MPOC

Microorganisms, particularly soil microbes, play a significant role in ecosystems by driving nutrient cycles such as C and nitrogen. The composition and functions of the soil microbial community are crucial for these processes, providing essential geo-biochemical cycling functions and regulating soil ecosystem functions [58,59].
In this study, the function and abundance of soil bacteria were examined in relation to MPOC. Three functional groups of bacteria were identified, chemoheterotrophic, C cycle, and nitrogen cycle, accounting for 30.39%, 7.64%, and 16.03% of the total abundance, respectively. The primary bacterial families contributing to MPOC are Microbacteriaceae, Mycobacteriaceae, Pseudomonadaceae, Streptomycetaceae, and Xanthomonadaceae. Microbacteriaceae, Mycobacteriaceae, Pseudomonadaceae, and Streptomycetaceae are involved in soil chemoheterotrophy, breaking down large molecular organic exogenous C substrates such as starch, fats, proteins, nucleic acids, and phospholipids into small molecular organic compounds, which are then mineralized into inorganic salts. Xanthomonadaceae is involved in soil’s C and nitrogen cycles. Previous studies have also highlighted the roles of Bacteroidetes and Fimicutes in the decomposition of SOC and C cycling [60], as well as Thaumarchaeota, Acidobacteria, Crenarchaeota, Planctomycetes, and Nitrospirae in soil C cycling functions [61].
Besides the bacterial communities, this study also identified seven major fungal genera associated with soil mineral-associated organic carbon: Cylindrocarpon, Leohumicola, Metarhizium, Neobulgaria, Neopestalotiopsis, Olpidium, and Tetracladium. These fungal genera function as pathogens, saprotrophs, fungal parasites, endophyte–saprotrophs, endophyte–pathogen–saprotrophs, and endophyte–lichen parasite–pathogen–saprotrophs, with relative abundances of 9.87%, 28.65%, 2.18%, 3.73%, 1.88%, 0.94%, and 1.01%, respectively. Saprotrophic fungi are crucial in this study due to their significant role in litter decomposition, as evidenced by research highlighting their involvement in breaking down recalcitrant substances in wood and leaves, such as cellulose and lignin, through the production of extracellular enzymes. This enzymatic activity converts these complex materials into glucose and other small molecules for nutrition. Furthermore, saprotrophic fungi also decompose animal remains [62]. Additionally, essential elements like nitrogen, sulfur, potassium, calcium, and the iron cycle from organic to inorganic forms through decomposition by saprotrophic fungi [63,64].

5. Conclusions

This study revealed a consistent upward trend in MPOC across all treatments over time. Furthermore, MPOC exhibited a significant positive correlation with the soil’s bacterial diversity and a negative correlation with its fungal diversity. By employing the FAPROTAX and FunGuild ecological function prediction methods, this study identified five crucial bacterial families that are primarily associated with MPOC: Microbacteriaceae, Mycobacteriaceae, Pseudomonadaceae, Streptomycetaceae, and Xanthomonadaceae. Additionally, seven fungal genera—Cylindrocarpon, Leohumicola, Metarhizium, Neobulgaria, Neopestalotiopsis, Olpidium, and Tetracladium—significantly influenced MPOC. These findings highlight the pivotal role of specific bacterial and fungal taxa in the formation and preservation of MPOC, offering valuable insights for strategies aimed at enhancing carbon sequestration.

Supplementary Materials

The following supporting information can be downloaded at: https://www.mdpi.com/article/10.3390/agronomy14102333/s1, Table S1: Correlation analysis between MPOC and common bacteria (p ≤ 0.01); Table S2: Correlation analysis between MPOC and common fungi (p ≤ 0.01).

Author Contributions

Conceptualization, L.Z. and Y.W.; methodology, C.Z.; software, L.Z. and C.Z.; validation, L.Z. and C.Z.; formal analysis, L.Z.; investigation, L.Z.; data curation, C.Z. and G.C.; writing—original draft preparation, L.Z.; writing—review and editing, Y.L.; supervision, G.C., W.S., and L.Y.; project administration, G.C., W.S. and L.Y.; funding acquisition, G.C., W.S. and L.Y. All authors have read and agreed to the published version of the manuscript.

Funding

This research was funded by Guizhou Province Science and Technology Plan Project (No. Qiankehe foundation-ZK [2024] Major 092), the National Natural Science Foundation of China (No. 42161052), and Guizhou Provincial Science and Technology Support Program (No. Qiankehe Support [2022] General 200).

Data Availability Statement

The original contributions presented in this study are included in the article/Supplementary Materials, and further inquiries can be directed to the corresponding author.

Conflicts of Interest

The authors declare no conflicts of interest.

References

  1. Angst, G.; Mueller, K.E.; Castellano, M.J.; Vogel, C.; Wiesmeier, M.; Mueller, C.W. Unlocking complex soil systems as carbon sinks: Multi-pool management as the key. Nat. Commun. 2023, 14, 2679. [Google Scholar] [CrossRef] [PubMed]
  2. Hicks, P.C.E.; Castanha, C.; Porras, R.C. The whole soils carbon flux in response to warming. Science 2017, 355, 1420–1423. [Google Scholar] [CrossRef] [PubMed]
  3. Xue, Z.J.; Li, X.Y.; Jiao, L.; Yang, Y.; Dou, Y.X.; Wang, B.R.; Huang, Q.; Liu, C.H.; Qu, T.T.; Zhou, Z.C.; et al. Advance in the formation and stabilization mechanisms of soil mineral-associated organic carbon. J. Soil Water Conserv. 2023, 37, 12–23. [Google Scholar]
  4. Basile, D.I.; Balesdent, J.; Pellerin, S. Reviews and syntheses: The mechanisms underlying carbon storage in soil. Biogeosciences 2020, 17, 5223–5242. [Google Scholar] [CrossRef]
  5. Yu, G.R.; Zhang, L.; He, H.L.; Yang, M. Process-based model and simulation system of dynamic change and spatial variation in large-scale terrestrial ecosystems. J. Appl. Ecol. 2021, 32, 2653–2665. [Google Scholar]
  6. Zhang, L.M.; Xu, M.G.; Lou, Y.L.; Wang, X.L.; Li, Z.F. Soil organic carbon fractionation methods. Soil Fertil. Sci. China 2014, 4, 1–6. [Google Scholar]
  7. Sokol, N.W.; Sanderman, J.; Bradford, M.A. Pathways of mineral-associated soil organic matter formation: Integrating the role of plant carbon source, chemistry, and point of entry. Glob. Chang. Biol. 2019, 25, 12–24. [Google Scholar] [CrossRef]
  8. Jilling, A.; Keiluweit, M.; Gutknecht, J.L.M. Priming mechanisms providing plants and microbes access to mineral-associated organic matter. Soil Biol. Boichem. 2021, 158, e108265. [Google Scholar] [CrossRef]
  9. Bramble, D.S.E.; Ulrich, S.; Schöning, I.; Mikutta, R.; Brandt, L.; Poll, C.; Kandeler, E.; Mikutta, C.; Konrad, A.; Siemens, J.; et al. Formation of mineral-associated organic matter in temperate soils is primarily controlled by mineral type and modified by land use and management intensity. Glob. Chang. Biol. 2024, 30, e17024. [Google Scholar] [CrossRef]
  10. Siebielec, S.; Siebielec, G.; Woźniak, M. Potential of using digestate to regenerate soil and stimulate its biological life. Pol. J. Agron. 2024, 52, 157–170. [Google Scholar]
  11. Różewicz, M.; Wyzińska, M.; Grabiński, J. Effect Application of Apple Pomace on Yield of Spring Wheat in Potting Experiment. Agronomy 2023, 13, 1526. [Google Scholar] [CrossRef]
  12. Ukalska-Jaruga, A.; Siebielec, G.; Siebielec, S.; Pecio, M. The Impact of Exogenous Organic Matter on Wheat Growth and Mineral Nitrogen Availability in Soil. Agronomy 2020, 10, 1314. [Google Scholar] [CrossRef]
  13. Kuzyakov, Y.; Friedel, J.K.; Stahr, K. Review of mechanisms and quantification of priming effects. Soil Biol. Biochem. 2000, 32, 1485–1498. [Google Scholar] [CrossRef]
  14. Liu, A.X.J.; Finley, B.K.; Mau, R.L.; Schwartz, E.; Dijkstra, P.; Bowker, M.A.; Hungate, B.A. The soil priming effect: Consistent across ecosystems, elusive mechanisms. Soil Biol. Biochem. 2020, 140, 1–12. [Google Scholar] [CrossRef]
  15. Liu, L.; Gundersen, P.; Zhang, T.; Mo, J. Effects of phosphorus addition on soil microbial biomass and community composition in three forest types in tropical China. Soil Biol. Biochem. 2012, 44, 31–38. [Google Scholar] [CrossRef]
  16. Klink, S.; Keller, A.B.; Wild, A.J.; Baumert, V.L.; Gube, M.; Lehndorff, E.; Meyer, N.; Mueller, C.W.; Phillips, R.P.; Pausch, J. Stable isotopes reveal that fungal residues contribute more to mineral-associated organic matter pools than plant residues. Soil Biol. Biochem. 2022, 168, 108634. [Google Scholar] [CrossRef]
  17. Nonthijun, P.; Mills, N.; Mills, N.; Yongsawas, R.; Sansupa, C.; Suwannarach, N.; Jaikang, C.; Motanated, K.; Chayakdee, P.; Jongjitngam, S.; et al. Seasonal Variations in Fungal Communities on the Surfaces of Lan Na Sandstone Sculptures and Their Biodeterioration Capacities. J. Fungi 2023, 9, 833. [Google Scholar] [CrossRef]
  18. Arunrat, N.; Kongsurakan, P.; Solomon, L.W.; Sereenonchai, S. Fire Impacts on Soil Properties and Implications for Sustainability in Rotational Shifting Cultivation: A Review. Agriculture 2024, 14, 1660. [Google Scholar] [CrossRef]
  19. Andrew, T.N.; Emanuel, G.; Erland, B. Soil carbon and microbes in the warming tropics. Funct. Ecol. 2022, 10, 1365–1406. [Google Scholar]
  20. Cotrufo, M.F.; Haddix, M.L.; Kroeger, M.E.; Stewart, C.E. The role of plant input physical-chemical properties, and microbial and soil chemical diversity on the formation of particulate and mineral-associated organic matter. Soil Biol. Biochem. 2022, 168, 108648. [Google Scholar] [CrossRef]
  21. Song, Y.Y.; Liu, C.; Song, C.C.; Wang, X.W.; Ma, X.Y.; Gao, J.L.; Gao, S.Q.; Wang, L.L. Linking soil organic carbon mineralization with soil microbial and substrate properties under warming in permafrost peatlands of Northeastern China. Catena 2021, 203, 105348. [Google Scholar] [CrossRef]
  22. Witzgall, K.; Vidal, A.; Schubert, D.I.; Schweizer, S.A.; Buegger, F.; Pouteau, V.; Chenu, C.; Mueller, C.W. Particulate organic matter as a functional soil component for persistent soil organic carbon. Nat. Commun. 2021, 12, 4115. [Google Scholar] [CrossRef] [PubMed]
  23. Louca, S.; Parfrey, L.W.; Doebeli, M. Decoupling function and taxonomy in the global ocean microbiome. Science 2016, 353, 1272–1277. [Google Scholar] [CrossRef] [PubMed]
  24. Ge, Y.H. Organic Carbon Mineralization and Microbial in Typical Karst Soil as a Response to the Exogenous Addition of Calcium Carbonate and Organic Substrate. Master’s Thesis, Hunan Agricultural University, Changsha, China, 2012. [Google Scholar]
  25. Six, J.; Conant, R.T.; Paustian, K.; Paul, E.A. Stabilization mechanisms of soil organic matter: Implications for C-saturation of soils. Plant Soil 2002, 241, 155–176. [Google Scholar] [CrossRef]
  26. Bao, S.D. Soil Agrochemical Analysis, 3rd ed.; China Agriculture Press: Beijing, China, 2001; pp. 3–109. [Google Scholar]
  27. Xu, N.; Tan, G.; Wang, H.; Gai, X. Effect of biochar additions to soil on nitrogen leaching, microbial biomass and bacterial community structure. Eur. J. Soil Biol. 2016, 74, 1–8. [Google Scholar] [CrossRef]
  28. Adams, R.I.; Miletto, M.; Taylor, J.W.; Bruns, T. D Dispersal in microbes: Fungi in indoor air are dominated by outdoor air and show dispersal limitation at short distances. ISME J. 2013, 7, 1262–1273. [Google Scholar] [CrossRef]
  29. Yergeau, E.; Bokhorst, S.; Huiskes, A.H.L.; Boschker, H.T.S.; Aerts, R.; Kowalchuk, G.A. Size and structure of bacterial, fungal and nematode communities along an Antarctic environmental gradient. FEMS Microbiol. Ecol. 2007, 59, 436–451. [Google Scholar] [CrossRef]
  30. Li, Q.R.; Tian, Y.Q.; Zhang, X.Y.; Xu, X.L.; Wang, H.M.; Yakov, K. Labile carbon and nitrogen additions affect soil organic matter decomposition more strongly than temperature. Appl. Soil Ecol. 2017, 114, 152–160. [Google Scholar] [CrossRef]
  31. Zhang, M.; Dong, L.G.; Fei, S.X.; Zhang, J.W.; Jiang, X.M.; Wang, Y.; Yu, X. Responses of Soil Organic Carbon Mineralization and Microbial Communities to Leaf Litter Addition under Different Soil Layers. Forests 2021, 12, 170–185. [Google Scholar] [CrossRef]
  32. Zheng, H.P.; Yang, T.J.; Bao, Y.Z.; He, P.P.; Yang, K.M.; Mei, X.L.; Wei, Z.; Xu, Y.C.; Shen, Q.R.; Banerjee, S. Network analysis and subsequent culturing reveal keystone taxa involved in microbial litter decomposition dynamics. Soil Biol. Biochem. 2021, 157, 108230. [Google Scholar] [CrossRef]
  33. Joanna, R.; Jennifer, K.; Ember, M.; Hayden, S.; Edward, B. Roots selectively decompose litter to mine nitrogen and build new soil carbon. Ecol. Lett. 2023, 27, e14331. [Google Scholar]
  34. Duan, P.P.; Wang, K.L.; Li, D.J. Nitrogen addition effects on soil mineral-associated carbon differ between the valley and slope in a subtropical karst forest. Geoderma 2023, 430, 116357. [Google Scholar] [CrossRef]
  35. Hu, L.N.; Su, Y.R.; He, X.Y.; Wu, J.S.; Zheng, H.; Li, Y.; Wang, A.H. Response of soil organic carbon mineralization in typical Karst soils following the addition of 14C-labeled rice straw and CaCO3. J. Sci. Food Agric. 2012, 92, 1112–1118. [Google Scholar] [CrossRef] [PubMed]
  36. Shi, J.W.; Deng, L.; Gunina, A.; Alharbi, S.; Wang, K.B.; Li, J.W.; Liu, Y.L.; Shangguan, Z.P.; Kuzyakov, Y. Carbon stabilization pathways in soil aggregates during long-term forest succession: Implications from δ13C signatures. Soil Biol. Biochem. 2023, 180, 108988. [Google Scholar] [CrossRef]
  37. Fei, C.; Zhang, S.R.; Zhang, L.; Ding, X.D. Straw is more effective than biochar in mobilizing soil organic phosphorus mineralization in saline-alkali paddy soil. Appl. Soil Ecol. 2023, 186, 104848. [Google Scholar] [CrossRef]
  38. Stegarescu, G.; Escuer, G.J.; Soosaar, K.; Kauer, K.; Astover, A.; Reintam, E. Effect of crop residue decomposition on soil aggregate stability. Agriculture 2020, 10, 527–539. [Google Scholar] [CrossRef]
  39. Kallenbach, C.M.; Frey, S.D.; Grandy, A. Stuart Direct evidence for microbial-derived soil organic matter formation and its ecophysiological controls. Nat. Commun. 2016, 7, 13630. [Google Scholar] [CrossRef]
  40. Zheng, T.T.; Xie, H.T.; Grant, L.T.; Bao, X.L.; Deng, F.B.; Yan, E.R.; Zhou, X.H.; Liang, C. Shifts in microbial metabolic pathway for soil carbon accumulation along subtropical forest succession. Soil Biol. Biochem. 2021, 160, 108335. [Google Scholar] [CrossRef]
  41. Shabtai, I.A.; Wilhelm, R.C.; Schweizer, S.A.; Buckley, D.H.; Lehmann, J. Calcium promotes persistent soil organic matter by altering microbial transformation of plant litter. Nat. Commun. 2023, 14, 6609. [Google Scholar] [CrossRef]
  42. Hu, X.; Yin, P.; Nong, X.; Liao, J.H. Effect of exogenous carbon addition and the freeze-thaw cycle on soil microbes and mineral nitrogen pools1. IOP Conf. Ser. Earth Environ. Sci. 2018, 108, 032046. [Google Scholar] [CrossRef]
  43. Ling, J.K.; Mao, X.F.; Wei, X.Y.; Tan, W.J.; Wu, Y.; Zhang, Y.C.; Bao, X.X.; Tong, L.L. The indication of soil microorganism to wetland restoration in Three River Source Area. IOP Conf. Ser. Earth Environ. Sci. 2020, 601, 012051. [Google Scholar] [CrossRef]
  44. Robert, W.B.; Davey, L.J. Plasticity of microbial substrate carbon use efficiency in response to changes in plant carbon input and soil organic matter status. Soil Biol. Biochem. 2024, 188, 109230. [Google Scholar]
  45. Keyvan, E.S.; Bahram, M.; Ghanbari, M.S.; Gohar, D.; Tohidfar, M.; Eremeev, V.; Talgre, L.; Khaleghdoust, B.; Mirmajlessi, S.M.; Luik, A.; et al. Cropping systems with higher organic carbon promote soil microbial diversity. Agric. Ecosyst. Environ. 2021, 319, 107521. [Google Scholar]
  46. Camenzind, T.; Mason, J.K.; Mansour, I.; Rillig, M.C.; Lehmann, J. Formation of necromass-derived soil organic carbon determined by microbial death pathways. Nat. Geosci. 2023, 16, 115–122. [Google Scholar] [CrossRef]
  47. Lucas, J.M.; McBride, S.G.; Strickland, M.S. Trophic level mediates soil microbial community composition and function. Soil Biol. Biochem. 2020, 143, 107756. [Google Scholar] [CrossRef]
  48. Zhu, M.T.; Liu, X.X.; Wang, J.M.; Liu, Z.W.; Zheng, J.F.; Bian, R.J.; Wang, G.M.; Zhang, X.H.; Li, L.Q.; Pan, G.X. Effects of biochar application on soil microbial diversity in soil aggregates from paddy soil. Acta Ecol. Sin. 2020, 40, 1–12. [Google Scholar]
  49. Wang, C.; Liu, D.W.; Bai, E. Decreasing soil microbial diversity is associated with decreasing microbial biomass under nitrogen addition. Soil Biol. Biochem. 2018, 120, 126–133. [Google Scholar] [CrossRef]
  50. Cao, M.M.; Zheng, X.; Cui, L.N.; Wu, F.; Gao, H.D.; Jiang, J. Soil bacterial communities are more sensitive to short-term nitrogen deposition than fungal communities in subtropical Chinese fir forests. Forest Ecol. Manag. 2023, 549, 121490. [Google Scholar] [CrossRef]
  51. Zhang, L.M.; Wang, Y.; Chen, J.; Feng, L.; Li, F.B.; Yu, L.F. Characteristics and Drivers of Soil Organic Carbon Saturation Deficit in Karst Forests of China. Diversity 2022, 14, 62. [Google Scholar] [CrossRef]
  52. Cobos, M.; Estela, S.L.; Rodrguez, H.N.; Castro, C.G.; Grandez, M.; Castro, J.C. Soil microbial diversity and functional profiling of a tropical rainforest of a highly dissected low hill from the upper Itaya river basin revealed by analysis of shotgun metagenomics sequencing data. Data Brief 2022, 42, 108205. [Google Scholar] [CrossRef]
  53. Zhang, L.M.; Wang, Y.; Chen, J.; Zhang, C.F.; Cao, Y.; Cai, G.J.; Yu, L.F. Exogenous carbon addition reduces soil organic carbon: The effects of fungi on soil carbon priming exceed those of bacteria on soil carbon sequestration. Forests 2023, 14, 1268. [Google Scholar] [CrossRef]
  54. Hu, P.L.; Zhang, W.; Chen, H.S.; Xu, L.; Xiao, J.; Luo, Y.Q.; Wang, K.L. Lithologic control of microbial-derived carbon in forest soils. Soil Biol. Biochem. 2022, 167, 108600. [Google Scholar] [CrossRef]
  55. Lu, X.L. A Review of Karst Environment andBiodiversity in China. Adv. Environ. Prot. 2024, 14, 348–353. [Google Scholar] [CrossRef]
  56. Sheng, Y.Q.; Zhu, L.Z. 2Biochar alters microbial community and carbon sequestration potential across different soil pH. Sci. Total Environ. 2018, 622, 1391–1399. [Google Scholar] [CrossRef] [PubMed]
  57. Gai, X.; Zhong, Z.K.; Zhang, X.P.; Bian, F.Y.; Yang, C.B. Effects of chicken farming on soil organic carbon fractions and fungal communities in a Lei bamboo (Phyllostachys praecox) forest in subtropical China. Forest Ecol. Manag. 2021, 479, 118603. [Google Scholar] [CrossRef]
  58. He, H.R.; Xu, M.Z.; Li, W.T.; Chen, L.; Chen, Y.N.; Moorhead, D.L.; Albert, B.C.; Liu, J.; Cui, Y.X.; Zeng, Y.; et al. Linking soil depth to aridity effects on soil microbial community composition, diversity and resource limitation. Catena 2023, 232, 107393. [Google Scholar] [CrossRef]
  59. Jenkins, J.R.; Viger, M.; Arnold, E.C.; Harris, Z.M.; Ventura, M.; Miglietta, F.; Girardin, C.; Edwards, R.J.; Rumpel, C.; Fornasier, F. Biochar alters the soil microbiome and soil function: Results of next-generation amplicon sequencing across Europe. Gcb. Bioenergy 2017, 9, 485–661. [Google Scholar] [CrossRef]
  60. Menzel, A.; Hempel, S.; Klotz, S. Mycorrhizal status helps explain invasion success of alien plant species. Ecology 2017, 98, 92–102. [Google Scholar] [CrossRef]
  61. Chakraborty, K.; Roy, D.A.; Saha, A.K.; Das, P. A culture based diversity of saprobic fungi associated with leaf litter of Hevea brasiliensis along a chronosequence of plantations in Tripura, Northeast India. Trop. Ecol. 2020, 61, 468–474. [Google Scholar] [CrossRef]
  62. Kang, P.; Pan, Y.Q.; Ran, Y.C.; Li, W.N.; Shao, M.X.; Zhang, Y.Q.; Ji, Q.B.; Ding, X.D. Soil saprophytic fungi could be used as an important ecological indicator for land management in desert steppe. Ecol. Indic. 2023, 150, 110224. [Google Scholar] [CrossRef]
  63. Hu, M.H.; Zhao, J.Q.; Wang, X.; Xiong, X.; Zhang, H.L.; Zhu, G.W.; Meng, Z.; Zhang, D.Q. Effects of natural warming on soil microorganisms communities and functional genes of soil organic carbon metabolism in subtropical forests. Acta Ecol. Sin. 2022, 42, 359–369. [Google Scholar]
  64. Yang, N.; Zhang, Y.; Li, J.J.; Xiong, X.; Zhang, H.L.; Zhu, G.W.; Meng, Z.; Zhang, D.Q. Interaction among soil nutrients, plant diversity and hypogeal fungal trophic guild modifies root-associated fungal diversity in coniferous forests of Chinese Southern Himalayas. Plant Soil 2022, 481, 395–408. [Google Scholar] [CrossRef]
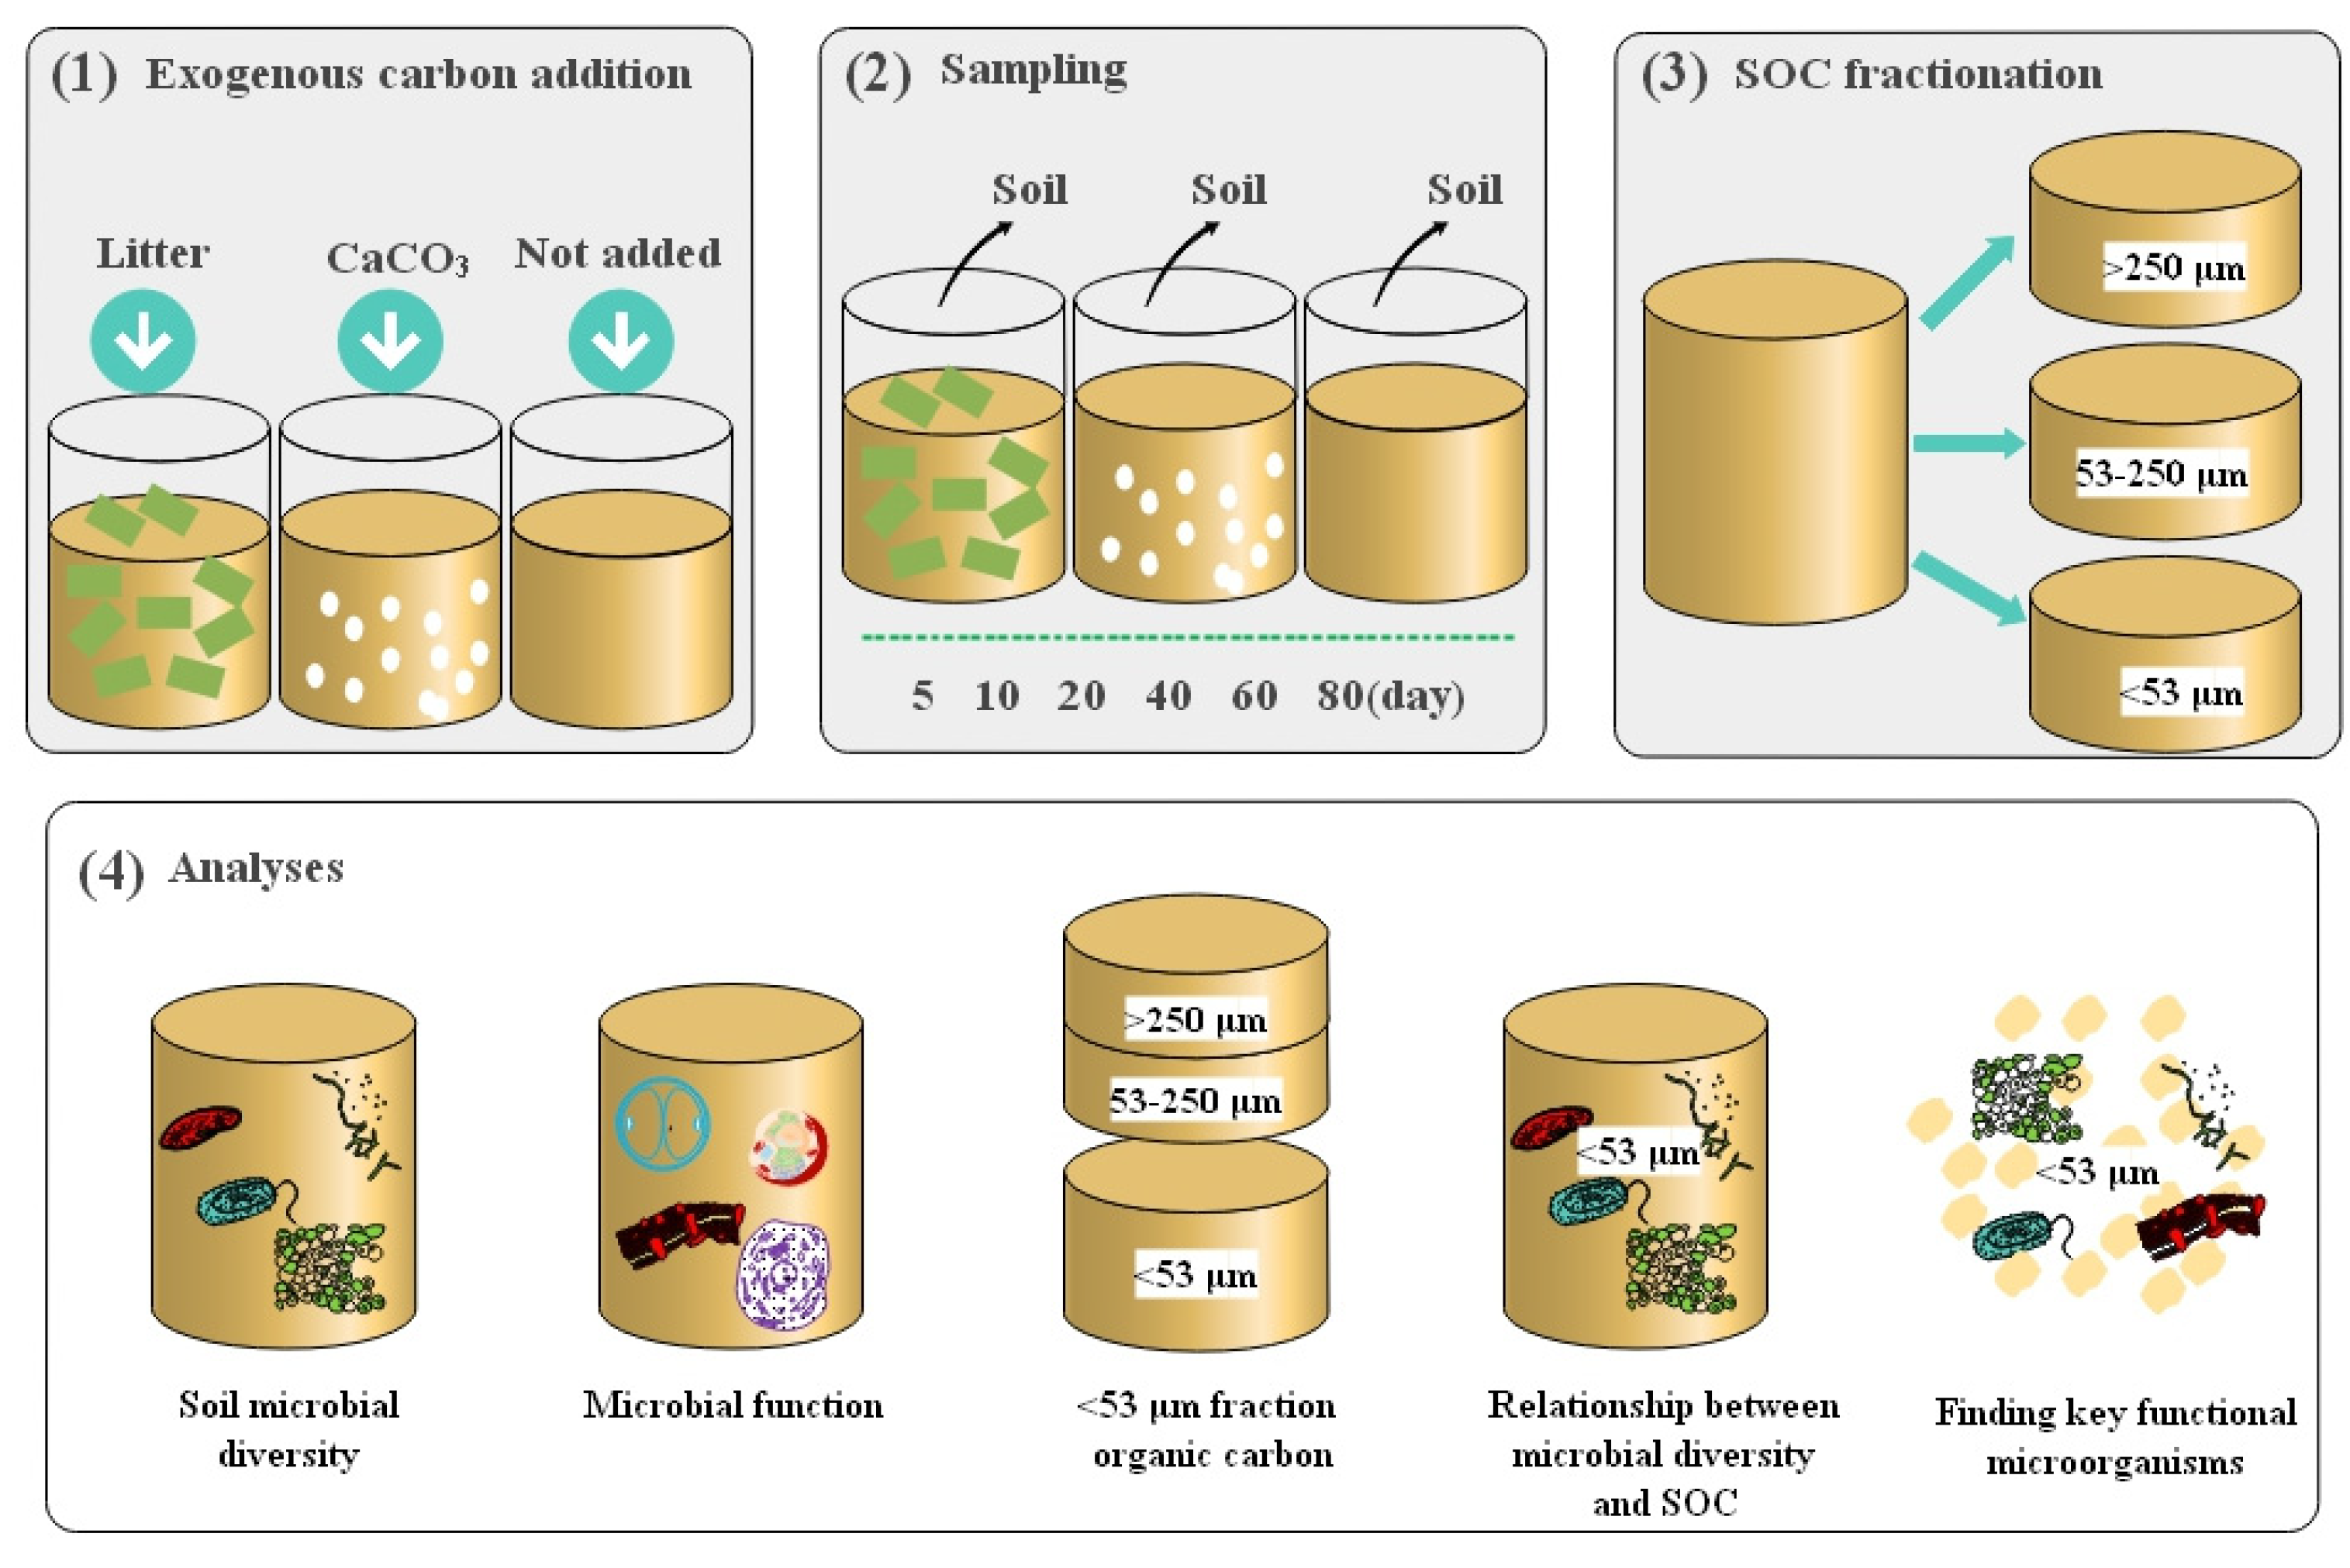
Figure 1. Experimental setup of litter and CaCO3 incubation in lime soils. (1) Soil was treated by adding litter, CaCO3, and no exogenous C, respectively. After addition, the soil was fully mixed for continuous incubation. (2) Three repeated soil samples were taken out at 5, 10, 20, 40, 60, and 80 days of culture, respectively. A small part was taken out for soil microbial determination, and the rest were dried and ground for soil C fractionation. (3) Soil samples collected during different incubation periods were grouped for SOC into > 250 μm, 53–250 μm, and <53 μm fractions. (4) The diversity and function of the soil microorganisms, the correlation between soil microorganisms and MPOC, and the key functional microorganisms were analyzed.
Agronomy 14 02333 g001
Figure 2. Community composition of soil bacteria families and fungi genus under different treatments. (a) is the community composition and proportion of the bacterial family, and (b) is the community composition and proportion of fungi.
Agronomy 14 02333 g002
Figure 3. Community composition of common microorganisms in soil: (a) illustrates bacteria and (b) illustrates fungi.
Agronomy 14 02333 g003
Figure 4. The relative abundance of common bacterial and fungal ecological functions under different treatments: (a) is the common bacteria and (b) is the common fungus.
Agronomy 14 02333 g004
Figure 5. The correlation of the soil’s microbial diversity with MPOC: (a) illustrates the linear regression models for bacterial diversity and MPOC; (b) illustrates the linear regression models for fungal diversity. R2, differences were plotted in the figure. n = 108. Statistical significance was analyzed using an unpaired two-sided t-test.
Agronomy 14 02333 g005
Table 1. Basic properties of the experimental soils. BD: soil bulk density; SOC: soil organic carbon; TN: total nitrogen; TP: total phosphorus.
ItempHBD
(g cm−3)
SOC
(g kg−1)
TN
(g kg−1)
TP
(g kg−1)
Bacterial
Diversity
Fungal
Diversity
<53 μm
C
Lime soil (CLZ)6.55 ± 0.041.18 ± 0.0329.23 ± 3.052.33 ± 0.170.37 ± 0.013.84 ± 0.183.80 ± 0.094.51 ± 0.17
Yellow soil (CYZ)6.13 ± 0.021.16 ± 0.0113.31 ± 2.351.24 ± 0.110.68 ± 0.053.90 ± 0.063.62 ± 0.072.32 ± 0.05
Table 2. The effect of exogenous carbon addition on MPOC. All data are means, with “±” being displayed with the standard deviation and n = 3 independent replicates. The lowercase letters denote significant differences in bacterial and fungal diversity at different stages of incubation in different treatments. Statistical significance was analyzed using an unpaired two-sided t-test.
Treatments51020406080
CY2.59 ± 0.03 b2.75 ± 0.14 ab2.80 ± 0.18 ab2.85 ± 0.04 a2.96 ± 0.06 a3.03 ± 0.07 a
LY2.64 ± 0.08 d2.84 ± 0.12 c2.97 ± 0.16 c3.40 ± 0.07 b3.73 ± 0.07 b4.04 ± 0.08 a
CCY2.59 ± 0.08 d2.80 ± 0.09 c2.95 ± 0.14 c3.25 ± 0.03 b3.55 ± 0.05 a3.82 ± 0.05 a
CL4.91 ± 0.15 c4.98 ± 0.05 c5.23 ± 0.19 b5.55 ± 0.16 b5.70 ± 0.37 a5.87 ± 0.24 a
LL5.55 ± 0.23 d6.15 ± 0.10 c6.38 ± 0.23 c6.82 ± 0.32 b7.28 ± 0.22 a7.61 ± 0.41 a
CCL5.30 ± 0.26 d5.27 ± 0.10 d5.75 ± 0.18 c6.15 ± 0.29 b6.55 ± 0.29 a6.68 ± 0.27 a
Table 3. The diversity of soil bacteria and fungi under different treatments and incubation stages. All data are means, with “±” being displaying with the standard deviation and n = 3 independent replicates. The lowercase letters denote significant differences in bacterial and fungal diversity at different stages of incubation under different treatments. Statistical significance was analyzed using an unpaired two-sided t-test.
NameTreatments51020406080
BacteriaCY4.18 ± 0.05 b4.18 ± 0.07 b4.24 ± 0.08 ab4.23 ± 0.11 ab4.37 ± 0.03 a4.38 ± 0.05 a
LY4.12 ± 0.06 c4.21 ± 0.02 b4.23 ± 0.07 b4.41 ± 0.11 a4.50 ± 0.09 a4.47 ± 0.04 a
CCY4.07 ± 0.07 b4.13 ± 0.09 b4.36 ± 0.05 a4.36 ± 0.02 a4.41 ± 0.08 a4.43 ± 0.09 a
CL4.44 ± 0.16 a4.63 ± 0.09 a4.51 ± 0.13 a4.50 ± 0.19 a4.54 ± 0.09 a4.60 ± 0.14 a
LL4.08 ± 0.11 c4.47 ± 0.26 b4.64 ± 0.15 a4.74 ± 0.16 a4.76 ± 0.11 a4.87 ± 0.06 a
CCL4.39 ± 0.23 c4.67 ± 0.09 b4.83 ± 0.03 a4.87 ± 0.06 a4.85 ± 0.07 a4.82 ± 0.05 a
FungiCY3.61 ± 0.02 a3.40 ± 0.10 a3.39 ± 0.12 a3.73 ± 0.13 a3.61 ± 0.03 a3.45 ± 0.10 a
LY3.71 ± 0.02 a3.64 ± 0.10 a2.99 ± 0.15 b3.38 ± 0.24 a3.52 ± 0.15 a2.75 ± 0.12 b
CCY3.67 ± 0.06 a3.58 ± 0.11 a3.61 ± 0.04 a3.62 ± 0.09 a3.57 ± 0.13 a3.54 ± 0.12 a
CL3.85 ± 0.11 a3.73 ± 0.06 a3.46 ± 0.03 b3.40 ± 0.07 b3.24 ± 0.15 b2.88 ± 0.20 c
LL3.79 ± 0.06 a3.63 ± 0.12 a3.57 ± 0.05 a3.55 ± 0.08 a2.20 ± 0.11 b2.07 ± 0.16 b
CCL3.96 ± 0.10 a3.89 ± 0.06 a3.70 ± 0.22 a3.32 ± 0.14 b3.15 ± 0.09 b2.64 ± 0.07 c
Table 4. Ecological functions of common bacteria.
FamilyEcological Functions
Beijerinckiaceae, Chitinophagaceae, Microbacteriaceae, Mycobacteriaceae, norank_o__Vicinamibacterales, Hymenobacteraceae, Sphingobacteriaceae, Streptomycetaceae, Pseudomonadaceae, Reyranellaceae, Solirubrobacteraceae, Thermomonosporaceae, norank_o__norank_c__Subgroup_22aerobic chemoheterotrophy, chemoheterotrophy
Oxalobacteraceaeureolysis
Planococcaceaemanganese oxidation
PolyangiaceaeCellulolysis, chemoheterotrophy
Acetobacteraceaeaerobic chemoheterotrophy, animal parasites or symbionts, chemoheterotrophy, human-associated functions, human pathogens all, ureolysis
A21banimal parasites or symbionts, human-associated functions, human pathogens all, human pathogens pneumonia
Nocardiaceaearomatic compound degradation, aliphatic non-methane hydrocarbon degradation, aromatic hydrocarbon degradation, chemoheterotrophy, hydrocarbon degradation, ureolysis
Xanthobacteraceaeaerobic chemoheterotrophy, anoxygenic photoautotrophy, S-oxidizing anoxygenic photoautotrophy, chemoheterotrophy, denitrification, nitrate denitrification, nitrate reduction, nitrite denitrification, nitrogen respiration, photoautotrophy, phototrophy
Xiphinematobacteraceaeanimal parasites or symbionts
Sutterellaceaeanimal parasites or symbionts, human-associated functions, human pathogens all, human pathogens pneumonia
Devosiaceaeaerobic chemoheterotrophy, chemoheterotrophy, ureolysis
Rhodanobacteraceaeaerobic chemoheterotrophy, chemoheterotrophy, nitrate reduction
Table 5. Ecological functions of common fungi.
GenusEcological Functions
Cladophialophora, Clavaria, Arthrobotrys, Conocybe, Coprinellus, Creosphaeria, Dactylella, Emericellopsis, Geminibasidium, Gonytrichum, Hamigera, Leohumicola, Leptodiscella, Lophiotrema, Lophotrichus, Monocillium, Myrmecridium, Neobulgaria, Nemania, Subplenodomus, Subulicystidium, Talaromyces, Tetracladium, Titaea, Trichaleurina, Trichocladium, Phaeosphaeriopsis, Pleurotheciella, Pseudeurotium, Sarocladium, Scolecobasidium, Scutellinia, Sporormiella, Stephanonectria, Paramicrothyrium, Paraphaeosphaeria, Nigrospora, Nodulisporium, Paraconiothyrium, Neocosmospora, PreussiaUndefined Saprotroph
Clonostachys, Neonectria, Cylindrocarpon, Ilyonectria, Dendryphion, Gibberella, Gibellulopsis, OlpidiumPlant Pathogen
Acaulopage, Simplicillium, MetarhiziumAnimal Pathogen
Lactarius, Tomentella, PulvinulaEctomycorrhizal
Schizothecium, Cercophora, ZopfiellaDung Saprotroph
Diversispora, EntrophosporaArbuscular Mycorrhizal
Psathyrella, TrechisporaWood Saprotroph
Purpureocillium, SyncephalisFungal Parasite
CystofilobasidiumLeaf Saprotroph
LecythophoraEndophyte
SerendipitaOrchid Mycorrhizal
CyphellophoraAnimal Pathogen–Undefined Saprotroph
AscobolusDung Saprotroph–Wood Saprotroph
KerniaDung Saprotroph–Undefined Saprotroph
StilbellaDung Saprotroph–Endophyte–Wood Saprotroph
MyxotrichumDung Saprotroph–Ericoid Mycorrhizal–Lichenized
GanodermaPlant Pathogen–Wood Saprotroph
LeucosporidiumSoil Saprotroph–Undefined Saprotroph
PericoniaEndophyte–Plant Pathogen–Wood Saprotroph
PyrenochaetopsisEndophyte–Lichen Parasite–Undefined Saprotroph
SpizellomycesPlant Pathogen–Undefined Parasite–Undefined Saprotroph
PluteusBryophyte Parasite–Litter Saprotroph–Wood Saprotroph
PodosporaDung Saprotroph–Endophyte–Litter Saprotroph–Undefined Saprotroph
AlternariaAnimal Pathogen–Endophyte–Plant Pathogen–Wood Saprotroph
ConiochaetaAnimal Pathogen–Dung Saprotroph–Endophyte–Lichen Parasite–Plant Pathogen–Undefined Saprotroph
DidymellaAnimal Pathogen–Plant Pathogen–Undefined Saprotroph
EntolomaEctomycorrhizal–Fungal Parasite–Soil Saprotroph–Undefined Saprotroph
FusariumAnimal Pathogen–Endophyte–Lichen Parasite–Plant Pathogen–Soil Saprotroph–Wood Saprotroph
MortierellaEndophyte–Litter Saprotroph–Soil Saprotroph–Undefined Saprotroph
TrichodermaAnimal Pathogen–Endophyte–Epiphyte–Fungal Parasite–Plant Pathogen–Wood Saprotroph
AcremoniumAnimal Pathogen–Endophyte–Fungal Parasite–Plant Pathogen–Wood Saprotroph
Table 6. Ecological functions of the p ≤ 0.01 under the MPOC and common bacteria.
FamilyEcological Functions
A21banimal parasites or symbionts, human-associated functions, human pathogens all, human pathogens pneumonia
Acetobacteraceaeaerobic chemoheterotrophy, animal parasites or symbionts, chemoheterotrophy, human-associated functions, human pathogens all, ureolysis
Microbacteriaceaeaerobic chemoheterotrophy, chemoheterotrophy
Mycobacteriaceaeaerobic chemoheterotrophy, chemoheterotrophy
Nocardiaceaearomatic compound degradation, aliphatic non-methane hydrocarbon degradation, aromatic hydrocarbon degradation, chemoheterotrophy, hydrocarbon degradation, ureolysis
norank_o__VicinamibacteralesAerobic chemoheterotrophy, chemoheterotrophy
Oxalobacteraceaeureolysis
PolyangiaceaeCellulolysis, chemoheterotrophy
Pseudomonadaceaeaerobic chemoheterotrophy, chemoheterotrophy
Reyranellaceaeaerobic chemoheterotrophy, chemoheterotrophy
Streptomycetaceaeaerobic chemoheterotrophy, chemoheterotrophy
Thermomonosporaceaeaerobic chemoheterotrophy, chemoheterotrophy
Xanthobacteraceaeaerobic chemoheterotrophy, anoxygenic photoautotrophy, S-oxidizing anoxygenic photoautotrophy, chemoheterotrophy, denitrification, nitrate denitrification, nitrate reduction, nitrite denitrification, nitrogen respiration, photoautotrophy, phototrophy
Sutterellaceaeanimal parasites or symbionts, human-associated functions, human pathogens all, human pathogens pneumonia
Rhodanobacteraceaeaerobic chemoheterotrophy, chemoheterotrophy, nitrate reduction
norank_o__norank_c__Subgroup_22aerobic chemoheterotrophy, chemoheterotrophy
Table 7. Ecological functions of the p ≤ 0.01 of the soil’s mineral particulate organic carbon and common fungi.
GenusEcological FunctionsGenusEcological Functions
LecythophoraEndophyteMetarhiziumAnimal Pathogen
TomentellaEctomycorrhizalLophotrichusUndefined Saprotroph
PurpureocilliumFungal ParasiteMonocilliumUndefined Saprotroph
SchizotheciumDung SaprotrophNemaniaUndefined Saprotroph
ClonostachysPlant PathogenNeobulgariaUndefined Saprotroph
GibberellaPlant PathogenNeocosmosporaUndefined Saprotroph
NeonectriaPlant PathogenPseudeurotiumUndefined Saprotroph
CylindrocarponPlant PathogenNigrosporaUndefined Saprotroph
OlpidiumPlant PathogenNodulisporiumUndefined Saprotroph
DendryphionPlant PathogenArthrobotrysUndefined Saprotroph
CoprinellusUndefined SaprotrophAscobolusDung Saprotroph–Wood Saprotroph
ScolecobasidiumUndefined SaprotrophKerniaDung Saprotroph–Undefined Saprotroph
StephanonectriaUndefined SaprotrophStilbellaDung Saprotroph–Endophyte–Wood Saprotroph
SubplenodomusUndefined SaprotrophPericoniaEndophyte–Plant Pathogen–Wood Saprotroph
TetracladiumUndefined SaprotrophPyrenochaetopsisEndophyte–Lichen Parasite–Undefined Saprotroph
TrichocladiumUndefined SaprotrophEntolomaEctomycorrhizal–Fungal Parasite–Soil Saprotroph–Undefined Saprotroph
GonytrichumUndefined SaprotrophAcremoniumAnimal Pathogen–Endophyte–Fungal Parasite–Plant Pathogen–Wood Saprotroph
LophiotremaUndefined SaprotrophTrichodermaAnimal Pathogen–Endophyte–Epiphyte-Fungal Parasite–Plant Pathogen–Wood Saprotroph
ClavariaUndefined SaprotrophFusariumAnimal Pathogen–Endophyte–Lichen Parasite–Plant Pathogen–Soil Saprotroph–Wood Saprotroph
LeohumicolaUndefined SaprotrophConiochaetaAnimal Pathogen–Dung Saprotroph–Endophyte–Lichen Parasite–Plant Pathogen–Undefined Saprotroph
Disclaimer/Publisher’s Note: The statements, opinions and data contained in all publications are solely those of the individual author(s) and contributor(s) and not of MDPI and/or the editor(s). MDPI and/or the editor(s) disclaim responsibility for any injury to people or property resulting from any ideas, methods, instructions or products referred to in the content.