Abstract
Curing modulation is one of the important processes in tobacco production, so it is crucial to recognize tobacco flue-curing states effectively and accurately. This study created a dataset of the complete tobacco flue-curing process in a bulk curing barn environment and proposed a lightweight recognition model based on a feature skip connections module. Firstly, the image data was enhanced using a color correction matrix, which was used to recover the true color of the tobacco leaf in order to reduce the misidentification of adjacent states. Secondly, the convolutional neural network model proposed in this paper introduced Spatially Separable convolution to enhance the extraction of tobacco leaf texture features. Then, the standard convolution in Short-Term Dense Concatenate (STDC) was replaced with Depthwise Separable Convolutional blocks with different expansion rates to reduce the number of model parameters and FLOPs (Floating Point Operations Per Second). Finally, the Tobacco Flue-Curing State Recognition Network (TFSNet) was constructed by combining the SimAm attention mechanism. The experimental results showed that the model accuracy was improved by 1.63 percentage points after the color correction process. The recognition accuracy of TFSNet for the seven states of tobacco flue-curing was as high as 98.71%. The number of params and the FLOPs of the TFSNet model were 203,058 and 172.39 M, which were 98.18% and 90.55% lower than that of the ResNet18 model, respectively. The size of the model was 0.78 mb, and the time consumed per frame was only 21 ms. Compared with the mainstream model, TFSNet significantly improved the detection speed while maintaining high accuracy, and it provided effective technical support for the intelligentization of the tobacco flue-curing process.
1. Introduction
Tobacco is an important economic crop. In 2022, China’s flue-cured tobacco production reached 2.08 million tons, and the total import and export of tobacco and its products amounted to 2.405 billion dollars [1]. Among them, tobacco flue-curing is an important part of tobacco production. The main purpose of flue-curing is to provide appropriate temperature and humidity conditions in the curing barn to induce yellowing and water loss in the appearance of the tobacco leaves to achieve the desired chemical and biological changes required for high-quality curing of the leaves [2,3] and then gradually realize the process of drying the tobacco leaves.
The process of tobacco flue-curing is very complex, requiring about 7 days for each curing cycle [4]. Traditional curing processes rely on manual control, requiring tobacco farmers to constantly monitor temperature and observe the state of the tobacco leaves [5], which can easily lead to unstable tobacco leaf quality. Therefore, the use of computer technology in agricultural production is of great importance and significance for promoting agricultural automation and intelligent production [6].
The position, shape, physical sensation, and color are the four key components of leaves that determine the value of tobacco [7]. Therefore, related scholars have conducted many research projects in the aspects of tobacco maturity and tobacco grading after roasting. A classification model of tobacco maturity was established by Lu et al. [8] using spectral images, but noise interference could not be eliminated easily due to the small sample size of the data. The grading of tobacco was conducted by Ma et al. [9] based on the feature selection probability method, with the recognition accuracy being related to the choice of the number of features, resulting in low efficiency. The reflection images of tobacco under seven different colored light sources were collected by Yin et al. [10] for the grading of tobacco leaves, but a large amount of complex calculations is required. A total of 80.23% accuracy was reported by He et al. [11] in their study on the grading of flue-cured tobacco leaves using color analysis and fuzzy recognition algorithms.
Compared to the static grading of post-roasting tobacco, relatively few studies have been conducted on the identification of tobacco state during the flue-curing process. Throughout the curing cycle, the appearance of tobacco will show characteristics such as leaf, main vein, branch vein yellowing, and bring wrinkled and curled [12]. Therefore, a large number of researchers have identified the tobacco flue-curing state according to color analysis of the curing images. For example, Wu et al. [13] extracted the RGB and HSI color component eigenvalues from images as inputs to the regression model for fuzzy inference to predict the state of tobacco flue-curing. However, the use of a small sample size of data led to time-consuming inference. A tobacco state prediction fusion model was constructed by Wang et al. [14] utilizing Long Short-Term Memory and Extreme Gradient Boost with an accuracy of 97.4%. Wang et al. [15] used the HSI color model to extract tobacco features to predict the state of flue-curing, but the captured images contained only the tip portion of the tobacco leaf, resulting in an inadequate representation of the features of tobacco flue-curing changes. A control system for the process of tobacco flue-curing was established by Condorí M et al. [16] calculating the time derivatives of the respective color channels of HSV separately for data fitting, but it suffered from poor generalization problems. The traditional image processing methods mentioned above suffer from issues such as a small amount of data samples, low image quality, poor generalization, and the need to integrate multiple processing stages, resulting in long recognition time and low efficiency.
In recent years, with the widespread application of deep learning in the agricultural field, the rapid development of convolutional neural networks (CNNs) has provided technical support for agricultural engineering. For example, the mean and standard deviation of different color channels in images were utilized by Wu et al. [17], which were combined with information on dry and wet bulb temperatures as input to the neural network, for predicting tobacco drying status. A dual-encoder structured network was proposed by Chen et al. [18] to address the challenge of manually distinguishing between two adjacent tobacco leaves in the same position. The model achieved an average testing accuracy of 79.30%. A pipeline device based on an improved bilinear convolutional neural network was developed by LU et al. [19] with the aim of achieving automatic grading of post-baked tobacco leaves. The accuracy achieved was 80.65%, and the required time for tobacco classification was 42.1 ms. An efficient tobacco grading method based on Densely Connected Convolutional Networks (DenseNets) [20] was proposed by XIN et al. [21] to address the issues of insufficient feature extraction capability and the lack of adaptability to multiple tobacco grades. The precision achieved was 98.1%. Wu et al. [22] used convolutional neural networks to predict the target temperature and humidity, but there were significant recognition errors in identifying adjacent baking stages with clear temperature changes.
In summary, deep learning algorithms have strong feature extraction capabilities to address the persistent color and texture variations in agricultural products. Compared to traditional methods, they offer higher accuracy and significantly reduced detection time, presenting clear advantages. However, most of the above research has still been focused on post-curing grading of tobacco leaves. There is still limited research on state recognition during the curing process in bulk curing barns, with issues such as high misidentification rates between adjacent curing state and poor real-time performance. To address this problem, this study constructed a dataset of the complete tobacco flue-curing process in an bulk curing barn environment and proposed a lightweight recognition model based on a feature skip connections module. The main contributions of this study are as follows:
- (1)
- A color correction matrix was used to process the image data to construct a dataset of tobacco flue-curing state images in an bulk curing barn environment, providing a rich resource for model training and evaluation.
- (2)
- The model backbone network proposed in this paper used Short-Term Dense Concatenate (STDC) [23] and replaced the standard convolutional blocks in STDC with Depthwise Separable Convolutional [24] blocks, which drastically reduced the parameters in the model and the FLOPs.
- (3)
- The input layer of the model used spatially separable convolutional layers of 3 × 1 convolution and 1 × 3 convolution, which significantly improved the recognition accuracy of the model by combining the SimAm attention module [25] and setting different expansion rates [26] for the Depthwise Separable Convolution.
The rest of the paper is organized as follows: Section 2 describes the collection and construction of the dataset, as well as the methodology proposed in this paper, followed by the results of the experimentsin Section 3 and a discussion section in Section 4, and finally, the conclusions summarized in Section 5.
2. Materials and Methods
2.1. Image Acquisition
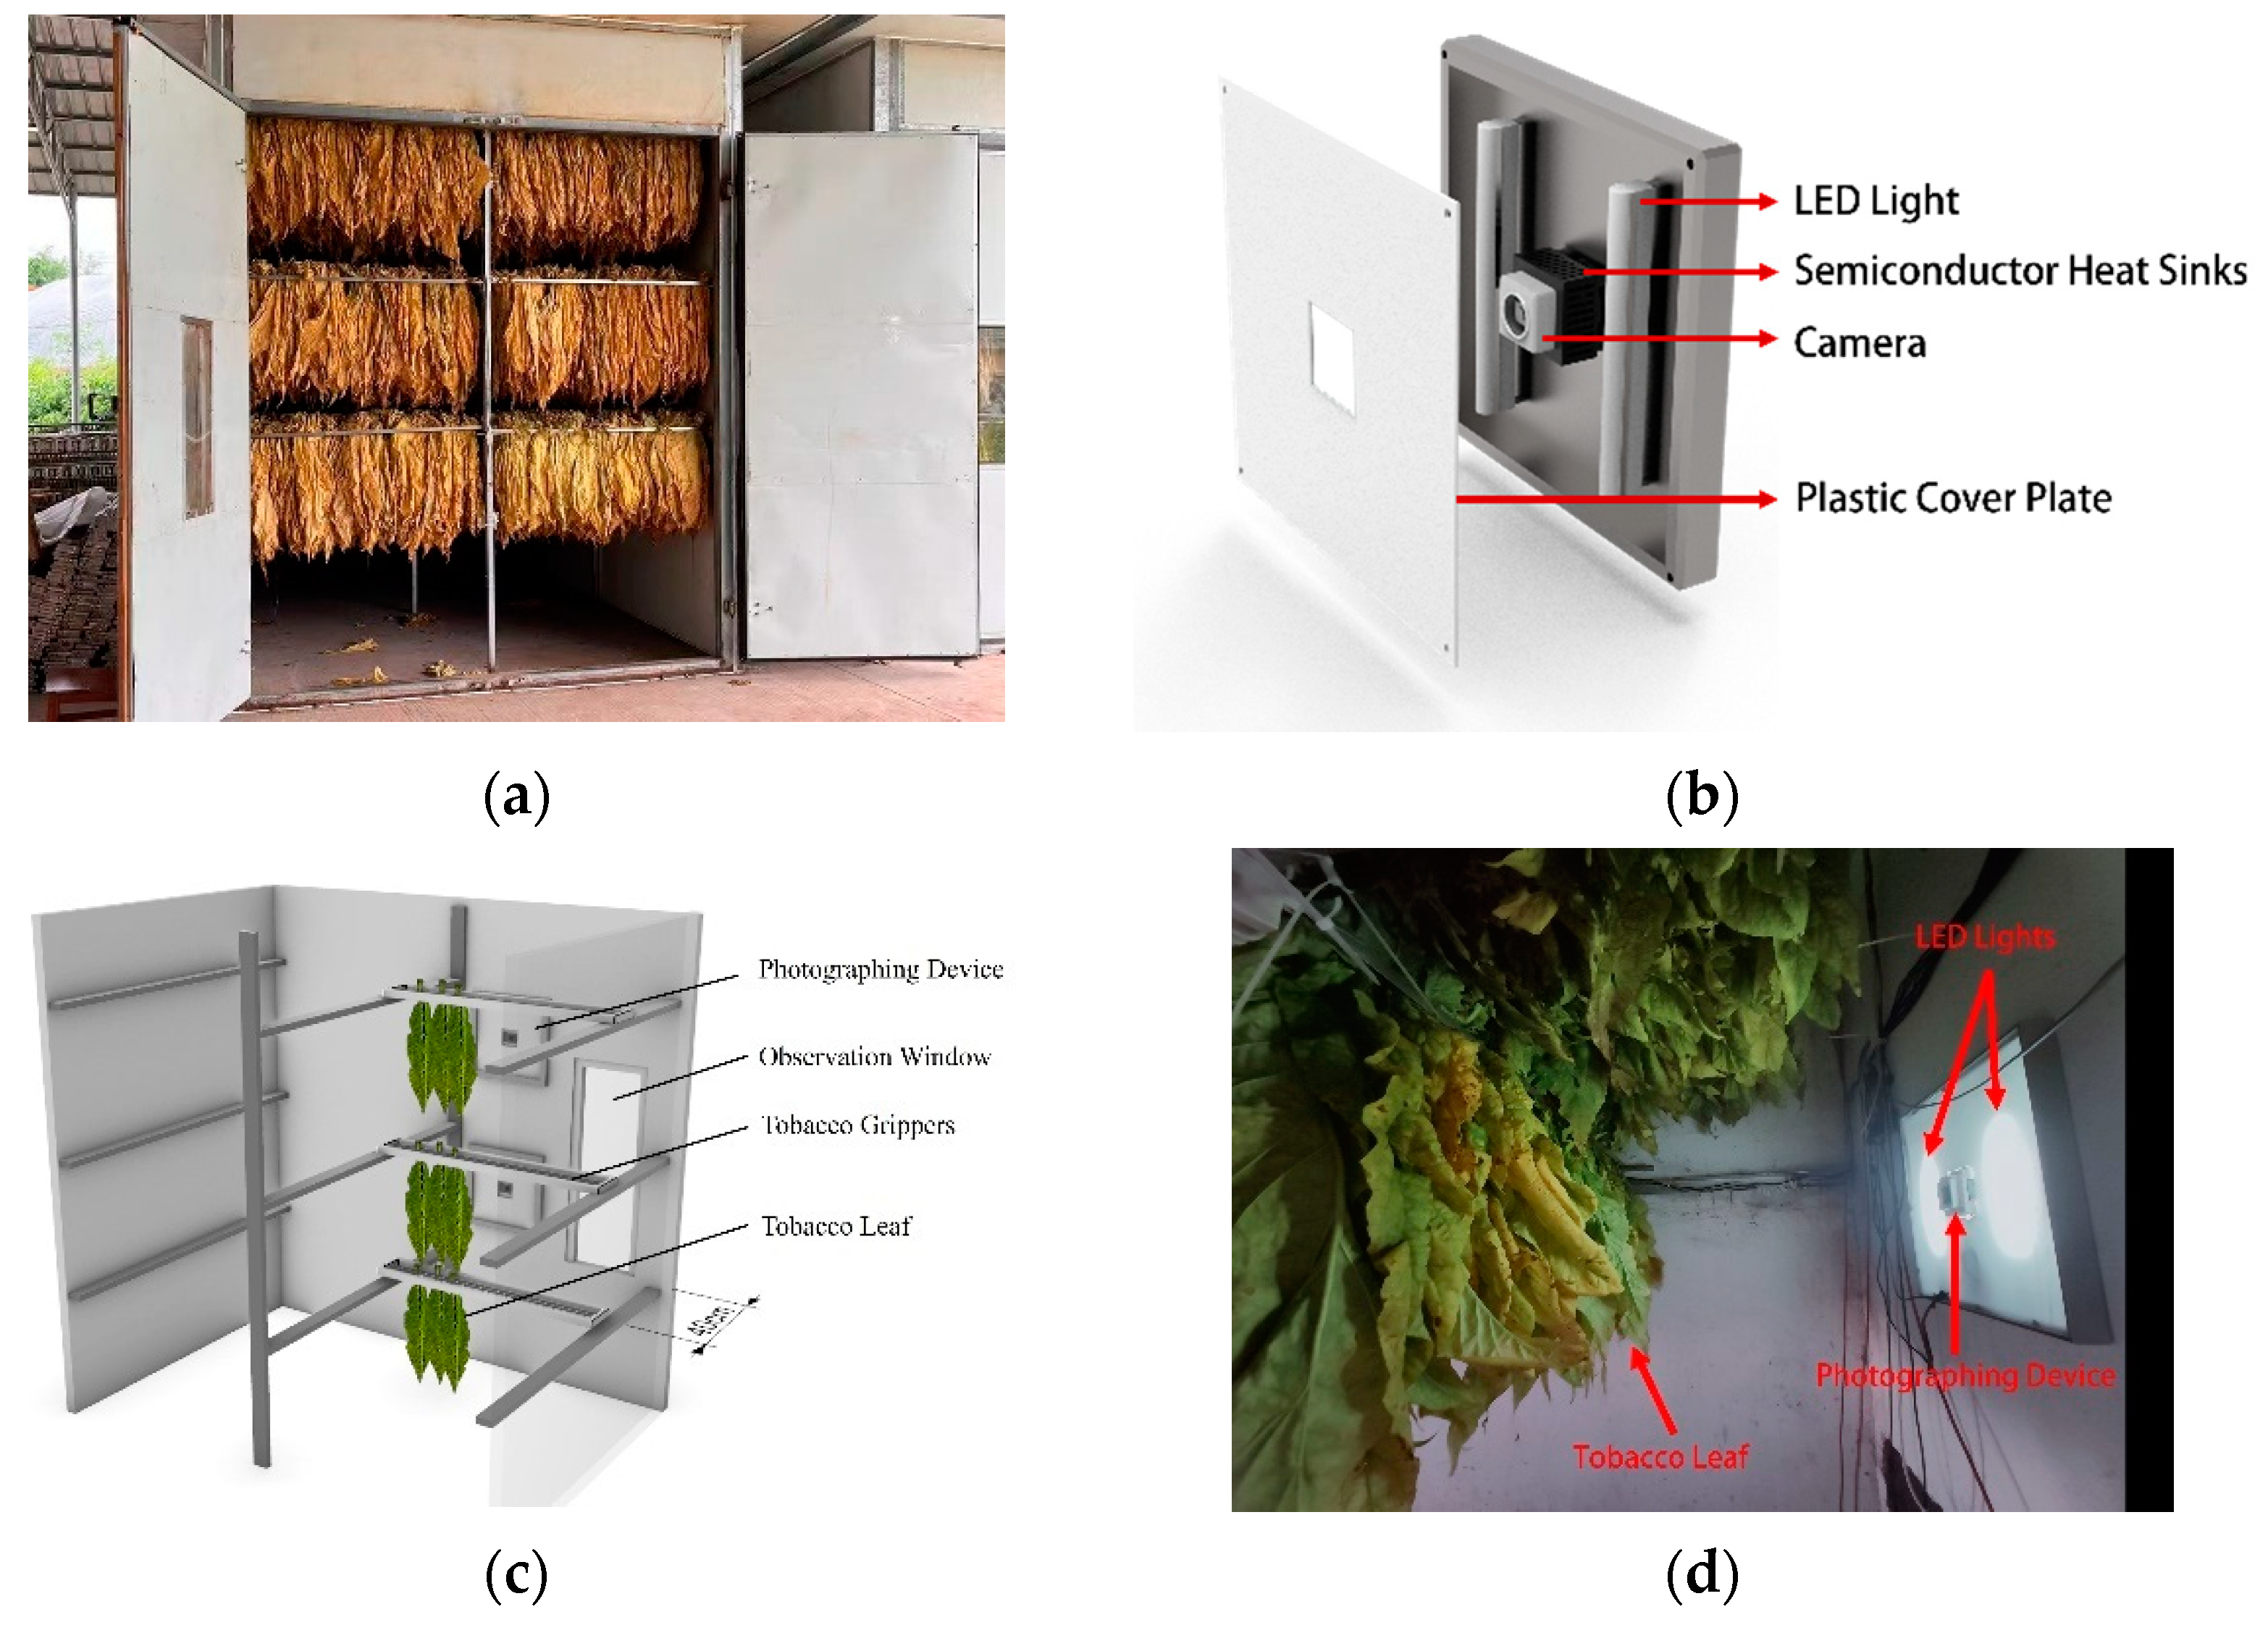
The experiment described in this paper took place from May 2023 to June 2023 at the Tobacco Science Institute of Nanxiong City, Guangdong Province, China (latitude 25.09683° N, longitude 114.28150° E). Figure 1 displays the precise location of the experiment and the distribution of tobacco picking sites. The experiment focused on a Chinese tobacco variety, Yueyan No.97. This variety is known for its post-harvest agronomic traits, including long elliptical leaf shape, acuminate leaf tip, slightly wrinkled leaf blade, and green leaf color [27]. The leaves used in the experiment consisted of the upper, middle, and lower portions of the tobacco stems and were randomly placed by the tobacco farmers on the same clamps. A bulk curing barn with airflow sinking, arranged in a 3-layer, 2-way pattern, was used for the experiment as shown in Figure 2a. Three bulk curing barns were utilized for the entire experiment, with each barn undergoing three rounds of curing, each lasting about 7 days.
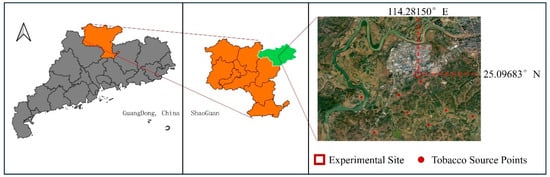
Figure 1.
Tobacco curing experiment site and distribution of tobacco picking locations.

Figure 2.
Tobacco image acquisition. (a) Tobacco in the curing barn. (b) Image acquisition device structure. (c) Image acquisition schematic diagram. (d) Image acquisition of actual scene.
To capture high-quality images in high-temperature environments, an image acquisition device was developed, as depicted in Figure 2b. The device consists of a 40 cm × 40 cm aluminum alloy frame (Sheng Jili, Shenzhen, China), an aluminum alloy base plate (Sheng Jili, Shenzhen, China), a PVC front cover plate (Huangbao, Chaozhou, China), a 800 w HD high-temperature-resistant industrial camera model Q8S (Jierui Weitong, Shenzhen, China), and a semiconductor heat sink (Zejie, Jinhua, China). The camera was securely mounted against the semiconductor heat sink to maintain its performance in high-temperature environments and was positioned at the center of the unit. Additionally, a 4 W LED white bar standard light source (Ge Xide, Zhongshan, China), 16 cm in length, was placed approximately 15 cm to the left and right of the camera. The average color temperature of the light source was measured to be 7488 K, and the average illuminance was 9284.1 Lux using a HP320 spectral illuminometer (Duotone Cloud, Hangzhou, China).
Based on the experience of the staff and the design of the curing barn, the state of tobacco flue-curing was primarily determined by observing the changes in the upper and middle tiers. The experiment’s environment is depicted in Figure 2c, with the image acquisition device installed in the upper and middle sheds of the air outlet wall of the curing barn, positioned approximately 30 cm away from the glass panel. To capture the intact leaf stalks and tips, the tobacco leaves of the upper and middle sheds were positioned 40 cm directly in front of the camera. Figure 2d illustrates the actual scene of the data acquisition.
Color is the fundamental aspect of digital images, but the images captured are often prone to color distortion due to factors such as light sources and capture devices [28]. Throughout the tobacco flue-curing process, significant changes occur in environmental temperature, humidity, and color. To address this, a Datacolor SpyderCheckr 24 color standard card (Datacolor, Lawrenceville, NJ, USA) was introduced into the enclosed curing barn before image acquisition. Images were scheduled for capture every 10 min (saved as .JPG files with a resolution of 3264 px × 2448 px) and then uploaded in real-time to the Alibaba Object Storage Service (OSS) Cloud server (Alibaba, Hangzhou, China). Images with abnormalities, like blur caused by leaf shedding and uneven lighting due to artificially opened observation windows, were removed from the collected pictures, resulting in a total of 5953 high-quality images.
2.2. Building the Dataset
According to the curing process in the Guangdong tobacco region and guidance from the staff, the mainstream curing process was divided into seven states: fresh tobacco state, initial yellowing state, yellowing and withering state, tendon changing state, dry flake state, and dry tendon state. The specific classification is shown in Table 1. Figure 3 illustrates the curing process of tobacco.

Table 1.
Features of tobacco at different states of curing.
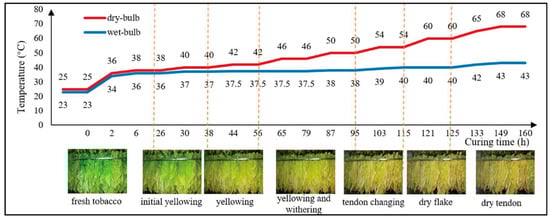
Figure 3.
Tobacco flue-curing process. The orange dotted line is used to mark the preset time point and temperature and humidity values at which the tobacco flue-curing states changes.
In the preliminary stage of the experiment, color correction was conducted on the captured images. With the assistance of a color chart, images for color correction under the curing barn lighting environment were obtained. The RGB values of each color block on the color chart in the images were extracted, and the input color space was linearized. Subsequently, a linear transformation was performed to convert the color space into an absolute RGB color space. The matrix used for this linear transformation is referred to as the color correction matrix (CCM), also known as the CCM matrix [29]. The aforementioned process represents the fitting process of the color space. Upon completion of the fitting process, image correction can be carried out. For the input images, linearization was conducted using the same method employed during the fitting process, followed by multiplication by the CCM matrix. At this stage, the data were transformed into an absolute linear RGB color space. The linearized RGB space was then converted back to RGB space before outputting the image. The formula is as follows:
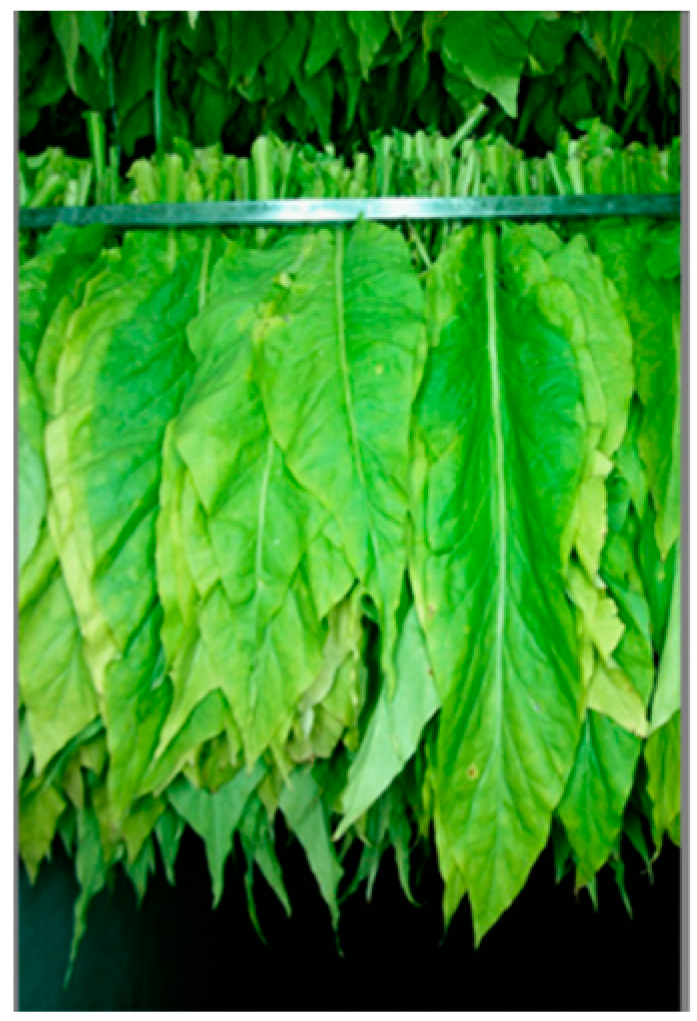
where Dl, Sl, and MCCM represent the output linear absolute color space, input linear color space, and CCM matrix, respectively. Figure 4 and Figure 5 show the images before and after color correction, respectively.
Dl = Sl × MCCM

Figure 4.
Image before color correction.
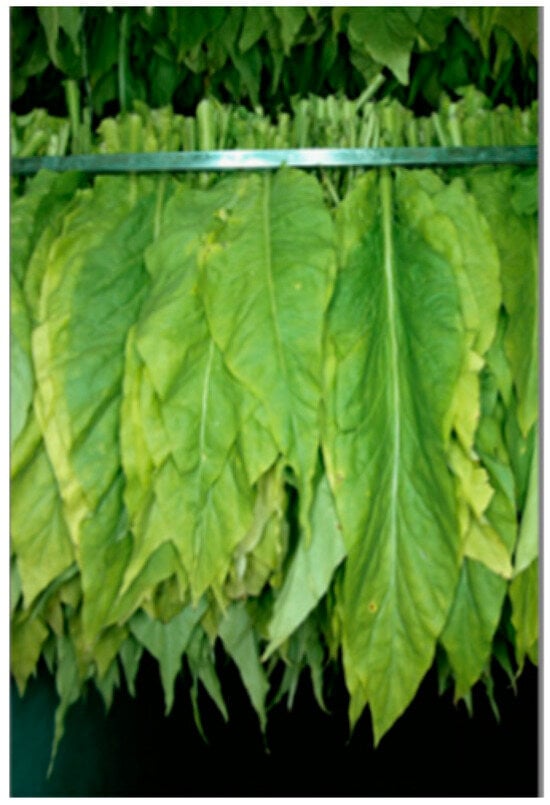
Figure 5.
Color corrected image.
In this study, image data augmentation techniques such as mirroring, rotation, and brightness enhancement were applied to generate approximately 17,859 images. The annotated dataset was divided into training, validation, and test sets in an 8:1:1 ratio, resulting in 14,292 images for the training set, 1782 images for the validation set, and 1785 images for the test set. The training and validation sets were used for model training and evaluation of results in a single training session, while the test set was utilized to validate the model performance.
2.3. Building the Model
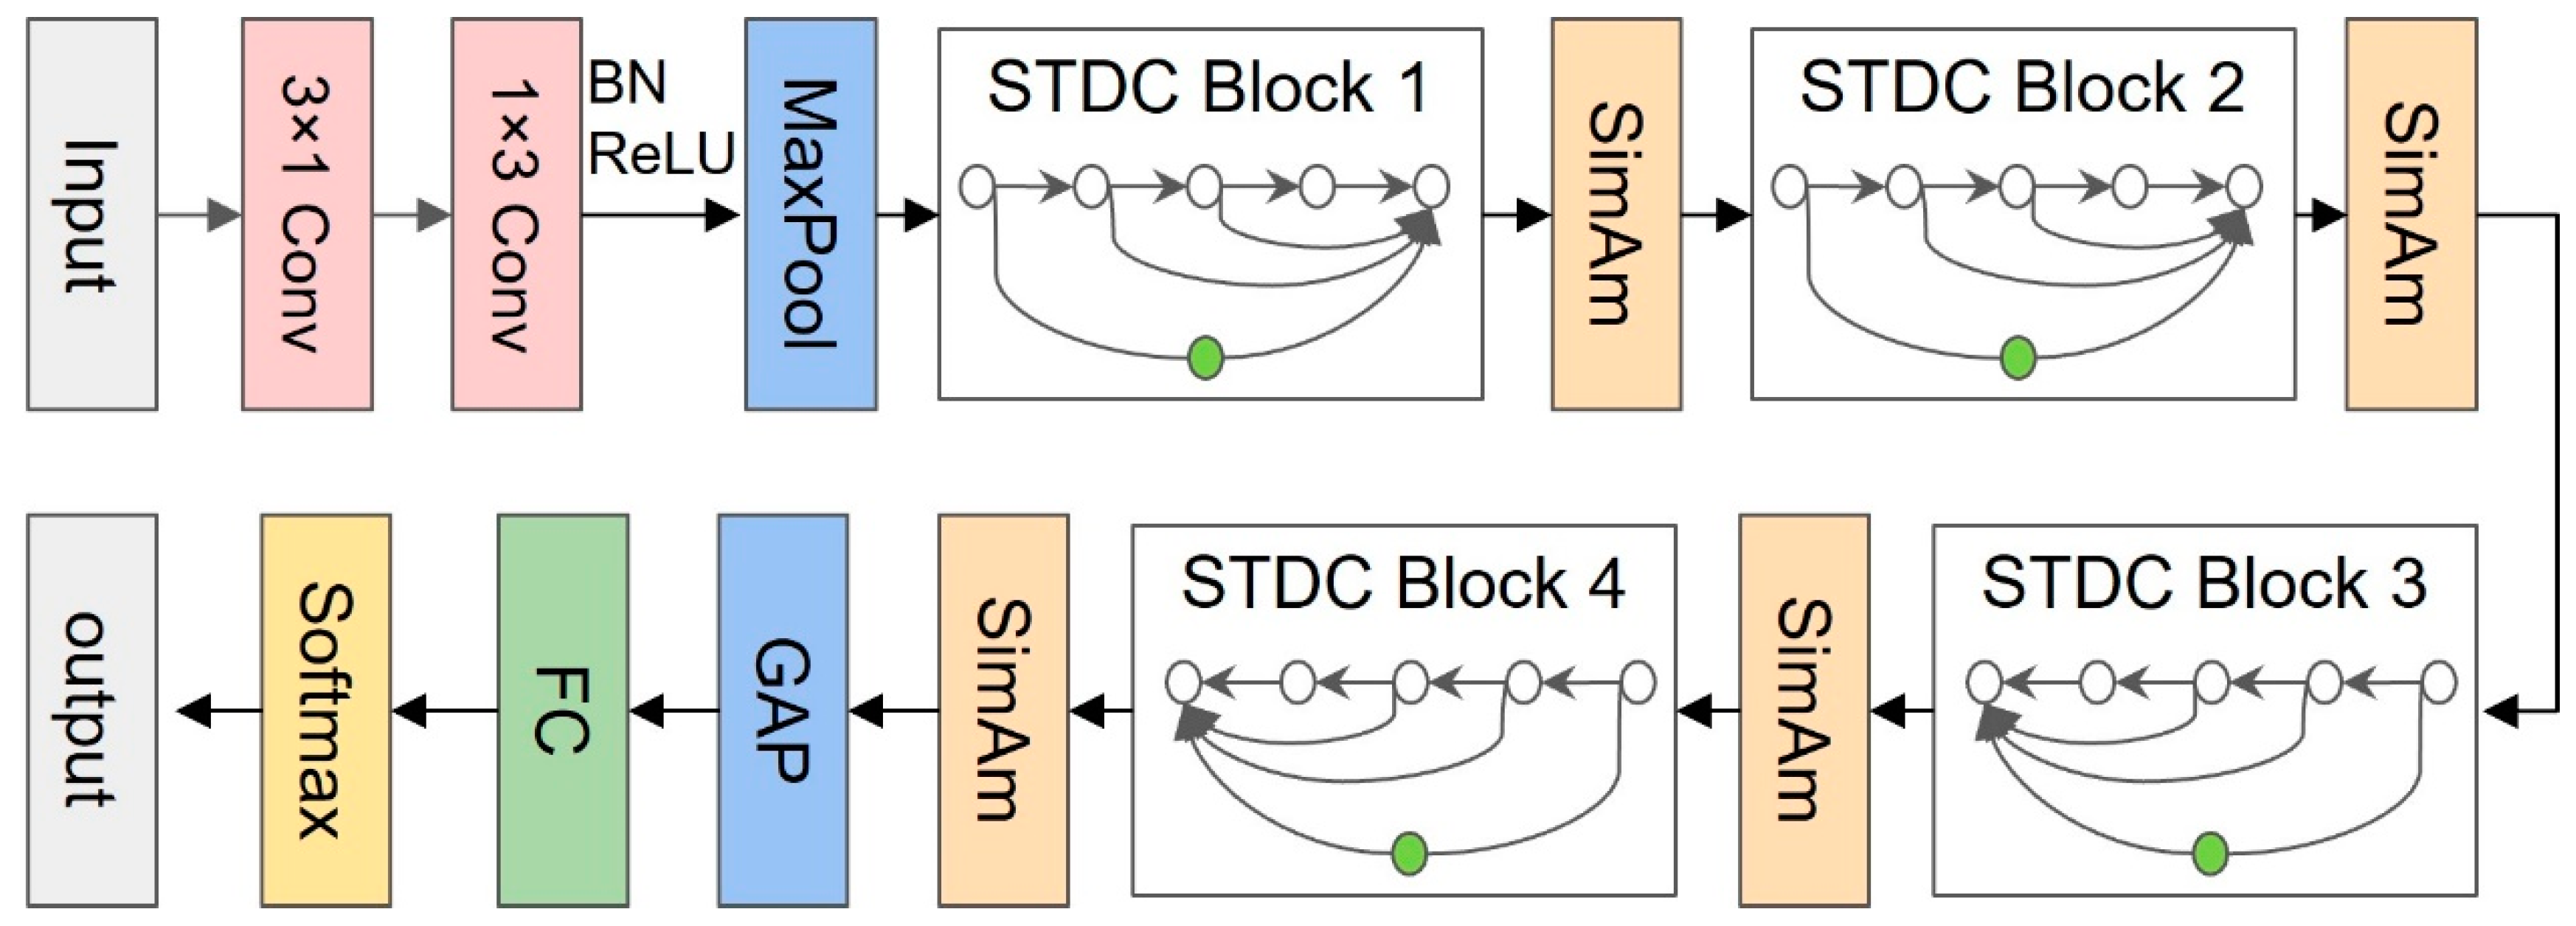
The overall structure of the lightweight tobacco flue-curing state recognition model (TFSNet) proposed in this paper is shown in Figure 6. The model first inputs the tobacco leaf image into a spatial separable convolution layer that consists of a 3 × 1 convolution followed by a 1 × 3 convolution, enhancing the extraction of texture features such as the tip, edge, and midrib of the tobacco leaf. It then undergoes a 3 × 3 max-pooling operation with a stride of 2. Next, it is connected to four improved Short-Term Dense Connection (STDC) modules, which can rapidly extract features from different deep layers of the image, strengthening the fusion of contextual features. The output of each STDC module is connected to a SimAm attention mechanism to further infer the three-dimensional weights of the feature map. The output feature map channels of the four improved STDC modules are 128, 256, 256, and 512 respectively. The feature map fused through multiple STDC modules is input into a global average pooling layer, followed by a fully connected layer, which uses the softmax function to output the final information on the 7 states of tobacco flue-curing.

Figure 6.
Structure of TFSNet.
2.3.1. Improved Short-Term Dense Concatenate Module
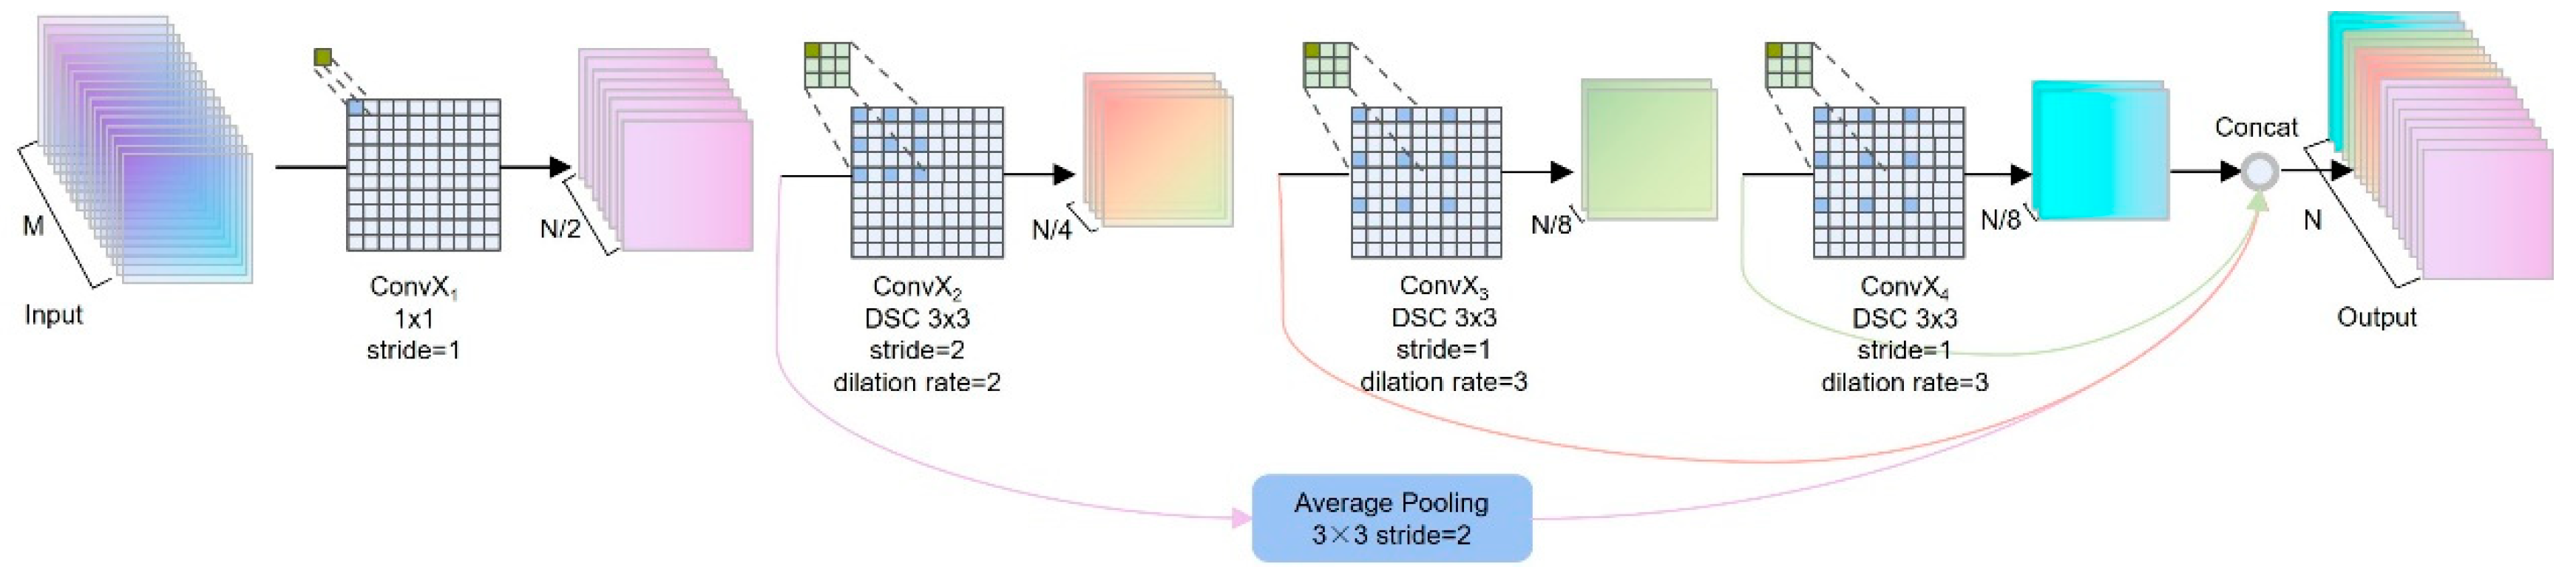
The key component of the improved lightweight network structure in this study is the Short-Term Dense Concatenate (STDC) module proposed by Fan et al. [23]. Its basic structure is shown in Figure 7. Specifically, each STDC module is divided into several convolution blocks, with ConvXi representing the operation of the ith block. Therefore, the output of the ith block is calculated as shown in Equation (4):
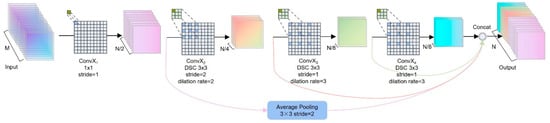
Figure 7.
Structure of STDC module.
In this setting, and represent the output and input of the i-th block, respectively. ConvX consists of a convolutional layer, a batch normalization layer (BN), and a ReLU activation layer, where ki denotes the kernel size of the convolutional layer. In the STDC module, the kernel size of the first block is set to 1, while the rest are simply set to 3. Given the number of channels N in the final output of the STDC module, the number of convolutional kernels in the ith block is N/2i, with the same number of kernels in the last two blocks. In the second convolutional block, the convolution stride is set to 2 for downsampling the feature maps. To enrich feature information, the output feature maps of X1 and Xn are connected through skip connections as the output of the STDC module. Prior to the connection, the output feature map of the first block in the STDC module is downsampled to the same size using average pooling with a kernel size of 3 × 3 for easier fusion operations. In the setting of this study, the final output of the STDC module is formulated as shown in Equation (5).
Here, represents the output of the STDC module, F is the fusion operation in this research method, and is the feature map from all n blocks. For operational efficiency, concatenation (Concat) is used as the fusion operation. The STDC module gradually reduces the size of the convolution kernel channels in a geometric series manner, significantly reducing computational complexity. Given input channel size M and output channel size N, the number of weight parameters for the STDC module is calculated as shown in Equation (6):
As shown in Equation (6), the number of parameters in the STDC module is mainly determined by the predefined input and output channel quantities, with the number of convolution blocks within the module having a minor impact on the parameter size. In particular, when n reaches its maximum limit, the number of parameters in the STDC module remains almost constant, defined solely by M and N.
The improved Short-Term Dense Concatenate module consists of 4 convolutional layers. ConvX1, similar to the original module, utilizes 1 × 1 pointwise convolutions to integrate channels of input feature maps and adjust the number of channels to half of the output feature map channels. ConvX2 introduces Depthwise Separable Convolutions, where the depthwise convolution in this layer employs dilated convolutions with different dilation rates. ConvX2 uses dilated convolutions with a dilation rate of 2, while ConvX3 and ConvX4 use dilated convolutions with a dilation rate of 3. A stride of 2 is set for the second convolutional layer to reduce the size of the feature maps.
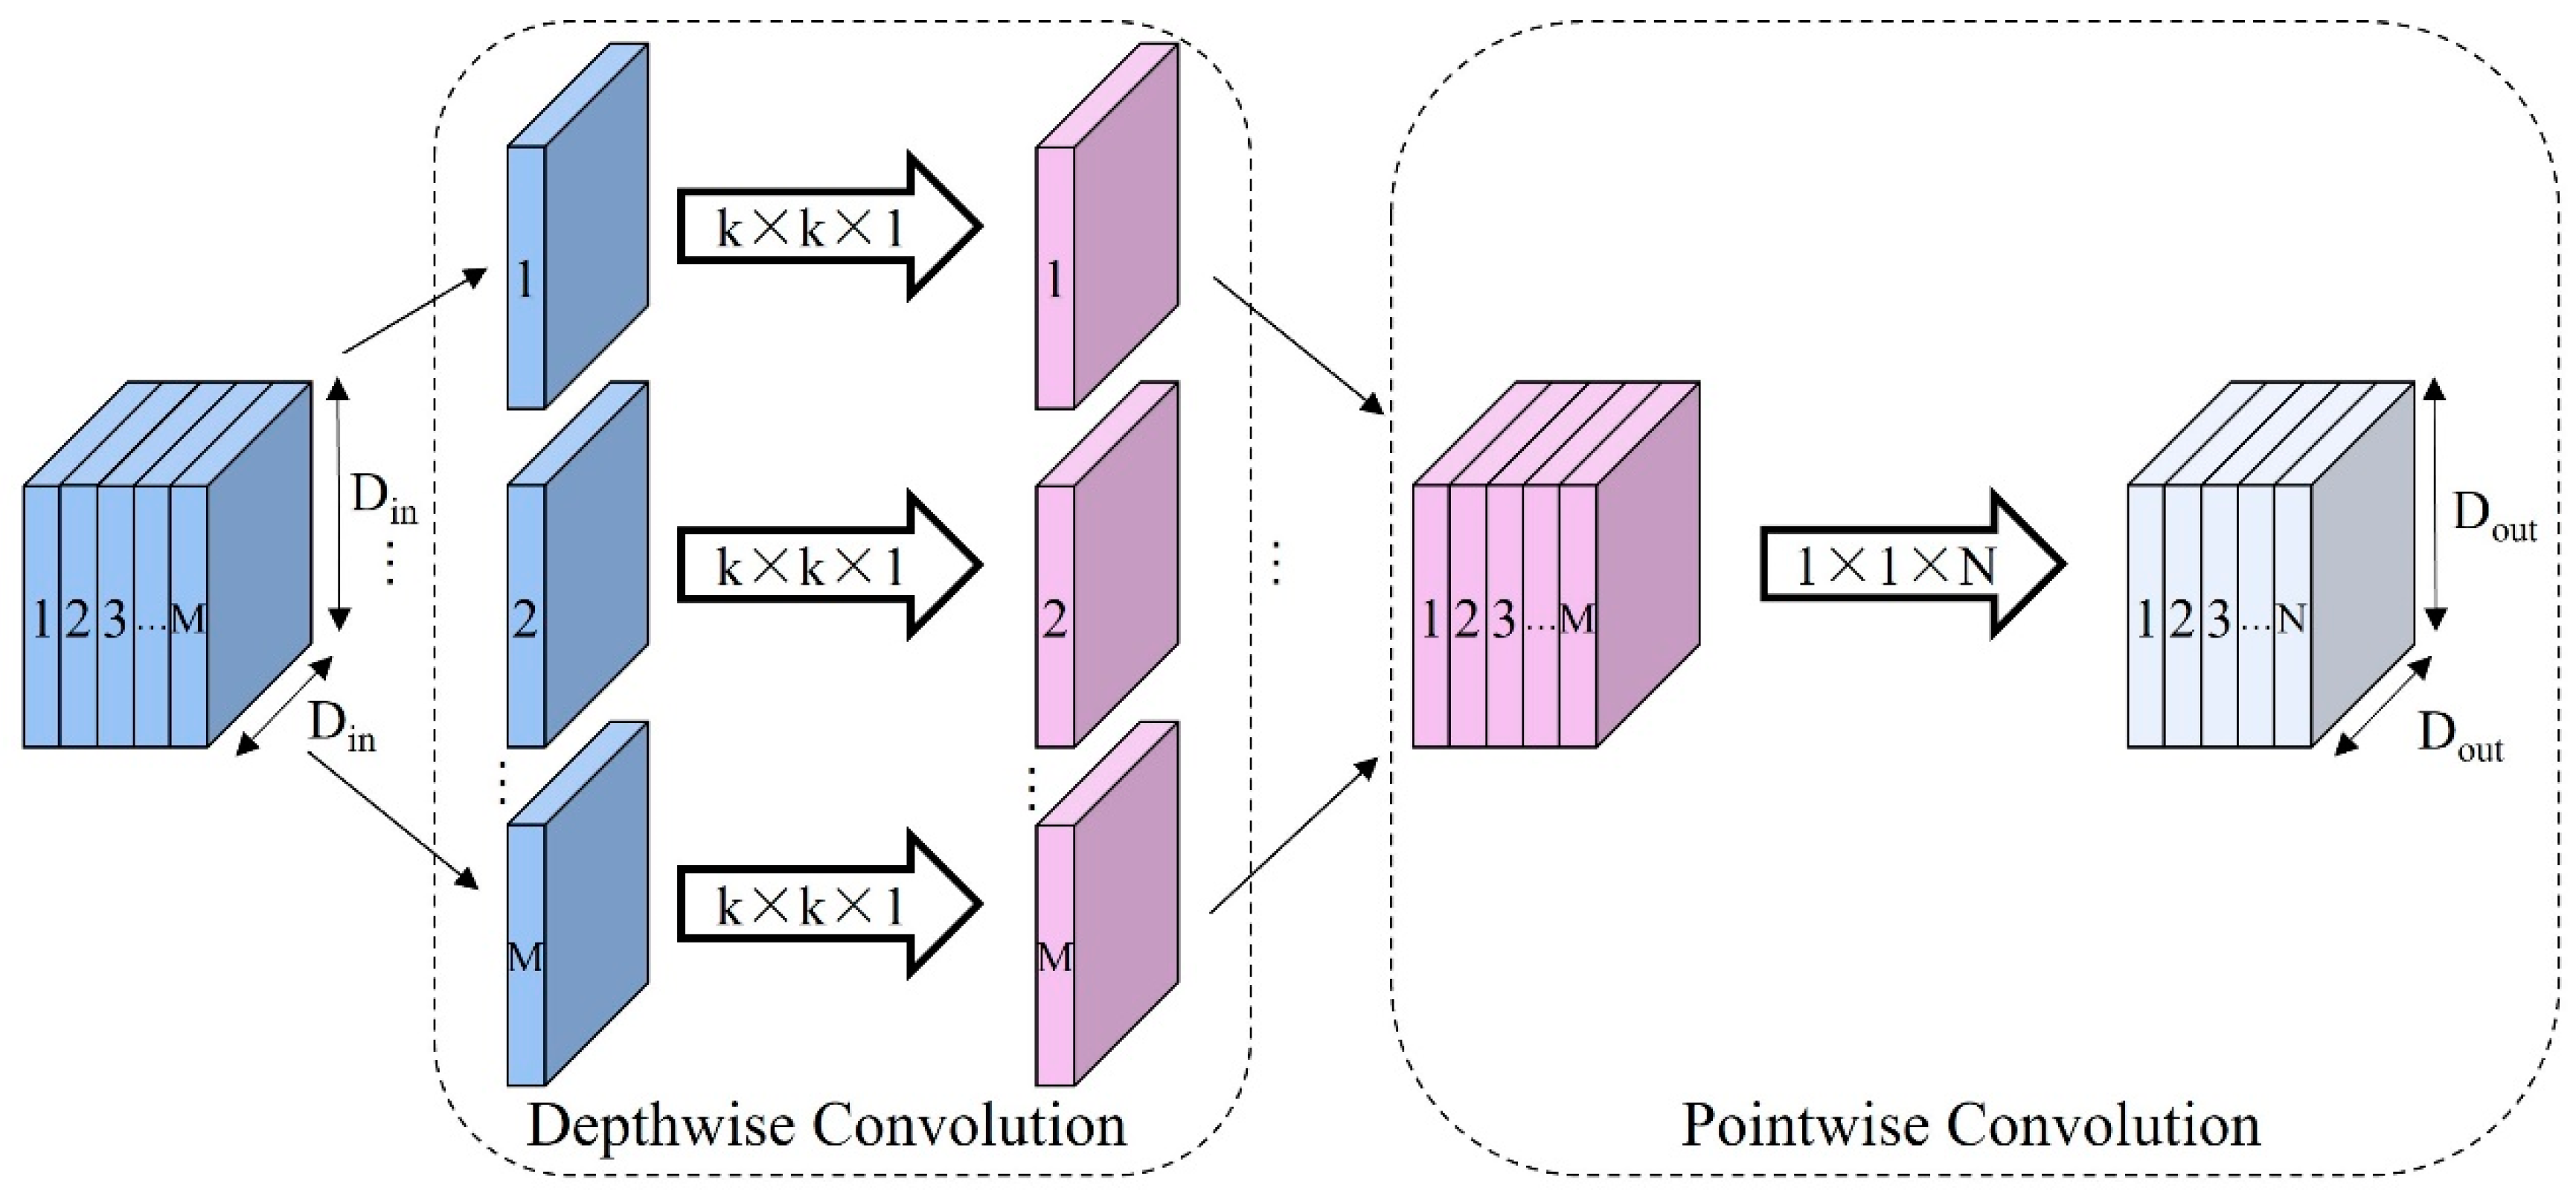
2.3.2. Depthwise Separable Convolution
This study introduces Depthwise Separable Convolution (DSC) to replace traditional convolutions in order to reduce the model’s parameter size and computational complexity. Depthwise Separable Convolution, as an improvement and optimization of standard convolution, was initially proposed by Sifre et al. [24]. Standard convolution operations achieve two tasks: extracting spatial feature information from image data and fusing spatial features across different channels. Depthwise Separable Convolution separates these two tasks by combining depthwise convolution with 1 × 1 pointwise convolution, effectively accomplishing each task independently. By combining depthwise and pointwise convolutions, the output feature maps are similar to those of standard convolution but with significantly reduced parameters and computational complexity, thereby improving computational speed.
Figure 8 specifically illustrates the processing procedure of Depthwise Separable Convolution. Assuming the input feature map size is Din × Din × M and the output feature map size is Dout × Dout × N, where the size dimensions correspond to the height, width, and number of channels of the feature map. The height and width dimensions of the convolution kernel are set to k × k. Therefore, the parameter quantity occupied by standard convolution is
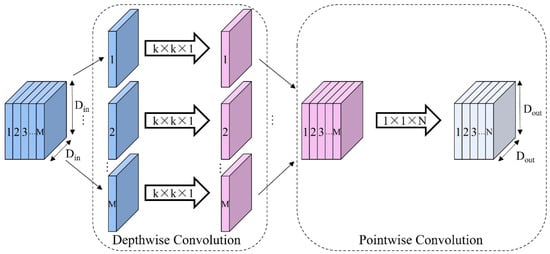
Figure 8.
Structure of Depthwise Separable Convolution.
The standard convolution is computed as
The total number of parameters in the Depthwise Separable Convolution is
The Depthwise Separable Convolution is computed as
The number of parameters and the amount of computation for the standard convolution and the Depthwise Separable Convolution are compared to obtain the ratio of Equations (11) and (12). Using Depthwise Separable Convolution reduces the number of parameters and computation by about 88% than using standard convolution.
2.3.3. Dilated Convolution
Typically, the process of image recognition using a convolutional neural network gradually reduces the size of the feature map in the pooling layer until the image is represented as a tiny feature map in which the spatial structure of the scene is difficult to recognize. This loss of spatial resolution makes it difficult for the model to extract detailed object information, which will limit the image recognition accuracy and lead to a decrease in task recognition accuracy. So, most research will improve the performance of the network by designing larger convolutional kernels and stacking more network layers. However, bigger and deeper network models will entail more numbers of parameters and longer inference times while improving classification accuracy. For this reason, this study uses dilated convolution to alleviate the above problems.
Dilated Convolution (DC) [26], also known as cavity convolution, is the addition of the concept of dilation rate r to the standard convolution. The dilation rate r affects the number of parameters and inter-parameter intervals within the convolution kernel, usually the number of intervals is equal to the dilation rate r − 1. When the dilation rate is 1 the dilated convolution is the same as the standard convolution, when the dilation rate is more than 1, the neighboring parameters within the convolution kernel are separated and the inter-parameter intervals are filled with the number 0, which does not take part in the weights update. The positions filled with the number 0 will be skipped when doing convolution calculation with the input feature map. When the dilatation rate is 2, the sensory field of the dilatation convolution is equivalent to the sensory field of the 5 × 5 standard convolution, while when the dilatation rate is 3, the sensory field of the dilatation convolution is equivalent to the sensory field of the 7 × 7 standard convolution. The larger the dilation rate, the larger the perceptual field and image spatial information that can be obtained from the dilation convolution.
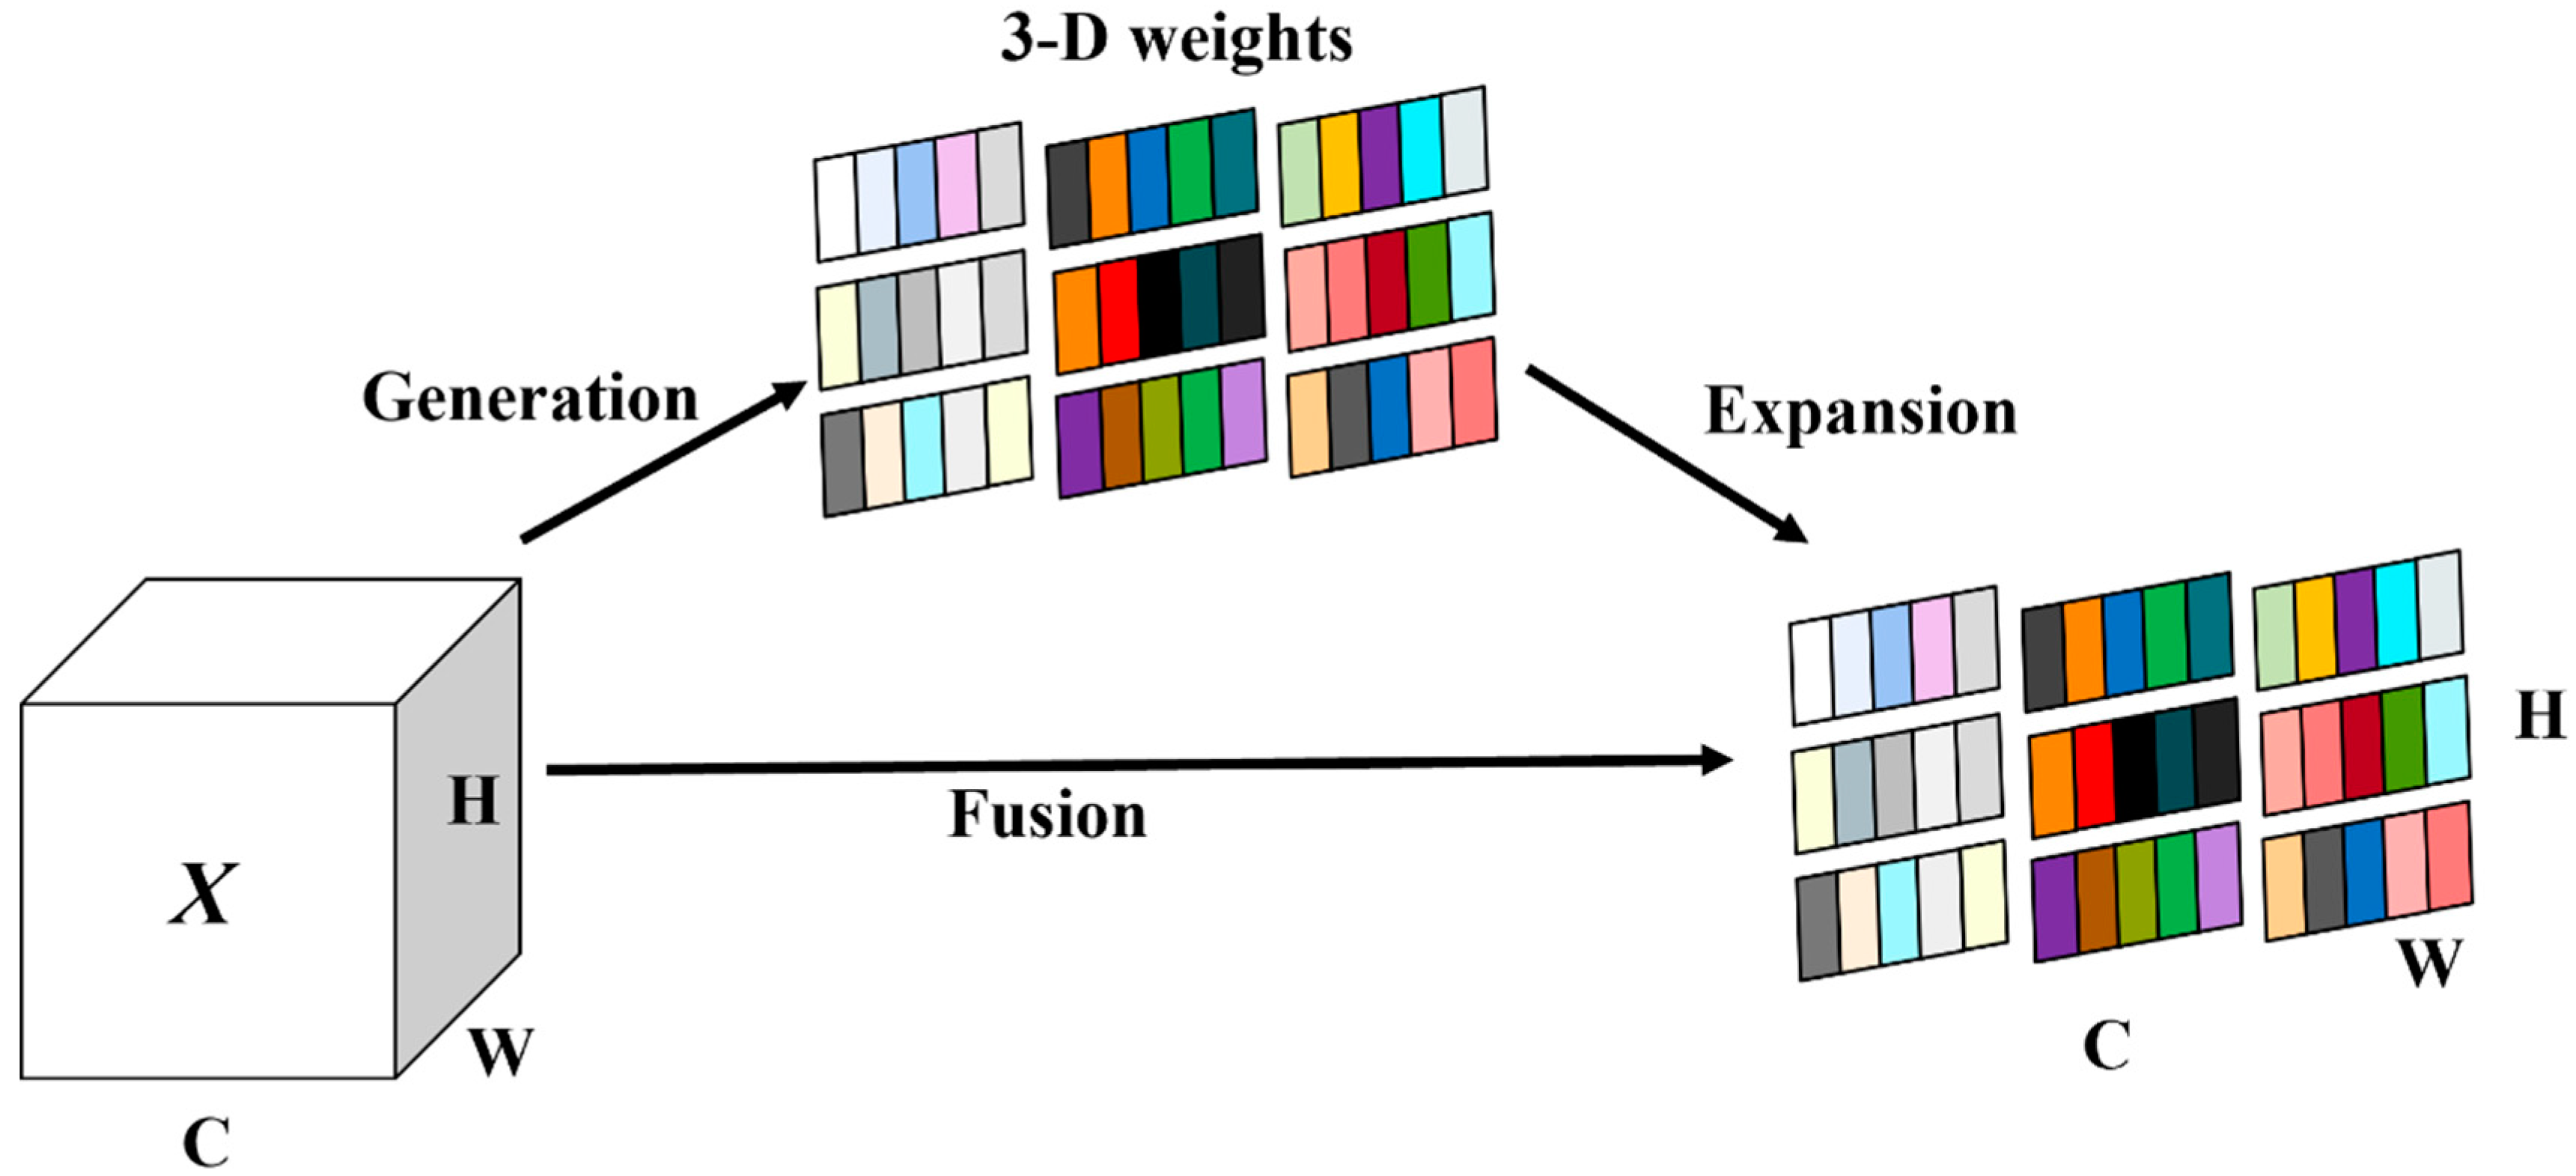
2.3.4. SimAm Attention Module
Since Depthwise Separable Convolution treats spatial features and channel features separately, it cannot directly capture the interaction information between the two, which may lead to the degradation of model performance. Therefore, this paper introduces the SimAm attention mechanism proposed by Yang et al. [25] based on the well-known neuroscience theory. Most of the existing attention modules can only refine the features along the channel or spatial dimension, and the learning of cross-channel and spatial variations is easily limited. As shown in Figure 9, the SimAm attention module can infer three-dimensional attention weights for the feature map without adding additional parameters. In simple terms, SimAm assigns higher importance to active neurons by means of an energy function, which enhances the extraction of important features and suppresses intrusive feature extraction in the channel or space. The minimum energy of a neuron can be calculated by the following equation:
where denotes the variance of all neurons, denotes the mean of all neurons on the channel, and λ is the regularization coefficient. When the energy is smaller, the neuron t is more different from the surrounding neurons and more important in the visual processing. After obtaining the importance of neurons, the features are refined by scaling operation as follows.
where E is the grouping of all of the tobacco feature map in terms of channel and spatial dimensions, and the sigmoid is added to limit excessively large E values. ⊙ denotes the scaling operation. X is the input feature, and is the enhanced feature.
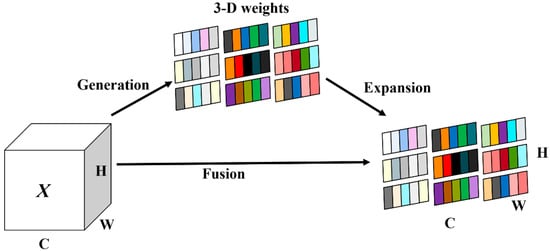
Figure 9.
Full 3D weights for attention. X denotes the input feature map. C denotes the number of channels of the feature map. H and W denote the height and width of the feature map, respectively.
3. Results
3.1. Test Environment and Evaluation Metrics
In this paper, the model training environment configuration was the following: Intel Core i7-11700K, 3.6 GHz, an NVIDIA GeForceRTX 3090 GPU using an Ubuntu 16.04 operating system, Python 3.8, CUDA 11.3, cuDNN 7.6.0, and Pytorch library 1.11.0.
The model training parameters were set as follows: input image size of 224 px × 224 px, sample batch size of 128, and the number of data iteration rounds epoch of 100. The optimizer used was the stochastic gradient descent, the momentum factor was 0.937, and the weight decay coefficient was 0.0005. The initial learning rate was 0.001.
In this paper, the relevant metrics for evaluating the performance and effectiveness of the model were Accuracy, Precision, Recall, F1 Score, Params, FLOPs, the size of storage space, and the inference time. They can be calculated by the following equations:
where TP (True Positive) represents the number of true positives, FN (False Negative) represents the number of false negatives, and FP (False Positive) represents the number of false positives. Precision represents the proportion of correct test results in the total test results, and Recall represents the proportion of correct test results in all true values. The F1 score result is related to the precision and recall of the classification model, which can be regarded as the reconciled average of the model’s precision and recall, with a maximum of 1 and a minimum of 0. The larger the score is, the better the overall performance of the model.
Params and FLOPs can be calculated by the following equations:
where Cin and Cout denote the number of channels in the input convolutional layer and output convolutional layer, respectively, kw and kh denote the width and height of the convolutional kernel, respectively, and H and W denote the width and height of the feature map in the output convolutional layer, respectively. The Params and FLOPs are commonly used to measure the complexity of algorithms and models, which allows for a better evaluation of the overhead of the model. The detection time is the forward inference time on the CPU of the curing barn data acquisition industrial controller, CPU model Intel N5095.
3.2. Inffuence of Color Calibration on Experimental Results
To verify the effect of color calibration on the classification results of this paper, STDCNet under standard convolution was used to train the datasets with and without color calibration, respectively. As can be seen from Table 2, compared with the dataset without color calibration, the model improved the precision of the dataset with color calibration by 1.6 percentage points, the recall by 1.9 percentage points, and the F1 value by 1.8 percentage points. In addition, after using color calibration, the model’s ability to identify the various states of tobacco flue-curing was improved, and all seven states were improved in terms of precision rate, including the fresh tobacco state by 6 percentage points, the initial yellowing state by 3.4 percentage points, and the dry flake state by 2.6 percentage points. In terms of recall, the yellowing state was improved by 9.7 percentage points, and the initial yellowing state was improved by 4 percentage points. In terms of F1 score, there was an increase in all states, with a 5.4 percentage point increase in the yellowing state and a 3.7 percentage point increase in the initial yellowing state.
Table 2.
Color correction experiment results.
The experimental results show that, compared to the original dataset, the classification performance of the model was better improved by using color-corrected images, which had a greater impact on the fresh tobacco state, the initial yellowing state, the yellowing state, and other states where the color changes were obvious and the changes were continuous. Therefore, color calibration can well restore the actual color of tobacco leaves and avoid the misclassification of images during the transition between two states, which played an important role in improving the recognition accuracy of the model.
3.3. Ablation Experiment
In order to reduce the parameters and enhance the ability of the shallow network of the model to perceive the features such as curling and shrinking of the changing process of tobacco roasting, the first conventional 3 × 3 convolutional layer of the model was replaced with spatially separable convolutional layers with convolutional kernel sizes of 3 × 1 and 1 × 3, and the results are shown in Table 3. Compared to using the regular 3 × 3 convolution block, the model with spatially separable convolution increased the accuracy by 0.43 percentage points and reduced the number of parameters by 6885. Introducing dilation convolution in the STDC module expanded the deep network perceptual field, and as can be seen from the results in Table 3, the dilation convolution similarly reduced the number of parameters and increased the model’s accuracy to 98.32%, which further improved the performance of the model. In addition, after the introduction of the depth-separable convolution, the parameters of the model were reduced by about 73.3% of the number of parameters compared with the original, and the floating-point computation was reduced by about 51.93%. The reduction in the params and the FLOPs led to a 20% reduction in the inference time of the model as well.
Table 3.
The results of ablation experiment.
Due to the limited ability of Depthwise Separable Convolution in capturing global information, comparative experiments were conducted on model that used Depthwise Separable Convolution as a baseline, with additional variations involving the separate integration of spatially separable convolution and dilated convolution for enhanced comparison. Furthermore, a model applying all three convolution methods simultaneously was also tested. The results indicated that the utilization of spatially separable convolution and dilated convolution could both offset the accuracy loss stemming from Depthwise Separable Convolution, thereby enhancing the model’s performance. To further augment the model’s capabilities, a SimAm attention module was appended after the output of each STDC module. As evident from the results presented in Table 3, this addition elevated the model’s accuracy to 98.71% without any increase in params, thereby ensuring both its lightness and significantly improved recognition ability.
3.4. Comparison of Results Using Different Attention Modules
In order to investigate the impact of various attention mechanisms on the model, five distinct attention modules, SE, CA, CBAM, ECA, and SimAm, were integrated after the output of each STDC module. The experimental results, summarized in Table 4, revealed a decline in performance for models incorporating CBAM and ECA attention mechanisms. This is primarily attributed to CBAM’s introduction of additional parameters, which can lead to overfitting issues and ECA’s emphasis on long-distance channel dependencies, potentially neglecting spatial information in complex images, particularly those involving tobacco leaves during the roasting process. Models using SE and CA attention exhibited minimal improvements, with accuracy gains of up to 0.24 percentage points. However, CA attention demanded significant computational resources, increasing computational overhead. In contrast, the SimAm attention module employed in this study stands out due to its utilization of three-dimensional weights, allowing it to learn more discriminatory features related to tobacco leaf color and texture. This effectively balances model complexity and performance, achieving an impressive accuracy of 98.71%, a precision rate of 98.56%, and a recall rate of 98.57%, all while maintaining consistent parameters and FLOPs.
Table 4.
Comparison of results using different attention modules.
3.5. Comparative Analysis of the Different Models
In order to comprehensively evaluate the competitiveness of the TFSNet model in terms of performance, this paper compares it with various mainstream convolutional neural network (CNN) models, including ResNet18 [30], EfffcientNet [31], EfffcientNetV2 [32], MobileNetV3 [33], MobileNetV4 [34], and ShufffeNetV2 [35]. Additionally, given the widespread use of Transformer technology in computer vision, this paper also includes a comparison with MobileVit [36] and FastVit [37], which are lightweight Transformer models that have demonstrated outstanding performance in recent years.
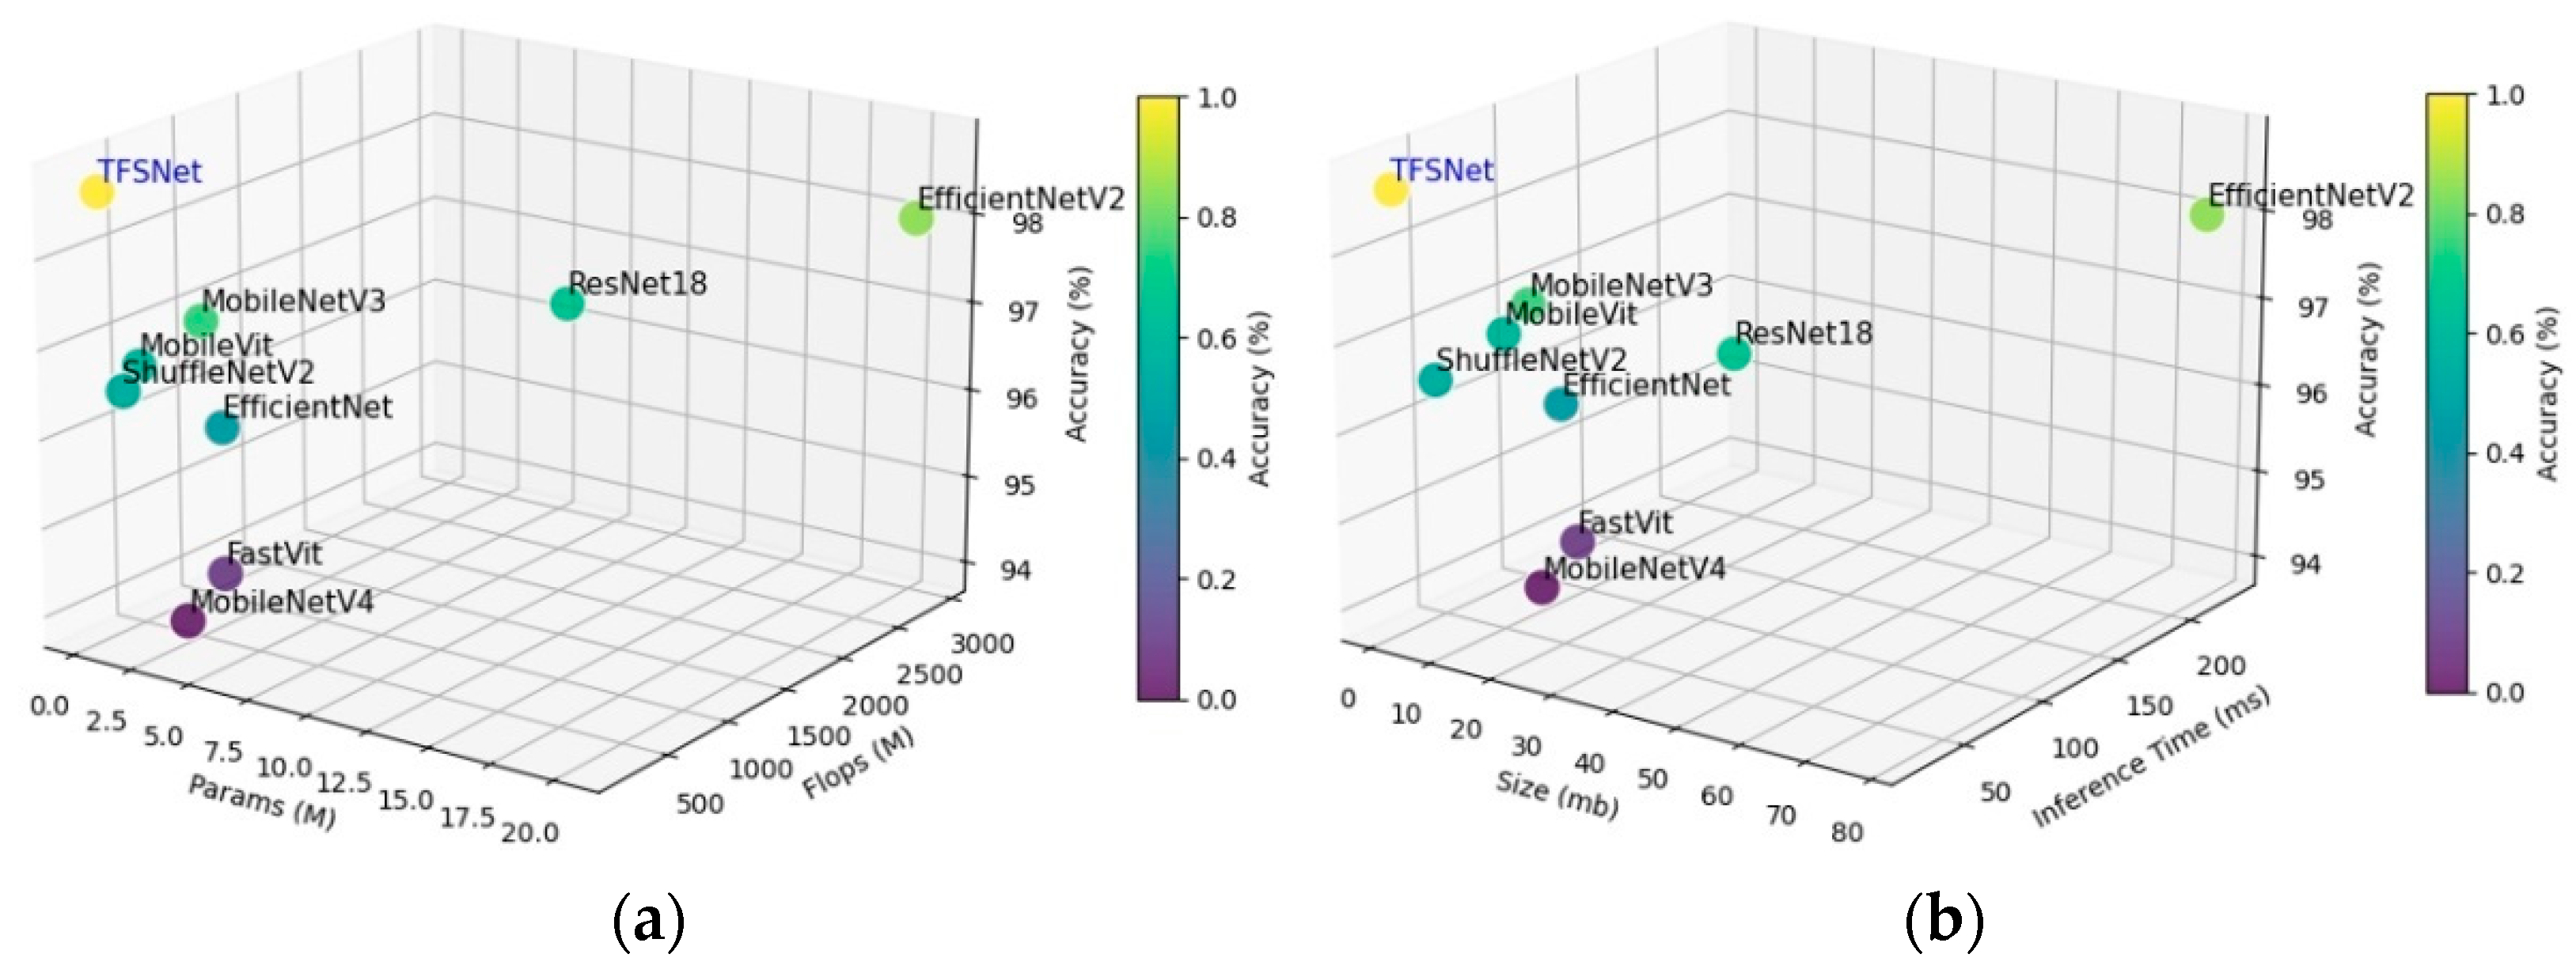
Table 5 showed that the TFSNet model proposed in the paper had an accuracy of 98.71%, a precision of 98.56%, and a recall of 98.57% for identifying tobacco flue-curing states. These values were higher than those of the comparison models. The TFSNet model had a model parameter count of only 0.203 M, making it more dominant in terms of the number of parameters compared to other models. For instance, it was only 1.816% of Resnet18 and 0.999% of EfficientNetV2 in terms of model parameters. Even when compared to models with fewer parameters, such as ShuffleNetV2, MobileVit, and MobileNetV4, TFSNet still stood out with their low parameter counts. Additionally, in terms of computational intensity, TFSNet was only 20.7 M more intensive than ShuffleNetV2, yet it outperformed it. Thanks to the reduced number of parameters, the model size of TFSNet was 0.78 mb, and its inference time for a single image was 21 ms, which was a significant reduction compared to other models. Figure 10a,b clearly illustrates the TFSNet model’s higher accuracy rate, demonstrating its ability to improve the recognition of features such as leaf surface and leaf stems in the tobacco curing process. Furthermore, the TFS-Net model excelled in recognition efficiency due to its fewer parameters, reduced computation, and shorter inference time.
Table 5.
Comparison of results using different model.
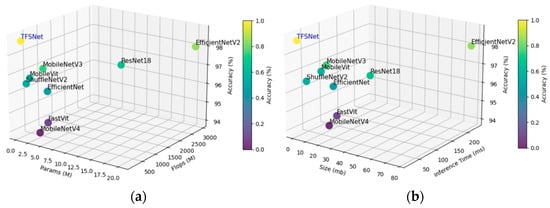
Figure 10.
Performance comparison of TFSNet with other models. (a) Comparison of model accuracy, number of parameters, and FLOPs. (b) Comparison of model accuracy, size, and inference time.
3.6. Results of Identification of Different States of Tobacco Flue-Curing
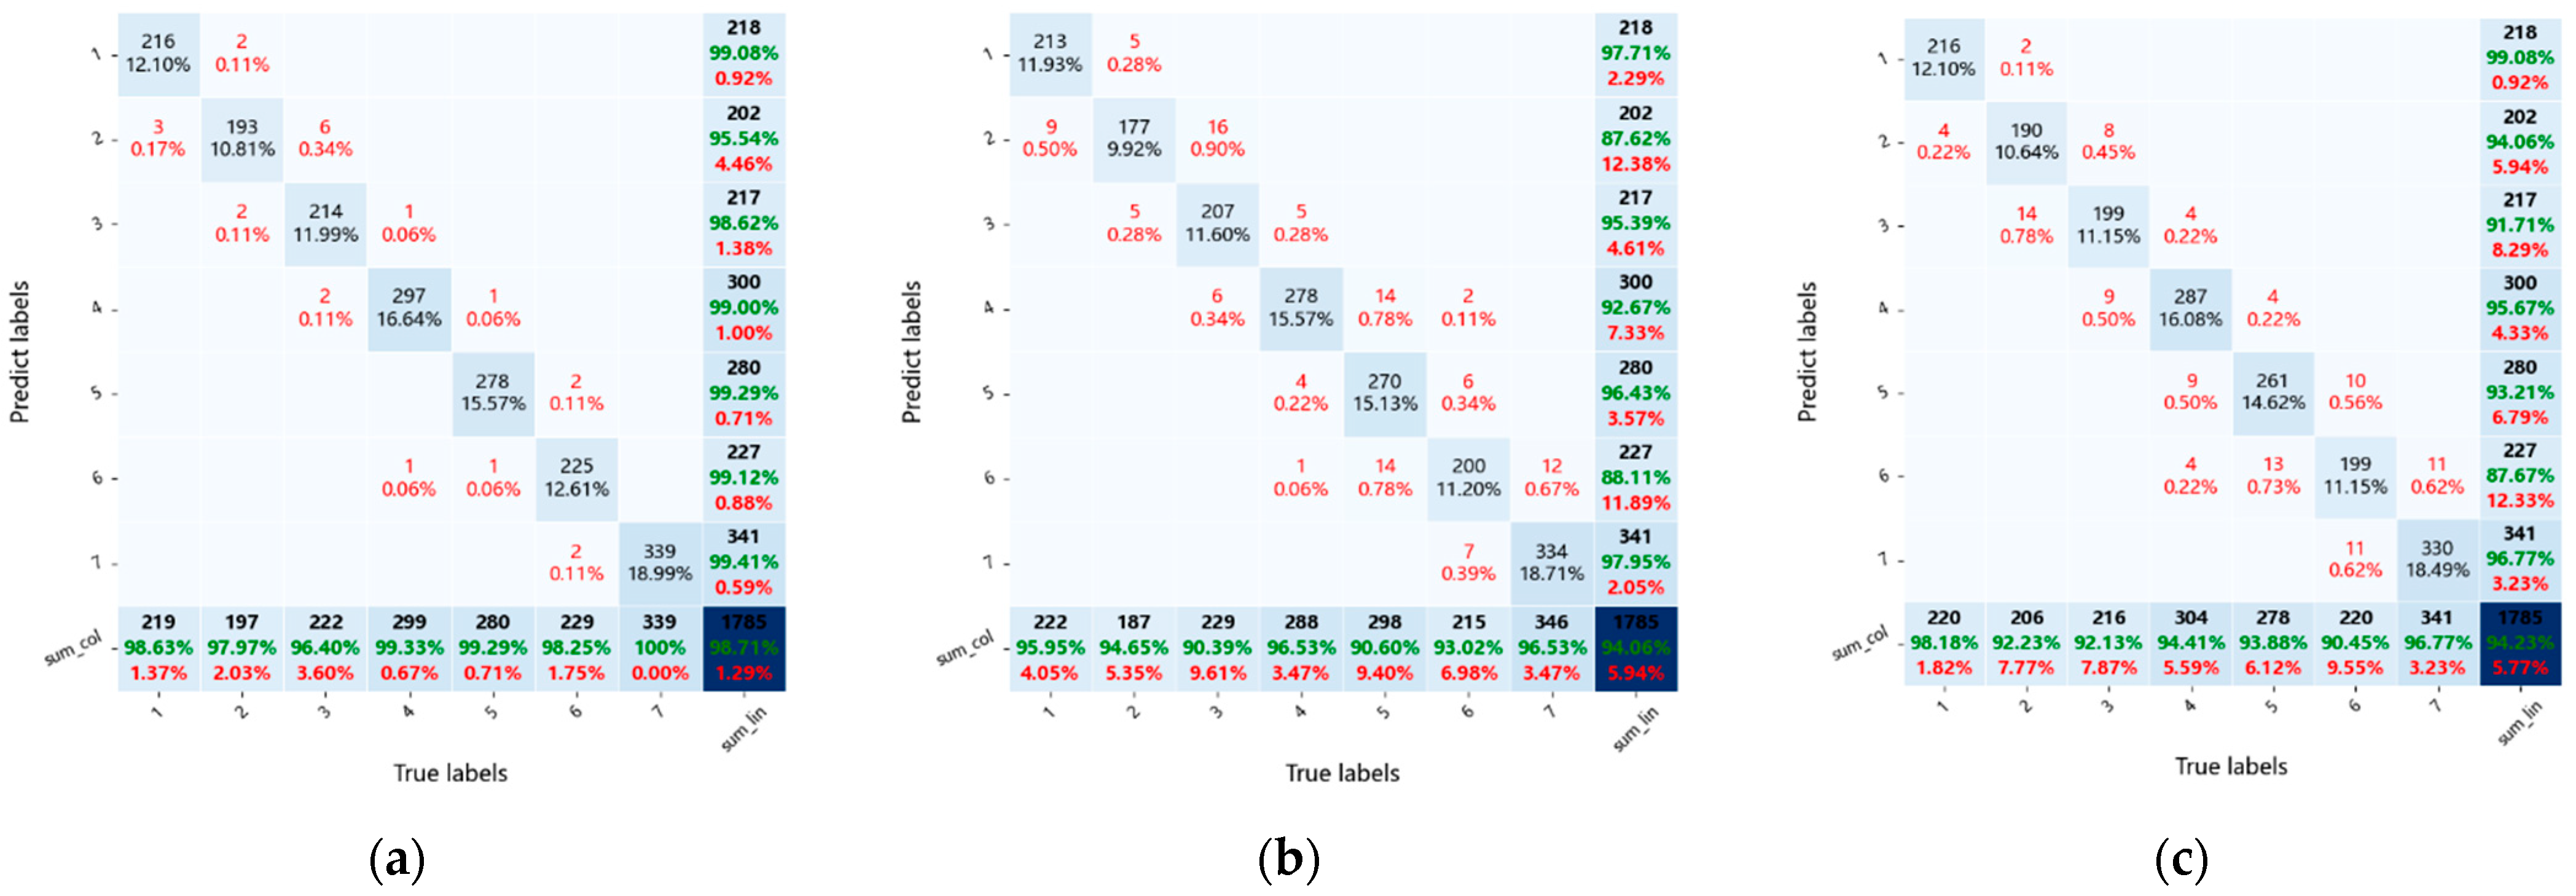
In order to analyze the recognition effect of the TFSNet model on different states of tobacco flue-curing, experiments were conducted on the test set. As can be seen from the confusion matrix in Figure 11a, in general, the vast majority of the test data were distributed on the diagonal of the confusion matrix, and the TFSNet model achieved good results in recognizing different curing states, with the precision rate exceeding 96% and the recall rate exceeding 95%. In addition, two adjacent curing stages that were more misidentified by the model, for example, images in the yellowing state were misidentified as initial yellowing state in six cases, and images in the fresh tobacco state were misidentified as initial yellowing state in three cases. According to the tobacco curing process of Figure 3, the curing of the tobacco into the next state involved a period of 2–8 h of heating. At the beginning of the heating, the surface changes of the tobacco were not obvious. The appearance of the tobacco leaf at the end of the previous state was highly similar to the appearance of the tobacco leaf at the beginning of the latter state, thus making it prone to misidentification. According to Figure 11b,c, TFSNet reduced the misidentification of adjacent states compared to the less effective MobileNetV4 and FastVit.

Figure 11.
Test set confusion matrix. Horizontal and vertical coordinates 1–7 indicate the seven states of tobacco flue-curing, respectively. The values of the first seven green marks in row 8 are the precision rate of each state. The values of the first 7 green marks in the 8th column are the recall rate of each state. The value marked in red is the error rate. The value of the green scale in the cell in row 8 and column 8 is the accuracy of the model in the test set. (a) Confusion matrix for TFSNet. (b) Confusion matrix for MobileNetV4. (c) Confusion matrix for FastVit.
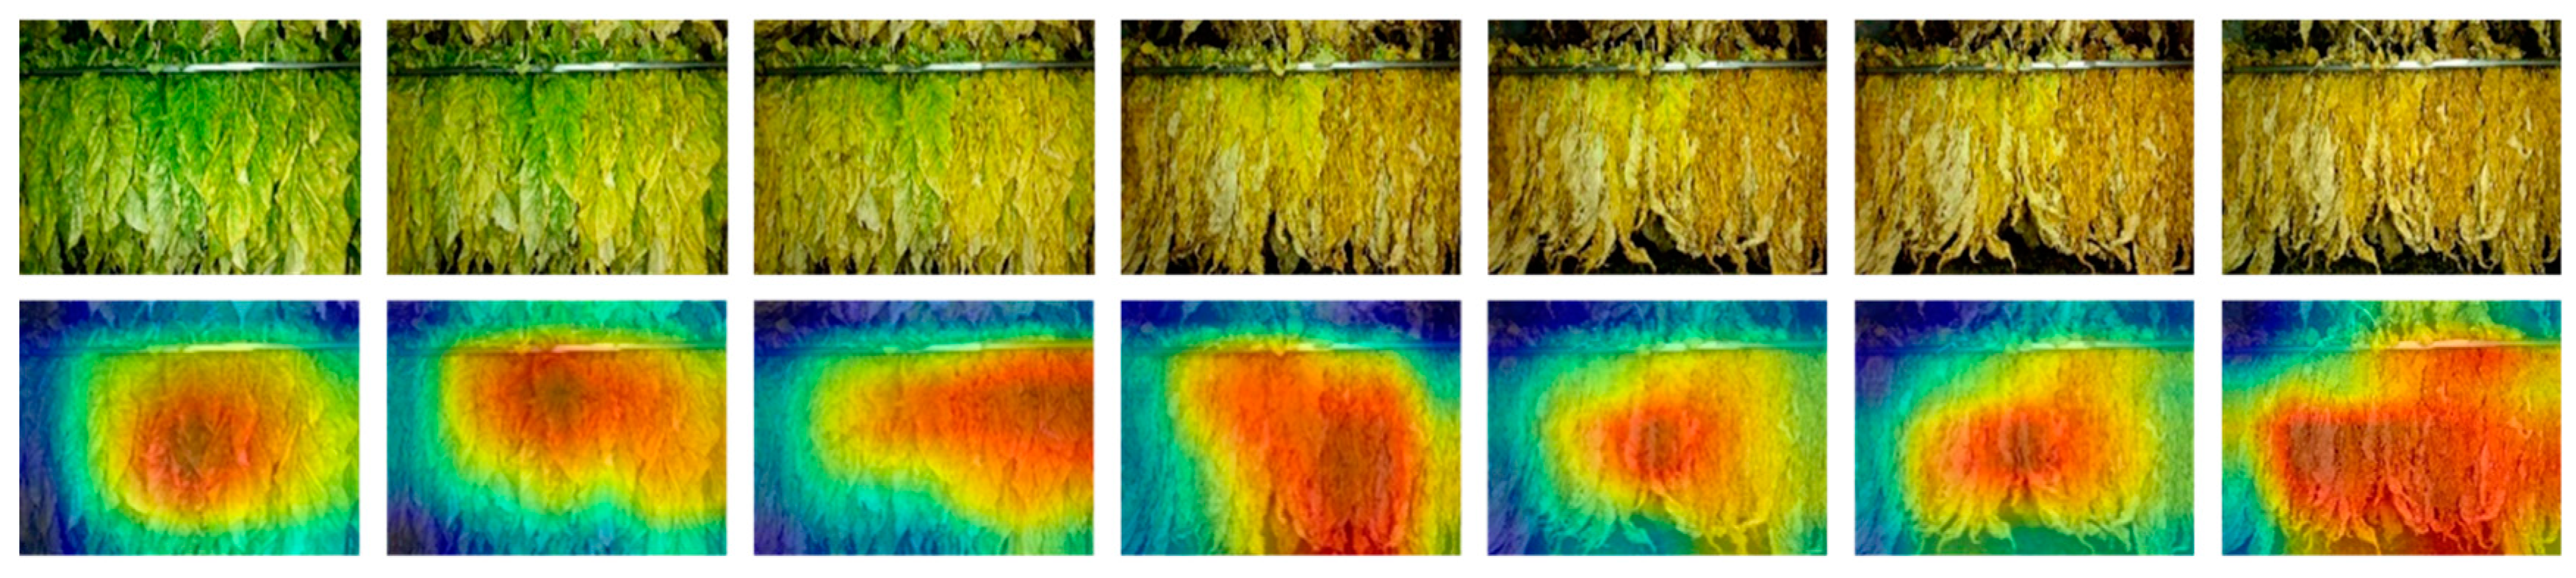
In order to further verify the feature perception ability of the model and understand the region of interest of the model, this study used the Grad-CAM method to obtain the model recognition heat map and used the gradient information of the last layer of the model to calculate the channel weights for the visualization of the class activation mapping, and the results are shown in Figure 12. By observing the heat maps of the seven states of tobacco flue-curing, it can be found that the model is able to capture the key information of the tobacco images at different states, and the activation region is able to provide a more complete coverage of the whole tobacco. In the fresh tobacco state and initial yellowing state of tobacco flue-curing, the model pays more attention to the overall leaf surface. In the yellowing state, the model has a stronger ability to perceive the obvious yellowing areas. In the yellowing and withering and tendon changing states, the focus of the model begins to move toward the curled leaf tips and leaf edges. In the dry flake and dry tendon states, the model gradually went to focus on the region of leaf stalks. Therefore, based on the above analysis, the model proposed in this study has a good ability to perceive and express the features of the whole process of tobacco roasting, and it has good recognition ability.
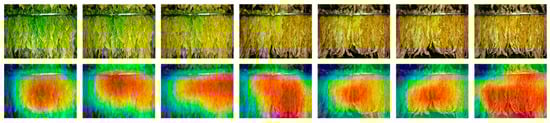
Figure 12.
Heat map of the seven curing states. Darker red areas in the heat map indicate a greater contribution to the prediction of tobacco flue-curing states. Conversely, blue areas can be considered unimportant to model judgements.
4. Discussion
In the tobacco flue-curing process, unsorted harvested tobacco is directly placed into clamps, resulting in sticks with a mix of leaf frontal, leaf reverse, and overlapping leaf parts on their surfaces. Research indicates that the color difference of tobacco changes significantly before reaching the curing temperature of 42 °C due to the degradation of tobacco pigments during the initial yellowing and yellowing stages [38]. Additionally, a faster heating speed during the yellowing and withering stages is more likely to cause greening and ash residue on the leaves after curing [39], which can be attributed to differences in the maturity of the harvested tobacco.
The model’s ability to recognize the tobacco flue-curing state was affected by various factors. Therefore, to achieve accurate recognition, the model had to consider both local and global feature extraction. The TFSNet, developed in this study, utilized spatially separable convolution in shallow feature extraction to enhance the model’s ability to extract local features. In addition, the model employed dilated convolutions with different dilation rates in deep feature extraction to expand the sensory field. The model also integrated the SimAm attention module to derive 3D weights for the feature map, further enhancing global feature extraction. Analysis showed that TFSNet had a significant feature attention area for tobacco. Among the CNN models, MobileNetV4 performed the worst, as it focused more on optimizing model complexity rather than improving feature extraction. Despite the introduction of the Extra Depthwise (ExtraDW) variant block, the increase in the sensory field was limited, sacrificing the model’s feature extraction capability. FastVit, a lightweight Transformer model, used a large convolutional kernel to increase the receptive field, but the localized convolution operation in a specific region may have led to the loss of overall contextual information. Figure 11b,c illustrates that MobileNetV4 and FastVit had a high percentage of misrecognition of adjacent tobacco states.
The TFSNet model developed in this study emphasized lightness and efficiency. The results reveal that the TFSNet model had only 0.203 M parameters, a model size of 0.78 MB, and an inference time of 21 ms for a single image, all of which were crucial for real-world production processes. In contrast, EfficientNetV2 exhibited the longest inference time of 231 ms due to its large number of parameters and floating-point computations. Additionally, despite having lower parameter counts and FLOPs, MobileVit and FastVit did not show an advantage in inference time compared to other CNN models. This was attributed to the computational complexity of the Transformer model’s self-attention mechanism, which had a complexity of O(n2) for input sequences of length n, resulting in significant time overhead for long sequences. Given the large-scale production of curing tobacco, future research could explore the integration of cloud computing, Internet of Things, and other technologies to enable the intelligent recognition of tobacco flue-curing processes and end-to-end curing barn environment control. Smaller model inference times could reduce computational overhead for edge devices, making them suitable for handling concurrent model inference requests and quickly returning recognition results, thereby enhancing tobacco flue-cured production control.
5. Conclusions
In this paper, a recognition model based on Short-Term Dense Concatenate was proposed to achieve fast and accurate recognition of tobacco flue-curing process state identification. In order to alleviate the problem of tobacco color distortion in the dataset, this paper adopted a standard color card for color correction of the dataset to improve the recognition ability of the model. After the color correction, the precision of the model increased by 1.6 percentage points, the recall increased by 1.9 percentage points, and the F1 value increased by 1.8 percentage points. Among them, the image features of the tobacco leaves in the adjacent stages of the fresh tobacco state, initial yellowing state, and yellowing and withering state were relatively similar, which can easily lead to misrecognition in the curing state. The STDC module, Depthwise Separable Convolution and spatial separable convolution module used in the model designed in this paper could make the model parameters and computation amount greatly reduced, the final parameters of the model was only 203,058, and the FLOPs was 172.39 M. Regarding the use of dilated convolution, the SimAm attention mechanism could improve the performance of the model, which achieved 98.71% accuracy, 98.56% precision, and 98.57% recall on the test set. Compared to the mainstream models, TFSNet was only 1.816% of Resnet18 and 0.999% of EfficientNetV2 in terms of it model parameters. The model size of TFSNet was 0.78 mb, and its inference time for a single image was 21 ms, which was a significant reduction compared to other models. Therefore, for the state identification problem of the tobacco flue-curing process, the comprehensive index of the TFSNet model proposed in this paper was more dominant, which provides technical support for the automated production of tobacco.
Author Contributions
Conceptualization, J.X. and Y.H.; methodology, Y.H.; software, H.W., K.T. and K.L.; validation, Y.H., K.T. and K.L.; formal analysis, Y.Z. and H.W.; investigation, Y.H. and Y.Z.; resources, Y.Y. and L.L.; data curation, Y.H.; writing—original draft preparation, Y.H. and J.X.; writing—review and editing, J.X. and H.W.; visualization, Y.H.; supervision, Y.Z.; project administration, J.X. and Y.Z.; funding acquisition, Y.Y. and L.L. All authors have read and agreed to the published version of the manuscript.
Funding
This work was funded by Guangdong Province Tobacco Science and Technology Project (2021440000240143), Guangdong Provincial Science and Technology Programme Project (2023A0505050130), and Guangzhou Science and Technology Programme Project (2024B03J1357).
Data Availability Statement
The data are contained within the article.
Acknowledgments
The authors wish to thank the anonymous reviewers for the useful comments in this paper.
Conflicts of Interest
The authors declare no conflicts of interest.
Abbreviations
The following abbreviations are used in this manuscript:
| STDC | Short-Term Dense Concatenate |
| SSC | Spatially Separable Convolution |
| DSC | Depthwise Separable Convolution |
| DC | Dilated Convolution |
| TFSNet | Tobacco Flue-Curing State Recognition Network |
| CA | Coordinate Attention |
| SE | Squeeze and Excitation |
| CBAM | Convolutional Block Attention Module |
| ECA | Efffcient Channel Attention |
| SimAm | A Simple, Parameter-Free Attention Module |
References
- Fu, L.; Ye, L. China Statistical Yeakbook 2023; China Statistics Press: Beijing, China, 2023; pp. 327–404. ISBN 978-7-5230-0190-5.
- Wu, J.; Yang, S.X.; Tian, F. An adaptive neuro-fuzzy approach to bulk tobacco flue-curing control process. Dry. Technol. 2017, 35, 465–477. [Google Scholar] [CrossRef]
- Zhu, W.; Wang, Y.; Chen, L.; Wang, Z.; Li, B.; Wang, B. Effect of two-stage dehydration on retention of characteristic flavor components of flue-cured tobacco in rotary dryer. Dry. Technol. 2016, 34, 1621–1629. [Google Scholar] [CrossRef]
- Lu, X.R.; Li, L.G. The factors of affecting tobacco baking quality by using the three-step technology in Guizhou. Guizhou Agric. Sci. 2009, 7, 41–42. [Google Scholar]
- Sumner, P.E.; Moore, J.M. Harvesting and Curing Flue-Cured Tobacco; University of Georgia: Athens, GA, USA, 2009. [Google Scholar]
- Rehman, T.U.; Mahmud, M.S.; Chang, Y.K.; Jin, J.; Shin, J. Current and future applications of statistical machine learning algorithms for agricultural machine vision systems. Comput. Electron. Agric. 2019, 156, 585–605. [Google Scholar] [CrossRef]
- Zou, C.; Hu, X.; Huang, W.; Zhao, G.; Yang, X.; Jin, Y.; Gu, H.; Yan, F.; Li, Y.; Wu, Q.; et al. Different yellowing degrees and the industrial utilization of flue-cured tobacco leaves. Sci. Agric. 2019, 76, 1–9. [Google Scholar] [CrossRef]
- Lu, X.; Zhao, C.; Qin, Y.; Xie, L.; Wang, T.; Wu, Z.; Xu, Z. The application of hyperspectral images in the classification of fresh leaves’ maturity for flue-curing tobacco. Processes 2023, 11, 1249. [Google Scholar] [CrossRef]
- Ma, X.; Shen, J.; Liu, R.; Zhai, H. Choice of tobacco leaf features based on selected probability of particle swarm algorithm. In Proceedings of the 2016 Chinese Control and Decision Conference (CCDC), Yinchuan, China, 28–30 May 2016; pp. 3041–3044. [Google Scholar]
- Yin, Y.; Xiao, Y.; Yu, H. An image selection method for tobacco leave grading based on image information. Eng. Agric. Environ. Food 2015, 8, 148–154. [Google Scholar] [CrossRef]
- He, Y.; Wang, H.; Zhu, S.; Zeng, T.; Zhuang, Z.; Zuo, Y.; Zhang, K. Method for grade identification of tobacco based on machine vision. Trans. ASABE 2018, 61, 1487–1495. [Google Scholar] [CrossRef]
- Wang, H.; Jiang, H.; Xu, C.; Wang, D.; Yang, C.; Wang, B. Three-Stage Six-Step Flue-Curing Technology for Viginia Tobacco Leaves and Its Application in China. J. Agric. Sci. Technol. A 2016, 6, 232–238. [Google Scholar]
- Wu, J.; Yang, S.X. Intelligent control of bulk tobacco curing schedule using LS-SVM-and ANFIS-based multi-sensor data fusion approaches. Sensors 2019, 19, 1778. [Google Scholar] [CrossRef]
- Wang, Y.; Qin, L. Research on state prediction method of tobacco curing process based on model fusion. J. Ambient Intell. Humaniz. Comput. 2022, 13, 2951–2961. [Google Scholar] [CrossRef]
- Wang, L.; Cheng, B.; Li, Z.; Liu, T.; Li, J. Intelligent tobacco flue-curing method based on leaf texture feature analysis. Optik 2017, 150, 117–130. [Google Scholar] [CrossRef]
- Condorí, M.; Albesa, F.; Altobelli, F.; Duran, G.; Sorrentino, C. Image processing for monitoring of the cured tobacco process in a bulk-curing stove. Comput. Electron. Agric. 2020, 168, 105113. [Google Scholar] [CrossRef]
- Wu, J.; Yang, S.X.; Tian, F. A novel intelligent control system for flue-curing barns based on real-time image features. Biosyst. Eng. 2014, 123, 77–90. [Google Scholar] [CrossRef]
- Chen, D.; Zhang, Y.; He, Z.; Deng, Y.; Zhang, P.; Hai, W. Feature-reinforced dual-encoder aggregation network for flue-cured tobacco grading. Comput. Electron. Agric. 2023, 210, 107887. [Google Scholar] [CrossRef]
- Lu, M.; Wang, C.; Wu, W.; Zhu, D.; Zhou, Q.; Wang, Z.; Chen, T.; Jiang, S.; Chen, D. Intelligent Grading of Tobacco Leaves Using an Improved Bilinear Convolutional Neural Network. IEEE Access 2023, 11, 68153–68170. [Google Scholar] [CrossRef]
- Huang, G.; Liu, Z.; Van Der Maaten, L.; Weinberger, K.Q. Densely connected convolutional networks. In Proceedings of the IEEE Conference on Computer Vision and Pattern Recognition, Honolulu, HI, USA, 21–26 July 2017; pp. 4700–4708. [Google Scholar]
- Xin, X.; Gong, H.; Hu, R.; Ding, X.; Pang, S.; Che, Y. Intelligent large-scale flue-cured tobacco grading based on deep densely convolutional network. Sci. Rep. 2023, 13, 11119. [Google Scholar] [CrossRef]
- Wu, J.; Yang, S.X. Modeling of the bulk tobacco flue-curing process using a deep learning-based method. IEEE Access 2021, 9, 140424–140436. [Google Scholar] [CrossRef]
- Fan, M.; Lai, S.; Huang, J.; Wei, X.; Chai, Z.; Luo, J.; Wei, X. Rethinking bisenet for real-time semantic segmentation. In Proceedings of the IEEE/CVF Conference on Computer Vision and Pattern Recognition, Nashville, TN, USA, 19–25 June 2021; pp. 9716–9725. [Google Scholar]
- Sifre, L.; Mallat, S. Rigid-motion scattering for texture classification. arXiv 2014, arXiv:1403.1687. [Google Scholar]
- Yang, L.; Zhang, R.Y.; Li, L.; Xie, X. Simam: A simple, parameter-free attention module for convolutional neural networks. In Proceedings of the International Conference on Machine Learning, PMLR, Virtual, 18–24 July 2021; pp. 11863–11874. [Google Scholar]
- Yu, F.; Koltun, V.; Funkhouser, T. Dilated residual networks. In Proceedings of the IEEE Conference on Computer Vision and Pattern Recognition, Honolulu, HI, USA, 21–26 July 2017; pp. 472–480. [Google Scholar]
- Weicai, Z.; Miaowen, Q.; Huihong, L.; Xiuling, J.; Shuhua, C. Breeding and Selection of Flue-cured Tobacco New Variety Yueyan97 and its Characteristics. Chin. Tob. Sci. 2010, 31, 10–14. [Google Scholar]
- Kucuk, A.; Finlayson, G.D.; Mantiuk, R.; Ashraf, M. Performance Comparison of Classical Methods and Neural Networks for Colour Correction. J. Imaging 2023, 9, 214. [Google Scholar] [CrossRef] [PubMed]
- Finlayson, G.D.; Mohammadzadeh Darrodi, M.; Mackiewicz, M. The alternating least squares technique for nonuniform intensity color correction. Color Res. Appl. 2015, 40, 232–242. [Google Scholar] [CrossRef]
- He, K.; Zhang, X.; Ren, S.; Sun, J. Deep residual learning for image recognition. In Proceedings of the IEEE Conference on Computer Vision and Pattern Recognition, Las Vegas, NV, USA, 27–30 June 2016; pp. 770–778. [Google Scholar]
- Tan, M.; Le, Q. Efficientnet: Rethinking model scaling for convolutional neural networks. In Proceedings of the International Conference on Machine Learning, PMLR, Long Beach, CA, USA, 9–15 June 2019; pp. 6105–6114. [Google Scholar]
- Tan, M.; Le, Q. Efffcientnetv2: Smaller models and faster training. In Proceedings of the International Conference on Machine Learning, PMLR, Virtual, 18–24 July 2021; pp. 10096–10106. [Google Scholar]
- Howard, A.; Sandler, M.; Chu, G.; Chen, L.C.; Chen, B.; Tan, M.; Wang, W.; Zhu, Y.; Pang, R.; Vasudevan, V.; et al. Searching for mobilenetv3. In Proceedings of the IEEE/CVF International Conference on Computer Vision, Seoul, Republic of Korea, 27 October–2 November 2019; pp. 1314–1324. [Google Scholar]
- Qin, D.; Leichner, C.; Delakis, M.; Fornoni, M.; Luo, S.; Yang, F.; Wang, W.; Banbury, C.; Ye, C.; Akin, B.; et al. MobileNetV4-Universal Models for the Mobile Ecosystem. arXiv 2024, arXiv:2404.10518. [Google Scholar]
- Ma, N.; Zhang, X.; Zheng, H.T.; Sun, J. Shufffenet v2: Practical guidelines for efffcient cnn architecture design. In Proceedings of the European Conference on Computer Vision (ECCV), Munich, Germany, 8–14 September 2018; pp. 116–131. [Google Scholar]
- Mehta, S.; Rastegari, M. Mobilevit: Light-weight, general-purpose, and mobile-friendly vision transformer. arXiv 2021, arXiv:2110.02178. [Google Scholar]
- Vasu, P.K.A.; Gabriel, J.; Zhu, J.; Tuzel, O.; Ranjan, A. FastViT: A fast hybrid vision transformer using structural reparameterization. In Proceedings of the IEEE/CVF International Conference on Computer Vision, Paris, France, 1–6 October 2023; pp. 5785–5795. [Google Scholar]
- Songfeng, W.; Aihua, W.; Jinliang, W.; Zhikun, G.; Sen, C.; Fushan, S.; Xiaohua, L.; Xiuhong, X.; Chuanyi, W.; Jie, R. Effect of Rising Temperature Rate at Leaf-drying Stage on Physiological-biochemistry Characters and Quality during Bulk Curing Process of Tobacco Leaves. Chin. Tob. Sci. 2012, 33, 48–53. [Google Scholar]
- Zhang, B.L.; Bai, T.; Han, G. Analysis on the threshold of heating rate during leaf-drying early stage and bulk curing on quality of upper ffue-cured tobacco leaves. Chin. Tob. Sci. 2023, 51, 160–164. [Google Scholar]


Disclaimer/Publisher’s Note: The statements, opinions and data contained in all publications are solely those of the individual author(s) and contributor(s) and not of MDPI and/or the editor(s). MDPI and/or the editor(s) disclaim responsibility for any injury to people or property resulting from any ideas, methods, instructions or products referred to in the content. |
© 2024 by the authors. Licensee MDPI, Basel, Switzerland. This article is an open access article distributed under the terms and conditions of the Creative Commons Attribution (CC BY) license (https://creativecommons.org/licenses/by/4.0/).