Review

A Critical Review on Soil Gas Analysis: Modern Technologies and Problems

by
Alexander G. Bannov
1,*,
Igor’ V. Trubin
1,
Ilya K. Zakharov
1,
Evgeny A. Maksimovskiy
2 and
Pavel B. Kurmashov
1
1
Laboratory of Chemical Technology of Functional Materials, Novosibirsk State Technical University, K. Marx 20, Novosibirsk 630073, Russia
2
Nikolaev Institute of Inorganic Chemistry SB RAS, Ak. Lavrent’eva 3, Novosibirsk 630030, Russia
*
Author to whom correspondence should be addressed.
Agronomy 2024, 14(10), 2374; https://doi.org/10.3390/agronomy14102374
Submission received: 2 September 2024 / Revised: 2 October 2024 / Accepted: 11 October 2024 / Published: 14 October 2024
(This article belongs to the Section Soil and Plant Nutrition)

Abstract

:
In this review article, the main techniques for spectroscopic studies of gases in field conditions are considered. The issues related to the study of gas emissions from soils and the determination of their concentrations are analysed. The main types of spectroscopy used in portable devices for soil gas analysis, along with their design features and sampling approaches, are provided. Various studies aimed at optimising the operation of devices for analysing gases emitted from the soil, taking into account agronomic, agrochemical, and ecological specifics, are also presented. The effect of using different types of lasers and reflecting elements on the accuracy of optical measurements and the sensitivity to various substances in the gases is analysed.

1. Introduction

Soil gas analysis is very important in many fields, including engineering, environmental science, geochemistry, and agriculture, etc. [1,2] This analysis makes it possible to detect contaminants in soil [3], including greenhouse gases [4] and volatile organic compounds [5]. Another approach is to analyse the gases produced as a result of the presence of microorganisms in the soil. The analysis allows one to estimate the efficiency of the introduction of certain additives to the soil. In this way, the concentration of gases and the dynamics of their emission serve as indicators of microbiological processes in the soil, specifically microbial activity.
The soil consists of solid, liquid, and gas phases. Generally, the ratio of phases are 50%, 25%, and 25%, respectively [6]. Determining gas exchange and its rate is a complex task, as it depends on many factors. There are two types of gas transport processes in the soil: diffusion (according to Fick’s law) and advective transport (caused by the pressure drop between soil air and atmospheric air, as described by Darcy’s law) [7]. The majority of gases are nitrogen containing compounds [8,9,10,11] and carbon containing compounds [12,13,14]. The presence of plants induces an increase in gas fluxes from the soil. Soil with plants can produce various gases, such as CO2 [15], N2O [16,17], CH4 [18,19], NO [20], NO2 [21], etc. Some research focuses on the determination of greenhouse gases only [22,23,24]. This latter issue is actively studied, as the increase in temperature, along with the number of summer days, results in higher gas emissions, e.g., CO2 emissions [15,25]. Typically, the emission of gases from soils is influenced by several factors, such as soil moisture, soil organic carbon, the presence of microorganisms, root processes, bulk density, and temperature [19,26,27]. The soil microbiome participates in biogeochemical processes, which should be further investigated [28].
The emission of gases from soil is a result of different processes, e.g., consumption and production, such as H2 oxidation by soil enzymes; CH4 oxidation by methanotrophic bacteria; CO cooxidation by the ammonium monooxygenase of nitrifying bacteria; N2O reduction to N2 by denitrifying bacteria, etc. [29]. All these processes differ depending on their occurrence in lowland and upland soils [29].
The formation of the chemical composition of the gas environment is influenced not only by plant life activity and anthropogenic factor in the form of agricultural activities but also by soil microflora. The monitoring of changes in the chemical composition of the gas and solid phase of soils is important for more accurate ecological and agricultural forecasting and planning of activities [30]. The completeness of information on the dynamics of soil formation is determined, among other things, by mass spectra obtained by spectrometry and chromatography. There are investigations devoted to field [31,32] and laboratory measurements of gas flux from soil [33,34]. However, each spectrometry imposes a number of requirements on the process of detection and further analysis of signals, which makes researchers and engineers look for ways of optimisation, especially for field studies where not only accuracy and resistance of measurements to noise but also the possibility of long-term studies, are important. One of the tasks that are solved by modern spectrometry methods is to provide non-destructive soil control in the fields of agriculture, ecology, and geology [35]. However, depending on the required quantity and quality of spectral data, the requirements for emitters, detection methods, and signal processing can vary. This is especially true for studies of microdoses of substances whose peaks in the spectrogram are negligible, but whose presence can provide certain information, e.g., data on the dynamics of microflora activity in the soil. Typically, investigating solid soil is a long-term and expensive process; however, gas analysis is faster and can be a non-destructive technique for this purpose [36].
The scheme of main methods for the investigation of gas emission from soils is shown in Figure 1.
There is no extensive classification of methods for soil gas analysis; all of them are based on different physical principles [37]. As can be seen, the majority of methods utilise optical techniques, such as Raman spectroscopy, infrared spectroscopy, and others. For some gases, e.g., CO2, a traditional method such as titration with NaOH is used [38]. However, this method is not suitable for long-term measurements (months, weeks) and is time-consuming. Therefore, the application of instrumental techniques is the most effective approach for soil respiration analysis, as it requires frequent measurements and allows for automation.
This paper mainly reviews methods for determining gases in response to changes in organic amendments in the soil (soil respiration). This paper primarily reviews methods for determining gases in response to changes in organic amendments in the soil (soil respiration). This includes a review of spectroscopy techniques, detection principles, and the advantages and disadvantages of their use and optimisation for field studies. It also discusses examples of designs employed by other researchers to obtain mass spectra and how these designs affect the quality of the analysis. Section 2 provides an overview of the most common optical spectroscopy methods, as well as promising ones that can be used for non-destructive control in the field. It describes the pathways of gas-phase passage through radiation and detection elements in analysers, along with various design solutions utilised by researchers for specific methods. Section 3 delivers information on the mass spectrometry and gas chromatography for soil gas analysis. Section 4 deals with the gas analysis using various sensors. Section 5 is devoted to gas-phase sampling methods, particularly the use of various modifications of sampling chambers, which are employed for both soil analysis in the field and for pre-formed soil samples and slices. The influence of design features on the accuracy of measurements over time, gas losses during accumulation and pumping, and the occurrence of noise during analysis is also addressed. Section 6 outlines the challenges and prospects for spectroscopic techniques that researchers are currently exploring, the aspects of gas analysis that are developing most rapidly, and the techniques not previously used for soil gas analysis that may be considered for optimisation and improvement in agricultural applications.

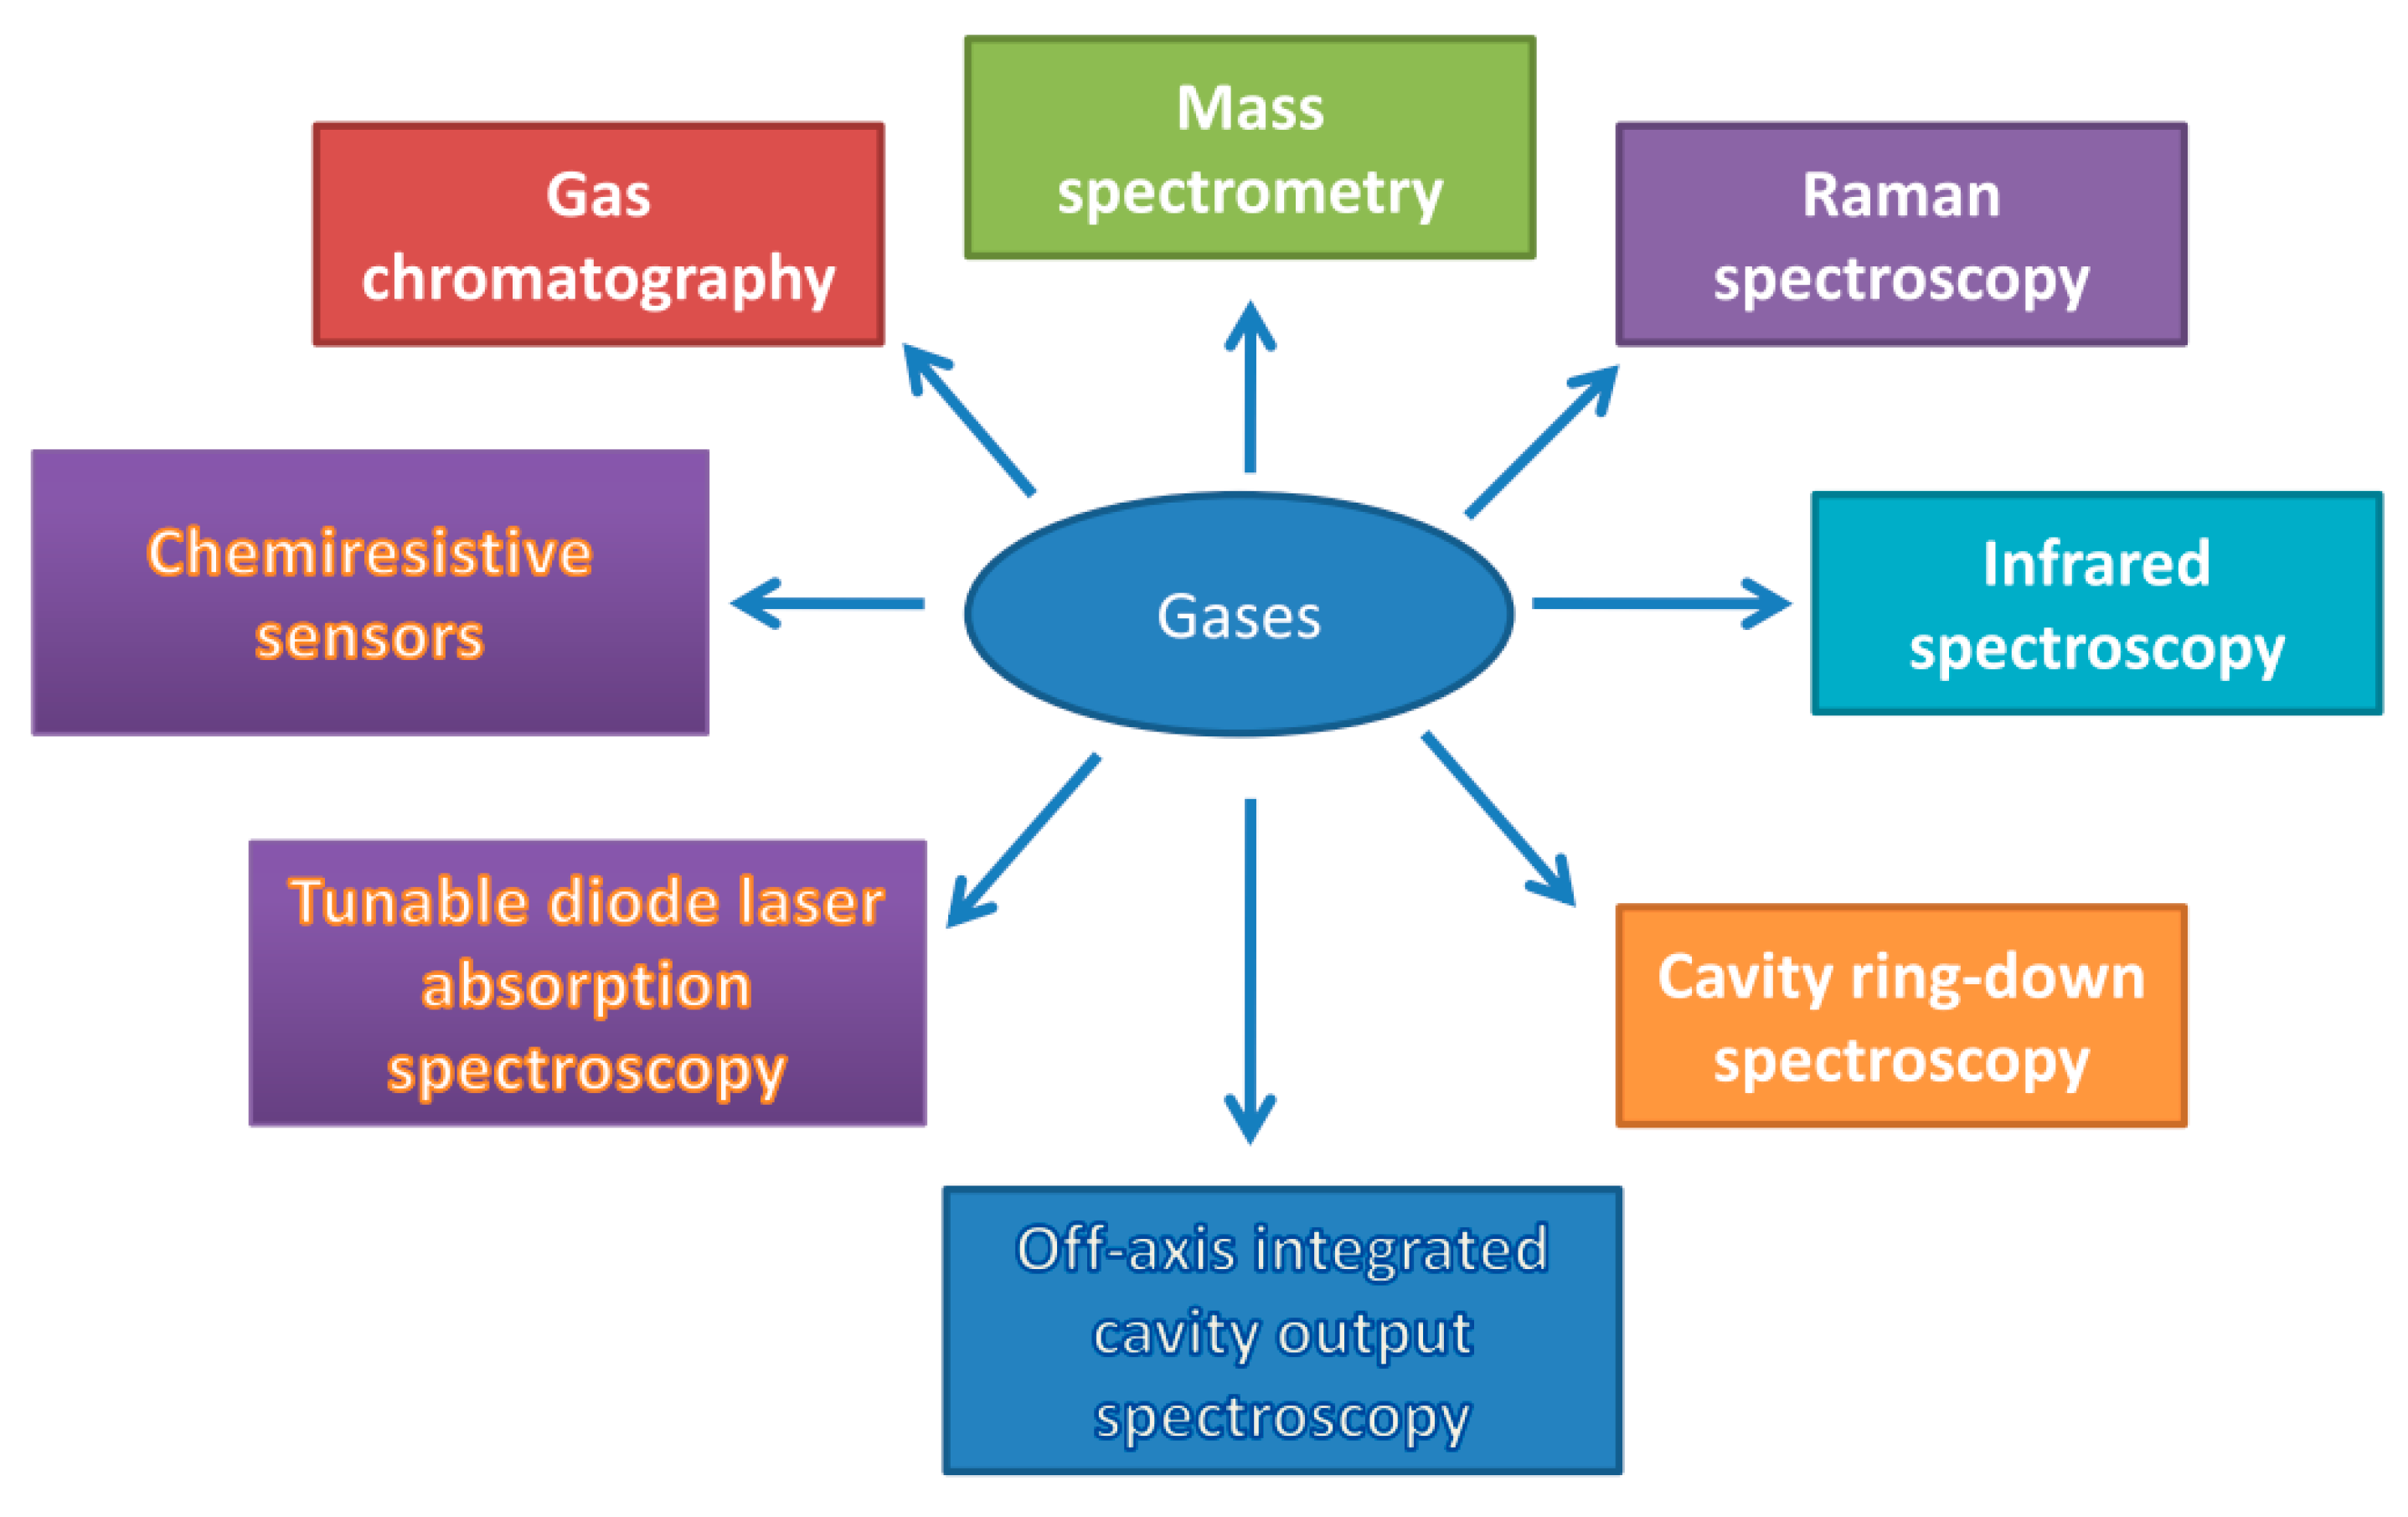
2. Optical Spectroscopy in Soil Gas Analysis

Spectroscopy is based on the study of spectra of various types, as well as the detection of electron excitation in the molecules that constitute the substance and their transition to a higher energy level. The methods of spectral analysis are determined by the type of spectrum, the source of excitation of the molecules, and the type of interaction between the molecules of the substance and the sensor. Spectra differ in how electromagnetic waves interact with the molecules of matter, affecting several parameters used in subsequent mathematical calculations. Spectroscopy can include emission spectra, which detect the intensity of radiation; scattering spectra, which reflect information about the structure of matter in terms of the distribution, frequency, and polarisation of waves; and absorption spectra, which record the effect of wavelengths on electron excitation.
There are some limitations associated with each spectroscopic technique, which determine the ability to detect certain gases in soils. For example, infrared spectroscopy is limited in its ability to detect gases with non-polarizable chemical bonds (such as N2, H2, O2, etc.), while gases with polarised bonds can be detected (e.g., CO2). Some optical methods (e.g., Raman spectroscopy) do not have this limitation. Optical methods must have their own specific optical path length, which can affect the dimensions of the analysers, potentially making them relatively large. The issue of the size of analysers can be addressed by utilising a set of gas sensors that are small enough, such as chemiresistive sensors, optodes, non-dispersive infrared sensors, etc. Some methods enable the detection of gases produced by various isotopes (e.g., mass spectrometry) instead of optical spectroscopy, which is useful not only for soil analysis but also for geophysics and environmental studies. The distinctive feature of optical methods is the analysis of gases above the soil, since light does not pass through the soil sample.

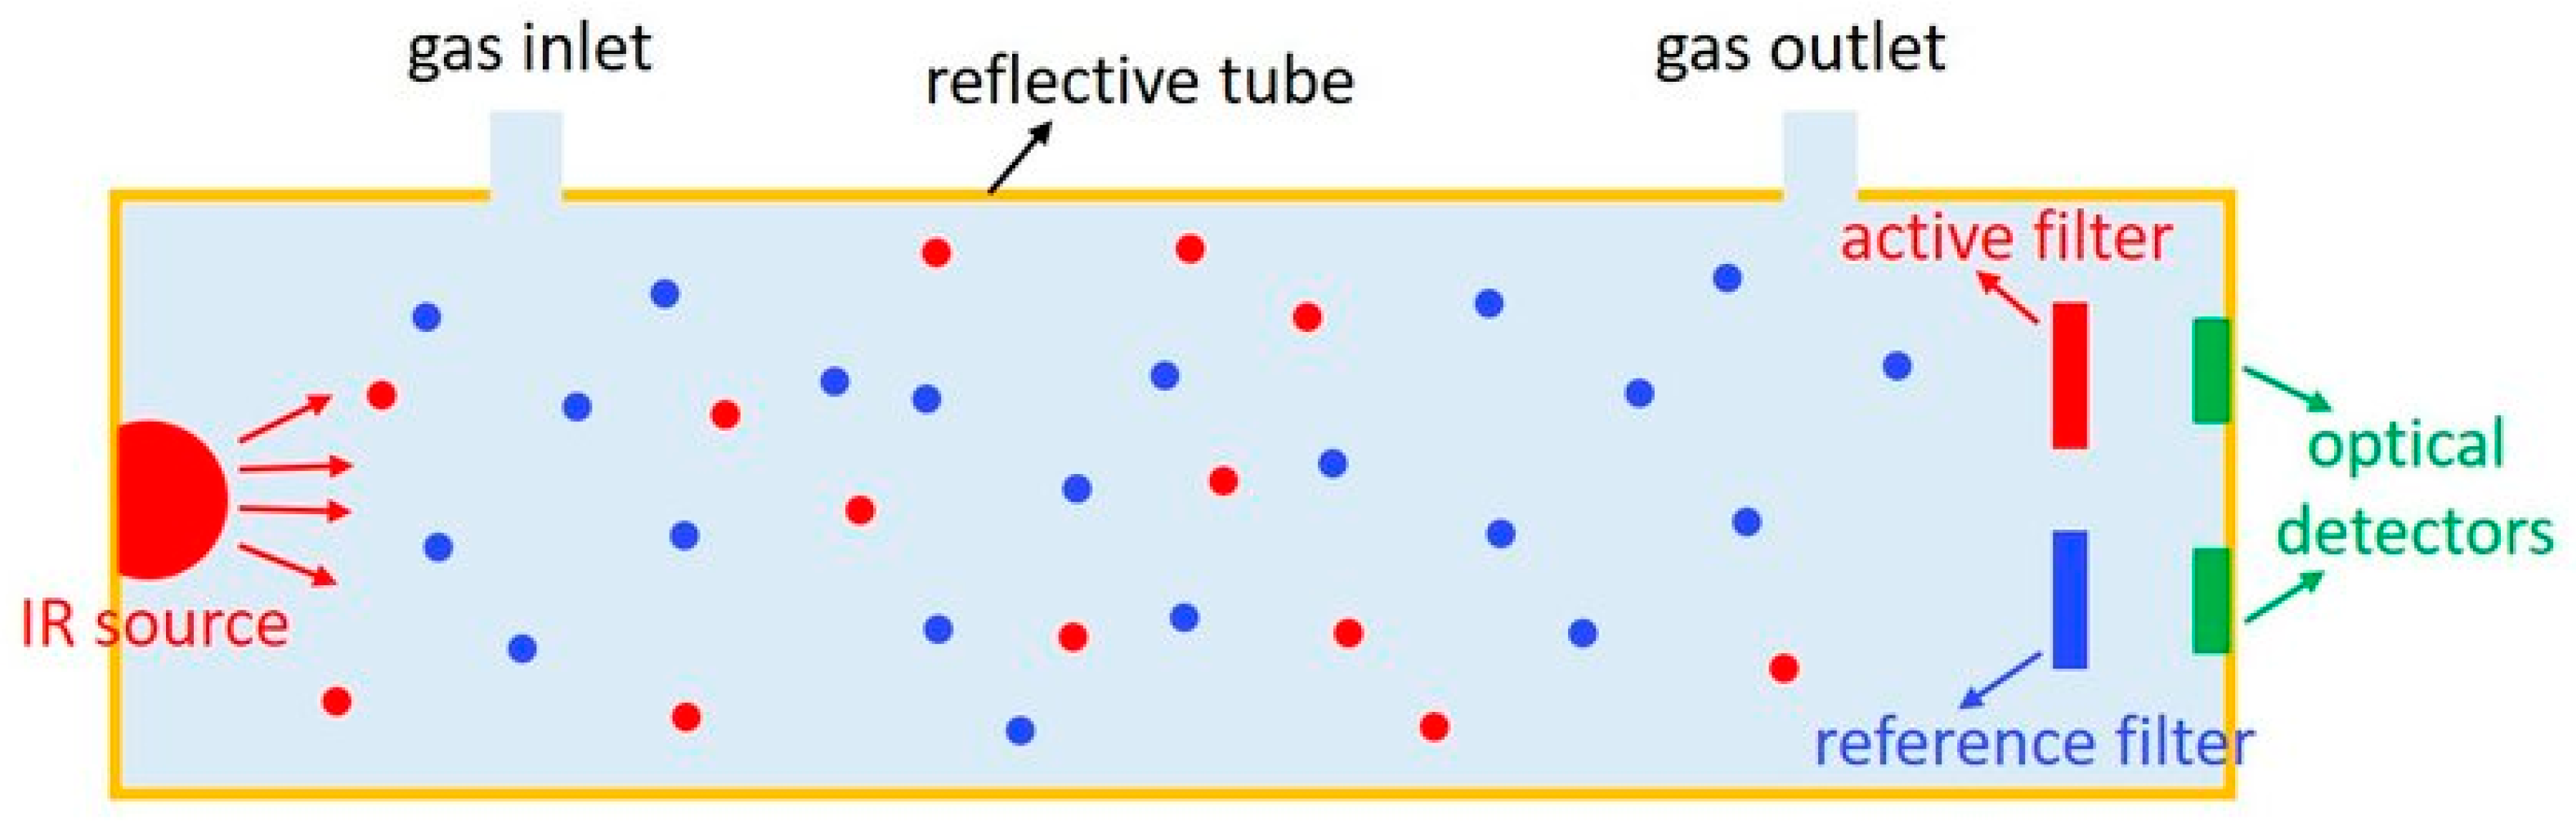
2.1. Infrared Spectroscopy

Types of spectrometry differ in the use of different radiation sources, fixation methods, as well as optimisation of structural elements to improve the passage cycle of radiation through the analyte or excitation of atoms in the substance by other means. The main driving force behind the development of spectrometric methods towards universality and the possibility of express research is the advancement of laser technologies and the application of absorption spectroscopy. Absorption spectroscopy is currently the most common method for building setups of spectroscopic and hybrid (chromato–mass spectrometry) type [39]. Infrared spectroscopy is widely used in soil analysis [40,41], but the majority of papers are devoted to analysis of solid soil [42,43,44,45,46], whereas the number of papers devoted to gas analysis [47] is relatively low.
The principle of operation of infrared spectroscopy involves the passage of a beam from a radiation source through the gas phase, which results in the excitation of vibrational movements of molecules or their fragments and a change in the intensity of radiation. The structure of molecules in the sample affects the change in intensity, allowing, after passing the radiation through an optical filter, an infrared spectrum corresponding to the vibration of functional groups in the analyte to be obtained (Figure 2).
The spectrum is defined as a function of the intensity of transmitted radiation versus frequency (wavenumber). The spectrogram reflects absorption bands, the position and intensity of which provide information about the composition of the gas phase (Figure 3).
Regardless of the type of radiation, measurements are usually taken at all wavelengths within a certain range. They are divided into the near, middle, and far regions [50]. However, depending on the methodology, sources with narrower wavelength coverage may be used. The spectrum reflects the matching of the frequency of the wavelength with the frequency of the molecule’s vibration in the substance [50,51]. When absorbed, radiation causes a change in the dipole moment of the molecule [51], but some molecules, such as O2, H2, N2, and others do not have it, so, for example, infrared spectroscopy is not used for their analysis [52], although these substances themselves can act as markers [53]. This is a main drawback of this technique. Therefore, additional different methods based on absorption, transmission of radiation, its scattering, and reflection are used for the detection of different substances [54].
For studying the emission gases of soil, infrared spectroscopy is an effective method of analysis because it allows automation of the analysis process, detecting from withdrawn samples, or conducting real-time research in field conditions. This facilitates environmental monitoring and agricultural planning of agrotechnical measures, allowing for precise local data on the gas composition in the soil and the dynamics of its changes to be obtained. The efficiency of infrared spectroscopy in soil analysis is described in [55] as this method covers a wide range of molecular vibration frequencies, allowing for non-destructive testing, and further cataloguing of spectra enables storage of data on the condition of soil masses for a long time and forecasting the dynamics of changes in physicochemical characteristics. New approach is the application of machine learning for gas sensing via infrared spectroscopy. For example, in [56] the one-dimensional convolutional deep learning neural network model has been demonstrated for detection of gases, showing the accuracy of 99% in a region of 400–4000 cm−1.
Fourier transform infrared (FTIR) spectroscopy is an effective method for measuring the composition of trace gases, which is usually used in industrial soil gas analysers [57]. The use of different optical scheme in infrared spectrometers made it possible to create the faster and compact analyser for FTIR. This method is applicable for simultaneous measurement of multiple gases. The frequency and intensity of these individual absorption bands affect the overall spectrum, making it unique to the molecule of a specific substance. FTIR spectroscopy differs from the classical infrared method in that the spectrum is obtained not by measuring signal intensity, but by the response in spatial domain. For these purposes, optical spectroscopy methods use interferometers. The development of open-path gas analysers allowed for measuring the average mole fractions over large path lengths [58]. The open path FTIR spectrometers can be applied not only for agricultural purposes, but also for monitoring of greenhouse gases in geology [59].
The study in [60] describes the effectiveness of mid-infrared (MIR) spectroscopy for digital soil mapping. This method makes it possible to operate with solid and gaseous fractions in the soil. This technique is most commonly used because the vibrations of the majority of studied functional groups are comparable to the frequencies of mid-infrared wavelengths of 3–8 μm. Usually, a sieved sample or suspension of small particles is used as a sample for soil analysis. The application of diffuse reflection spectroscopy (DRS) for soil analysis is demonstrated in [61]. However, for the gases, other methods based on detecting the scattering spectrum are used because the requirements for sensor sensitivity and noise levels sharply increase in a pure gas environment without the use of an auxiliary eluent such as spraying or vapour creation.
Griffith et al. [62] used the FTIR for detection of trace gases, such as CO2, CH4, N2O, and CO, reaching the precision of 0.1–0.5% and 1–2 min resolution. For some gases, the precision was high enough, e.g., N2O measurements showed the precision of 0.2 ppbv with the variation within 0.5 ppbv. In [63], real-time monitoring of N2O and its isotopologues was carried out. There was good agreement between the N2O amount and consumptions of NO2 and NO3 when the atmosphere contained C2H2.
The other simple method to detect the gases is non-dispersive infrared (NDIR) spectroscopy, which is based on the measurement of characteristic infrared absorption. NDIR gas sensors are widely used for detection of various gases (COx, NO, SO2, etc.); however, the increase in the number of gases to detect makes the equipment expensive and large in size, due to the need for many detectors and filters [64]. In [65], the NDIR device (Figure 4) for N2O detection based on 59 cm path-length gas cell with microelectromechanical systems-based infrared emitter, pyroelectric detector, two anti-reflective coated optical windows, and convex lens has been created, covering the range of 1–2000 ppm without the impact of humidity. Laboratory tests showed good sensitivity (11.87 RMS/ppm at 3.87 ppm N2O) to the soil atmosphere using the submerged diffusion cell.
Some approaches allow the creation of devices with multiplexed NDIR gas sensors by means of integrating the plasmonic metamaterial absorbers with pyroelectric detectors showing the enhanced response for eight gases (H2S, CO2, CH4, CO, NO, CH2O, SO2, and NO2; the LoD for methane, carbon dioxide, and carbon monoxide were 63 ppm, 2 ppm, and 11 ppm).
Overall, there is a lot of research devoted to infrared spectroscopy for the determination of gas species, whereas there have been few papers on the application of UV-visible molecular spectroscopy for this purpose. For example, the UV-visible molecular absorption spectrophotometer (with a path length of 1 cm) and diode array detector were used for the detection of VOCs in [52].

2.2. Raman Spectroscopy

One of the features of infrared spectroscopy is its ability to detect the molecules only with a dipole moment. However, some optical methods make it possible to overcome this obstacle, such as Raman spectroscopy [66,67,68]. This type of spectroscopy is also used for analysis of gas mixtures, e.g., analysis of natural gas [69,70,71], hydrocarbons [72], carbon dioxide [73], gases of fermentation (O2, N2, H2, CH4, and CO2) [74], and fire gases [75]. Therefore, the task of analysing gases in soil using Raman spectroscopy seems to be similar to problems of such detection in chemical engineering, food engineering, metallurgy, and other fields.
Guo et al. [55] describe the method of cavity enhanced Raman spectroscopy (CERS) for analysing a multi-component gas medium. This method allows for effective detection of gas and enables work with compounds that do not have a dipole moment (N2, O2, H2) and hydrocarbons (CH4 and C2H4) in situ compared to infrared absorption spectroscopy. An example of the setup for Raman spectroscopy, which consists of a sampling cuvette whose structure is shown in Figure 5, a 532 nm laser emitting radiation through a 50 μm optical fibre into a probe via an adapter, and a 600 μm fibre for connecting the probe to the GRS-1000-532 spectrometer, has been shown. The cuvette in this method has a collimation node of excitation light, a resonator, and a receiving node. The Raman signal is formed by collimating the radiation from the source through lenses followed by reflection with concave lenses and signal accumulation by the lenses of the receiving device.
It can be noted that the number of papers devoted to the application of cavity-enhanced Raman spectroscopy in gas analysis increases significantly compared to those focusing on gas spectroscopy [76]. This suggests a growing application of cavity-enhanced Raman spectroscopy even in soil gas analysis.
The main difference in Raman spectroscopy compared to the infrared and its modifications lies in the fact that there is no change in the dipole moment, but rather a deformation of the electronic clouds. This effect is called the change in polarizability [48], and Raman spectra are obtained when analysing different media. As an example, the Raman spectrum of natural gas is shown in Figure 6.
The work [53], describes the design of a compact Raman spectrometer used for the analysis of greenhouse gases with a resolution of 1 cm−1 by the Raman shift and detection limits of CO2 isotopologues below 100 ppm, for CH4 isotopologues < 25 ppm. It is assumed that the drawbacks of Raman spectroscopy in terms of low accuracy can be offset by using intense excitation beams in a gas cell with high pressure, so in this study, a gas chamber for high pressure made of titanium with anti-reflective enamel on the inner surface and windows made of optical glass K8 with antireflection coating was used. As for the analysis of soil emissions in situ in real time, a Raman spectroscopy system under pressure can be applied in a tunnel sample system, where the cuvette has a cylindrical shape and is placed at a specific depth in the soil.
Raman/FTIR spectroscopy is also applied for determination of concentration of gases [78]. In [79], the coupled Raman spectroscopy/FTIR analysis was used for monitoring of N2, O2, H2O, and CO2. It has been showed that Raman spectroscopy allows one to carry out measurements in wet conditions where FTIR spectroscopy does not show efficiency, even though the latter possesses higher sensitivity for CO2 detection. The difference in signal to noise ratio (SNR) between these two methods, confirming the higher SNR of FTIR spectroscopy compared to Raman spectroscopy for CO2 and water vapour, is shown in Table 1.
Some modifications of Raman spectroscopy make it possible to carry out the in-field measurements. In [80] the shifted excitation Raman difference spectroscopy (SERDS) portable device, containing the sensor dual-wavelength diode laser (785 nm, 36 mW) with the SNR of 146 has been created. Surface enhanced Raman spectroscopy was also used for detection of nitrogen in there different types of soils by an ultra-portable Raman spectrometer and machine learning [81].
Even though Raman spectroscopy makes it possible to detect non-polar molecules (as mentioned above), the challenge of achieving a high signal-to-noise ratio (SNR) in certain environments remains critical. One of the most available and long-established methods of SNR improvement is the use of matched filters, but their use requires knowledge of the shape of the substance peak in the spectrum to match the filter’s impulse response. However, there are other techniques for mitigating Raman spectrometry. Fan et al. [82] used an automatic denoising method of convolutional denoising autoencoder for advancement of the SNR in Raman spectra without manual intervention (Raman spectrometer with 785 nm laser and Ne/Ar source). For example, the increase in SNR from 2.2 to 4.4 for a classical spectrometer, and from 3.2 to 7.2 for an optimised spectrometer was achieved. There are other approaches, such as spatially compressed illumination reported in [83]; deep learning-based approach in [84]; feature extraction method [85], etc. However, the majority of these methods were not tested for Raman spectra of gases, even in the field of soil science.

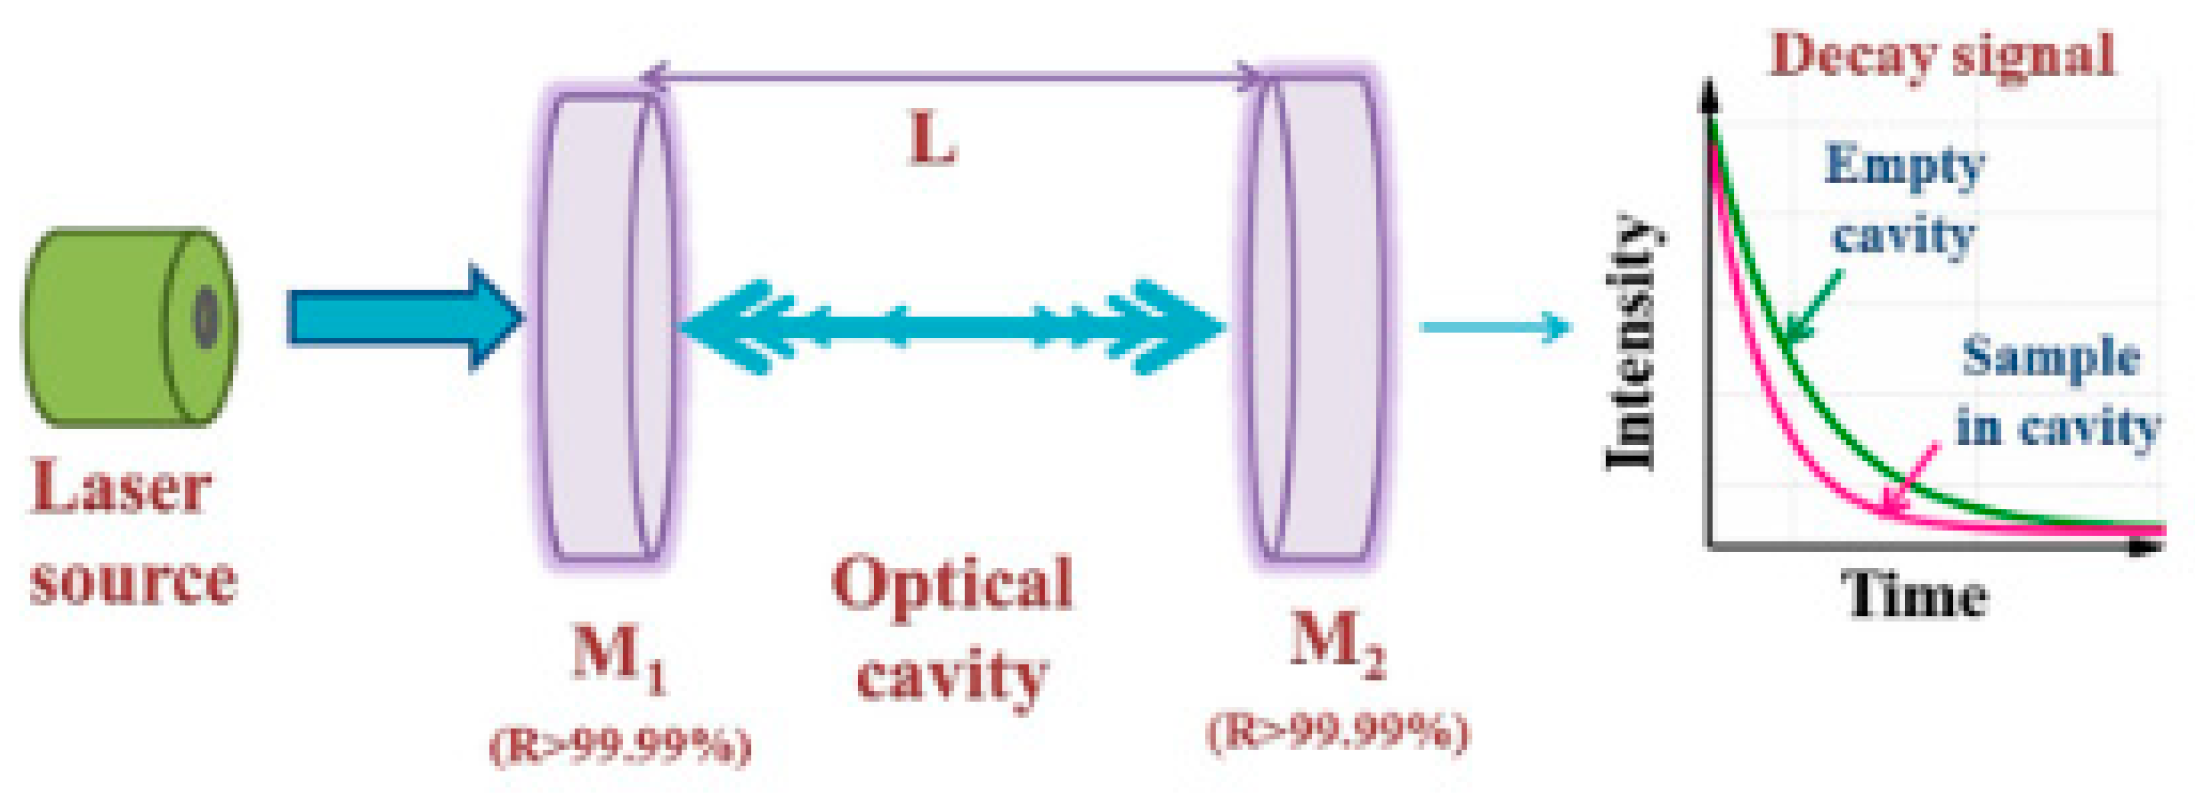
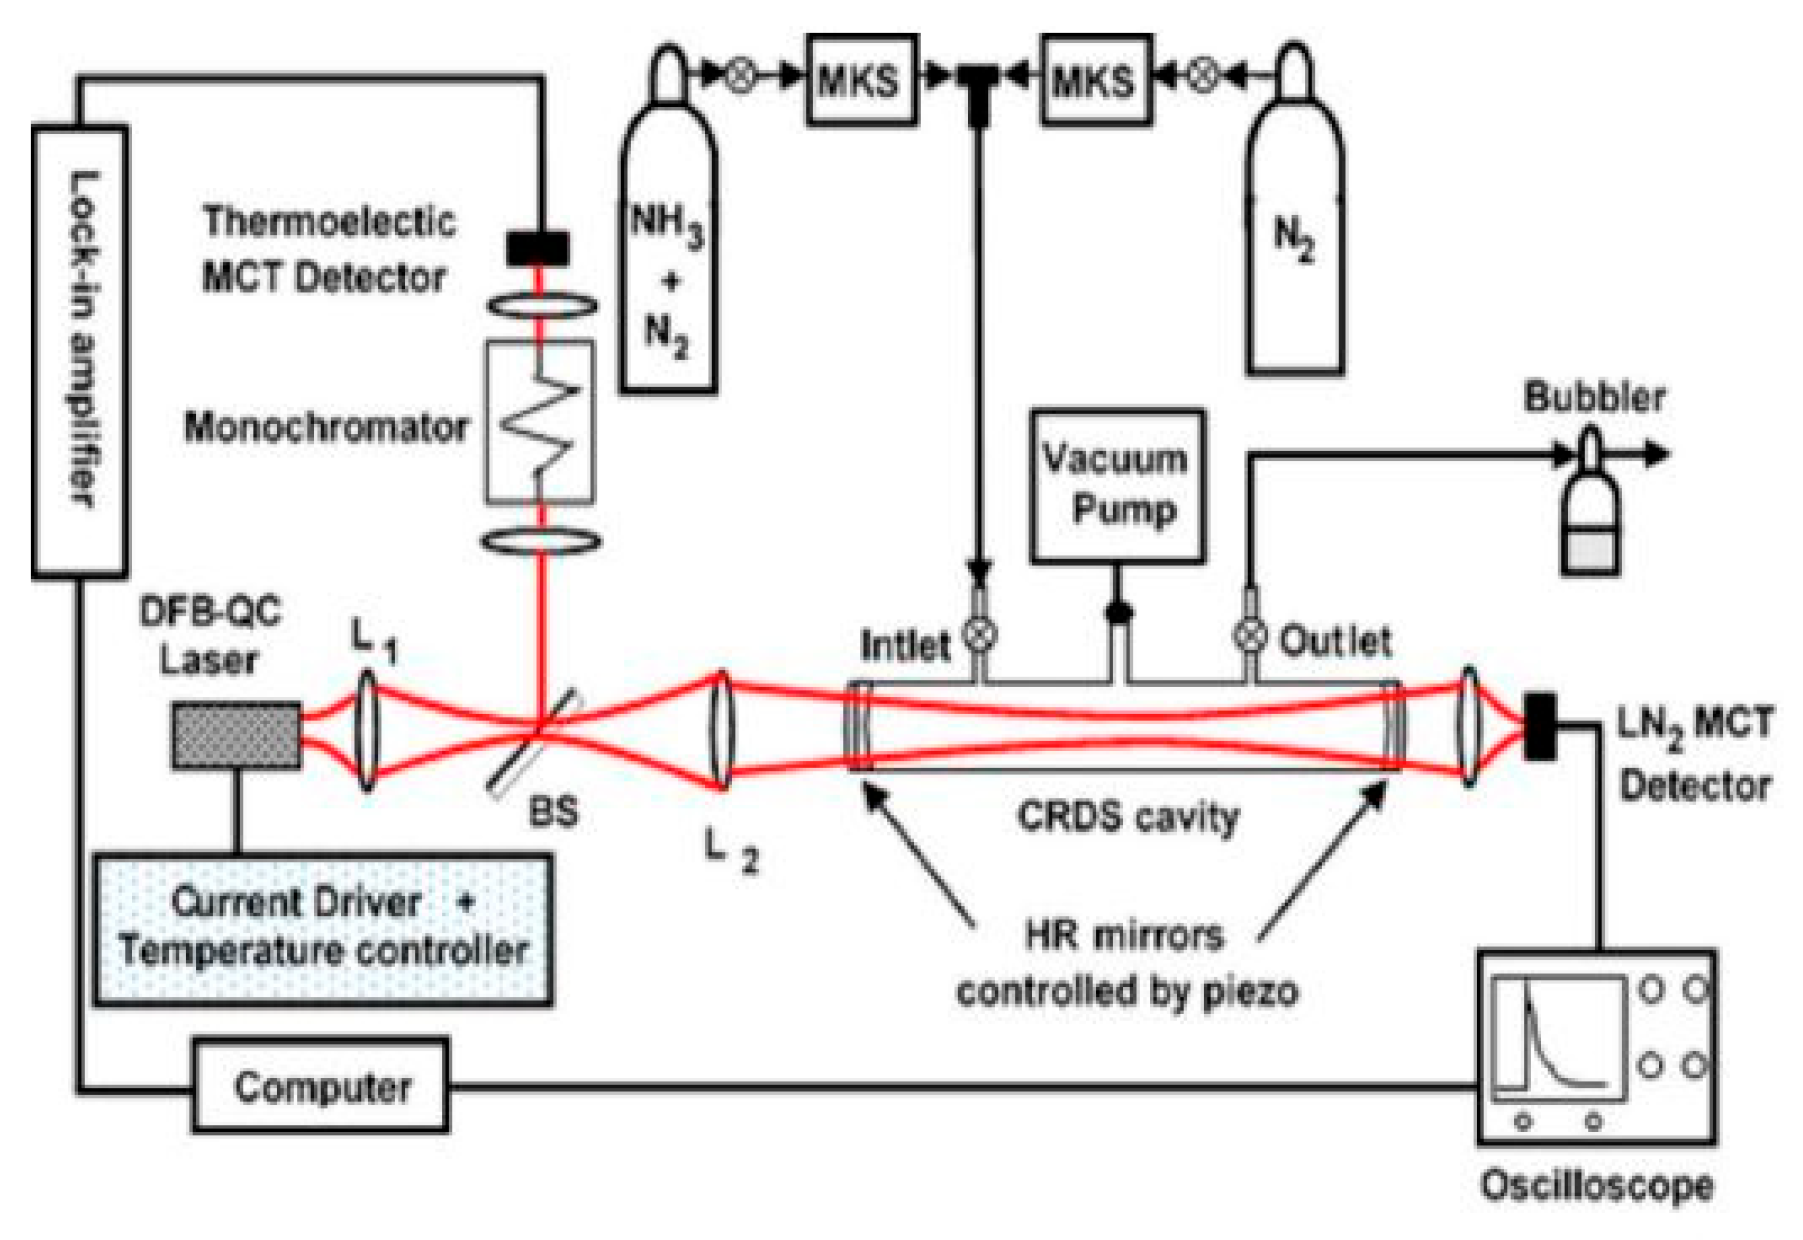
2.3. Cavity Ring-Down Spectroscopy

Cavity ring-down (CRD) spectroscopy is a direct absorption method that can be performed with pulsed or continuous light sources and has significantly higher sensitivity than achievable in conventional absorption spectroscopy [86,87,88,89,90,91,92,93]. The calculation of concentration is based on Beer’s Law [94]. The key feature of this method is measuring the rate of light absorption rather than the amount of light absorbed in a closed optical loop.
The scheme of CRD spectroscopy is shown in Figure 7 [95].
This method has several advantages over regular absorption spectroscopy [96]. Firstly, it is insensitive to fluctuations in the light source intensity, which enhances measurement stability and accuracy. Secondly, CRD spectroscopy allows for the creation of optical resonators with a long effective path length (it can reach the value of several kilometres [97]), which is particularly useful for measuring substances present in small concentration. In recent times, CRD spectroscopy has proven to be especially effective in spectroscopy by enabling the detection of even weak absorbing components. The scheme of analysis by CRD spectroscopy is shown in Figure 8.
The application of CRD spectroscopy makes it possible to detect the gases in quantities of several hundred ppb or even lower [99,100,101], which is an advantage of such approach for the analysis of soil gases. The second advantage is the possibility to create the device with low weight and low power [101]. The third advantage is the sustainability to noise of the laser, since the absorption path can be tens of kilometres [102,103,104]. Some research highlight the suitability of the method for environmental monitoring (e.g., detection of atmospheric δ13 CH4 reported in [105]; detection of NO3 radicals in atmospheric air [106]), monitoring of industrial gaseous mixtures [107], δ13C–CO2 analysis in soil respiration [108] or even breath analysis [109].
The resonator is tuned to different wavelengths, and the change in ring-down time is measured. This change provides spectral information about the absorbing substances in the resonator and allows for determining their concentration. However, when applying this method, several considerations need to be taken into account. The reflective mirrors must have a very high reflectance coefficient [110]. For different types of gases, adjustments to laser parameters are necessary, which can be complicated by their technical characteristics. The requirement to use high-reflectivity mirrors (in order to achieve longer path lengths) is a feature of CRD spectroscopy and cavity-enhanced absorption spectroscopy, compared to chemical ionisation mass spectrometry (CIMS) [111]. For example, the mirrors with reflectivity of R ≥ 99.9985% with an effective path length of 20 km were used in [112]. The design of high-reflectivity mirrors represents a challenge for the implementation of CRD spectroscopy in soil gas analysis.

2.4. Off-Axis Integrated Cavity Output Spectroscopy

Off-axis integrated cavity output spectroscopy (OA-ICOS) [113,114,115,116,117,118,119] improves the accuracy by introducing laser light into the cavity at an angle relative to the main axis to avoid interacting with the high density of transverse modes. Although the intensity fluctuations are lower than those in direct axial ICOS, the method is still limited by low transmission and intensity fluctuations due to partial excitation of high-order transverse modes and typically can achieve sensitivity of ~10. OA-ICOS is used for detection of various gases in the nuclear industry (14CO2 in CO2 [113]), in breath analyses, as a non-invasive diagnostic (C2H6, CH4, H2O, acetone [120]; water isotopes [121]; C2H6 [122]), and leak monitoring of NH3 [123], CH4/C2H6 [124]).
In [125], a setup design for OA-ICOS that has been enhanced with radiofrequency white noise to improve the sensitivity of multicomplex gas-phase element detection has been shown (the LoD of CH4 was 7.6 ppbv, corresponding to a minimum detectable fractional absorption scaled to the path length of 7.3 × 10⁻¹⁰ cm−1). The design of the spectrometer is shown in Figure 9.
Wang et al. [126] presented an improved version of the OA-ICOS spectrometer using a time-sharing multiplexing method (Figure 10). A distinctive feature of the presented prototype is a dual-channel optical structure using two DFB lasers with ranges of 1603 and 1651 nm. In this system, input separators inject radiation from two sources into the optical cavity. In addition, the lasers are located off the optical axis, and the collimator system can be located on either side of the separators. Authors analysed the concentrations of CO2 and CH4 simultaneously (Figure 10b) with limit of detection (LoD) at the level of 0.271 and 1.743 ppb, respectively. This was achieved not only through a two-channel, two-source system, but also through the use of time division multiplexing.
Some papers related to detection of gases in other fields compared to agriculture, confirmed the prospects of OA-ICOS for soil gas analysis since the same gases are formed in soils. For example, in [113], it was shown that it is possible to carry out the 14CO2 monitoring in the presence of N2O and H2O. He et al. [127] reported the application of wavelength modulated OA-ICOS based on a 50.8 mm long assembly Fabry–Perot cavity for CH4 detection showing the 10.5 ppm LoD (averaging time was 30 s). The greenhouse gas analyser based on OA-ICOS technology for detection of CO2 and CH4 was created showing the accuracy 92.52–116.36 ppbv and 0.45–0.55 ppbv, respectively [128]. However, the detection of multiple gases is still an important problem to be solved in OA-ICOS [115].

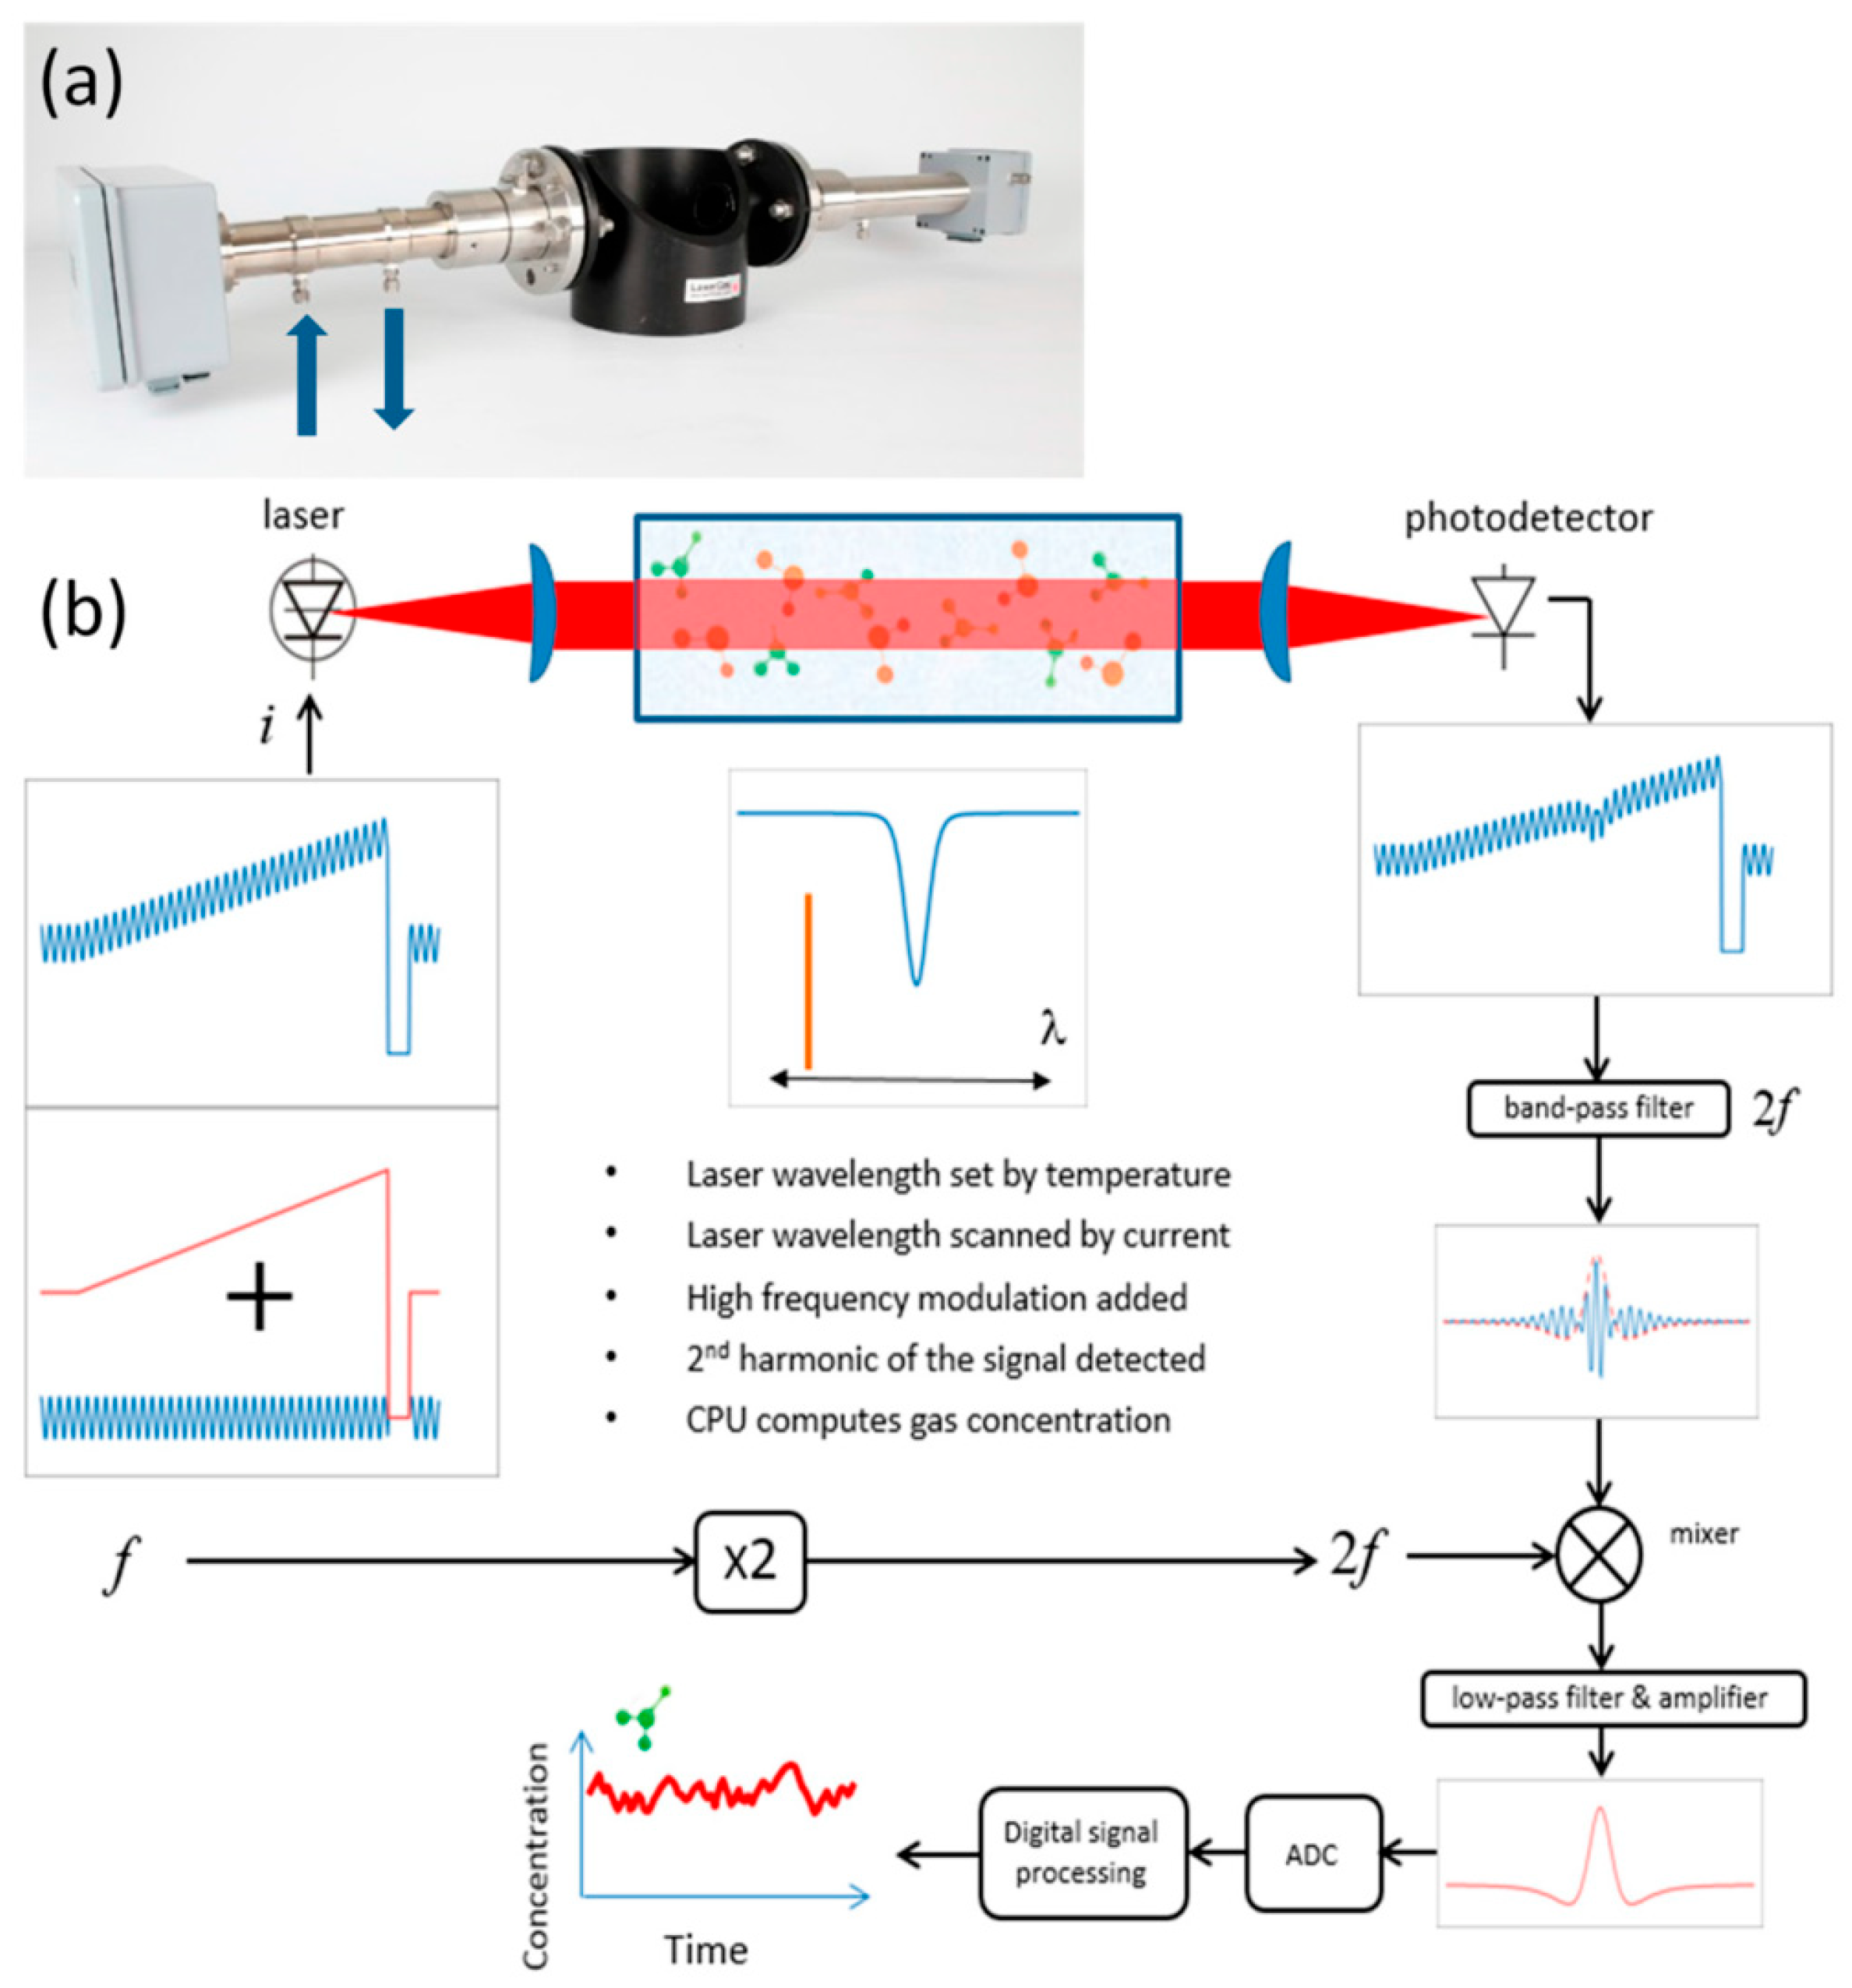
2.5. Tunable Diode Laser Absorption Spectroscopy (TDLAS)

The basic setup for TDLAS consists of a tuneable diode laser light source, transmitting optics, an optically accessible absorbing medium, receiving optics, and a detector [129,130,131,132,133]. The wavelength of the emission from the tuneable diode laser is tuned to the characteristic absorption lines of the substance in the gas along the path of the laser beam. This tuning leads to a reduction in the intensity of the measured signal due to absorption, which can be detected by a photodiode and subsequently used to determine the gas concentration and other properties. The schematic of the TDLAS device for H2 detection is shown in Figure 11.
There are two main approaches used in TDLAS: the application of multiple lasers for detection and a single laser approach [134]. Various diode lasers are employed depending on the application area and the range in which tuning needs to be performed. Typical examples include InGaAsP/InP (0.9–1.6 µm), InGaAsP/InAsP (1.6–2.2 µm), etc. These lasers can be tuned by adjusting their temperature or varying the injection current density in the amplification medium. While temperature changes allow tuning over more than 100 cm−1, it is limited by the slow tuning speeds (several Hz) due to the thermal inertia of the system. On the other hand, current modulation can provide tuning at frequencies up to ~10 GHz, but it is limited to a smaller range (approximately from 1 to 2 cm−1) in which tuning can be performed. The typical linewidth of the laser line is about 10−3 cm−1 or less. Additional methods for tuning and narrowing the linewidth include the use of intracavity dispersive optics.
The main disadvantage of absorption spectrometry (AS), as well as laser absorption spectrometry in general, is that it is based on measuring a small signal change over a large background. Any noise generated by the light source or optical system degrades the detectability of the technique. Therefore, the sensitivity of direct absorption methods is often limited by absorption to ~10−3, which is far from the shot noise level, which for single-pass direct AS is in the range of 10−7–10−8. Since this is insufficient for many types of applications, AS is rarely used in its simplest operating mode. There are two main ways to improve this. One is to reduce noise in the signal; the other is to increase absorption. The first can be achieved using modulation methods, while the second can be obtained by placing the gas in a cavity where light passes through the sample several times, thereby increasing the interaction length. If this method is applied to detect trace particles, the signal can also be enhanced by detecting at wavelengths where transitions have greater line strength, for example, using fundamental vibrational bands or electronic transitions.
Most of the papers devoted to TDLAS applications for air analysis have considered the detection of gases, i.e., pollutants coming from industrial plants; however, some are related to soil gas analysis. Some research has demonstrated the efficiency of TDLAS compared to other methods. For example, this method was used to determine the molar fractions of 12CO2 and 13CO2 from grassland, along with field tests, independently, rather than using their ratio from mass spectrometry. The fractions of gases were extremely low (350–700 μmol mol−1) [135]. Famulari et al. [136] presented data on field measurements of ammonia fluxes taken over 60 days in grassland in Southern Scotland. The research showed a small net emission of ammonia during the growing season (3.78 ng m−2 s−1). In [137], the TDLAS spectrometer for field detection of nitrous oxide and methane was developed, showing the precision of 0.1% with 1 s averaging.
Comparing TDLAS and CRD spectroscopy technologies, it is important to note that CRD spectroscopy allows for an increase in the optical path of absorption to thousands of metres using an optical mirror, which ensures extremely high detection accuracy. However, this method imposes quite high requirements on the experimental setup and complicates the conduct of online measurements on-site. TDLAS, on the other hand, is characterised by high adaptability to challenging conditions, excellent selectivity, affordability, and its measurement results meet most practical needs. The applied significance of this method has always attracted the attention of researchers. With the advancement of technologies, scientists are increasingly focusing on improving the detection sensitivity of the TDLAS system using various approaches [138].
The optical methods considered above are well-studied, whereas the application of some optical sensors (optodes) makes it possible to substitute large devices [37,139]. Currently, these sensors are used for the detection of ppbv levels of certain gases, such as ammonia [140,141,142]. However, their application in soil gas analysis could yield excellent results compared to the devices listed above.

3. Mass Spectrometry and Gas Chromatography

Mass spectrometry (MS) is one of the most rapidly developing areas of substance analysis due to its wide range of applications and the development of new methods to optimise the analysis process [143,144,145]. Measuring the spectra of substances in gaseous, liquid, or solid media and their subsequent systematisation allow for the extrapolation of obtained data to other measurements and the conducting of comparative analyses to determine the molecular composition of the medium. Despite the use of auxiliary components in most cases, such as liquid or gaseous eluents and various coatings of different compositions for ionisation, spectrometric methods are generally more suitable as a field research method, in contrast to chromatography. However, the combination of gas chromatography (GC) and mass spectrometry is frequently used [146,147] along with the separate research on the use of MS for soil gas analysis [148]. The main value to be analysed for carrying out the interpretation is the m/z ratio of ions analysed by MS, and the range of m/z limits the chemical compounds that can be determined. Taking into account that the majority of gases emitted from soils possess low molecular weights [27], the spectrometers and their design makes it possible to identify all of them. The significant difference and advantage of MS is its ability to recognise the gaseous compounds formed by isotopes (e.g., 12C and (e.g., 12C and 13C, 14N and 15N, 16O and 18O, as well as the compounds formed by these isotopes) [149], which is useful for the purposes of ecology, climate change, and geochemistry [150,151].
A typical graph of gas concentration determined using MS is depicted below (Figure 12).
Nakayama et al. [153] developed the time-of-flight portable mass spectrometer for soil gas analysis, making it possible to determine NO2 and O2 with the precision of ±34 ppbv and ±0.60 vol.%, respectively, operating with a resolution of 1 h within 5 days of field investigations.
Considering the advantages of MS application in soil gas analysis, the drawbacks can also be listed. Mass spectrometers are expensive, and the interpretation of analytical data is more complex. While the sensitivity of the technique is an advantage, it can also be a drawback, as all contaminants will be detected in the spectra. This sometimes results in data abundance, as the majority of the information pertains to contaminants that have no relation to the actual emissions from the soil.
MS has relatively high sensitivity and makes it possible to detect multiple gases, which is mainly a problem for gas chromatography [154]. It has almost no problems of interference sensing of gases, which is a feature of some optical methods, e.g., cavity ring-down spectroscopy [155]. Usually, the GC-MS devices are large and expensive enough; however, there are some data on the application of portable devices for analysis of gases, including field tests [156]. GC-MS technique makes it possible to detect even the hydrocarbon gases in soils, taking into account their interference. For example, the ion extraction method [157] was applied in to separate peaks from the aliphatic fractions, BTEX (benzene, toluene, ethylbenzene, xylenes), MTBE (methyl-tert-butyl-ether), ETBE (ethyl-tert-butyl-ether), halogenated VOCs, which made it possible to exclude the time-consuming process of treatment [143].
There are only a few papers on the application of gas chromatography specifically for soil gas analysis. Burford et al. [158] reported the use of gas chromatography for measuring CO2 evolved from soils, using a He ionisation detector on a Porapak Q column. The treatment applied to the soil induced changes in CO2 concentration. The results were obtained in only 6–7 min, which is significantly faster compared to the titration technique for CO2 determination. Modini et al. [159] investigated the application of GC for measurement of CO2, CH4, and N2O in soils with the detection limits of 2, 1, and 4 ppmv, respectively (the accuracy was –0.88, –0.94, and –3.17%, respectively).
One of the main disadvantages of gas chromatography in soil gas analysis is its complex design, the need for frequent calibration, and the requirement to maintain the stability of column operation. The majority of research is based on laboratory experiments [160]. There are almost no data on the field applications of portable GC devices for soil gas analysis.

4. Gas Analysis Using Chemiresistive Sensors

From some point, the method of analysing gas using chemiresistive sensors can be considered one of the types of adsorption spectroscopy, but it is not entirely accurate to call it spectroscopy [161]. The method is based on the application of a set of sensors calibrated for certain gases [162]. The mechanism of compound detection operates by utilising the effect of adsorption of gas molecules on the active sites. Adsorption can induce either an increase or decrease in the concentration of charge carriers in the sensing material, leading to a change in the sensor’s resistance [163,164]. The main component of the sensor is the material, which determines the sensor’s response, sensitivity, and selectivity. The sensors are prepared using various materials, such as metal oxides [165], dichalcogenides of transition metals [166,167,168], carbon nanomaterials [169,170], various composites [171,172], MXenes [173], etc.
The size of such sensors can be scaled depending on the material restrictions for the film and can take on various shapes, not just flat forms. Novel sensors are based on thin films that make it possible to create lightweight, flexible sensors [174].
The limits of sensor detection have become lower, reaching the ppb levels [175]. These sensors have high accuracy and selectivity, with the material for the film selected for specific types of gas environments. They are inexpensive to manufacture; however, drawbacks include their short lifespan, sensitivity to humidity, and reduced accuracy at excessive concentrations of particular molecules in the gas environment (due to excessive deposition of the molecules on the surface of the adsorbing layer).
There is not a great deal of research dedicated to the analysis of gases in soils; however, investigations of exhaled breath air for humans (low concentrations of gases such as CH4 [176], CO2 [176], NH3 [177,178], NO2 [179], VOCs [180,181], etc.) suggest that these sensors could be applied in this field. However, there are specific narrow areas where soil analysis has been conducted using chemiresistive gas sensors. For example, in [182] the sensors based on polypyrrole were used for detection of ammonium nitrate/fuel oil (ANFO) system used in improvised explosive devices showing the limit of detection of 73 ± 11 ppbv NH3 under different soil types. The change in sensor resistance under contact with ammonia in soil is shown in Figure 13.
In [183], a chemiresistive sensor package for the detection of VOCs in soil was developed. The experiments demonstrated the efficiency of iso-octane detection in soil and field tests were successfully conducted in the Hazmat Spill Centre at the Nevada Test Site and at the Chemical Waste Landfill at Sandia National Laboratories. The sensor consisted of a polymer dissolved in a solvent and mixed with conductive carbon particles, which are then deposited on a solid substrate. Some articles have reported on advanced approaches in the treatment of data from chemiresistive gas sensors using calculation algorithms, which could benefit soil gas analysis. For example, Shooshtari [184] successfully used an electronic nose based on carbon nanotube-TiO₂ nanostructures for the detection of VOCs, along with support vector machine algorithms and principal component analysis (PCA) for data reduction. There are a lot of cases of PCA application for treatment the data of gas sensors [177]. It makes it possible to create the score plot of various characteristics of sensors (response, response time, recovery time, etc.) to various gases and find the distinguishable areas by various types of sensors for searching the most appropriate one [185]. The application of PCA-based approaches is also useful to improve the SNR values in other fields [186,187]. It can be suggested that such techniques may find its application in soil gas analysis.
Getino et al. reported one of the first papers dedicated to the application of chemiresistive gas sensors for soil analysis [188]. Sensor arrays were created for detection of combustion gases (NOx, SO2 and benzene) in soils.
The main problem is the necessity to use the defined type of chemiresistive gas sensor for analysis of certain gas. When the number of gases is high enough, the gas analyser becomes a complex device. However, the application of machine learning already helps to overcome this problem, making one sensing material appropriate for the analysis of multiple numbers of gases [189,190]. It can be noted that the machine learning is becoming applicable not only in chemiresistive gas analysis but also in soil gas analysis in general [2,191,192,193]. Of course, other types of sensors could be used for creating the arrays for soil gas analysis, e.g., quartz crystal microbalance (QCM) sensors [194] (there is an interesting paper since 1972 on detection of mercury vapours in soils using the QCM sensor [195]) and field-effect transistors (FETs) [196]. However, their price and availability are not the factor which could accelerate the application in this field. The price is one of the determining factors in the application of such sensors in soil gas emission analysis. However, it has already been shown in [197] that it is possible to create low-cost soil gas analysers using conventional gas sensors, e.g., MQ sensors, with a cost of around 50 USD. Additionally, there are more limitations of the application of chemosensors for soil gas analyzers. For example, the challenges include their recovery at room temperature, the effect of gas accumulation during adsorption, the stability of sensor response, and the modification of sensor materials for various fields of application.
It can be suggested that the soil gas analyser will be designed using various types of sensors that differ in their operating principles. For example, Romanak et al. [198] reported on the application of several commercial sensors used together for the analysis of N2, CH4, CO2, O2, and H2O. Two infrared sensors were employed for the measurement of carbon dioxide and methane, while a galvanic cell was used for oxygen analysis. However, all-optical gas analysers using the same type of sensors (e.g., enhanced Raman gas sensors) are also found [199], but probably the combination of different types of sensors could bring higher limit of detections and responses for wide range of gases.

5. Methods of Sampling of Gas Emission

Gas exchange between the soil and the atmosphere is one of the key processes of the ecosystem, involving numerous processes occurring during the life activities of soil organisms and plants, as well as the migration of gases from anthropogenic interactions. Multiple studies of soil gas emission sampling methods show that the biological factor has a significant influence on the quality of the formed flux in the chamber and its concentration and dynamics of change over time. Moreover, these changes can be caused not only by the factor of the presence of a biological component in the study area but also by the design features of the flow chamber itself. It is mentioned in [200] that the activity of the root system of plants at the place of adjoining chambers of different manufacturers may differ, which inevitably leads to distortions of emission measurements. The control of microorganisms in the soil layer and their influence on the emission of greenhouse gases and other substances has received much attention due to the desire for environmentally friendly production of agricultural products. However, emissions from the greenhouse effect created by microorganisms and plants, especially when the task is to analyse the emission of soil gases from individual factors, increase the requirements for greater stability and accuracy of measurements from analytical equipment and auxiliary devices (flux chambers).
The design of the chamber for gas analysis plays an important role in obtaining correct results. There are two types of chamber systems: open systems (which allow ambient air to pass through the soil) and static systems (using non-flow-through-non-steady-state chambers [201]). The results of the first type strongly depend on the condition of the air (atmospheric pressure, relative humidity) [202]. Unfortunately, it is difficult to operate such systems, which require highly skilled staff. Static chambers are significantly cheaper and simpler compared to open systems [203]. Usually, the latter are applied for detection of greenhouse gases and non-reacting gases (CH4, N2O) [204]. Even so, the design of the non-steady state chamber is a critical problem (their seals, vents, dimensions of pipe, texture of soils, and a lot of other factors) affecting the quality of data obtained and errors occurring as a result of design [205,206]. It can be noted that these factors not only affect the gas exchange between soil and air but also there are many additional ones that is hard to account for them together: wind [207], rainfall/precipitation [208,209], soil water regime [210], groundwater level [211], etc. Therefore, the use of machine learning, artificial intelligence, and other information technologies is the critical need in this field.
The chambers are manufactured from plastics, metals, and glass. Usually, the materials should be inert chemically and do not react with gases to be measured. The use of some plastics (e.g., polyethylene, polyvinyl chloride, polycarbonate, etc.) should be checked before real field application [7]. From this point, metals (i.e., stainless steels) can be considered as the most appropriate materials; however, the problem of corrosion arises compared to plastics, which has no chemical and electrochemical corrosion under contact with soil (there are many other advantages of plastics for chambers for soil gas analysis, such as low density, ability to glue the elements easily). All chambers have thermal insulation for the protection of inner space from heating (polystyrene foam with foil for reflection of radiation heat transfer) [1]. Sometimes, the chamber for field measurements included the round shield on the top, protecting from the infrared radiation (e.g., CFlux-1 device, by Hansatech Co., Pentney, UK). The typical shape of such chambers is hemispherical; this shape also provides uniform mixing. The impact of soil temperature and moisture is considered by means of corresponding sensors installed in the chamber.
Glass-based chamber are not so frequently used, since it is fragile (for field tests, but appropriate for laboratory tasks), but it almost the most inert and convenient material for this purpose [7].
Studies show that gas emissions, especially carbon dioxide, depend on multiple factors influencing the measurement accuracy. In particular, the purity of CO2 emission measurements is affected by the contact method of the sampling chamber with the soil surface, especially the depth of the sleeve installation, as indicated in [212]. In conditions of very loose desert soils, the location of the sleeve affects the surface temperature of the study area, indirectly influencing gas exchange under the temperature fluctuations in the desert throughout the day. The sampling process may vary not only due to the soil particle size distribution and climatic conditions but also because of the gases being studied and introductory conditions, such as emissions from geological activities or under the influence of agricultural work. It is mentioned in [213] that one of the industry standards in several countries, particularly in Canada, is the use of a tube-shaped rod chamber approximately 50 cm long (Figure 14). This sampling method is inherent in researching emissions in mining areas or areas where gas migration is presumed to occur during extraction processes. However, it helps better identify the correlation between gas flow and soil particle size distribution, as well as biological factors, as it encompasses multiple soil layers. An important element in studying soil gas emissions is whether the chamber is stationary or dynamic. A stationary chamber implies measuring the concentration of elements in an accumulating enclosed space without the release of the accumulated gas. However, this method may alter the diffusion gradient, affecting measurement accuracy. In dynamic chambers, gas is purged outside to an analyser in a volume equal to the amount of gas in the chamber. This method allows for connecting multiple flow chambers to a single analysing system.
In addition to the pillar type of chambers, a dome system, which is a container that establishes a tight seal with the soil surface, is used. It also features a channel for directing emission gases to the analyser. One of the advantages of this system is the ability to conduct analysis over a larger area and cover the most biologically active soil horizon, which is heavily influenced by anthropogenic factors and, thus, enhancing gas exchange more intensively. For example, in the work of [215], a non-flow-through (NFT) soil gas sampling system was used, adapted for assessing the emission of greenhouse gases such as N2O and CO2, which make a significant contribution to the chemical composition of the gas phase in pastures, areas with large herds of cattle.
In this experiment, the method of off-axis diode-laser spectroscopy with a declared dynamic range of the instrument of 0–10 ppm is used. To prevent a decrease in accuracy due to an increase in pressure inside the chamber, an oscillating fan is used, operating periodically, and the ventilation outlet is designed as a dish-type structure to create a variable gap. The study also assessed the types of sealing between the container and the lid, using both standard seals and filling with water, ballistic gel, Newtonian fluid, etc. Manufacturing rectangular metal lids for containers is a more accessible option for creating chambers with a large area. However, in certain situations, indicators such as air flow recirculation in a chamber with a specific geometry, as well as the degree of heating of the gas environment under a particular material, are crucial. In some cases, this can significantly affect measurement accuracy during prolonged real-time measurements.
The problem of pressure control during long-term measurements is important, and in some cases, it is recommended to install the pressure-sensitive transducers in dynamic chambers to somehow reduce the pressure deficit that may occur [216]. Each type of soil possesses the specific soil depth affected by the change in pressure, including the negative or positive pressure drop on the surface. This change in pressure should be compensated in the experimental apparatus [217].
In [28], the application of diffuse exchange system was reported using tuneable infrared laser direct absorption spectroscopy. The technique is based on the application of diffuse exchange membranes made of polymers (e.g., PTFE). These porous material-based techniques are frequently used [218]. However, the measurement system was more convenient for laboratory tests compared to field ones.
In many cases, this can significantly affect the accuracy of measurements during prolonged real-time monitoring. In their work, Maier et al. [219] presented recommendations for designing flow chambers to minimise noise during long-term measurements, taking into account factors such as photosynthetic activity, where the quantum yield of photosynthesis changes under weak illumination, or root exudation, which affects the activity of microflora and, thus, the dynamics of the soil gas composition. Groundwater pressure and precipitation also influence soil–atmosphere gas exchange. All gas flows, dependent on various factors, are depicted in Figure 15.
There are many features of experimental techniques linked with chambers. However, there are no strong recommendations. For example, the minimum depth of chamber insertion inside the soil is hard to unify. Usually it is within 5–20 cm [220,221].
Modern commercial flux chambers are made to ensure automation of the pumping process and minimise gas losses and the influence of external factors such as vibration, temperature, and infrared radiation. Such chambers include design solutions from Li-Cor, ABB, Picarro, PP Systems, and others. However, the systems have their drawbacks, which manufacturers try to emphasise in the design of the dome and gas exchange system. In [200], authors note that with some automated flux chambers, there may be problems with gas phase mixing under the dome as well as CO2 diffusion under the chamber collars. However, improvements in the control of emission fluxes depending on the time of day, as well as paying more attention to the shape of the dome and the place where the chamber adjoins the ground, are made by the developers, which makes their design solutions more adaptive for long-term studies in different weather conditions and soil structure [214]. Researchers are trying to accumulate enough data on the use of flux chambers for specific climate zones. Bekin et al. [212] conducted experiments with automated gas chambers in desert conditions. They found that the emission of gases from soil in desert regions is not tied to periods of short-term rains, but depends much more on the time of day, as CO2 and other emission components of the soil gas phase are absorbed at night. This fact, as well as the fact that in dry regions soil microflora and soil in general are more sensitive to temperature and other factors, increases the requirements to the design features of flux chambers. In particular, to ensure greater accuracy of measurements, it is necessary to minimise shading in the chamber, including in the area of contact with the surface. Artificial pressurisation and mixing of the gas phase can also be a serious factor, which also excludes the possibility of sequential connection of flux chambers. The authors’ experiment also showed the importance of the location of the collar in the soil. They measured the values of CO2 emission and absorption, temperature fluctuations of the gas phase itself, and the ground surface at different types of collar placement 7.5 cm depth with a rim above the surface of 3.5 cm; 11 cm depth without a rim; 2.5 cm depth (Figure 16). A significant difference in CO2 flux and temperature variations at specific time intervals between conventional and other types of collars was found. This is partly due to uneven heating of the surface due to shading, the influence of which was mentioned above.
Tropical and boreal zones also have their own specificity of flow measurements not only due to the influence of climatic factor, but also due to the peculiarities of gas exchange. In particular, tropical areas are a source of N2O and a sink of CH4. At the same time, very little information on the emission features has been collected, especially in certain regions such as the Congo Basin [222]. For a long time, there was a problem of adapting automatic chamber systems for different types of tropical forests (mountain, lowland, swamp). It is connected not only with places difficult to access for experiments, but also because of the specificity of gas emission, as well as the great influence of fauna activity on emission processes. In particular, researchers in tropical forests of Congo noted sharp increases in peaks in the spectra with increasing daily activity of termite colonies.
The other feature is the application of thermal desorption for components present in soil, which are volatile (VOCs, aromatic hydrocarbons, etc.). However, this approach is more directed toward environmental research and is not appropriate for gases released as a result of the action of microorganisms [223]. Some approaches are based on the desorption of VOCs with low boiling points, while others use high-temperature thermal desorption [224]. Nevertheless, the use of high temperatures may harm microorganisms; therefore, this method is mainly applied to contaminated soils.
Overall, a comparison of various characteristics of typical soil gas analysers is given in Table 2.
As seen, the weight of the analyser decreases when moving towards devices based on gas sensors. At the same time, the majority of analysis methods are based on optical methods with concentration limits as low as tens or hundreds of ppb. The trend towards developing low-LoD sensors will enable lower detection limits and significantly reduce the weight of analysers, which is beneficial for field applications.

6. Challenges

The main problem is caused by the features of soil gas analysis using optical spectroscopy analysers, particularly due to the design of the setups and the optical system, which makes them relatively large. However, the creation of small devices consisting of a multitude of gas sensors operating at room temperature could help overcome this issue, as the energy consumption, limits of detection (LoD), and relative response of chemiresistive gas sensors are low [164,225,226], making it possible to detect the concentration levels typically used in soil gas analysis. Solving such problem accompanied with the algorithms for enhancement of SNR and other sensor characteristics (as well as PCA or other approaches to eliminate the cross-sensitivity) will make it possible to approach the creation of the small gas analyser.
The second challenge is the sampling technique, which aims to create representative data from different points in the soil. It may be beneficial to treat the sampling points using AI approaches based on additional agronomic data. This means that the data from gas analysis should be considered alongside additional information on soils, such as pH, humidity, type, and other factors, since all of these can affect the pattern of gas emissions. The application of mathematical statistics and regression analysis to analyse gas data could enhance data quality. It is probable that the active involvement of machine, which is actively used for prediction of soil gas emission [227], will bring new outstanding results. Creation of maps of soil pollution with time and geographical points along with algorithms for their plotting will bring new data not only for agronomy, but for geochemistry, geophysics, environmental protection, etc. At the same time, the issues regarding the treatment of big data obtained from soils and their comparison with soil gas analysis data are important and need clarification. Even if the data could be obtained from different soils, the behaviour of these soils in various environments should be taken into account, representing an additional problem.
The issue of sample contamination and the presence of obstructive factors must also be taken into account. However, it is difficult to account it for all pollutants and biological agents in the soil that may affect gas emissions. Creation of recommendations and systematisation of research results could solve such a problem.
Interference from the signals of various gases could introduce errors in their detection. Therefore, applying principal component analysis and other methods should increase the precision of the acquired data.

7. Conclusions

In the present work, a review of modern instrumental techniques for soil gas analysis and the problems related to the determination of gases by each method has been conducted. The features of each technique, such as optical spectroscopy, mass spectrometry, etc., were analysed. The problem on the application of gas sensors for soil gas analysis was first considered. The studies demonstrated the potential of novel approaches for soil gas emission. Important problems that need to be addressed to improve the quality of gas analysis have been presented.

Author Contributions

Methodology, A.G.B., I.V.T. and I.K.Z.; resources, P.B.K.; writing—original draft preparation, A.G.B., I.V.T., E.A.M. and I.K.Z.; writing—review and editing, A.G.B., I.V.T., I.K.Z. and E.A.M.; supervision, A.G.B. and P.B.K. All authors have read and agreed to the published version of the manuscript.

Funding

This research was funded by the State Task of Ministry of Science and Higher Education of Russian Federation (FSUN-2023-0008).

Data Availability Statement

Dataset available on request from the authors.

Conflicts of Interest

The authors declare no conflicts of interest.

References

  1. de Klein, C.A.M.; Alfaro, M.A.; Giltrap, D.; Topp, C.F.E.; Simon, P.L.; Noble, A.D.L.; van der Weerden, T.J. Global Research Alliance N2O chamber methodology guidelines: Statistical considerations, emission factor calculation, and data reporting. J. Environ. Qual. 2020, 49, 1156–1167. [Google Scholar] [CrossRef] [PubMed]
  2. Banríon, M.; Cobelli, M.; Crowley, Q.G. Applying machine learning to model radon using topsoil geochemistry. Appl. Geochemistry 2023, 158, 105790. [Google Scholar] [CrossRef]
  3. Grantham, G.; Eddis, M.K.D. Contamination of Soils by Hazardous Gases: Investigation, Monitoring, Diagnosis and Treatment. In Contaminated Soil ’90, Proceedings of the Third International KfK/TNO Conference on Contaminated Soil, 10–14 December 1990, Karlsruhe, Federal Republic of Germany; Arendt, F., Hinsenveld, M., Van Den Brink, W.J., Eds.; Springer: Dordrecht, The Netherlands, 1990; pp. 681–689. ISBN 978-94-011-3270-1. [Google Scholar]
  4. Button, E.S.; Marshall, M.; Sánchez-Rodríguez, A.R.; Blaud, A.; Abadie, M.; Chadwick, D.R.; Jones, D.L. Greenhouse gas production, diffusion and consumption in a soil profile under maize and wheat production. Geoderma 2023, 430, 116310. [Google Scholar] [CrossRef]
  5. McAlary, T.; Wang, X.; Unger, A.; Groenevelt, H.; Górecki, T. Quantitative passive soil vapor sampling for VOCs-part 1: Theory. Environ. Sci. Process. Impacts 2014, 16, 482–490. [Google Scholar] [CrossRef]
  6. Luna, A.S. Raman Spectroscopy, Soil Analysis Applications, 3rd ed.; Lindon, J.C., Tranter, G.E., Koppenaal, D., Eds.; Academic Press: Oxford, UK, 2017; pp. 919–923. [Google Scholar]
  7. Zaman, M.; Heng, L.; Müller, C. Measuring Emission of Agricultural Greenhouse Gases and Developing Mitigation Options Using Nuclear and Related Techniques: Applications of Nuclear Techniques for GHGS; Springer: Berlin/Heidelberg, Germany, 2021; ISBN 9783030553968. [Google Scholar]
  8. Nelson, D.W.; Bremner, J.M. Factors affecting chemical transformations of nitrite in soils. Soil Biol. Biochem. 1969, 1, 229–239. [Google Scholar] [CrossRef]
  9. Ansari, J.; Davis, M.P.; Anderson, S.H.; Eivazi, F.; Bardhan, S. Greenhouse Gas Emissions from Row Crop, Agroforestry, and Forested Land Use Systems in Floodplain Soils. Water Air Soil Pollut. 2023, 234, 227. [Google Scholar] [CrossRef]
  10. Brümmer, C.; Brüggemann, N.; Butterbach-Bahl, K.; Falk, U.; Szarzynski, J.; Vielhauer, K.; Wassmann, R.; Papen, H. Soil-Atmosphere Exchange of N2O and NO in Near-Natural Savanna and Agricultural Land in Burkina Faso (W. Africa). Ecosystems 2008, 11, 582–600. [Google Scholar] [CrossRef]
  11. Fowler, D.; Pilegaard, K.; Sutton, M.A.; Ambus, P.; Raivonen, M.; Duyzer, J.; Simpson, D.; Fagerli, H.; Fuzzi, S.; Schjoerring, J.K.; et al. Atmospheric composition change: Ecosystems—Atmosphere interactions. Atmos. Environ. 2009, 43, 5193–5267. [Google Scholar] [CrossRef]
  12. Ray, R.L.; Griffin, R.W.; Fares, A.; Elhassan, A.; Awal, R.; Woldesenbet, S.; Risch, E. Soil CO2 emission in response to organic amendments, temperature, and rainfall. Sci. Rep. 2020, 10, 5849. [Google Scholar] [CrossRef]
  13. Chau, T.T.M.; Someya, T.; Akao, S.; Nakamura, M.; Oritate, F.; Somura, H.; Yamane, S.; Maeda, M. Emissions of CO2 and CH4 from Agricultural Soil with Kitchen Compost at Different Temperatures. J. Soil Sci. Plant Nutr. 2024, 24, 5462–5471. [Google Scholar] [CrossRef]
  14. Yerli, C.; Cakmakci, T.; Sahin, U. Soil CO2 Emission Linearly Increases with Organic Matter Added Using Stabilized Sewage Sludge under Recycled Wastewater Irrigation Conditions. Water Air Soil Pollut. 2023, 234, 56. [Google Scholar] [CrossRef]
  15. Mühlbachová, G.; Růžek, P.; Kusá, H.; Vavera, R. CO2 Emissions from Soils under Different Tillage Practices and Weather Conditions. Agronomy 2023, 13, 3084. [Google Scholar] [CrossRef]
  16. Müller, C. Plants affect the in situ N2O emissions of a temperate grassland ecosystem. Pflanzen beeinflussen die in situ N2O-Freisetzungen eines Grünlandökosystems in temperierten Breiten. J. Plant Nutr. Soil Sci. 2003, 166, 771–773. [Google Scholar] [CrossRef]
  17. Le Mer, J.; Roger, P. Production, oxidation, emission and consumption of methane by soils: A review. Eur. J. Soil Biol. 2001, 37, 25–50. [Google Scholar] [CrossRef]
  18. Liu, J.; Chen, H.; Zhu, Q.; Shen, Y.; Wang, X.; Wang, M.; Peng, C. A novel pathway of direct methane production and emission by eukaryotes including plants, animals and fungi: An overview. Atmos. Environ. 2015, 115, 26–35. [Google Scholar] [CrossRef]
  19. Bastviken, D.; Treat, C.C.; Pangala, S.R.; Gauci, V.; Enrich-Prast, A.; Karlson, M.; Gålfalk, M.; Romano, M.B.; Sawakuchi, H.O. The importance of plants for methane emission at the ecosystem scale. Aquat. Bot. 2023, 184, 103596. [Google Scholar] [CrossRef]
  20. Pilegaard, K. Processes regulating nitric oxide emissions from soils. Philos. Trans. R. Soc. B Biol. Sci. 2013, 368, 20130126. [Google Scholar] [CrossRef]
  21. Wang, R.; Bei, N.; Wu, J.; Li, X.; Liu, S.; Yu, J.; Jiang, Q.; Tie, X.; Li, G. Cropland nitrogen dioxide emissions and effects on the ozone pollution in the North China plain. Environ. Pollut. 2022, 294, 118617. [Google Scholar] [CrossRef]
  22. Chataut, G.; Bhatta, B.; Joshi, D.; Subedi, K.; Kafle, K. Greenhouse gases emission from agricultural soil: A review. J. Agric. Food Res. 2023, 11, 100533. [Google Scholar] [CrossRef]
  23. Basheer, S.; Wang, X.; Farooque, A.A.; Nawaz, R.A.; Pang, T.; Neokye, E.O. A Review of Greenhouse Gas Emissions from Agricultural Soil. Sustainability 2024, 16, 4789. [Google Scholar] [CrossRef]
  24. Jaiswal, B.; Mukherjee, A.; Pandey, B.; Agrawal, M. Emission of Greenhouse Gases from Soil: An Assessment of Agricultural Management Practices. In Plant Responses to Soil Pollution; Singh, P., Singh, S.K., Prasad, S.M., Eds.; Springer: Singapore, 2020; pp. 221–248. ISBN 978-981-15-4964-9. [Google Scholar]
  25. Camarda, M.; De Gregorio, S.; Capasso, G.; Di Martino, R.M.R.; Gurrieri, S.; Prano, V. The monitoring of natural soil CO2 emissions: Issues and perspectives. Earth-Sci. Rev. 2019, 198, 102928. [Google Scholar] [CrossRef]
  26. Kibet, E.; Musafiri, C.M.; Kiboi, M.; Macharia, J.; Ng’etich, O.K.; Kosgei, D.K.; Mulianga, B.; Okoti, M.; Zeila, A.; Ngetich, F.K. Soil greenhouse gas emissions from different land utilization types in Western Kenya. Front. Soil Sci. 2022, 2, 956634. [Google Scholar] [CrossRef]
  27. Oertel, C.; Matschullat, J.; Zurba, K.; Zimmermann, F.; Erasmi, S. Greenhouse gas emissions from soils—A review. Geochemistry 2016, 76, 327–352. [Google Scholar] [CrossRef]
  28. Roscioli, J.R.; Meredith, L.K.; Shorter, J.H.; Gil-Loaiza, J.; Volkmann, T.H.M. Soil gas probes for monitoring trace gas messengers of microbial activity. Sci. Rep. 2021, 11, 8327. [Google Scholar] [CrossRef] [PubMed]
  29. Conrad, R. Soil microorganisms as controllers of atmospheric trace gases (H2, CO, CH4, OCS, N2O, and NO). Microbiol. Rev. 1996, 60, 609–640. [Google Scholar] [CrossRef]
  30. Wang, J.; Zhen, J.; Hu, W.; Chen, S.; Lizaga, I.; Zeraatpisheh, M.; Yang, X. Remote sensing of soil degradation: Progress and perspective. Int. Soil Water Conserv. Res. 2023, 11, 429–454. [Google Scholar] [CrossRef]
  31. Zaman, M.; Kleineidam, K.; Bakken, L.; Berendt, J.; Bracken, C.; Butterbach-Bahl, K.; Cai, Z.; Chang, S.X.; Clough, T.; Dawar, K.; et al. Methodology for Measuring Greenhouse Gas Emissions from Agricultural Soils Using Non-isotopic Techniques. In Measuring Emission of Agricultural Greenhouse Gases and Developing Mitigation Options using Nuclear and Related Techniques: Applications of Nuclear Techniques for GHGs; Zaman, M., Heng, L., Müller, C., Eds.; Springer International Publishing: Cham, Switzerland, 2021; pp. 11–108. ISBN 978-3-030-55396-8. [Google Scholar]
  32. Bhowmik, A.; Fortuna, A.-M.; Cihacek, L.J.; Rahman, S.; Borhan, M.S.; Carr, P.M. Use of laboratory incubation techniques to estimate greenhouse gas footprints from conventional and no-tillage organic agroecosystems. Soil Biol. Biochem. 2017, 112, 204–215. [Google Scholar] [CrossRef]
  33. Cárdenas, L.M.; Hawkins, J.M.B.; Chadwick, D.; Scholefield, D. Biogenic gas emissions from soils measured using a new automated laboratory incubation system. Soil Biol. Biochem. 2003, 35, 867–870. [Google Scholar] [CrossRef]
  34. McGowen, E.B.; Sharma, S.; Deng, S.; Zhang, H.; Warren, J.G. An Automated Laboratory Method for Measuring CO2 Emissions from Soils. Agric. Environ. Lett. 2018, 3, 180008. [Google Scholar] [CrossRef]
  35. Pires, L.F.; Cássaro, F.A.M.; Bacchi, O.O.S.; Reichardt, K. Non-destructive image analysis of soil surface porosity and bulk density dynamics. Radiat. Phys. Chem. 2011, 80, 561–566. [Google Scholar] [CrossRef]
  36. Imadi, S.R.; Babar, M.M.; Hasan, H.; Gul, A. Soil Microflora—An Extensive Research. In Soil Science: Agricultural and Environmental Prospectives; Hakeem, K.R., Akhtar, J., Sabir, M., Eds.; Springer International Publishing: Cham, Switzerland, 2016; pp. 303–316. ISBN 978-3-319-34451-5. [Google Scholar]
  37. Merl, T.; Hu, Y.; Pedersen, J.; Zieger, S.E.; Bornø, M.L.; Tariq, A.; Sommer, S.G.; Koren, K. Optical chemical sensors for soil analysis: Possibilities and challenges of visualising NH3 concentrations as well as pH and O2 microscale heterogeneity. Environ. Sci. Adv. 2023, 2, 1210–1219. [Google Scholar] [CrossRef]
  38. Forster, J.C. 3-Soil sampling, handling, storage and analysis. In Methods in Applied Soil Microbiology and Biochemistry; Alef, K., Nannipieri, P.B.T.-M., Eds.; Academic Press: London, UK, 1995; pp. 49–121. ISBN 978-0-12-513840-6. [Google Scholar]
  39. Margenot, A.J.; Calderón, F.J.; Goyne, K.W.; Mukome, F.N.D.; Parikh, S.J. IR Spectroscopy, Soil Analysis Applications. In Encyclopedia of Spectroscopy and Spectrometry, 3rd ed.; Lindon, J.C., Tranter, G.E., Koppenaal, D., Eds.; Academic Press: Oxford, UK, 2017; pp. 448–454. ISBN 978-0-12-803224-4. [Google Scholar]
  40. Stripp, S.T. In Situ Infrared Spectroscopy for the Analysis of Gas-processing Metalloenzymes. ACS Catal. 2021, 11, 7845–7862. [Google Scholar] [CrossRef]
  41. Margenot, A.J.; Parikh, S.J.; Calderón, F.J. Fourier-transform infrared spectroscopy for soil organic matter analysis. Soil Sci. Soc. Am. J. 2023, 87, 1503–1528. [Google Scholar] [CrossRef]
  42. Thabit, F.N.; Negim, O.I.A.; AbdelRahman, M.A.E.; Scopa, A.; Moursy, A.R.A. Using Various Models for Predicting Soil Organic Carbon Based on DRIFT-FTIR and Chemical Analysis. Soil Syst. 2024, 8, 22. [Google Scholar] [CrossRef]
  43. Krivoshein, P.K.; Volkov, D.S.; Rogova, O.B.; Proskurnin, M.A. FTIR Photoacoustic and ATR Spectroscopies of Soils with Aggregate Size Fractionation by Dry Sieving. ACS Omega 2022, 7, 2177–2197. [Google Scholar] [CrossRef] [PubMed]
  44. Nuzzo, A.; Buurman, P.; Cozzolino, V.; Spaccini, R.; Piccolo, A. Infrared spectra of soil organic matter under a primary vegetation sequence. Chem. Biol. Technol. Agric. 2020, 7, 1–12. [Google Scholar] [CrossRef]
  45. Śliwińska, A.; Smolinski, A.; Kucharski, P. Simultaneous Analysis of Heavy Metal Concentration in Soil Samples. Appl. Sci. 2019, 9, 4705. [Google Scholar] [CrossRef]
  46. Bruckman, V.J.; Wriessnig, K. Improved soil carbonate determination by FT-IR and X-ray analysis. Environ. Chem. Lett. 2013, 11, 65–70. [Google Scholar] [CrossRef] [PubMed]
  47. Materazzi, S.; Gentili, A.; Curini, R. Applications of evolved gas analysis: Part 1: EGA by infrared spectroscopy. Talanta 2006, 68, 489–496. [Google Scholar] [CrossRef]
  48. Jia, X.; Roels, J.; Baets, R.; Roelkens, G. On-Chip Non-Dispersive Infrared CO2 Sensor Based on an Integrating Cylinder. Sensors 2019, 19, 4260. [Google Scholar] [CrossRef]
  49. Khan, S.; Newport, D.; Le Calvé, S. Gas Detection Using Portable Deep-UV Absorption Spectrophotometry: A Review. Sensors 2019, 19, 5210. [Google Scholar] [CrossRef] [PubMed]
  50. Abbas, O.; Dardenne, P.; Baeten, V. Chapter 3—Near-Infrared, Mid-Infrared, and Raman Spectroscopy. In Chemical Analysis of Food; Picó, Y., Ed.; Academic Press: Boston, MA, USA, 2012; pp. 59–89. ISBN 978-0-12-384862-8. [Google Scholar]
  51. Kaufmann, P.; Chrzanowski, H.M.; Vanselow, A.; Ramelow, S. Mid-IR spectroscopy with NIR grating spectrometers. Opt. Express 2022, 30, 5926. [Google Scholar] [CrossRef]
  52. Vicente, I.S.; Pinillos, S.C.; Bernal, J.G.; Asensio, J.S. New approaches on gas phase molecular absorption spectrometry detection in gas chromatography. Fresenius. J. Anal. Chem. 1996, 355, 733–735. [Google Scholar] [CrossRef] [PubMed]
  53. Vitkin, V.; Polishchuk, A.; Chubchenko, I.; Popov, E.; Grigorenko, K.; Kharitonov, A.; Davtian, A.; Kovalev, A.; Kurikova, V.; Camy, P.; et al. Raman Laser Spectrometer: Application to 12C/13C Isotope Identification in CH4 and CO2 Greenhouse Gases. Appl. Sci. 2020, 10, 7473. [Google Scholar] [CrossRef]
  54. Chang, A.; Bond, T.; Sahota, S.; Arteaga, J.; Demory, B.; Delmas, W.; Tumkur, T.; Khitrov, V. CO2 Leakage Detection by Raman Spectroscopy with Hollow Core Photonic Crystal Fiber. In Proceedings of the CLEO 2023, San Jose, CA, USA, 7–12 May 2023; p. JW2A.117. [Google Scholar]
  55. Guo, J.; Luo, Z.; Liu, Q.; Yang, D.; Dong, H.; Huang, S.; Kong, A.; Wu, L. High-Sensitivity Raman Gas Probe for In Situ Multi-Component Gas Detection. Sensors 2021, 21, 3539. [Google Scholar] [CrossRef] [PubMed]
  56. Chowdhury, M.A.Z.; Oehlschlaeger, M.A. Deep Learning for Gas Sensing via Infrared Spectroscopy. Sensors 2024, 24, 1873. [Google Scholar] [CrossRef]
  57. Xing, Z.; Tian, K.; Du, C.; Li, C.; Zhou, J.; Chen, Z. Agricultural soil characterization by FTIR spectroscopy at micrometer scales: Depth profiling by photoacoustic spectroscopy. Geoderma 2019, 335, 94–103. [Google Scholar] [CrossRef]
  58. Lin, C.H.; Grant, R.H.; Heber, A.J.; Johnston, C.T. Application of open-path Fourier transform infrared spectroscopy (OP-FTIR) to measure greenhouse gas concentrations from agricultural fields. Atmos. Meas. Tech. 2019, 12, 3403–3415. [Google Scholar] [CrossRef]
  59. Schütze, C.; Lau, S.; Reiche, N.; Sauer, U.; Borsdorf, H.; Dietrich, P. Ground-based remote sensing with open-path fourier-Transform infrared (OP-FTIR) spectroscopy for large-scale monitoring of greenhouse gases. Energy Procedia 2013, 37, 4276–4282. [Google Scholar] [CrossRef]
  60. Seybold, C.A.; Ferguson, R.; Wysocki, D.; Bailey, S.; Anderson, J.; Nester, B.; Schoeneberger, P.; Wills, S.; Libohova, Z.; Hoover, D.; et al. Application of Mid-Infrared Spectroscopy in Soil Survey. Soil Sci. Soc. Am. J. 2019, 83, 1746–1759. [Google Scholar] [CrossRef]
  61. Torrent, J.; Barrón, V. Diffuse Reflectance Spectroscopy. In Methods of Soil Analysis Part 5—Mineralogical Methods; SSSA Book Series; Soil Science Society of America: Madison, WI, USA, 2008; pp. 367–385. ISBN 9780891188575. [Google Scholar]
  62. Griffith, D.W.T.; Jamie, I.M.; Beasley, P.A.; Denmead, O.T.; Leuning, R.; Galbally, I.E.; Meyer, C.P. FTIR in the Paddock: Trace gas soil flux measurements using FTIR spectroscopy. AIP Conf. Proc. 1998, 430, 211–214. [Google Scholar] [CrossRef]
  63. Dubowski, Y.; Harush, D.; Shaviv, A.; Stone, L.; Linker, R. Real Time Monitoring of N2O Emissions from Agricultural Soils using FTIR Spectroscopy. Soil Sci. Soc. Am. J. 2014, 78, 61–69. [Google Scholar] [CrossRef]
  64. Tan, X.; Zhang, H.; Li, J.; Wan, H.; Guo, Q.; Zhu, H.; Liu, H.; Yi, F. Non-dispersive infrared multi-gas sensing via nanoantenna integrated narrowband detectors. Nat. Commun. 2020, 11, 5245. [Google Scholar] [CrossRef] [PubMed]
  65. Bandara, K.M.T.S.; Sakai, K.; Nakandakari, T.; Yuge, K. A Low-Cost NDIR-Based N2O Gas Detection Device for Agricultural Soils: Assembly, Calibration Model Validation, and Laboratory Testing. Sensors 2021, 21, 1189. [Google Scholar] [CrossRef] [PubMed]
  66. Welsh, H.L.; Stansbury, E.J.; Romanko, J.; Feldman, T. Raman Spectroscopy of Gases. J. Opt. Soc. Am. 1955, 45, 338–343. [Google Scholar] [CrossRef]
  67. Xing, Z.; Du, C.; Shen, Y.; Ma, F.; Zhou, J. A method combining FTIR-ATR and Raman spectroscopy to determine soil organic matter: Improvement of prediction accuracy using competitive adaptive reweighted sampling (CARS). Comput. Electron. Agric. 2021, 191, 106549. [Google Scholar] [CrossRef]
  68. Lacroix, E.; De Donato, P.; Lafortune, S.; Caumon, M.C.; Barres, O.; Liu, X.; Derrien, M.; Piedevache, M. In situ continuous monitoring of dissolved gases (N2, O2, CO2, H2) prior to H2 injection in an aquifer (Catenoy, France) by on-site Raman and infrared spectroscopies: Instrumental assessment and geochemical baseline establishment. Anal. Methods 2021, 13, 3806–3820. [Google Scholar] [CrossRef]
  69. Petrov, D.; Matrosov, I. Natural Gas Analysis Using Polarized Raman Spectroscopy. Anal. Chem. 2023, 95, 9409–9414. [Google Scholar] [CrossRef]
  70. Buldakov, M.A.; Korolkov, V.A.; Matrosov, I.I.; Petrov, D.V.; Tikhomirov, A.A.; Korolev, B. V Analyzing natural gas by spontaneous Raman scattering spectroscopy. J. Opt. Technol. 2013, 80, 426–430. [Google Scholar] [CrossRef]
  71. Chibirev, I.; Mazzoleni, C.; van der Voort, D.D.; Borysow, J.; Fink, M. Raman spectrometer for field determination of H2O in natural gas pipelines. J. Nat. Gas Sci. Eng. 2018, 55, 426–430. [Google Scholar] [CrossRef]
  72. Yin, Z.; Zheng, R.; Li, L.; Xi, S.; Luan, Z.; Sun, C.; Zhang, X. In situ Raman quantitative monitoring of methanogenesis: Culture experiments of a deep-sea cold seep methanogenic archaeon. Front. Microbiol. 2023, 14, 1128064. [Google Scholar] [CrossRef]
  73. Huang, B.; Zhao, Q.; Sun, C.; Zhu, L.; Zhang, H.; Zhang, Y.; Liu, C.; Li, F. Trace Analysis of Gases and Liquids with Spontaneous Raman Scattering Based on the Integrating Sphere Principle. Anal. Chem. 2022, 94, 13311–13314. [Google Scholar] [CrossRef] [PubMed]
  74. Numata, Y.; Shinohara, Y.; Kitayama, T.; Tanaka, H. Rapid and accurate quantitative analysis of fermentation gases by Raman spectroscopy. Process Biochem. 2013, 48, 569–574. [Google Scholar] [CrossRef]
  75. Alden, M.; Blomqvist, J.; Edner, H.; Lundberg, H. Raman spectroscopy in the analysis of fire gases. Fire Mater. 1983, 7, 32–37. [Google Scholar] [CrossRef]
  76. Niklas, C.; Wackerbarth, H.; Ctistis, G. A Short Review of Cavity-Enhanced Raman Spectroscopy for Gas Analysis. Sensors 2021, 21, 1698. [Google Scholar] [CrossRef] [PubMed]
  77. Petrov, D.V.; Matrosov, I.I.; Zaripov, A.R.; Tanichev, A.S. Raman Natural Gas Analyzer: Effects of Composition on Measurement Precision. Sensors 2022, 22, 3492. [Google Scholar] [CrossRef] [PubMed]
  78. Jurowski, K.; Noga, M.; Kobylarz, D.; Niżnik, Ł.; Krośniak, A. Multimodal Imaging Using Raman Spectroscopy and FTIR in a Single Analytical Instrument with a Microscope (Infrared Raman Microscopy AIRsight, Shimadzu): Opportunities and Applications. Int. J. Mol. Sci. 2024, 25, 6884. [Google Scholar] [CrossRef]
  79. Taquet, N.; Pironon, J.; De Donato, P.; Lucas, H.; Barres, O. Efficiency of combined FTIR and Raman spectrometry for online quantification of soil gases: Application to the monitoring of carbon dioxide storage sites. Int. J. Greenh. Gas Control. 2013, 12, 359–371. [Google Scholar] [CrossRef]
  80. Maiwald, M.; Sowoidnich, K.; Sumpf, B. Portable shifted excitation Raman difference spectroscopy for on-site soil analysis. J. Raman Spectrosc. 2022, 53, 1560–1570. [Google Scholar] [CrossRef]
  81. Qin, R.; Zhang, Y.; Ren, S.; Nie, P. Rapid Detection of Available Nitrogen in Soil by Surface-Enhanced Raman Spectroscopy. Int. J. Mol. Sci. 2022, 23, 10404. [Google Scholar] [CrossRef]
  82. Fan, X.; Zeng, Y.; Zhi, Y.-L.; Nie, T.; Xu, Y.; Wang, X. Signal-to-noise ratio enhancement for Raman spectra based on optimized Raman spectrometer and convolutional denoising autoencoder. J. Raman Spectrosc. 2021, 52, 890–900. [Google Scholar] [CrossRef]
  83. Bai, Y.; Luo, H.; Li, Z.; Ding, Y.; Wang, Q.; Xiong, W. Enhancement of the signal-to-noise ratio by compressing the illumination of a spatial heterodyne Raman spectrometer. Instrum. Sci. Technol. 2024, 52, 583–596. [Google Scholar] [CrossRef]
  84. Zeng, Y.; Liu, Z.; Fan, X.; Wang, X. Modified denoising method of Raman spectra-based deep learning for Raman semi-quantitative analysis and imaging. Microchem. J. 2023, 191, 108777. [Google Scholar] [CrossRef]
  85. Zhao, X.Y.; Liu, G.Y.; Sui, Y.T.; Xu, M.; Tong, L. Denoising method for Raman spectra with low signal-to-noise ratio based on feature extraction. Spectrochim. Acta Part A Mol. Biomol. Spectrosc. 2021, 250, 119374. [Google Scholar] [CrossRef]
  86. Berden, G.; Peeters, R.; Meijer, G. Cavity ring-down spectroscopy: Experimental schemes and applications. Int. Rev. Phys. Chem. 2000, 19, 565–607. [Google Scholar] [CrossRef]
  87. Pohlman, J.W.; Casso, M.; Magen, C.; Bergeron, E. Discrete Sample Introduction Module for Quantitative and Isotopic Analysis of Methane and Other Gases by Cavity Ring-Down Spectroscopy. Environ. Sci. Technol. 2021, 55, 12066–12074. [Google Scholar] [CrossRef]
  88. He, Y.; Englich, F.V.; Orr, B.J. Multi-species trace gas detection by rapidly swept cavity ringdown spectroscopy. In Proceedings of the 2007 Conference on Lasers and Electro-Optics (CLEO), Baltimore, MD, USA, 6–11 May 2007; pp. 9–10. [Google Scholar]
  89. Martin, N.A.; Ferracci, V.; Cassidy, N.; Hoffnagle, J.A. The application of a cavity ring-down spectrometer to measurements of ambient ammonia using traceable primary standard gas mixtures. Appl. Phys. B Lasers Opt. 2016, 122, 1–11. [Google Scholar] [CrossRef]
  90. Persijn, S.; Harren, F.; Van Der Veen, A. Quantitative gas measurements using a versatile OPO-based cavity ringdown spectrometer and the comparison with spectroscopic databases. Appl. Phys. B Lasers Opt. 2010, 100, 383–390. [Google Scholar] [CrossRef]
  91. Santamaria, L.; Sarno, V.D.; Natale, P.; De Rosa, M.; De Inguscio, M.; Mosca, S.; Ricciardi, I.; Calonico, D.; Levi, F.; Maddaloni, P. Comb-assisted cavity ring-down spectroscopy of a buffer-gas-cooled molecular beam. Phys. Chem. Chem. Phys. 2016, 18, 16715–16720. [Google Scholar] [CrossRef]
  92. Liu, D.; Yu, Z.; Lin, J. Application of Combustion Module Coupled with Cavity Ring-Down Spectroscopy for Simultaneous Measurement of SOC and δ13C-SOC. J. Spectrosc. 2018, 2018, 6893454. [Google Scholar] [CrossRef]
  93. Wang, C.; Zhao, W.; Fang, B.; Yang, N.; Cheng, F.; Hu, X.; Chen, Y.; Zhang, W.; Fittschen, C.; Chen, W. Portable cavity ring-down spectrometer for an HO2 radical measurement: Instrument’s performance and potential improvement using a narrow linewidth laser. Opt. Express 2022, 30, 37446–37456. [Google Scholar] [CrossRef] [PubMed]
  94. Yan, W.B.; Dudek, J.; Lehmann, K.; Rabinowitz, P. Trace gas detection with CW cavity ring-down laser absorption spectroscopy. In Proceedings of the 2000 IEEE/SEMI Advanced Semiconductor Manufacturing Conference and Workshop, Boston, MA, USA, 12–14 September 2000; pp. 203–206. [Google Scholar] [CrossRef]
  95. Maity, A.; Maithani, S.; Pradhan, M. Chapter 3—Cavity ring-down spectroscopy: Recent technological advances and applications. In Molecular and Laser Spectroscopy; Gupta, V.P., Ozaki, Y., Eds.; Elsevier: Amsterdam, The Netherlands, 2020; pp. 83–120. ISBN 978-0-12-818870-5. [Google Scholar]
  96. Jongma, R.T.; Boogaarts, M.G.H.; Holleman, I.; Meijer, G. Trace gas detection with cavity ring down spectroscopy. Rev. Sci. Instrum. 1995, 66, 2821–2828. [Google Scholar] [CrossRef]
  97. Courtois, J.; Mohamed, A.K.; Romanini, D. High-speed off-axis Cavity Ring-Down Spectroscopy with a re-entrant configuration for spectral resolution enhancement. Opt. Express 2010, 18, 4845–4858. [Google Scholar] [CrossRef] [PubMed]
  98. Gadedjisso-Tossou, K.S.; Stoychev, L.I.; Mohou, M.A.; Cabrera, H.; Niemela, J.; Danailov, M.B.; Vacchi, A. Cavity Ring-Down Spectroscopy for Molecular Trace Gas Detection Using a Pulsed DFB QCL Emitting at 6.8 µm. Photonics 2020, 7, 74. [Google Scholar] [CrossRef]
  99. Kwaśny, M.; Bombalska, A. Optical Methods of Methane Detection. Sensors 2023, 23, 2834. [Google Scholar] [CrossRef]
  100. Liu, Y.; He, Y.; Hu, M.; Chen, B.; Xu, Z.; Yao, L.; Wang, X.; Kan, R. Cavity ring-down spectroscopy with a laser frequency stabilized and locked to a reference target gas absorption for drift-free accurate gas sensing measurements. Front. Phys. 2023, 11, 1238869. [Google Scholar] [CrossRef]
  101. McHale, L.E.; Hecobian, A.; Yalin, A.P. Open-path cavity ring-down spectroscopy for trace gas measurements in ambient air. Opt. Express 2016, 24, 5523–5535. [Google Scholar] [CrossRef]
  102. Hu, S.M. Trace Gas Measurements Using Cavity Ring-down Spectroscopy; Elsevier Inc.: Amsterdam, The Netherlands, 2021; Volume I, ISBN 9780128150146. [Google Scholar]
  103. He, Y.; Jin, C.; Kan, R.; Liu, J.; Liu, W.; Hill, J.; Jamie, I.M.; Orr, B.J. Remote open-path cavity-ringdown spectroscopic sensing of trace gases in air, based on distributed passive sensors linked by km-long optical fibers. Opt. Express 2014, 22, 13170. [Google Scholar] [CrossRef]
  104. Elmaleh, C.; Simon, F.; Decker, J.; Dumont, J.; Cazier, F.; Fourmentin, M.; Bocquet, R.; Cuisset, A.; Mouret, G.; Hindle, F. THz cavity ring-down quantitative gas phase spectroscopy. Talanta 2023, 253, 124097. [Google Scholar] [CrossRef]
  105. Ma, G.; He, Y.; Chen, B.; Deng, H.; Liu, Y.; Wang, X.; Zhao, Z.; Kan, R. Quasi-simultaneous sensitive detection of two gas species by cavity-ringdown spectroscopy with two lasers. Sensors 2021, 21, 7622. [Google Scholar] [CrossRef]
  106. Brown, S.S.; Stark, H.; Ravishankara, A.R. Cavity ring-down spectroscopy for atmospheric trace gas detection: Application to the nitrate radical (NO3). Appl. Phys. B Lasers Opt. 2002, 75, 173–182. [Google Scholar] [CrossRef]
  107. Fasci, E.; D’Agostino, V.; Khan, M.A.; Gravina, S.; Porzio, G.; Gianfrani, L.; Castrillo, A. Comb-assisted cavity ring-down spectroscopy for ultra-sensitive traceable measurements of water vapour in ultra-high purity gases. J. Phys. Conf. Ser. 2023, 2439, 012017. [Google Scholar] [CrossRef]
  108. Dickinson, D.; Bodé, S.; Boeckx, P. System for δ13C-CO2 and xCO2 analysis of discrete gas samples by cavity ring-down spectroscopy. Atmos. Meas. Tech. 2017, 10, 4507–4519. [Google Scholar] [CrossRef]
  109. Wang, C.; Surampudi, A.B. An acetone breath analyzer using cavity ringdown spectroscopy: An initial test with human subjects under various situations. Meas. Sci. Technol. 2008, 19, 105604. [Google Scholar] [CrossRef]
  110. Maithani, S.; Pradhan, M. Cavity ring-down spectroscopy and its applications to environmental, chemical and biomedical systems. J. Chem. Sci. 2020, 132, 1–19. [Google Scholar] [CrossRef]
  111. Varma, R.M.; Venables, D.S.; Ruth, A.A.; Heitmann, U.; Schlosser, E.; Dixneuf, S. Long optical cavities for open-path monitoring of atmospheric trace gases and aerosol extinction. Appl. Opt. 2009, 48, B159–B171. [Google Scholar] [CrossRef]
  112. Wang, D.; Hu, R.; Xie, P.; Liu, J.; Liu, W.; Qin, M.; Ling, L.; Zeng, Y.; Chen, H.; Xing, X.; et al. Diode laser cavity ring-down spectroscopy for in situ measurement of NO3 radical in ambient air. J. Quant. Spectrosc. Radiat. Transf. 2015, 166, 23–29. [Google Scholar] [CrossRef]
  113. Ko, K.H.; Kim, Y.; Kim, T.S.; Lee, L.; Park, H. Measurement of 14CO2 using off-axis integrated cavity output spectroscopy. Appl. Phys. B Lasers Opt. 2022, 128, 149. [Google Scholar] [CrossRef]
  114. Shen, G.; Chao, X.; Sun, K. Modeling the optical field in off-axis integrated-cavity-output spectroscopy using the decentered Gaussian beam model. Appl. Opt. 2018, 57, 2947. [Google Scholar] [CrossRef]
  115. Shao, L.; Mei, J.; Chen, J.; Tan, T.; Wang, G.; Liu, K.; Gao, X. Recent advances and applications of off-axis integrated cavity output spectroscopy. Microw. Opt. Technol. Lett. 2023, 65, 1489–1505. [Google Scholar] [CrossRef]
  116. Moyer, E.J.; Sayres, D.S.; Engel, G.S.; St Clair, J.M.; Keutsch, F.N.; Allen, N.T.; Kroll, J.H.; Anderson, J.G. Design considerations in high-sensitivity off-axis integrated cavity output spectroscopy. Appl. Phys. B Lasers Opt. 2008, 92, 467–474. [Google Scholar] [CrossRef]
  117. Nadeem, F.; Mandon, J.; Cristescu, S.M.; Harren, F.J.M. Optical re-injection in Off-Axis Integrated Cavity Output Spectroscopy, modelling and experiments. In Proceedings of the 2018 Conference on Lasers and Electro-Optics (CLEO), San Jose, CA, USA, 13–18 May 2018; pp. 1–2. [Google Scholar]
  118. Yuan, Z.; Huang, Y.; Lu, X.; Huang, J.; Liu, Q.; Qi, G.; Cao, Z. Measurement of CO2 by wavelength modulated reinjection off-axis integrated cavity output spectroscopy at 2 µm. Atmosphere 2021, 12, 1247. [Google Scholar] [CrossRef]
  119. Chen, W.; Kosterev, A.A.; Tittel, F.K.; Boucher, D. Detection of H2S based on Off-Axis Integrated Cavity Output Spectroscopy. In Proceedings of the 2007 European Conference on Lasers and Electro-Optics and the International Quantum Electronics Conference, Munich, Germany, 17–22 June 2007; p. 1. [Google Scholar]
  120. Arslanov, D.D.; Swinkels, K.; Cristescu, S.M.; Harren, F.J.M. Real-time, subsecond, multicomponent breath analysis by Optical Parametric Oscillator based Off-Axis Integrated Cavity Output Spectroscopy. Opt. Express 2011, 19, 24078. [Google Scholar] [CrossRef] [PubMed]
  121. Pal, M.; Bhattacharya, S.; Maity, A.; Chaudhuri, S.; Pradhan, M. Exploring Triple-Isotopic Signatures of Water in Human Exhaled Breath, Gastric Fluid, and Drinking Water Using Integrated Cavity Output Spectroscopy. Anal. Chem. 2020, 92, 5717–5723. [Google Scholar] [CrossRef]
  122. Parameswaran, K.R.; Rosen, D.I.; Allen, M.G.; Ganz, A.M.; Risby, T.H. Off-axis integrated cavity output spectroscopy with a mid-infrared interband cascade laser for real-time breath ethane measurements. Appl. Opt. 2009, 48, B73–B79. [Google Scholar] [CrossRef]
  123. Zheng, K.; Zheng, C.; Hu, L.; Song, F.; Zhang, Y.; Wang, Y.; Tittel, F.K. Near-Infrared Fiber-Coupled Off-Axis Cavity-Enhanced Thermoelastic Spectroscopic Sensor System for In Situ Multipoint Ammonia Leak Monitoring. IEEE Trans. Instrum. Meas. 2021, 70, 1–9. [Google Scholar] [CrossRef]
  124. Zheng, K.; Yu, L.; Zheng, C.; Xi, Z.; Zhang, Y.; Yan, G.; Zhang, H.; Zhang, Y.; Wang, Y.; Tittel, F.K. Vehicle-Deployed off-Axis Integrated Cavity Output Spectroscopic CH4/C2H6 Sensor System for Mobile Inspection of Natural Gas Leakage. ACS Sens. 2022, 7, 1685–1697. [Google Scholar] [CrossRef]
  125. Wang, J.; Tian, X.; Dong, Y.; Zhu, G.; Chen, J.; Tan, T.; Liu, K.; Chen, W.; Gao, X. Enhancing off-axis integrated cavity output spectroscopy (OA-ICOS) with radio frequency white noise for gas sensing. Opt. Express 2019, 27, 30517–30529. [Google Scholar] [CrossRef]
  126. Wang, K.; Shao, L.; Chen, J.; Wang, G.; Liu, K.; Tan, T.; Mei, J.; Chen, W.; Gao, X. A dual-laser sensor based on off-axis integrated cavity output spectroscopy and time-division multiplexing method. Sensors 2020, 20, 6192. [Google Scholar] [CrossRef]
  127. He, Q.; Zheng, C.; Zheng, K.; Tittel, F.K. Off-axis integrated cavity output spectroscopy for real-time methane measurements with an integrated wavelength-tunable light source. Infrared Phys. Technol. 2021, 115, 103705. [Google Scholar] [CrossRef]
  128. Mahesh, P.; Sreenivas, G.; Rao, P.V.N.; Dadhwal, V.K.; Sai Krishna, S.V.S.; Mallikarjun, K. High-precision surface-level CO2 and CH4 using off-axis integrated cavity output spectroscopy (OA-ICOS) over Shadnagar, India. Int. J. Remote Sens. 2015, 36, 5754–5765. [Google Scholar] [CrossRef]
  129. Wang, M.; Zhang, Y.; Liu, J.; Liu, W.; Kan, R.; Wang, T.; Chen, D.; Chen, J.; Wang, X.; Xia, H.; et al. Applications of a tunable diode laser absorption spectrometer in monitoring greenhouse gases. Chin. Opt. Lett. 2006, 4, 363–365. [Google Scholar]
  130. Avetisov, V.; Bjoroey, O.; Wang, J.; Geiser, P.; Paulsen, K.G. Hydrogen Sensor Based on Tunable Diode Laser Absorption Spectroscopy. Sensors 2019, 19, 5313. [Google Scholar] [CrossRef] [PubMed]
  131. Liu, X.; Ma, Y. Tunable Diode Laser Absorption Spectroscopy Based Temperature Measurement with a Single Diode Laser Near 1.4 μm. Sensors 2022, 22, 6095. [Google Scholar] [CrossRef] [PubMed]
  132. Tu, R.; Gu, J.; Zeng, Y.; Zhou, X.; Yang, K.; Jing, J.; Miao, Z.; Yang, J. Development and Validation of a Tunable Diode Laser Absorption Spectroscopy System for Hot Gas Flow and Small-Scale Flame Measurement. Sensors 2022, 22, 6707. [Google Scholar] [CrossRef]
  133. Chaulya, S.K.; Prasad, G.M. Chapter 3—Gas Sensors for Underground Mines and Hazardous Areas. In Sensing and Monitoring Technologies for Mines and Hazardous Areas; Elsevier: Amsterdam, The Netherlands, 2016; pp. 161–212. ISBN 978-0-12-803194-0. [Google Scholar]
  134. Sun, J.; Chang, J.; Wang, C.; Shao, J. Tunable diode laser absorption spectroscopy for detection of multi-component gas: A review. Appl. Spectrosc. Rev. 2024, 59, 1086–1107. [Google Scholar] [CrossRef]
  135. Bowling, D.R.; Sargent, S.D.; Tanner, B.D.; Ehleringer, J.R. Tunable diode laser absorption spectroscopy for stable isotope studies of ecosystem-atmosphere CO2 exchange. Agric. For. Meteorol. 2003, 118, 1–19. [Google Scholar] [CrossRef]
  136. Famulari, D.; Fowler, D.; Hargreaves, K.; Milford, C.; Nemitz, E.; Sutton, M.A.; Weston, K. Measuring Eddy Covariance Fluxes of Ammonia Using Tunable Diode Laser Absorption Spectroscopy. Water Air Soil Pollut. Focus 2004, 4, 151–158. [Google Scholar] [CrossRef]
  137. Brueckner, D.; Solokhina, A.; Krähenbühl, S.; Braissant, O. A combined application of tunable diode laser absorption spectroscopy and isothermal micro-calorimetry for calorespirometric analysis. J. Microbiol. Methods 2017, 139, 210–214. [Google Scholar] [CrossRef]
  138. Lin, S.; Chang, J.; Sun, J.; Xu, P. Improvement of the Detection Sensitivity for Tunable Diode Laser Absorption Spectroscopy: A Review. Front. Phys. 2022, 10, 853966. [Google Scholar] [CrossRef]
  139. Li, C.; Ding, S.; Yang, L.; Zhu, Q.; Chen, M.; Tsang, D.C.W.; Cai, G.; Feng, C.; Wang, Y.; Zhang, C. Planar optode: A two-dimensional imaging technique for studying spatial-temporal dynamics of solutes in sediment and soil. Earth-Sci. Rev. 2019, 197, 102916. [Google Scholar] [CrossRef]
  140. Waich, K.; Borisov, S.; Mayr, T.; Klimant, I. Dual lifetime referenced trace ammonia sensors. Sens. Actuators B Chem. 2009, 139, 132–138. [Google Scholar] [CrossRef]
  141. Müller, B.J.; Steinmann, N.; Borisov, S.M.; Klimant, I. Ammonia sensing with fluoroionophores—A promising way to minimize interferences caused by volatile amines. Sens. Actuators B Chem. 2018, 255, 1897–1901. [Google Scholar] [CrossRef]
  142. Honeyman, A.S.; Merl, T.; Spear, J.R.; Koren, K. Optode-based chemical imaging of laboratory burned soil reveals millimeter-scale heterogeneous biogeochemical responses. Environ. Res. 2023, 224, 115469. [Google Scholar] [CrossRef] [PubMed]
  143. De Gregorio, M.A.; Clerici, L.; Marinone, E.; Frattini, V.; Dellavedova, P. Advances in Hydrocarbon Speciation for Soil Gas Analysis. Separations 2023, 10, 489. [Google Scholar] [CrossRef]
  144. Katsumi, N.; Yonebayashi, K.; Okazaki, M.; Nishiyama, S.; Nishi, T.; Hosaka, A.; Watanabe, C. Characterization of soil organic matter with different degrees of humification using evolved gas analysis-mass spectrometry. Talanta 2016, 155, 28–37. [Google Scholar] [CrossRef]
  145. Duff, D.; Lennard, C.; Li, Y.; Doyle, C.; Edge, K.J.; Holland, I.; Lothridge, K.; Johnstone, P.; Beylerian, P.; Spikmans, V. Portable gas chromatography–mass spectrometry method for the in-field screening of organic pollutants in soil and water at pollution incidents. Environ. Sci. Pollut. Res. 2023, 30, 93088–93102. [Google Scholar] [CrossRef]
  146. Maurin, N.; Sayen, S.; Guillon, E. Gas chromatography–mass spectrometry analysis of organic pollutants in French soils irrigated with agro-industrial wastewater. Front. Environ. Sci. 2023, 11, 1125487. [Google Scholar] [CrossRef]
  147. Schnitzer, M.; Schulten, H.-R. Analysis of Organic Matter in Soil Extracts and Whole Soils by Pyrolysis-Mass Spectrometry. In Advances in Agronomy; Sparks, D., Ed.; Academic Press: Cambridge, MA, USA, 1995; Volume 55, pp. 167–217. ISBN 0065-2113. [Google Scholar]
  148. Leinweber, P.; Schulten, H.-R. -R. Differential thermal analysis, thermogravimetry and in-source pyrolysis-mass spectrometry studies on the formation of soil organic matter. Thermochim. Acta 1992, 200, 151–167. [Google Scholar] [CrossRef]
  149. Alpers, C.N.; Dettman, D.L.; Lohmann, K.C.; Brabec, D. Stable isotopes of carbon dioxide in soil gas over massive sulfide mineralization at Crandon, Wisconsin. J. Geochem. Explor. 1990, 38, 69–86. [Google Scholar] [CrossRef]
  150. Zhu, X.; Di, D.; Ma, M.; Shi, W. Stable Isotopes in Greenhouse Gases from Soil: A Review of Theory and Application. Atmosphere 2019, 10, 377. [Google Scholar] [CrossRef]
  151. Lubbers, I.M.; van Groenigen, K.J.; Fonte, S.J.; Six, J.; Brussaard, L.; van Groenigen, J.W. Greenhouse-gas emissions from soils increased by earthworms. Nat. Clim. Chang. 2013, 3, 187–194. [Google Scholar] [CrossRef]
  152. Sheppard, S.K.; Lloyd, D. Direct mass spectrometric measurement of gases in soil monoliths. J. Microbiol. Methods 2002, 50, 175–188. [Google Scholar] [CrossRef] [PubMed]
  153. Nakayama, N.; Toma, Y.; Iwai, Y.; Furutani, H.; Hondo, T.; Hatano, R.; Toyoda, M. Mass spectrometric multiple soil-gas flux measurement system with a portable high-resolution mass spectrometer (MULTUM) coupled to an automatic chamber for continuous field observations. Atmos. Meas. Tech. 2020, 13, 6657–6673. [Google Scholar] [CrossRef]
  154. Christiansen, J.R.; Outhwaite, J.; Smukler, S.M. Comparison of CO2, CH4 and N2O soil-atmosphere exchange measured in static chambers with cavity ring-down spectroscopy and gas chromatography. Agric. For. Meteorol. 2015, 211–212, 48–57. [Google Scholar] [CrossRef]
  155. Munksgaard, N.C.; Davies, K.; Wurster, C.M.; Bass, A.M.; Bird, M.I. Field-based cavity ring-down spectrometry of δ13C in soil-respired CO2. Isot. Environ. Health Stud. 2013, 49, 232–242. [Google Scholar] [CrossRef]
  156. Wang, L.; Cheng, Y.; Naidu, R.; Chadalavada, S. Environmental Technology & Innovation Application of portable gas chromatography—Mass spectrometer for rapid field based determination of TCE in soil vapour and groundwater. Environ. Technol. Innov. 2021, 21, 101274. [Google Scholar] [CrossRef]
  157. McDonald, M.; Lewis, K.; Gentry, T.; DeLaune, P. Soil pore space gas probes for use in agricultural research. Soil Secur. 2021, 5, 100015. [Google Scholar] [CrossRef]
  158. Burford, J.R.; Bremner, J.M. Gas chromatographic determination of carbon dioxide evolved from soils in closed systems. Soil Biol. Biochem. 1972, 4, 191–197. [Google Scholar] [CrossRef]
  159. Mondini, C.; Sinicco, T.; Cayuela, M.L.; Sanchez-Monedero, M.A. A simple automated system for measuring soil respiration by gas chromatography. Talanta 2010, 81, 849–855. [Google Scholar] [CrossRef]
  160. Zgonnik, V.; Beaumont, V.; Deville, E.; Larin, N.; Pillot, D.; Farrell, K.M. Evidence for natural molecular hydrogen seepage associated with Carolina bays (surficial, ovoid depressions on the Atlantic Coastal Plain, Province of the USA). Prog. Earth Planet. Sci. 2015, 2, 1–15. [Google Scholar] [CrossRef]
  161. Peng, G.; Tisch, U.; Adams, O.; Hakim, M.; Shehada, N.; Broza, Y.Y.; Billan, S.; Abdah-Bortnyak, R.; Kuten, A.; Haick, H. Diagnosing lung cancer in exhaled breath using gold nanoparticles. Nat. Nanotechnol. 2009, 4, 669–673. [Google Scholar] [CrossRef] [PubMed]
  162. Penza, M.; Rossi, R.; Alvisi, M.; Signore, M.A.; Serra, E.; Paolesse, R.; D’Amico, A.; Di Natale, C. Metalloporphyrins-modified carbon nanotubes networked films-based chemical sensors for enhanced gas sensitivity. Sens. Actuators B Chem. 2010, 144, 387–394. [Google Scholar] [CrossRef]
  163. Mubeen, S.; Lai, M.; Zhang, T.; Lim, J.H.; Mulchandani, A.; Deshusses, M.A.; Myung, N.V. Hybrid tin oxide-SWNT nanostructures based gas sensor. Electrochim. Acta 2013, 92, 484–490. [Google Scholar] [CrossRef]
  164. Sakthivel, R.; Geetha, A.; Dineshkumar, J. Design and fabrication of CoS2/graphene hybrid composite film sensor for NO2 gas-sensing performance. J. Mater. Sci. Mater. Electron. 2023, 34, 1495. [Google Scholar] [CrossRef]
  165. Kumbhakar, P.; Chowde Gowda, C.; Mahapatra, P.L.; Mukherjee, M.; Malviya, K.D.; Chaker, M.; Chandra, A.; Lahiri, B.; Ajayan, P.M.; Jariwala, D.; et al. Emerging 2D metal oxides and their applications. Mater. Today 2021, 45, 142–168. [Google Scholar] [CrossRef]
  166. Alagh, A.; Annanouch, F.E.; Sierra-Castillo, A.; Haye, E.; Colomer, J.F.; Llobet, E. Three-Dimensional Assemblies of Edge-Enriched WSe2Nanoflowers for Selectively Detecting Ammonia or Nitrogen Dioxide. ACS Appl. Mater. Interfaces 2022, 14, 54946–54960. [Google Scholar] [CrossRef]
  167. Kumar, R.; Goel, N.; Hojamberdiev, M.; Kumar, M. Transition metal dichalcogenides-based flexible gas sensors. Sens. Actuators A Phys. 2020, 303, 111875. [Google Scholar] [CrossRef]
  168. Zheng, W.; Liu, X.; Xie, J.; Lu, G.; Zhang, J. Emerging van der Waals junctions based on TMDs materials for advanced gas sensors. Coord. Chem. Rev. 2021, 447, 214151. [Google Scholar] [CrossRef]
  169. Mendes, R.G.; Wr, P.S.; Bachmatiuk, A.; Sun, J.; Gemming, T.; Liu, Z.; Rümmeli, M.H.; Wróbel, P.S.; Bachmatiuk, A.; Sun, J.; et al. Carbon nanostructures as a multi-functional platform for sensing applications. Chemosensors 2018, 6, 60. [Google Scholar] [CrossRef]
  170. Fei, H.; Wu, G.; Cheng, W.Y.; Yan, W.; Xu, H.; Zhang, D.; Zhao, Y.; Lv, Y.; Chen, Y.; Zhang, L.; et al. Enhanced NO2 Sensing at Room Temperature with Graphene via Monodisperse Polystyrene Bead Decoration. ACS Omega 2019, 4, 3812–3819. [Google Scholar] [CrossRef] [PubMed]
  171. Liu, Y.; Babu, H.V.; Zhao, J.; Goñi-Urtiaga, A.; Sainz, R.; Ferritto, R.; Pita, M.; Wang, D.Y. Effect of Cu-doped graphene on the flammability and thermal properties of epoxy composites. Compos. Part B Eng. 2016, 89, 108–116. [Google Scholar] [CrossRef]
  172. Freddi, S.; Emelianov, A.V.; Bobrinetskiy, I.I.; Drera, G.; Pagliara, S.; Kopylova, D.S.; Chiesa, M.; Santini, G.; Mores, N.; Moscato, U.; et al. Development of a Sensing Array for Human Breath Analysis Based on SWCNT Layers Functionalized with Semiconductor Organic Molecules. Adv. Healthc. Mater. 2020, 9, e2000377. [Google Scholar] [CrossRef] [PubMed]
  173. Mirzaei, A.; Lee, M.H.; Safaeian, H.; Kim, T.-U.; Kim, J.-Y.; Kim, H.W.; Kim, S.S. Room Temperature Chemiresistive Gas Sensors Based on 2D MXenes. Sensors 2023, 23, 8829. [Google Scholar] [CrossRef] [PubMed]
  174. Mishra, P.; Tai, N.H.; Harsh; Islam, S.S. Transfer of microstructure pattern of CNTs onto flexible substrate using hot press technique for sensing applications. Mater. Res. Bull. 2013, 48, 2804–2808. [Google Scholar] [CrossRef]
  175. Guo, Z.; Wang, B.; Wang, X.; Li, Y.; Gai, S.; Wu, Y.; Cheng, X. A high-sensitive room temperature gas sensor based on cobalt phthalocyanines and reduced graphene oxide nanohybrids for the ppb-levels of ammonia detection. RSC Adv. 2019, 9, 37518–37525. [Google Scholar] [CrossRef]
  176. Lin, Y.; Manalili, D.; Khodabakhsh, A.; Cristescu, S.M. Real-Time Measurement of CH4 in Human Breath Using a Compact CH4/CO2 Sensor. Sensors 2024, 24, 1077. [Google Scholar] [CrossRef]
  177. Drera, G.; Freddi, S.; Emelianov, A.V.; Bobrinetskiy, I.I.; Chiesa, M.; Zanotti, M.; Pagliara, S.; Fedorov, F.S.; Nasibulin, A.G.; Montuschi, P.; et al. Exploring the performance of a functionalized CNT-based sensor array for breathomics through clustering and classification algorithms: From gas sensing of selective biomarkers to discrimination of chronic obstructive pulmonary disease. RSC Adv. 2021, 11, 30270–30282. [Google Scholar] [CrossRef]
  178. Kwak, D.; Lei, Y.; Maric, R. Ammonia gas sensors: A comprehensive review. Talanta 2019, 204, 713–730. [Google Scholar] [CrossRef]
  179. Chérot-Kornobis, N.; Hulo, S.; Edmé, J.-L.; de Broucker, V.; Matran, R.; Sobaszek, A. Analysis of nitrogen oxides (NOx) in the exhaled breath condensate (EBC) of subjects with asthma as a complement to exhaled nitric oxide (FeNO) measurements: A cross-sectional study. BMC Res. Notes 2011, 4, 202. [Google Scholar] [CrossRef]
  180. Lee, J.; Jung, M.; Barthwal, S.; Lee, S.; Lim, S.-H. MEMS gas preconcentrator filled with CNT foam for exhaled VOC gas detection. BioChip J. 2015, 9, 44–49. [Google Scholar] [CrossRef]
  181. Mazzsatenta, A.; Pokorski, M.; Di Giulio, C. Volatile organic compounds (VOCs) in exhaled breath as a marker of hypoxia in multiple chemical sensitivity. Physiol. Rep. 2021, 9, e15034. [Google Scholar] [CrossRef]
  182. Lefferts, M.J.; Castell, M.R. Influence of soil type on chemiresistive detection of buried ANFO. Forensic Chem. 2022, 27, 100401. [Google Scholar] [CrossRef]
  183. Ho, C.K.; Hughes, R.C. In-Situ Chemiresistor Sensor Package for Real-Time Detection of Volatile Organic Compounds in Soil and Groundwater. Sensors 2002, 2, 23–34. [Google Scholar] [CrossRef]
  184. Shooshtari, M.; Salehi, A. An electronic nose based on carbon nanotube -titanium dioxide hybrid nanostructures for detection and discrimination of volatile organic compounds. Sens. Actuators B Chem. 2022, 357, 131418. [Google Scholar] [CrossRef]
  185. Su, P.-G.; Li, M.-C. Recognition of binary mixture of NO2 and NO gases using a chemiresistive sensors array combined with principal component analysis. Sens. Actuators A Phys. 2021, 331, 112980. [Google Scholar] [CrossRef]
  186. Hamadache, M.; Lee, D. Principal component analysis based signal-to-noise ratio improvement for inchoate faulty signals: Application to ball bearing fault detection. Int. J. Control Autom. Syst. 2017, 15, 506–517. [Google Scholar] [CrossRef]
  187. Morawski, R.Z.; Miękina, A. Application of principal components analysis and signal-to-noise ratio for calibration of spectrophotometric analysers of food. Measurement 2016, 79, 302–310. [Google Scholar] [CrossRef]
  188. Getino, J.; Arés, L.; Robla, J.I.; Horrillo, M.C.; Sayago, I.; Fernández, M.J.; Rodrigo, J.; Gutiérrez, J. Environmental applications of gas sensor arrays: Combustion atmospheres and contaminated soils. Sens. Actuators B Chem. 1999, 59, 249–254. [Google Scholar] [CrossRef]
  189. Huang, S.; Croy, A.; Panes-Ruiz, L.A.; Khavrus, V.; Bezugly, V.; Ibarlucea, B.; Cuniberti, G. Machine Learning-Enabled Smart Gas Sensing Platform for Identification of Industrial Gases. Adv. Intell. Syst. 2022, 4, 2200016. [Google Scholar] [CrossRef]
  190. Ketchanji Mougang, Y.C.; Endale Mangamba, L.-M.; Capuano, R.; Ciccacci, F.; Catini, A.; Paolesse, R.; Mbatchou Ngahane, H.B.; Palombi, L.; Di Natale, C. On-Field Test of Tuberculosis Diagnosis through Exhaled Breath Analysis with a Gas Sensor Array. Biosensors 2023, 13, 570. [Google Scholar] [CrossRef] [PubMed]
  191. Hosoda, M.; Tokonami, S.; Suzuki, T.; Janik, M. Machine learning as a tool for analysing the impact of environmental parameters on the radon exhalation rate from soil. Radiat. Meas. 2020, 138, 106402. [Google Scholar] [CrossRef]
  192. Awais, M.; Naqvi, S.M.Z.A.; Zhang, H.; Li, L.; Zhang, W.; Awwad, F.A.; Ismail, E.A.A.; Khan, M.I.; Raghavan, V.; Hu, J. AI and machine learning for soil analysis: An assessment of sustainable agricultural practices. Bioresour. Bioprocess. 2023, 10, 90. [Google Scholar] [CrossRef] [PubMed]
  193. Adjuik, T.A.; Davis, S.C. Machine Learning Approach to Simulate Soil CO2 Fluxes under Cropping Systems. Agronomy 2022, 12, 197. [Google Scholar] [CrossRef]
  194. Murcek, R.; Hölzel, J.; Köhler, H.; Boye, A.; Hesse, M.; Mauermann, M. Development of a quartz crystal sensor system to monitor local soil removal during cleaning in closed food processing lines. Food Bioprod. Process. 2021, 127, 282–287. [Google Scholar] [CrossRef]
  195. Bristow, Q. An evaluation of the quartz crystal microbalance as a mercury vapour sensor for soil gases. J. Geochem. Explor. 1972, 1, 55–76. [Google Scholar] [CrossRef]
  196. Lim, J.-H.; Phiboolsirichit, N.; Mubeen, S.; Deshusses, M.A.; Mulchandani, A.; Myung, N.V. Electrical and gas sensing properties of polyaniline functionalized single-walled carbon nanotubes. Nanotechnology 2010, 21, 75502. [Google Scholar] [CrossRef]
  197. Pineda, D.M.; Pérez, J.C. SENose: An under U$50 electronic nose for the monitoring of soil gas emissions. Comput. Electron. Agric. 2017, 133, 15–21. [Google Scholar] [CrossRef]
  198. Romanak, K.D.; Womack, G.L.; Bomse, D.S. Field Test of in Situ Sensor Technology for Process-based Soil Gas Monitoring. Energy Procedia 2014, 63, 4027–4030. [Google Scholar] [CrossRef]
  199. Romanak, K.D.; Bomse, D.S. Field assessment of sensor technology for environmental monitoring using a process-based soil gas method at geologic CO2 storage sites. Int. J. Greenh. Gas Control 2020, 96, 103003. [Google Scholar] [CrossRef]
  200. Görres, C.M.; Kammann, C.; Ceulemans, R. Automation of soil flux chamber measurements: Potentials and pitfalls. Biogeosciences 2016, 13, 1949–1966. [Google Scholar] [CrossRef]
  201. Livingston, G.P.; Hutchinson, G.L.; Spartalian, K. Trace Gas Emission in Chambers. Soil Sci. Soc. Am. J. 2006, 70, 1459–1469. [Google Scholar] [CrossRef]
  202. Van Afferden, M.; Hansen, A.M.; Kaiser, C.; Chapelain, N. Laboratory test system to measure microbial respiration rate. Int. J. Environ. Pollut. 2006, 26, 220–233. [Google Scholar] [CrossRef]
  203. Hoyle, F.C.; Murphy, D.V.; Brookes, P.C. Microbial response to the addition of glucose in low-fertility soils. Biol. Fertil. Soils 2008, 44, 571–579. [Google Scholar] [CrossRef]
  204. Pihlatie, M.K.; Christiansen, J.R.; Aaltonen, H.; Korhonen, J.F.J.; Nordbo, A.; Rasilo, T.; Benanti, G.; Giebels, M.; Helmy, M.; Sheehy, J.; et al. Comparison of static chambers to measure CH4 emissions from soils. Agric. For. Meteorol. 2013, 171–172, 124–136. [Google Scholar] [CrossRef]
  205. Conen, F.; Smith, K.A. An explanation of linear increases in gas concentration under closed chambers used to measure gas exchange between soil and the atmosphere. Eur. J. Soil Sci. 2000, 51, 111–117. [Google Scholar] [CrossRef]
  206. Hutchinson, G.L.; Livingston, G.P. Vents and seals in non-steady-state chambers used for measuring gas exchange between soil and the atmosphere. Eur. J. Soil Sci. 2001, 52, 675–682. [Google Scholar] [CrossRef]
  207. Laemmel, T.; Mohr, M.; Longdoz, B.; Schack-Kirchner, H.; Lang, F.; Schindler, D.; Maier, M. From above the forest into the soil—How wind affects soil gas transport through air pressure fluctuations. Agric. For. Meteorol. 2019, 265, 424–434. [Google Scholar] [CrossRef]
  208. Liu, T.; Hu, C.; Wang, Q.; Li, J.; Huang, K.; Chen, Z.; Shi, T. Conversion relationship of rainfall-soil moisture-groundwater in Quaternary thick cohesive soil in Jianghan Plain, Hubei Province, China. China Geol. 2020, 3, 462–472. [Google Scholar]
  209. Song, B.; Niu, S.; Wan, S. Precipitation regulates plant gas exchange and its long-term response to climate change in a temperate grassland. J. Plant Ecol. 2016, 9, 531–541. [Google Scholar] [CrossRef]
  210. Mikhalchuk, A.; Kharanzhevskaya, Y.; Burnashova, E.; Nekhoda, E.; Gammerschmidt, I.; Akerman, E.; Kirpotin, S.; Nikitkin, V.; Khovalyg, A.; Vorobyev, S. Soil Water Regime, Air Temperature, and Precipitation as the Main Drivers of the Future Greenhouse Gas Emissions from West Siberian Peatlands. Water 2023, 15, 3056. [Google Scholar] [CrossRef]
  211. Sundari, S.; Hirano, T.; Yamada, H.; Kusin, K.; Limin, S. Effect of Groundwater Level on Soil Respiration in Tropical Peat Swamp Forests. J. Agric. Meteorol. 2012, 68, 121–134. [Google Scholar] [CrossRef]
  212. Bekin, N.; Agam, N. Rethinking the deployment of static chambers for CO2 flux measurement in dry desert soils. Biogeosciences 2023, 20, 3791–3802. [Google Scholar] [CrossRef]
  213. Verginelli, I.; Pecoraro, R.; Baciocchi, R. Using dynamic flux chambers to estimate the natural attenuation rates in the subsurface at petroleum contaminated sites. Sci. Total Environ. 2018, 619–620, 470–479. [Google Scholar] [CrossRef] [PubMed]
  214. Argento, M.; Henderson, F.; Lewis, R.; Mallyon, D.A.; Risk, D.; Nickerson, N. Soil surface flux measurements are a reliable means for assessing fugitive gas migration across soils and seasons. Elementa 2022, 10, 00010. [Google Scholar] [CrossRef]
  215. Parker, D.B.; Casey, K.D.; Todd, R.W.; Waldrip, H.M.; Marek, G.W.; Auvermann, B.W.; Marek, T.H.; Webb, K.; Willis, W.M.; Pemberton, B.; et al. Improved chamber systems for rapid, real-time nitrous oxide emissions from manure and soil. Trans. ASABE 2017, 60, 1235–1258. [Google Scholar] [CrossRef]
  216. Reichman, R.; Rolston, D.E. Design and Performance of a Dynamic Gas Flux Chamber. J. Environ. Qual. 2002, 31, 1774–1781. [Google Scholar] [CrossRef]
  217. Jiang, J.; Gu, K.; Xu, J.; Li, Y.; Le, Y.; Hu, J. Effect of Barometric Pressure Fluctuations on Gas Transport over Soil Surfaces. Land 2023, 12, 161. [Google Scholar] [CrossRef]
  218. DeSutter, T.M.; Sauer, T.J.; Parkin, T.B. Porous tubing for use in monitoring soil CO2 concentrations. Soil Biol. Biochem. 2006, 38, 2676–2681. [Google Scholar] [CrossRef]
  219. Maier, M.; Weber, T.K.D.; Fiedler, J.; Fuß, R.; Glatzel, S.; Huth, V.; Jordan, S.; Jurasinski, G.; Kutzbach, L.; Schäfer, K.; et al. Introduction of a guideline for measurements of greenhouse gas fluxes from soils using non-steady-state chambers. J. Plant Nutr. Soil Sci. 2022, 185, 447–461. [Google Scholar] [CrossRef]
  220. Zaman, M.; Saggar, S.; Blennerhassett, J.D.; Singh, J. Effect of urease and nitrification inhibitors on N transformation, gaseous emissions of ammonia and nitrous oxide, pasture yield and N uptake in grazed pasture system. Soil Biol. Biochem. 2009, 41, 1270–1280. [Google Scholar] [CrossRef]
  221. Martins, M.R.; Sant’Anna, S.A.C.; Zaman, M.; Santos, R.C.; Monteiro, R.C.; Alves, B.J.R.; Jantalia, C.P.; Boddey, R.M.; Urquiaga, S. Strategies for the use of urease and nitrification inhibitors with urea: Impact on N2O and NH3 emissions, fertilizer-15N recovery and maize yield in a tropical soil. Agric. Ecosyst. Environ. 2017, 247, 54–62. [Google Scholar] [CrossRef]
  222. Barthel, M.; Bauters, M.; Baumgartner, S.; Drake, T.W.; Bey, N.M.; Bush, G.; Boeckx, P.; Botefa, C.I.; Dériaz, N.; Ekamba, G.L.; et al. Low N2O and variable CH4 fluxes from tropical forest soils of the Congo Basin. Nat. Commun. 2022, 13, 330. [Google Scholar] [CrossRef] [PubMed]
  223. Kristanti, R.A.; Khanitchaidecha, W.; Taludar, G.; Karácsony, P.; Cao, L.T.T.; Chen, T.-W.; Darwish, N.M.; AlMunqedhi, B.M. A Review on Thermal Desorption Treatment for Soil Contamination. Trop. Aquat. Soil Pollut. 2022, 2, 45–58. [Google Scholar] [CrossRef]
  224. Zhao, C.; Dong, Y.; Feng, Y.; Li, Y.; Dong, Y. Thermal desorption for remediation of contaminated soil: A review. Chemosphere 2019, 221, 841–855. [Google Scholar] [CrossRef]
  225. Kaushik, P.; Eliáš, M.; Prášek, J.; Michalička, J.; Zajíčková, L. Manipulating MWCNT/TiO2 heterostructure morphology at nanoscale and its implications to NO2 sensing properties. Mater. Chem. Phys. 2021, 271, 124901. [Google Scholar] [CrossRef]
  226. Polyakov, M.; Ivanova, V.; Klyamer, D.; Köksoy, B.; Demirba, E. A Hybrid Nanomaterial Based on Single Walled Carbon Nanotubes Cross-Linked via Axially Substituted Silicon (IV) Phthalocyanine for Chemiresistive Sensors. Molecules 2020, 25, 2073. [Google Scholar] [CrossRef]
  227. Harsányi, E.; Mirzaei, M.; Arshad, S.; Alsilibe, F.; Vad, A.; Nagy, A.; Ratonyi, T.; Gorji, M.; Al-Dalahme, M.; Mohammed, S. Assessment of Advanced Machine and Deep Learning Approaches for Predicting CO2 Emissions from Agricultural Lands: Insights Across Diverse Agroclimatic Zones. In Earth Systems and Environment; Springer: Berlin/Heidelberg, Germany, 2024. [Google Scholar] [CrossRef]
Figure 1. Main methods for detection of gases emitted from soils.
Agronomy 14 02374 g001
Figure 2. Scheme of infrared absorption spectroscopy [48]. Reproduced with the permission of MDPI.
Agronomy 14 02374 g002
Figure 3. Infrared absorption spectra of analyte in gas phase [49]. Reproduced with the permission of MDPI.
Agronomy 14 02374 g003
Figure 4. Scheme of gas cell based on NDIR spectroscopy [65]. Reproduced with the permission of MDPI.
Agronomy 14 02374 g004
Figure 5. Design of cuvette for Raman spectroscopy (a) and optical scheme of device (b) [55]. Reproduced with the permission of MDPI.
Agronomy 14 02374 g005
Figure 6. Raman spectrum of natural gas [77]. Reproduced with the permission of MDPI.
Agronomy 14 02374 g006
Figure 7. A schematic of cavity ring-down technique [95]. Reproduced with the permission of Elsevier.
Agronomy 14 02374 g007
Figure 8. Design of measuring device of CRD spectroscopy (path length of 226 m) [98]. Reproduced with the permission of MDPI.
Agronomy 14 02374 g008
Figure 9. Design (a) and scheme (b) of modified setup for OA-ICOS with the application of radiofrequency white noise [125]. Reproduced with the permission of Optica.
Agronomy 14 02374 g009
Figure 10. Scheme of two-channel OA-ICOS spectrometer (a) and spectrum of compounds detected (b) [126]. Reproduced with the permission of MDPI.
Agronomy 14 02374 g010
Figure 11. (a) H2 sensor based on TDLAS on a demo pipe. Transmitter and receiver units are placed at the opposite ends of the pipe. (b) The principles of sensor operation, where a sinusoidally modulated current is applied to the laser, sweeping in frequency. The transmitted intensity is detected using a photodetector. The digital signal processing is applied to retrieve the concentration. Reproduced from [130]. Reproduced with the permission of MDPI.
Agronomy 14 02374 g011
Figure 12. Oscillations of concentrations of gases (5 cm depth) [152]. Reproduced with the permission of Elsevier.
Agronomy 14 02374 g012
Figure 13. Design of chamber for testing of ANFO detection by polypyrrole-based chemiresistive gas sensor (a) and sensor resistance vs. concentration of ammonia (b) [182]. Reproduced with the permission of Elsevier.
Agronomy 14 02374 g013
Figure 14. Design of dynamic flux chamber [214]. Reproduced with the permission of University of California Press Journals.
Agronomy 14 02374 g014
Figure 15. Diagram of gas flows between soil, plant vegetative system, and atmosphere. The net gas flux is expressed as a sum of the fluxes between the soil–vegetation system and the atmosphere Φgas,s-v-a(t) and the gas flux between inside and outside of the chamber Φgas,leak(t). Reproduced with the permission of Wiley.
Agronomy 14 02374 g015
Figure 16. (a) Types of collars used for dry soil. (b) Conventional collar. (c) Representation of deep and shallow collar [212]. Reproduced with the permission of EGU.
Agronomy 14 02374 g016
Table 1. SNR of Raman and FTIR spectroscopy for various substances [79] (reproduced with the permission of Elsevier).
Raman spectroscopyN2
250–400
O2
25–45
H2Ovapor 8–23-CO2
(1285 cm−1)
4–14
CO2
(1388 cm−1)
3–9
-
FTIR spectroscopy--H2Ovapor 500–710H2Oliquid 500–710CO2
(3609 cm−1)
135–300
CO2
(4983 cm−1)
7–20
H2Oliquid
500–710
Table 2. Comparison of various characteristics of conventional soil gas analysers.
Analyzer (Company)Type of MeasurementGases and Their ConcentrationsWeight, gPressure of Pump, kPaCountry
Picarro G2508CRD spectroscopyN2O: 0.3–200 ppm,
CH4: 1.5 –12 ppm,
CO2: 380–5000 ppm,
NH3: 0–300 ppb,
H2O: 0–3%
22,60040–133USA
Gasmet
GT5000
FTIR spectroscopyN2O: oт 7 ppb, CH4: oт 40 ppb, CO2: oт 5 ppm, H2O: oт 0.01%, CO: oт 70 ppb, NH3: oт 70 ppb940060–110Finland
Li-Cor
LI78xx
n/aN2O: 0.4–100 ppm,
H2O: 0–60,000 ppm,
CO2: 50–2000 ppm,
NH3: 0–30,000 ppb
10,50070–110USA
ABB
GLA131/132/151
OA-ICOSN2O: 0.5–40 ppm,
CH4: 0.9–100 ppm,
CO2: 0.35–20,000 ppm,
H2O: 0–30,000 ppm
640070–110Sweden-Switzeland
Hansatech Instuments
CFLUX-1
IR spectroscopyCO2: 1–30,000 ppm,
H2O: 0.1–75%
850080–115UK
Echo Instruments
ECHO
Infrared, paramagnetic and electrochemical gas sensorsCO2: 0.35–5000 ppm,
CH4: 0–10,000 ppm,
O2: 0–25%,
H2: 0–1000 ppm
7500200–340Slovenia
Disclaimer/Publisher’s Note: The statements, opinions and data contained in all publications are solely those of the individual author(s) and contributor(s) and not of MDPI and/or the editor(s). MDPI and/or the editor(s) disclaim responsibility for any injury to people or property resulting from any ideas, methods, instructions or products referred to in the content.

