Article

Effects of Rainfall Variability and Land Cover Type on Soil Organic Carbon Loss in a Hilly Red Soil Region of Southern China

1
Jiangxi Key Laboratory of Watershed Soil and Water Conservation, Jiangxi Provincial Academy of Water Resources Sciences, Jiangxi Provincial Eco-Hydraulic Technology Innovation Center of Poyang Lake Basin, Nanchang 330029, China
2
College of Land Resource and Environment, Jiangxi Agricultural University, Nanchang 330045, China
*
Author to whom correspondence should be addressed.
Agronomy 2024, 14(11), 2563; https://doi.org/10.3390/agronomy14112563
Submission received: 13 September 2024 / Revised: 14 October 2024 / Accepted: 23 October 2024 / Published: 31 October 2024
(This article belongs to the Section Water Use and Irrigation)

Abstract

:
Rainfall intensity (RI) and land cover type are two important factors that affect soil erosion and thus the transfer and loss of soil organic carbon (SOC). However, the in situ quantitative monitoring of SOC loss under natural rainfall and various land cover types restored on eroded lands has not been thoroughly examined. In order to further study the effects of rainfall changes and vegetation types on SOC loss in the red soil region of Southern China, the Jiangxi Eco-Science Park of Soil and Water Conservation in De’an County, Jiangxi Province, was taken as the research object. Considering natural rainfall and based on the long-term field in situ monitoring of rainfall and runoff and sediment data, we studied the effects of three land cover types (bare land, orchards, and grass cover) on surface runoff, sediment production, and SOC loss in relation to 1 hour of RI during natural rainfall in the red soil region of Southern China during rainy seasons of 2020 and 2021 (March to August). Compared with bare land plots, the orchard and grass cover plots had surface runoff reductions of 67% and 98%, respectively, and sediment reductions of 79% and 99% over the two rainy seasons, respectively. With an increasing RI over 1 hour, total SOC loss increased for each of the three land cover types. More SOC loss was associated with sediments, and the enrichment ratio of SOC in the sediments (ERoc) decreased significantly. The ERoc values decreased in the following order: bare land (1.23) > orchard (1.08) > grass cover (0.81). Bare land exhibited the highest proportion of SOC associated with sediment in the total SOC loss (Ps), at 68.69%, followed by the orchard plots, at 55.02%, and then the grass cover plots at 49.24%. With the transfer of land cover type from bare land to orchard and to grass cover (decreased soil loss intensity, SLI), more SOC was lost associated with runoff in the form of dissolved organic carbon (DOC); the values of ERoc and organic carbon loss intensity (CLI) also decreased significantly. These findings are crucial to improving our understanding of the regulatory mechanisms of rainfall changes and land cover types on SOC loss during soil erosion.

1. Introduction

The soil organic carbon (SOC) pool is influenced by water erosion on both slope and watershed scales [1,2,3]. Water erosion is a major contributor to carbon (C) redistribution over terrestrial landscapes and carbon exportation into aquatic systems [1,4]. Due to the vital function of SOC in sustainable social and environmental development [4,5], the transfer and loss of SOC through soil erosion has attracted global attention [6,7,8]. Furthermore, previous studies have stated that soil erosion is closely related to rainfall characteristics (especially rainfall intensity and rainfall duration) [9,10,11,12] and land cover types/vegetation conditions [9,11,12,13,14]. Rainfall erosion is the driving force that leads to soil erosion. Raindrops hit the surface, destroy soil aggregates, and lead to soil organic carbon loss. Different types of rainfall have different types of erosion destructive power. The land cover type affects the soil erosion process through plant species, vegetation coverage, and management methods. It is of great significance for the sustainable management of regional land to study the effect of the land cover type on soil erosion in the red soil region of Southern China under erosive rainfall conditions.
The enrichment ratio as defined by Massey and Jackson [15] is an important term in most chemical transport models currently used for the prediction of SOC delivery to streams by sediment through overland flow. During the erosion process, the sediment is enriched in organic carbon (OC) compared to the original soil due to the selective transportation of different-sized sediments [16,17], primarily associated with the transport of finer soil particles [1,13]. In general, the enrichment ratio of organic carbon (ERoc) in suspended sediment is found to be >1 [18,19]. However, the ERoc ranged from 0.61 to 2.13 in a hilly red soil region of Southern China [10], and varied between 0.8 and 1.2 on the Loess Plateau in China [14], indicating that SOC is not always transported preferentially during water erosion.
The ERoc is associated with rainfall events, especially those with low rainfall depth and low rainfall intensity. These types of events selectively remove SOC-rich sediments and serve as an important mechanism for nutrient transport, which has been confirmed by numerous simulated rainfall studies [12,13]. However, the effects of variable rainfall intensity on the ERoc under field conditions and natural rainfall remain largely unknown [20], especially in the red soil region of Southern China. More data are required for improving our understanding of the underlying mechanisms and processes affecting erosion-induced SOC loss, SOC accumulation in surface soil layers, and SOC pool management.
The formerly densely forested hilly red soil region of Southern China, which covers 2.2 × 10⁶ km2, is now known as the “red desert of Southern China” [21]. The red soil area was 56.9 × 10⁴ km2, accounting for 26.1% of the regional land area, and the area of the red soil slope, at a degree of 6–15, was 3.37 × 10⁴ km2 [21]. Grassland is a very common land cover type in this region due to the abundant water and heat resources. In recent decades, with the rapid growth of the human population (40% of China’s population) and heavy pressure on productive soil resources, increasing amounts of barren land with secondary communities on the slopes have been transformed into orchards [22,23]. Different land cover types coexist in one small watershed in this region of Southern China [24]. In particular, for those red soil slopes at 6–15 degrees, grass planting and orchard development are two important ways by which to control soil erosion (for those red soil slopes at a degree > 15, terrace and orchard development is the main soil erosion control method). In this region, Liu et al. [25] and Duan et al. [26] studied soil erosion characteristics in the grass cover plots and orchard plots, respectively. Ma et al. [27] and Nie et al. [10] also researched SOC loss characteristics under simulated rainfall, though only for bare land. However, very few studies have explicitly evaluated the effects of land cover type transfer in severely eroded areas on SOC loss intensity, SOC transportation selectivity, and the ERoc [11], especially in the red soil region of Southern China [9]. Further research is required to assess sustainable management strategies for soil erosion control and SOC protection. Considering that in situ field monitoring has many observation fields, involving different rainfall patterns and a large field area, research results based on considerations of natural rainfall can better explain the authenticity of soil organic carbon erosion loss [28,29,30].
Therefore, the overall objectives of this study are to better understand runoff, sediment yield, and sediment-fixed organic carbon loss during natural rainfall events and for different land cover types; to clarify the response characteristics of organic carbon migration loss to rainfall characteristics, soil erosion, and land cover types; to deepen the scientific understanding of the relationship between soil erosion and the carbon cycle; and to provide a scientific basis for the regulation of organic carbon loss, enhancing the soil carbon sequestration capacity, and maintaining soil fertility in red soil areas. The specific objectives are to (1) quantify runoff and sediment yield from bare land, citrus orchards, and grass cover and determine the magnitude of organic C (OC) associated with runoff and OC associated with sediment, and (2) investigate the effects of RI on runoff and sediment, and particularly the selective removal of OC associated with runoff or sediment for the three land cover types.

2. Materials and Methods

2.1. Study Area

The study was conducted in the Jiangxi Eco-Science Park of Soil and Water Conservation (115°42′ E–15°43′ E, 29°16′ N–29°17′ N), about 5 km southeast of De’an county in Jiangxi province (Figure 1). The study area altitude ranges from 30 m to 90 m and the slope is 5°–12°. The area belongs to the subtropical humid monsoon climate zone with an average annual temperature of 16.7 °C and average annual precipitation of 1608.2 mm (70.2% of which is received during March to August) for the 10 years from 2010 to 2019 (from the original observation data of the weather station in the study area, Table 1). The region has approximately 245 to 260 frost-free days.
The red soil in this region was primarily produced from the weathering of quaternary sediments, and is classified as chestnut soil in the Chinese classification or Calcic-orthic Aridisol in Soil Taxonomy classification. The soil depth in the study area was over 100 cm, and the profile type was Ah-Bs-Cs according to Soil Taxonomy [31]. The surface layer (Ah) depth was 25–30 cm, and the Bs layer appeared at a soil depth of 30–60 cm. High erosion potential is characteristic of the Ah layer because of its loose structure and the region’s high precipitation. In many places, the entire Ah layer has been lost due to soil erosion [25].
To test how vegetation restoration affects soil erosion, besides retaining some bare slopes, we developed several main land cover types in the park, including artificial grassland, shrub, citrus orchard, Pinus elliottii plantation, and Cunninghamia lanceolata plantation.

2.2. Sampling Design

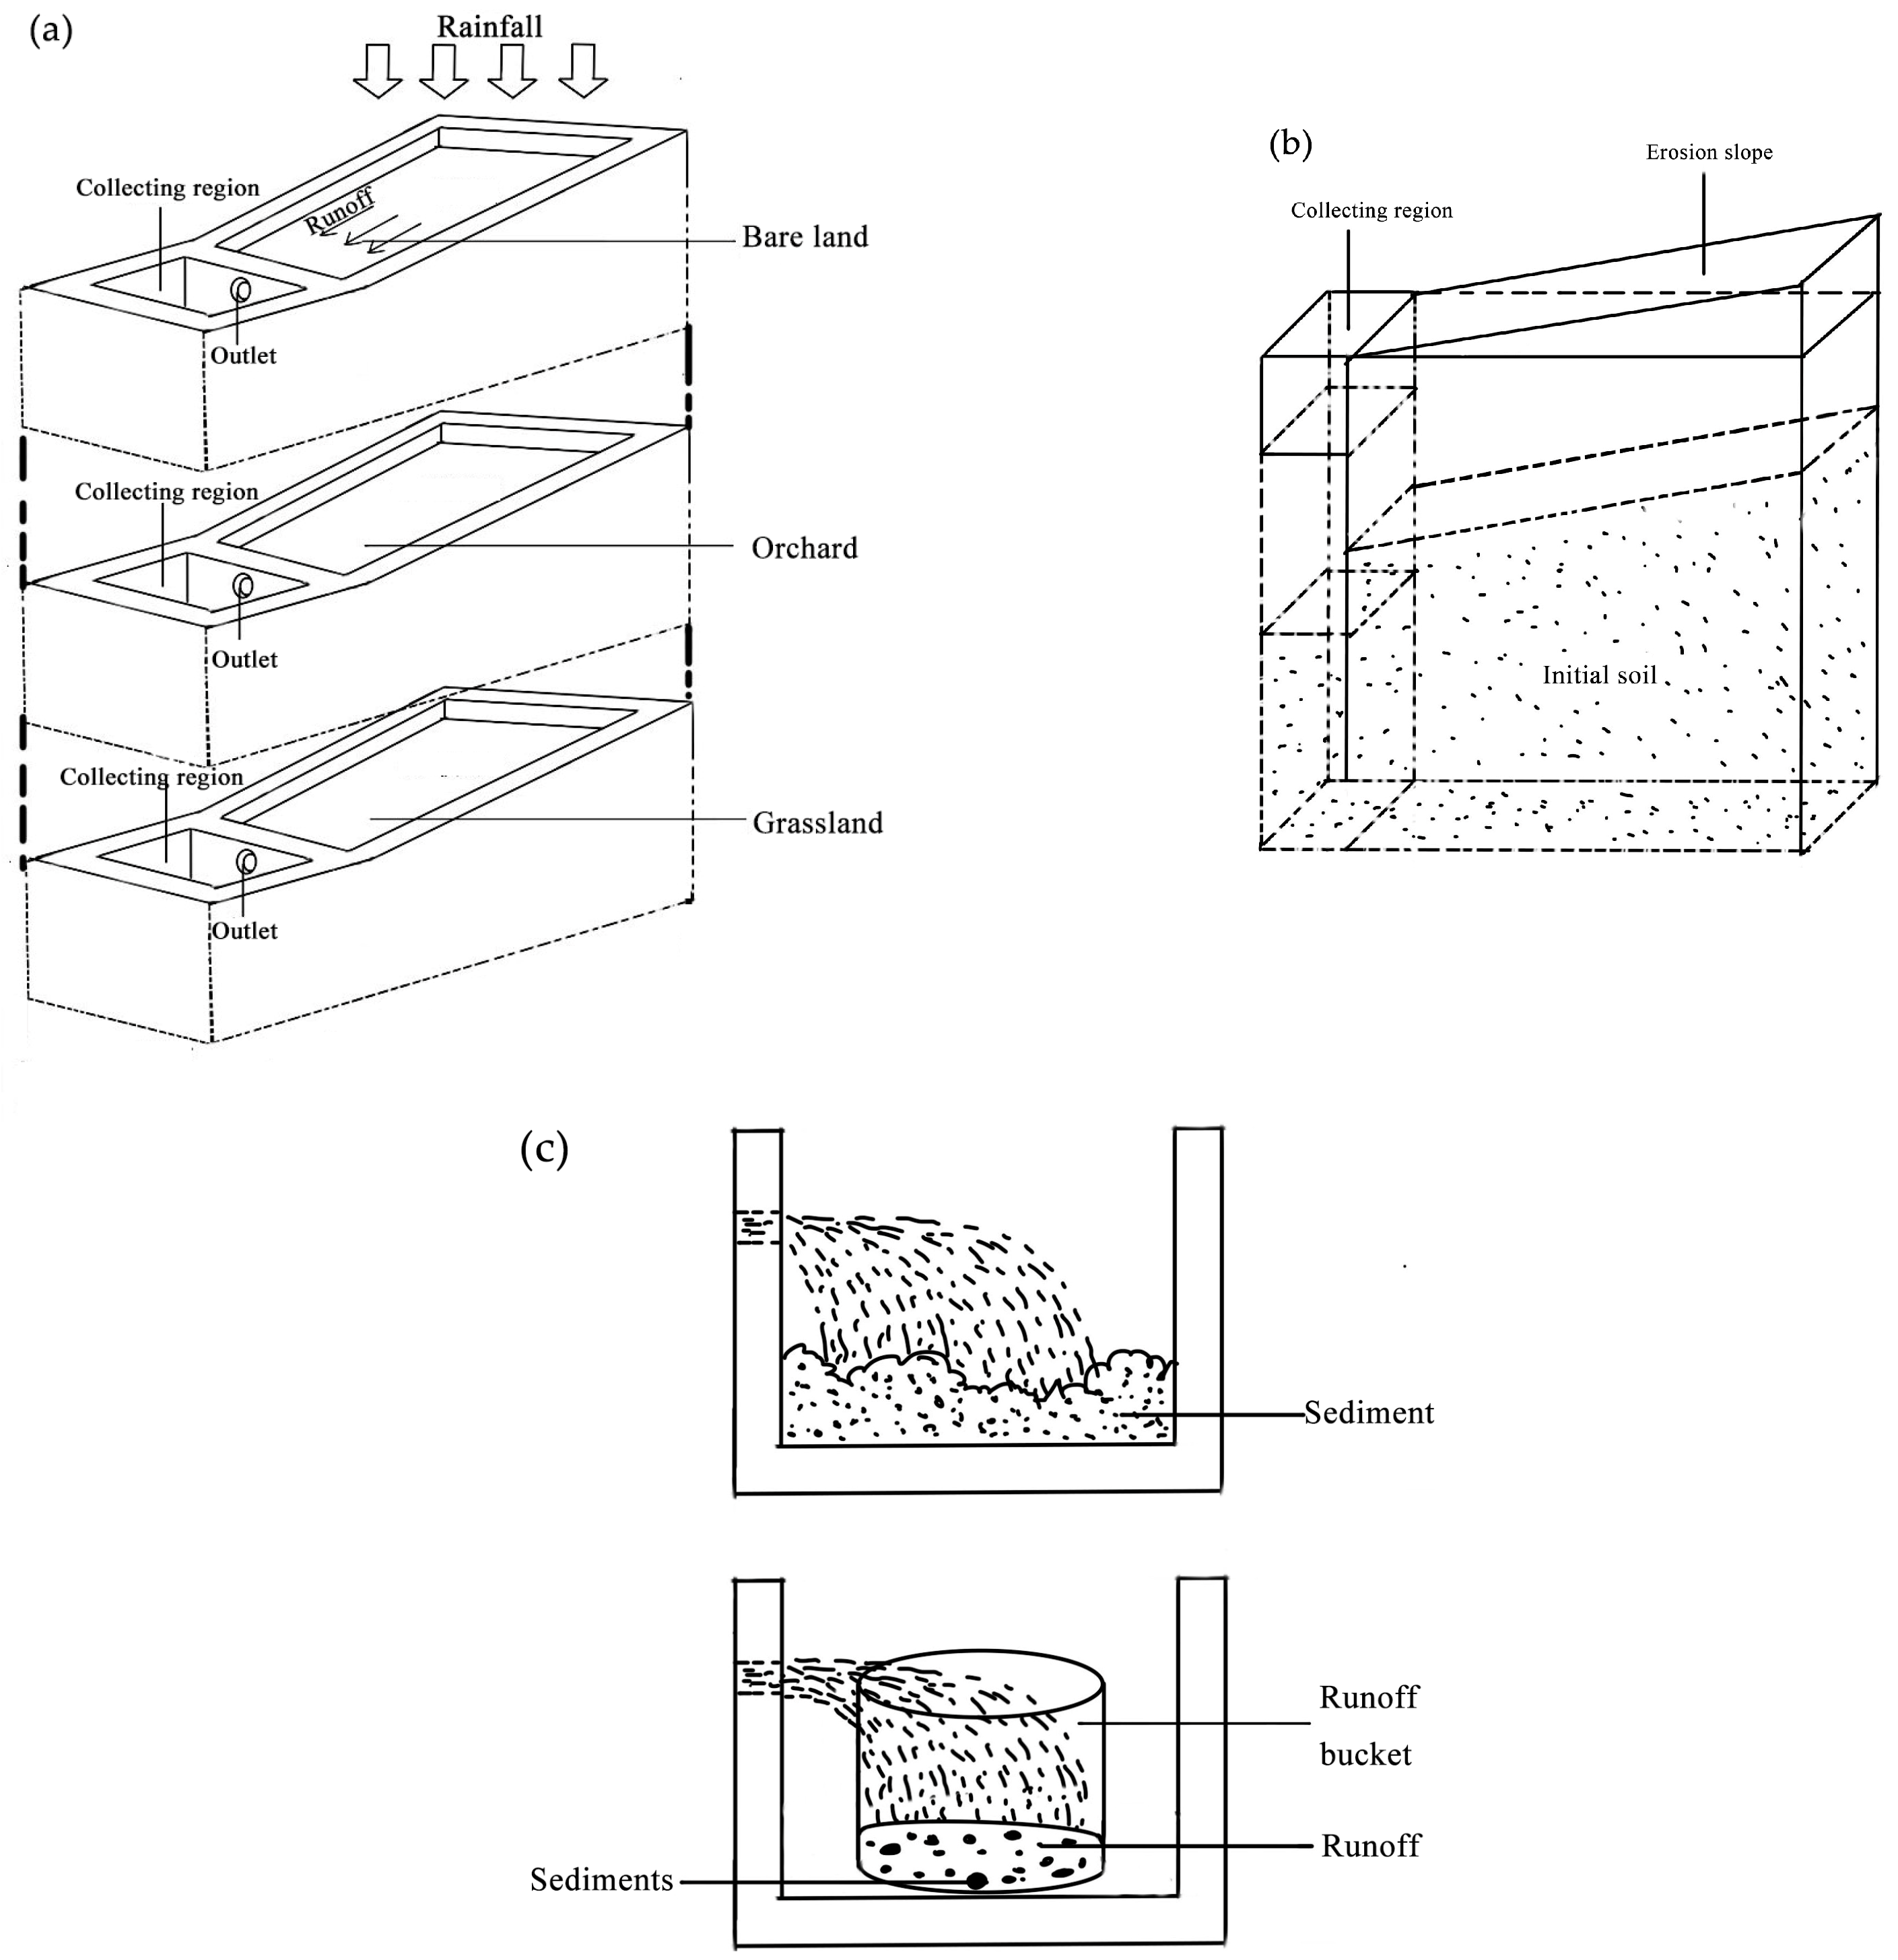
Nine in situ runoff plots were installed, all with the same slopes (12° gradient) and soil background. The nine plots consisted of three replicates for each of the three land cover types. The first land cover type was bare land, where the entire Ah layer had been lost due to soil erosion. The surface of the bare land plot was not loosened and had no vegetation on it. The second land cover type was citrus orchard, which was planted in 2000 with an initial density of 1335 trees ha−1. Each runoff plot had 12 citrus plants (Citrus reticulata) with an average diameter at breast height (DBH) of 7.6 cm, average tree height of 2.8 m, average crown diameter of 1.2 m, and few undergrowth plants. The third land cover type was grassland plots, which were dominated by Paspalum notatum, a perennial warm season grass species with good soil erosion control effect, with average height of 40 cm and >95% canopy cover. The grass was seed in 2000 with a seed density of 20 g m−2 to produce a full surface cover (Figure 2).
In order to monitor the transfer and loss of SOC under an ideal situation after ecological restoration of severely eroded land in the southern red soil region, we set up two in situ runoff plots adjacent to our current study plots, where the past ecological restoration project had successfully established a 30-year-old Pinus elliottii plantation on severely eroded soil. The two plantation plots had the same slope as our study plots, and their average DBH and tree height were 20.4 cm and 15.7 m, respectively, with 85% coverage of understory vegetation. The contents of SOC and dissolved organic carbon (DOC) in the 0–20 cm soil layer were 15.52 ± 0.66 g kg−1 and 745.34 ± 124.36 mg kg−1, respectively.
The grass cover plots were 15 m long and 5 m wide, and the plots of the other three types were 20 m long and 5 m wide. Cement walls 50 cm deep were constructed around the plots to isolate hydrological disturbances from adjacent plots. A flume was built at the lower edge of each plot to carry runoff and sediment, and a PVC pipe (diameter of 10 cm) directed water from the flume into the runoff containers. Every container volume for the surface flow was 3 m3 by the five-hole shunt method. Several soil characteristics were evaluated in January 2020 before initiation of the experiment (Table 2).

2.3. In Situ Observations

The rainfall, surface runoff and soil loss from each plot were collected and measured after each rainfall event from March to August in 2020 and 2021. The rainfall depth and duration of every rainfall event in the study area were measured and recorded by an RGS-100 siphoning rain gauge connected to an automatic weather station located only 50 m from the runoff plots. The RI values in one hour were calculated by rainfall depth and duration. An auto-recording water level gauge was installed in each runoff storage container to record the runoff depth (use an enamel measuring stick to correct). After each rainfall event, the runoff was thoroughly mixed and samples of approximately 1 L were taken in polypropylene bottles, treated with three drops of concentrated HCl, and then transferred to a cooler maintained at 4 °C (Figure 2).
Dissolved organic carbon (DOC) extraction began within 48 h of field collection. The suspensions were shaken for 30 min and centrifuged at 5000 rpm for 10 min, and then the supernatants were vacuum filtered through 0.45 um polycarbonate filter membrane. DOC was quantified with a total organic carbon analyzer (Vario TOC Cube, Elementar, Frankfurt, Germany) [28].
During the observation period from March to August in 2020 and 2021, five soil samples in every runoff plot were collected once a month for determination of the content of OC in the 0–20 cm surface soil layer (CCss, g kg−1). After every erosive rainfall event, three sediment samples in the runoff container of every plot were collected, oven-dried at 105 °C for 24 h, and the sediment C concentration was determined (CCs g kg−1). After sieving through the 2 mm mesh, both soil samples and sediment samples were analyzed for OC content using the K2Cr2O7 oxidation method.
In our study, an erosive rainfall event was not considered independent unless the interval time since the previous rainfall event was over 6 h and the average rainfall intensity was greater than 1.2 mm h−1 [29].

2.4. Data Analysis

The runoff coefficient (RC) was calculated as:
R C = R D / P
where RD was the runoff depth (mm) and P was the rainfall depth (mm).
The soil loss intensity for an individual rainfall event (SLI, t km−2) was calculated as:
S L I = S Y / A
where SY was the sediment yield (kg), and A was the area of the runoff plot (m2).
The C loss intensity (CLI, mg m−2) was defined in this study (especially for SOC) as:
C L I = C L t / A
C L t = S Y × C C s + V r × C C r
where CLt was the total C loss for an individual rainfall event (mg), CCs was the sediment C concentration (g kg−1), V r was the runoff volume for an individual rainfall event (L), and CCr was the runoff C concentration (mg L−1).
The proportion of OC associated to sediment in total SOC loss (Ps) was:
P s = S Y × C C s / C L t
This value of CCss was treated as the background value of OC content for that month. The enrichment ratio of OC in sediment (ERoc) was calculated as:
E R o c = C C s / C C s s
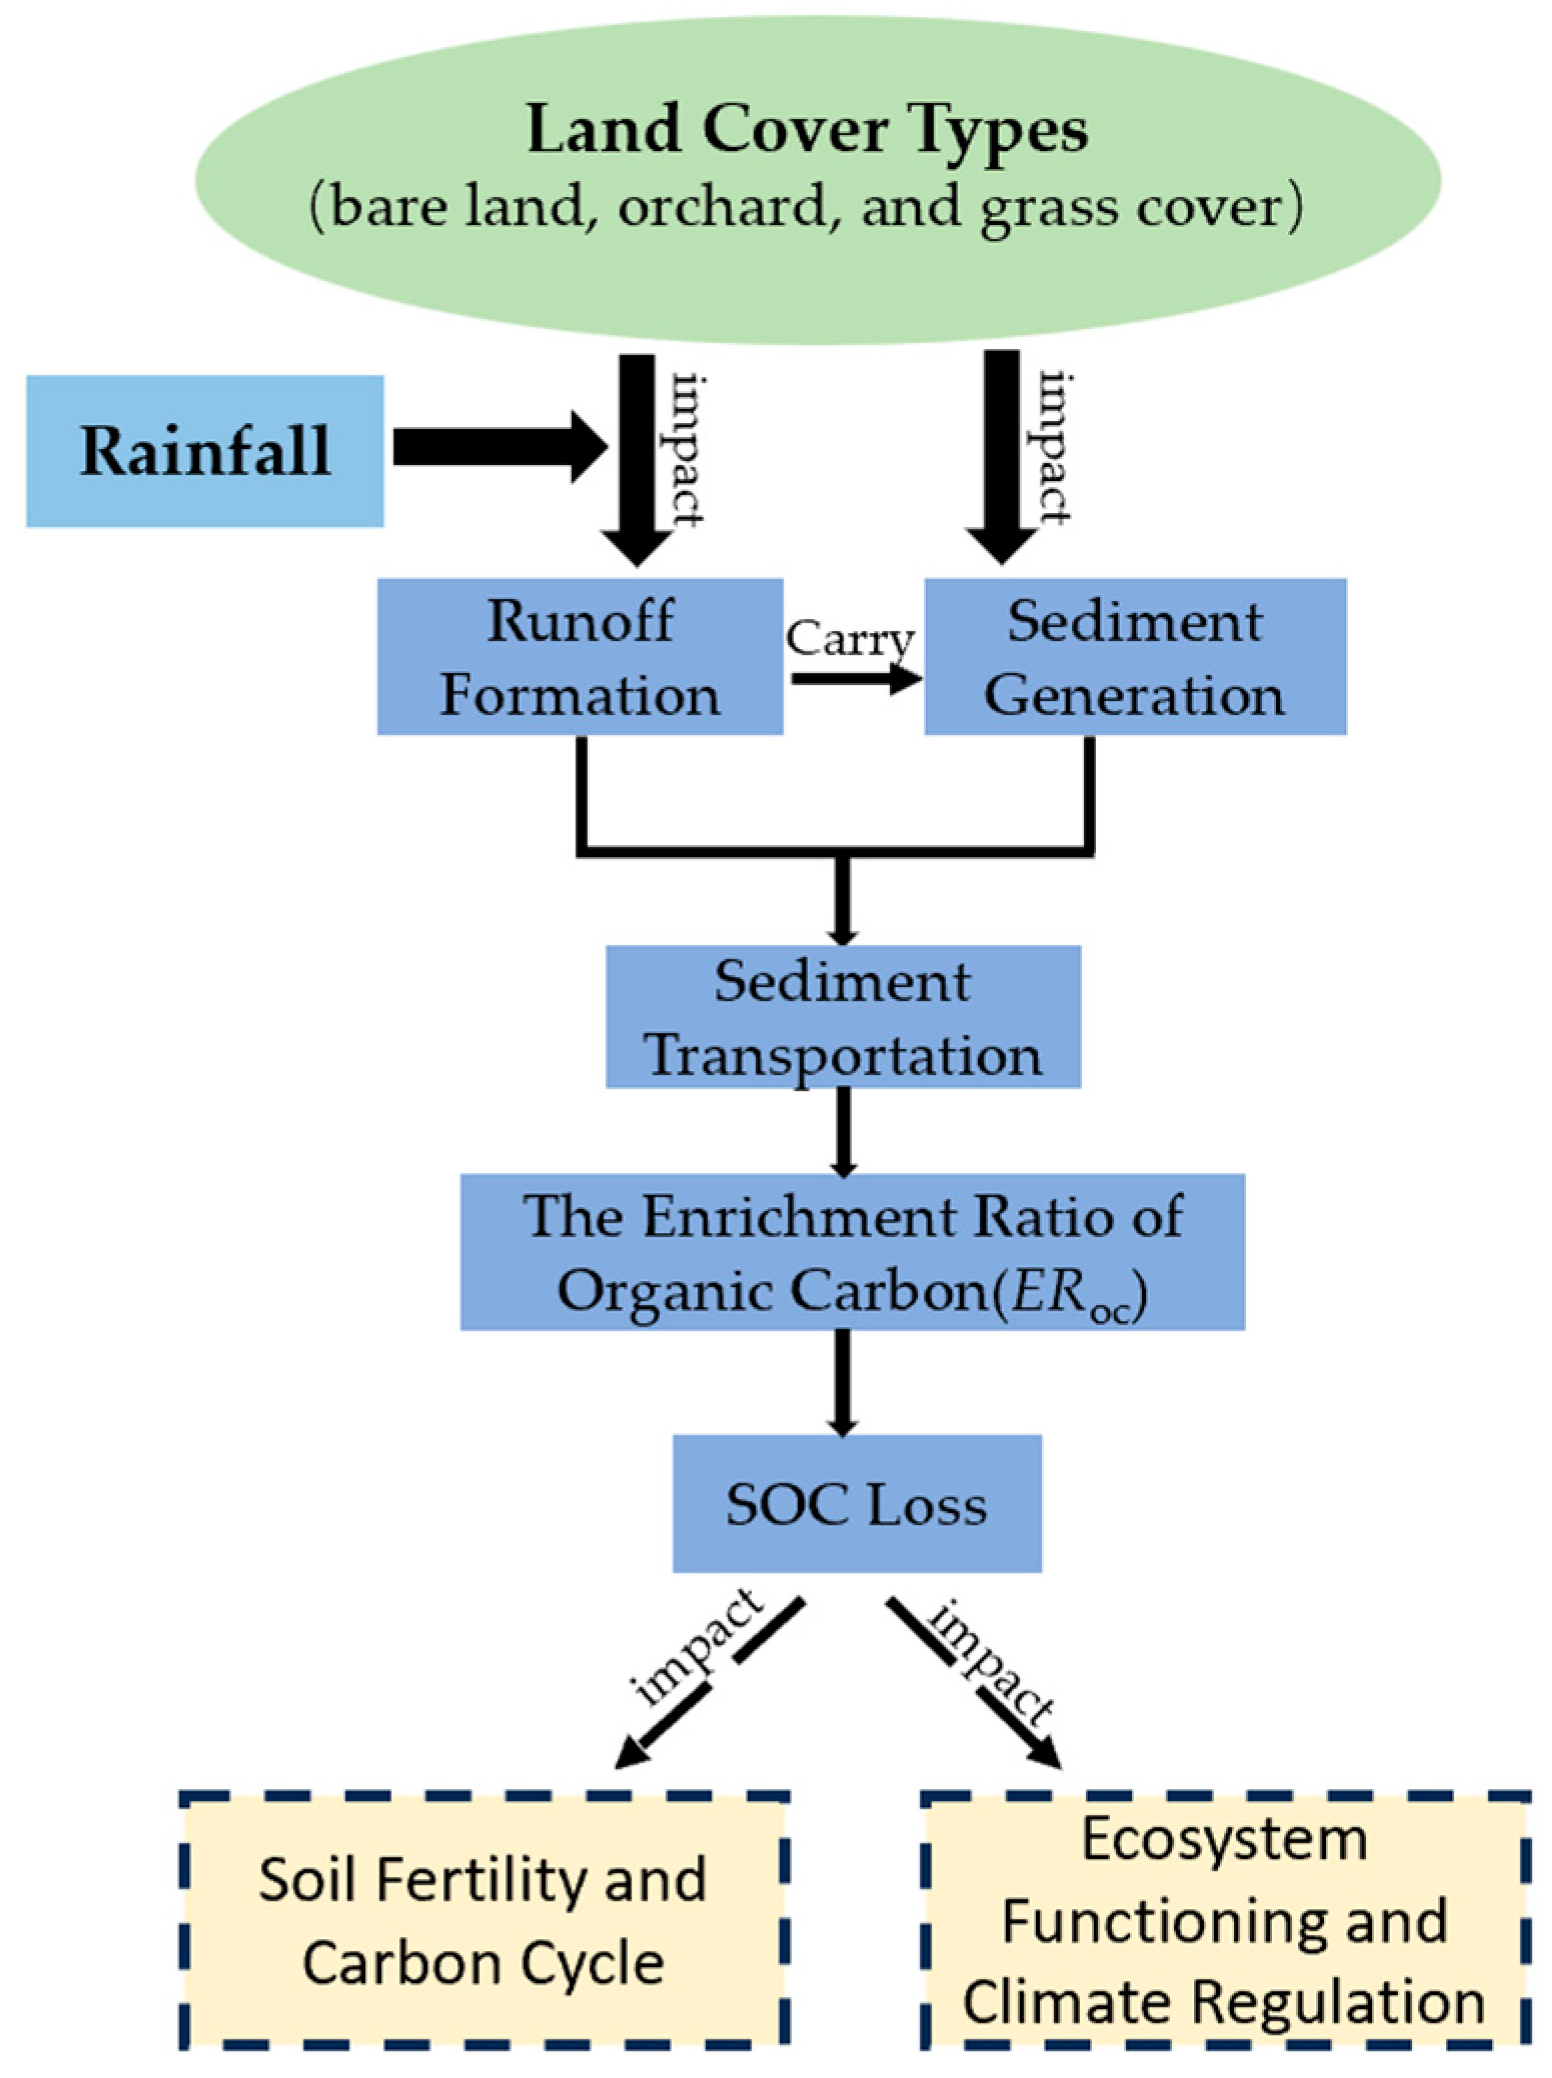
Correlations were analyzed using a Pearson test between runoff depth, sediment yields, and rainfall depth; between sediment yields and runoff depth; between CCr and one-hour RI; between CCs and one-hour RI; and between ERoc and one-hour RI for the three types of runoff plots. One-way analysis of variance (ANOVA) with Tukey’s HSD test was used to test the differences in CLI among land cover types (Figure 3). Statistically significant differences were tested at p-values < 0.05 unless otherwise stated. All the statistical analyses were conducted using the SPSS 13.0 software package (SPSS, Chicago, IL, USA) and graphs were prepared with Origin 8.5 (Origin Lab Corporation, Northampton, MA, USA).

3. Results

3.1. Rainfall Pattern

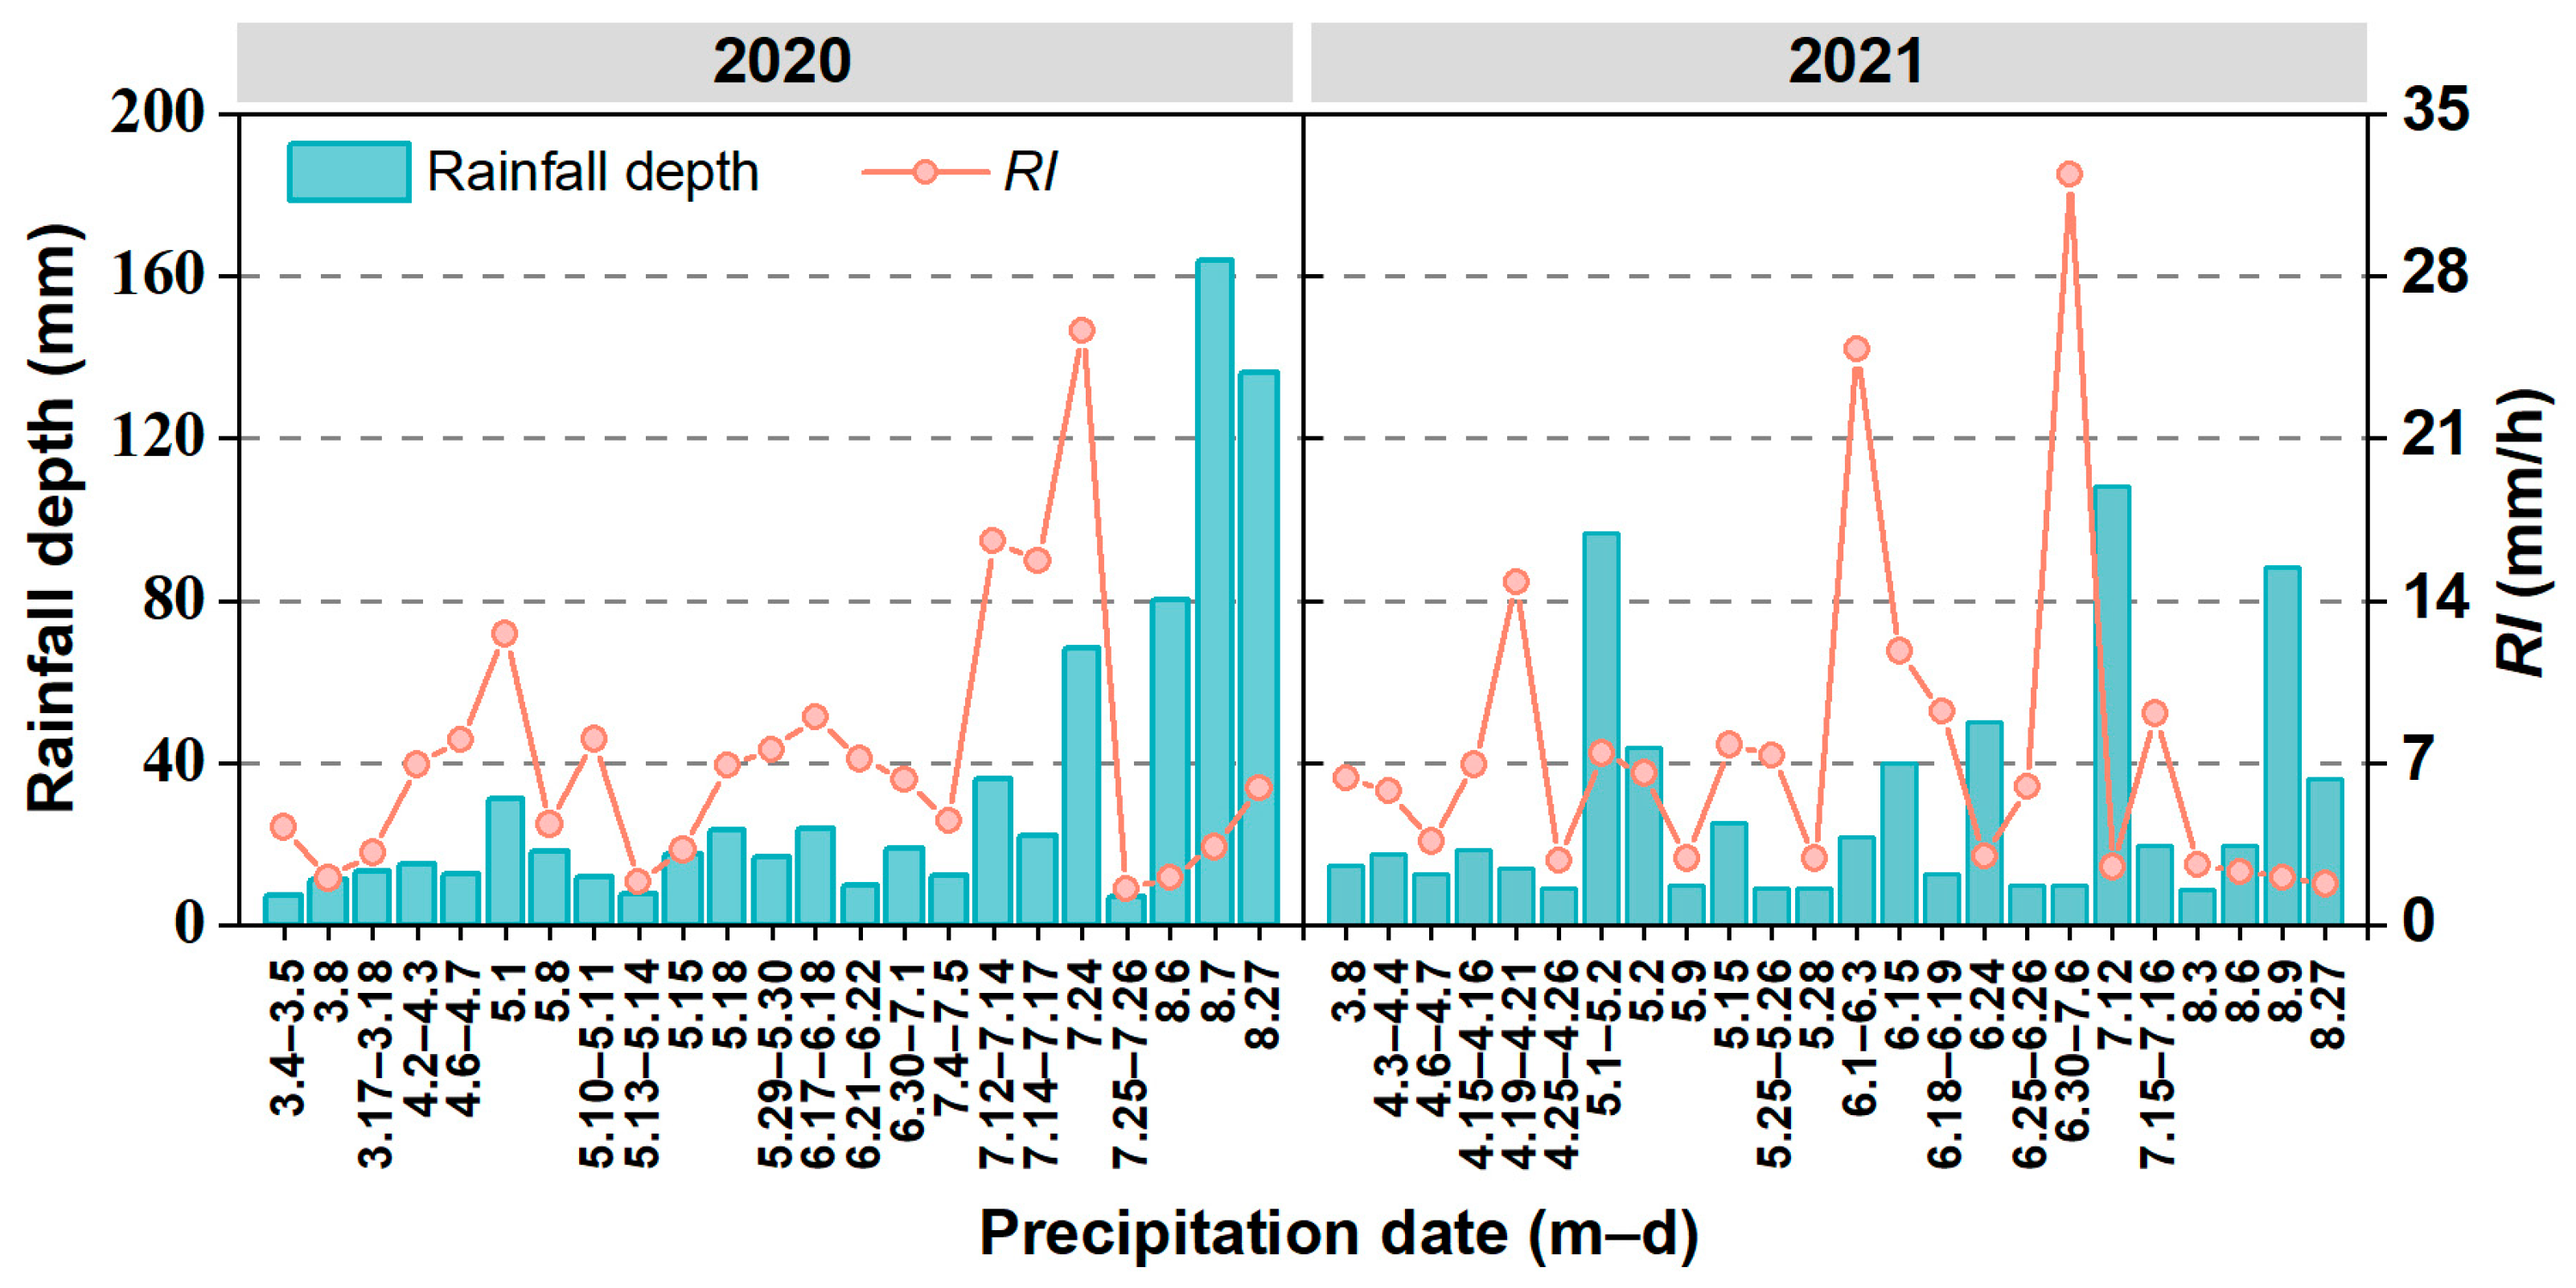
During the observation period from March to August in 2020 and 2021, 23 and 24 erosive rainfall events occurred, respectively. The one-hour RI values ranged from 1.2 to 28.6 mm h−1 in the two years, with a coefficient of variation (CV) of 112.8% (Figure 4).
Generally, the variations of one-hour RI were small before July, but varied greatly from July to August in both years. Most of the rainfall events were characterized by long duration and low intensity. Only a few rainfall events had short duration and high intensity, such as the rain that occurred on 7 August 2020, with a one-hour RI of 28.65 mm h−1, but it continued for only 40 min.

3.2. Runoff and Sediment Loss

The average values of RC and SLI of the three land cover types during the two years are shown in Figure 5. Averaging the two years of 2020 and 2021, the RC value on bare land (0.22) was significantly higher than that for orchard (0.067) and grass cover (0.0045) (p < 0.001). In addition, significant differences for RC values were observed between grass cover and orchard (p < 0.05). Averaging over the two years, orchard and grass cover reduced runoff by 67.03% and 97.85%, respectively, when compared with bare land plots.
In the two years, the average value of SLI on bare land plots was 60.27 t km−2, which was significantly higher than that on orchard plots (9.75 t km−2) and grass cover plots (0.12 t km−2). However, no significant difference was observed between grass cover plots and orchard plots in both years (p > 0.05). Averaged over two years, orchard and grass cover plots resulted in sediment reductions of 78.88% and 99.22%, respectively, compared with bare land plots.
RC and SLI were significantly positively correlated with rainfall depth for orchard and bare land cover types (except for between RC and rainfall depth on bare land in 2021) (Table 2). For grass cover plots, SLI was significantly positively correlated with rainfall depth, but not with RC (Table 3). In contrast, correlations between RI and either runoff depth or sediment yields were mostly not significant except for orchard plots, where RI was found to be significantly correlated with RC and SLI in 2020 (Table 3).

3.3. Organic C Export in Runoff and Sediments

In the two years, the average values of CCr for bare land plots (47 rainfall events), orchard plots (47 rainfall events) and grass cover plots (34 rainfall events) were 4.75 mg L−1, 5.74 mg L−1 and 7.26 mg L−1. The average CCs values for bare land plots (47 rainfall events), orchard plots (41 rainfall events) and grass cover plots (17 rainfall events) were 7.47 g kg−1, 7.83 g kg−1 and 8.55 g kg−1. So there were the same change orders both for CCr and CCs values among the three land cover types. For CCr, significant differences among the three land cover types were detected (p < 0.05). For CCs, there were significant differences between bare land plots and grass cover plots, between orchard plots and grass cover plots (p < 0.05). The one-hour RI value had a marked effect on both CCr and CCs (Table 4). There were significant negative correlations between CCr and one-hour RI for the three land cover types (except for bare land in 2020), but there was a significant negative correlation between CCr and one-hour RI only for bare land. Overall, the larger the runoff depth, the lower the CCr value, but the negative correlations were only found to be significant in 2020 for bare land and grass cover plots (Table 4). There was no consistent relationship between CCs and sediment yield (Table 4).
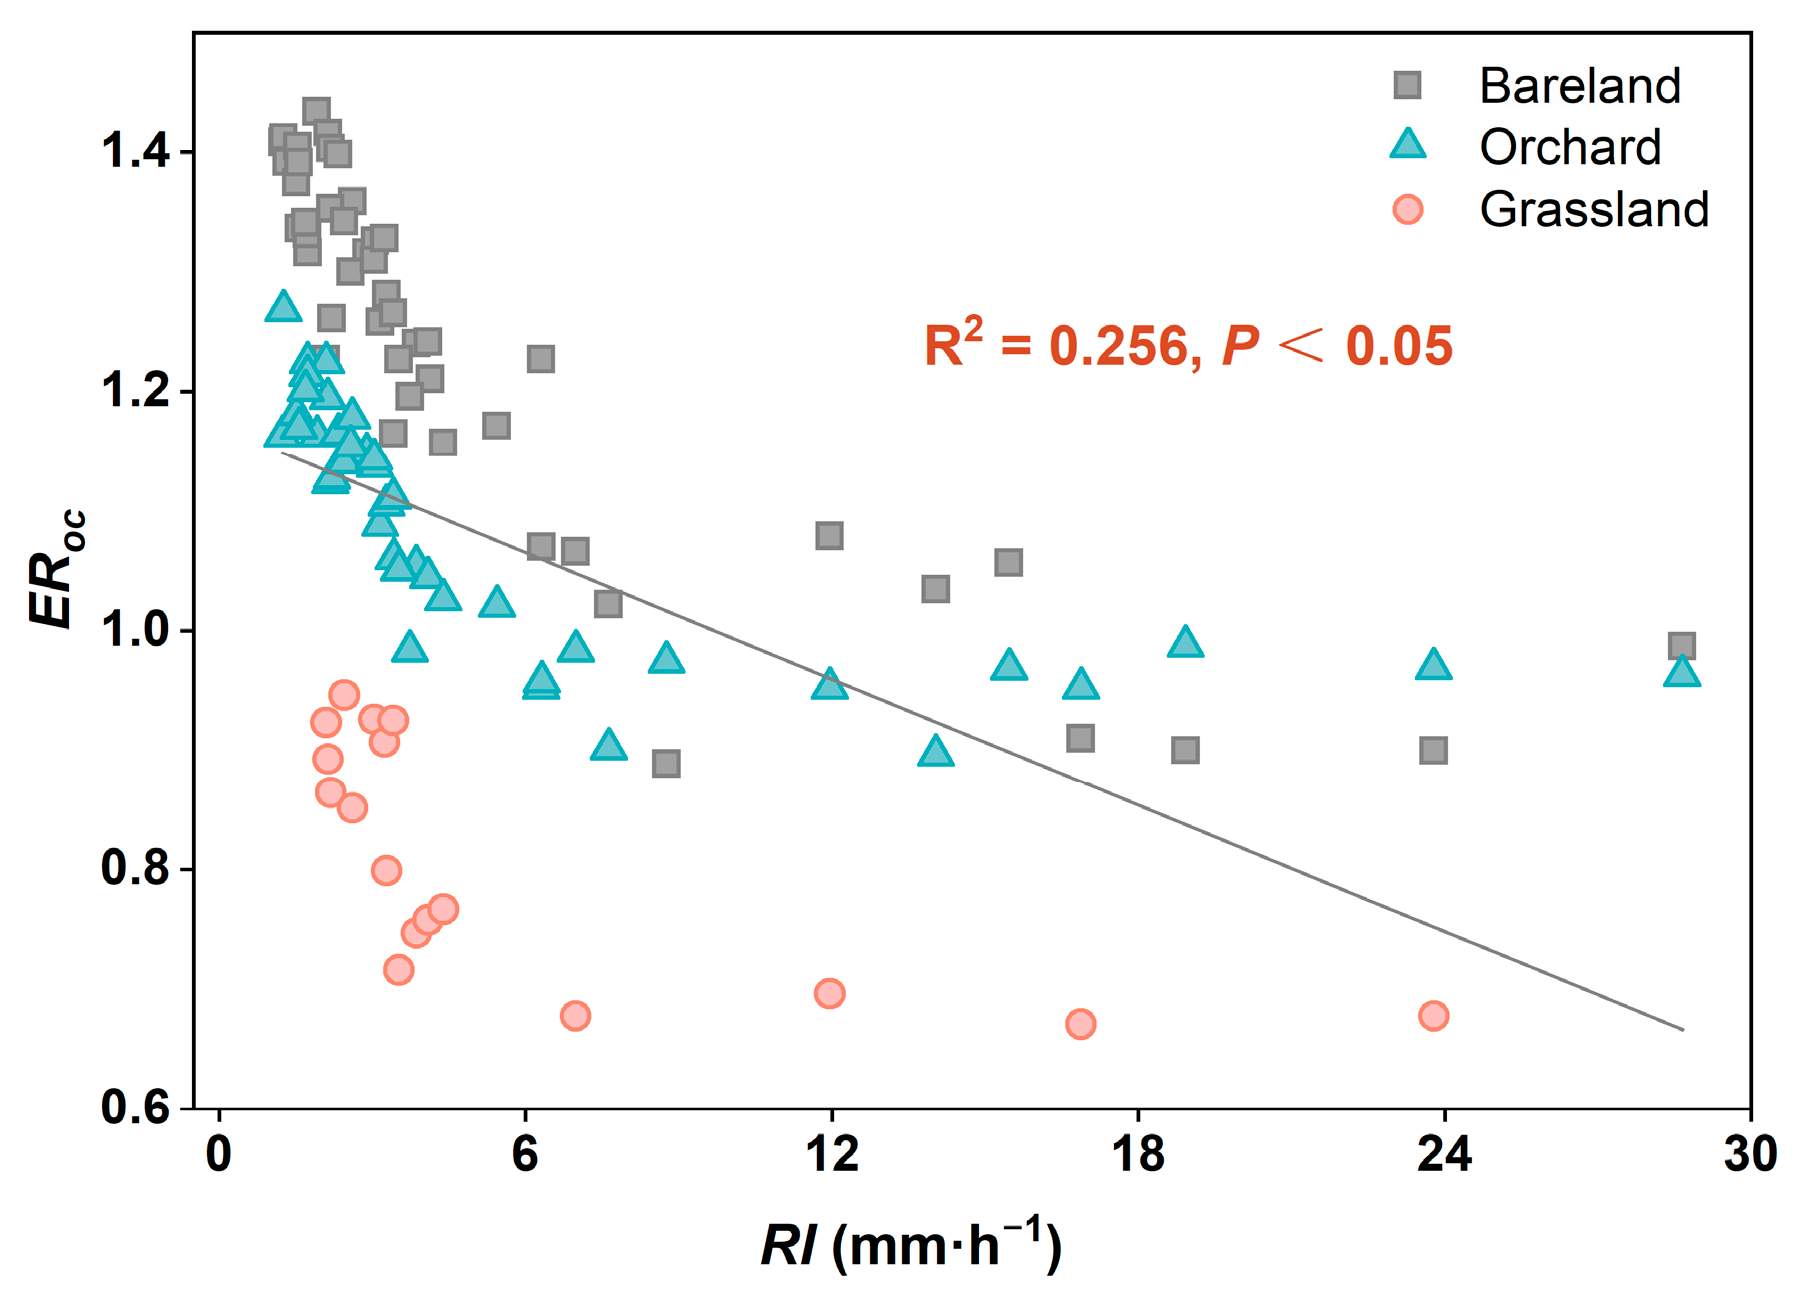
In the two years, the ERoc values for bare land, orchard, and grass cover plots ranged from 0.89 to 1.43 (with the average of 1.23, n = 47), from 0.90 to 1.27 (1.08, n = 41), and from 0.67 to 0.95 (0.81, n = 17), respectively. These results suggested that there was no obvious selective enrichment for OC in sediments from grass cover plots, but OC can be transported preferentially during water erosion from bare land. It also showed that ERoc was closely associated with land cover types. From bare land to orchard, and to grass cover plots, with reduced SLI values, the ERoc values also decreased. In addition, ERoc values decreased significantly with increased RI values (p < 0.05, Figure 6 and Table 5).
In the two years, the average values of Ps for bare land, orchard, and grass cover plots were 68.69%, 55.02% and 49.24%, respectively. With SLI values reduced from bare land to orchard, and to grass cover plots, the Ps values also decreased, and more C would be lost by runoff. In addition, significant positive correlations between Ps and RI were observed for bare land and orchard (Table 5). With increased RI, more C would be lost by sediment than by runoff.
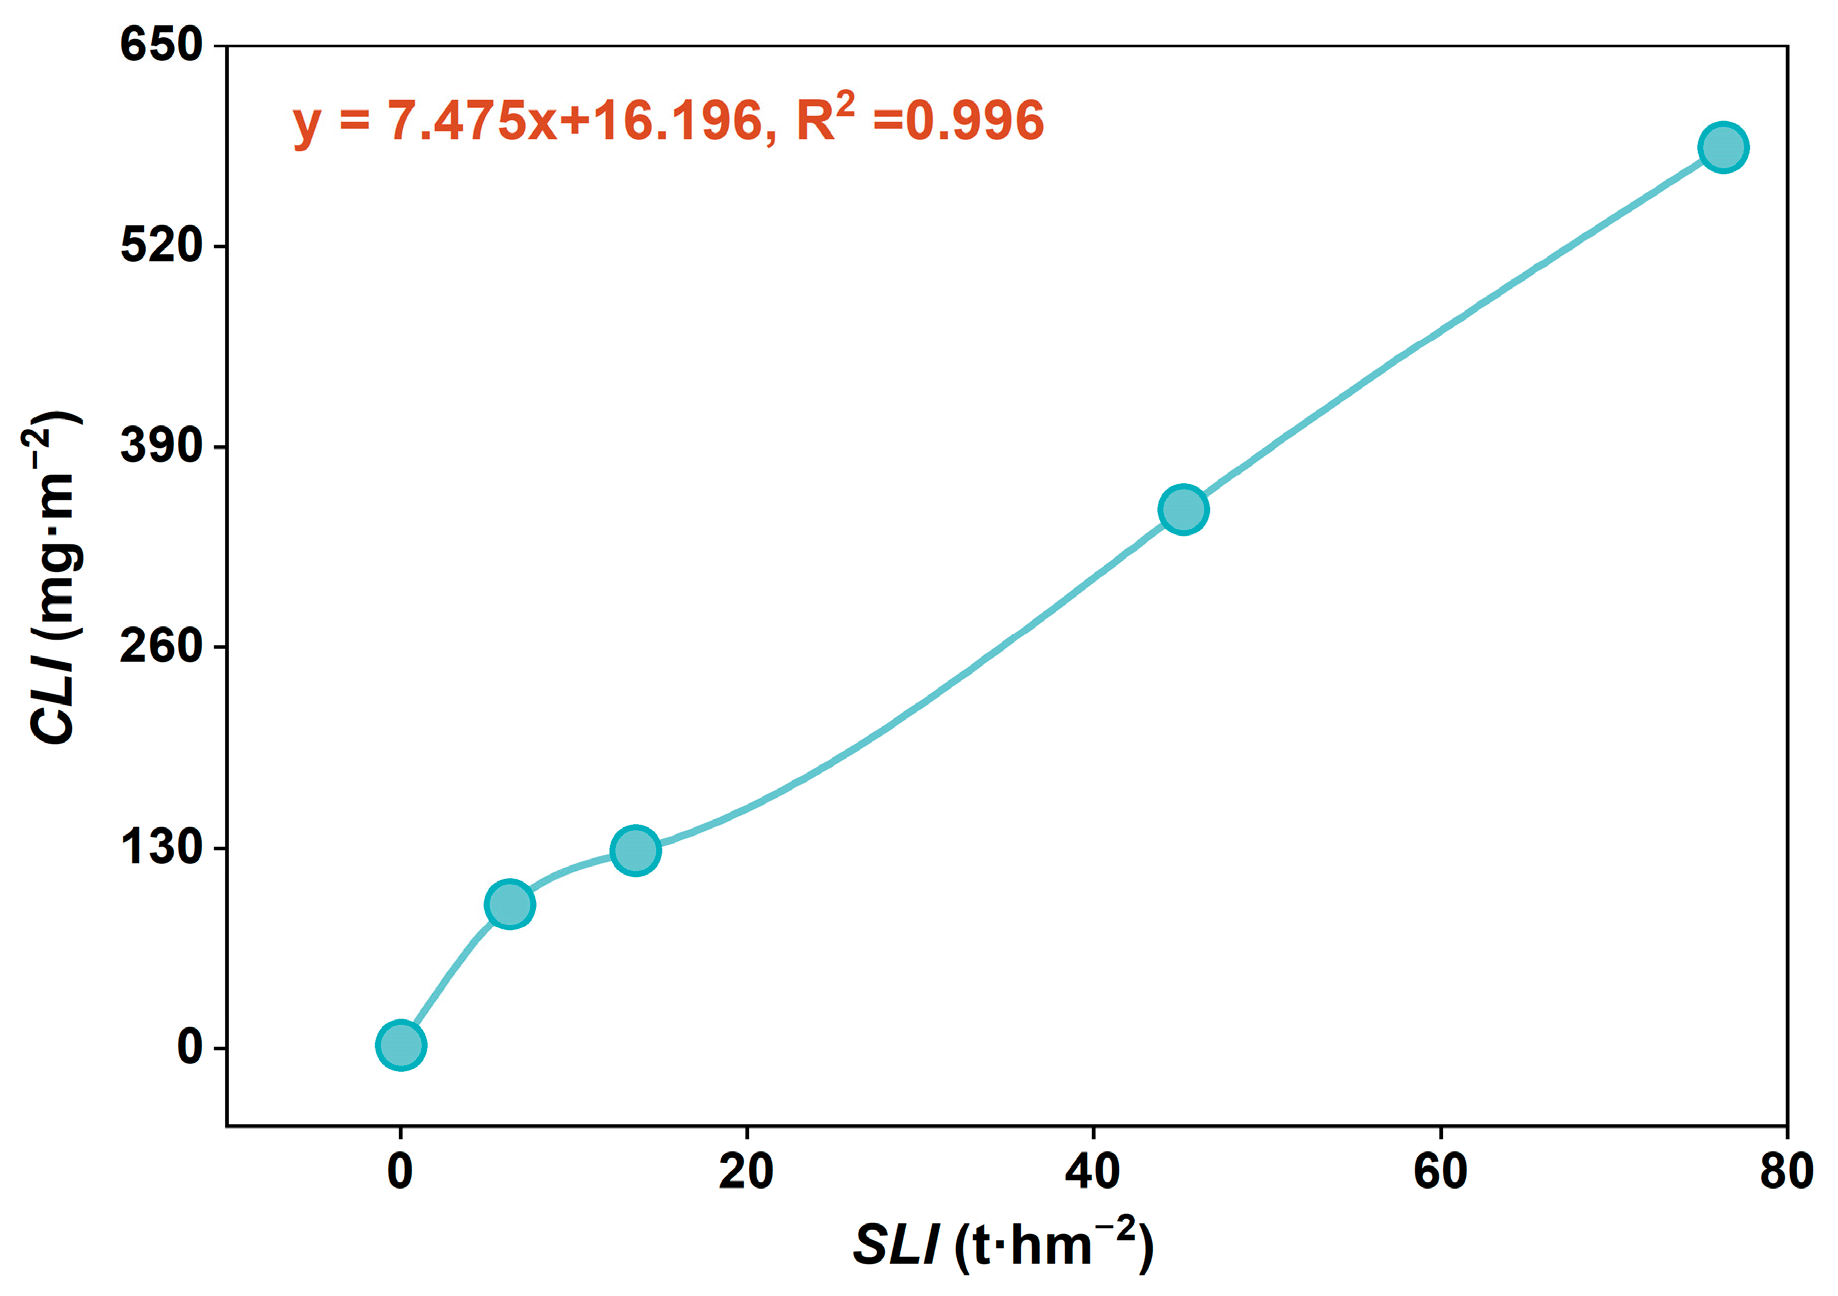
Significant differences were found in CLI among the three land cover types (p < 0.05). In two years, the values of CLI for bare land, orchard, and grass cover plots averaged 464.7 mg m−2, 105.3 mg m−2 and 2.9 mg m−2, respectively. With increased RI values, the total OC loss in the three land cover types increased, but the positive correlation was not significant (p > 0.05). The CLI was significantly positive linearly related to SLI (p < 0.05, Figure 7).

4. Discussion

4.1. Selective Transportation of SOC by Runoff or Sediment

Severe soil erosion can lead to land degradation and productivity decline, and tends to destroy large water-stable aggregates [32]. In the process of soil erosion, the loss of SOC is mainly related to runoff and sediment. Vegetation restoration has been proved to be the most effective measure to improve the soil quality of bare land, protect the soil surface from rainfall and runoff, thereby reducing soil erosion and significantly affecting the selective migration of organic carbon [33]. In this study, the runoff and sediment reduction effects of orchards and grasslands in the rainy season of 2020 and 2021 were more than 50%, and the impact of grasslands was more significant than that of orchards. This result is the same as the research results of Bai et al. [34] in the Loess Plateau, that is, compared with forest land, grassland has a better effect on reducing runoff and sediment. Grassland accumulates abundant roots in the surface soil, which will rapidly turnover, enhance soil cohesion and stability, and help to control sediment loss [35].
Our study showed that, during the 2020 and 2021 rainy seasons, the average values of Ps for bare land, orchard, and grassland plots were 68.69%, 55.02%, and 49.24%, respectively, which was consistent with the result reported by Jacinthe et al. [1]. However, Wang et al. [13] reported that the eroded C in all simulated rainfall events was found to be mainly in the form of sediment-bound C (more than 67%, and as high as 90%). Different results found in different studies may be attributed to different soil types, slopes, land use types, and especially different rainfall characteristics; in most simulated rainfall studies, RI usually reached large values, such as 30, 60, 90, and 120 mm h−1, during a relatively short time (one hour or half an hour). However, most natural rainfall events in this study were characterized by low intensities (Figure 4 and Figure 5). We found that as RI increased, more C was lost by sediment transportation than by runoff, especially for bare land and orchard plots (Table 5). Our results suggested that with increasing RI, the energy available for soil detachment by raindrop impact and the transportation of detached particles by runoff would strengthen [13]. Therefore, the fate of organic C migration due to runoff or sediment transport during water erosion events could not be fully explained by simulated rainfall tests. A comparative study should be conducted on the latter to compare the differences between simulated rainfall and long-term in situ monitoring under natural rainfall.

4.2. ERoc in Sediments

Sediment organic carbon enrichment ratio refers to the ratio of organic carbon concentration in sediment to soil organic carbon concentration, which is a form of selective transportation of SOC. In general, the enrichment of OC is often attributed to the preferential removal of (a) poorly decomposed noncohesive plant fragments [36], and (b) fine-sized sediments that are richer in silt, clay particles and OC [16]. Sediment sorting was observed during water erosion in previous studies [37]. The distribution and density of different sizes of sediment are the main factors determining soil particle migration or deposition [37]. Soil erosion processes tend to selectively remove finer soil particles than coarser ones [1,13]. For example, Wang et al. [13] reported that eroded sediment contained substantially more fine fractions than the original soil, with an increase in clay content (<2 μm) from 16.8% in the original soil to 18.7–29.4% in the sediment, and an increase in fine silt (2–20 um) from 25.6% in the original soil to 27.5–47.1% in the sediment. Qian et al. [38] also reported that ERoc was positively correlated with ERclay (<2 μm) (R2 = 0.68) and ERfine silt (2–20 um) (R2 = 0.63). Therefore, SOC transportation by erosion is primarily associated with finer soil particles [39], which can carry more OC than coarser soil fractions [8,11]. The transportation and enrichment of clay or clay-sized particles that can absorb a large amount of SOC may be the main mechanisms for the enrichment of SOC in sediment.
In our study, the average values for CCr in the two rainy seasons were 4.74 mg L−1, 5.74 mg L−1, and 7.26 mg L−1, and the average values for CCs were 7.47 g kg−1, 7.83 g kg−1, and 8.55 g kg−1 in bare land, orchard, and grass cover plots, respectively. This result was consistent with a previous report [1], which found CCr values ranging from 3.5 mg L−1 to 27.6 mg L−1. The differences of CCr and CCs among different land cover types were mainly due to the different soil DOC content. As shown in Table 1, the DOC contents in surface soil (10–20 cm) of citrus orchard and grass cover plots were 2.65 and 2.49 times higher than that of bare land, respectively. According to the CCs and the background values of SOC content, bare land, orchard, and grass cover plots showed lower ERoc values of 1.24, 1.08 and 0.81, respectively. Nie et al. [10] also pointed out that ERoc on the Loess Plateau in China showed relatively stable values, mostly varying between 0.8 and 1.2, indicating that SOC cannot be transported preferentially by water erosion.
Our ERoc results contradicted some previous studies [1,17]. The low values of ERoc in this study may be attributed to the high infiltration rate of the red soil, which results in the eluviations of clay and organic matter into the topsoil during runoff events. Previous studies found that red soil experienced strong subsurface flow [40,41], and showed obvious vertical migration of nutrients in Southern China [29]. Another reason may be the relatively short length of the runoff plots; shorter runoff plots may lead to an increase in runoff shear stress and a decrease in resistance coefficient, accelerating the migration of sediment, so that more fine-grained sediment and SOC are taken away, thereby reducing the ERoc [42].

4.3. The Effects of RI on SOC Selective Transportation and ERoc

The selective transportation of SOC is closely associated with rainfall characteristics in severely eroded plots, such as bare land and orchards in our study. The bare land plots in our study were similar to the sloping farmlands in previous studies [10,43]. As one-hour RI increased, OC was more likely to be removed with sediments (Table 4), which is consistent with the conclusions of Nie et al. [10]. However, the Ps in grass cover plots was not significantly related to one-hour RI, which may be a result of low sediment loss due to the high vegetation coverage.
In the process of water erosion on the slope scale, the ERoc decreased with the increase in rainfall intensity, and rainfall intensity became an important factor affecting the ERoc. In general, with the increase in rainfall intensity, ERoc shows a decreasing trend. Consistent with previous studies [1,10,12,16], we found that ERoc was higher during low-intensity rainfall events than during high-intensity storms. The mechanism for how RI influences ERoc has been well explained. On the one hand, RI affects soil detachment by raindrop impact and detached particles are transported by surface runoff [43]. With increased RI, the runoff transportation capacity increased, and thus large soil aggregates and large sand particles would also be removed [44]. More coarse sediments were transported in high-intensity storms, thereby diluting the OC concentration of the sediment. On the other hand, higher RI leads to a decrease in infiltration and an increase in runoff, thereby providing additional energy for the movement of sediment and SOC [10], and high runoff depth has an important dissolution effect [16]. In addition, the energy loads of low-intensity storms are sufficient for the detachment of the less resistant soil macro-aggregates and the release of associated C [1,13].
In this study area, according to the continuous observation data from 2010 to 2019, the annual rainfall characteristics are shown in Table 1. In 2020 and 2021, the annual rainfall depth was 1470.7 mm and 1797.4 mm, respectively. In the same study area, a total of 393 rainfall events were used from 2002 to 2014 by Liu et al. [25] to divide into five rainfall regimes by k-means clustering based on the rainfall depth, the maximum 30 min rainfall intensity (I30, mm h−1) and the rainfall duration. Liu et al. [25] reported that the frequency of mean I30 with 5.5 mm h−1, 5.7 mm h−1, 6.7 mm h−1, 7.5 mm h−1 and 10.6 mm h−1 was 76 times, 15 times, 117 times, 44 times and 141 times, respectively. Similar to the results reported by Aneseyee et al. [44], we conclude that frequently occurring low-intensity rainfall events in the hilly red soil region of Southern China should not be overlooked as an important mechanism for removing nutrient-loaded sediment. In general, as expected, heavy rainfall would produce more sediment and nutrient losses; however, higher ERoc was particularly associated with lower RI. In summary, there is a significant dynamic relationship between ERoc and rainfall intensity. With the increase in rainfall intensity, ERoc showed a decreasing trend. However, this relationship is affected by many factors and has complexity and uncertainty. Future research needs to further explore the changes and mechanisms of ERoc under different conditions to provide a scientific basis for soil erosion control and carbon cycle management.

4.4. The Effects of Land Cover Types on SOC Selective Transportation and ERoc

Similar to the results reported by Chen et al. [45] and Jin et al. [46], our study found that dense grass or litter cover was greatly useful for controlling red soil erosion. The lower benefits of reducing runoff and sediment transport in the citrus orchard plots may be due to the combined effects of reduced ground cover by clean tillage, inter-plant and intra-plant gaps, resulting in 30% vegetation coverage, and increased ground consolidation or compaction and lowered infiltration rate because of orchard management practices.
In our study, the Ps values in the plots with vegetation cover (including in grass cover plots and orchard plots) were lower than the values for bare land, suggesting that more SOC was transported by sediments for bare land. Similarly, Jacinthe et al. [1] also found that DOC accounted for 11–28% of the C exported from the cultivated watersheds, and most (67–76%) of the C loss occurred as dissolved load in runoff in forestry watersheds. In addition, the results showed that, during the 2020 rainy season in the two plantation plots, SOC was mainly transferred by runoff with an average Ps of 36%. Therefore, under forest vegetation coverage, the accumulated forest floor, and increased OC at the soil surface over time could help dissipate raindrop impact energy, increase soil resistance to erosion, maintain infiltration, and decrease soil detachment, sediment transport, and water-dispersible clay, thus affecting the migration of OC. Only occasional heavy-intensity storms can lead to soil erosion and subsequent OC loss with sediment in forested land [11].
In addition, the grass cover plots displayed low ERoc (mostly lower than 1.0), which differed from bare land and orchard plots, indicating there was no obvious enrichment for OC in sediments under grass cover. The ERoc varied between 0.49 and 0.69 in the pinus elliottii plantation plots in 2020, also indicating no enrichment of OC in the forested land. Therefore, ERoc observed in our study displayed obvious differences among different land cover types. With increasing SLI for the four land cover types, the ERoc in sediment also increased. Martinez-Mena et al. [20] also showed that the ERoc in an olive grove was higher than in a forest. Wouter et al. [17] found higher clay enrichment ratios in plots without vegetation than in those with vegetation, suggesting that plant cover would influence OC enrichment.
Vegetation restoration increases soil aggregate stability and cohesion, and changes physical and chemical properties of soil [47,48]. In bare land, the energy under low-intensity rainfall is enough to detach soil macro-aggregates with less resistance and release associated nutrients [43,49]. Vegetation coverage can increase infiltration into subsoil layers [18]. For example, for a three-year study conducted at the same research station as our current study, underground runoff for a bare land plot was 68.4% of total runoff, while underground runoff was above 90% of total runoff for vegetation coverage and litter mulch treatments [41]. Liu et al. [25] also reported that the average surface runoff coefficient for bare land was 18.12%, but it was only 1.19% and 1.67%% for grassland and litter cover treatments, The litter cover generated the highest subsurface flow rate, followed by grassland, while the lowest subsurface flow rate was observed for bare land based on studying 393 natural rainfall events. The thick litter layer on the soil surface caused a lag in surface flow generation and increased the volume of water that infiltrated into deep soil layers. This may be the main reason for the differences in enrichment ratio observed among different land use patterns in this study.
The loss of SOC under water erosion mainly depends upon the total soil loss, the ERoc value in sediment and the OC loss in runoff. Due to lower runoff and soil loss in orchard and grass cover plots, the average CLI values in this study were relatively low, just like the reports in Nie et al. [10] and Li et al. [9]. There was a good linear correlation between CLI and SLI (Figure 7). A similar result had previously been reported by Li et al. [9]. Therefore, restoring vegetation coverage on eroded red soil slopes not only effectively controls soil erosion, but also affects the loss of OC by the retention of fine particles, which enrich OC and other nutrients in soils.
The correlation between SOC loss, climate change, and sustainable land management is a hot topic of international concern. With the intensification of global climate change, the frequent occurrence of extreme weather events, such as droughts, floods, and heat waves, poses a serious challenge to the dynamic balance of SOC. These climatic factors not only affect the accumulation and decomposition rates of SOC, but may also alter the soil microbial community structure, further impacting the stability of SOC and the carbon cycle process. Sustainable land management strategies play a crucial role in addressing these challenges. By adopting scientific methods, reasonable fertilization systems, effective soil and water conservation measures, and ecological restoration techniques, SOC loss can be slowed down, soil carbon sequestration can be promoted, and soil resilience and productivity can be enhanced. The formulation of sustainable land management strategies needs to account for differences in regional climate and soil characteristics. By optimizing management practices, soil carbon sequestration can be promoted, and the impacts of climate change can be mitigated. At the same time, long-term monitoring and in-depth research on the dynamic changes of SOC will help to predict the global carbon cycle and respond to climate change more accurately.

5. Conclusions

In this study, surface runoff and sediment loss differed significantly among the three land cover types in the hilly red soil region of Southern China. Compared with bare land plots, orchard and grass cover plots had significant soil and water control effects with the surface runoff reductions of 67% and 98%, and soil loss reductions of 79% and 99% from March to August in 2020 and 2021, respectively.
The selective transportation of SOC was significantly regulated by one-hour RI. With increased one-hour RI, the total SOC loss increased in the three land cover types, but with no significant positive correlation, more OC would be lost associated to sediment than associated to runoff in bare land and orchard plots, and ERoc in sediments decreased significantly. Consequently, more attention should be given to low-intensity rainfall events during the rainy season because of the high enrichment ratio of SOC in sediments in the red soil region.
The land cover types had a marked effect on SOC transportation in the red soil region, including the transportation mode and total loss. With decreased SLI (from bare land to orchard, and to grass cover plots), more OC would be removed by runoff rather than by sediments, and the ERoc in sediments and CLI values also decreased significantly. Compared to bare land in the hilly red soil region, grass planting and orchard development could effectively reduce SOC loss.
The results of this study are of great significance for understanding the impact of soil erosion on land management in the red soil region of southern China, and also play an important guiding role in soil and water conservation and sustainable utilization of resources in the red soil region.

Author Contributions

M.C.: Investigation, Writing—original draft, Visualization. S.X.: Funding acquisition and resources, Conceptualization, Writing—review and editing. Y.L., J.H. and H.L.: Investigation. All authors have read and agreed to the published version of the manuscript.

Funding

This work was supported by the Science Centre Project of the National Natural Science Foundation of China (grant numbers: 42367049 and 41761063), Jiangxi Province “Science and Technology + Water Resources” Joint Plan Project (grant number: 2023KSG01001), The Major Discipline Academic and Technical Leaders Training Program of Jiangxi Province (grant number: 20243BCE51025).

Data Availability Statement

Data available on request due to privacy reasons.

Conflicts of Interest

The authors declare no conflicts of interest.

Abbreviations

AbbreviationImplicationDetailed Description
AThe area of the runoff plot /
AhThe surface layer25–30 cm
CVCoefficient of variation /
CLtThe total C loss for an individual rainfall event C L t = S Y × C C s + V r × C C r
CLIThe C loss intensity C L I = C L t / A
CLMThe C loss modulus /
CCsThe sediment C concentration /
CCrThe runoff C concentration /
CCssThe organic C content in the 0–20 cm surface soil layer /
DBHDiameter at breast height7.6 cm
ERocThe enrichment ratio of SOC in sediments E R o c = C C s / C C s s
EMThe soil erosion modulus /
PsThe average proportions of sediment-transported C in total SOC loss P s = S Y × C C s / C L t
PThe rainfall depth
RCThe runoff coefficient R C = R D / P
RDThe runoff depth /
RIRainfall intensity /
SYThe sediment yield /
SLISoil erosion intensity S L I = S Y / A
VrThe runoff volume for an individual rainfall event /

References

  1. Jacinthe, P.; Lal, R.; Owens, L.; Hothem, L. Transport of labile carbon in runoff as affected by land use and rainfall characteristics. Soil Tillage Res. 2004, 77, 111–123. [Google Scholar] [CrossRef]
  2. Yue, Y.; Ni, J.; Ciais, P.; Piao, S.; Wang, T.; Huang, M.; Borthwick, A.G.L.; Li, T.; Wang, Y.; Chappell, A.; et al. Lateral transport of soil carbon and land-atmosphere CO2 flux induced by water erosion in China. Proc. Natl. Acad. Sci. USA 2016, 113, 17–22. [Google Scholar] [CrossRef] [PubMed]
  3. Li, Y.; Liu, W.; Feng, Q.; Zhu, M.; Yang, L.; Zhang, J. Effects of land use and land cover change on soil organic carbon storage in the Hexi regions, Northwest China. J. Environ. Manag. 2022, 312, 114911. [Google Scholar] [CrossRef] [PubMed]
  4. Lal, R. Soil erosion and the global carbon budget. Environ. Int. 2003, 29, 437–450. [Google Scholar] [CrossRef]
  5. Lal, R. Soil carbon sequestration to mitigate climate change. Geoderma 2004, 12, 1–22. [Google Scholar] [CrossRef]
  6. Mariappan, S.; Hartley, I.P.; Cressey, E.L.; Dungait, J.A.; Quine, T.A. Soil burial reduces decomposition and offsets erosion-induced soil carbon losses in the Indian Himalaya. Glob. Chang. Biol. 2022, 28, 1643–1658. [Google Scholar] [CrossRef]
  7. Hunter, B.D.; Roering, J.J.; Silva, L.C.R.; Moreland, K.C. Geomorphic controls on the abundance and persistence of soil organic carbon pools in erosional landscapes. Nat. Geosci. 2024, 17, 151–157. [Google Scholar] [CrossRef]
  8. Zhang, H.; Lauerwald, R.; Regnier, P.; Ciais, P.; Yuan, W.; Naipal, V.; Guenet, B.; Van Oost, K.; Camino-Serrano, M. Simulating erosion-induced soil and carbon delivery from uplands to rivers in a global land surface model. J. Adv. Model. Earth Syst. 2020, 12, e2020MS002121. [Google Scholar] [CrossRef]
  9. Li, Z.; Nie, X.; He, J.; Chang, X.; Liu, C.; Liu, L.; Sun, L. Zonal characteristics of sediment-bound organic carbon loss during water erosion: A case study of four typical loess soils in Shanxi Province. Catena 2017, 156, 393–400. [Google Scholar] [CrossRef]
  10. Nie, X.; Li, Z.; He, J.; Huang, J.; Zhang, Y.; Huang, B.; Ma, W.; Lu, Y.; Zeng, G. Enrichment of organic carbon in sediment under field simulated rainfall experiments. Environ. Earth Sci. 2015, 74, 5417–5425. [Google Scholar] [CrossRef]
  11. Adhikary, P.; Hombegowda, C.; Barman, D.; Madhu, M. Soil and onsite nutrient conservation potential of aromatic grasses at field scale under a shifting cultivated, degraded catchment in Eastern Ghats, India. Int. J. Sediment. Res. 2018, 33, 340–350. [Google Scholar] [CrossRef]
  12. Yao, Y.; Liu, J.; Wang, Z.; Wei, X.; Zhu, H.; Fu, W.; Shao, M. Responses of soil aggregate stability, erodibility and nutrient enrichment to simulated extreme heavy rainfall. Sci. Total Environ. 2020, 709, 136150. [Google Scholar] [CrossRef] [PubMed]
  13. Wang, L.; Yen, H.; Wang, X.; Huang, C.; Sun, J.; Hammac, A.; Wang, Y. Deposition- and transport-dominated erosion regime effects on the loss of dissolved and sediment-bound organic carbon: Evaluation in a cultivated soil with laboratory rainfall simulations. Sci. Total Environ. 2021, 750, 141717. [Google Scholar] [CrossRef] [PubMed]
  14. Han, J.; Pan, Y.; Xiao, P.; Ge, W.; Sun, P. Quantifying the Effects of Climate Change and Revegetation on Erosion-Induced Lateral Soil Organic Carbon Loss on the Chinese Loess Plateau. Remote Sens. 2023, 15, 1775. [Google Scholar] [CrossRef]
  15. Massey, H.; Jackson, M. Selective erosion of soil fertility constituents. Soil Sci. Soc. Am. J. 1952, 16, 353–356. [Google Scholar] [CrossRef]
  16. Liu, L.; Li, Z.; Jiao, P. Hydraulic mechanisms of the uneven enrichment of soil organic carbon in sediments during rain-induced overland flow. PLoS ONE 2022, 17, e0262865. [Google Scholar] [CrossRef]
  17. Wouter, S.; Donald, G.; Cornelis, W.M.; Hofman, G. Enrichment of Organic Carbon in Sediment Transport by Interrill and Rill Erosion Processes. Soil Sci. Soc. Am. J. 2008, 72, 50–55. [Google Scholar]
  18. Lin, J.; Fang, N.; Zhang, Y.; Zeng, Y.; Yang, D.; Dai, W.; Wang, L.; Shi, Z. Dynamics of soil organic carbon in different-sized aggregates under splash erosion. J. Soils Sediments 2022, 22, 1713–1723. [Google Scholar] [CrossRef]
  19. Park, S.; Yang, H.; Park, H.; Seo, B.S.; Jeong, Y.J.; Lim, S.S.; Kwak, J.H.; Kim, H.Y.; Yoon, K.S.; Lee, S.M.; et al. Rice straw cover decreases soil erosion and sediment-bound C, N, and P losses but increases dissolved organic C export from upland maize fields as evidenced by δ 13 C. Sci. Total Environ. 2021, 753, 142053. [Google Scholar] [CrossRef]
  20. Martínez-Mena, M.; López, J.; Almagro, M.; Albaladejo, J.; Castillo, V.; Ortiz, R.; Boix-Fayos, C. Organic carbon enrichment in sediments: Effects of rainfall characteristics under different land uses in a Mediterranean area. Catena 2012, 94, 36–42. [Google Scholar] [CrossRef]
  21. Zhao, Q. Red Soil Material Cycling and Its Regulation; Science Publisher: Beijing, China, 2002. [Google Scholar]
  22. Li, X.; Yang, J.; Zhao, C. Effect of agroforestry and time on soil and water conservation of sloping red soil in southeastern China. J. Soil Water Conserv. 2014, 69, 131–139. [Google Scholar] [CrossRef]
  23. Chen, Z.; Wang, L.; Wei, A.; Gao, J.; Lu, Y.; Zhou, J. Land-use change from arable lands to orchards reduced soil erosion and increased nutrient loss in a small catchment. Sci. Total Environ. 2019, 648, 1097–1104. [Google Scholar] [CrossRef] [PubMed]
  24. Chen, J.; Li, Z.; Xiao, H.; Ning, K.; Tang, C. Effects of land use and land cover on soil erosion control in southern China: Implications from a systematic quantitative review. J. Environ. Manag. 2021, 282, 111924. [Google Scholar] [CrossRef] [PubMed]
  25. Liu, Y.J.; Yang, J.; Hu, J.M.; Tang, C.J.; Zheng, H.J. Characteristics of the surface-subsurface flow generation and sediment yield to the rainfall regime and land-cover by long-term in-situ observation in the red soil region, Southern China. J. Hydrol. 2016, 539, 457–467. [Google Scholar] [CrossRef]
  26. Duan, J.; Liu, Y.; Yang, J.; Tang, C.; Shi, Z. Role of groundcover management in controlling soil erosion under extreme rainfall in citrus orchards of southern China. J. Hydrol. 2020, 582, 124290. [Google Scholar] [CrossRef]
  27. Ma, W.; Li, Z.; Ding, K.; Huang, J.; Nie, X.; Zeng, G.; Liu, G. Effect of soil erosion on dissolved organic carbon redistribution in subtropical red soil under rainfall simulation. Geomorphology 2014, 226, 217–225. [Google Scholar] [CrossRef]
  28. Qi, Y.; Dong, Y.; Peng, Q.; Xiao, S.; He, Y.; Liu, X.; Sun, L.; Jia, J.; Yang, Z. Effects of a conversion from grassland to cropland on the different soil organic carbon fractions in Inner Mongolia, China. J. Geogr. Sci. 2012, 22, 315–328. [Google Scholar] [CrossRef]
  29. Xie, Y.; Liu, B. Nearing AM. Practical thresholds for separating erosive and non-erosive storms. Trans. ASABE 2002, 45, 1843–1847. [Google Scholar]
  30. Majid, M.; Samira, Z.; Najme, Y. Enrichment of soil organic carbon in the eroded sediments due to the simultaneous occurrence of rain and wind. Geoderma 2021, 386, 114926. [Google Scholar]
  31. ISSAS. Chinese Soil Taxonomy Retrieval, 3rd ed.; USS Working Group: London, UK, 2001. [Google Scholar]
  32. Wen, L.; Peng, Y.; Zhou, Y.; Guo, C.; Lin, Y.; Li, B. Study on soil erosion and its driving factors from the perspective of landscape in Xiushui watershed, China. Sci. Rep. 2023, 13, 8182. [Google Scholar] [CrossRef]
  33. Lowrance, R.; Williams, R.G. Carbon movement in runoff and erosion under simulated rainfall conditions. Soil Sci. Soc. Am. 1988, 52, 1445–1448. [Google Scholar] [CrossRef]
  34. Bai, R.; Wang, X.; Li, J.; Yang, F.; Shangguan, Z.; Deng, L. The impact of vegetation reconstruction on soil erosion in the Loess plateau. J. Environ. Manag. 2024, 363, 121382. [Google Scholar] [CrossRef] [PubMed]
  35. Wang, S.; Fu, B.; Piao, S.; Lü, Y.; Ciais, P.; Feng, X.; Wang, Y. Reduced sediment transport in the Yellow River due to anthropogenic changes. Nat. Geosci. 2016, 9, 38–41. [Google Scholar] [CrossRef]
  36. Ghadiri, H.; Rose, C. Sorbed chemical transport in overland flow: II. Enrichment ratio variation with erosion processes. J. Environ. Qual. 1991, 20, 634–641. [Google Scholar] [CrossRef]
  37. Han, Z.; Wang, X.; Song, D.; Li, X.; Huang, P.; Ma, M. Response of soil erosion and sediment sorting to the transport mechanism on a steep rocky slope: The journal of the british geomorphological research group. Earth Surf. Process. Landf. 2019, 44, 2467–2478. [Google Scholar] [CrossRef]
  38. Qian, J.; Zhang, L.P.; Wang, W.Y.; Liu, Q. Organic carbon losses by eroded sediments from sloping vegetable fields in South China. J. Mt. Sci. 2017, 14, 539–548. [Google Scholar] [CrossRef]
  39. Jiang, Y.; Zheng, F.; Wen, L.; Shen, H. Effects of sheet and rill erosion on soil aggregates and organic carbon losses for a mollisol hillslope under rainfall simulation. J. Soils Sediments 2019, 19, 467–477. [Google Scholar] [CrossRef]
  40. Ma, Y.; Li, Z.; Tian, L.; Yang, Y.; Li, W.; He, Z.; Nie, X.; Liu, Y. Erosion of granite red soil slope and processes of subsurface flow generation, prediction, and Simulation. Int. J. Environ. Res. Public Health 2023, 20, 2104. [Google Scholar] [CrossRef]
  41. Xie, S.; Mo, M.; Tu, A.; Liu, Y. Characteristics of vertical runoff output on red-soil slope under natural rainfall condition. Trans. Chin. Soc. Agric. Eng. 2014, 30, 132–138. [Google Scholar]
  42. Polyakov, V.; Lal, R. Soil erosion and carbon dynamics under simulated rainfall. Soil Sci. 2004, 169, 590–599. [Google Scholar] [CrossRef]
  43. Wang, S.; Fan, Y.; Liu, L.; Qu, J. Transport/Detachment regimes of different size class sediment particles and enlightenments for transport capacity prediction for rain-induced overland flow erosion. Sustainability 2023, 15, 7096. [Google Scholar] [CrossRef]
  44. Aneseyee, A.; Elias, E.; Soromessa, T.; Feyisa, G. Land use/land cover change effect on soil erosion and sediment delivery in the Winike watershed, Omo Gibe Basin, Ethiopia. Sci. Total Environ. 2020, 728, 138776. [Google Scholar] [CrossRef] [PubMed]
  45. Chen, J.; Xiao, H.; Li, Z.; Liu, C.; Ning, K.; Tang, C. How effective are soil and water conservation measures (SWCMs) in reducing soil and water losses in the red soil hilly region of China? A meta-analysis of field plot data. Sci. Total Environ. 2020, 735, 139517. [Google Scholar] [CrossRef] [PubMed]
  46. Jin, H.; Huang, S.; Shi, D.; Chen, B.; Zhang, Y.; Liu, Q.; Liu, E. Effects of different tillage practices on soil stability and erodibility for red soil sloping farmland in southern China. Agronomy 2023, 13, 1310. [Google Scholar] [CrossRef]
  47. Wu, W.; Chen, G.; Meng, T.; Li, C.; Feng, H.; Si, B.; Siddique, K.H. Effect of different vegetation restoration on soil properties in the semi-arid Loess Plateau of China. Catena 2023, 220, 106630. [Google Scholar] [CrossRef]
  48. Yu, P.; Li, Y.; Liu, S.; Liu, J.; Ding, Z.; Ma, M.; Tang, X. Afforestation influences soil organic carbon and its fractions associated with aggregates in a karst region of Southwest China. Sci. Total Environ. 2021, 814, 152710. [Google Scholar] [CrossRef]
  49. Qi, Z.; Cui, W.; Tian, Z.; Li, J.; Wang, Y.; Wu, P.; Gao, Z.; Xue, J. Soil aggregates stability response to summer fallow tillage in rainfed winter wheat fields on the loess plateau. Agronomy 2023, 13, 1413. [Google Scholar] [CrossRef]
Figure 1. (A) Study area, location in the center of the red soil region in Southern China. (B) Study site. The photos on the bottom show the three types of runoff plots including bare land (a), orchard (b), and grassland (c). (Photograph taken by Shengsheng Xiao).
Agronomy 14 02563 g001
Figure 2. Experimental design concept map. (a) Set the map for the three runoff plots; (b) the process of collecting runoff and sediment; (c) detailed design for profile of erosion slope and sedimentary zone.
Agronomy 14 02563 g002
Figure 3. The schematic diagram of migration process of organic carbon.
Agronomy 14 02563 g003
Figure 4. Rainfall depth and rainfall intensity (RI) from March to August in 2020 and 2021 at Jiangxi Eco-Science Park of Soil and Water Conservation, China.
Agronomy 14 02563 g004
Figure 5. Runoff coefficients and soil erosion intensities for three type of plots in 2020 and 2021 at Jiangxi Eco-Science Park of Soil and Water Conservation, China.
Agronomy 14 02563 g005
Figure 6. The ERoc in sediments under different RI values for different land cover types in the two rainy seasons at Jiangxi Eco-Science Park of Soil and Water Conservation, China.
Agronomy 14 02563 g006
Figure 7. Relationships between carbon loss intensity (CLI) and soil loss intensity (SLI) during two rainy seasons at Jiangxi Eco-Science Park of Soil and Water Conservation, China.
Agronomy 14 02563 g007
Table 1. The annual rainfall characteristics of the study area from 2010 to 2019.
Year2010201120122013201420152016201720182019
Annual rainfall depth (mm)1637.8898.51867.91336.41635.32685.41797.41839.61176.41207.7
Rainfall depth from March to August (mm)1192.5730.01166.211371297.41214.71388.51537.2775.8853
Annual duration (h)749.8772.41060.2628.0764.0809.11020.41129.51151.01181.8
Annual mean rainfall intensity (mm h−1)2.21.21.82.12.12.32.12.42.31.6
Table 2. Main characteristics of surface soil (0–20 cm) for the three land cover plots at Jiangxi Eco-Science Park of Soil and Water Conservation, China.
TreatmentSand
(g kg−1)
Silt
(g kg−1)
Clay
(g kg−1)
pH (1:2.5)Soil Bulk Density
(g cm−3)
Total Soil
Nitrogen
(g kg−1)
Total Soil Phosphorus
(g kg−1)
Total Soil
Potassium
(g kg−1)
Soil Organic
Carbon
(g kg−1)
Dissolved Organic Carbon
(mg kg−1)
Bare land398.3 ± 19.2 a258.4 ± 14.8 a343.3 ± 14.3 a5.90 ± 0.19 a1.53 ± 0.05 a0.66 ± 0.07 a0.31 ± 0.03 a14.19 ± 1.06 a6.08 ± 0.34 a150.88 ± 19.03 a
Orchard386.5 ± 19.7 a260.6 ± 17.7 a353.0 ± 16.5 a6.23 ± 0.19 a1.55 ± 0.05 a0.97 ± 0.10 b0.38 ± 0.05 a14.34 ± 1.12 a7.35 ± 0.35 b399.96 ± 46.62 b
Grassland380.2 ± 14.5 a256.9 ± 14.7 a362.9 ± 155.3 a5.78 ± 0.16 a1.41 ± 0.03 a0.72 ± 0.08 a0.32 ± 0.03 a13.84 ± 0.96 a10.71 ± 0.47 b376.23 ± 54.21 b
Note: Date are means ± SD, n = 3; different letters indicate significant differences among vegetation types (p < 0.05).
Table 3. Correlations between runoff and sediment yield and rainfall depth or RI for three land cover types at Jiangxi Eco-Science Park of Soil and Water Conservation, China.
Bare LandOrchardGrass Cover
RCSLIRCSLIRCSLI
202020212020202120202021202020212020202120202021
Rainfall depth0.564 **0.3870.869 **0.569 **0.653 **0.691 **0.753 **0.565 **0.0040.1310.708 **0.748 **
RI0.3440.3080.3520.0700.725 **−0.0540.446 *−0.1150.0510.0890.114−0.129
Note: * and ** indicate significant differences at p = 0.05 and p = 0.01, respectively.
Table 4. Correlations between RI, runoff depth, or sediment yield and CCr and CCs for three different land cover types at Jiangxi Eco-Science Park of Soil and Water Conservation, China.
Bare LandOrchardGrassland
CCrCCsCCrCCsCCrCCs
202020212020202120202021202020212020202120202021
RI−0.299−0.794 **−0.877 **−0.859 **−0.520*−0.526 **−0.0080.066−0.543 *−0.518 *0.1460.029
Runoff depth−0.496 *−0.376//−0.568−0.215//−0.467 *0.173//
Sediment yield//−0.490*−0.263//0.0260.134//0.669 **0.361
Note: CCr is runoff carbon concentration (mg L−1); CCs is sediment carbon concentration (g kg−1); * and ** indicate significant differences at p = 0.05 and p = 0.01, respectively.
Table 5. Effects of RI on ERoc and Ps for different land cover types in 2020 and 2021 at Jiangxi Eco-Science Park of Soil and Water Conservation, China.
Bare LandOrchardGrassland
RIRIRI
202020212020202120202021
ERoc−0.876 **−0.859 **−0.007−0.698 **−0.766 **−0.674
Ps0.537 **0.454 *0.623 **0.504 *0.170−0.065
Note: * and ** indicate significant differences at p = 0.05 and 0.01, respectively.
Disclaimer/Publisher’s Note: The statements, opinions and data contained in all publications are solely those of the individual author(s) and contributor(s) and not of MDPI and/or the editor(s). MDPI and/or the editor(s) disclaim responsibility for any injury to people or property resulting from any ideas, methods, instructions or products referred to in the content.