Article

Estimation of Canopy Water Content by Integrating Hyperspectral and Thermal Imagery in Winter Wheat Fields

1
College of Agronomy, Henan Agricultural University, Zhengzhou 450046, China
2
College of Resources and Environment, Henan Agricultural University, Zhengzhou 450046, China
*
Authors to whom correspondence should be addressed.
These authors contributed equally to this work.
Agronomy 2024, 14(11), 2569; https://doi.org/10.3390/agronomy14112569
Submission received: 12 September 2024 / Revised: 19 October 2024 / Accepted: 28 October 2024 / Published: 1 November 2024
(This article belongs to the Section Precision and Digital Agriculture)

Abstract

:
Rapid and accurate estimation of canopy water content (CWC) is important for agricultural water management and food security. Due to the complexity of dynamic changes in water transport during plant growth, estimation of CWC using a single sensor often leads to high uncertainty in the results. Multi-sensor data fusion is one of the solutions to this problem, but suitable spectral preprocessing methods and data fusion methods still need further research. The objectives of this study were to characterize the performance of two varieties at different growth stages under five water stress conditions and screen hyperspectral sensitive spectral bands by using continuous wavelet transform (CWT) and a successive projection algorithm (SPA). Ultimately, the CWC prediction model of winter wheat hyperspectral characteristic bands and thermal imaging information fusion was created using the GRA algorithm. The results showed that canopy temperature parameters and spectral parameters responded significantly to water deficits in winter wheat. Using the CWT-SPA method, a total of 285 hyperspectral feature bands with wavelet decomposition scales ranging from one to eight were selected. The sensitive bands were mainly distributed in the following ranges: 545–561, 746–1348, 1561–1810, and 2122–2430 nm. The GRA algorithm has good multi-source data model fusion capability, and its constructed prediction model based on hyperspectral and thermal image fusion has high accuracy on the canopy water content in winter wheat (R2 = 0.930, RMSE = 5.44%, nRMSE = 7.94%). Compared to the single-feature spectral model (R2 = 0.864, RMSE = 5.92%, nRMSE = 8.63%) and thermal image CWC prediction model (R2 = 0.813, RMSE = 7.22%, nRMSE = 10.49%), the model prediction accuracy based on the GRA algorithm is increased by 7.64% and 13.69%, respectively.

1. Introduction

Drought is a major meteorological disaster that affects global agriculture production and food security, and its negative impact cannot be ignored [1,2]. It reported that China suffers an annual economic loss of 75.7 billion per year due to drought [3]. As an important grain production base in China, the North China Plain (NCP) is also the region most severely affected by drought and temperature stress, with an area of 6.639 million hm2 affected from 2002 to 2017 [4]. The temporal and spatial distribution of rainfall in the Huang Huai Hai Plain is uneven, showing a trend of more rainfall in summer and less rainfall in winter and spring. The rainfall during the winter wheat growing season is usually between 125 and 250 mm [5]. Natural rainfall is unable to meet the growth requirements of winter wheat, which often results in a water deficit during the critical growth period of winter wheat [6]. When plants are subjected to drought stress, their physiological and biochemical functions are damaged, their growth rate slows down, and they can even die [7]. Therefore, objectively and accurately monitoring wheat drought conditions and scientifically and rigorously responding to wheat drought disaster risks are particularly important for ensuring national food security and achieving sustainable agricultural development.
Water stress leads to increased stomatal closures, decreased transpiration rates, and subsequently increased canopy temperatures. Crop canopy temperatures obtained by thermal infrared techniques are used to detect the water status in multiple crop species, due to the fact that drought stress induces a reduction in leaf water, closure of the stomata, a decrease in leaf water potential, and a decrease in evaporation while increasing the leaf/canopy temperature [8]. Thus, canopy temperature becomes an alternative to stomatal conductance, transpiration rate, and leaf water potential for monitoring plant water stress in response to different water stresses [9]. By establishing the correlation between canopy temperature and crop water index, numerous studies have succeeded in monitoring crop water conditions in real time and accurately [10,11]. The thermal imaging sensor is very important for quickly obtaining the temperature difference and spatial distribution of the crop canopy over a large area, as it can record the thermal radiation within the field of view and provide the temperature value of each pixel in the image [12]. For example, Mangus et al. [13] found a strong correlation (R2 = 0.82) between the soil water content and crop water stress index (CWSI) of maize obtained using a thermal infrared imaging system (TIRIS). Kurunc et al. [14] used the thermal imager with non-contact data acquisition to effectively distinguish the water status of wheat under four different irrigation levels. Banerjee et al. [15] used thermal imaging to obtain canopy temperature parameters, the crop water stress index (CWSI), and the stomatal conductance index (IG), performed thermal map inversion for different genotypes of wheat, and constructed a new water stress index (NWSTI) to monitor the water status of winter wheat for screening drought resistant varieties. As a result, winter wheat water status can be efficiently monitored by using thermal imaging to obtain canopy temperature data (Tc) and canopy temperature-based stress indices such as canopy temperature difference (CTD), crop water stress index (CWSI), and stomatal conductance index (IG) [16].
The passive reflectance sensor measurements rely on sunlight sources to passively receive information reflected from target features and can be used to monitor crop biomass, water status, and crop yield in different environmental conditions. The principle of using hyperspectral remote sensing to monitor crop water status is that the morphological and physiological changes caused by plant water shortages directly affect the light absorption, transmission, and reflection of plants [17]. Research has shown that the plant water content is highly correlated with the bands in the 950–970, 1150–1260, and 1520–1540 nm regions [18]. Meanwhile, mathematical transformation techniques have also been proven to be highly effective in providing key spectral information for monitoring the water status of winter wheat [19]. Most studies screen spectral bands using feature selection techniques like successive projection algorithms (SPAs), competitive adaptive reweighted sampling (CARS), genetic algorithms (GAs), and principal component analysis (PCA) to prevent the impact of multicollinearity on feature spectrum modeling [20,21,22,23]. The successive projection algorithm (SPA) can quickly extract the sensitive bands, minimize the number of independent variables, optimize the characteristic spectrum, and guarantee the least collinearity between independent variables [24]. In addition, wavelet transform was used by many researchers for crop detection to identify pests, diseases, nitrogen, and water conditions [25,26]. Wavelet transform can preserve the differences between spectral features, which is the best method in spectral processing and is often used in the research of hyperspectral data denoising [27]. The wavelet transform decomposes the original input spectrum into new data forms at different scales (frequencies), allowing the components of the original reflectance spectrum to be quantified [28]. Continuous wavelet transform is a linear transformation method that can fully emphasize the local characteristics of the wave spectrum, effectively extract the weak information part of the signal, and has the characteristics of multi-resolution analysis [29]. The successive projection algorithm (SPA) can select a few distinctive bands from the entire band and applies vector projection analysis to remove as much redundant information as possible from the spectrum. It can not only reduce the number of spectral bands involved in modeling but also ensure minimum collinearity between characteristic bands to improve modeling efficiency [30]. Some studies have also shown that by employing SPAs to further extract the characteristic spectrum by wavelet transforming the original spectrum, the benefits of SPAs can be fully exploited [31]. Therefore, the CWT combined with the SPA is able to efficiently filter out water-sensitive bands and extract hyperspectral feature data indicating the water status of winter wheat.
The change in plant water status is a complex physiological and biochemical process, and the data from a single sensor cannot accurately reflect the water deficit of plants. The fusion of multiple sensor information can more comprehensively and accurately reflect the water status of plants [32]. Elsayed et al. [33] validated the effectiveness of integrating infrared thermal imaging and hyperspectral sensor data for predicting winter wheat yield using linear regression and partial least squares methods. Wang et al. [34] combined unmanned aerial vehicle (UAV) multispectral and thermal image data to construct effective water content (EWC) prediction models for different growth stages of winter wheat based on gradient boosting decision tree algorithms. The current data fusion techniques and frameworks mainly combine raw data from multiple sensors, which is not ideal for current research [35]. However, application model averaging techniques provide an additional solution that uses the information previously collected by each sensor separately for fusion [36]. The model averaging algorithm was first proposed by Granger and Ramanathan [37] and has been used to mine useful information from multi-sensor data for predicting soil properties [36,38]. Although simple, this method is as efficient as more complex data fusion methods [38]. Currently, the majority of model averaging algorithms focus on XRF and visible near-infrared data fusion [16,39]. Meanwhile, research on the integration of thermal images and multispectral or hyperspectral data mainly focuses on extracting raw canopy temperatures and spectral reflectance data to construct new vegetation indices to improve prediction accuracy, lacking deeper data mining [40]. Therefore, the combination of CWT with SPA is used to analyze the hyperspectral data, while the GRA algorithm is used to integrate the thermal image information to improve the accuracy of predicting the water content of winter wheat.
Although wheat is a medium–high drought-tolerant crop, it can also be affected by extreme or intermittent drought stress during the reproductive or nutritional growth stages, which can eventually lead to yield loss. Considering the expected future trend in global warming, wheat growth is increasingly affected by drought as well as water scarcity; therefore, quick monitoring of its water deficits can help mitigate losses through remote sensing technology. The major objectives of this study were to (1) analyze the responses of winter wheat canopy temperature parameters and spectral parameters under five water treatments; (2) screen the hyperspectral sensitive spectral bands by using continuous wavelet transform (CWT) and a successive projection algorithm (SPA); and (3) establish the canopy water content prediction model by fusing the results of the model based on the characteristic spectrum and canopy temperature parameters using the GRA algorithm.

2. Materials and Methods

2.1. Experimental Conditions and Field Design

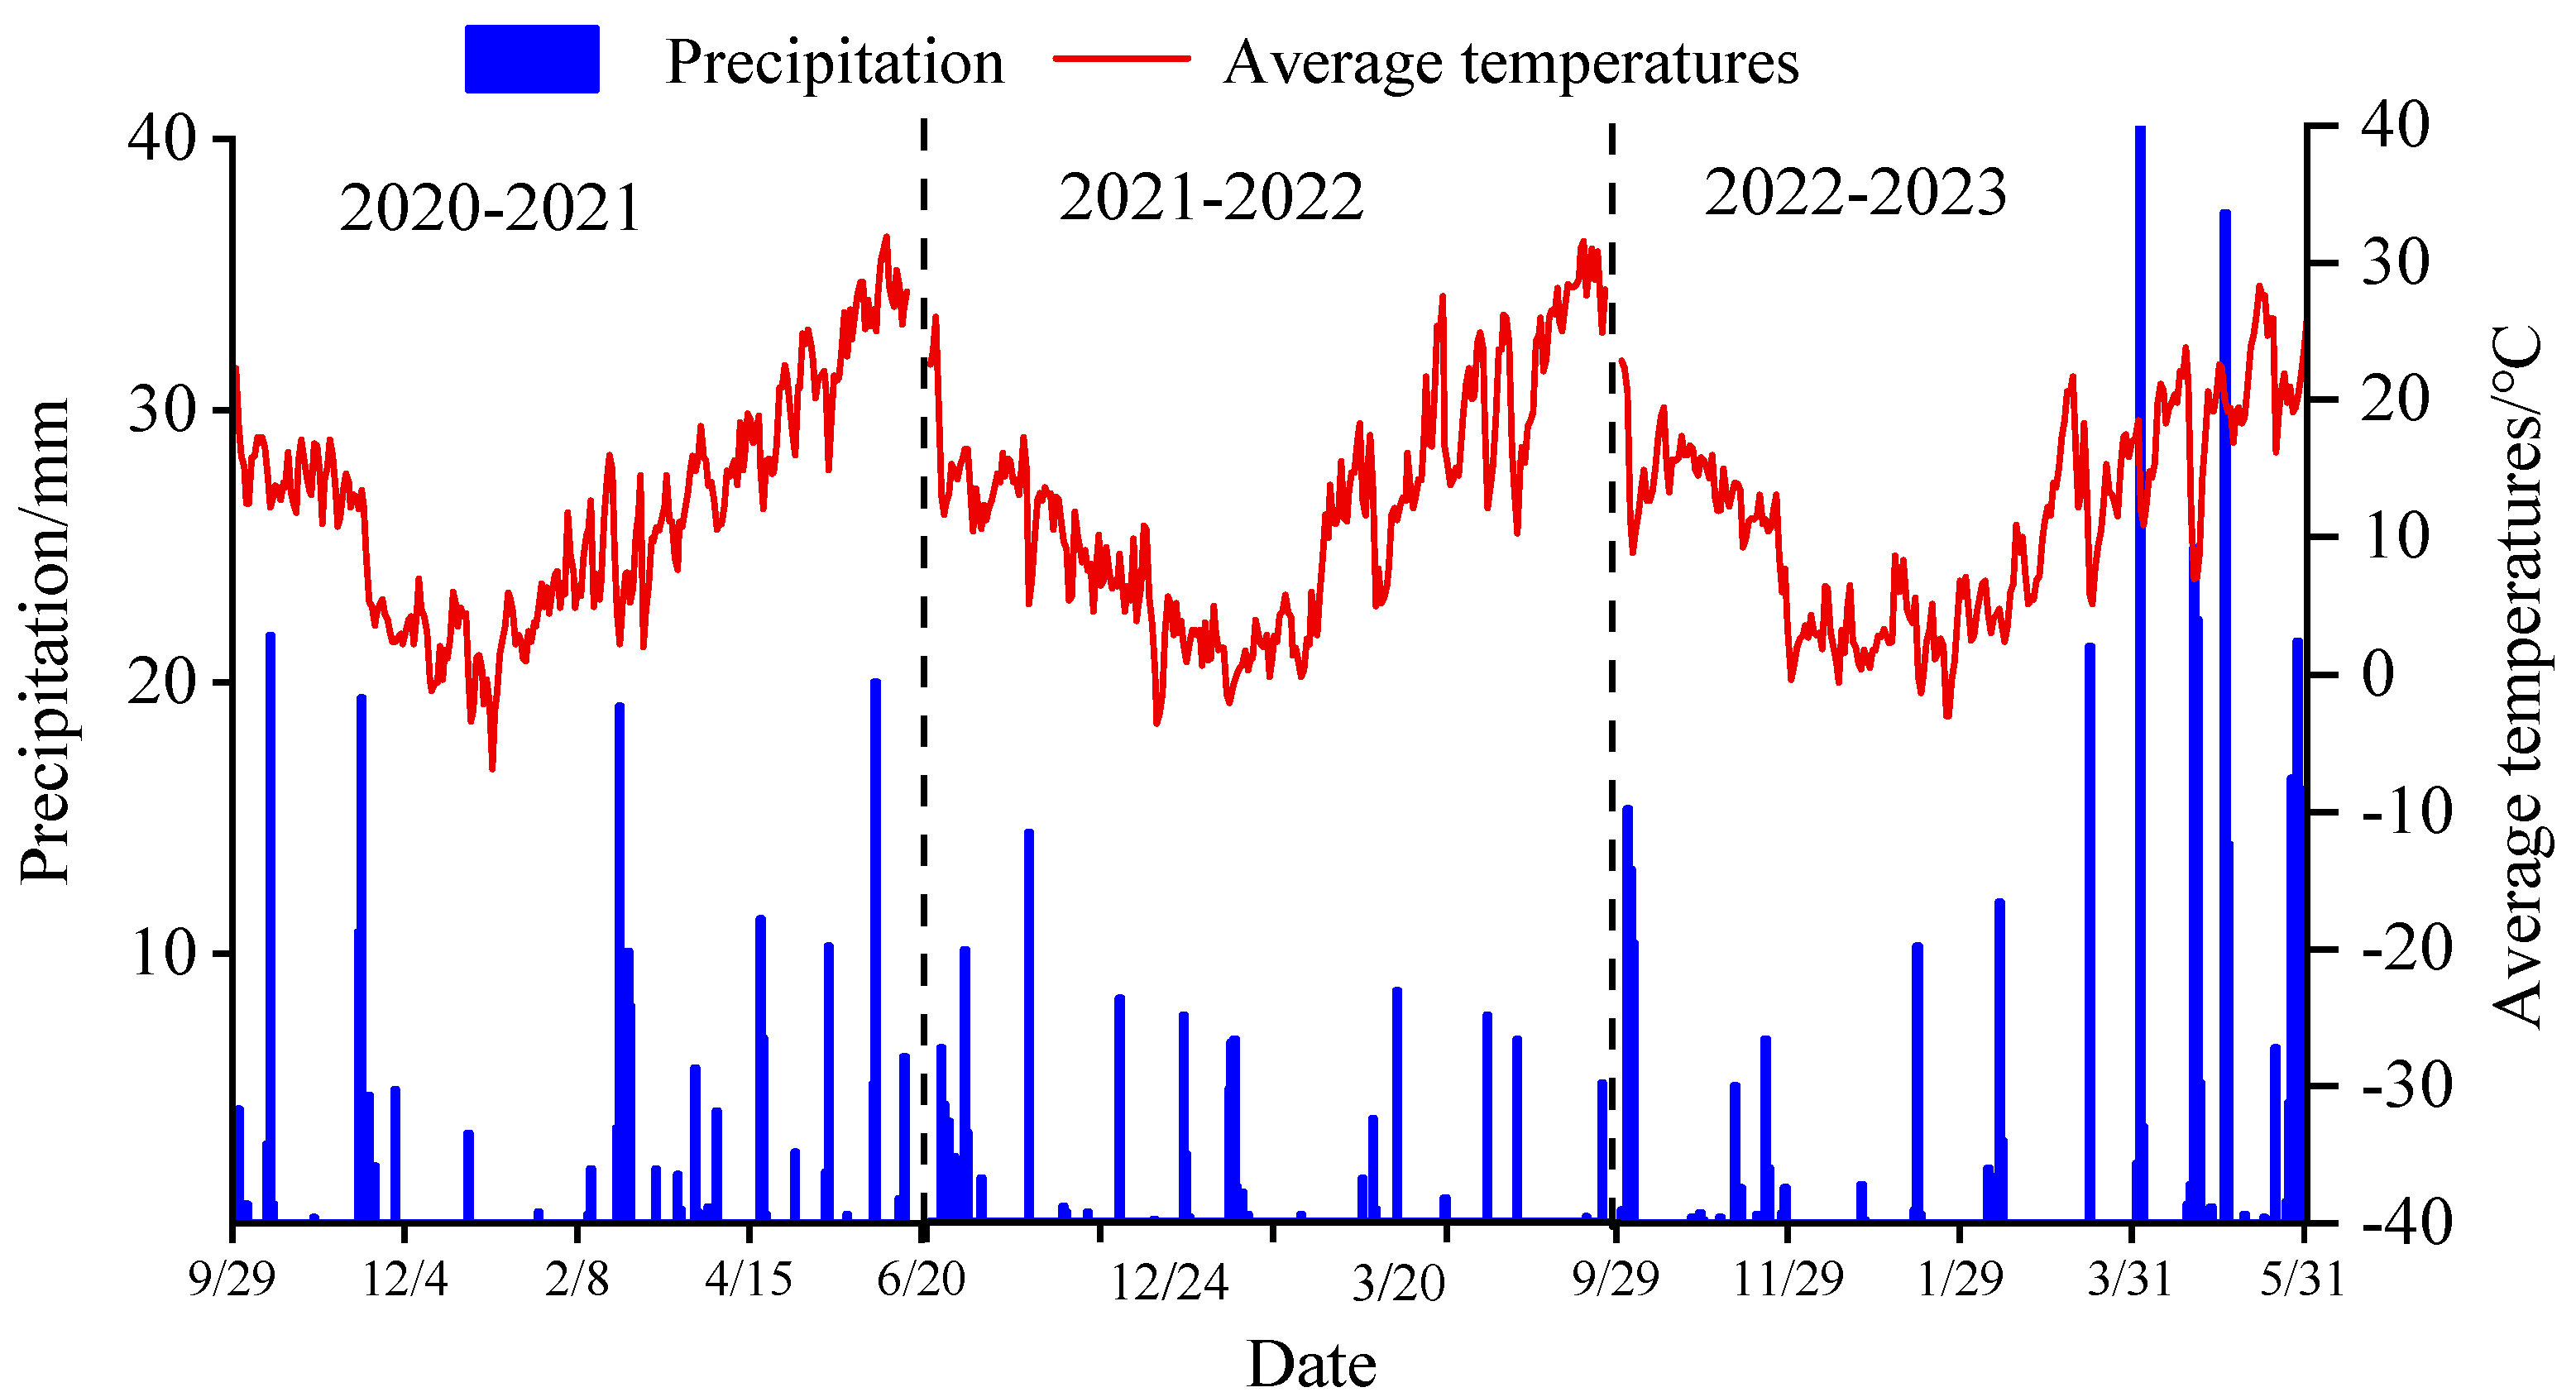
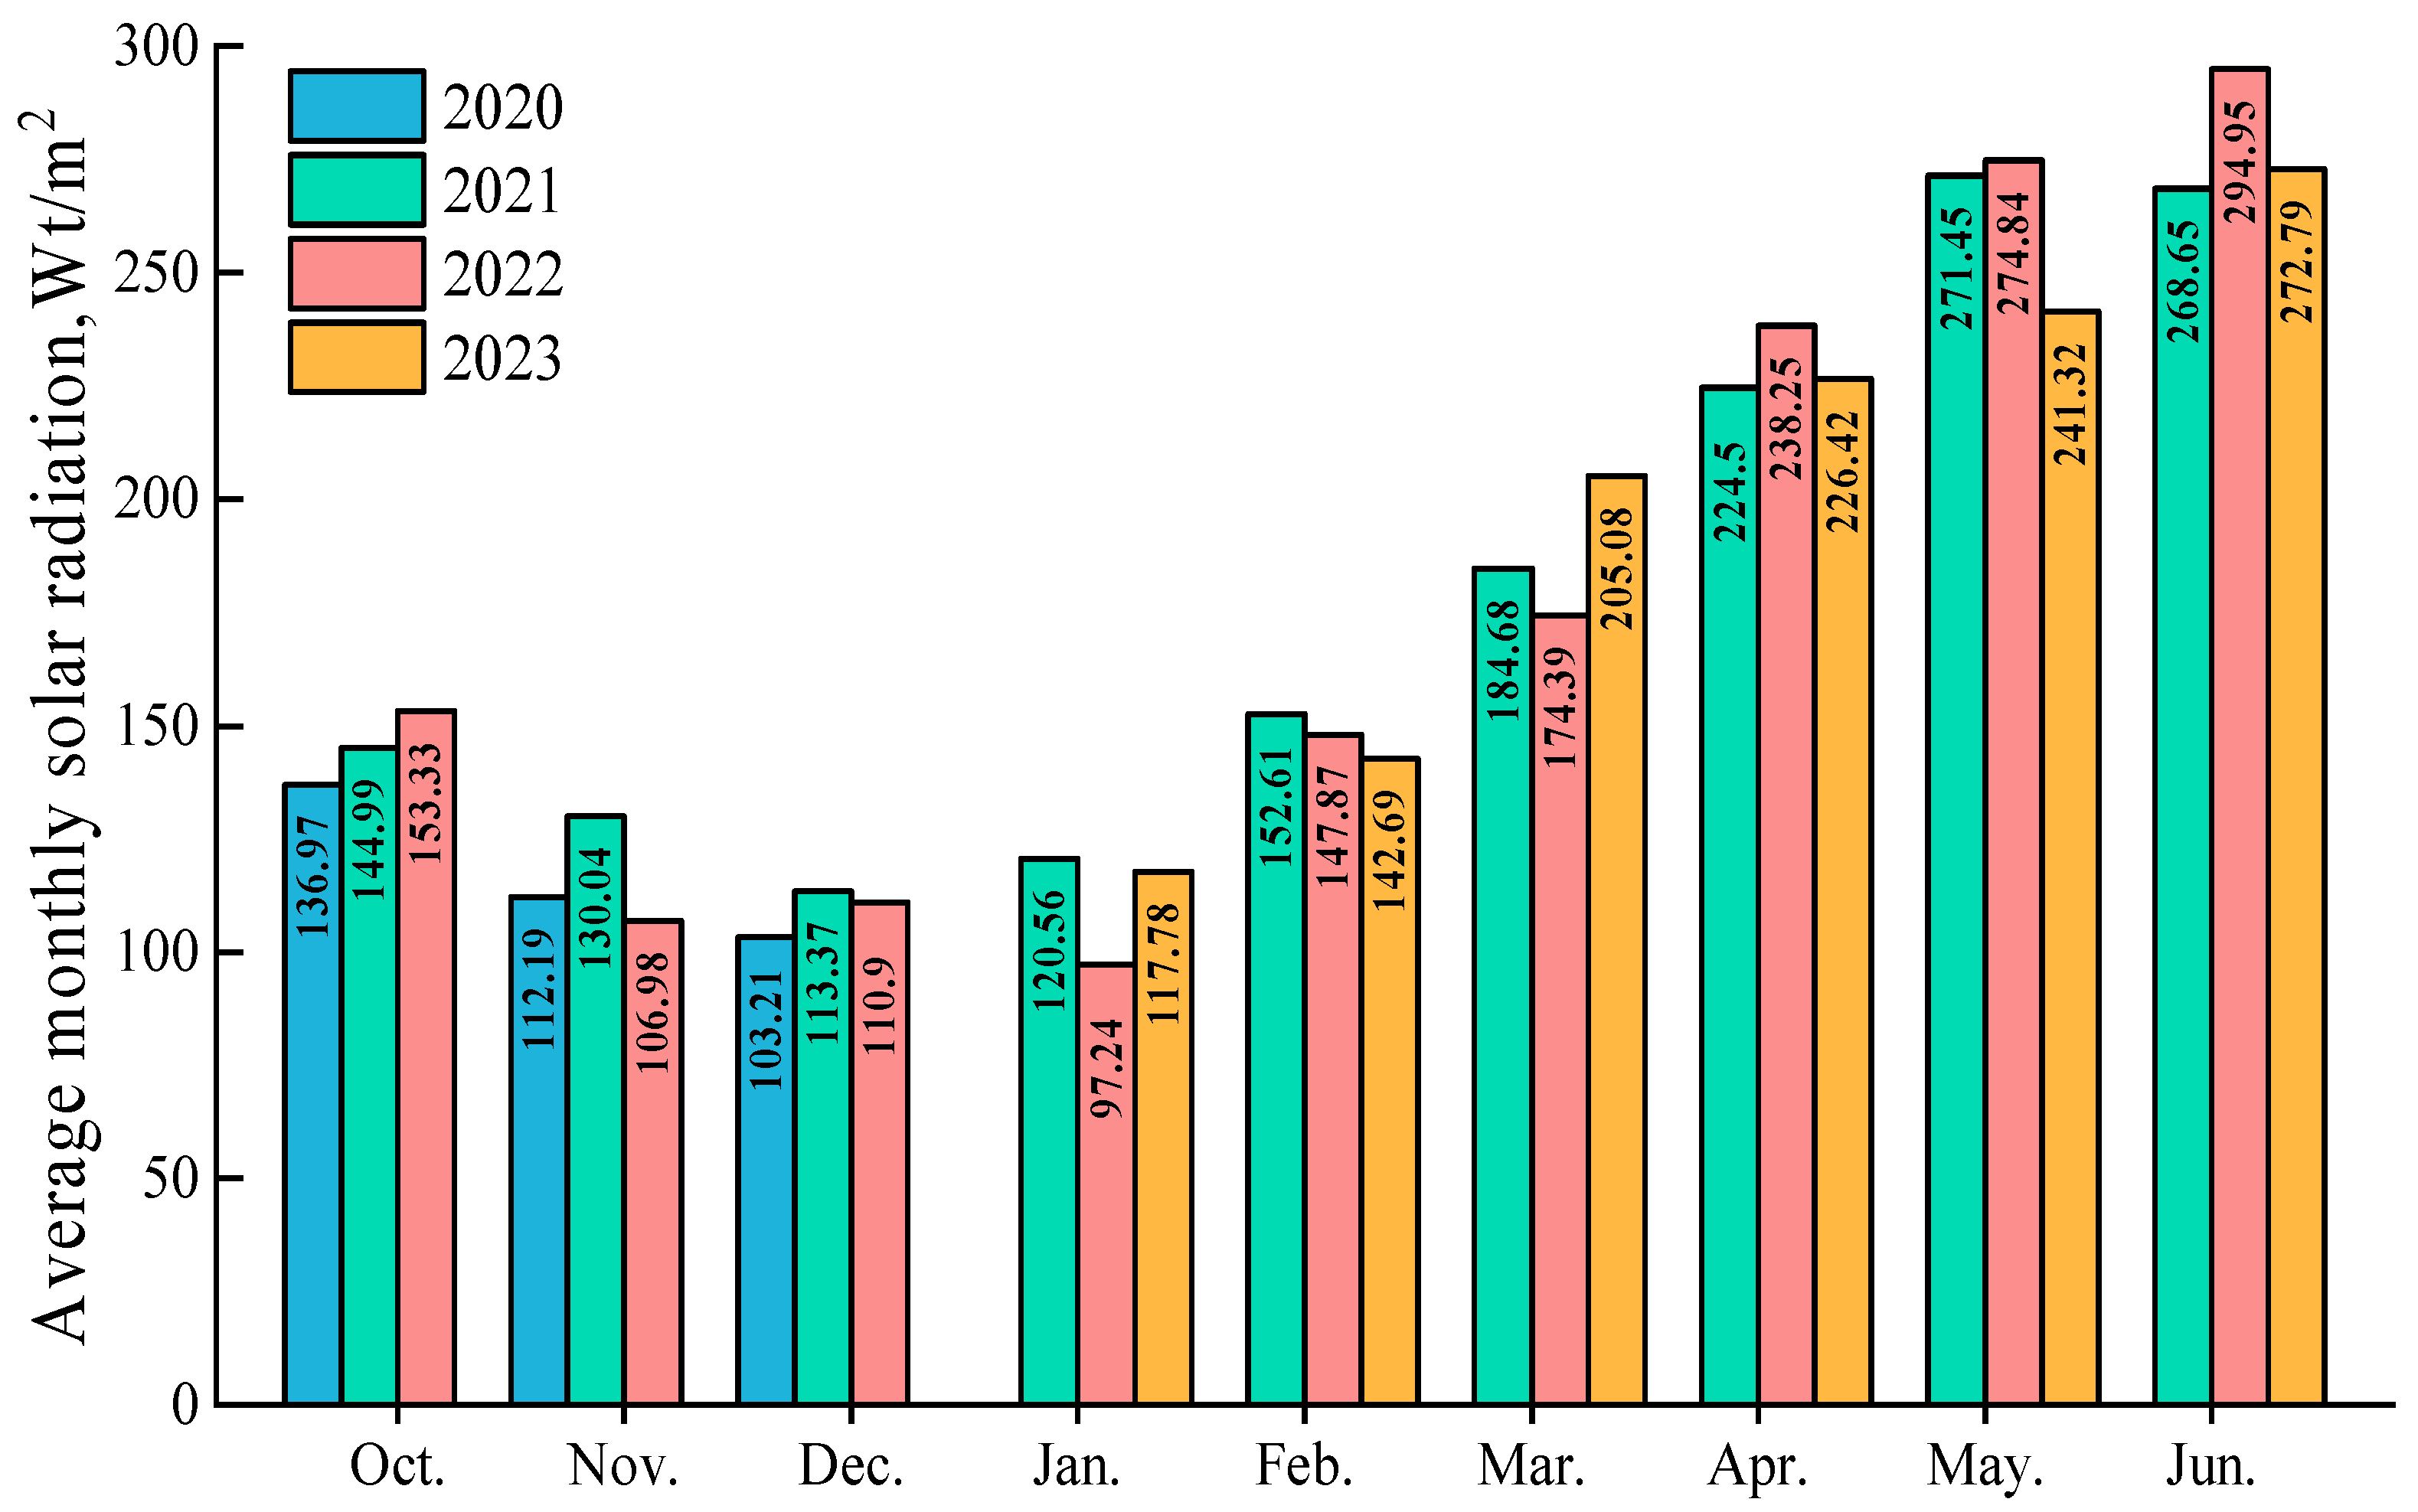
Field experiments were conducted for three consecutive years from 2020 to 2023 at Maozhuang Farm (34°47′ N, 113°38′ E) in the Education Park of Henan Agricultural University (Figure 1). The study site is located in a warm monsoon climate zone, with an average annual temperature of 15.2 °C and an annual rainfall of 640 mm. The rainfall, average temperature, and average monthly solar radiation for the three experimental years are shown in Figure 2 and Figure 3. The soil in the 0–30 cm layer of the experimental plot was sandy loam, with a bulk density of 1.31 g·cm−3. Soil organic matter, total nitrogen, available phosphorus, and available potassium were 12.3 g·kg−1, 1.05 g·kg−1, 13.45 mg·kg−1, and 120.5 mg·kg−1, respectively.
Five irrigation treatments were set up: rain-fed (R); flood irrigation (F); drip irrigation (W1): 40~50% Field Capacity (FC); drip irrigation (W2): 60~70% Field Capacity (FC); and drip irrigation (W3): 80~100% Field Capacity (FC). A water meter (nominal diameter: 15 mm) was used to control the applied water for each irrigation level. All treatments were given in three replicates and all plot sizes were 6.6 m2 (3 m × 2.2 m). To prevent water from seeping out laterally, 13 × 5 cm wall tiles are used around each plot. Irrigation was applied once during the jointing stage of the three-year experiment. The irrigation amounts for treatments R, F, W1, W2, and W3 were 0 mm, 96 mm, 35 mm, 48 mm, and 68 mm, respectively. The characteristics of the experimental varieties and field management are shown in Table 1. Before seeding, the soil was flipped and compound fertilizer was added, with N-P2O5-K2O (18%-18%-18%) 750 kg·hm−2, and all treatments received 225 kg·N·hm−2 of nitrogen fertilizer at the jointing stage. Other management, such as pest and disease control, and herbicide application, followed local standard practices in winter wheat production.

2.2. Data Measurements

2.2.1. Measurement of Canopy Hyperspectral Data

Hyperspectral data were collected using a portable spectroradiometer (FieldSpec Handheld 2, Analytical Spectral Devices, Boulder, CO, USA) with a field of view of 25° and a distance of about 1 m above the ground surface. The measurements were meticulously carried out under clear skies with windless conditions between 11:00 and 12:00. Reflectance spectra were derived through calibration with the 99% white reference board (Labsphere, Inc., North Sutton, NH, USA). Three sample points were selected for repeated measurements in each test plot, 10 spectral curves were measured at each sample point, and these values were averaged to obtain the canopy spectral reflectance for the repeated measurements.

2.2.2. Acquisition of Canopy Temperature Parameters

A FLIR T650sc thermal infrared camera (FLIR Systems, Inc., Wilsonville, OR, USA) was used to obtain the canopy temperature images in winter wheat. The thermal infrared image acquired by the instrument has a resolution of 640 × 480 pixels. Images were taken constantly on bright sunny days and under less windy conditions between 11.00 and 12.00 a.m. from a nadir view angle and at a distance of 1.5 m above the crop canopy. Every pixel in the image was exported to Excel (2019) using the thermal imager’s FLIR Tools (5.6.16078.1002) image analysis software (FLIR Systems, Inc., Wilsonville, OR, USA). Data were processed using Excel’s data analysis and statistical histogram analysis loading module. The exported pixel temperature points were filtered and counted to obtain the number of points occupied by different temperature values according to the known plant temperature threshold. Different canopy temperature-based stress indices namely canopy temperature depression (CTD), normalized relative canopy temperature (NRCT), stomatal conductance index (IG), and average canopy temperature (TAV) were used to assess the wheat crop status under different water stress conditions using the formula mentioned below (Table 2).

2.2.3. Determination of Canopy Water Content

Representative plants in a single row of 20 cm were selected from each plot, replicated twice, and immediately wrapped in freshness-retaining film. This was carried out in conjunction with the collection of hyperspectral data and thermal infrared images of winter wheat. The plants were taken to the laboratory to weigh the fresh weight, then put in the oven at 105 °C for 30 min, and dried at 80 °C to constant weight; the dry weight was weighed, and the canopy water content (CWC) was calculated [44]. The formula for calculating the canopy water content is as follows:
CWC (%) = (CWF − CWD)/CWF × 100
where CWF is the total fresh weight of each part of the plant, and CWD is the total dry weight of each part of the plant.

2.2.4. Continuous Wavelet Transform

In this study, the continuous wavelet transform is used to decompose the hyperspectral data using wavelet basis functions to obtain a series of wavelet coefficients at different scales. The wavelet coefficients contain two dimensions, i.e., decomposition scale (i = 1, 2, …, m) and band (j = 1, 2, …, n). Therefore, the one-dimensional hyperspectral reflectance is converted into two-dimensional wavelet coefficients by continuous wavelet transform. The formula is as follows:
W f a , b = - + f λ ψ a , b ( λ ) d λ
ψ a , b λ = 1 a ψ ( λ - b a )
where Wf(a,b) is the wavelet coefficient; f(λ) is the hyperspectral reflectance, λ is the spectral band of 350–2500 nm, and ψa,b(λ) is the wavelet basis function transformed by the scaling factor a and the stretching factor b. In this study, the original spectral data are subjected to a continuous wavelet transform using the Gaus1 wavelet function. In order to reduce the redundancy of the data, the decomposition scales of the continuous wavelet transform are set as 21, 22…210, corresponding to 1~10 scales [25].

2.2.5. Successive Projection Algorithm

The successive projection algorithm (SPA) is a forward variable selection technique that reduces collinearity in the vector space [30]. The SPA works in two phases. In the first phase, candidate wavelength subsets were identified. In the second phase, the best wavelength subset that minimized the cost function without compromising accuracy was selected [45]. The exact algorithm and meaning are described in detail in reference [20].

2.2.6. GRA Data Fusion Algorithm

In this study, the GRA algorithm is used to fuse the estimation results based on single-sensor hyperspectral (HS) and thermal imaging (TI) to achieve a more accurate, simple, and effective CWC prediction model. The formula is as follows:
Y = W 0 + W HS   ×   X HS + ( W TI   ×   X TI )
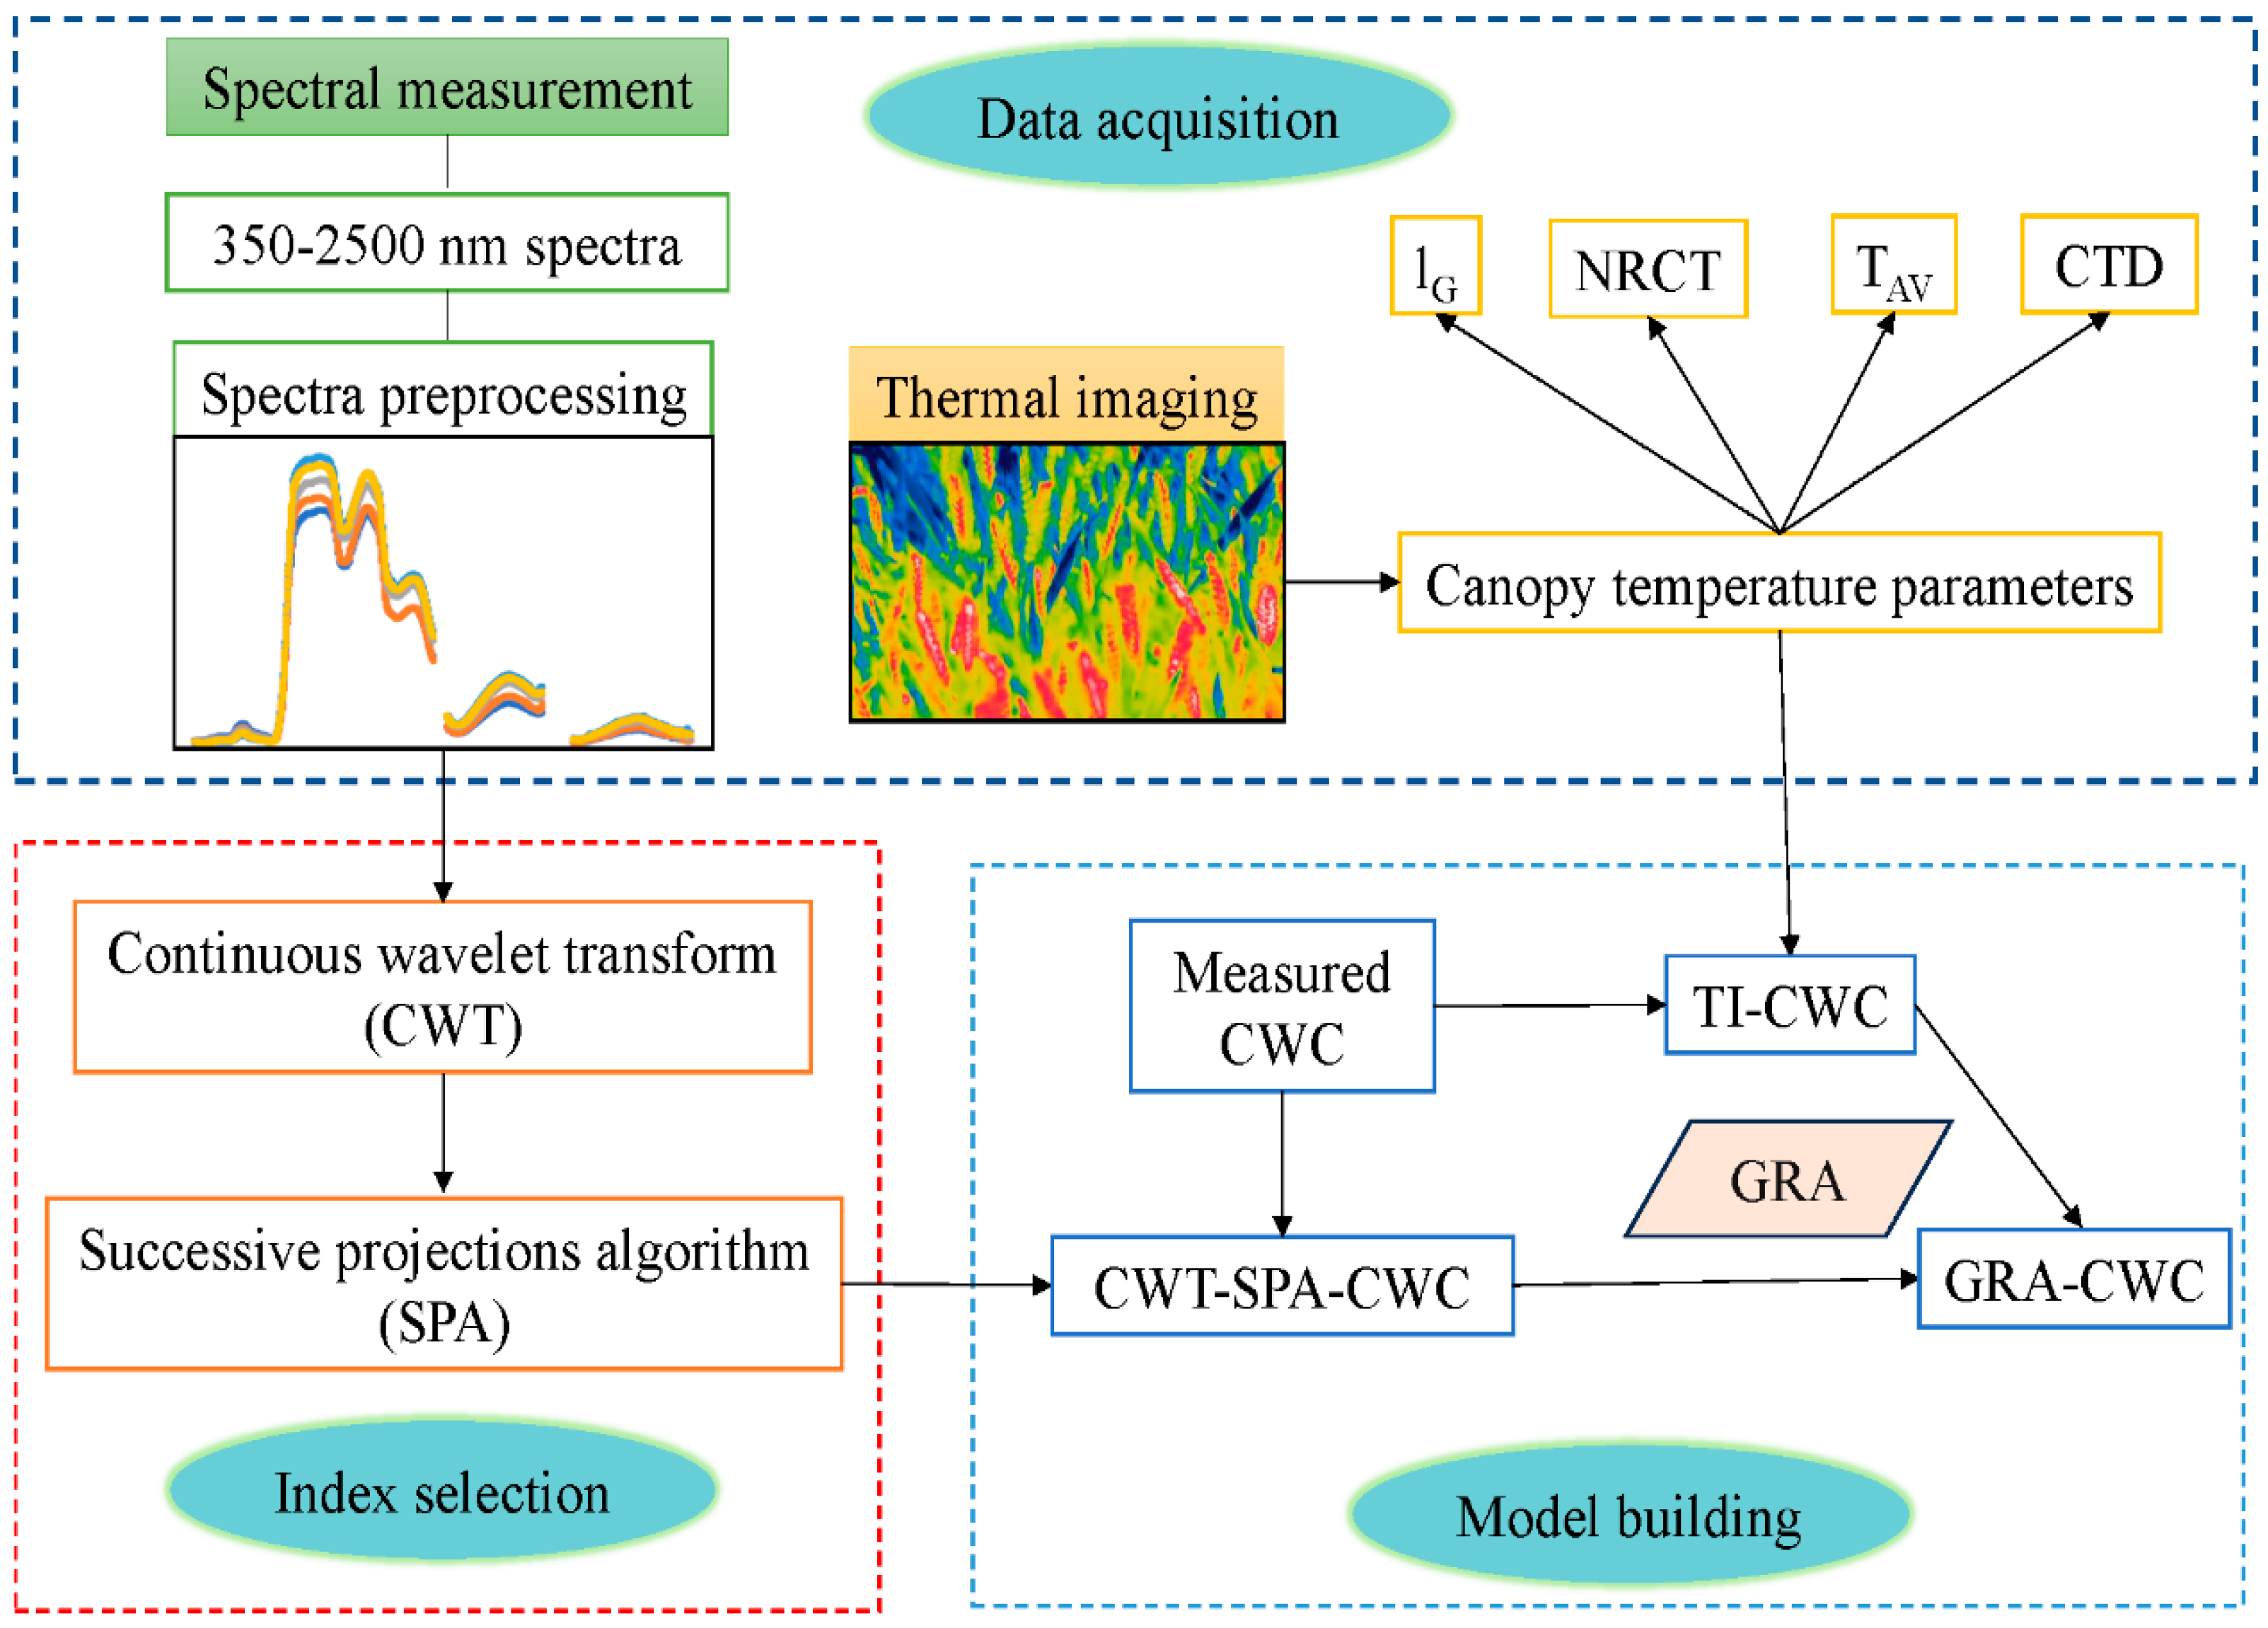
where Y is the independent variable (canopy water content, CWC), XHS and XHI are the independent variables (canopy water content estimation results based on HS and TI), WHS and WTI are the weights of HS and TI estimation results, respectively, and W0 is the intercept. The process of using the GRA algorithm to fuse hyperspectral and thermal imaging information is shown in Figure 4.

2.3. Data Analysis

The statistical analysis and regression models were executed using Excel 2019 (Microsoft Inc., Seattle, WA, USA) and Origin 2021 (Origin Lab Corporation, Northampton, MA, USA). The PLSR algorithm was implemented in the R Studio environment. CWT and the SPA were calculated in a MATLAB R2018b (The MathWorks Inc., Natick, MA, USA) environment. Two-thirds (n = 180) of the data at each growth stage of the jointing stage, booting stage, and filling stage were used as modeling data, and one-third (n = 90) of the data were used as validation data. The performance evaluation of the model was conducted using the coefficient of determination (R2), root mean square error (RMSE), and relative RMSE (nRMSE). Higher R2 and lower RMSE and nRMSE represent better prediction accuracy. A scatter plot of 1:1 was drawn to intuitively demonstrate the fit and reliability of the models.

3. Results

3.1. Effect of Different Water Treatments on Canopy Temperature Parameters in Winter Wheat

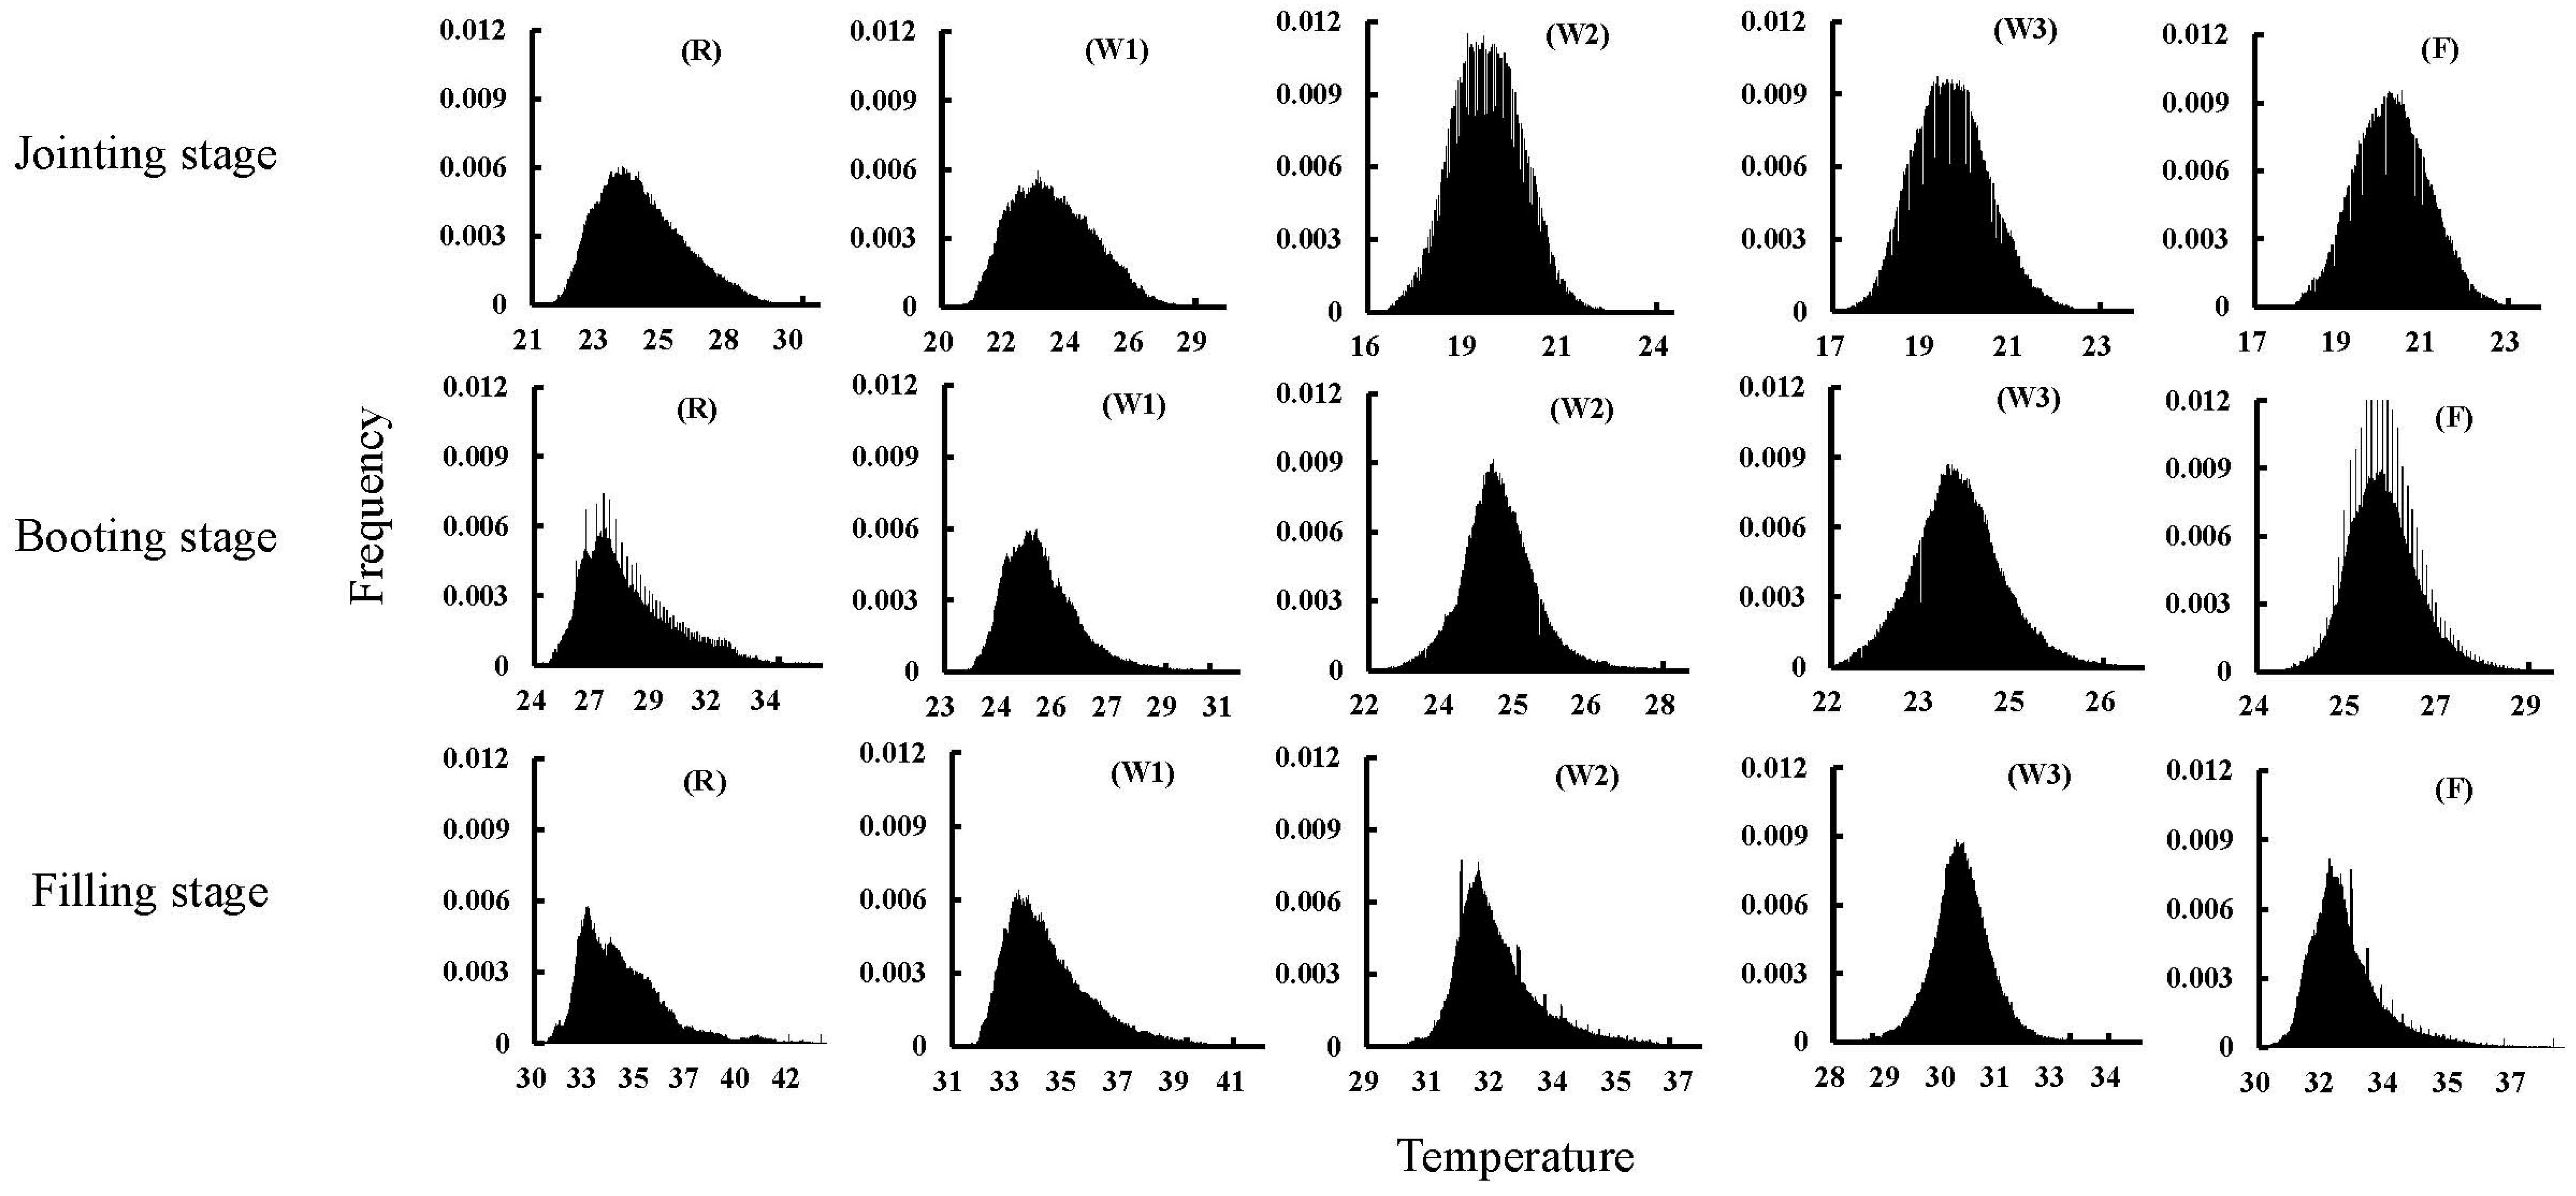
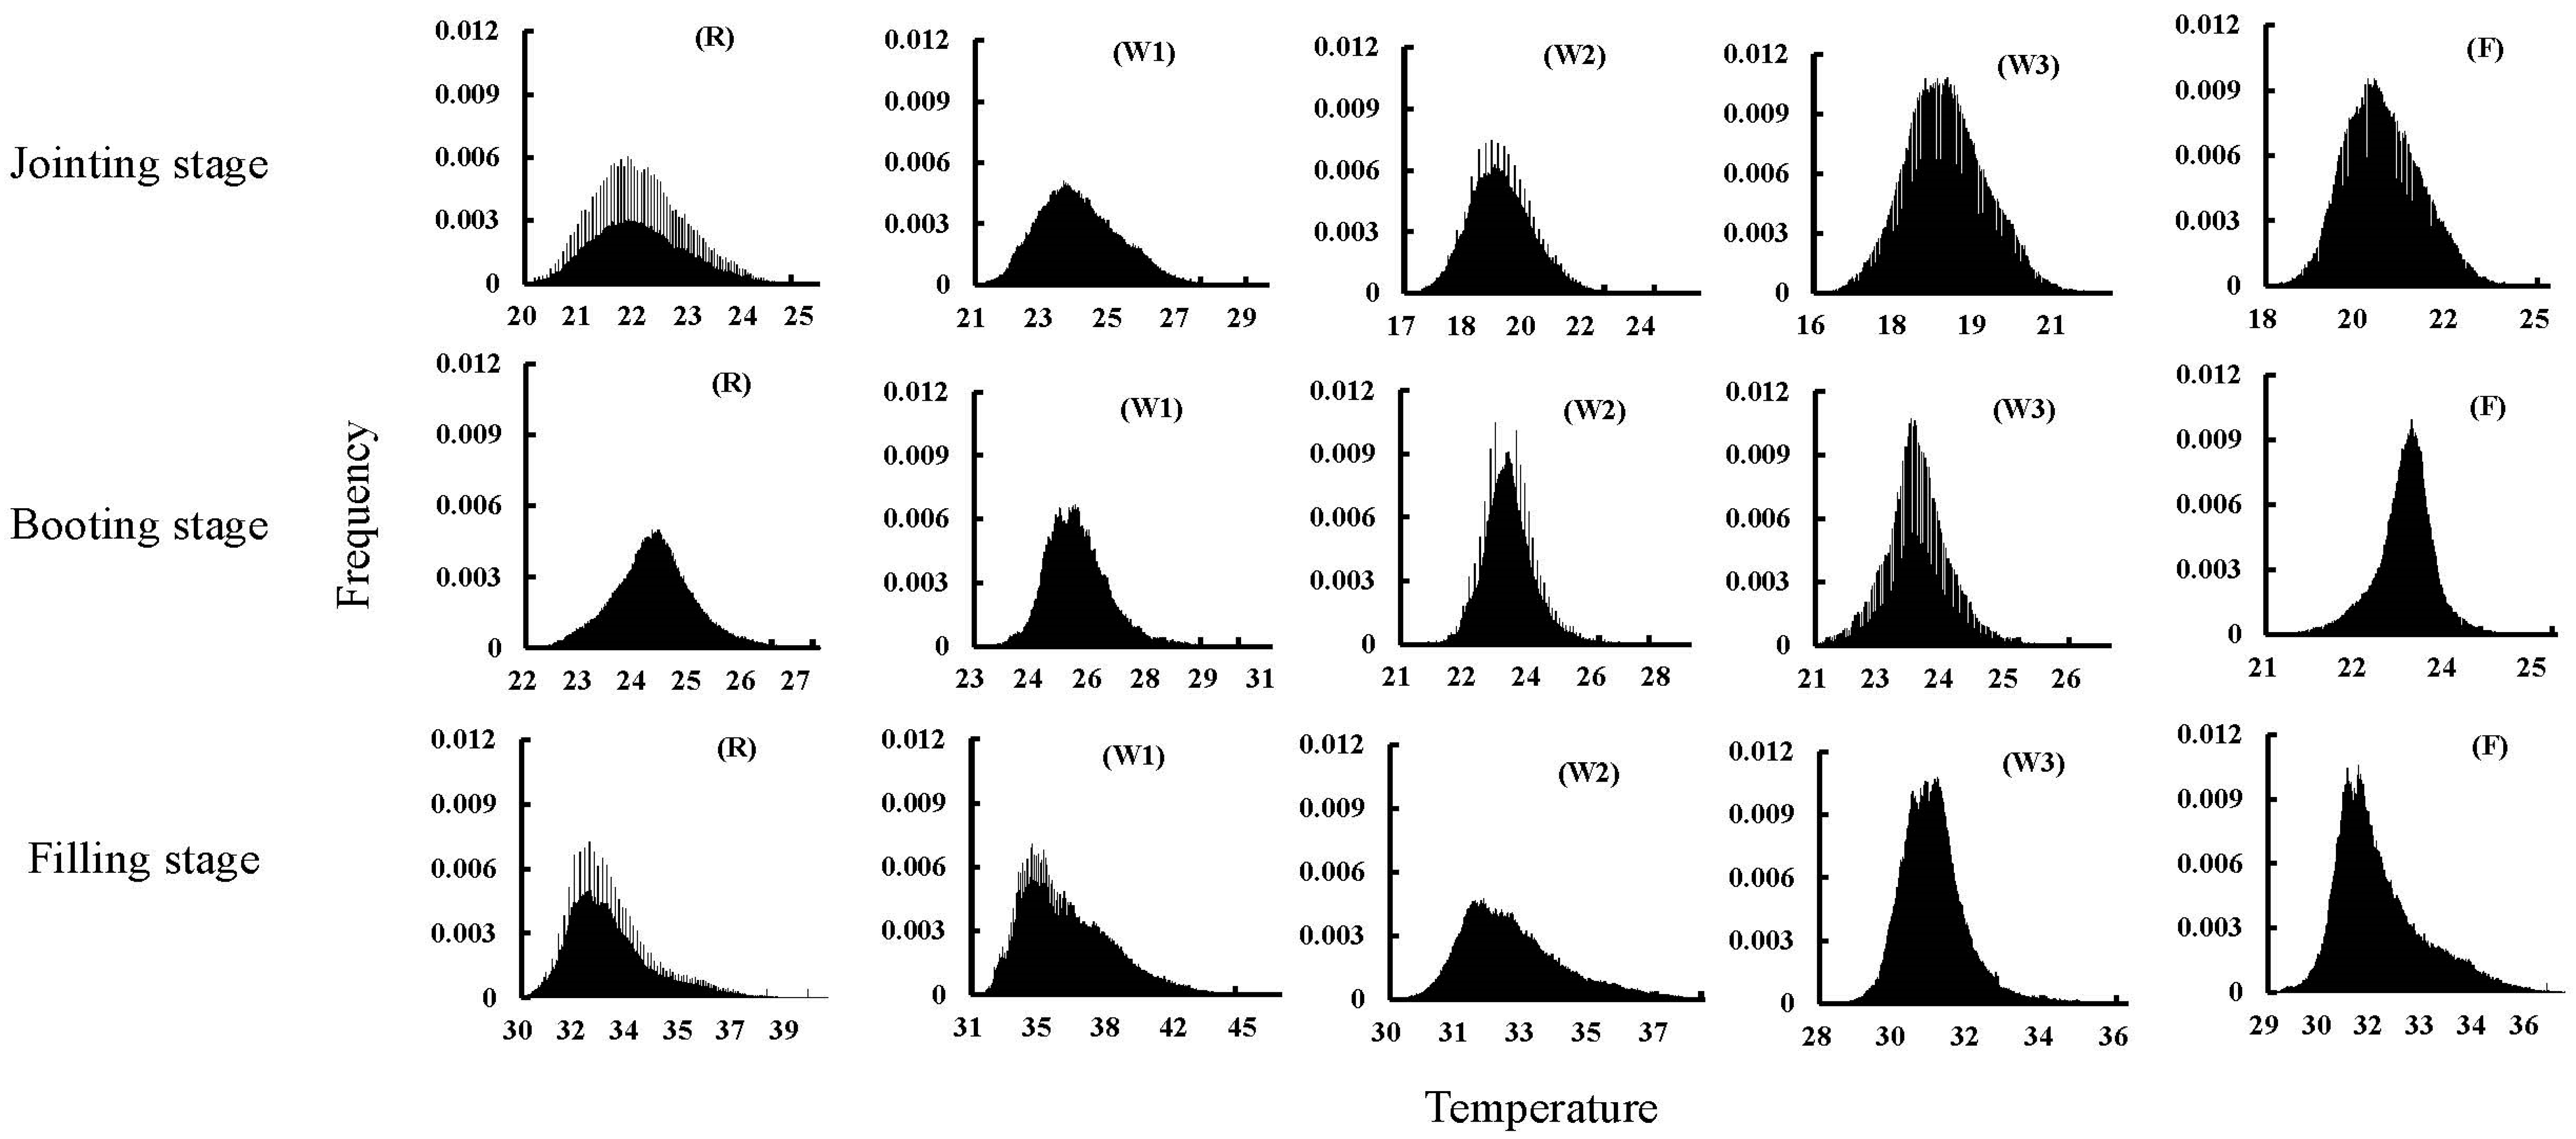
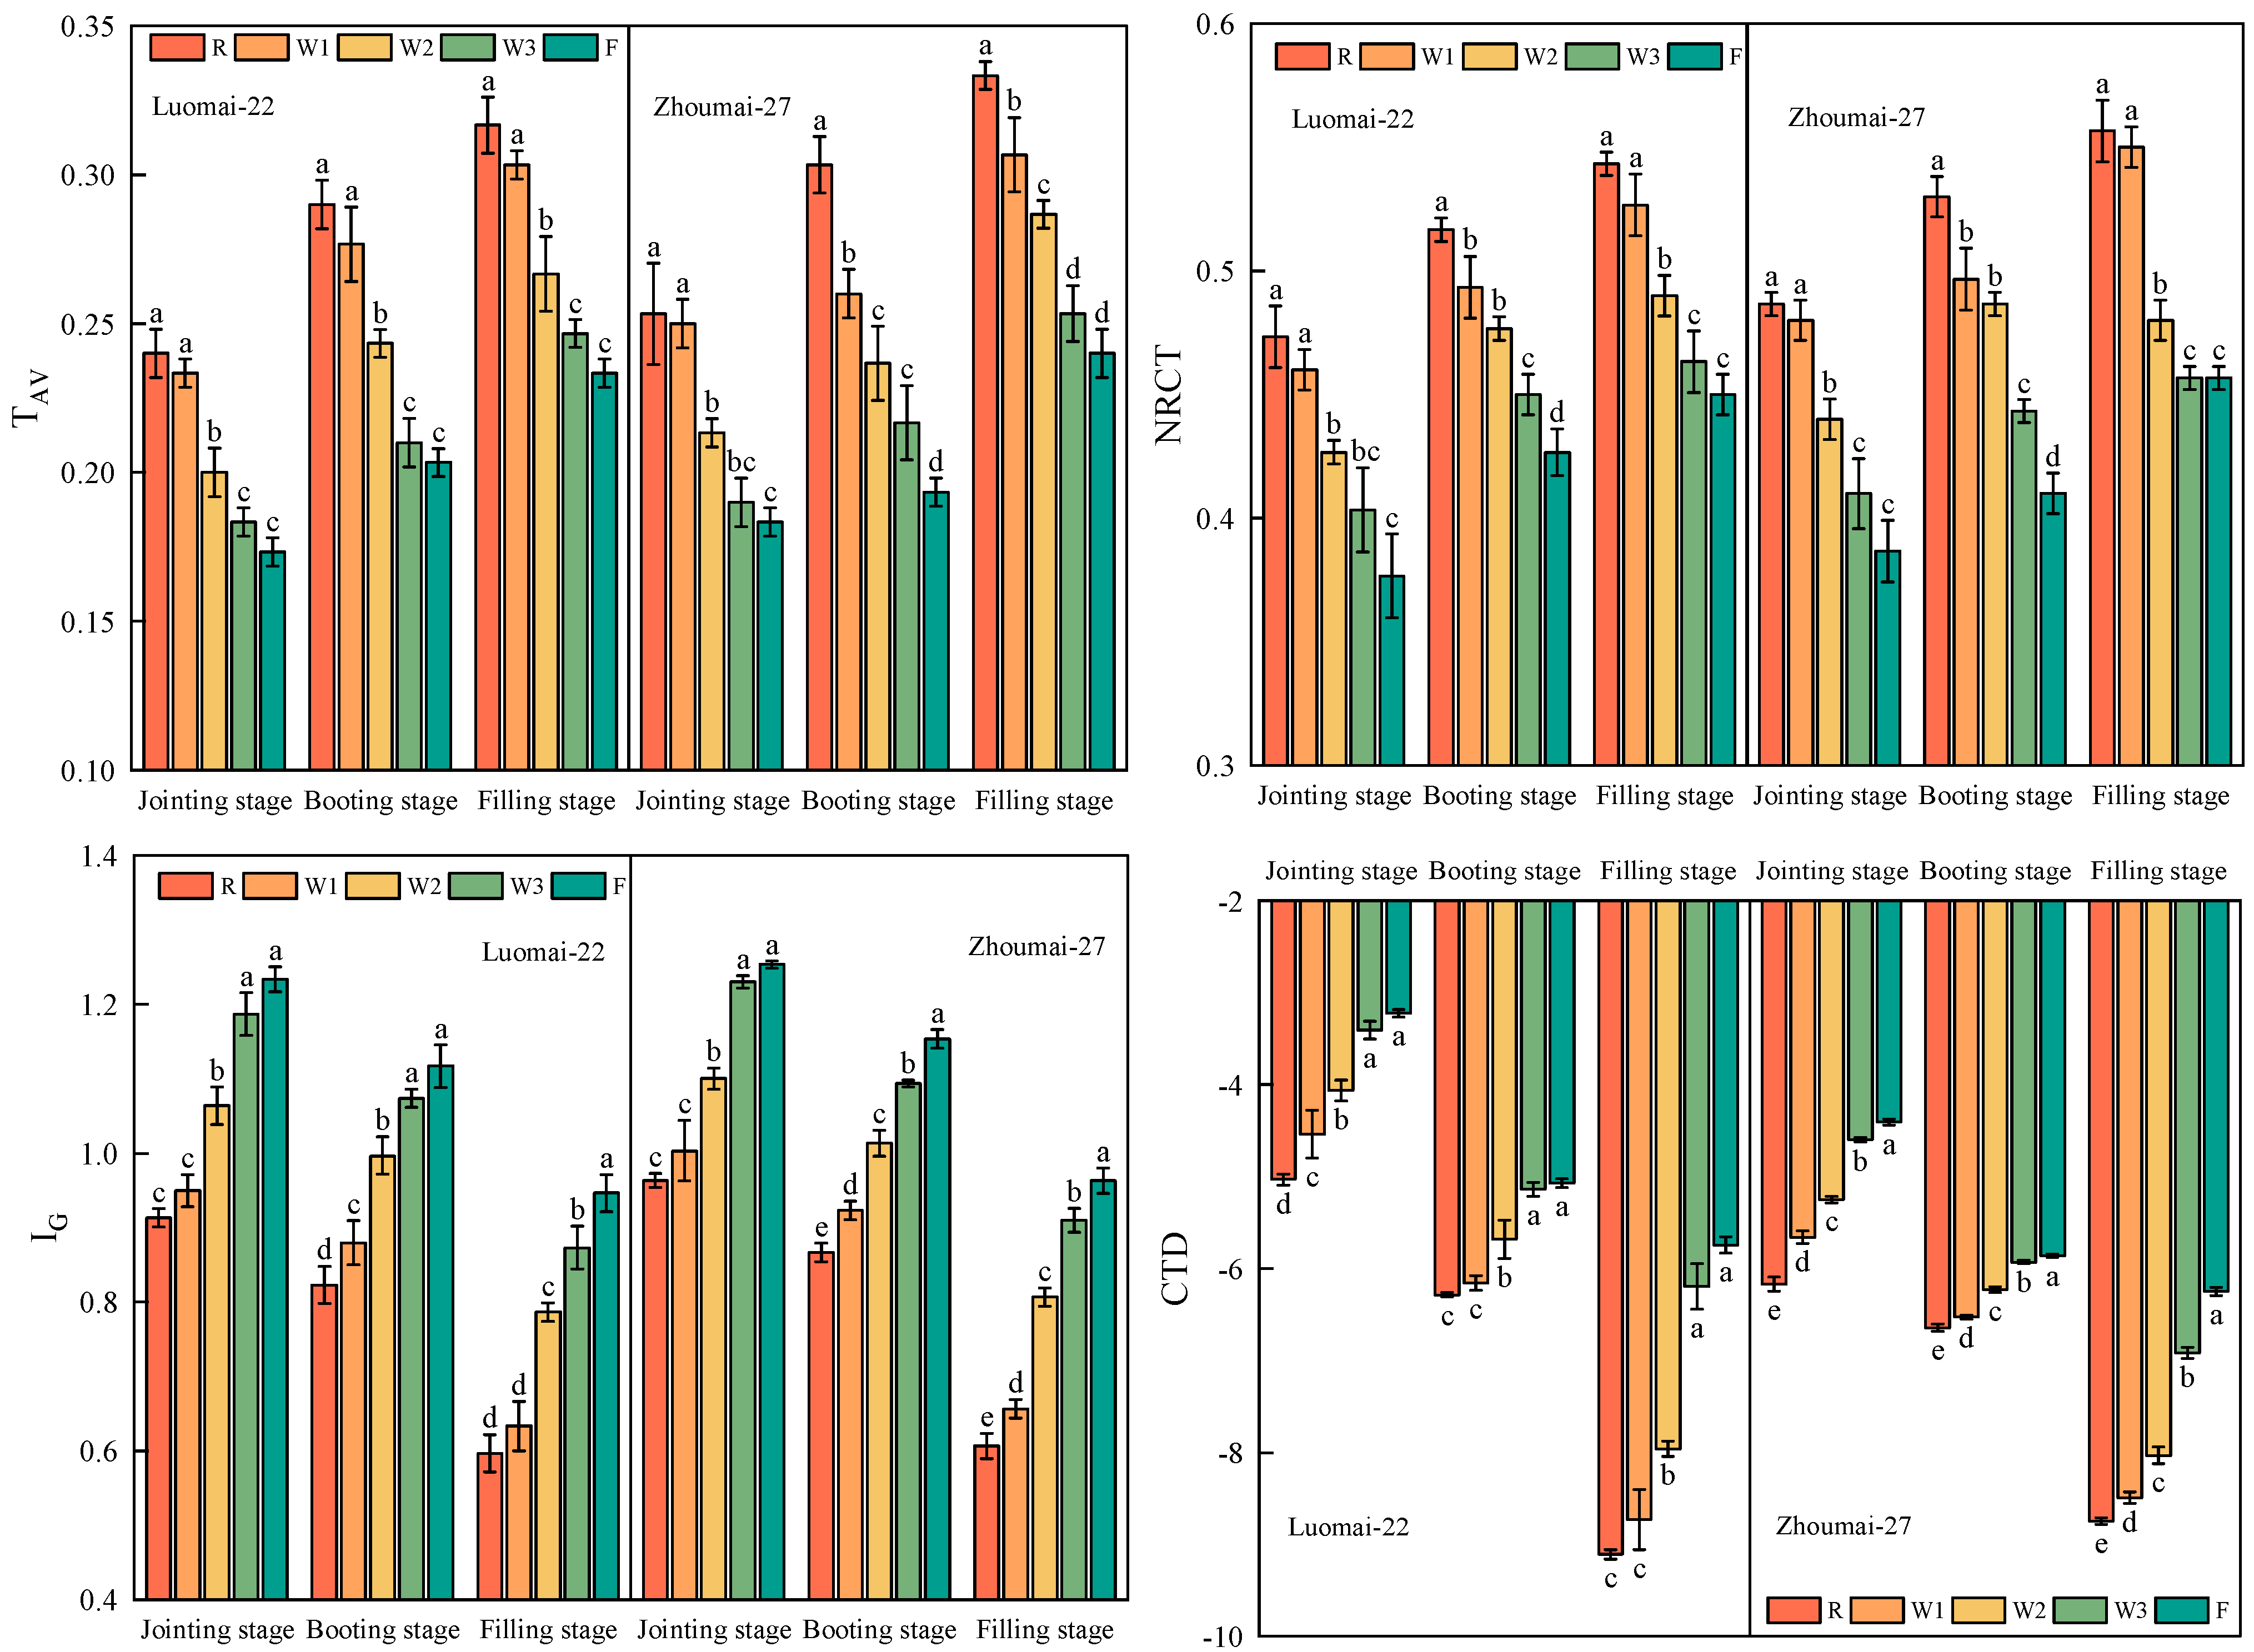
Distinct variations in the canopy temperature distribution of the wheat crop were obtained from thermal images at the jointing, booting, and filling stages under different water stress conditions. The canopy temperature frequency histograms were plotted under different water treatments (Figure 5 and Figure 6). It showed an overall single-peak skewed distribution pattern. The main pixels of the canopy temperature frequency histograms were concentrated in the middle of the histograms. With an increase in the water stress, the frequency distribution of the thermal image-based canopy temperature showed a shift towards a higher temperature range. Due to the errors of the pixel temperatures in the range of intervals before and after the histograms, 0.5–99.5% of the image elements of the canopy temperature histogram were selected as the effective temperature image values for measurement. Different canopy temperature parameters (CTD, IG, NRCT, and TAV) gave a significant response for Luomai-22 and Zhoumai-27 tested in this study under different water deficit treatments during each growth stage (Figure 7). The CTD and IG were significantly reduced by 10.72–20.08% and 6.54–17.76%, respectively, under the water deficit treatment (R, W1, and W2) compared with the control treatment (W3). Compared to the control (W3), NRCT and TAV for R, W1, and W2 treatments in the booting stage were significantly increased by 6.00–9.56% and 15.71–31.90%, respectively.
To avoid the influence of covariance between canopy temperature parameters on the stability of the predictive model construction, the canopy temperature parameters were diagnosed for covariance during modeling, and a variance inflation factor (VIF) value greater than 10 was considered a strong covariance between variables. Table 3 shows that the VIF values of CTD, IG, NRCT, and TAV were 2.933, 5.554, 3.563, and 5.606, respectively, all of which were less than 10, and there was no strong covariance between the four variables. Therefore, the canopy temperature parameters TAV, NRCT, IG, and CTD could well characterize the canopy temperature characteristics of winter wheat under different water treatments.

3.2. Sensitive Band Screening of CWC Based on CWT and SPA

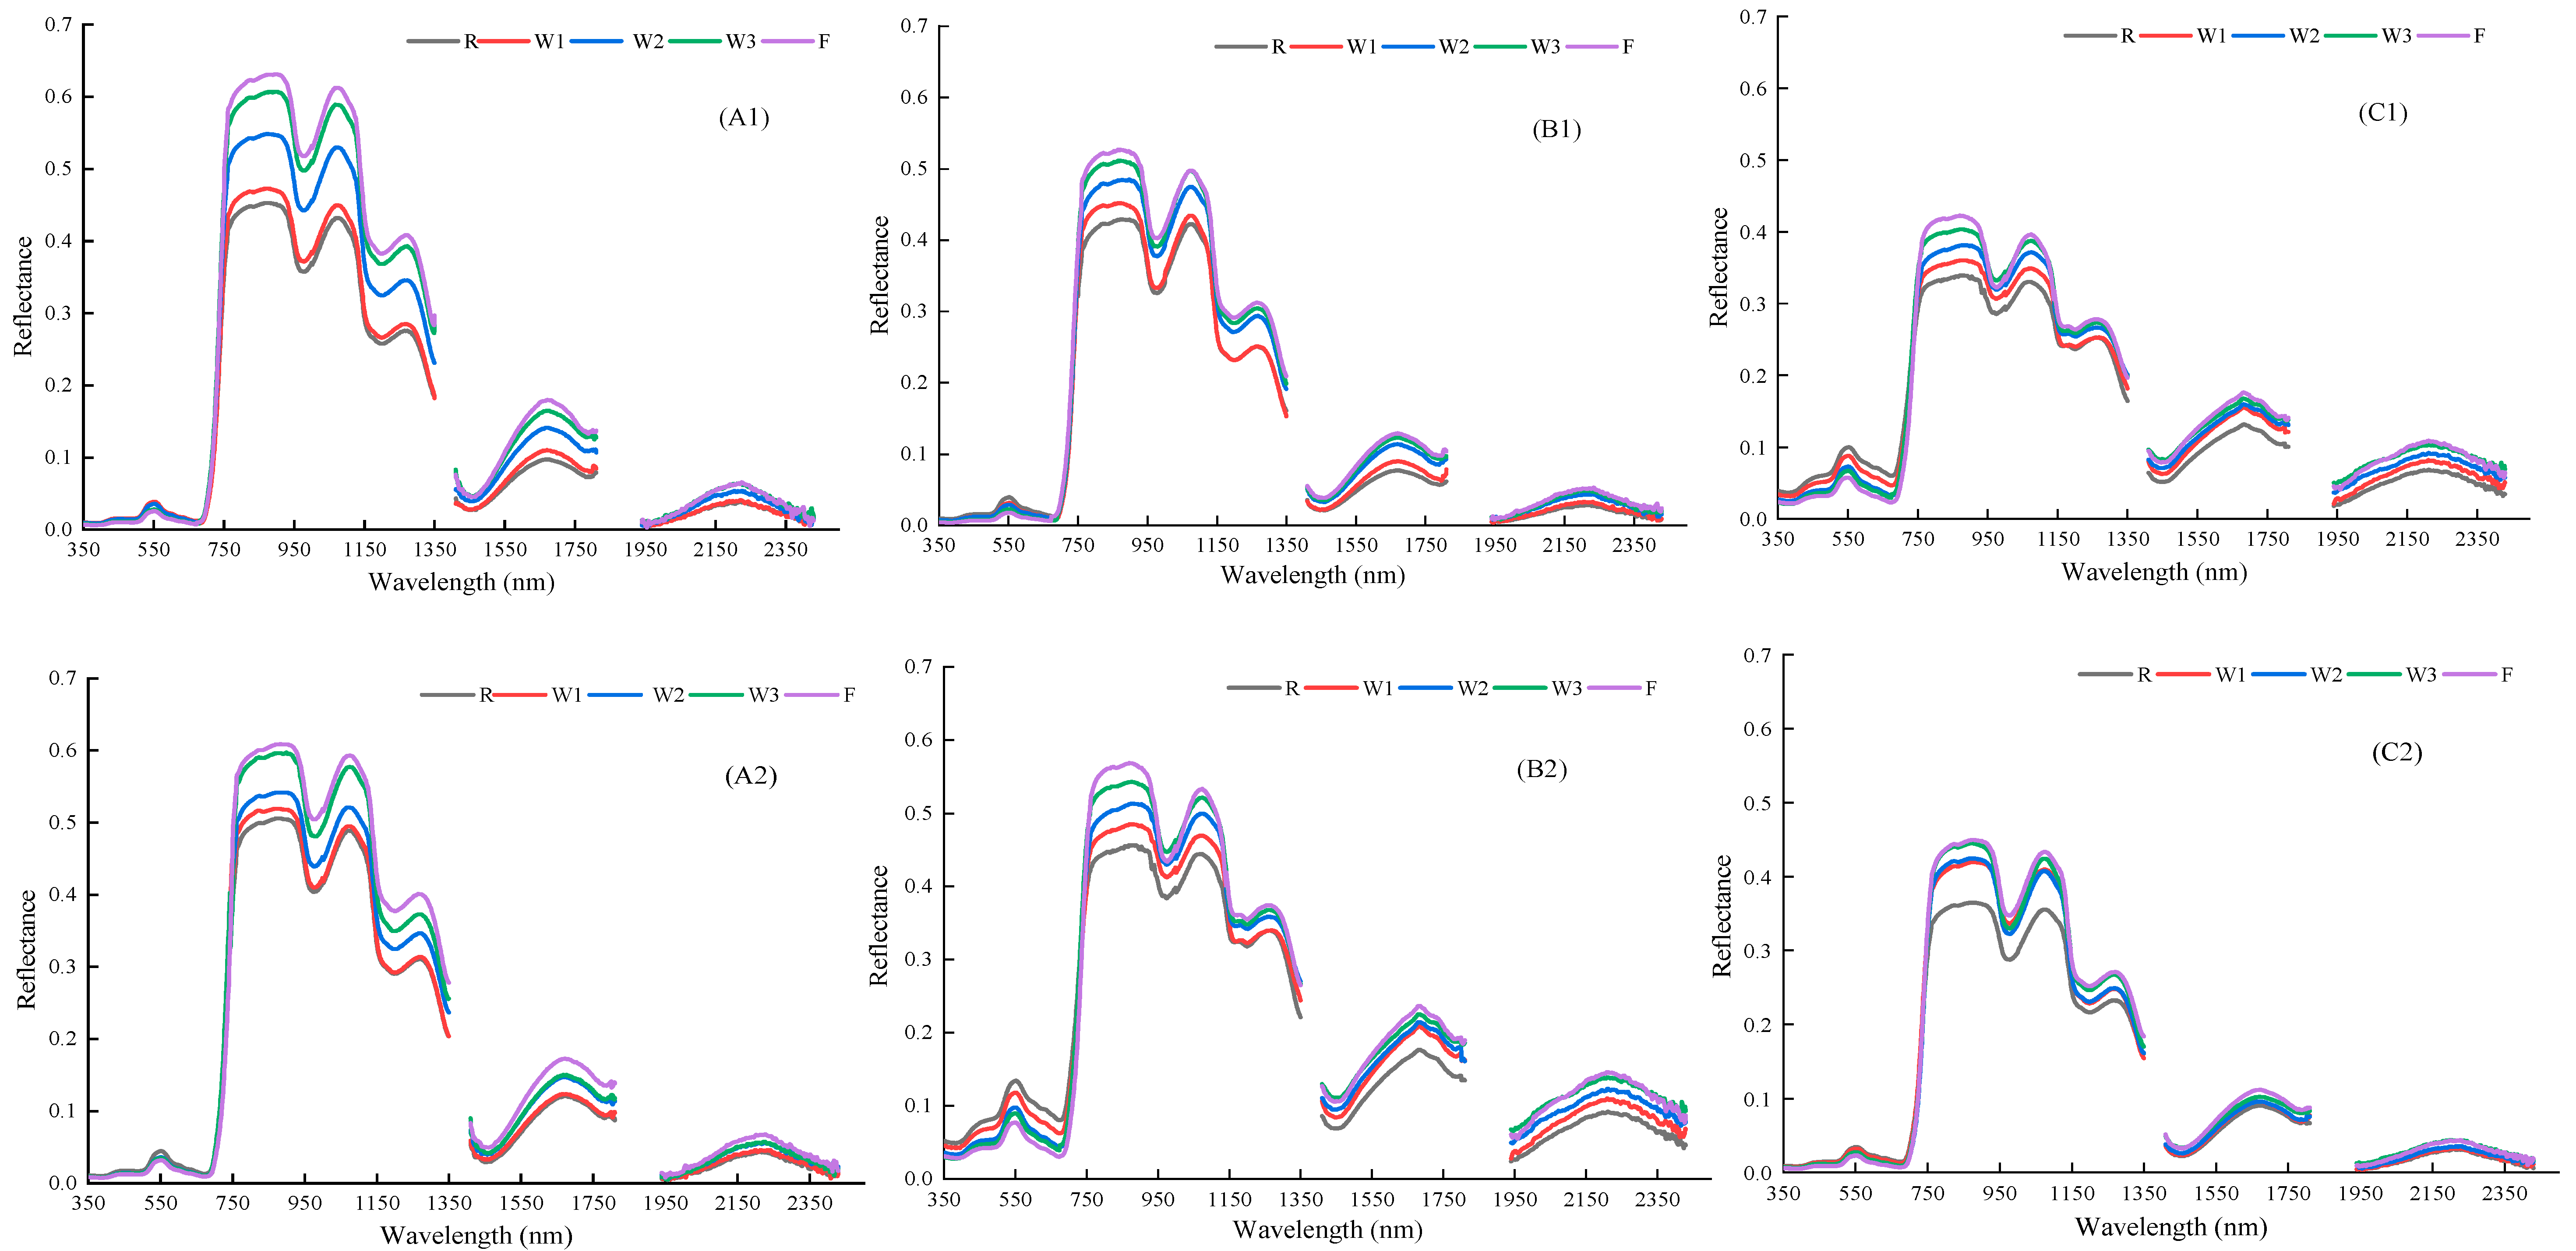
The spectral reflectance shows a decreasing trend as the growth stage, as shown in Figure 8. At the five water stress treatments, the general trend in the spectral curve with different growth stages was similar in winter wheat. In the visible region (350–750 nm), the spectral reflectance gradually increased with water deficits, and the reflectance of R treatment was the highest. In the near-infrared region (750–1350 nm), the spectral reflectance gradually decreased with water stress, and the spectral reflectance of winter wheat under R treatment was the lowest. In addition, spectral reflectance in the near-infrared region led to greater variability compared with that in the visible region, the radiation that canopy water absorbs. In the mid-infrared region (1350–1810 and 1940–2430 nm), the reflectance gradually decreased with water stress, and the reflectance of winter wheat under F treatment was the highest.
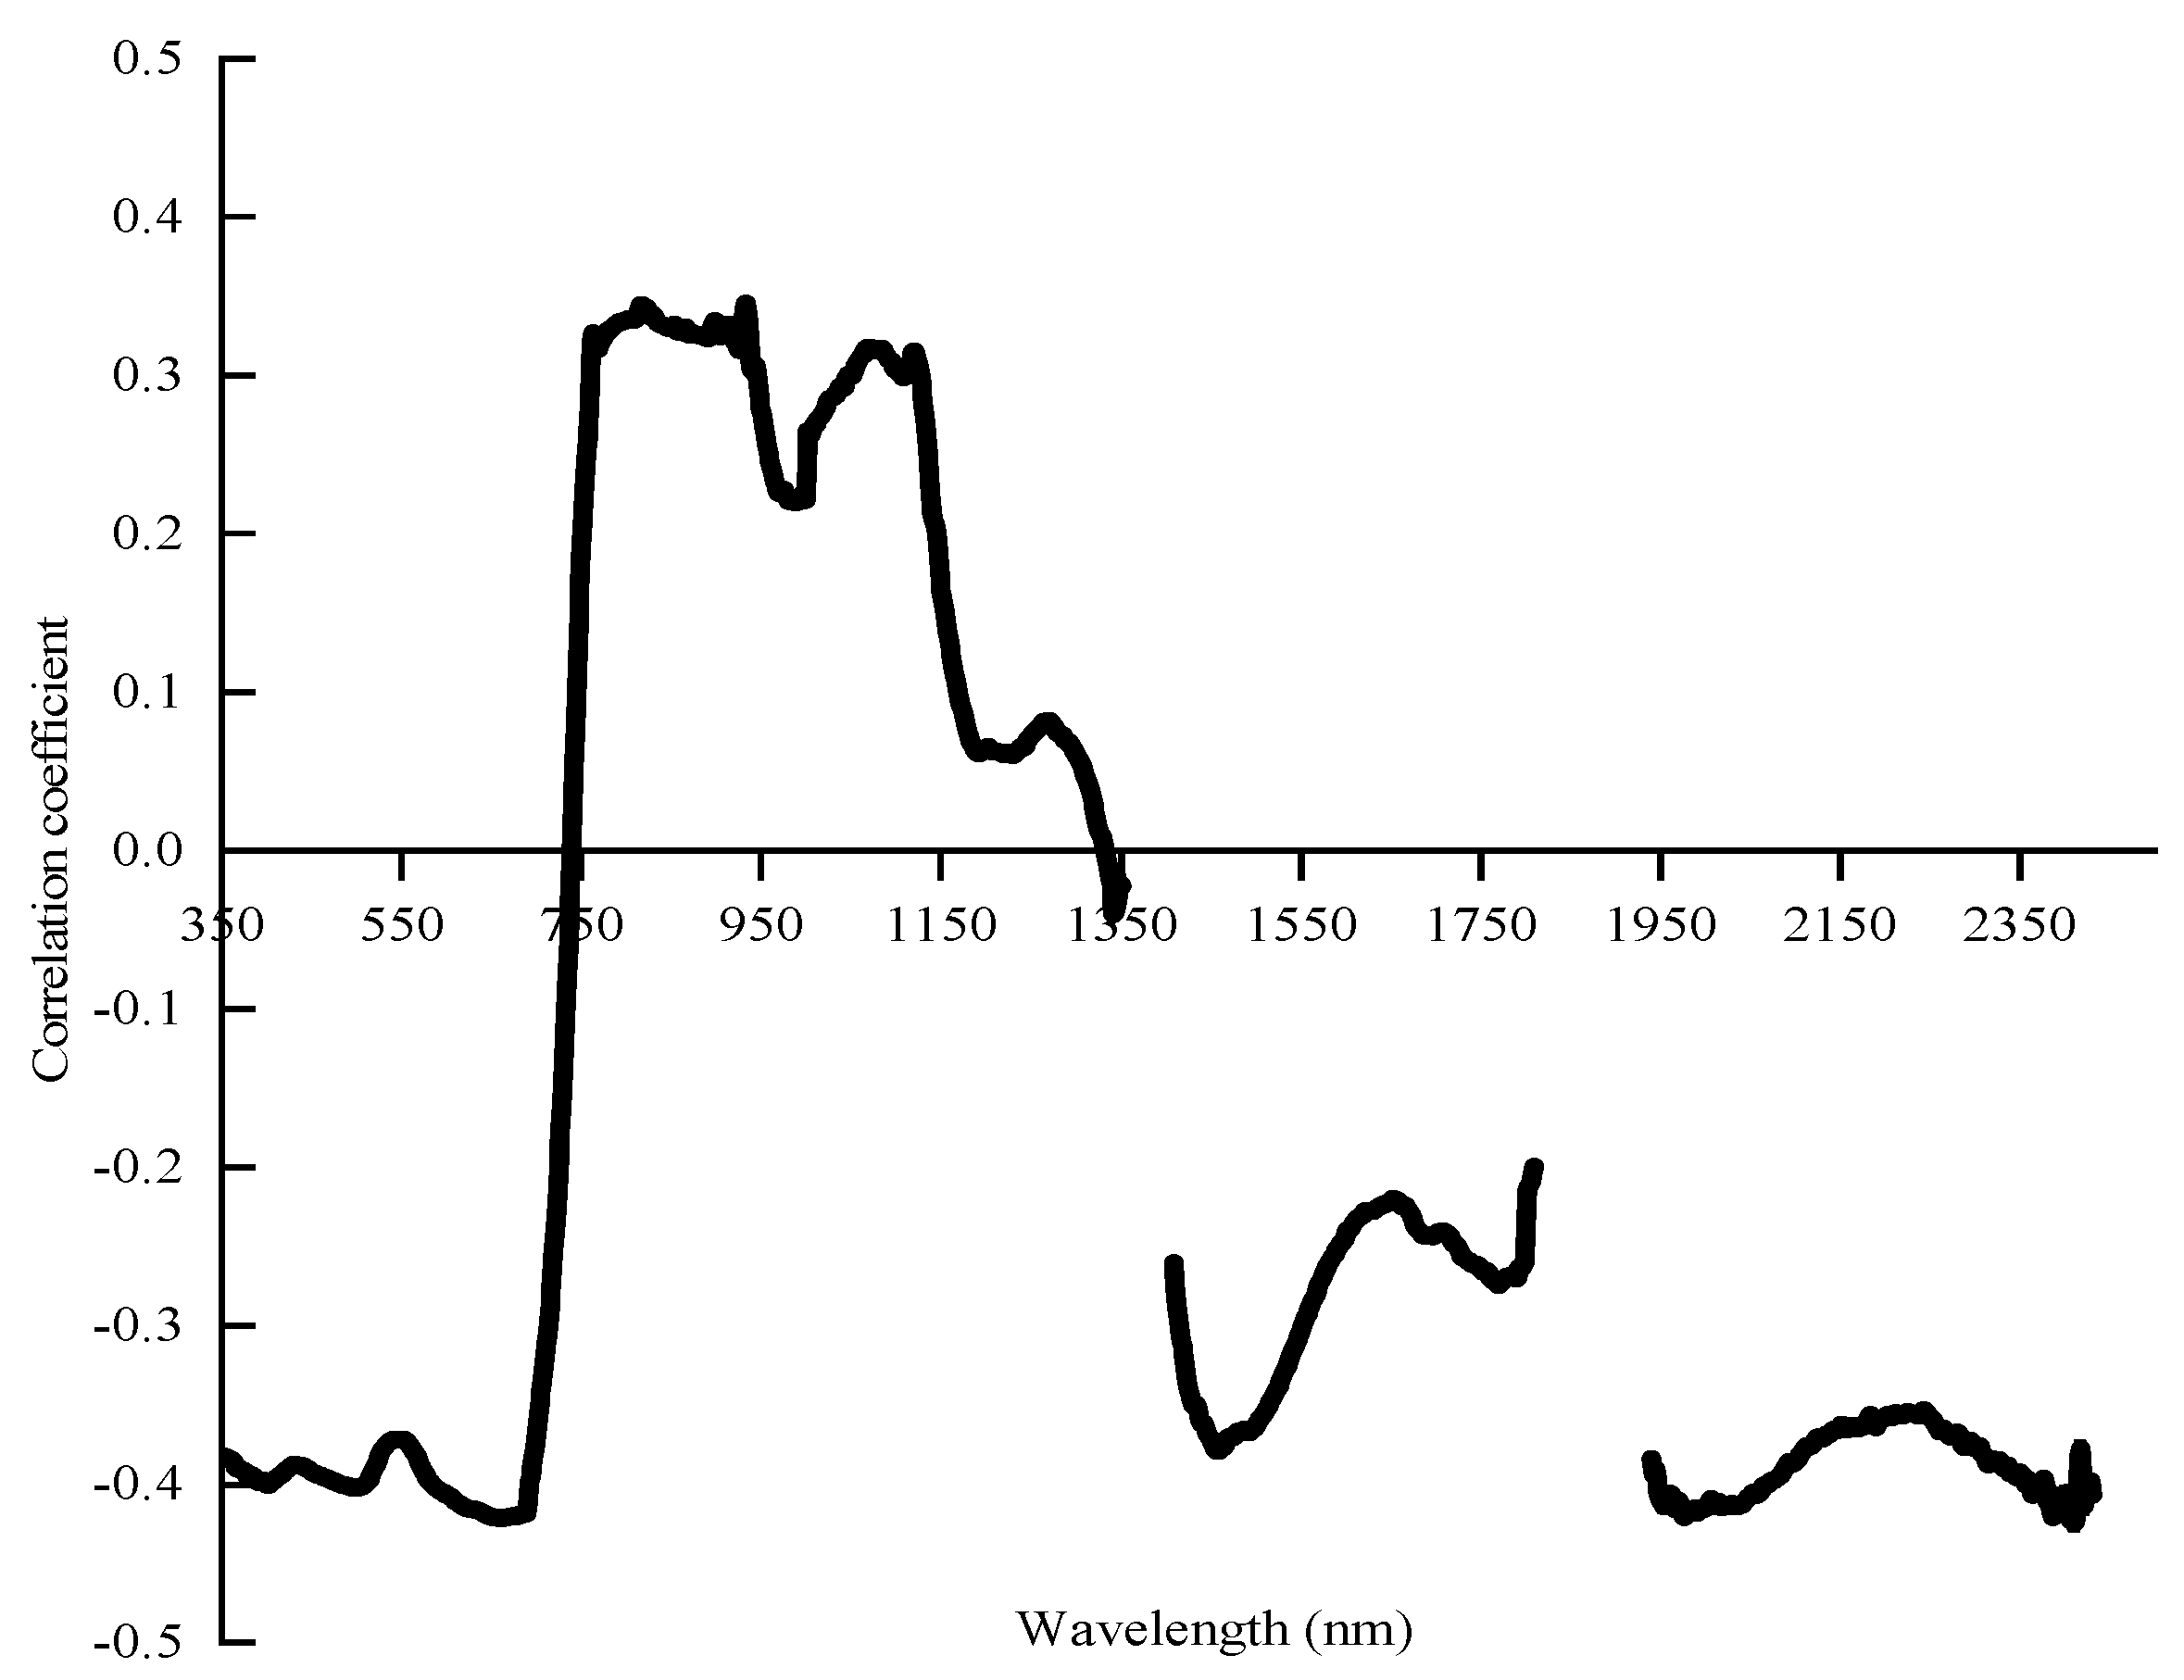
As shown in Figure 9, canopy water content was negatively correlated with spectral reflectance at 350–750, 1350–1810, and 1940–2430 nm. The band with an absolute correlation coefficient greater than 0.5 is in the 584–691 nm region, and the correlation in the visible band is significantly higher than that in the near- and mid-infrared bands.
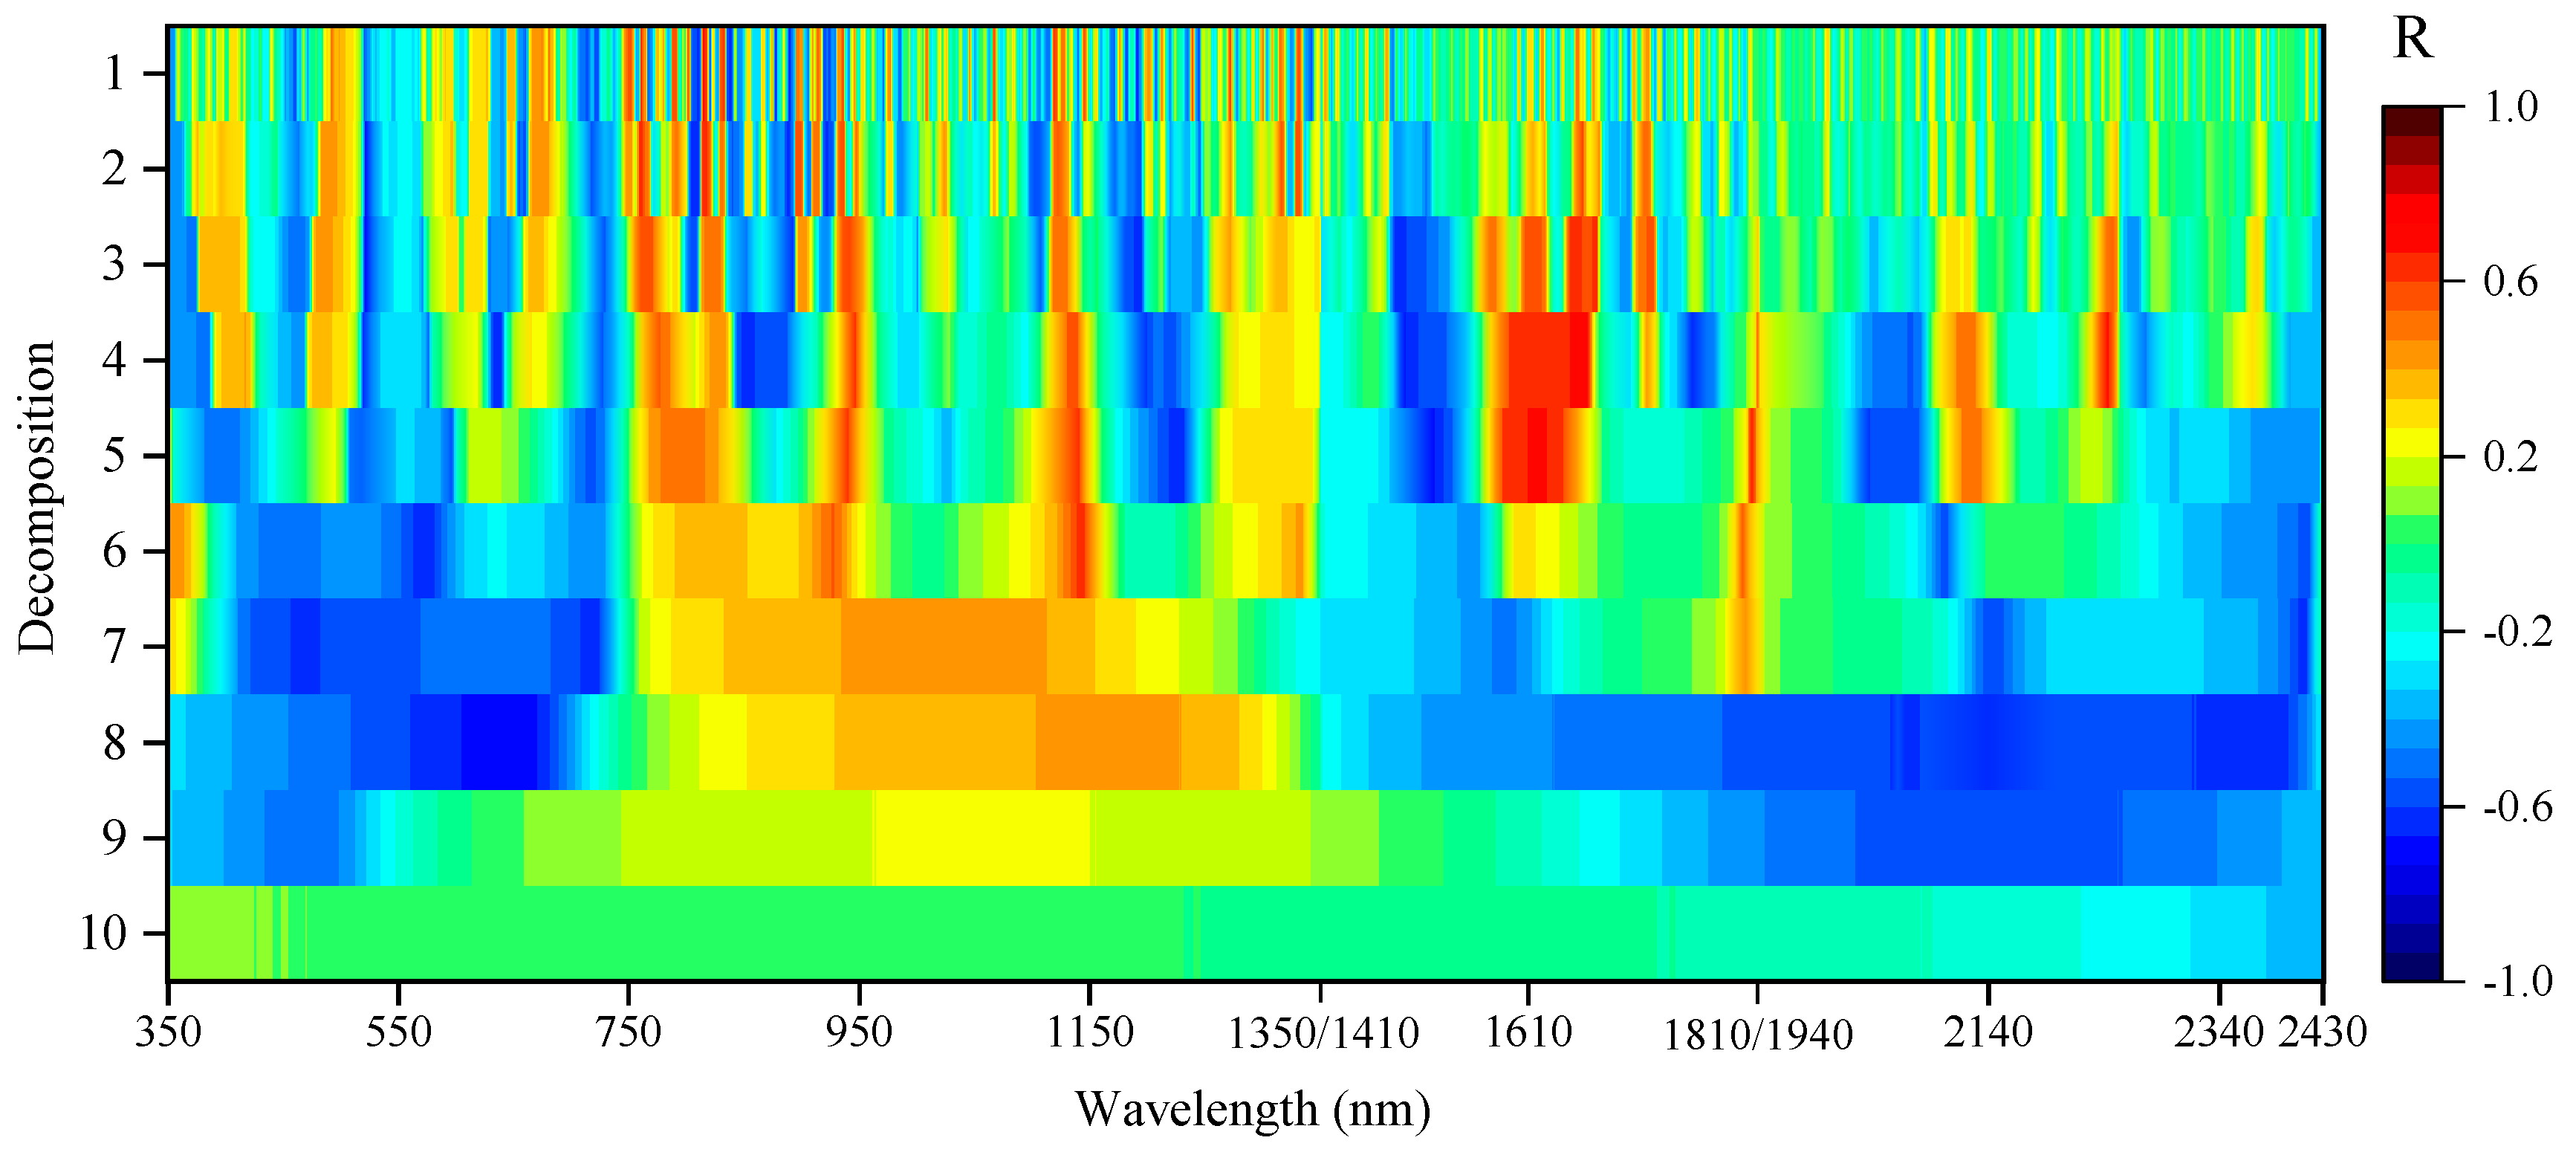
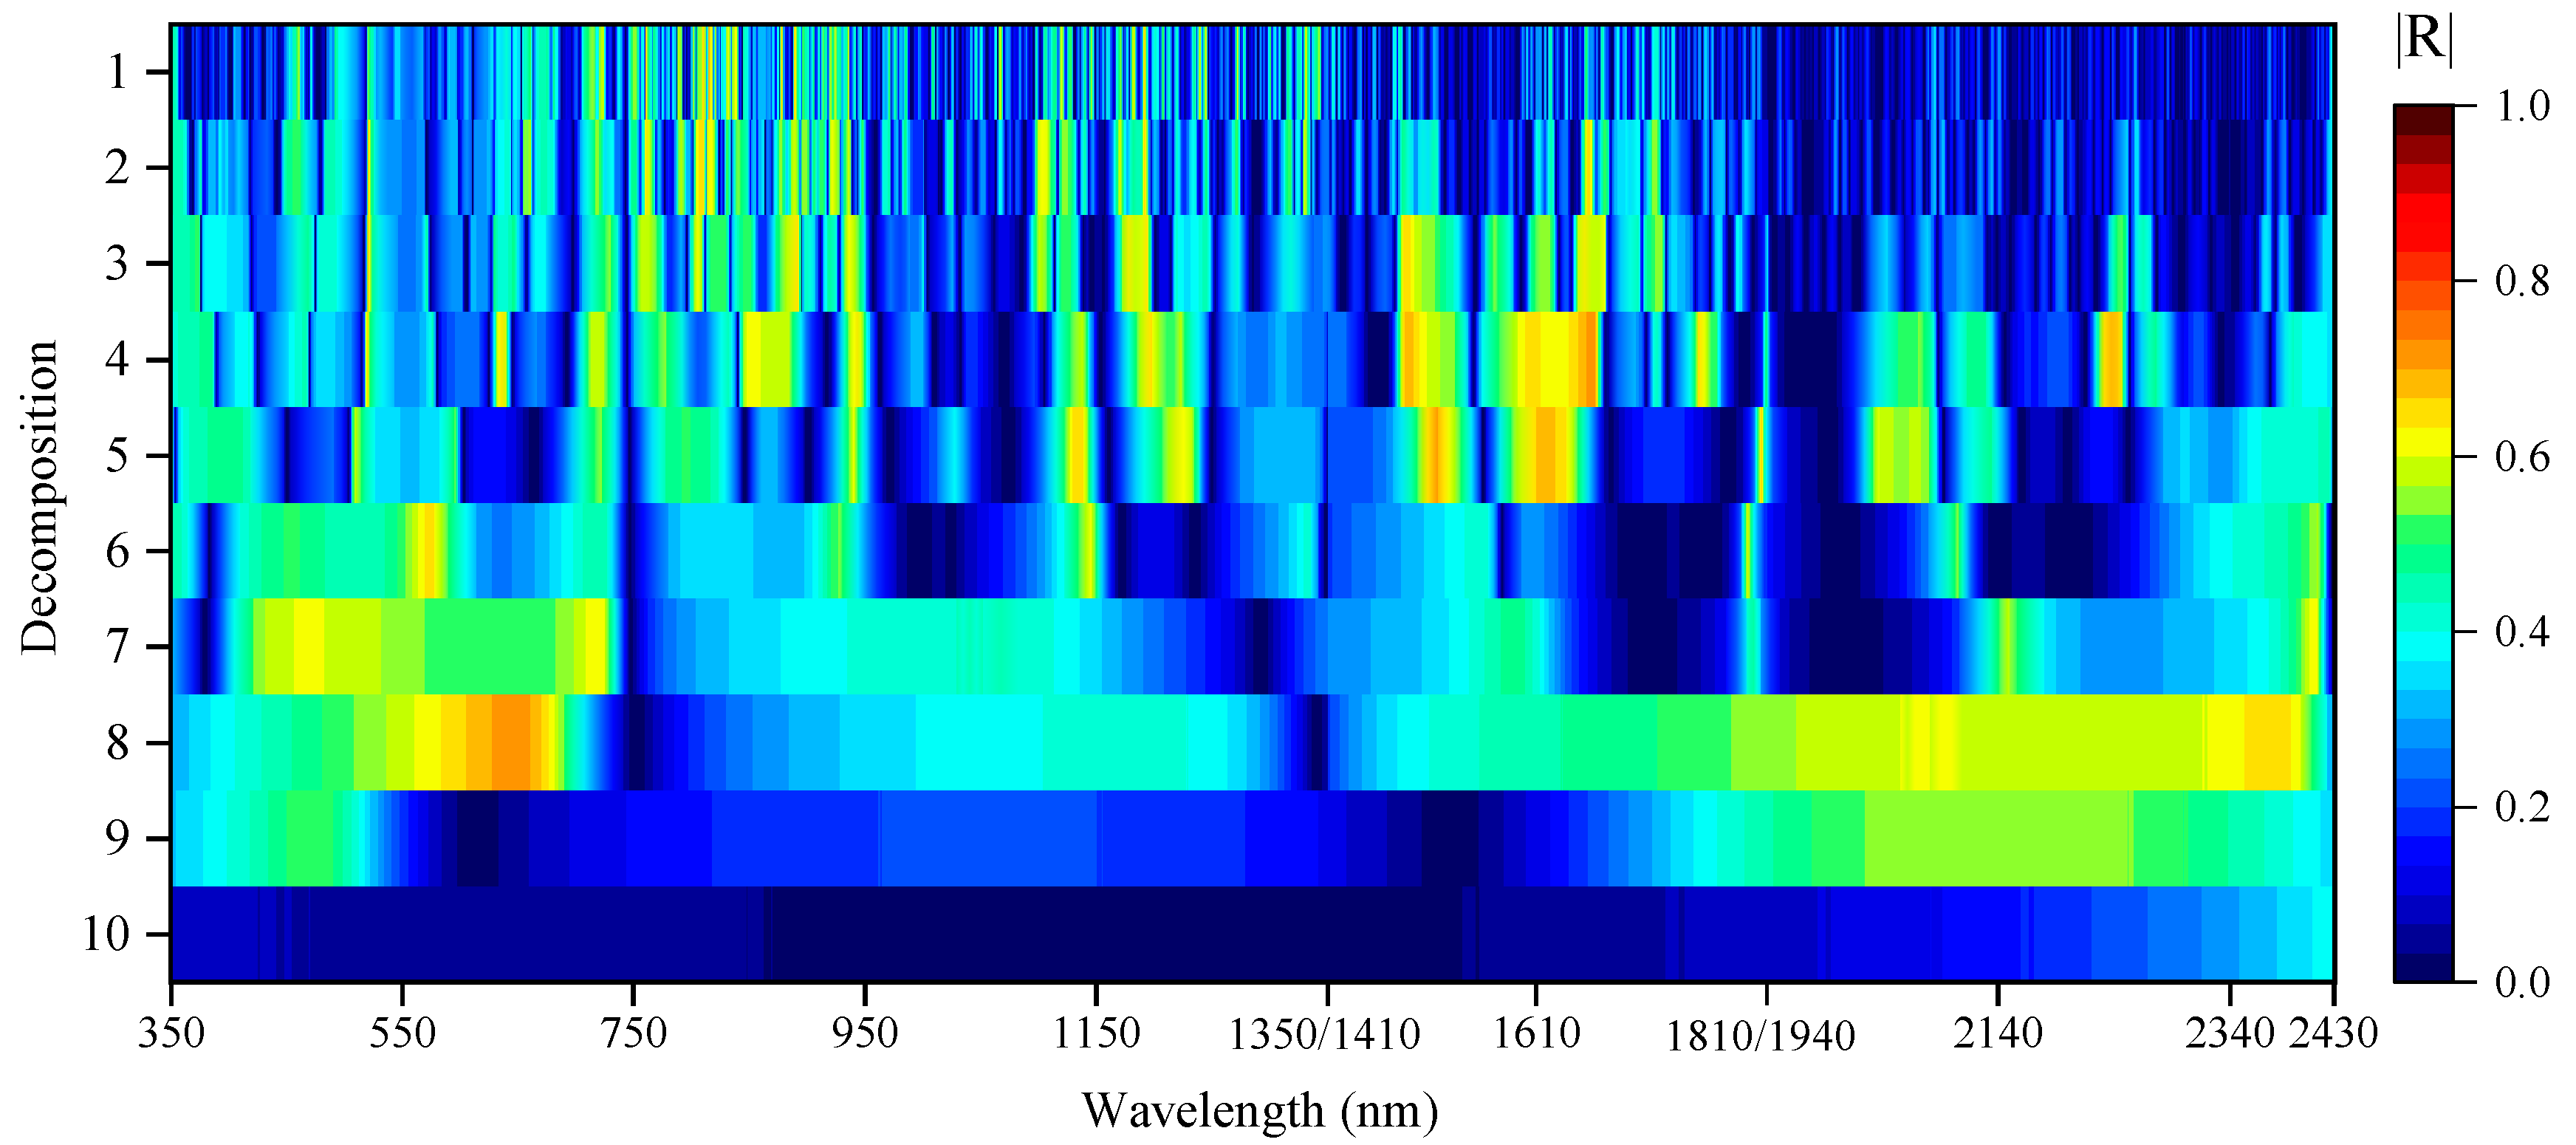
Wavelet energy coefficients on the 1st~10th decomposition scale were obtained by decomposing and transforming the spectral reflectance data using the CWT. This study conducted a correlation analysis between wavelet energy coefficients and canopy water content at various decomposition scales (Figure 10). The wavelet energy coefficient and canopy water content showed a stronger correlation in the different bands of the first to eighth decomposition scales according to CWT. This suggests that the CWT of the medium and low decomposition scales is able to fully extract the information hidden in the winter wheat canopy spectrum. The wavelet energy coefficient and canopy water content showed the highest positive correlation (r = 0.731) at 1659 nm in the fourth layer, while the maximum negative correlation (r = −0.722) was found at 1518 nm in the fifth layer. The highest correlation increased from 0.527 to 0.731, which is 38.71% greater than the original spectrum. By creating an absolute value map of the correlation coefficient, the correlation between the wavelet energy coefficient and canopy water content at each decomposition scale was determined. Figure 11 shows that the bands showing strong correlation are mainly concentrated in the 3rd–8th scales, specifically at 416–945 nm, 1099–1235 nm, 1494–1766 nm, and 2025–2398 nm. It can be seen that the spectral-sensitive regions with a high correlation to canopy water content are mainly concentrated in the visible, near-infrared, and mid-infrared bands.
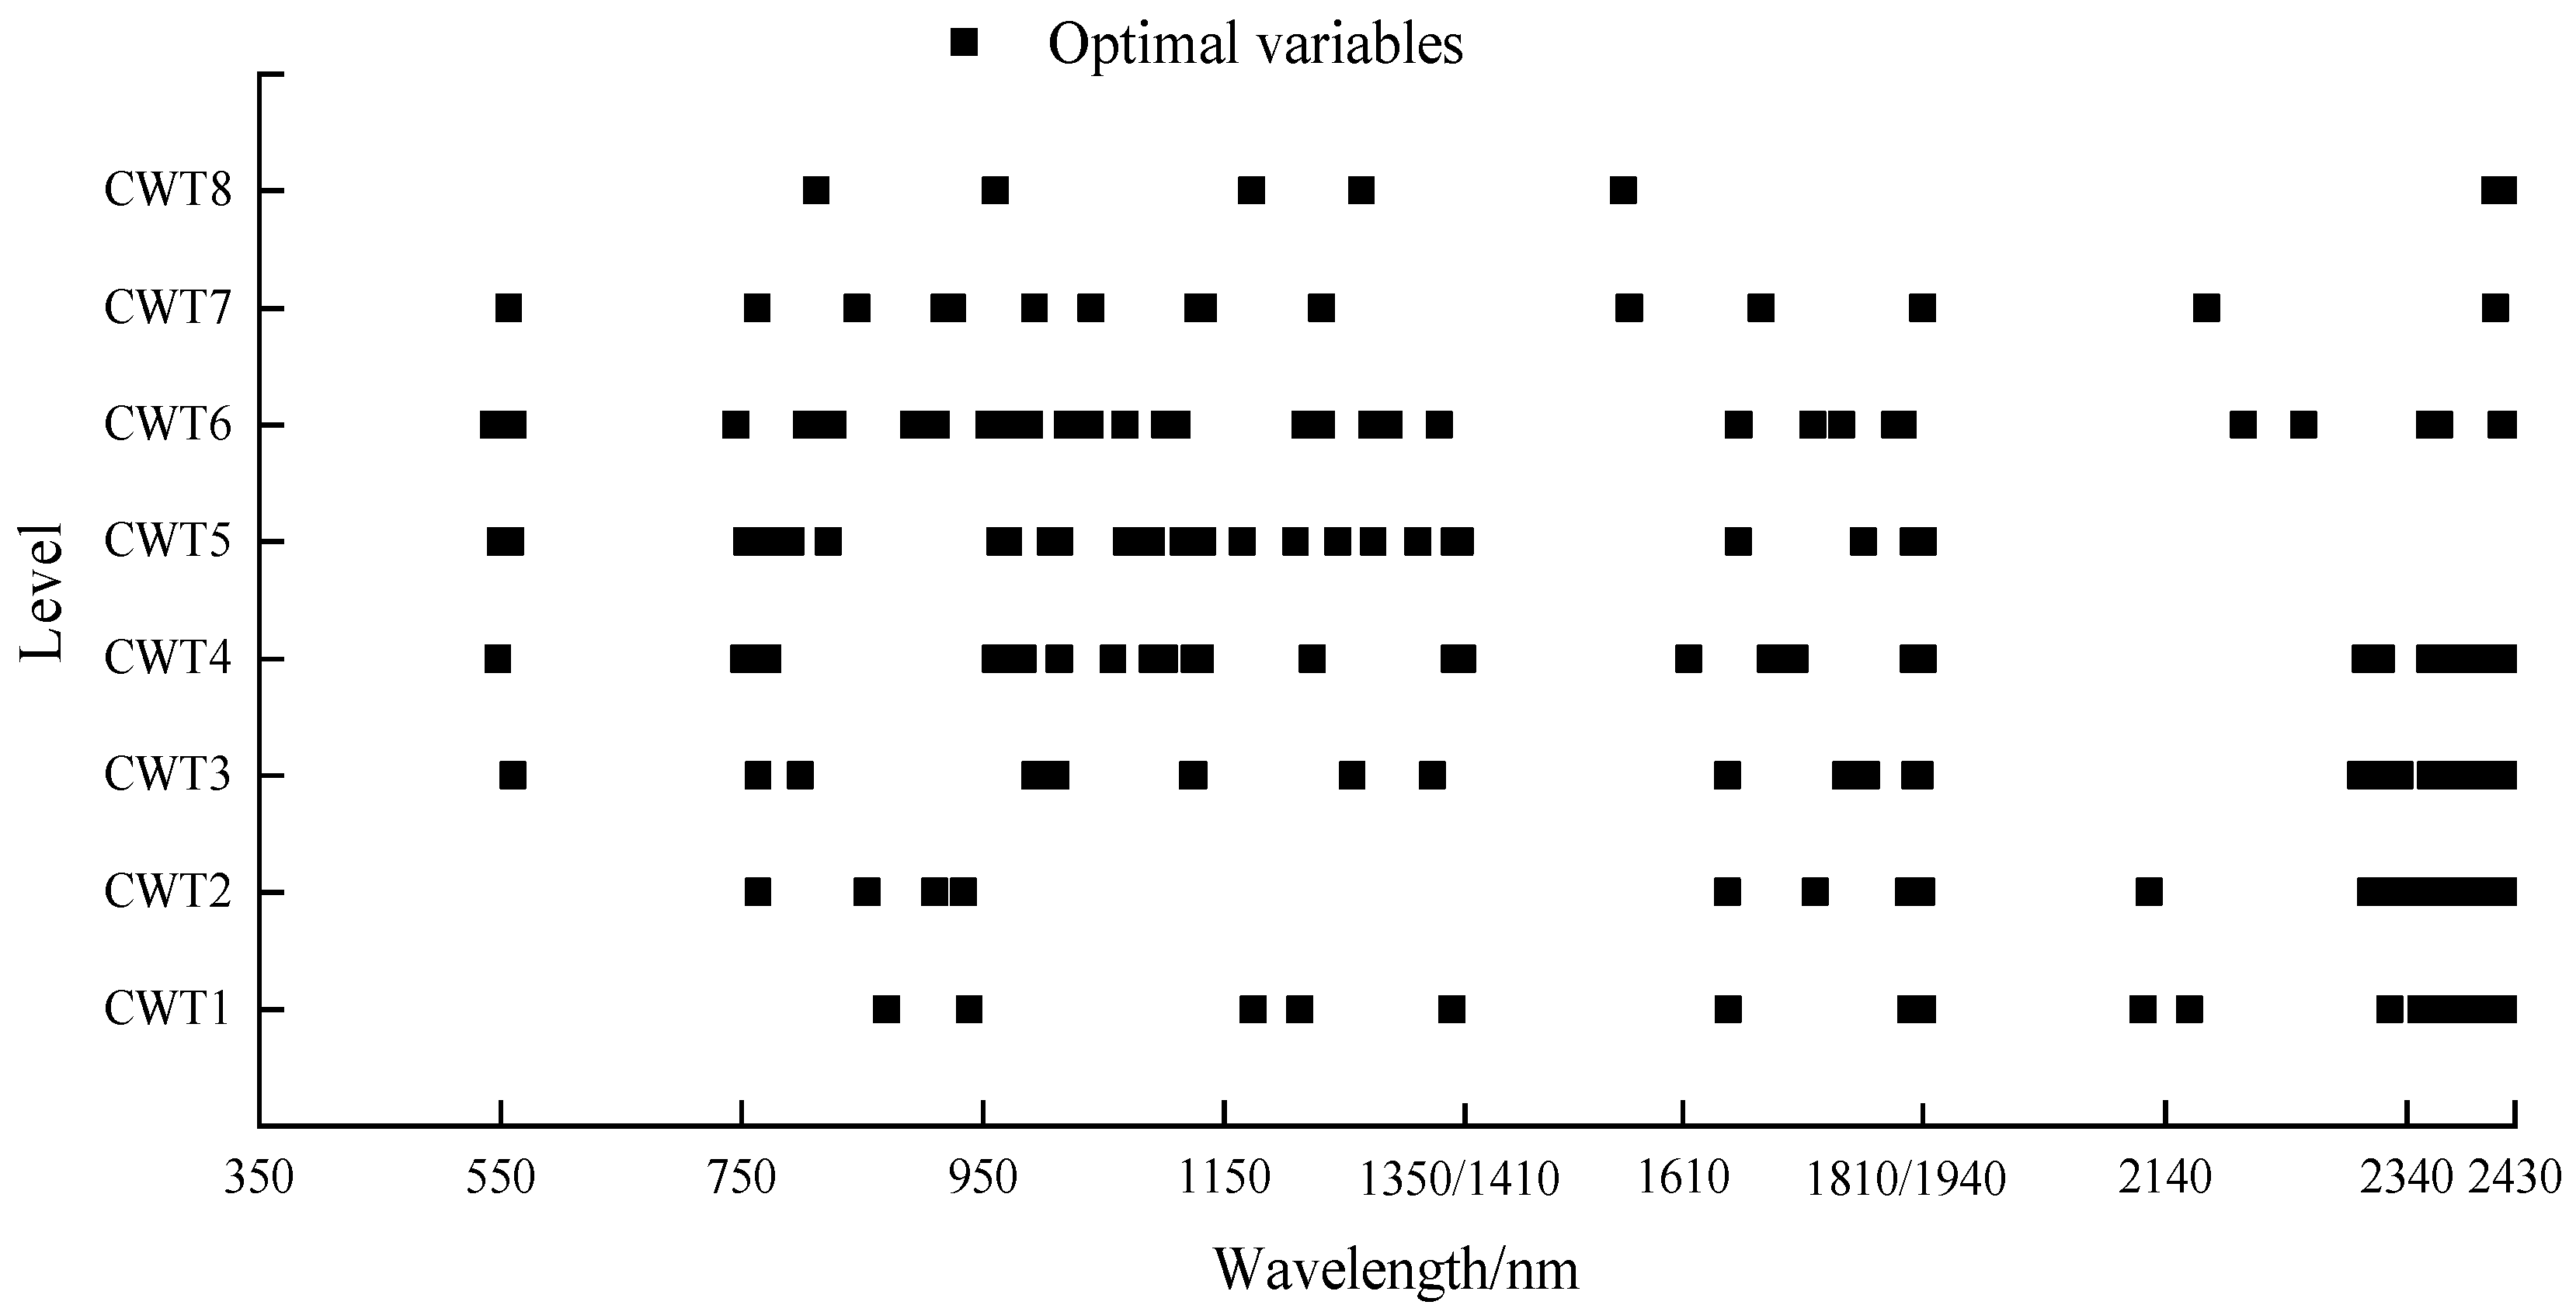
The distribution of the set of sensitive bands at each layer is obtained by applying the SPA to extract the optimal variables of each spectral scale, 1–8, following the CWT. The preferred variable set of each layer’s characteristic spectrum is roughly distributed around the water absorption peak (550, 850, 1070, 1270, 1670, and 2220 nm) as shown in Figure 12. The information reflecting the characteristics of the plant canopy decreases as the number of decomposition layers increases, and only a portion of the canopy attributes can be characterized by the characteristic spectrum of each layer. Therefore, a total of 285 sensitive bands were obtained by combining the characteristic variables at each spectral scale, with the sensitive bands mainly distributed at 545–561, 746–1348, 1561–1810, and 2122–2430 nm.

3.3. Construction of a Fusion Model Based on Hyperspectral and Thermal Imaging Data

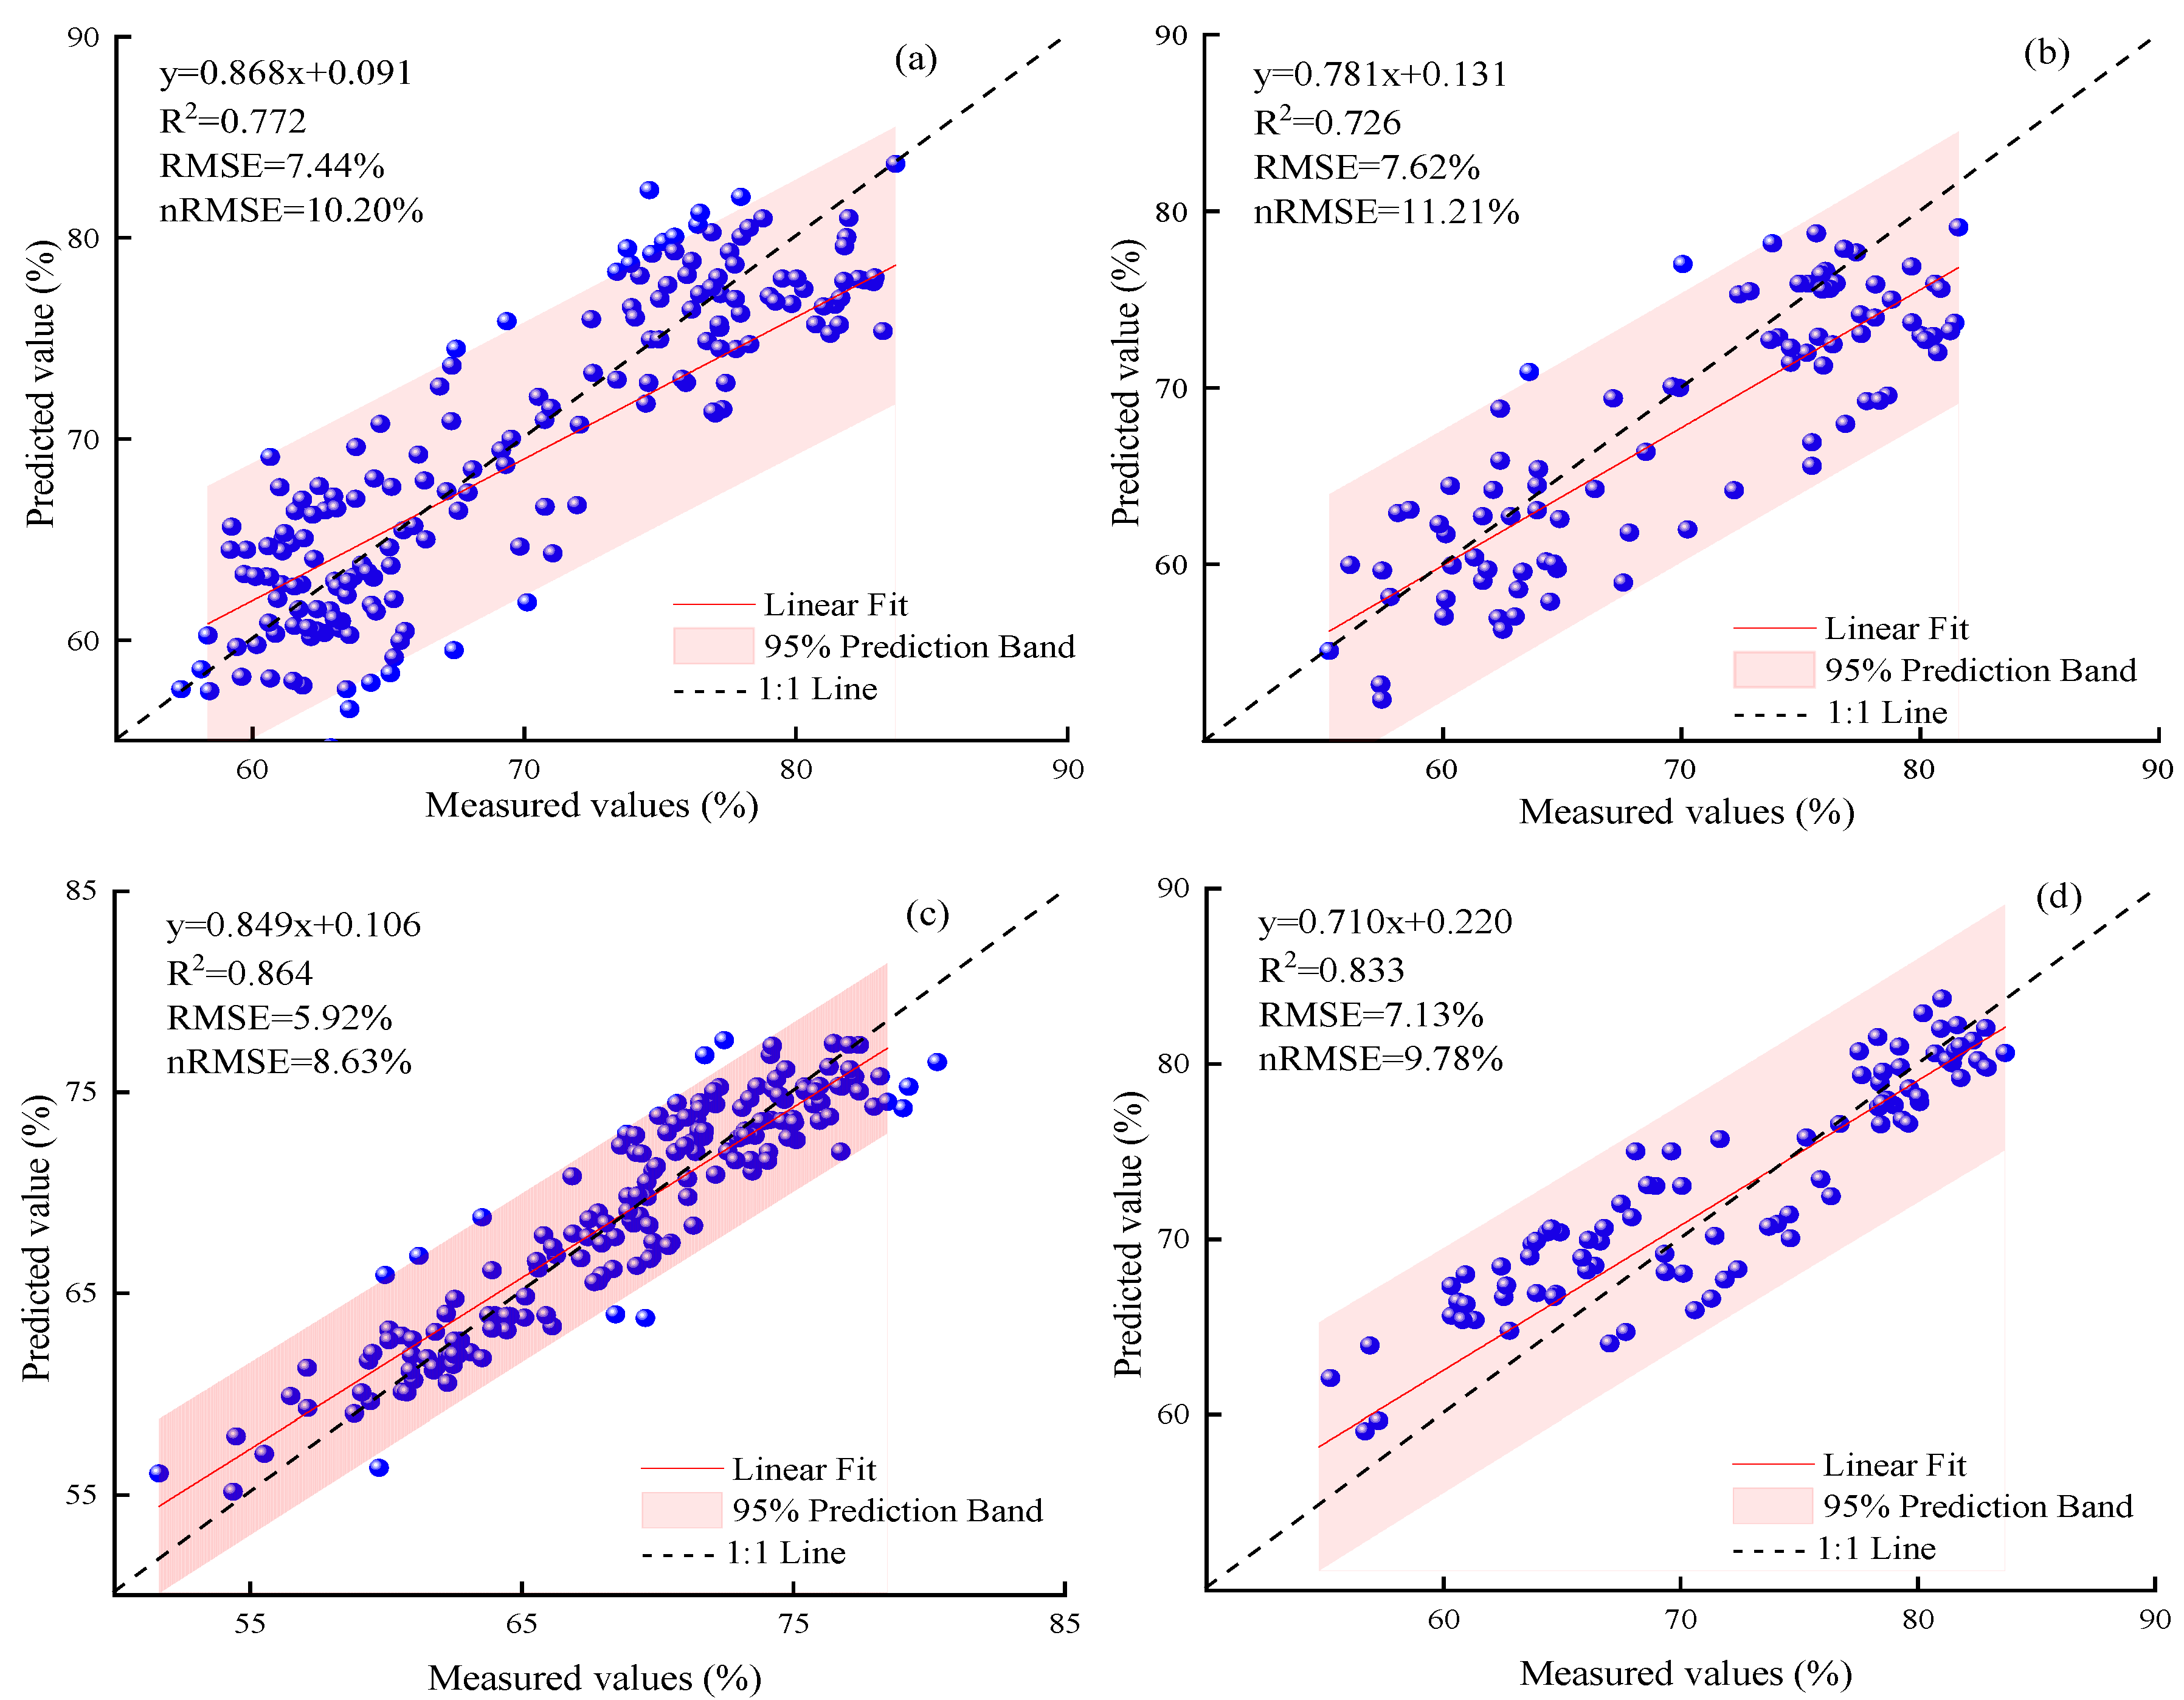
The CWC prediction model was constructed by selecting the optimal variables of the superimposed spectrum selected by the CWT-SPA coupling algorithm as the independent variable and CWC as the dependent variable. A comparison with the full-band PLSR model is provided to illustrate the benefits of variable selection. Figure 13 shows the CWC prediction model based on the original spectrum and the CWC prediction model based on optimized variables after CWT-SPA screening. The results showed that the CWC prediction model based on optimized variables after CWT-SPA screening (R2 = 0.864, RMSE = 5.92%, nRMSE = 8.63%) demonstrated superior performance compared to the CWC prediction model based on the original spectrum.
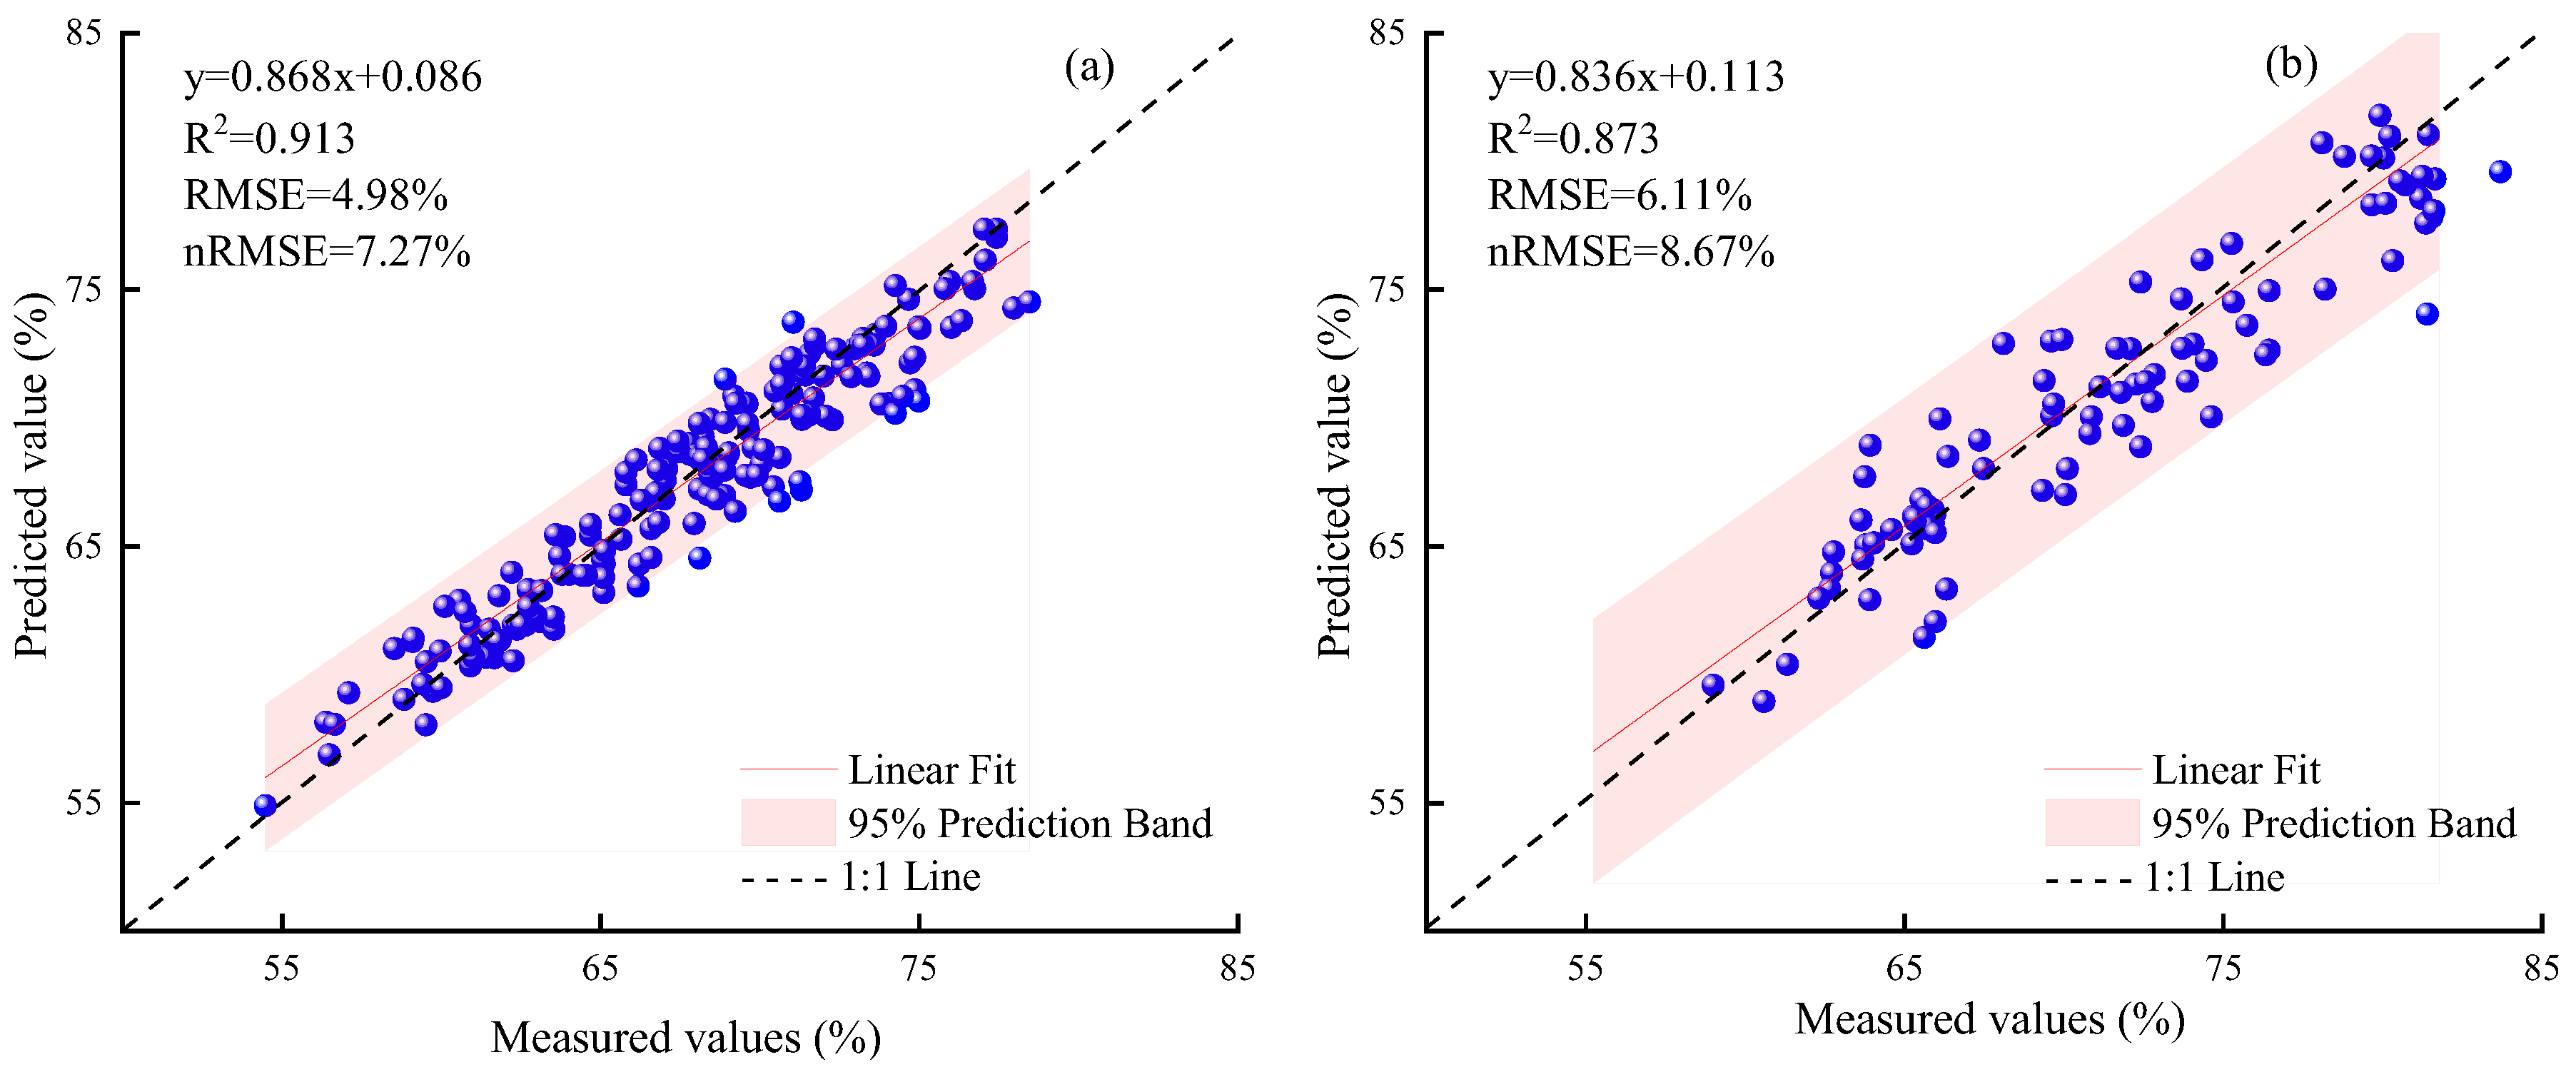
The CWC fusion model was created with the GRA using the output of the PLSR model with CWC as the dependent variable and optimized spectral variables and canopy temperature parameters as independent variables (Figure 14). Table 4 shows that the canopy temperature parameter model (R2 = 0.813, RMSE = 7.22%, nRMSE = 10.49%) and the optimized spectral variable model (R2 = 0.864, RMSE = 5.92%, nRMSE = 8.63%) are not as accurate as the CWC fusion model based on the GRA (R2 = 0.913, RMSE = 4.98%, nRMSE = 7.27%), as evidenced by its consistent performance in both calibration and validation sets. Compared to the single-feature spectral and thermal image CWC prediction models, the R2 for the model based on the GRA algorithm increased by 7.64% and 13.69%, and the RMSE and nRMSE decreased by 14.29% and 31.02%, and 13.66% and 30.70%, respectively. Notably, the models constructed based on the GRA algorithm displayed a more uniform distribution of validation point samples around the 1:1 line while mitigating the phenomena of underestimation for high values and overestimation for low values of CWC.

4. Discussion

4.1. Effect of Different Water Treatments on Canopy Temperature and Spectral Reflectance in Winter Wheat

Water deficit can cause a decrease in the water content of the crop canopy, causing the leaves to dry up and wilt, which in turn changes crop canopy reflectance and broadens the application of hyperspectral remote sensing in agricultural water monitoring [46]. Remote sensing technology proves to be more convenient, sensitive, and rapid compared to traditional field sampling methods [47]. This study delineated a pronounced and consistent significant difference between the spectral reflectance band of plants under water deficit conditions (R, W1, and W2 treatments) and that of conventional irrigation (W3 and F treatments). This is due to the fact that changes in plant canopy water content cause changes in the scattering of light by internal leaf components, which in turn affects spectral reflectance. This study also showed that winter wheat showed a decreasing trend in the wavelength ranges of 780–1350 nm, 1410–1810 nm, and 1940–2430 nm with increasing water deficits. A previous study showed that water absorption peaks of plant hyperspectral bands were at 970, 1200, 1450, 1940, and 2500 nm [48]. The above spectral band changes can reflect the corresponding laws of plant water stress, which provides a basis for us to screen sensitive spectral bands based on CWT and SPA methods.
Thermal infrared imaging technologies have wide application prospects in remote sensing monitoring activities [49]. Plant canopy temperature is the result of the combined effect of internal and environmental influences on the energy balance of the plant canopy [50]. When plants are under water stress conditions, stomata are closed and heat loss on the leaf surface changes, which leads to leaf surface temperature responses [51]. In addition, studies have demonstrated the close relationship between canopy temperature parameters and crop yield and drought severity [52]. The results of the current study show a decreasing trend in CTD and IG and an increasing trend in NRCT and TAV with increasing water deficits. It also suggests that preferential allocation of crop transport to growth centers under water deficits exacerbates the disparity in water content and its physiological activity among different organs, resulting in increased spatial variability in plant canopy temperature, which leads to a decrease in CTD and IG and an increase in NRCT and TAV. Consequently, a solid theoretical basis for remote sensing monitoring can be provided by the remarkable responses of winter wheat’s hyperspectral and canopy temperatures. This provides a reliable basis for us to construct a plant canopy water prediction model using hyperspectral and thermal imaging information.

4.2. Combining CWT and SPA to Screen Hyperspectral Water-Sensitive Bands

Some sensitive spectral information in hyperspectral data is easily overlooked, and variations in test conditions and environmental factors lead to different results for the spectral index or vegetation index [53]. The wavelet transform can be used to decompose the spectral data for effective noise reduction and to extract more spectral locations and feature parameters [54]. Previous research has shown that after wavelet transforming the original spectrum, the high-scale wavelet features represent the amplitude change and general change trend in the overall shape of the original spectrum, while the low-scale wavelet features reflect the structural changes in the leaves or canopy and the spectral absorption characteristics of various substances [27]. In this study, the hyperspectral data of winter wheat under different water treatments were analyzed using CWT. The results showed the highest positive correlation (r = 0.731) at 1659 nm in the fourth layer, while the maximum negative correlation (r = −0.722) was found at 1518 nm in the fifth layer. Furthermore, the results show that scale 4 of the 10 wavelet coefficient scales obtained using the GAUS1 wavelet function has the best correlation performance in winter wheat canopy water content when compared to the original spectrum. This is consistent with the results of Cheng et al. [29] who used CWT analysis to show that the correlation with leaf water content is the best at the fourth decomposition scale. This suggests that the wavelet transform reflects the spectral characteristics associated with a particular frequency of canopy water content. However, due to the good time–frequency localization of the wavelet transform, the spectral features with weak correlations are suppressed. This further demonstrates the superiority of the wavelet transform in spectral denoising and effective information extraction.
The spectral reflectance curve represents the overall performance of various blade attributes, with a high degree of correlation and a high degree of information redundancy between adjacent bands. Studies have shown that the use of SPAs in canopy water prediction not only improves prediction accuracy and capabilities but also reduces the number of redundant bands [55]. To eliminate the redundancy of information between hyperspectral bands, this study selected 285 bands as the optimal variable set based on the SPA of CWT. The CWC prediction model based on optimized variables after CWT-SPA screening (R2 = 0.868, RMSE = 5.92%, nRMSE = 8.63%) demonstrated superior performance compared to the CWC prediction model based on the original spectrum. This is consistent with previous studies that improved the accuracy of the model by using an optimized CWT in combination with SPA to select the effective wavelength of water [24]. This demonstrates that SPA can filter characteristic bands faster, significantly reduce the number of covariances, and compress spectral data at multiple wavelet decomposition scales [55,56]. By combining CWT and SPAs, it is possible to identify weak signals in spectral data and eliminate redundant bands with covariance, resulting in the screening of characteristic bands and a quick and reliable estimate of canopy water content.

4.3. The GRA Improves the Accuracy of the CWC Prediction Model

Canopy water content is the most intuitive indicator of crop water status, and monitoring canopy water content is of great significance for evaluating plant growth [57]. It is possible to gain a better understanding of the water status of winter wheat with the wealth of target information offered by hyperspectral data. Meanwhile, infrared thermal imaging technology, with its fast response time and non-destructive nature, can detect subtle temperature changes in crops in the early stages of water shortages. Plant water status is the result of multiple factors, and the predictive model is limited by the information from a single sensor [58]. Therefore, this study used the GRA method to integrate thermal imaging and hyperspectral information to improve the accuracy of canopy water content monitoring. The results of this study indicate that the GRA algorithm to integrate canopy temperature information from thermal images and optimized hyperspectral variables can improve the accuracy of canopy water content prediction. The prediction accuracy of the GRA-based CWC fusion model (R2 = 0.913, RMSE = 4.98%, nRMSE = 7.27%) is higher than that of the canopy temperature parameter model (R2 = 0.813, RMSE = 7.22%, nRMSE = 10.49%) and the optimized spectral variable model (R2 = 0.864, RMSE = 5.92%, nRMSE = 8.63%), as evidenced by its consistent performance on the calibration and validation sets. This is consistent with the results of Maimaitijiang et al., [59] who combined data from temperature, spectral, and spatial structure sensors to improve the accuracy of water prediction models. Most previous approaches to combining hyperspectral and thermal imagery have used machine learning techniques to create a direct data fusion model that combines temperature and vegetation indices [33]. It may miss important hyperspectral features and not fully exploit sensitive bands for modeling. Usually, in the process of agricultural water model construction, the introduction of image feature information of different categories of vegetation structures can effectively monitor the water status during crop growth and be applied to agricultural irrigation [60]. This is due to the fact that different types of models have their own advantages and disadvantages in terms of their water sensing properties, and by combining the advantages of different sensors for monitoring the water status of the crop, the accuracy of the model for predicting the water content of the crop can be improved [61]. With advances in computing technology, many studies have used multi-sensor fusion algorithms, particularly those combining hyperspectral and thermal images to estimate canopy water content.
The GRA fusion is an excellent multi-sensor data fusion method, and its wide application in model fusion and its ease of implementation and execution make it a popular choice [38,62]. It can increase the accuracy and stability of the estimate while avoiding the uncertainty associated with using data from a single sensor to estimate canopy water content [39]. In this study, 285 hyperspectral water-sensitive bands were extracted from hyperspectral data using CWT and the SPA, and then the hyperspectral characteristic bands and thermal images were fused using the GRA algorithm. The CWC model based on GRA (R2 = 0.913, RMSE = 4.98%, nRMSE = 7.27%) has a good accuracy. This is mainly because the accuracy of the CWC prediction model can be improved by feature selection of the hyperspectral data before model fusion, which can eliminate redundant information and fully exploit the synergy of feature data [36,39].

5. Conclusions

This study uses GRA fusion of hyperspectral and thermal imaging information to construct a more accurate prediction model for canopy water content, which is of great significance for winter wheat water diagnosis and drought assessment. The main conclusions were as follows: (1) Compared with the control treatment (R and W3), CTD and IG showed a decreasing trend under water deficit treatment (R, W1, and W2), while NRCT and TAV showed an increasing trend. In the 350–750 nm region, compared with the control treatment (R and W3), the canopy spectral reflectance of the water deficit treatment (R, W1, and W2) showed an upward trend, and a downward trend in 750–1350 nm, 1430–1810 nm, and 1940–2430 nm. (2) Using the CWT-SPA, 285 characteristic spectra of winter wheat were screened. (3) The CWC prediction model based on optimized variables after CWT-SPA screening (R2 = 0.868, RMSE = 5.92%, nRMSE = 8.63%) demonstrated superior performance compared to the CWC prediction model based on the original spectrum. The GRA-based CWC fusion model (R2 = 0.913, RMSE = 4.98%, nRMSE = 7.27%) is higher than that of the canopy temperature parameter model (R2 = 0.813, RMSE = 7.22%, nRMSE = 10.49%) and the optimized spectral variable model (R2 = 0.864, RMSE = 5.92%, nRMSE = 8.63%). The CWC prediction model constructed based on GRA fusion of hyperspectral and canopy temperature parameters information significantly improves the prediction accuracy of CWC in winter wheat.

Author Contributions

Conceptualization, C.G., P.W. (Pengfei Wen), and T.W.; methodology, C.G., P.W. (Pengfei Wen), and T.W.; software, C.G., P.W. (Pengnian Wu), P.W. (Pengfei Wen) and T.W.; validation, C.G., P.W. (Pengnian Wu), P.W. (Pengfei Wen) and T.W.; formal analysis, C.G., S.L. (Shuimiao Liu), P.W. (Pengnian Wu), P.W. (Pengfei Wen) and T.W.; investigation, C.G., S.L. (Shuimiao Liu), P.W. (Pengnian Wu), Y.W., K.W., P.W. (Pengfei Wen), L.L., J.W., S.L. (Shilong Liu), P.G., Z.Z., J.S., H.Y., X.G. and T.W.; resources, C.G., S.L. (Shuimiao Liu), P.W. (Pengnian Wu), Y.W., K.W., P.W. (Pengfei Wen), L.L., J.W., S.L. (Shilong Liu), P.G., Z.Z., J.S., H.Y., X.G. and T.W.; data curation, C.G., S.L. (Shuimiao Liu), P.W. (Pengnian Wu), Y.W., K.W., P.W. (Pengfei Wen), L.L., J.W., S.L. (Shilong Liu), P.G., Z.Z., J.S., H.Y., X.G. and T.W.; writing—original draft preparation, C.G., S.L. (Shuimiao Liu), P.W. (Pengnian Wu) and P.W. (Pengfei Wen); writing—review and editing, C.G., S.L. (Shuimiao Liu), P.W. (Pengnian Wu) and P.W. (Pengfei Wen); visualization, P.W. (Pengfei Wen) and T.W.; supervision P.W. (Pengfei Wen) and T.W.; project administration, P.W. (Pengfei Wen) and T.W.; funding acquisition, P.W. (Pengfei Wen) and T.W. All authors have read and agreed to the published version of the manuscript.

Funding

This study was supported by the National Key Research and Development Program of China (2021YFD1700900), the Project Plan of Key Scientific Research in Colleges and Universities of Henan Province (23A210017), and the Key Scientific and Technological Project of Henan Province (232102110298) of China.

Data Availability Statement

The data presented in this study are available upon request from the corresponding author. The data are not publicly available due to their use in subsequent studies.

Acknowledgments

We would like to thank the three reviewers and the editors for their suggestions, which led to an improved quality of the manuscript.

Conflicts of Interest

The authors declare that they have no known competing financial interests or personal relationships that could have appeared to influence the work reported in this paper.

References

  1. Fang, Y.J.; Xiong, L.Z. General mechanisms of drought response and their application in drought resistance improvement in plants. Cell. Mol. Life Sci. 2015, 72, 673–689. [Google Scholar] [CrossRef] [PubMed]
  2. Hao, Z.; Singh, V.P.; Xia, Y. Seasonal Drought Prediction: Advances, Challenges, and Future Prospects. Rev. Geophys. 2018, 56, 108–141. [Google Scholar] [CrossRef]
  3. He, B.; Lü, A.F.; Wu, J.J.; Zhao, L.; Liu, M. Drought hazard assessment and spatial characteristics analysis in China. J. Geogr. Sci. 2011, 21, 235–249. [Google Scholar] [CrossRef]
  4. Sun, H.Y.; Liu, C.M.; Zhang, X.Y.; Shen, Y.J.; Zhang, Y.Q. Effects of irrigation on water balance, yield and WUE of winter wheat in the North China Plain. Agric. Water Manag. 2006, 85, 211–218. [Google Scholar] [CrossRef]
  5. Jha, S.K.; Gao, Y.; Liu, H.; Huang, Z.D.; Wang, G.S.; Liang, Y.P.; Duan, A.W. Root development and water uptake in winter wheat under different irrigation methods and scheduling for North China. Agric. Water Manag. 2017, 182, 139–150. [Google Scholar] [CrossRef]
  6. Liu, X.F.; Pan, Y.Z.; Zhu, X.F.; Yang, T.T.; Bai, J.J.; Sun, Z.L. Drought evolution and its impact on the crop yield in the North China Plain. J. Hydrol. 2018, 564, 984–996. [Google Scholar] [CrossRef]
  7. Sallam, A.; Alqudah, A.M.; Dawood, M.F.A.; Baenziger, P.S.; Börner, A. Drought Stress Tolerance in Wheat and Barley: Advances in Physiology, Breeding and Genetics Research. Int. J. Mol. Sci. 2019, 20, 3137. [Google Scholar] [CrossRef]
  8. Jones, H.G.; Serraj, R.; Loveys, B.R.; Xiong, L.Z.; Wheaton, A.; Price, A.H. Thermal infrared imaging of crop canopies for the remote diagnosis and quantification of plant responses to water stress in the field. Funct. Plant Biol. 2009, 36, 978–989. [Google Scholar] [CrossRef]
  9. Wedeking, R.; Mahlein, A.-K.; Steiner, U.; Oerke, E.-C.; Goldbach, H.E.; Wimmer, M.A. Osmotic adjustment of young sugar beets (Beta vulgaris) under progressive drought stress and subsequent rewatering assessed by metabolite analysis and infrared thermography. Funct. Plant Biol. 2017, 44, 119–133. [Google Scholar] [CrossRef]
  10. DeJonge, K.C.; Taghvaeian, S.; Trout, T.J.; Comas, L.H. Comparison of canopy temperature-based water stress indices for maize. Agric. Water Manag. 2015, 156, 51–62. [Google Scholar] [CrossRef]
  11. Qi, Z.; Ma, L.; Bausch, W.C.; Trout, T.J.; Ahuja, L.R.; Flerchinger, G.N.; Fang, Q.X. Simulating Maize Production, Water and Surface Energy Balance, Canopy Temperature, and Water Stress under Full and Deficit Irrigation. Trans. Asabe 2016, 59, 623–633. [Google Scholar]
  12. Grant, O.M.; Tronina, L.; Jones, H.G.; Chaves, M.M. Exploring thermal imaging variables for the detection of stress responses in grapevine under different irrigation regimes. J. Exp. Bot. 2007, 58, 815–825. [Google Scholar] [CrossRef]
  13. Mangus, D.L.; Sharda, A.; Zhang, N.Q. Development and evaluation of thermal infrared imaging system for high spatial and temporal resolution crop water stress monitoring of corn within a greenhouse. Comput. Electron. Agric. 2016, 121, 149–159. [Google Scholar] [CrossRef]
  14. Kurunc, A.; Tezcan, N.Y.; Bimurzayev, N. Determination of Water Stress in Wheat Crops by Thermal Images Under Mediterranean Conditions. Commun. Soil Sci. Plant Anal. 2023, 54, 1713–1726. [Google Scholar] [CrossRef]
  15. Banerjee, K.; Krishnan, P.; Das, B. Thermal imaging and multivariate techniques for characterizing and screening wheat genotypes under water stress condition. Ecol. Indic. 2020, 119, 106829. [Google Scholar] [CrossRef]
  16. Tavares, T.R.; Molin, J.P.; Javadi, S.H.; de Carvalho, H.W.P.; Mouazen, A.M. Combined Use of Vis-NIR and XRF Sensors for Tropical Soil Fertility Analysis: Assessing Different Data Fusion Approaches. Sensors 2021, 21, 148. [Google Scholar] [CrossRef]
  17. Zarco-Tejada, P.J.; González-Dugo, V.; Berni, J.A.J. Fluorescence, temperature and narrow-band indices acquired from a UAV platform for water stress detection using a micro-hyperspectral imager and a thermal camera. Remote Sens. Environ. 2012, 117, 322–337. [Google Scholar] [CrossRef]
  18. Sims, D.A.; Gamon, J.A. Estimation of vegetation water content and photosynthetic tissue area from spectral reflectance: A comparison of indices based on liquid water and chlorophyll absorption features. Remote Sens. Environ. 2003, 84, 526–537. [Google Scholar] [CrossRef]
  19. Wang, Q.Y.; Zhao, Y.L.; Yang, F.F.; Liu, T.; Xiao, W.; Sun, H.Y. Simulating Heat Stress of Coal Gangue Spontaneous Combustion on Vegetation Using Alfalfa Leaf Water Content Spectral Features as Indicators. Remote Sens. 2021, 13, 2634. [Google Scholar] [CrossRef]
  20. Galvao, R.K.H.; Araújo, M.C.U.; Fragoso, W.D.; Silva, E.C.; José, G.E.; Soares, S.F.C.; Paiva, H.M. A variable elimination method to improve the parsimony of MLR models using the successive projections algorithm. Chemom. Intell. Lab. Syst. 2008, 92, 83–91. [Google Scholar] [CrossRef]
  21. Huang, L.S.; Zhang, H.S.; Ruan, C.; Huang, W.J.; Hu, T.G.; Zhao, J.L. Detection of scab in wheat ears using in situ hyperspectral data and support vector machine optimized by genetic algorithm. Int. J. Agric. Biol. Eng. 2020, 13, 182–188. [Google Scholar] [CrossRef]
  22. Shi, B.; Yuan, Y.F.; Zhuang, T.X.; Xu, X.; Schmidhalter, U.; Ata-Ui-Karim, S.T.; Zhao, B.; Liu, X.J.; Tian, Y.C.; Zhu, Y.; et al. Improving water status prediction of winter wheat using multi-source data with machine learning. Eur. J. Agron. 2022, 139, 126548. [Google Scholar] [CrossRef]
  23. Sudu, B.; Rong, G.Z.; Guga, S.; Li, K.W.; Zhi, F.; Guo, Y.; Zhang, J.Q.; Bao, Y.L. Retrieving SPAD Values of Summer Maize Using UAV Hyperspectral Data Based on Multiple Machine Learning Algorithm. Remote Sens. 2022, 14, 5407. [Google Scholar] [CrossRef]
  24. Wang, L.S.; Wang, R.J.; Lu, C.P.; Wang, J.; Huang, W. Rapid determination of moisture content in compound fertilizer using visible and near infrared spectroscopy combined with chemometrics. Infrared Phys. Technol. 2019, 102, 6–20. [Google Scholar] [CrossRef]
  25. Cheng, T.; Rivard, B.; Sánchez-Azofeifa, G.A.; Feng, J.; Calvo-Polanco, M. Continuous wavelet analysis for the detection of green attack damage due to mountain pine beetle infestation. Remote Sens. Environ. 2010, 114, 899–910. [Google Scholar] [CrossRef]
  26. Peng, J.; Shen, H.; He, S.W.; Wu, J.S. Soil moisture retrieving using hyperspectral data with the application of wavelet analysis. Environ. Earth Sci. 2013, 69, 279–288. [Google Scholar] [CrossRef]
  27. Gu, X.H.; Wang, Y.C.; Sun, Q.; Yang, G.J.; Zhang, C. Hyperspectral inversion of soil organic matter content in cultivated land based on wavelet transform. Comput. Electron. Agric. 2019, 167, 105053. [Google Scholar] [CrossRef]
  28. Cheng, T.; Riaño, D.; Ustin, S.L. Detecting diurnal and seasonal variation in canopy water content of nut tree orchards from airborne imaging spectroscopy data using continuous wavelet analysis. Remote Sens. Environ. 2014, 143, 39–53. [Google Scholar] [CrossRef]
  29. Cheng, T.; Rivard, B.; Sánchez-Azofeifa, A. Spectroscopic determination of leaf water content using continuous wavelet analysis. Remote Sens. Environ. 2011, 115, 659–670. [Google Scholar] [CrossRef]
  30. Li, J.B.; Huang, W.Q.; Chen, L.P.; Fan, S.X.; Zhang, B.H.; Guo, Z.M.; Zhao, C.J. Variable Selection in Visible and Near-Infrared Spectral Analysis for Noninvasive Determination of Soluble Solids Content of ‘Ya’ Pear. Food Anal. Methods 2014, 7, 1891–1902. [Google Scholar] [CrossRef]
  31. Huang, X.Y.; Wang, X.M.; Baishan, K.; An, B.S. Hyperspectral Estimation of Soil Organic Carbon Content Based on Continuous Wavelet Transform and Successive Projection Algorithm in Arid Area of Xinjiang, China. Sustainability 2023, 15, 2587. [Google Scholar] [CrossRef]
  32. Nawar, S.; Corstanje, R.; Halcro, G.; Mulla, D.; Mouazen, A.M. Delineation of Soil Management Zones for Variable-Rate Fertilization: A Review. Adv. Agron. 2017, 143, 175–245. [Google Scholar]
  33. Elsayed, S.; Elhoweity, M.; Ibrahim, H.H.; Dewir, Y.H.; Migdadi, H.M.; Schmidhalter, U. Thermal imaging and passive reflectance sensing to estimate the water status and grain yield of wheat under different irrigation regimes. Agric. Water Manag. 2017, 189, 98–110. [Google Scholar] [CrossRef]
  34. Wang, J.J.; Lou, Y.; Wang, W.T.; Liu, S.Y.; Zhang, H.H.; Hui, X.; Wang, Y.L.; Yan, H.J.; Maes, W.H. A robust model for diagnosing water stress of winter wheat by combining UAV multispectral and thermal remote sensing. Agric. Water Manag. 2024, 291, 108616. [Google Scholar] [CrossRef]
  35. Castanedo, F. A Review of Data Fusion Techniques. Sci. World J. 2013, 2013, 704504. [Google Scholar] [CrossRef]
  36. Xu, D.Y.; Chen, S.C.; Rossel, R.A.V.; Biswas, A.; Li, S.; Zhou, Y.; Shi, Z. X-ray fluorescence and visible near infrared sensor fusion for predicting soil chromium content. Geoderma 2019, 352, 61–69. [Google Scholar] [CrossRef]
  37. Granger, C.W.J.; Ramanathan, R.J.J.o.F. Improved Methods of Combining Forecasts. J. Forecast. 1984, 3, 197–204. [Google Scholar] [CrossRef]
  38. O’Rourke, S.M.; Stockmann, U.; Holden, N.M.; McBratney, A.B.; Minasny, B. An assessment of model averaging to improve predictive power of portable vis-NIR and XRF for the determination of agronomic soil properties. Geoderma 2016, 279, 31–44. [Google Scholar] [CrossRef]
  39. Shi, X.Y.; Song, J.H.; Wang, H.J.; Lv, X.; Zhu, Y.Q.; Zhang, W.X.; Bu, W.Q.; Zeng, L.Y. Improving soil organic matter estimation accuracy by combining optimal spectral preprocessing and feature selection methods based on pXRF and vis-NIR data fusion. Geoderma 2023, 430, 116301. [Google Scholar] [CrossRef]
  40. Pancorbo, J.L.; Camino, C.; Alonso-Ayuso, M.; Sereno, R.; Gonzalez-Fernandez, I.; Gabriel, J.; Zarco-Tejada, P.; Quemada, M. Simultaneous assessment of nitrogen and water status in winter wheat using hyperspectral and thermal sensors. Eur. J. Agron. 2021, 127, 126287. [Google Scholar] [CrossRef]
  41. Purushothaman, R.; Thudi, M.; Krishnamurthy, L.; Upadhyaya, H.D.; Kashiwagi, J.; Gowda, C.L.L.; Varshney, R.K. Association of mid-reproductive stage canopy temperature depression with the molecular markers and grain yields of chickpea (Cicer arietinum L.) germplasm under terminal drought. Field Crops Res. 2015, 174, 1–11. [Google Scholar] [CrossRef]
  42. Elsayed, S.; Rischbeck, P.; Schmidhalter, U. Comparing the performance of active and passive reflectance sensors to assess the normalized relative canopy temperature and grain yield of drought-stressed barley cultivars. Field Crops Res. 2015, 177, 148–160. [Google Scholar] [CrossRef]
  43. Jones, H.G. Use of infrared thermometry for estimation of stomatal conductance as a possible aid to irrigation scheduling. Agric. For. Meteorol. 1999, 95, 139–149. [Google Scholar] [CrossRef]
  44. Zhao, J.; Li, H.; Chen, C.; Pang, Y.Y.; Zhu, X.Q. Detection of Water Content in Lettuce Canopies Based on Hyperspectral Imaging Technology under Outdoor Conditions. Agriculture 2022, 12, 1796. [Google Scholar] [CrossRef]
  45. Lakshmanan, M.K.; Boelt, B.; Gislum, R. A chemometric method for the viability analysis of spinach seeds by near infrared spectroscopy with variable selection using successive projections algorithm. J. Near Infrared Spectrosc. 2023, 31, 24–32. [Google Scholar] [CrossRef]
  46. Elvanidi, A.; Katsoulas, N.; Ferentinos, K.P.; Bartzanas, T.; Kittas, C. Hyperspectral machine vision as a tool for water stress severity assessment in soilless tomato crop. Biosyst. Eng. 2018, 165, 25–35. [Google Scholar] [CrossRef]
  47. Krishna, G.; Rabi, N.; Singh, P.; Bajpai, V.; Patra, H.; Kumar, S.; Dandapani, R.; Gupta, V.K.; Viswanathan, C.; Ahmad, T.; et al. Comparison of various modelling approaches for water deficit stress monitoring in rice crop through hyperspectral remote sensing. Agric. Water Manag. 2019, 213, 231–244. [Google Scholar] [CrossRef]
  48. Yi, Q.X.; Bao, A.M.; Wang, Q.; Zhao, J. Estimation of leaf water content in cotton by means of hyperspectral indices. Comput. Electron. Agric. 2013, 90, 144–151. [Google Scholar] [CrossRef]
  49. Chandel, A.K.; Khot, L.R.; Yu, L.X. Alfalfa (Medicago sativa L.) crop vigor and yield characterization using high-resolution aerial multispectral and thermal infrared imaging technique. Comput. Electron. Agric. 2021, 182, 105999. [Google Scholar] [CrossRef]
  50. Yu, M.H.; Ding, G.D.; Gao, G.L.; Zhao, Y.Y.; Yan, L.; Sai, K. Using Plant Temperature to Evaluate the Response of Stomatal Conductance to Soil Moisture Deficit. Forests 2015, 6, 3748–3762. [Google Scholar] [CrossRef]
  51. Feng, Z.H.; Song, L.; Duan, J.Z.; He, L.; Zhang, Y.Y.; Wei, Y.K.; Feng, W. Monitoring Wheat Powdery Mildew Based on Hyperspectral, Thermal Infrared, and RGB Image Data Fusion. Sensors 2022, 22, 31. [Google Scholar] [CrossRef] [PubMed]
  52. Pandey, B.R.; Burton, W.A.; Salisbury, P.A.; Nicolas, M.E. Comparison of osmotic adjustment, leaf proline concentration, canopy temperature and root depth for yield of juncea canola under terminal drought. J. Agron. Crop Sci. 2017, 203, 397–405. [Google Scholar] [CrossRef]
  53. Ray, S.S.; Das, G.; Singh, J.P.; Panigrahy, S. Evaluation of hyperspectral indices for LAI estimation and discrimination of potato crop under different irrigation treatments. Int. J. Remote Sens. 2006, 27, 5373–5387. [Google Scholar] [CrossRef]
  54. Ebrahimi, H.; Rajaee, T. Simulation of groundwater level variations using wavelet combined with neural network, linear regression and support vector machine. Glob. Planet Change 2017, 148, 181–191. [Google Scholar] [CrossRef]
  55. Dou, S.Q.; Zhang, W.J.; Deng, Y.X.; Zhang, C.H.; Mei, Z.M.; Yan, J.C.; Li, M.L. Comparison of Citrus Leaf Water Content Estimations Based on the Continuous Wavelet Transform and Fractional Derivative Methods. Horticulturae 2024, 10, 177. [Google Scholar] [CrossRef]
  56. Zhao, X.H.; Zhang, J.C.; Pu, R.L.; Shu, Z.F.; He, W.Z.; Wu, K.H. The continuous wavelet projections algorithm: A practical spectral-feature-mining approach for crop detection. Crop J. 2022, 10, 1264–1273. [Google Scholar] [CrossRef]
  57. Zygielbaum, A.I.; Gitelson, A.A.; Arkebauer, T.J.; Rundquist, D.C. Non-destructive detection of water stress and estimation of relative water content in maize. Geophys. Res. Lett. 2009, 36, 1–4. [Google Scholar] [CrossRef]
  58. Liu, S.B.; Jin, X.L.; Nie, C.W.; Wang, S.Y.; Yu, X.; Cheng, M.H.; Shao, M.C.; Wang, Z.X.; Tuohuti, N.; Bai, Y.; et al. Estimating leaf area index using unmanned aerial vehicle data: Shallow vs. deep machine learning algorithms. Plant Physiol. 2021, 187, 1551–1576. [Google Scholar] [CrossRef]
  59. Maimaitijiang, M.; Sagan, V.; Sidike, P.; Hartling, S.; Esposito, F.; Fritschi, F.B. Soybean yield prediction from UAV using multimodal data fusion and deep learning. Remote Sens. Environ. 2020, 237, 111599. [Google Scholar] [CrossRef]
  60. Wang, S.; Wang, C.Z.; Zhang, C.L.; Xue, J.Y.; Wang, P.; Wang, X.W.; Wang, W.S.; Zhang, X.; Li, W.C.; Huang, G.H.; et al. A classification-based spatiotemporal adaptive fusion model for the evaluation of remotely sensed evapotranspiration in heterogeneous irrigated agricultural area. Remote Sens. Environ. 2022, 273, 112962. [Google Scholar] [CrossRef]
  61. Tian, M.Y.; Ma, X.B.; Liang, M.Y.; Zang, H.C. Application of Rapid Identification and Determination of Moisture Content of Coptidis Rhizoma from Different Species Based on Data Fusion. J. AOAC Int. 2023, 106, 1389–1401. [Google Scholar] [CrossRef] [PubMed]
  62. Shrestha, G.; Calvelo-Pereira, R.; Roudier, P.; Martin, A.P.; Turnbull, R.E.; Kereszturi, G.; Jeyakumar, P.; Anderson, C.W.N. Quantification of multiple soil trace elements by combining portable X-ray fluorescence and reflectance spectroscopy. Geoderma 2022, 409, 115649. [Google Scholar] [CrossRef]
Figure 1. Distribution map of study areas. Notes: In 2020–2021 and 2021–2022, variety 1 and variety 2 are Zhoumai-27 and Luomai-22, respectively. In 2022–2023, variety 1 and variety 2 are Yunong-804 and Xinmai-26, respectively.
Agronomy 14 02569 g001
Figure 2. Distribution of rainfall and average temperature in the three experimental years in the study area.
Agronomy 14 02569 g002
Figure 3. Average monthly solar radiation in the three experimental years in the study area.
Agronomy 14 02569 g003
Figure 4. The flowchart of the research process.
Agronomy 14 02569 g004
Figure 5. Histogram of canopy temperature of Luomai 22 at three growth stages under different water treatments.
Agronomy 14 02569 g005
Figure 6. Histogram of canopy temperature of Zhoumai 27 at three growth stages under different water treatments.
Agronomy 14 02569 g006
Figure 7. Response of canopy temperature parameters at three growth stages under different water treatments in winter wheat. Different lowercase letters indicate significant differences between different water treatments (p < 0.05).
Agronomy 14 02569 g007
Figure 8. Hyperspectral spectral response of winter wheat canopy under water treatment at different growth stages. Notes: (AC) are the spectral reflectance of winter wheat at jointing, booting and filling stages, respectively. (A1C1) and (A2C2) represent the reflectance values of Luomai 22 and Zhoumai 27, respectively.
Agronomy 14 02569 g008
Figure 9. Correlation between canopy water content and spectral reflectance in winter wheat.
Agronomy 14 02569 g009
Figure 10. Correlation coefficient between wavelet energy coefficient and canopy water content at each decomposition scale in winter wheat.
Agronomy 14 02569 g010
Figure 11. Absolute correlation coefficient between wavelet energy coefficient and canopy water content at each decomposition scale in winter wheat.
Agronomy 14 02569 g011
Figure 12. Distribution of sensitive bands in the characteristic spectrum of each layer of CWT1~CWT 8.
Agronomy 14 02569 g012
Figure 13. Modeling and validation of CWC prediction model based on original spectrum and optimised spectral variables. Note: (a,b) are the modeling set and validation set of CWC prediction model based on original spectral band respectively, and (c,d) are the modeling set and validation set of CWC prediction model based on optimised spectral variables respectively.
Agronomy 14 02569 g013
Figure 14. Modeling and verification effect of CWC prediction model based on GRA algorithm. Note: (a,b) are the modeling set and validation set of CWC prediction model based on GRA algorithm respectively.
Agronomy 14 02569 g014
Table 1. Winter Wheat cultivars and test management.
YearVarietySowing DateHarvest DateWater Treatment DateMaturityDrought ResistanceSeeding Rate (kg/hm2)Plant Height (cm)Number of Grains per Ear
2020–2021Luomai-2211 October 202026 May 202121 March 2021Mid late maturing Drought tolerance110–12576–8335–37
Zhoumai-27Mid maturingMid drought tolerance115–13074–7836–38
2021–2022Luomai-2213 October 202126 May 202223 March 2022Mid late maturingDrought tolerance110–12575–8135–37
Zhoumai-27Mid maturingMid drought tolerance115–13076–7936–38
2022–2023Xinmai-2610 October 202228 May 202320 March 2023Mid maturingMid drought tolerance115–13078–8234–36
Yunong-804Mid late maturingDrought tolerance120–13577–8236–38
Table 2. Canopy temperature parameters and calculation formula.
Canopy Temperature ParameterCalculation FormulaReferences
Canopy temperature depression (CTD)CTD = Ta − Tc[41]
Normalized relative canopy temperature (NRCT) NRCT = T l e a f T m i n T m a x T m i n [42]
Stomatal conductance index (IG) I G = T d r y T l e a f T l e a f T w e t [43]
Average canopy temperature (TAV) T AV = T m a x T m i n T m a x [12]
Table 3. Collinearity diagnosis of canopy temperature parameters in winter wheat.
FactorVariance Inflation Factor
CTD2.933
IG5.554
NRCT3.563
TAV5.606
Table 4. Calibration and validation analysis of canopy water content based on single-sensor and multi-sensor fusion.
Calibration DatasetsValidation Datasets
R2RMSEnRMSER2RMSEnRMSE
HS-CWC0.8645.92%8.63%0.8337.13%9.78%
TI-CWC0.8137.22%10.49%0.7838.84%12.40%
GRA-CWC0.9134.98%7.27%0.8736.11%8.67%
Disclaimer/Publisher’s Note: The statements, opinions and data contained in all publications are solely those of the individual author(s) and contributor(s) and not of MDPI and/or the editor(s). MDPI and/or the editor(s) disclaim responsibility for any injury to people or property resulting from any ideas, methods, instructions or products referred to in the content.