Article

Effects of Natural Factors and Production Management on the Soil Quality of Agricultural Greenhouses in the Lhasa River Valley, Tibetan Plateau

1
Key Laboratory of Land Surface Pattern and Simulation, Institute of Geographic Sciences and Natural Resources Research, Chinese Academy of Sciences, Beijing 100101, China
2
University of Chinese Academy of Sciences, Beijing 100049, China
3
National Disaster Reduction Center, Ministry of Emergency Management, Beijing 100124, China
*
Author to whom correspondence should be addressed.
Agronomy 2024, 14(11), 2708; https://doi.org/10.3390/agronomy14112708
Submission received: 18 October 2024 / Revised: 6 November 2024 / Accepted: 13 November 2024 / Published: 17 November 2024

Abstract

:
Agricultural greenhouses (AGs) are an effective solution to address the growing demand for vegetables despite limited cropland, yet significant soil quality problems often accompany them, particularly in high-altitude regions. However, the effects of natural factors and production management on soil quality are not well understood in such fragile environments. This study analyzed soil quality differences between AGs and adjacent open cropland (OCs) in the Lhasa River Valley, Tibetan Plateau, based on 592 soil samples and 12 key soil physicochemical indicators. GeoDetector was used to identify the dominant factors and their interactions with these differences. The results showed that AG soils had significantly lower pH, with an average decrease of 20%, indicating acidification, while nutrient levels and total salinity were significantly higher compared to OC soils. Specifically, available phosphorus, available potassium, the soil fertility quality index, and total soluble salt increased by 281%, 102%, 38%, and 184%, respectively. Planting, topographic, and fertilizer factors were identified as the dominant factors contributing to these differences. Interaction analysis showed that the interaction of these factors increased the explanatory power by 20.2% to 41.32% compared to individual factors. The interaction between planting year and fertilizer type had the highest explanatory power for nutrient increases and pH decline, while fertilizer amount and slope aspect contributed to salinity accumulation. These findings provide valuable insights and practical guidance for optimizing AG management and ensuring sustainable agricultural development in high-altitude regions.

1. Introduction

In the context of doubling global food demand in the next 50 years [1], agricultural greenhouses (AGs) have emerged as a vital strategy to enhance vegetable yield and quality through controlled environmental conditions [2,3]. AGs have been widely adopted in 119 countries, playing a crucial role in improving agricultural production [4]. They have particularly been adopted in China, and by the end of 2017, the total area of AG land exceeded 3.5 million hectares, accounting for 95% of the global greenhouse agriculture area [5]. Greenhouse vegetable production contributes to more than one-third of China’s total vegetable production [5,6]. However, AG management often leads to various soil problems, including acidification, salinization, and nutrient imbalances [7,8,9,10]. These issues weaken soil fertility and structural stability, reducing vegetable yields and quality but also potentially threatening human health [11,12]. Therefore, monitoring soil quality variations and identifying key influencing factors are crucial for the sustainable development of AGs and ensuring long-term agricultural stability.
To maintain soil quality, it is critical to understand how natural factors and human activities affect soil quality. In open croplands (OCs), soil quality changes are relatively slow and natural, driven by precipitation, climate change, and biodiversity [13,14]. In contrast, AGs are relatively enclosed environments, where amounts of water and fertilizer are utilized to easily alter soil properties [15,16]. Studies have shown that AG soils often face more severe soil problems than OC [15,17]. Excessive fertilization is widely regarded as the primary driver of these soil issues in AGs [18]. For instance, nitrogen application rates in AGs are estimated to be about ten times higher than those in OCs [19]. In Eastern China, the overuse of urea and other nitrogen fertilizers has led to acidification and salinity accumulation, affecting soil quality negatively [20]. In Southern Germany, improper fertilization has also caused nutrient imbalances, impacting soil pH and salinity [14]. Beyond fertilization, the duration of cultivation and continuous cropping can enhance nutrient levels in AG soils, and the risks of soil acidification and secondary salinization increase with the length of cultivation [21,22]. Moreover, higher irrigation rates reduce available nutrients and may exacerbate salinization [23]. In addition, natural environmental factors, including elevation, slope gradient, and aspect, determine the hydrothermal conditions and soil development [24,25,26,27]. These factors also influence the soil properties of AGs. However, the majority of global greenhouse clusters are located in plains [4], while relatively few studies have examined high-altitude areas.
High-altitude regions present challenges to AGs due to the fragile natural environments and harsh climatic conditions [28]. The Tibetan Plateau, with an average altitude exceeding 4000 m [29], has limited agricultural activity confined mainly to the river valleys [30]. In recent years, AGs have been regarded as an ideal way to enhance vegetable yield and quality, contributing more than 65% to the region’s vegetable self-supply [31]. However, maintaining soil quality under AG management in such sensitive environments is particularly challenging. Studies conducted in the Lhasa River Valley have reported problems such as soil acidification, salinization, and nutrient imbalances in AGs [31,32,33]. Despite these findings, existing research has often focused on the correlation between individual soil indicators and production management without assessing the relative importance of these factors or their interactions. Moreover, there is a trend of expanding AG land to higher altitudes [34,35]. However, the effect of the unique natural environment, characterized by obvious elevation gradients and diverse topographic features, has been largely overlooked [31,32]. As a result, to bridge this knowledge gap, the following three questions must be addressed: (1) In high-altitude environments, which factors—natural or production management—have a more significant impact on soil quality? (2) Among the individual factors, which factors are the dominant contributors to the observed soil quality differences? (3) How do interactions among individual factors influence soil quality differences?
To answer these questions, our study investigates AG soil in the Lhasa River Valley of the Tibetan Plateau, using open cropland soils as a reference for comparison. We focused on key soil properties, including pH, salinity, and nutrient content. We employed the GeoDetector model to analyze the dominant factors, influencing soil quality and their interactions. The specific objectives are as follows: (i) to identify significant indicators of soil quality differences between AG and OC soils; (ii) to reveal the factors influencing soil quality differences and their interactions. The findings will offer a scientific basis for optimizing AG practices and promoting soil conservation in high-altitude regions and other similar environments worldwide.

2. Materials and Methods

2.1. Study Area

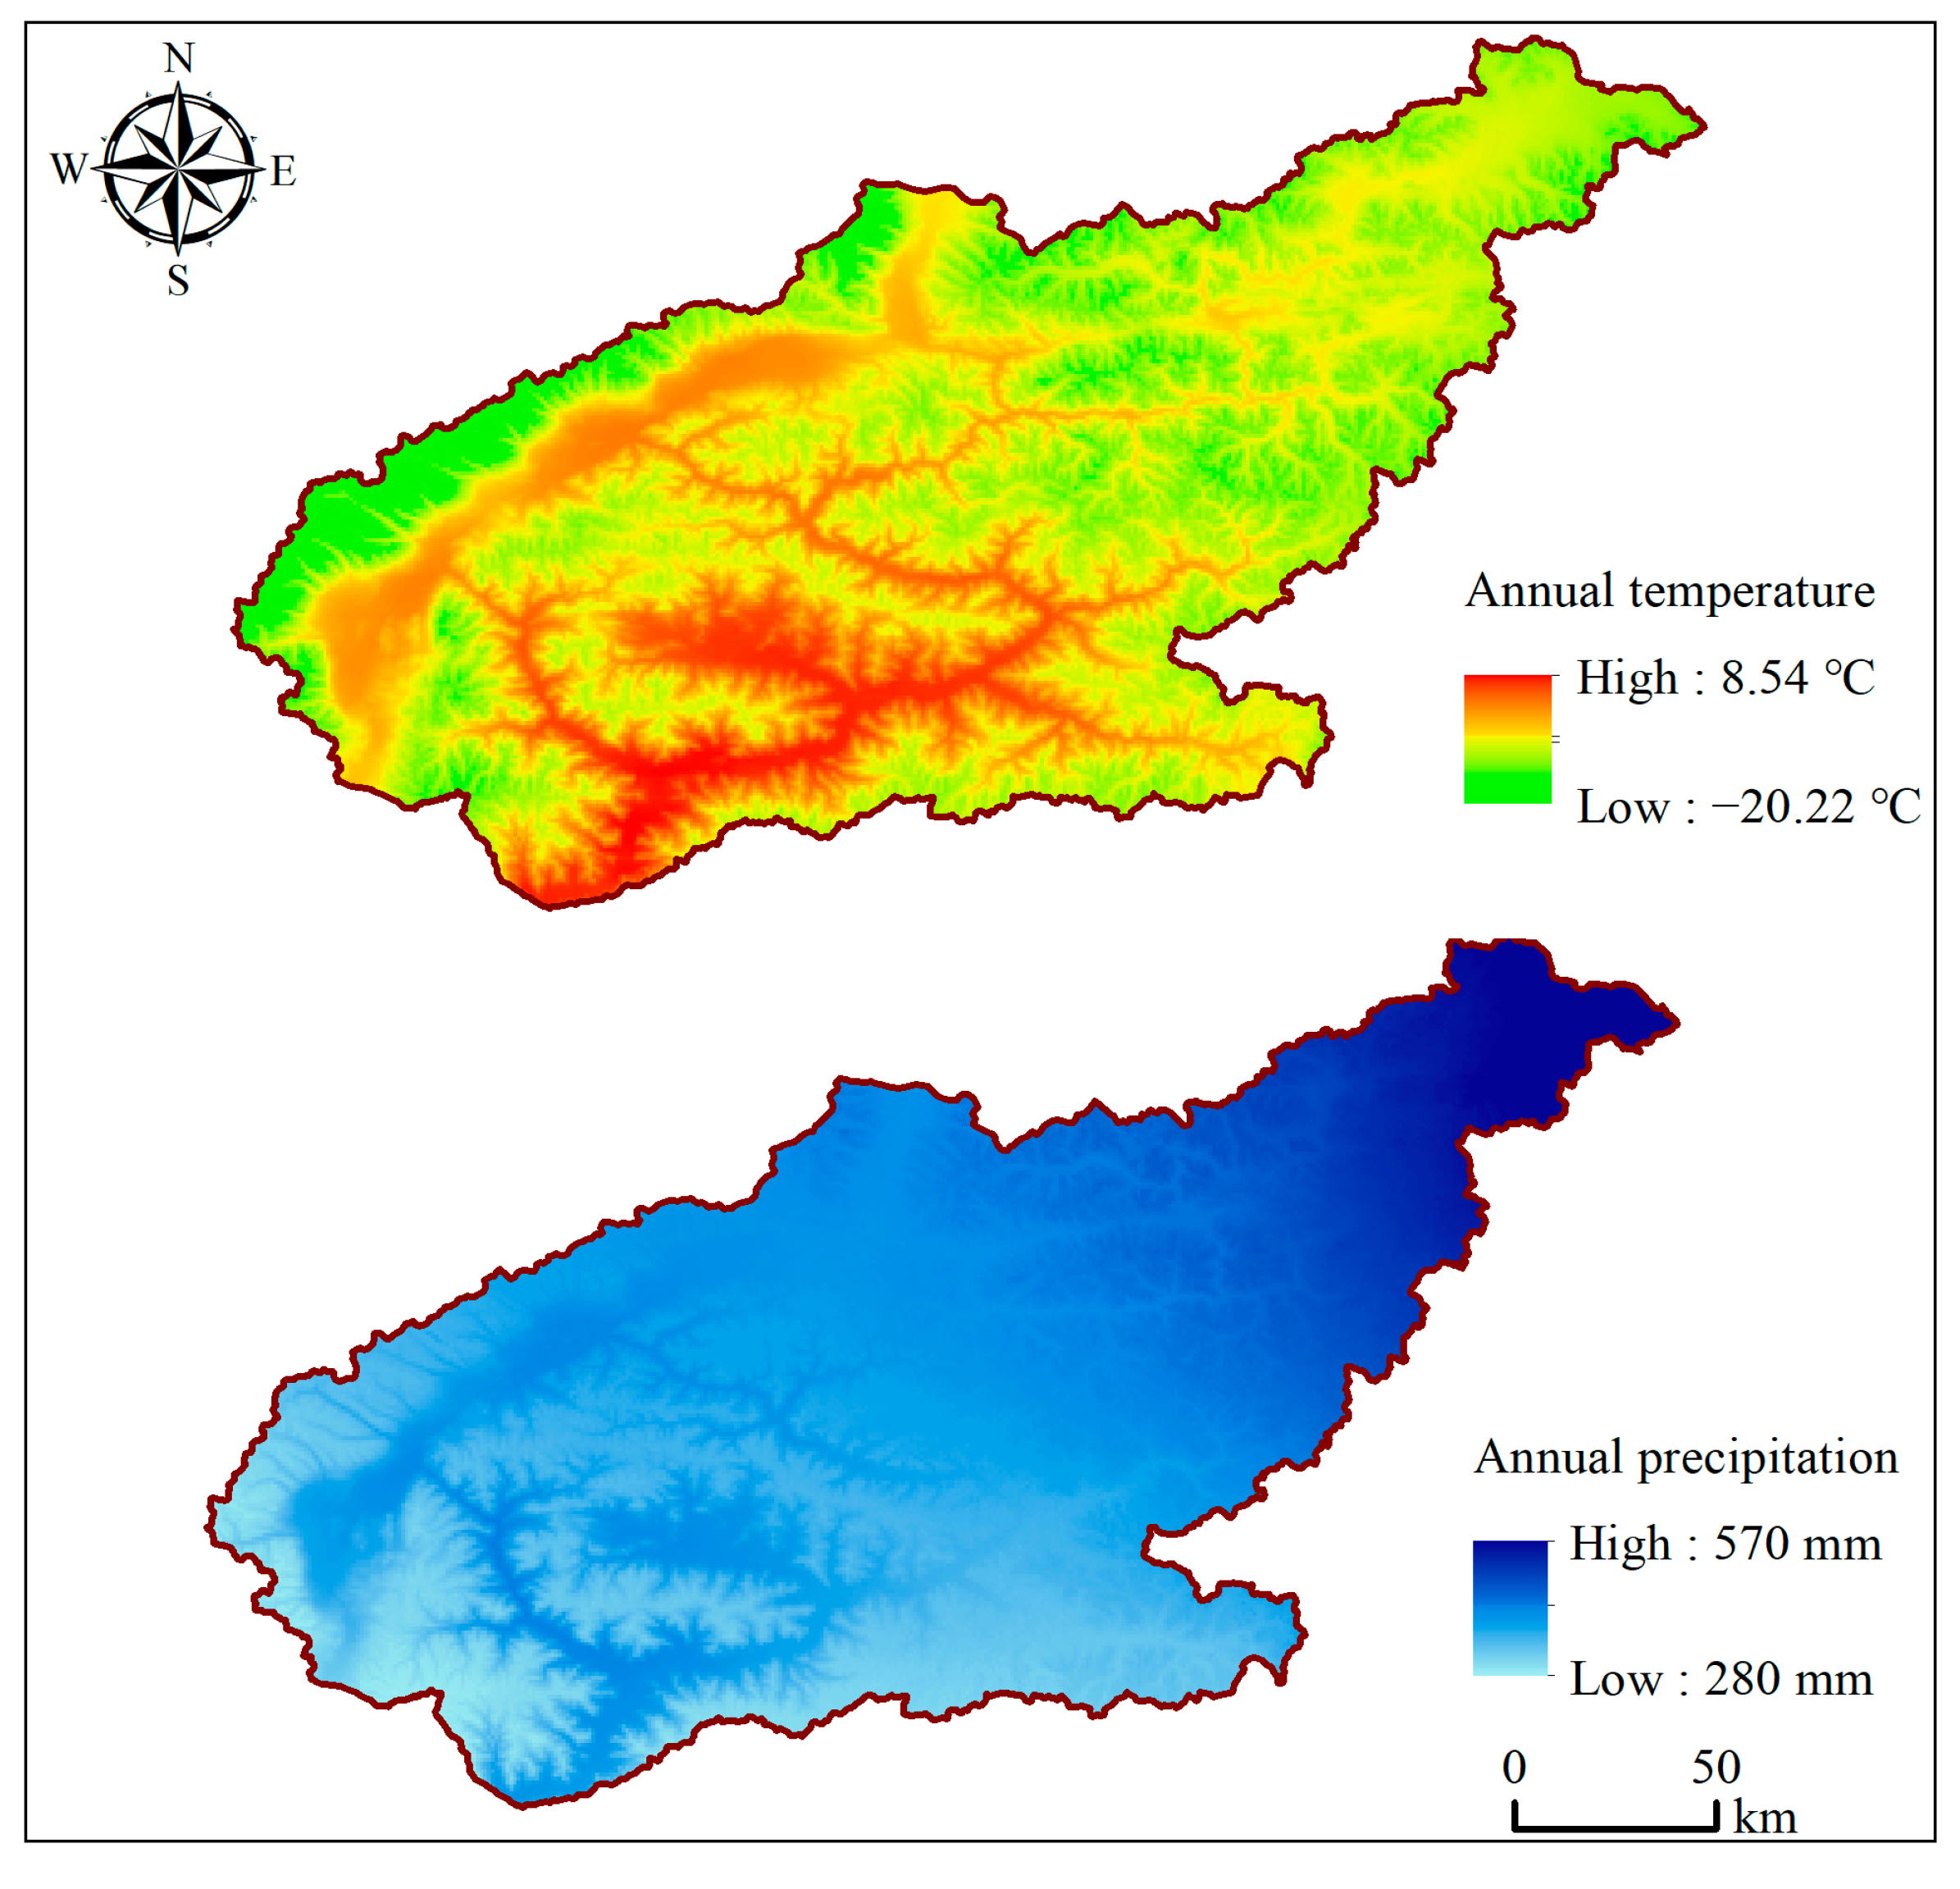
The Lhasa River is located in the middle reaches of the Yarlung Zangbo River on the Tibetan Plateau in China (Figure 1). The Lhasa River Valley is a broad inter-mountain valley and lake basin that features undulating topography with an average elevation of approximately 4300 m and a floor elevation ranging from 3600 to 3800 m. This region experiences a temperate semi-arid monsoon climate, with the average annual temperature ranging from −20.2 to 8.5 °C and the average annual precipitation ranging from 280 to 570 mm (Figure A1). With over 3000 h of sunshine annually, the region provides ideal conditions for greenhouse vegetable cultivation [34]. AG lands, resembling a string of pearls, are distributed across terraces along both banks of the Lhasa River and its tributaries. The primary crops grown in these AGs are vegetables, while the adjacent OCs are used mainly for highland barley and wheat cultivation [31]. According to the Chinese Soil Taxonomy [36], the major soil types are Cambosols and Vertosols. According to the World Reference Base for Soil Resources (WRB), the major soil groups in this area are Fluvisols, Leptosols, and Arenosols. The soil depth impacted by agricultural machinery in this region is approximately 40 cm.

2.2. Experimental Design, Soil Sampling, and Analysis

AG and OC lands in the Lhasa River Valley were initially identified from 2008 to 2018 using high-definition Google Earth imagery [34]. Follow-up imaging confirmed that all AG lands were converted from OCs. Moreover, traditional agricultural management of OCs has not led to soil quality improvements and was found to be comparable to the undisturbed natural soils in the region [37]. Therefore, the adjacent OCs of the AGs can be selected as a reference to reflect the background of the AGs. To ensure uniform spatial distribution, 2 to 7 sample areas were selected in each county, totaling 25 sample areas (S1–S25) (Table A1). In each sample area, more than 20 AGs were included to ensure a good representation of commercialization. The reference sample areas were positioned immediately adjacent to the AG sample areas, with all OC sample areas cultivating highland barley. High commercialization rates in OC cultivation were avoided to maintain uniform farming management across the region.
In August 2018, soil samples were collected from the AGs and adjacent OC sample areas, covering a depth of 0–40 cm. Within each sample area, 2–5 sampling points were selected from the AG land and OCs; five sub-samples were combined to form a composite sample at each sampling point. Soil samples were collected at four different depths (0–10 cm, 10–20 cm, 20–30 cm, and 30–40 cm) using a stainless steel soil auger with a diameter of 5 cm [31]. After removing defective samples, 312 AG and 280 OC soil samples were collected. Additionally, in August 2023, we investigated nine soil profile points to identify soil parent materials based on geomorphic locations and lithological distributions of the AG sample areas [37].
All soil samples were taken to the laboratory. After air drying, the samples were manually crushed and thoroughly mixed. Gravel and plant residues were removed using a 2-millimeter sieve, and soil samples were taken to Southwest University for analysis. Soil texture was determined using a laser particle size analyzer and classified according to the International Soil Classification System [38]. Soil organic matter (SOM) was determined using the dichromate oxidation method [39]. Total nitrogen (TN) and alkali-hydrolyzable nitrogen (AN) in air-dried soil were measured using the Kjeldahl digestion method and the sodium hydroxide alkaline diffusion method, respectively [40]. Total phosphorus (TP) and available phosphorus (AP) in air-dried soil were extracted using the sodium hydroxide fusion method and the sodium bicarbonate extraction method, respectively, and were then determined using the molybdenum blue colorimetric method [41]. Total potassium (TK) and available potassium (AK) in air-dried soil were extracted using the acid dissolution method and the ammonium acetate leaching method, respectively, and were then measured using flame photometry [42]. Soil pH (1:2.5 soil–water ratio) was measured using a digital pH meter [43]. The total soluble salt content (TS) was determined using the residue on ignition method [44]. To ensure the accuracy and reliability of the tests, each sample was measured in triplicate, and the average value was recorded. For each batch, 20% of the samples were set as parallel samples, ensuring that the relative standard deviation remained below 5%.

2.3. Data Sources

The latitude, longitude, and elevation of the soil sampling points in AGs and OCs were recorded using a GPS device (Garmin Etrex Venture). Topographic data were obtained from the 30-meter digital elevation model, GDEM V2 (http://www.gscloud.cn (accessed on 15 March 2023)), from which slope and aspect were extracted. The planting year of an AG was determined using remote sensing imagery data [34]. Climate data, including mean annual temperature and precipitation for 2018 (spatial resolution: 1 km) were obtained from the National Tibetan Plateau Data Centre (https://tpdc.ac.cn (accessed on 21 April 2024)). The vegetable cultivar was recorded while sampling and the names were obtained from the Plant Plus of China database (http://www.iplant.cn (accessed on 21 April 2024)). The boundaries were sourced from National Basic Geographic Information (scale 1:4,000,000). The primary soil profile data of the main soil types on the Tibetan Plateau were sourced from the Soil Science Database (vdb3.soil.csdb.cn (accessed on 11 April 2024)). Fertilizer data of Lhasa were sourced from statistical yearbooks (https://data.cnki.net (accessed on 14 January 2024)). Questionnaires collected information on geographical information, crop species, fertilizers, irrigation, pesticides, yield, and income. Soil parent material was derived from the results of nine soil profile analyses.

2.4. Methods for the Analyses

2.4.1. Soil Fertility Quality Index

The soil fertility quality index (SFQI) integrates multiple soil indicators using weighted scoring functions based on soil test results [37,45]. In this study, SFQI was calculated to quantify the overall condition of soil nutrients. The SFQI is calculated using the following formula:
SFQI = i n W i × N i    
where SFQI is the soil fertility quality index; W i is the weight of the i t h indicator; N i   is the score of the i t h indicator; and n is the total number of soil indicators.
The SFQI incorporates several indicators, including SOM, TN, TP, TK, AN, AP, and AK [46]. The weights of the soil indicators are determined by common factor variance from the principal component analysis (PCA) [37,47] and are shown in Table A2. Previous research suggests that soil fertility indicators positively impact soil quality, prompting the development of membership scoring functions that correlate these indicators with soil productivity, categorized as “the more, the better” (M) [45]. The scoring function is defined as follows:
M x = 0.9 × 1 ,   x b         x a b a + 0.1 ,   a < x < b 0.1 , x a ,
where M x represents the scoring functions, with values ranging from 0.1 to 1; x is the actual measured value of the soil indicator; and a and b represent the lower and upper threshold values of the soil indicator, respectively.

2.4.2. Relative Change Rate

The differences in physicochemical properties between AG and OC soils were calculated using the “space instead of time” method [48], specifically through the relative change rate, as detailed below:
R C = x A G   x O C x O C
where R C is the relative change rate of a soil indicator; x A G is the actual measured value in the AG; and x O C is the value in the OC.

2.4.3. Geographical Detection of the Factors and Their Interactions

In this study, we hypothesize that a stronger correlation between influencing factors and the relative change in soil quality corresponds to a greater similarity in their spatial distributions. The GeoDetector model, based on the principle of spatial stratified heterogeneity, was employed to quantitatively assess the explanatory power of various factors on the spatial heterogeneity of soil quality indicators [49,50]. This model effectively reveals the consistency and statistical significance of natural and production management factors with the spatial distribution of RC in AG soils.
Factor detector: This method assesses the contribution of individual factors to significant differences in soil quality. The explanatory power (q) of a factor is quantified as follows.
q = 1 h = 1 L n h σ h 2 n σ 2
where q is the explanatory power of the factor; h = 1 L are the strata of the factor; n h and n are the number of impact factors in the h strata and soil samples, respectively; σ h 2 is the variance in the h strata; σ 2 is the total variance. The value of q ranges from 0 to 1, where a higher q value indicates a stronger explanatory power of the factor.
Interaction detector: This tool evaluates whether the interaction between two factors enhances the explanatory power of the RC beyond what is explained by each factor independently. It compares the q values of the individual factors with the combined q to assess their interaction. The results of these interactions are categorized as nonlinear enhancement, independence, bivariate enhancement, single-factor nonlinear weakening, and nonlinear weakening.
Based on previous research that incorporated collective contracting and construction features of AGs in the Lhasa River Valley [30], we selected topographic factors (elevation, slope aspect), a parent material factor (soil parent material), planting factors (planting year, planting pattern, and crop), fertilizer factors (fertilizer type, fertilizer amount), and an irrigation factor (irrigation pattern). These factors, classified into five categories, serve as the independent variables (X) in the GeoDetector model, with the RC of soil indicator as the dependent variable (Y). Detailed classifications of these factors are provided in Table 1.

2.5. Data Analysis and Processing

An initial integrity check was conducted on all raw data, and missing values from eight OC sampling points were imputed using the average values from the respective sample area. To improve analytical consistency, data from the 20–30 cm and 30–40 cm depths were combined into a single 20–40 cm layer. All soil data underwent Shapiro–Wilk tests for normality and Levene’s test for homogeneity of variances. When these conditions were met, differences in the means of the physicochemical indicators and SFQI between AG and OC soils were analyzed using ANOVA. Otherwise, Mann–Whitney U tests were applied (p ≤ 0.05). Paired-sample t-tests were used to identify indicators showing significant differences between AG and OC soils at three significance levels (p ≤ 0.05, p ≤ 0.01, p ≤ 0.001). All statistical analyses were performed using the SciPy library in Python [51]. The PCA was conducted using SPSS 27.0 (SPSS Inc., Chicago, MI, USA) [52]. Spatial distribution maps were generated using ArcGIS (version 10.8, Environmental Systems Research Institute, Redlands, CA, USA). Influence factor analysis was conducted using the GeoDetector model in R [53], with the relative change rate (RC) of soil indicators averaged over the 0–40 cm depth serving as the dependent variable (Y). Graphs were generated using the matplotlib library in Python.

3. Results

3.1. Descriptive Statistical Analysis of Soil Physicochemical Properties

The soil physicochemical indicators of AGs and OCs are presented in Table 2. Both AG and OC soils showed a sandy loam, with no significant differences observed in the clay, silt, and sand, indicating similar soil textures between AGs and OCs. However, other soil properties showed significant differences between AGs and OCs, highlighting the impacts of AG management. Specifically, the pH of AG soils was significantly lower, with an average value of 5.90 ± 1.46 compared to 7.07 ± 0.79 in the OC soils. This indicates the risk of soil acidification in AGs. The TS content in AG soils was significantly higher (0.64%), compared to OCs (0.37%), reflecting the accumulation of salts under greenhouse management. Regarding soil nutrients, except for TK, the AG soil nutrient indicators are significantly higher than those of OC. The SOM content in AG soils was notably higher, with an average of 27.01 g·kg−1 compared to 23.86 g·kg−1 in OC soils, which suggests that the controlled management conditions in AGs contributed to enhanced organic matter retention. Similar trends were observed for N, P, and AK. Particularly noteworthy is the AP content, which was almost three times higher in AG soils (113.5 mg·kg−1) compared to OC soils (42.87 mg·kg−1).
The coefficient of variation (C.V.) for soil physicochemical indicators further revealed differences in variability between AG and OC soils. In general, soil indicators in both AGs and OCs had moderate variability (10% < C.V. < 90%), suggesting considerable heterogeneity within these environments. Moreover, approximately two-thirds of the soil indicators in AGs exhibited higher variability compared to OCs, suggesting greater heterogeneity in the physicochemical properties of AG soils.
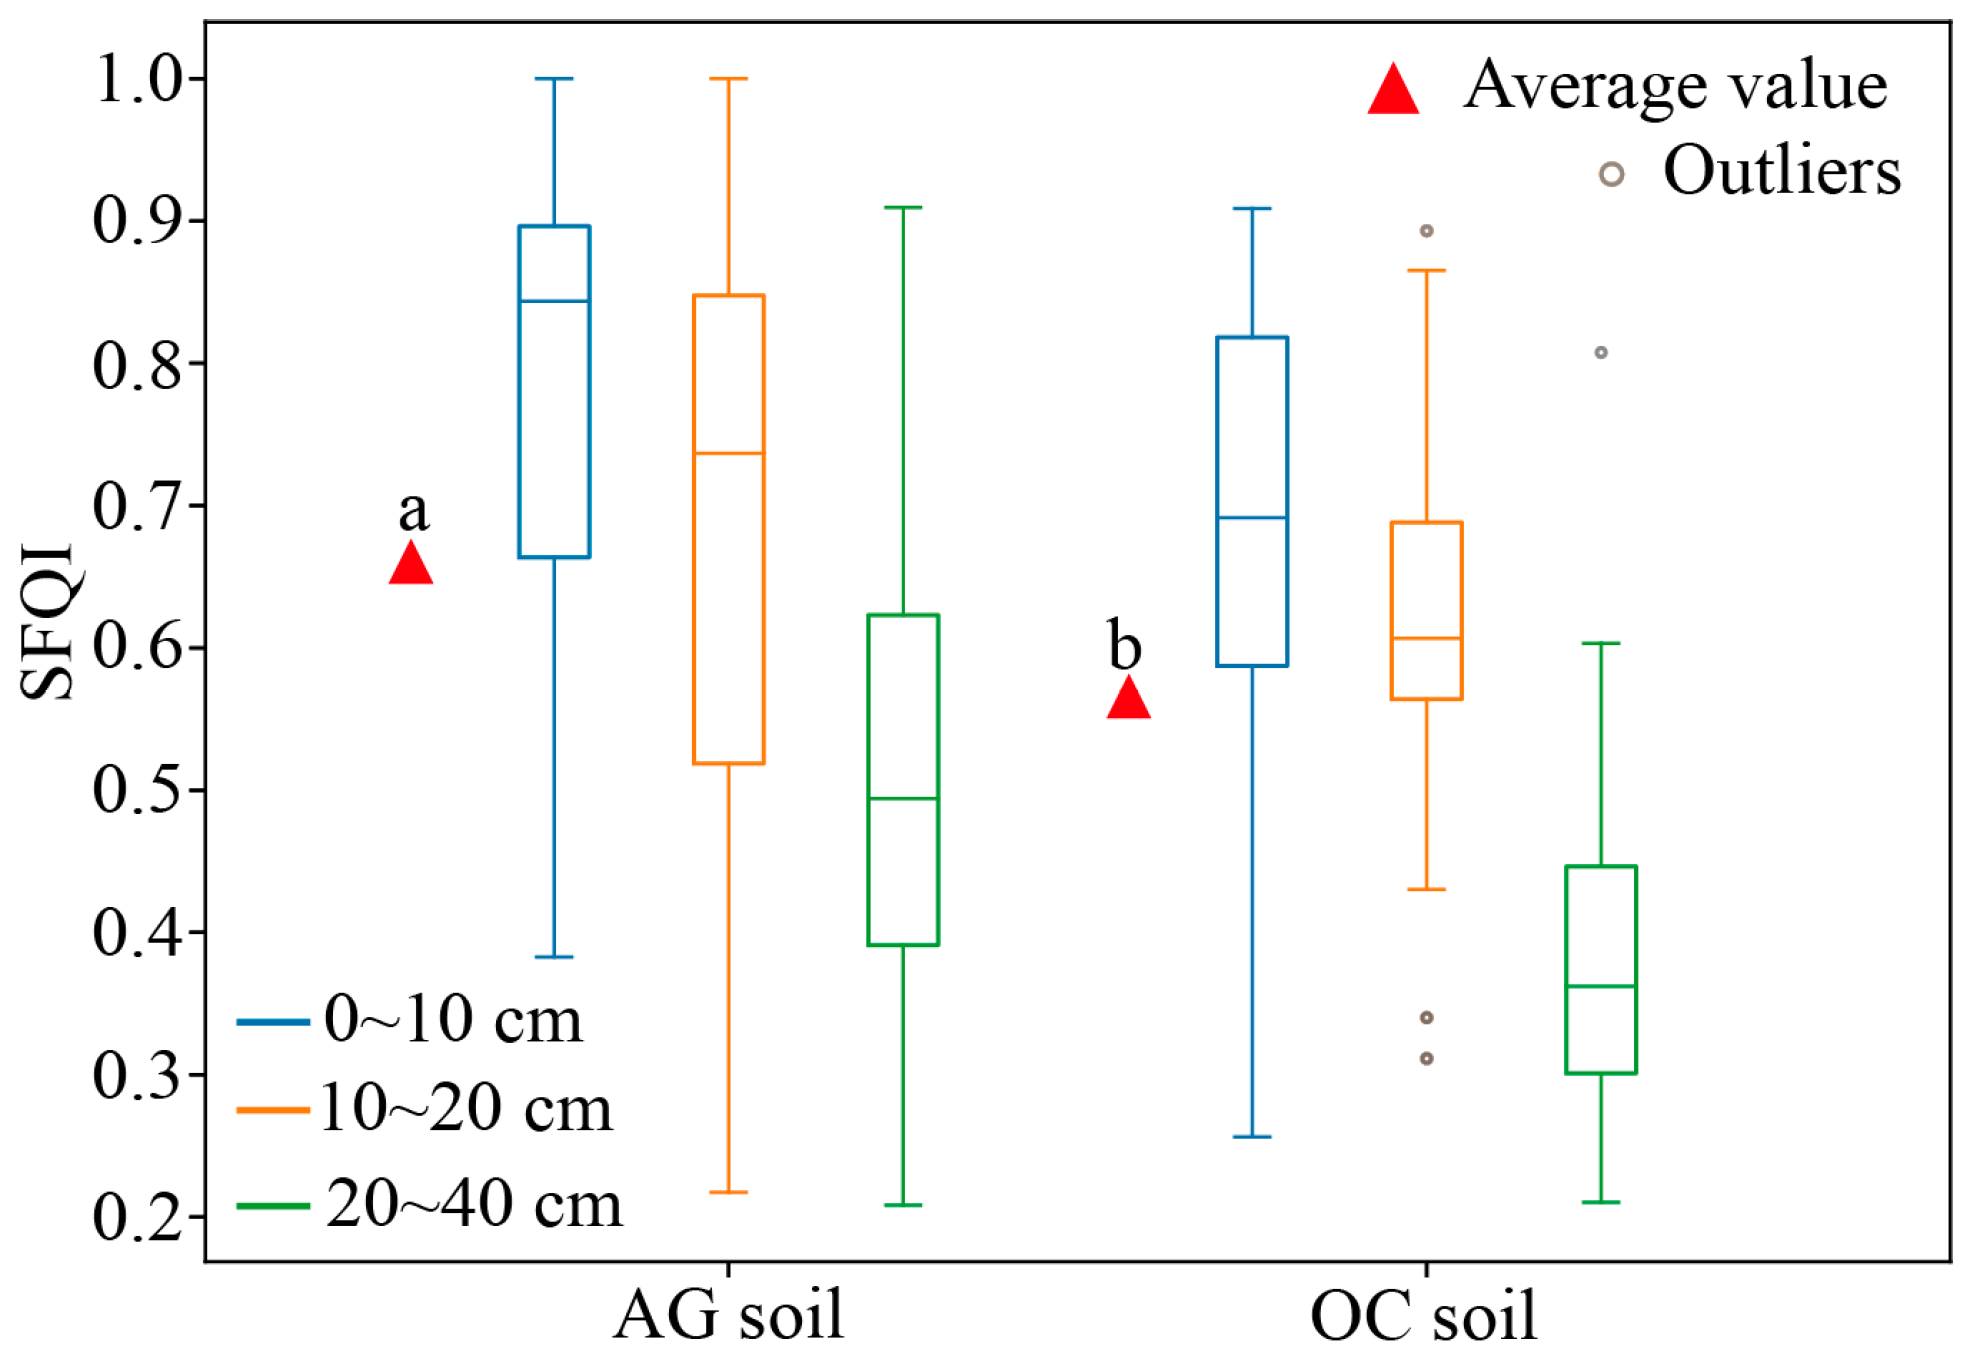
Figure 2 illustrates the SFQI values for AG and OC soils at three depths: 0–10 cm, 10–20 cm, and 20–40 cm. Across the entire 0–40 cm soil profile, the average SFQI value of AG soils was 0.66, which was significantly higher than that of OC soils (0.57). Furthermore, SFQI values in AG soils were consistently higher at each depth compared to OC soils, demonstrating that AG management contributes to an overall improvement in soil fertility compared to traditional open cropland management.

3.2. Identification and Analysis of Soil Quality Indicators with Significant Differences

The relative change rates of soil physicochemical indicators across different soil depths are shown in Figure 3. Significant differences in the relative change rate were observed for soil pH, TS, TP, AP, AK, and SFQI across all depths. In the 0–20 cm layer, pH exhibited a significant decline, while TS and AK showed obvious accumulation. TP showed a significant increase in the 10–20 cm layer, while AP showed consistent and significant improvements across all soil depths. SOM exhibited a significant increase only in the 0–10 cm layer, TN and AN did not show significant improvements in the 0–40 cm layer. However, the SFQI showed obvious improvement in the 20–40 cm layer. These results indicated that significant differences exist between AG and OC soils, with more pronounced effects observed at certain depths.
The relative change rates for different soil indicators across the entire 0–40 cm depth are presented in Table 3. The average magnitude of RC for soil pH, TS, TP, AP, AK, and SFQI were 0.19, 1.28, 0.55, 2.45, 0.76, and 0.32, respectively. AP shows the highest magnitude of RC. In terms of the proportion of sampling points, soil pH showed a decreasing trend across most of the samples, with 89.74% of the sampling points having an RC < 0, indicating an average decline of 20%. Conversely, TS, TP, AP, AK, and SFQI generally increased, with between 62.82% and 85.9% of the samples indicating RC > 0. These indicators showed increased magnitudes of 184%, 64%, 281%, 102%, and 38%, respectively. It is noteworthy that AP demonstrated the largest increase in magnitude.
In summary, AG soils in the Lhasa River Valley showed a significant decrease in pH, accumulation of TS, and a significant increase in AP and AK, alongside an overall improvement in SFQI.

3.3. Influence Factors of Soil Quality Improvements and Declines

3.3.1. Factors Contributing to Soil pH Decline and Their Interactions

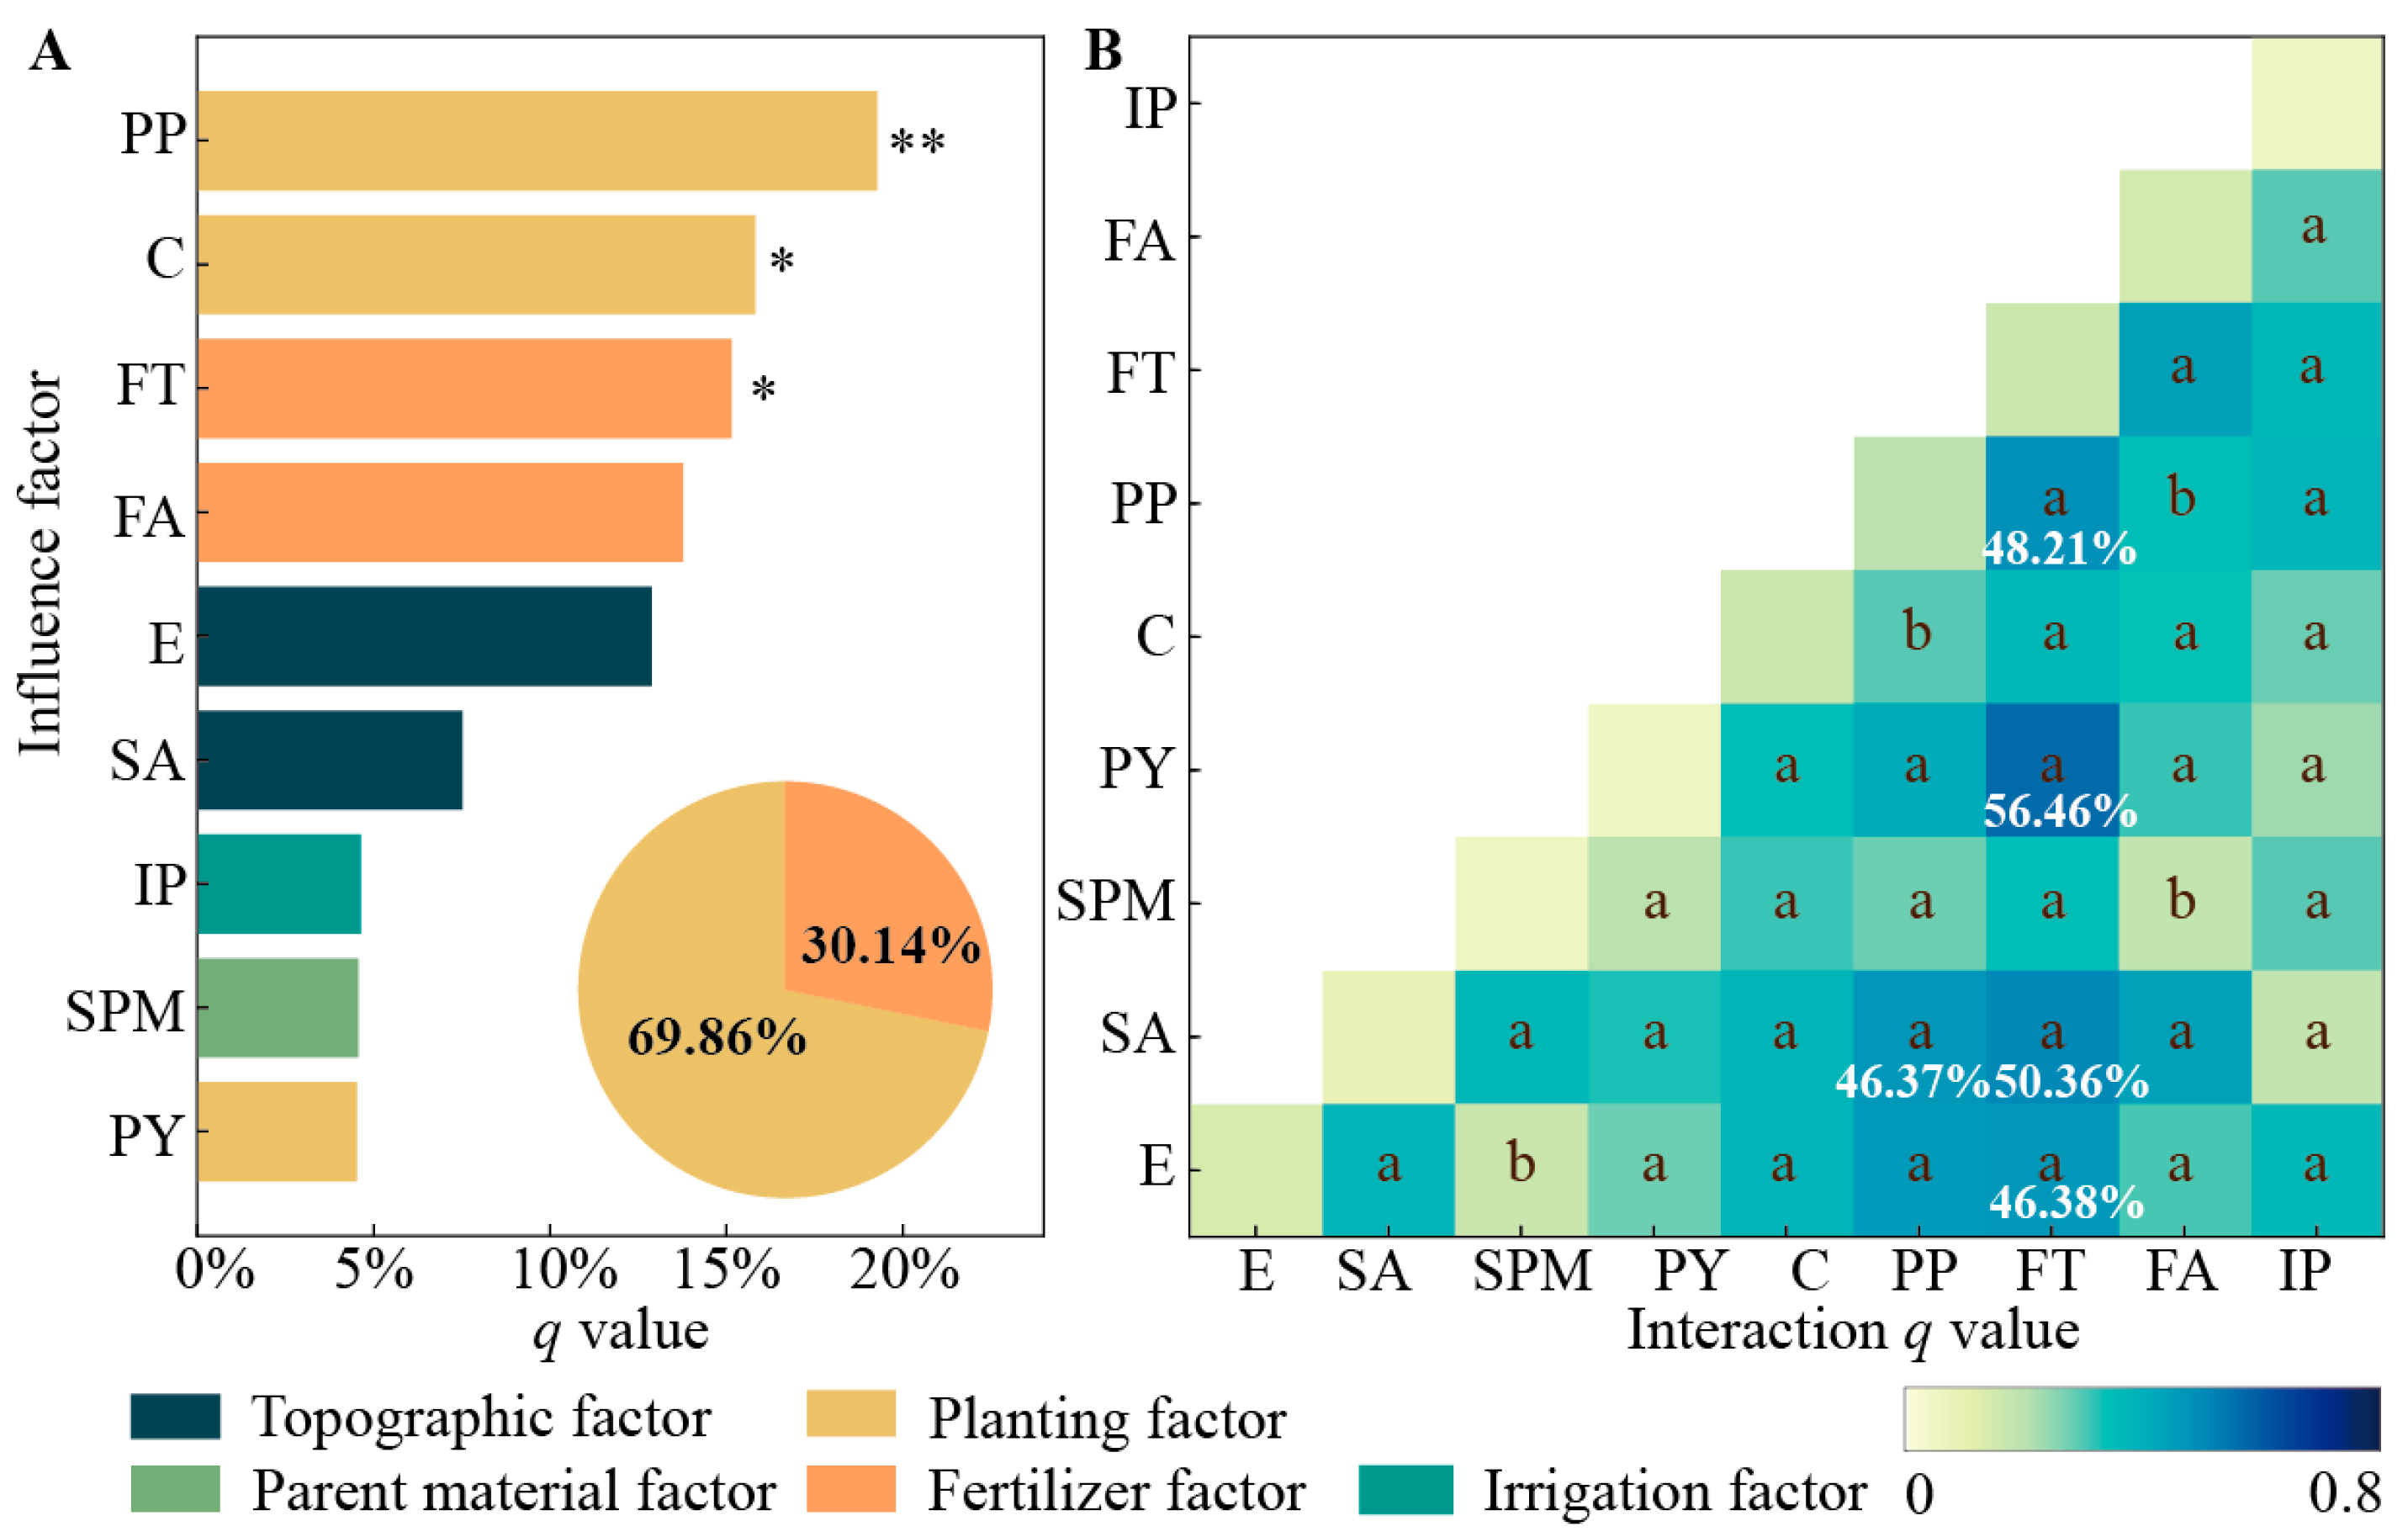
The analysis of the factors influencing soil pH decline is presented in Figure 4. The individual factor contributions (q values) quantify their explanatory power on soil pH decline (Figure 4A), the planting factor is the dominant influence factor, collectively accounting for 69.86% of the pH decline. Among these, the planting pattern had the highest explanatory power at 19.28%, followed by crop, which provided an explanatory power of 15.82%. The fertilizer amount also contributed significantly, with an explanatory power of 15.14%. In addition to the individual factors, interactions between natural factors and production management factors all had increased explanatory powers when compared to the single factors, and most interactions were nonlinearly enhanced (Figure 4B). Notably, there was a strong interaction between the fertilizer factor and planting factor. The interaction between fertilizer type and planting year had the highest explanatory power at 56.46%, followed by fertilizer type and slope aspect at 50.36%, and compared to individual factors, these interactions enhanced the explanatory power by 41.32% and 35.22%, respectively.

3.3.2. Contributions and Interactions of Factors Influencing Soil Salinity Accumulation

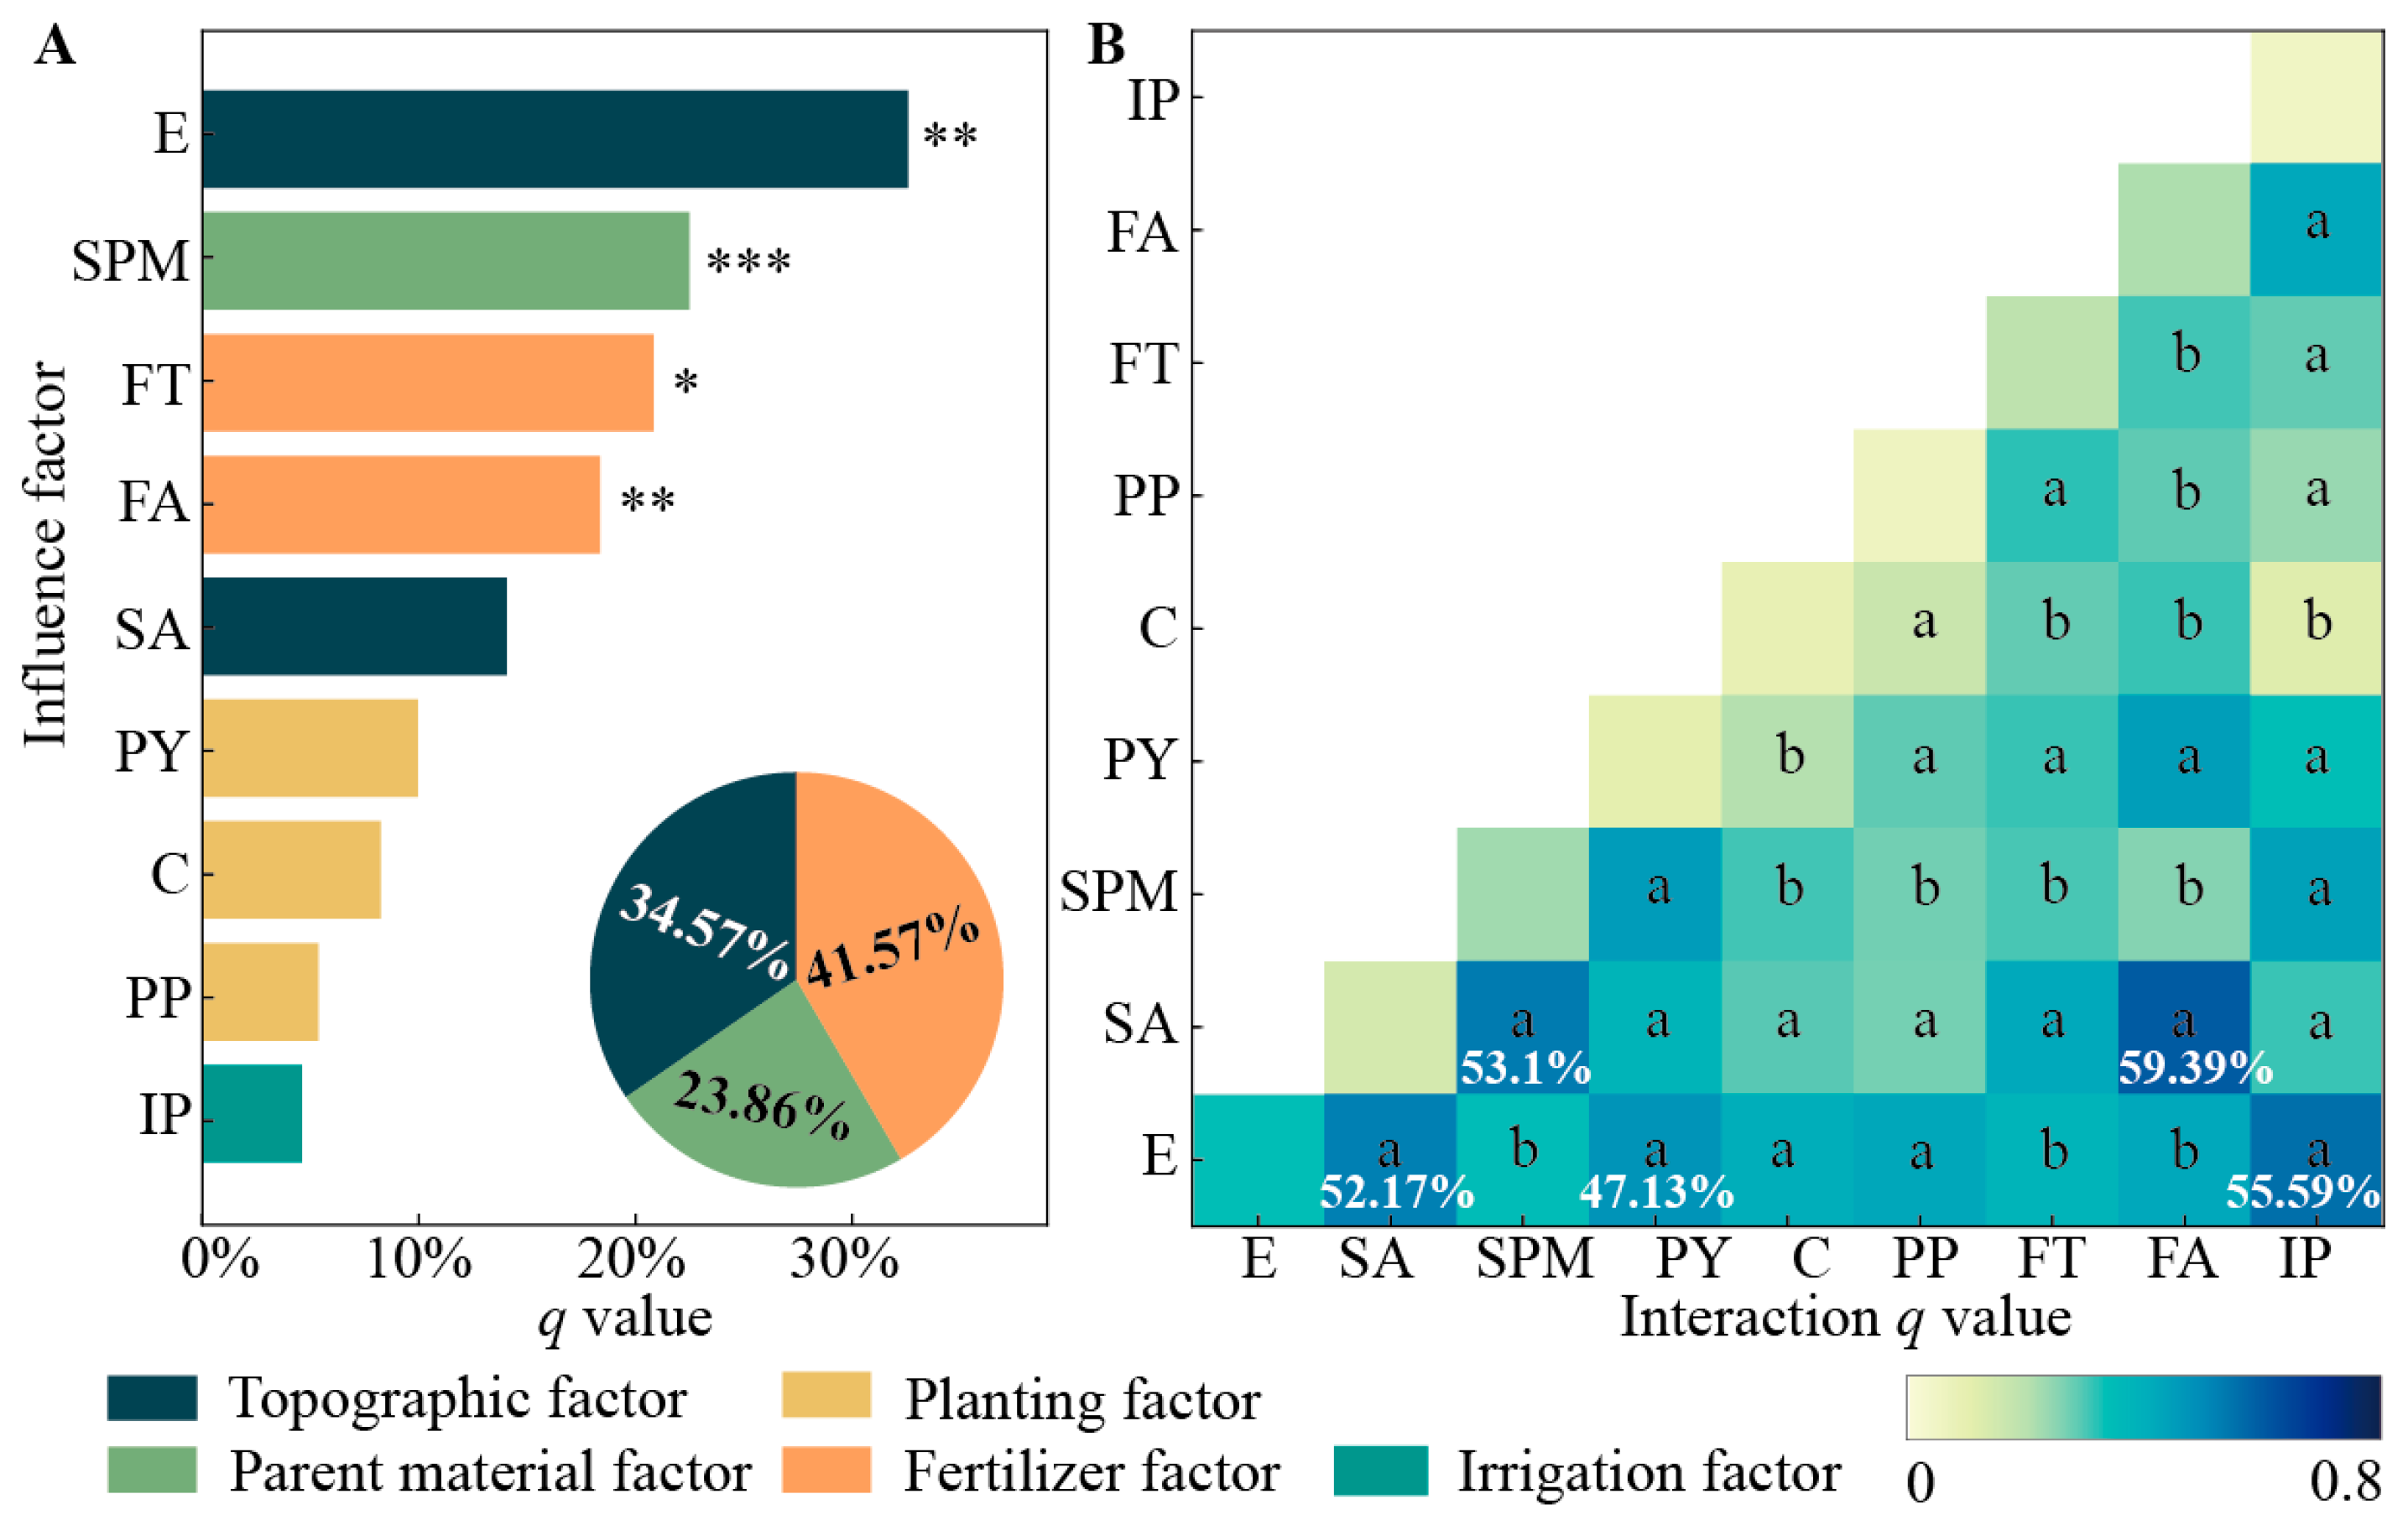
The analysis of the factors contributing to soil TS accumulation is illustrated in Figure 5. The q values of individual factors indicate that soil TS accumulation is jointly dominated by fertilizer factor and topographic factor, which account for 41.57% and 34.57% of the observed TS increase, respectively (Figure 5A). Among these factors, elevation was found to be the most influential factor, providing an explanatory power of 32.57%, followed by fertilizer type (20.81%) and fertilizer amount (18.35). Soil parent material also played an important role, explaining 14.28% of the salinity increase. The interaction between topographic factors and other factors showed a prominent influence on TS accumulation and most interactions were nonlinearly enhanced (Figure 5B). Notably, the interaction between slope aspect and fertilizer amount showed the highest explanatory power at 59.39%, followed by interactions between elevation and irrigation pattern, and slope aspect and soil parent material, each providing approximately 53%. These interactions enhanced the explanatory power by 23.03% to 38.58% compared to the effects of individual factors.

3.3.3. Influential Factors for Soil Nutrient Improvement and Their Interaction Effects

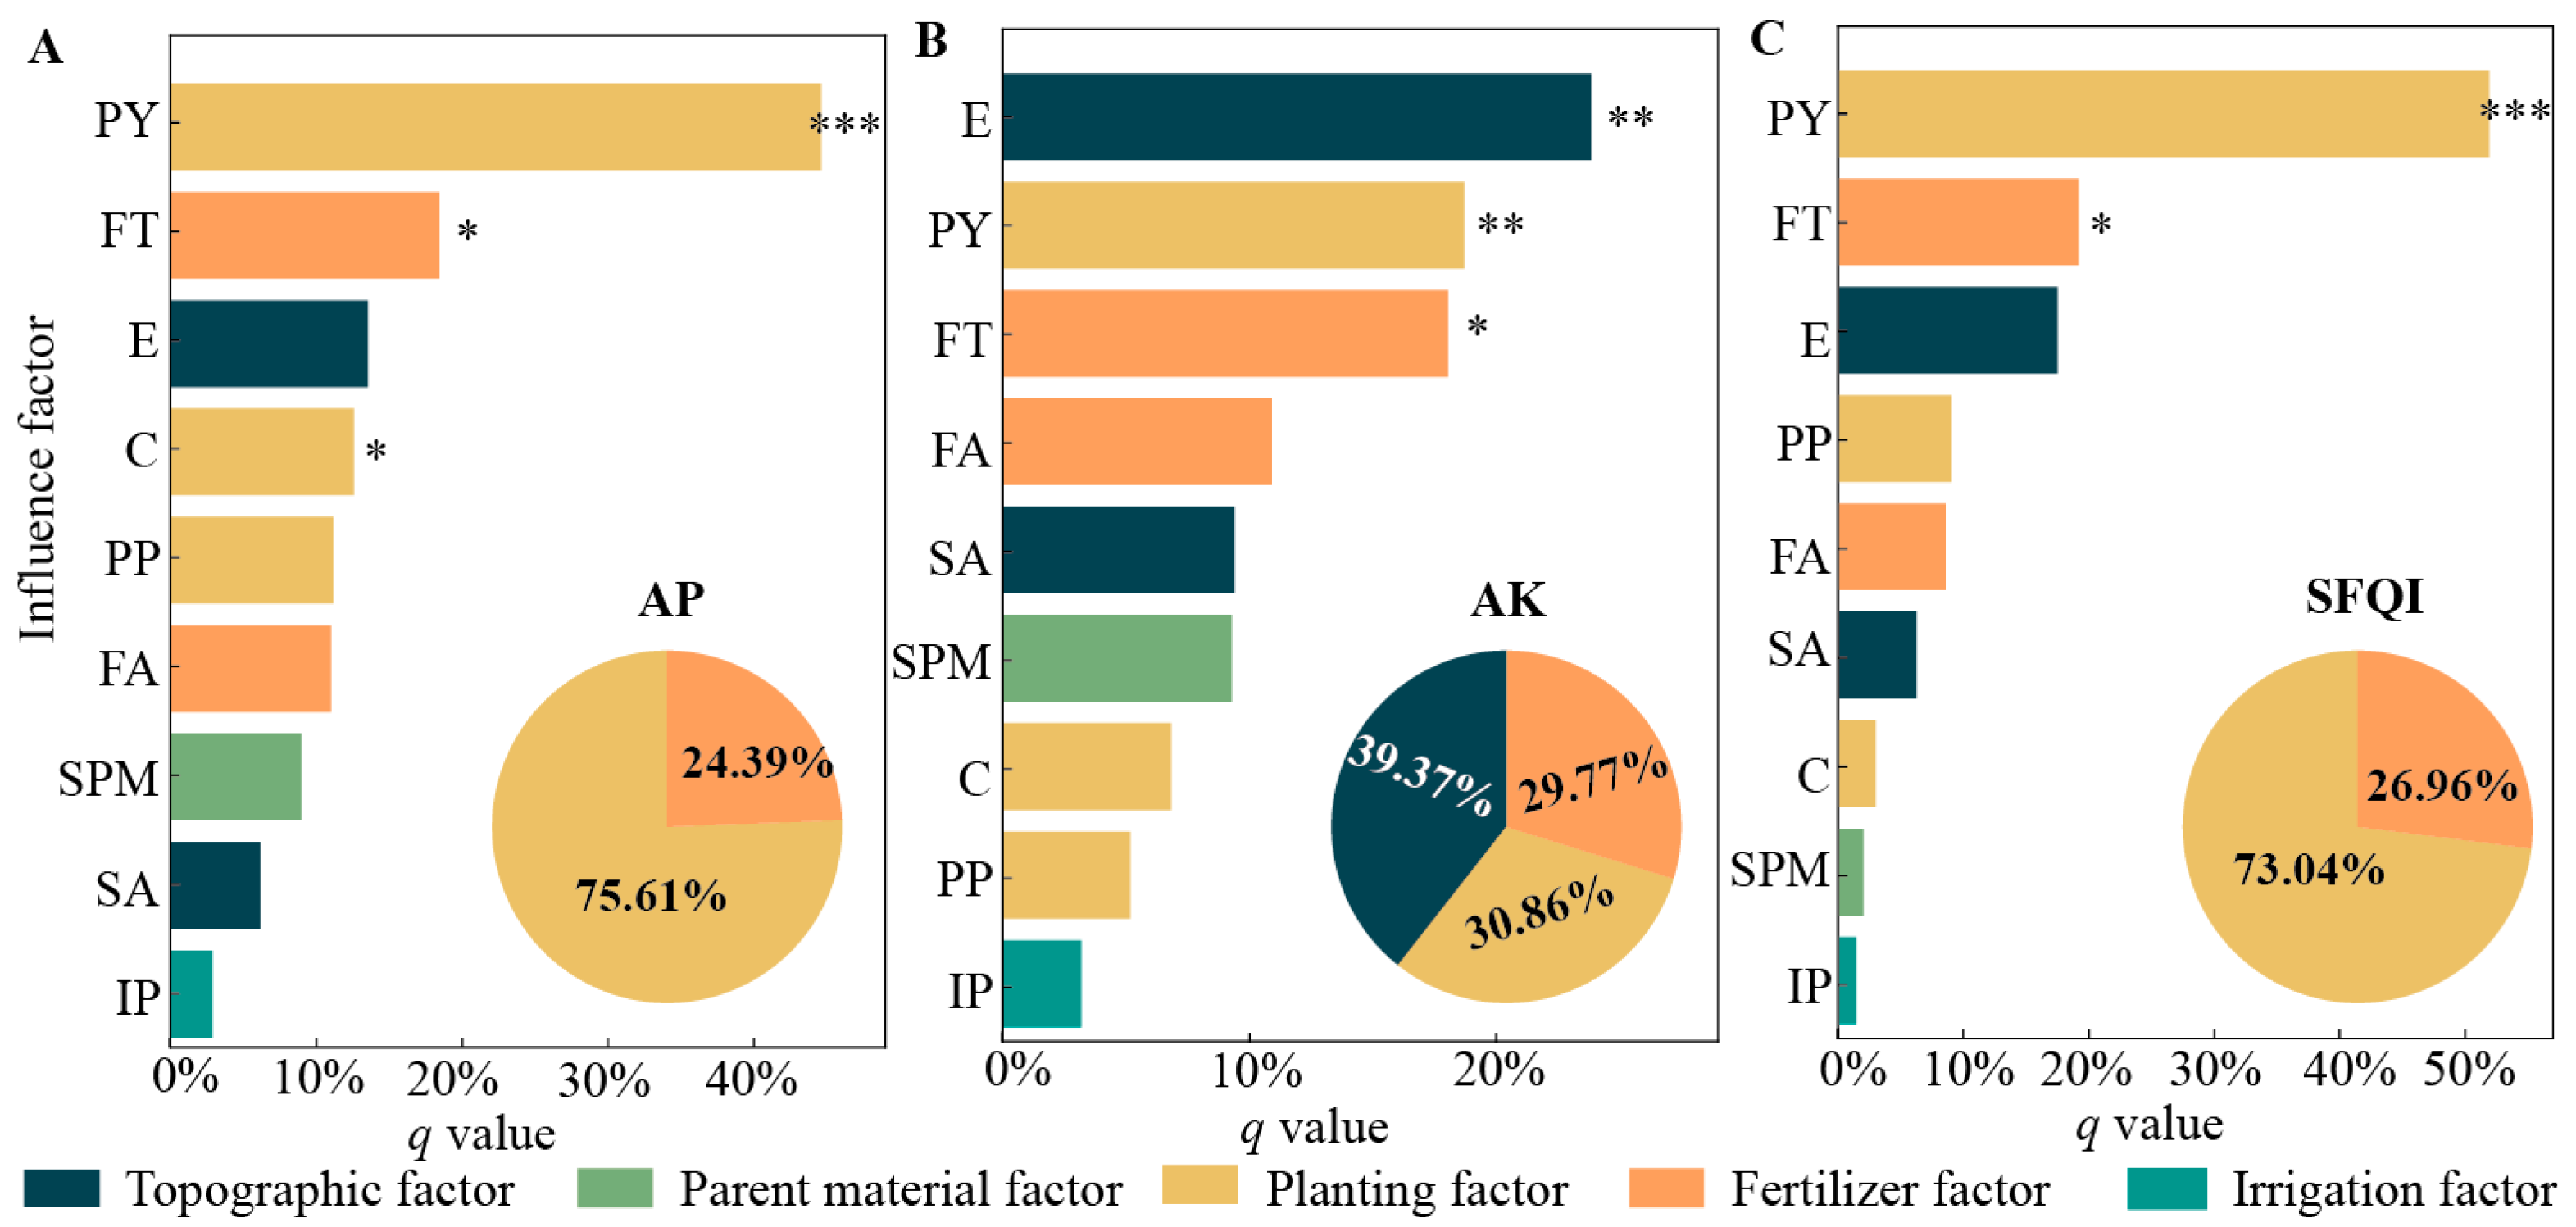
The analysis of individual factors influencing soil nutrient improvements is presented in Figure 6. For AP and SFQI (Figure 6A,C), planting factors are identified as the dominant influencing factor, contributing 75.61% and 73.04% to their respective improvements. Among these, planting year provides the highest explanatory power, accounting for 44.61% for AP and 51.92% for SFQI followed by fertilizer type, contributing 18.45% for AP and 19.16% for SFQI. Additionally, crop significantly impacts AP improvement, providing 12.59% explanatory power. For AK (Figure 6B), soil AK differences are jointly dominated by the topographic factor, planting factor, and fertilizer factor, with elevation, planting year, and fertilizer type contributing 23.87%, 18.71%, and 18.04% explanatory power, respectively.
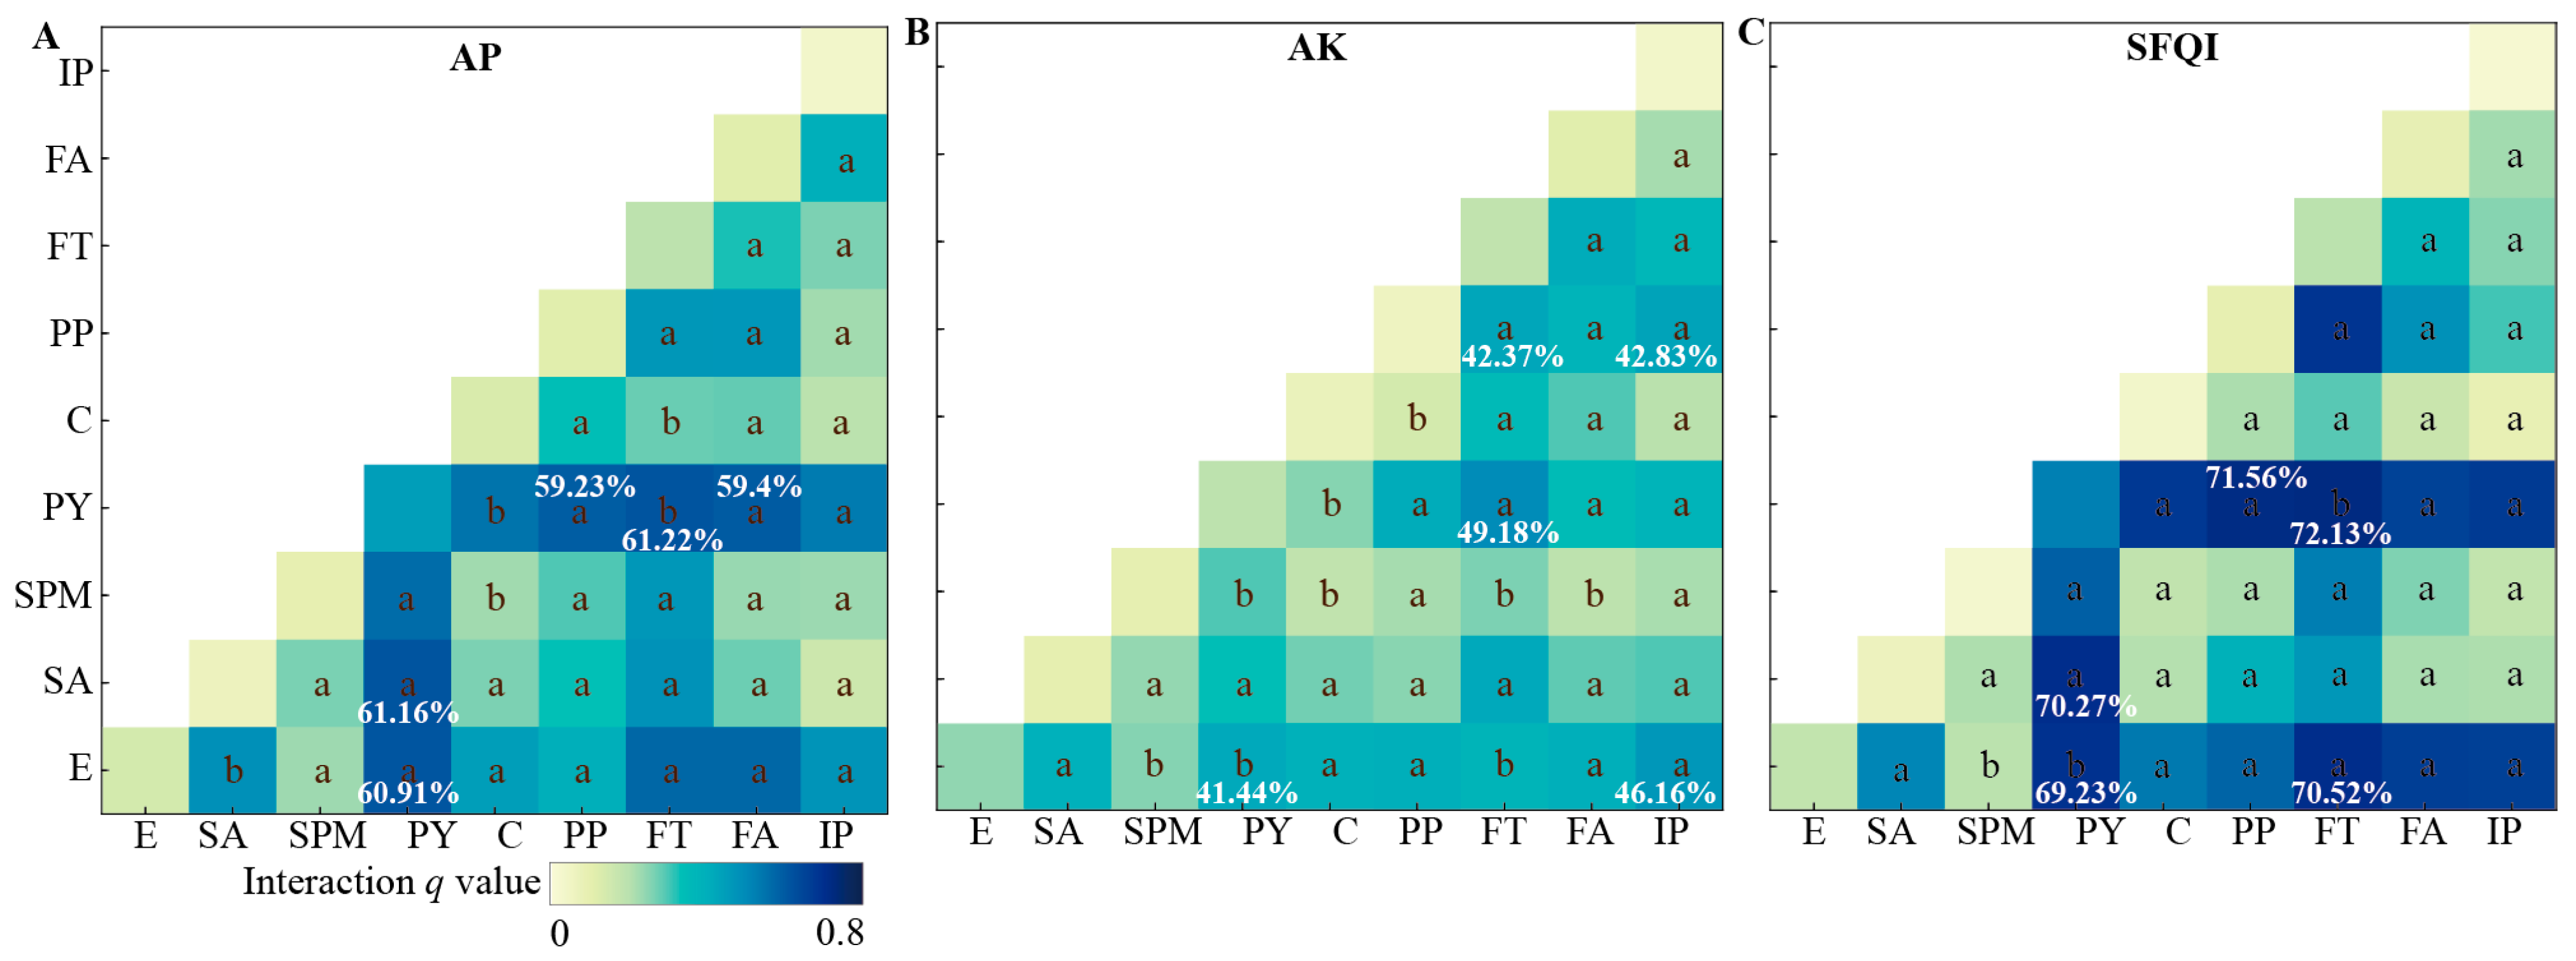
The interaction effects between factors on soil nutrient improvement are presented in Figure 7. The results indicate that the combined influence of natural factors and production management factors on soil nutrient improvement is generally higher than that of individual factors alone, with most interactions showing nonlinear enhancement effects. Notably, planting factors and their interactions with other factors provide strong explanatory power for the differences in AP, AK, and SFQI. Specifically, for AP, the interaction between planting year and fertilizer type provides the highest explanatory power at 61.22%, which represents an increase of 16.6% compared to the explanatory power of individual factors. A similar trend is observed for soil AK and SFQI differences, where the interaction between planting year and fertilizer type offers the highest explanatory power of 49.18% and 72.13%, respectively. Compared to individual factors, these interactions enhance the explanatory power by 30.47% for AK and 20.2% for SFQI. Furthermore, the interaction between planting year and planting pattern significantly explains the SFQI differences with an explanatory power of 71.56%.

4. Discussion

4.1. Significant Differences in Soil Quality Between Agricultural Greenhouses and Open Croplands

This study confirms that AG management significantly impacts soil quality in the 0–40 cm profile of the Lhasa River Valley, altering soil properties compared to OCs. Soil nutrient indicators were consistently higher in AG soils, indicating a substantial enhancement of soil fertility under greenhouse conditions. This is attributed to the intensive water and fertilizer inputs typical of AG systems [12,15], which meet the demands of frequent vegetable cultivation and promote crop yield [54]. In particular, soil AP and AK showed significant increases in AG—with average increments exceeding one time—comparable to the levels in major greenhouse vegetable regions in China [9,15,55]. However, this rapid nutrient increase also poses a risk of nutrient imbalances, which could eventually degrade soil quality if not managed properly [14]. Furthermore, the high input of soluble fertilizers is often associated with soil salt accumulation [20,56]. In this study, the average TS content in AG soils increased by 1.84 times, which is comparable to the salinity levels observed in this region in 2011 [31] yet remains higher than the national average in China [16]. High soil salinity is known to inhibit plant growth and, in severe cases, lead to plant mortality [17]. Our field survey found that several AG sampling areas (S21–25) had already reached salinization levels, resulting in observable seedling mortality among greenhouse vegetables. Another notable observation is the significant decline in soil pH in AG soils, leading to predominantly acidic conditions. While such acidic environments are generally optimal for many greenhouse vegetables [57], approximately 39.74% of soil sample points exhibited a decline to strongly acidic levels or lower, highlighting the widespread acidification issue in AG systems. Excessive acidification could ultimately harm soil microbial communities and reduce nutrient availability, which may compromise soil quality over the long term [58].

4.2. Dominant Factors of Soil Quality Differences

This study analyzed the dominant factors contributing to soil quality differences between AG and OC soils in the Lhasa River Valley, highlighting the complex interaction between natural and production management factors. The findings reveal that the planting factor, fertilizer factor, and topographic factor play crucial roles in determining these differences. Furthermore, their interactions significantly enhanced the explanatory power by 20.2% to 41.32%, providing a more nuanced understanding of soil quality differences in high-altitude agricultural greenhouse systems.
The planting factor was identified as the common dominant factor affecting differences in soil AP, AK, SFQI, and pH between AG and OC soils. In this region, AG systems typically have three to five sowing cycles per year compared to the single cropping cycle of OC systems. This high frequency of cultivation accelerates nutrient accumulation, enhancing soil fertility and nutrient availability [22]. The interaction between planting year and fertilizer type provides the highest explanatory power for differences in soil AP, AK, and SFQI but the mechanisms differ for each nutrient. In the case of AP, previous soil surveys in Tibet indicated a severe phosphorus deficiency, yet our current results show a substantial increase in AP levels in AG soils. This increase is largely attributed to the extensive use of high-phosphorus compound fertilizers, as evidenced by the 6825.47 tons of compound fertilizers and 1499.13 tons of phosphorus fertilizers applied in Lhasa in 2018. This repeated application has significantly increased AP levels in AG soils compared to OC soils. For AK, differences were influenced not only by production management but also by topographic factors, particularly elevation. Higher elevations are characterized by thinner soil layers, which facilitate the availability of potassium released from soil parent materials. Our soil profile investigation revealed that soil parent materials in this region primarily consist of alluvial deposits and weathered subalpine steppe soil, rich in potassium-bearing minerals such as syenite and feldspars [37,59]. Traditional agriculture in this region has not emphasized potassium supplementation [32], leading to no significant difference in TK between AG and OC soils. However, the application of 1465 tons of potassium fertilizer in 2018—the majority of which is likely to have been used in AGs—resulted in a significant increase in soil AK levels. Overall, the long-term use of compound fertilizers, combined with the increase in soil phosphorus and potassium, has enhanced the SFQI of AG soils.
The significant decline in soil pH observed in AG soils was predominantly influenced by the planting pattern and crop used. Due to limitations in agricultural practices, farmers in the Lhasa River Valley often adopt mono-cropping vegetable cultivars, which are also common in Central and Eastern China [5]. This approach generally involves the extensive use of nitrogen fertilizers, particularly urea and ammonium sulfate, which are favored due to their high nitrogen content and cost-effectiveness [18]. These fertilizers lead to the accumulation of ammonium ions in the soil, followed by the nitrification process, which releases hydrogen ions, thereby significantly lowering the soil pH. Although Lhasa has made significant efforts to reduce over-fertilization [31,60], resulting in a decrease in total agricultural fertilizer application from 16,563.15 tons in 2011 to 10,800 tons in 2018, and a per-hectare reduction from 436.95 kg·ha−1 to 218.55 kg·ha−1, soil acidification remains an issue. Our study found that the interaction between planting year and fertilizer type enhanced the explanatory power, indicating a more complex mechanism beyond simple over-fertilization, as suggested in previous studies [61,62,63]. This could be attributed to the high frequency of fertilization necessary to meet the nutrient demands of multiple cropping cycles in AG systems, which leads to sustained acidification pressure on soils, unlike the relatively lower fertilizer inputs in OC. Furthermore, the results of the questionnaire survey indicated that fertilizer samples in AGs often contained high levels of organic matter and humic acids. Under conditions of high temperature and moisture, decomposition of organic matter produces organic acids, which can exacerbate soil acidification [64].
The analysis revealed that the fertilizer factor and topographic factor were the dominant factors influencing TS difference. In particular, soil parent material, fertilizer amount, and fertilizer type were identified as key individual contributors. Soil parent material with inherently low fertility often necessitates higher fertilizer inputs [32,37], which subsequently contributes to increased salinity accumulation. This is particularly evident in AG soils, where soluble fertilizers are frequently applied, resulting in higher salinity than in OC soils [44,56]. Another interesting finding is that elevation also significantly influences TS differences. This is due to the different hydrothermal conditions that affect AG and OC systems differently as the altitude increases. In AGs, greenhouse structures can mitigate climatic variability and improve water and heat availability for crops. Conversely, OC soils remain highly susceptible to the redistributive effects of altitude on water and temperature. This disparity results in differential responses to elevation, thereby producing soil salt differences between AG and OC soils at higher altitudes. Moreover, the interaction between fertilizer amount and slope aspect showed the highest explanatory power for TS differences. It is noteworthy that north-facing slopes showed a higher relative change rate of TS (227%) compared to south-facing slopes (41.16%). This indicates that the slope aspect also influences the impact of fertilizers on salinity accumulation, potentially due to less favorable sunlight conditions on north-facing slopes. In AGs, this condition necessitates higher fertilizer inputs to maintain productivity. Our investigation showed that the average fertilizer amount on north-facing slopes was 0.50 kg·m2 compared to 0.31 kg·m2 on south-facing slopes. In addition, the reduced solar radiation on north-facing slopes may lead to lower nutrient uptake efficiency and slower crop growth, further diminishing nutrient use efficiency. This increased fertilizer application, particularly within the controlled greenhouse environment, contributes more to salt accumulation than in OC, where lower fertilizer input and better natural leaching mitigate salt build-up.

4.3. Adjustment Strategy for Agricultural Greenhouses

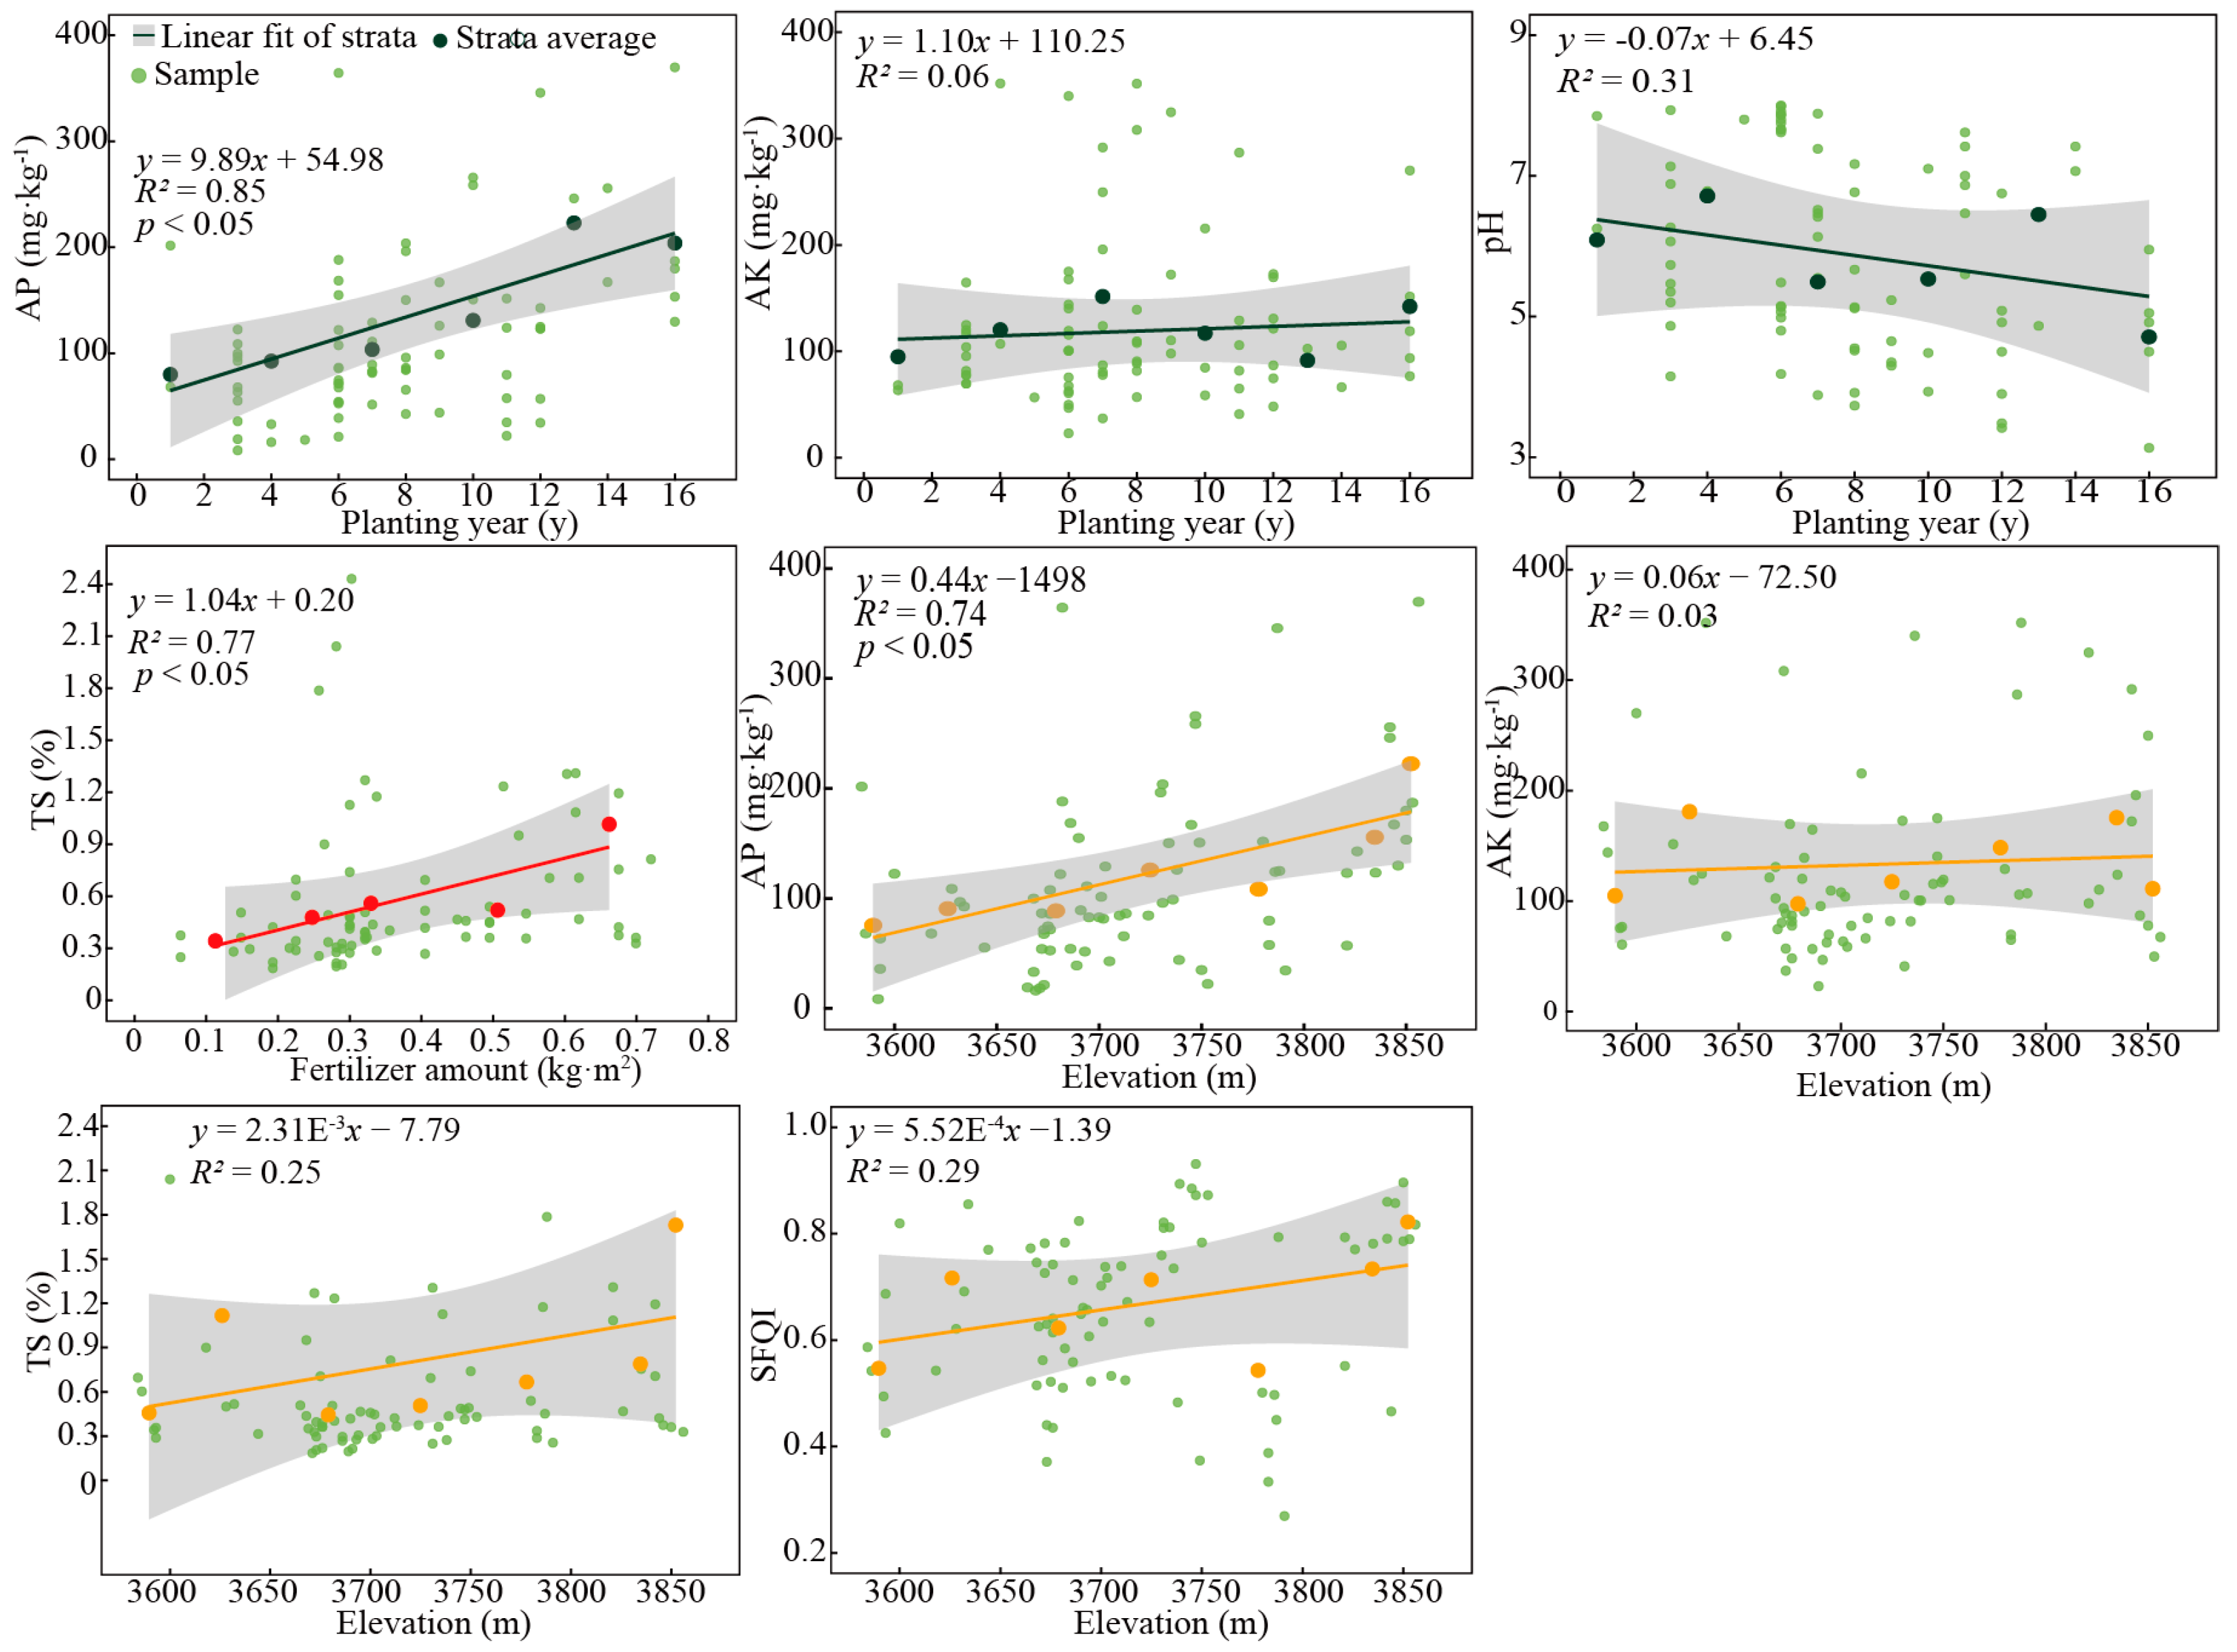
To mitigate soil problems and optimize AG management and production layout, linear regression analyses were conducted to explore the relationships between key soil indicators and factors (including planting year, fertilizer amount, and elevation) (Figure 8). Vegetables generally thrive in slightly acidic environments but excessively low soil pH can hinder nutrient uptake by plants [65]. Our study found that it takes approximately 7.8 years for AG soils in this region to reach strongly acidic levels, which is shorter than the rate observed in Eastern and Central China [9]. Therefore, it is crucial to monitor the pH of AG soils that have been cultivated for over eight years. Fertilizer management is essential to prevent harmful levels of soil salinity [12]. The analysis showed that maintaining fertilizer application below 0.38 kg·m2 can effectively prevent harmful salt accumulation. However, the questionnaire data indicated that some AGs applied 0.46–0.72 kg·m2 of fertilizer, with the potential to reduce the amount of fertilizer used by 17.39%–47.22%.
In the existing AG land layout, within the elevation range of 3650–3700 m, 65.38% of the sample points had AK levels below the moderate level. Below 3700 m, 62.16% of the sample points had SFQI levels below the regional average. Therefore, it is evident that focusing on potassium supplementation and improving overall soil fertility below 3700 m is essential. Conversely, above 3800 m, soil salinity levels pose a significant threat to crop survival, indicating that large-scale agricultural development in this region should be reduced. In addition, this study also highlighted the need to modify the types of fertilizers used. Specifically, it takes only 2.5 years for soil AP to exceed double the very rich level. This rapid accumulation highlights the need to reduce reliance on high-phosphorus fertilizers to prevent nutrient imbalances and potential environmental risks [66]. Furthermore, adopting more diversified cultivars and implementing crop rotations can alleviate the risk of excessive nutrient accumulation [16].

4.4. Implications and Limitations

From the perspective of soil quality, there are significant differences in the physicochemical indicators of soil between AGs and OCs. This study identified significant differences in soil indicators, offering valuable insights into agricultural development and baseline soil quality for high-altitude regions. The findings indicate that AG soil in the Lhasa River Valley exhibits excessive nutrient accumulation, salinity accumulation, and acidification, aligning with the soil health threats identified by the United Nations Food and Agriculture Organization (FAO). Globally, greenhouse cultivation data often rely on unverified commercial reports [4]. The lack of detailed spatial, distributional, and dynamic information about AGs hampers understanding the potential environmental impacts of high-altitude AGs. Identifying the dominant factors and interaction mechanisms for soil quality differences provides new references for the protection of croplands in high-altitude regions.
Despite efforts to cover AGs, this study selected only 25 typical sample areas due to the workload of soil sample collection and the cost of soil indicator testing. To obtain more universally applicable results, it is recommended that the typical sample area be evenly distributed along the valley’s elevation gradient and that the number of soil samples be increased. Another limitation is the lack of in situ experimental data, which is a consequence of the challenges encountered in early research on the Tibetan Plateau. Control variable methods are among the best ways to understand how factors affect soil quality. Therefore, establishing in situ observation experiments is an effective means of studying soil quality changes and understanding the influencing mechanisms. Furthermore, soil biodiversity plays a crucial role in organic matter decomposition and nutrient cycling, and its reduction in AG systems may affect soil quality. Pesticide use also impacts soil microbial communities, potentially altering soil quality. Due to resource limitations, we did not measure soil biodiversity or pesticide impacts in this study. Future research should include these indicators and factors to comprehensively assess AG’s effects on soil quality. Additionally, the selected sample areas and soil samples mainly come from commercial AGs with mature agricultural techniques and high vegetable yields. However, numerous small-scale family AGs across the Tibetan Plateau are used for personal consumption. The differing soil backgrounds, agricultural technology levels, and fertilizer input intensities may result in varying soil quality differences and dominant factors. Consequently, the results of this study may primarily represent the impact of high-altitude commercial AGs on soil quality.

5. Conclusions

This study analyzed the differences in soil physicochemical indicators and SFQI between AG and adjacent OC soils in the Lhasa River Valley, identifying significant differences in key indicators, including pH, TS, TP, AP, AK, and SFQI. AG soils exhibited significant nutrient enrichment, increased salinity, and decreased pH compared to OC soils. This study found that planting, fertilizer, and topographic factors are critical drivers of soil quality differences between AGs and OCs, and interactions among these factors significantly enhanced the explanatory power by 20.2% to 41.32% compared to individual factors. This finding highlights the complex interaction between natural conditions and agricultural management in shaping soil quality outcomes in AG systems. Despite AG management improving nutrient availability, the accompanying issues of acidification and salinity accumulation pose significant challenges for sustainable agricultural practices in high-altitude regions. To address these challenges, it is recommended to control AG expansion above 3800 m, enhance soil monitoring for greenhouses cultivated for over eight years, optimize high-phosphorus fertilization, address potassium deficiencies in lower elevation areas, and optimize fertilization and planting strategies. The findings provide a scientific reference for improving soil quality and ensuring the sustainable development of AG in high-altitude regions and similar environments globally.

Author Contributions

Conceptualization, Z.W.; methodology, Z.W. and D.G.; formal analysis, D.G. and Z.W.; investigation, D.G., Z.W., X.H., B.W. and C.G.; resources, Z.W. and Y.Z.; writing—original draft preparation, D.G. and Z.W.; writing—review and editing, D.G. and Z.W.; visualization, D.G., B.W. and X.H.; supervision, Z.W. and Y.Z.; project administration, Z.W. and Y.Z.; funding acquisition, Z.W. and Y.Z. All authors have read and agreed to the published version of the manuscript.

Funding

This research was funded by the Second Tibetan Plateau Scientific Expedition and Research Program (STEP) (2019 QZKK0603) and the National Natural Science Foundation of China (41771113).

Data Availability Statement

Data presented in this study are available upon reasonable request to the corresponding author.

Conflicts of Interest

The authors declare no conflicts of interest.

Appendix A

Table A1. General information of agricultural greenhouse sample areas.
CountySample AreaGeometric Position (°)Average Elevation
(m)
Slope
(°)
Average Planting Year
(y)
Main Cultivars
QuxuS1E 90.79
N 29.38
3588.750–46Lycopersicon esculentum, Spinacia oleracea
S2E 90.95
N 29.54
3609.752–1016Lycopersicon esculentum,
Cucurbita moschata
DoilungdeqenS3E 90.82
N 29.74
3784.000–411Cucumis sativus, Capsicum annuum
S4E 90.74
N 29.82
3789.500–24Capsicum annuum
S5E 90.83
N 29.72
3766.000–23Capsicum annuum, Lactuca sativa
S6E 90.95
N 29.68
3700.200–64.8Spinacia oleracea, Lactuca sativa.
S7E 90.95
N 29.68
3688.000–63Chrysanthemum coronarium
S8E 90.99
N 29.61
3660.000–26Spinacia oleracea, Coriandrum sativum
ChengguanS9E 91.16
N 29.70
3706.500–29.5Oenanthe javanica, Ipomoea aquatica
S10E 91.26
N 29.67
3673.400–411Luffa aegyptiaca, Vigna unguiculata
S11E 90.25
N 29.67
3672.674–67.67Solanum melongena, Lablab purpureus
S12E 91.24
N 29.67
3675.002–610.5Ipomoea aquatica, Allium fistulosum
S13E 91.22
N 29.67
3668.330–613.3Allium fistulosum
S14E 91.23
N 29.64
3674.500–28Capsicum annuum var. grossum,
Brassica chinensis
S15E 91.25
N 29.64
3687.670–47Lycopersicon esculentum
DagzeS16E 91.38
N 29.70
3701.000–21Cucumis sativus
S17E 91.31
N 29.66
3691.000–63Brassica parachinensis, Capsicum annuum
LhunzhubS18E 91.26
N 29.89
3727.500–211Cucumis sativus, Raphanus sativus
S19E 91.26
N 29.29
3721.502–414Cucurbita pepo, Lactuca sativa var. capitata
S20E 91.26
N 29.89
3746.830–26Cucurbita pepo, Cucumis sativus, Brassica pekinensis
S21E 91.44
N 29.81
3737.000–26Lactuca sativa var. angustata, Cucurbita pepo
MaizhokunggarS22E 91.79
N 29.81
3853.000–26.33Lactuca sativa, Cucurbita pepo
S23E 91.77
N 29.82
3843.400–47Solanum melongena, Brassica oleracea var. capitata
S24E 91.76
N 29.82
3834.000–29Capsicum annuum
S25E 91.75
N 29.83
3821.000–29Capsicum annuum
Table A2. Common factor variance and weight of soil quality indicators.
Soil IndicatorsCommon Factor VarianceWeight
SOM0.77414.05%
TN0.89416.23%
TP0.83515.15%
TK0.66212.01%
AN0.90016.34%
AP0.80914.69%
AK0.63511.53%
Figure A1. Distribution of mean annual temperature and precipitation in the Lhasa River Valley.
Agronomy 14 02708 g0a1

References

  1. Tilman, D.; Cassman, K.G.; Matson, P.A.; Naylor, R.; Polasky, S. Agricultural Sustainability and Intensive Production Practices. Nature 2002, 418, 671–677. [Google Scholar] [CrossRef] [PubMed]
  2. Kopittke, P.M.; Menzies, N.W.; Wang, P.; McKenna, B.A.; Lombi, E. Soil and the Intensification of Agriculture for Global Food Security. Environ. Int. 2019, 132, 105078. [Google Scholar] [CrossRef] [PubMed]
  3. Hollingsworth, J.A.; Ravishankar, E.; O’Connor, B.; Johnson, J.X.; DeCarolis, J.F. Environmental and Economic Impacts of Solar-Powered Integrated Greenhouses. J. Ind. Ecol. 2020, 24, 234–247. [Google Scholar] [CrossRef]
  4. Tong, X.; Zhang, X.; Fensholt, R.; Jensen, P.R.D.; Li, S.; Larsen, M.N.; Reiner, F.; Tian, F.; Brandt, M. Global Area Boom for Greenhouse Cultivation Revealed by Satellite Mapping. Nat. Food 2024, 5, 513–523. [Google Scholar] [CrossRef]
  5. Sun, H.; Wei, C.; Xu, W.; Yang, J.; Wang, X.; Qiu, Y. Characteristics of Salt Contents in Soils under Greenhouse Conditions in China. Environ. Sci. Pollut. Res. 2019, 26, 3882–3892. [Google Scholar] [CrossRef]
  6. Yuan, Y.; Zhang, X. Comparison of Agrochemicals Allocation Efficiency between Greenhouse and Open-Field Vegetables in China. Sci. Rep. 2021, 11, 12807. [Google Scholar] [CrossRef]
  7. Bai, Z.; Caspari, T.; Gonzalez, M.R.; Batjes, N.H.; Mäder, P.; Bünemann, E.K.; de Goede, R.; Brussaard, L.; Xu, M.; Ferreira, C.S.S.; et al. Effects of Agricultural Management Practices on Soil Quality: A Review of Long-Term Experiments for Europe and China. Agric. Ecosyst. Environ. 2018, 265, 1–7. [Google Scholar] [CrossRef]
  8. Alskaf, K.; Mooney, S.J.; Sparkes, D.L.; Wilson, P.; Sjögersten, S. Short-Term Impacts of Different Tillage Practices and Plant Residue Retention on Soil Physical Properties and Greenhouse Gas Emissions. Soil. Tillage Res. 2021, 206, 104803. [Google Scholar] [CrossRef]
  9. Chen, Z.; Tian, T.; Gao, L.; Tian, Y. Nutrients, Heavy Metals and Phthalate Acid Esters in Solar Greenhouse Soils in Round-Bohai Bay-Region, China: Impacts of Cultivation Year and Biogeography. Environ. Sci. Pollut. Res. 2016, 23, 13076–13087. [Google Scholar] [CrossRef]
  10. Gao, J.J.; Bai, X.L.; Zhou, B.; Zhou, J.B.; Chen, Z.J. Soil Nutrient Content and Nutrient Balances in Newly-Built Solar Greenhouses in Northern China. Nutr. Cycl. Agroecosyst. 2012, 94, 63–72. [Google Scholar] [CrossRef]
  11. Daliakopoulos, I.N.; Apostolakis, A.; Wagner, K.; Deligianni, A.; Koutskoudis, D.; Stamatakis, A.; Tsanis, I.K. Effectiveness of Trichoderma Harzianum in Soil and Yield Conservation of Tomato Crops under Saline Irrigation. Catena 2019, 175, 144–153. [Google Scholar] [CrossRef]
  12. Kianpoor Kalkhajeh, Y.; Huang, B.; Hu, W.; Ma, C.; Gao, H.; Thompson, M.L.; Bruun Hansen, H.C. Environmental Soil Quality and Vegetable Safety under Current Greenhouse Vegetable Production Management in China. Agric. Ecosyst. Environ. 2021, 307, 107230. [Google Scholar] [CrossRef]
  13. Han, J.; Luo, Y.; Yang, L.; Liu, X.; Wu, L.; Xu, J. Acidification and Salinization of Soils with Different Initial pH under Greenhouse Vegetable Cultivation. J. Soils Sediments 2014, 14, 1683–1692. [Google Scholar] [CrossRef]
  14. Zikeli, S.; Deil, L.; Möller, K. The Challenge of Imbalanced Nutrient Flows in Organic Farming Systems: A Study of Organic Greenhouses in Southern Germany. Agric. Ecosyst. Environ. 2017, 244, 1–13. [Google Scholar] [CrossRef]
  15. Fan, Y.; Zhang, Y.; Hess, F.; Huang, B.; Chen, Z. Nutrient Balance and Soil Changes in Plastic Greenhouse Vegetable Production. Nutr. Cycl. Agroecosyst. 2020, 117, 77–92. [Google Scholar] [CrossRef]
  16. Zhang, Z.; Sun, D.; Tang, Y.; Zhu, R.; Li, X.; Gruda, N.; Dong, J.; Duan, Z. Plastic Shed Soil Salinity in China: Current Status and next Steps. J. Clean. Prod. 2021, 296, 126453. [Google Scholar] [CrossRef]
  17. Wu, R.; Sun, H.; Xue, J.; Yan, D.; Liu, Y.; Gui, D.; Wang, X.; Yang, J. Acceleration of Soil Salinity Accumulation and Soil Degradation Due to Greenhouse Cultivation: A Survey of Farmers’ Practices in China. Environ. Monit. Assess. 2020, 192, 399. [Google Scholar] [CrossRef]
  18. Guo, J.H.; Liu, X.J.; Zhang, Y.; Shen, J.L.; Han, W.X.; Zhang, W.F.; Christie, P.; Goulding, K.W.T.; Vitousek, P.M.; Zhang, F.S. Significant Acidification in Major Chinese Croplands. Science 2010, 327, 1008–1010. [Google Scholar] [CrossRef] [PubMed]
  19. Li, S.; Lei, Y.; Zhang, Y.; Liu, J.; Shi, X.; Jia, H.; Wang, C.; Chen, F.; Chu, Q. Rational Trade-Offs between Yield Increase and Fertilizer Inputs Are Essential for Sustainable Intensification: A Case Study in Wheat–Maize Cropping Systems in China. Sci. Total Environ. 2019, 679, 328–336. [Google Scholar] [CrossRef]
  20. Wang, X.; Zou, C.; Gao, X.; Guan, X.; Zhang, Y.; Shi, X.; Chen, X. Nitrate Leaching from Open-Field and Greenhouse Vegetable Systems in China: A Meta-Analysis. Environ. Sci. Pollut. Res. 2018, 25, 31007–31016. [Google Scholar] [CrossRef]
  21. Herencia, J.F.; García-Galavís, P.A.; Maqueda, C. Long-Term Effect of Organic and Mineral Fertilization on Soil Physical Properties Under Greenhouse and Outdoor Management Practices. Pedosphere 2011, 21, 443–453. [Google Scholar] [CrossRef]
  22. Tian, K.; Hu, W.; Xing, Z.; Huang, B.; Jia, M.; Wan, M. Determination and Evaluation of Heavy Metals in Soils under Two Different Greenhouse Vegetable Production Systems in Eastern China. Chemosphere 2016, 165, 555–563. [Google Scholar] [CrossRef] [PubMed]
  23. Machado, R.M.A.; Serralheiro, R.P. Soil Salinity: Effect on Vegetable Crop Growth. Management Practices to Prevent and Mitigate Soil Salinization. Horticulturae 2017, 3, 30. [Google Scholar] [CrossRef]
  24. Ge, D.; Wang, Z.; Tu, S.; Long, H.; Yan, H.; Sun, D.; Qiao, W. Coupling Analysis of Greenhouse-Led Farmland Transition and Rural Transformation Development in China’s Traditional Farming Area: A Case of Qingzhou City. Land. Use Policy 2019, 86, 113–125. [Google Scholar] [CrossRef]
  25. Li, Y.; Ma, J.; Li, Y.; Jia, Q.; Shen, X.; Xia, X. Spatiotemporal Variations in the Soil Quality of Agricultural Land and Its Drivers in China from 1980 to 2018. Sci. Total Environ. 2023, 892, 164649. [Google Scholar] [CrossRef]
  26. Cao, Z.; Kühn, P.; He, J.-S.; Bauhus, J.; Guan, Z.-H.; Scholten, T. Calibration of Near-Infrared Spectra for Phosphorus Fractions in Grassland Soils on the Tibetan Plateau. Agronomy 2022, 12, 783. [Google Scholar] [CrossRef]
  27. He, G.; Shi, Z.; Fang, H.; Shi, L.; Wang, Y.; Yang, H.; Yan, B.; Yang, C.; Yu, J.; Liang, Q.; et al. Climate and Soil Stressed Elevation Patterns of Plant Species to Determine the Aboveground Biomass Distributions in a Valley-Type Savanna. Front. Plant Sci. 2024, 15, 1324841. [Google Scholar] [CrossRef]
  28. Biek, M.A.; Chung, W.; Mehta, K. Affordable Greenhouses: A Tool to Increase Farmers’ Adaptive Capacity to Climate Change. In Proceedings of the 2015 IEEE Global Humanitarian Technology Conference (GHTC), Seattle, DC, USA, 8–11 October 2015; pp. 321–325. [Google Scholar]
  29. Wang, Z.; Huang, L.; Shao, M. Spatial Variations and Influencing Factors of Soil Organic Carbon under Different Land Use Types in the Alpine Region of Qinghai-Tibet Plateau. Catena 2023, 220, 106706. [Google Scholar] [CrossRef]
  30. Wei, H.; Lv, C.; Liu, Y.; Yang, K. Spatial Distribution and Temporal Changes of Facility Agriculture on the Tibetan Plateau. Resour. Sci. 2019, 41, 1093–1101. [Google Scholar] [CrossRef]
  31. Wang, Z.; Gong, D.; Zhang, Y. Investigating the Effects of Greenhouse Vegetable Cultivation on Soil Fertility in Lhasa, Tibetan Plateau. Chin. Geogr. Sci. 2020, 30, 456–465. [Google Scholar] [CrossRef]
  32. Zhang, D.; Zhou, Z.; Zhang, B.; Du, S.; Liu, G. The Effects of Agricultural Management on Selected Soil Properties of the Arable Soils in Tibet, China. Catena 2012, 93, 1–8. [Google Scholar] [CrossRef]
  33. Dai, F.; Lv, Z.; Liu, G. Assessing Soil Quality for Sustainable Cropland Management Based on Factor Analysis and Fuzzy Sets: A Case Study in the Lhasa River Valley, Tibetan Plateau. Sustainability 2018, 10, 3477. [Google Scholar] [CrossRef]
  34. Gong, D.; Wang, Z.; Zhang, Y. Spatial-Temporal Variation Characteristics of Greenhouse-Vegetable Land in Lhasa of Tibet from 2008 to 2018. Trans. Chin. Soc. Agric. Eng. 2020, 36, 233–241. [Google Scholar] [CrossRef]
  35. Chen, W.; Yang, L.; Zeng, J.; Yuan, J.; Gu, T.; Liu, Z. Untangling the Increasing Elevation of Cropland in China from 1980 to 2020. Geogr. Sustain. 2023, 4, 281–293. [Google Scholar] [CrossRef]
  36. Huang, J.; Ebach, M.C.; Triantafilis, J. Cladistic Analysis of Chinese Soil Taxonomy. Geoderma Reg. 2017, 10, 11–20. [Google Scholar] [CrossRef]
  37. Chen, T.; Jiao, J.; Zhang, Z.; Lin, H.; Zhao, C.; Wang, H. Soil Quality Evaluation of the Alluvial Fan in the Lhasa River Basin, Qinghai-Tibet Plateau. Catena 2022, 209, 105829. [Google Scholar] [CrossRef]
  38. Polakowski, C.; Makó, A.; Sochan, A.; Ryżak, M.; Zaleski, T.; Beczek, M.; Mazur, R.; Nowiński, M.; Turczański, K.; Orzechowski, M.; et al. Recommendations for Soil Sample Preparation, Pretreatment, and Data Conversion for Texture Classification in Laser Diffraction Particle Size Analysis. Geoderma 2023, 430, 116358. [Google Scholar] [CrossRef]
  39. Shamrikova, E.V.; Vanchikova, E.V.; Kondratenok, B.M.; Lapteva, E.M.; Kostrova, S.N. Problems and Limitations of the Dichromatometric Method for Measuring Soil Organic Matter Content: A Review. Eurasian Soil. Sci. 2022, 55, 861–867. [Google Scholar] [CrossRef]
  40. Liu, J.; Gou, X.; Liu, J.; Yin, D.; Zhang, D. Comparative Analysis of the Drivers of Soil Organic Carbon, Total Nitrogen, and Phosphorus Stocks in Different Coniferous Plantations on the Eastern Tibetan Plateau. J. Soil. Sci. Plant Nutr. 2024, 24, 331–342. [Google Scholar] [CrossRef]
  41. Wan, H.-S.; Zhang, W.-C.; Wu, W.; Liu, H.-B. Environmental Factors Affecting Soil Organic Carbon, Total Nitrogen, Total Phosphorus under Two Cropping Systems in the Three Gorges Reservoir Area. J. Soils Sediments 2023, 23, 831–844. [Google Scholar] [CrossRef]
  42. Liu, X.; Ma, J.; Ma, Z.-W.; Li, L.-H. Soil Nutrient Contents and Stoichiometry as Affected by Land-Use in an Agro-Pastoral Region of Northwest China. Catena 2017, 150, 146–153. [Google Scholar] [CrossRef]
  43. Bargrizan, S.; Smernik, R.J.; Mosley, L.M. Development of a Spectrophotometric Method for Determining pH of Soil Extracts and Comparison with Glass Electrode Measurements. Soil. Sci. Soc. Am. J. 2017, 81, 1350–1358. [Google Scholar] [CrossRef]
  44. Peng, J.; Ji, W.; Ma, Z.; Li, S.; Chen, S.; Zhou, L.; Shi, Z. Predicting Total Dissolved Salts and Soluble Ion Concentrations in Agricultural Soils Using Portable Visible Near-Infrared and Mid-Infrared Spectrometers. Biosyst. Eng. 2016, 152, 94–103. [Google Scholar] [CrossRef]
  45. Qi, Y.; Darilek, J.L.; Huang, B.; Zhao, Y.; Sun, W.; Gu, Z. Evaluating Soil Quality Indices in an Agricultural Region of Jiangsu Province, China. Geoderma 2009, 149, 325–334. [Google Scholar] [CrossRef]
  46. Cardoso, E.; Vasconcellos, R.; Bini, D.; Miyauchi, M.; Alcantara, C.; Alves, P.; de Paula, A.; Nakatani, A.; Pereira, J.; Nogueira, M. Soil Health: Looking for Suitable Indicators. What Should Be Considered to Assess the Effects of Use and Management on Soil Health? Sci. Agric. 2013, 70, 219–303. [Google Scholar] [CrossRef]
  47. Jin, H.; Shi, D.; Lou, Y.B.; Zhang, J.; Ye, Q.; Jiang, N. Evaluation of the Quality of Cultivated-Layer Soil Based on Different Degrees of Erosion in Sloping Farmland with Purple Soil in China. Catena 2021, 198, 105048. [Google Scholar] [CrossRef]
  48. Zhang, L.; Xu, E. Effects of Agricultural Land Use on Soil Nutrients and Its Variation along Altitude Gradients in the Downstream of the Yarlung Zangbo River Basin, Tibetan Plateau. Sci. Total Environ. 2023, 905, 167583. [Google Scholar] [CrossRef]
  49. Jiang, Y.; Gao, J.; Yang, L.; Wu, S.; Dai, E. The Interactive Effects of Elevation, Precipitation and Lithology on Karst Rainfall and Runoff Erosivity. Catena 2021, 207, 105588. [Google Scholar] [CrossRef]
  50. Wang, J.; Zhang, T.; Fu, B. A Measure of Spatial Stratified Heterogeneity. Ecol. Indic. 2016, 67, 250–256. [Google Scholar] [CrossRef]
  51. Virtanen, P.; Gommers, R.; Oliphant, T.E.; Haberland, M.; Reddy, T.; Cournapeau, D.; Burovski, E.; Peterson, P.; Weckesser, W.; Bright, J.; et al. SciPy 1.0: Fundamental Algorithms for Scientific Computing in Python. Nat. Methods 2020, 17, 261–272. [Google Scholar] [CrossRef]
  52. IBM Corp. IBM SPSS Statistics for Windows, version 27.0; IBM Corp: Armonk, NY, USA, 2020.
  53. R Core Team. R: A Language and Environment for Statistical Computing; R Foundation for Statistical Computing: Vienna, Austria, 2024; Available online: https://www.R-project.org/ (accessed on 15 March 2024).
  54. Ren, X.; Zou, W.; Jiao, J.; Stewart, R.; Jian, J. Soil Properties Affect Crop Yield Changes under Conservation Agriculture: A Systematic Analysis. Eur. J. Soil. Sci. 2023, 74, e13413. [Google Scholar] [CrossRef]
  55. Yu, H.; Li, T.; Zhang, X. Nutrient Budget and Soil Nutrient Status in Greenhouse System. Agric. Sci. China 2010, 9, 871–879. [Google Scholar] [CrossRef]
  56. Fan, Y.; Zhang, Y.; Wan, M.; Hu, W.; Chen, Z.; Huang, B. Plastic Shed Production Intensified Secondary Soil Salinization in Perennial Fruit Production Systems. Agric. Ecosyst. Environ. 2021, 316, 107469. [Google Scholar] [CrossRef]
  57. Yang, L.; Huang, B.; Mao, M.; Yao, L.; Niedermann, S.; Hu, W.; Chen, Y. Sustainability Assessment of Greenhouse Vegetable Farming Practices from Environmental, Economic, and Socio-Institutional Perspectives in China. Environ. Sci. Pollut. Res. 2016, 23, 17287–17297. [Google Scholar] [CrossRef] [PubMed]
  58. Xun, W.; Zhao, J.; Xue, C.; Zhang, G.; Ran, W.; Wang, B.; Shen, Q.; Zhang, R. Significant Alteration of Soil Bacterial Communities and Organic Carbon Decomposition by Different Long-Term Fertilization Management Conditions of Extremely Low-Productivity Arable Soil in South China. Environ. Microbiol. 2016, 18, 1907–1917. [Google Scholar] [CrossRef]
  59. Islam, A.; Hussain, M.S. Mineralogical Characterization of Clay Fraction of Chalan Beel Soils of Bangladesh. J. Bangladesh Agric. Univ. 2008, 6, 253–260. [Google Scholar] [CrossRef]
  60. Gong, D.; Wang, Z.; Zhang, Y.; Hu, X.; Gu, C.; Wei, B. Soil Quality Change and Spatial Differentiation Characteristics of Greenhouses Land Soil in Lhasa River Valley. Acta Pedol. Sin. 2023, 60, 1582–1594. [Google Scholar] [CrossRef]
  61. Lv, H.; Zhao, Y.; Wang, Y.; Wan, L.; Wang, J.; Butterbach-Bahl, K.; Lin, S. Conventional Flooding Irrigation and over Fertilization Drives Soil pH Decrease Not Only in the Top- but Also in Subsoil Layers in Solar Greenhouse Vegetable Production Systems. Geoderma 2020, 363, 114156. [Google Scholar] [CrossRef]
  62. Andersen, J.H.; Fossing, H.; Hansen, J.W.; Manscher, O.H.; Murray, C.; Petersen, D.L.J. Nitrogen Inputs from Agriculture: Towards Better Assessments of Eutrophication Status in Marine Waters. Ambio 2014, 43, 906–913. [Google Scholar] [CrossRef]
  63. Cai, Z.; Wang, B.; Xu, M.; Zhang, H.; He, X.; Zhang, L.; Gao, S. Intensified Soil Acidification from Chemical N Fertilization and Prevention by Manure in an 18-Year Field Experiment in the Red Soil of Southern China. J. Soils Sediments 2015, 15, 260–270. [Google Scholar] [CrossRef]
  64. Ma, L.; Li, R.; Luan, H.; Tang, J.; Wang, L.; Huang, S. Temperature Matters More than Fertilization for Straw Decomposition in the Soil of Greenhouse Vegetable Field. Agronomy 2024, 14, 233. [Google Scholar] [CrossRef]
  65. Bosiacki, M.; Bednorz, L.; Fedeńczak, K.; Górecki, T.; Mizgajski, A.; Poniży, L.; Spiżewski, T. Soil Quality as a Key Factor in Producing Vegetables for Home Consumption—A Case Study of Urban Allotments in Gorzów Wielkopolski (Poland). Agronomy 2021, 11, 1836. [Google Scholar] [CrossRef]
  66. Wu, J.; Liang, J.; Björn, L.O.; Li, J.; Shu, W.; Wang, Y. Phosphorus-Arsenic Interaction in the ‘Soil-Plant-Microbe’ System and Its Influence on Arsenic Pollution. Sci. Total Environ. 2022, 802, 149796. [Google Scholar] [CrossRef] [PubMed]
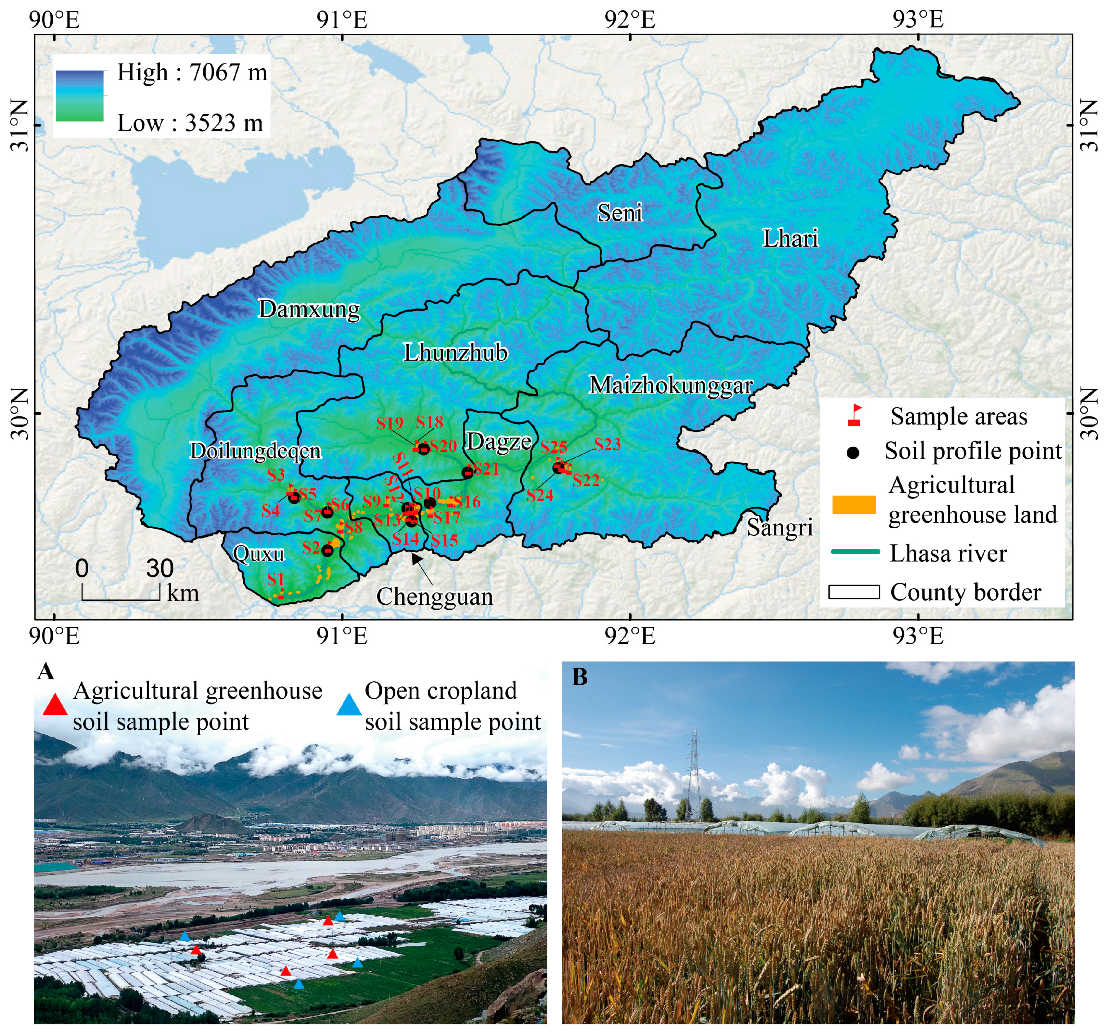
Figure 1. Map of the study area. (A) Soil sampling points in agricultural greenhouses and adjacent open croplands of sample area 10 (S10); (B) landscape of adjacent open cropland highland barley cultivation in S10.
Agronomy 14 02708 g001
Figure 2. Comparison of SFQI between AGs and OCs at different depths. Different letters indicate significant differences in SFQI (ANOVA, p ≤ 0.05).
Agronomy 14 02708 g002
Figure 3. Relative change rate of soil indicators across different depths. Statistical test: t-tests, where ***, **, and * indicate a significance of p ≤ 0.001, p ≤ 0.01, and p ≤ 0.05, respectively.
Agronomy 14 02708 g003
Figure 4. Contribution and interaction of different factors to soil pH decline. (A) The q value represents the explanatory power of individual factors on soil pH decline. (B) The heat map shows the interaction effect between different factors, with color intensity representing the magnitude of explanatory power (q value). Letters a and b indicate the type of interaction effect, where a represents nonlinear enhancement and b represents bivariate enhancement. ** and * represent significance at 0.01 and 0.05, respectively. E: elevation; SA: slope aspect; SPM: soil parent material; PP: planting pattern; C: crop; PY: planting year; FT: fertilizer type; FA: fertilizer amount; IP: irrigation pattern.
Agronomy 14 02708 g004
Figure 5. Contribution and interaction of different factors to soil TS accumulation. (A) The q value represents the explanatory power of individual factors on soil TS accumulation. (B) The heat map shows the interaction effects between different factors. Letters a and b indicate the type of interaction effect, where a represents nonlinear enhancement and b represents bivariate enhancement. ***, **, and * represent significance at 0.001, 0.01, and 0.05, respectively.
Agronomy 14 02708 g005
Figure 6. Contribution of individual factors to soil nutrient improvement. (A) Explanatory power of individual factors on soil AP increase. (B) Explanatory power of individual factors on soil AK increase. (C) Explanatory power of individual factors on soil AK increase. ***, **, and * represent significance at 0.001, 0.01, and 0.05, respectively.
Agronomy 14 02708 g006
Figure 7. Interaction effects of different factors on soil nutrient improvement: (A) interaction effects on AP; (B) interaction effects on AK; (C) interaction effects on SFQI. Letters a and b indicate the type of interaction effect, where a represents nonlinear enhancement and b represents bivariate enhancement.
Agronomy 14 02708 g007
Figure 8. Linear regression analysis of soil indicators with planting year, fertilizer amount, and elevation.
Agronomy 14 02708 g008
Table 1. List of influential factors and their respective strata.
FactorStrata
Elevation3650–3600 m, >3600–3650 m, >3650–3700 m, >3700–3750 m, >3750–3800 m, >3800–3850 m, >3850–3900 m. These strata were assigned numerical codes 1, 2, 3, 4, 5, 6, and 7, with 7 strata in total.
Slope aspectEast, southeast, south, southwest, west, northwest, north, and northeast. These strata were assigned numerical codes 1, 2, 3, 4, 5, 6, 7, and 8, with 8 strata in total.
Soil parent materialAlluvial material, Fluvial deposit material, Alluvial—slope sediment material. These strata were assigned numerical codes 1, 2, and 3, with 3 strata in total.
Planting year1–3 y, 4–6 y, 7–9 y, 10–12 y, 13–15 y, 16–18 y. These strata were assigned numerical codes 1, 2, 3, 4, 5, and 6, with 6 strata in total.
CropRoot vegetables, stem vegetables, leaf vegetables, fruity vegetables, miscellaneous. These strata were assigned numerical codes 1, 2, 3, 4, and 5, with 5 strata in total.
Planting patternContinuous cropping, crop rotation, intercropping, mono-cropping, mixture cropping. These strata were assigned numerical codes 1, 2, 3, 4, and 5, with 5 strata in total.
Fertilizer typeLow concentration, medium concentration, high concentration, low–low concentration, low–medium concentration, low–high concentration, medium–high concentration. These strata were assigned numerical codes 1, 2, 3, 4, 5, 6, and 7, with 7 strata in total.
Fertilizer amount0–0.15 kg/m2, >0.15–0.3 kg/m2, >0.3–0.45 kg/m2, >0.45–0.6 kg/m2, >0.6 kg/m2. These strata were assigned numerical codes 1, 2, 3, 4, and 5, with 5 strata in total.
Irrigation patternSprinkler irrigation, flood irrigation, furrow irrigation, border irrigation. These strata were assigned numerical codes 1, 2, 3, and 4, with 4 strata in total.
Table 2. Descriptive statistics of soil physicochemical properties.
Soil
Indicators
UnitAG SoilOC Soil
Mean ± StdMinMaxC.V. (%)Mean ± StdMinMaxC.V. (%)
Clay%2.98 ± 1.58 a0.098.8053.093.23 ± 1.37 a0.686.0942.49
Silt%23.50 ± 11.46 a5.6767.6748.7826.39 ± 13.20 a7.6371.2750.03
Sand%73.52 ± 12.89 a25.5794.2217.5470.38 ± 14.17 a23.9491.6920.13
pH 5.90 ± 1.46 b3.10 8.15 24.87.07 ± 0.79 a5.70 8.25 11.24
TS *%0.64 ± 0.66 a0.15 4.31 102.540.37 ± 0.17 b0.07 0.79 44.8
SOMg·kg−127.01 ± 13.77 a1.59 98.22 5123.86 ± 7.92 b9.00 40.17 33.2
TN *g·kg−11.93 ± 1.14 a0.15 8.01 58.881.62 ± 0.67 b0.61 4.58 41.23
TP *g·kg−11.07 ± 0.49 a0.14 2.62 45.370.74 ± 0.23 b0.29 1.43 31.56
TKg·kg−135.52 ± 3.63 a25.52 46.39 10.2135.30 ± 5.85 a17.11 47.68 16.58
AN *mg·kg−1142.04 ± 83.71 a11.71 539.25 58.93120.29 ± 54.64 b52.42 339.38 45.42
AP *mg·kg−1113.50 ± 88.05 a3.83 555.45 77.5842.87 ± 37.85 b3.83 183.62 88.28
AK *mg·kg−1124.10 ± 86.76 a18.00 470.00 69.9190.73 ± 44.56 b33.00 216.00 49.12
Note: Mean ± Std: mean value (Mean) ± standard deviation (Std); Min: minimum; Max: maximum. Indicators marked with * were analyzed using the Mann–Whitney U test, while other indicators were analyzed using ANOVA. Different letters indicate significant differences in the soil physicochemical indicators (p ≤ 0.05).
Table 3. Statistics analysis of the relative change rate of soil indicators.
Soil
Indicators
|RC|
Mean ± Std
RC > 0Percentage
of RC > 0
RC < 0Percentage
of RC < 0
Mean ± StdMean ± Std
pH0.19 ± 0.150.17 ± 0.0910.26%−0.20 ± 0.1589.74%
TS1.28 ± 2.611.84 ± 3.1264.10%−0.27 ± 0.1835.90%
SOM0.38 ± 0.370.43 ± 0.4364.10%−0.28 ± 0.2235.90%
TN0.44 ± 0.460.57 ± 0.5458.97%−0.25 ± 0.1941.03%
TP0.55 ± 0.520.64 ± 0.5480.77%−0.18 ± 0.1519.23%
AN0.40 ± 0.480.49 ± 0.5761.54%−0.24 ± 0.1938.46%
AP2.45 ± 2.682.81 ± 2.7385.90%−0.22 ± 0.1914.10%
AK0.76 ± 1.001.02 ± 1.1862.82%−0.30 ± 0.2237.18%
SFQI0.32 ± 0.330.38 ± 0.3770.51%−0.18 ± 0.1429.49%
Note: RC represents relative change rate; |RC| represents the absolute value of the RC, which quantifies the magnitude of difference without its direction.
Disclaimer/Publisher’s Note: The statements, opinions and data contained in all publications are solely those of the individual author(s) and contributor(s) and not of MDPI and/or the editor(s). MDPI and/or the editor(s) disclaim responsibility for any injury to people or property resulting from any ideas, methods, instructions or products referred to in the content.