Abstract
Rapid and accurate detection of rice foliar diseases is essential for yield prediction and food security. This study proposes a multi-size rice leaf disease detection model, YOLOv7-tiny, for fast and accurate detection of rice leaf diseases. The MobileNetV3 lightweight network is introduced to replace the backbone network of YOLOv7-tiny, which reduces the size of the model parameters and improves the extraction capability of features of different sizes; the RCS-OSA is used to replace the original ELAN-1 module, which improves the extraction capability of interlayer features; the TSCODE detector head is designed to enhance the extraction capability of the model for small targets; and the MPDIoU loss function is used to improve the model’s convergence speed and effect. The experimental results show that the average accuracy of ofYOLOv7-TMRTM is 97.9%, and compared with the baseline YOLOv7-tiny model, the accuracy of leaf spot detection is improved for different sizes and types of small target detection results, the YOLOv7-TMRTM model improves mAP0.5 by 4.4%, recall by 4.7% and precision by 8.8% compared to YOLOv7-tiny. The comparison with Faster RCNN, SSD, YOLOv4, YOLOv5s, YOLOv8s, and other mainstream target detection models shows that this method greatly solves the field environment. The problem of small spots and fuzzy edges of photographed rice diseases provides a basis for intelligent management of diseases in the field, which in turn promotes food security in China.
1. Introduction
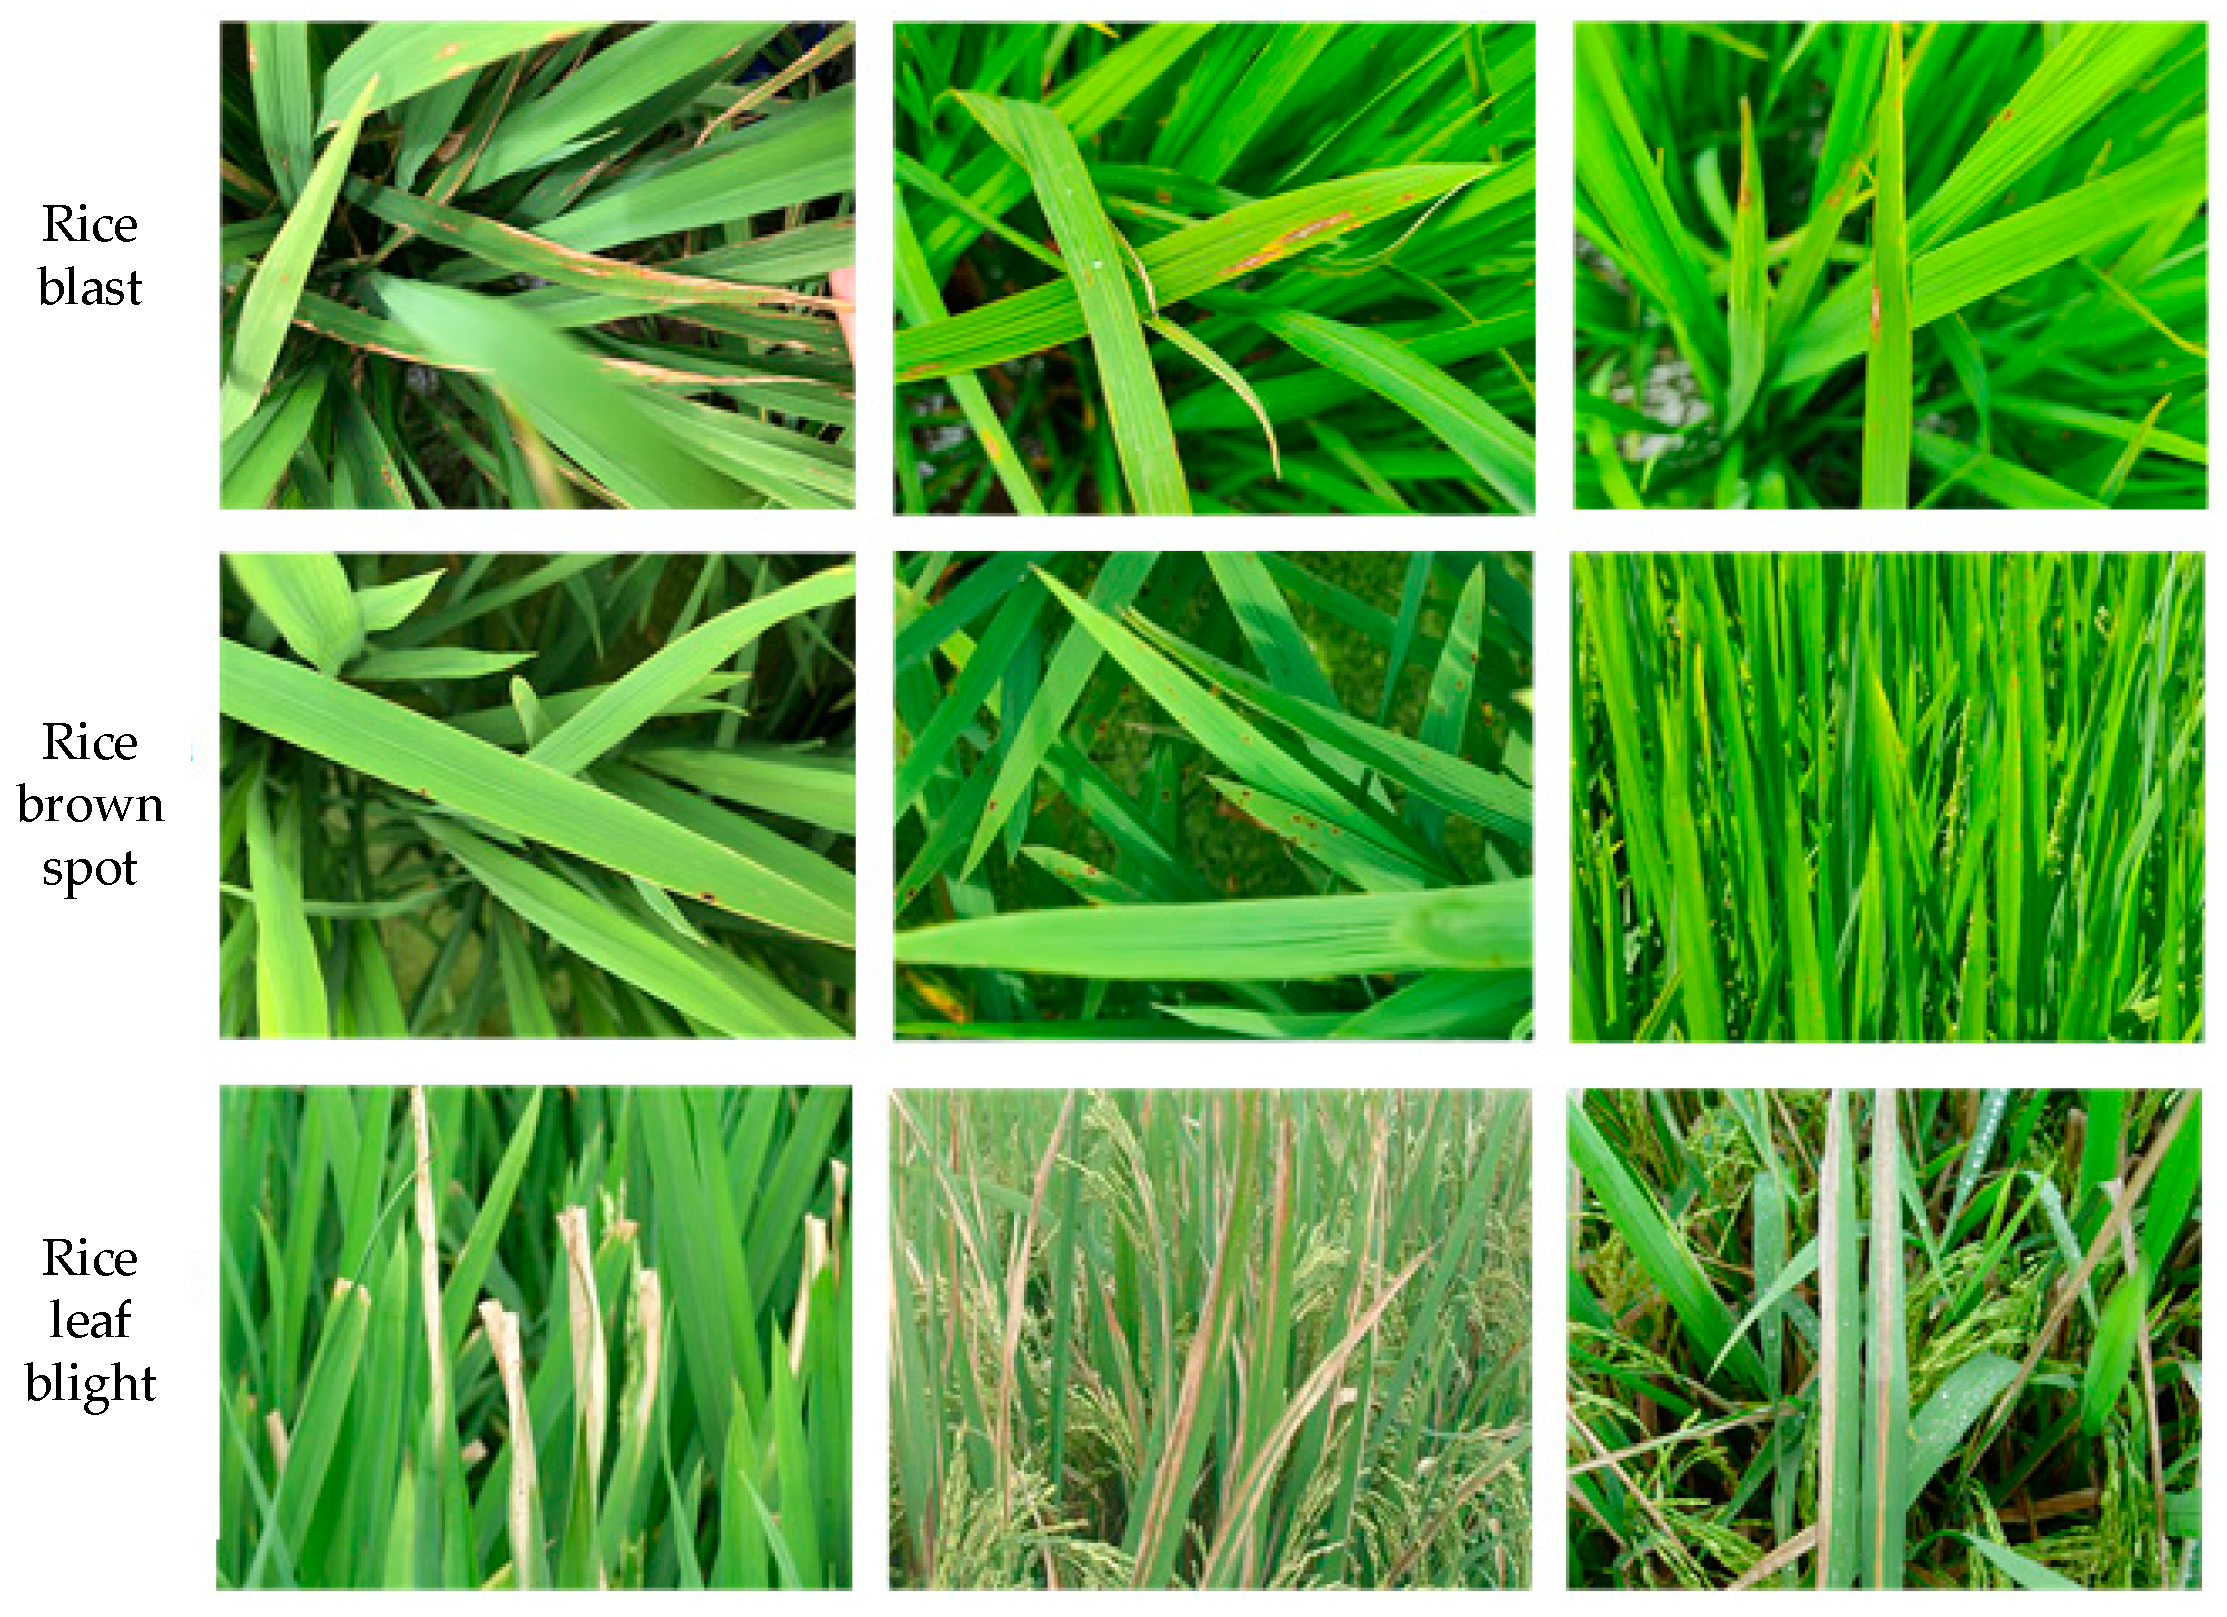
Rice is a major food crop for more than half of the population globally, and its high quality and yield are important for ensuring food security in China [1]. Due to changes in global climate in recent years, the incidence of rice diseases has been increasing year by year and has become a major threat to rice production. Rice blast, rice brown spot, and rice leaf blight are common diseases in rice production, of which rice blast and leaf blight are extremely harmful to rice, while hoary leaf spot is a black-brown irregular spot at the early stage of disease contraction, which is difficult to differentiate between rice blast and brown spot when they appear at the same time, especially when the early spots are small. It is difficult to accurately identify the diseases.
Currently, crop disease detection methods mainly include traditional manual visual detection and biochemical polymerase chain reaction (PCR) crop disease detection methods. Among them, manual visual detection mainly relies on experienced plant protection personnel to carry out manual visual inspection and field surveys for disease identification and assessment of severity. This method requires a lot of manpower and material resources, lacks representativeness, and is prone to human misjudgment due to subjectivity. As for polymerase chain reaction and other biochemical methods for disease detection, it has the characteristics of a fast and high sensitivity, but it has higher requirements for the professional level of personnel, testing equipment, and environment [2,3,4,5]. Disease detection based on digital images can not only better extract the phenotypic characteristics of diseases but also has the advantages of low cost, high efficiency, and convenience. Based on the extracted digital images, researchers usually use traditional machine learning or deep learning techniques for disease detection, whereas traditional machine learning relies heavily on feature extraction, which makes the algorithm extract less effective feature information if there are too many interfering factors in the dataset of crop diseases, resulting in a poor generalizability of the model [6]. Deep learning models, on the other hand, have shown great potential in the field of disease recognition by actively learning disease features from the original data, and their powerful feature extraction capability and detection performance provide new ideas for disease detection [7,8,9,10,11,12].
In recent years, convolutional neural networks have achieved remarkable results in the field of disease recognition, but there are also problems such as complex models and the application of lightweight networks. Scholars have conducted extensive research and improvements on convolutional neural networks. For example, Ahmad et al. [13] compared the recognition effects of ResNet, VGG16, and VGG19 on tomato disease images under different backgrounds; Ramesh et al. [14] proposed a CNN for recognizing rice leaf diseases based on the Jaya algorithm; Wan et al. [15] proposed a CNN combined with a saliency detection and segmentation algorithm and a multi-layer network, achieving good detection results. In addition, some researchers have adopted lightweight networks, such as Tarek et al. [16] using MobileNetV3 Large to detect tomato diseases and deploying it on a Raspberry Pi; Cai et al. [17] fused the Efficient Net and coordinate attention mechanism module; Sun et al. [18] embedded a lightweight coordinate attention mechanism based on the MobileNet-V2 model; Zhou et al. [19] used the MobileNetV3 model for transfer learning and the gated linear unit as the activation function, with a relatively high detection rate; Wang et al. [20] used EfficientNet-B0 and DenseNet121 to optimize the loss function to improve the recognition rate of apple leaf diseases.
At the same time, research based on the YOLO series has also shown excellent detection effects. For example, Kumar et al. [21] used the YOLOv5 network and replaced the backbone network to improve the detection effect of rice leaf diseases; Wen et al. [22] used a feature pyramid and attention mechanism to improve the detection accuracy of five-leaf ginseng leaf diseases; Wang et al. [23] compared the YOLOv7 and other series models; Zhao et al. [24] improved the detection accuracy of the YOLOv7 model by adding diverse branch modules and attention mechanisms; Wang et al. [25] added attention mechanisms in the network and improved the detection accuracy of different classification samples by improving the loss function; Zheng et al. [26] optimized the YOLOv7 model through a mixed attention module and feature pyramid; Tao et al. [27] used a weighted bidirectional feature pyramid network to optimize the model to improve the detection accuracy of tomato diseases; Zhu et al. [28] constructed the PolyCorn dataset and the Poly-YOLOv8 model to solve the shortcomings of existing detection methods; Yang et al. [29] designed a tea garden pest detection and recognition model based on the dataset. Zhang et al. [30] proposed a high-resolution target detection model HR-YOLOv8 based on a self-attention mechanism. They added a new dual self-attention mechanism to the YOLOv8 backbone network to improve the attention to small targets. They used IS-IoU as the bounding-box regression loss and improved the feature fusion part as a parallel connection of convolutional streams from high resolution to low resolution. The results showed that the method could maintain high resolution and represent more spatial accuracy. The average detection accuracy was improved by 5.2% and 0.6%, respectively, and the overall performance was much better than other mainstream models. The method also improved the ability and accuracy of detecting small targets. Ye et al. [31] used adaptive spatial feature fusion to improve the multi-scale feature fusion module of the model to improve the model’s anti-interference ability against tea disease background. These studies provide rich ideas and methods for the field of disease recognition.
The above scholars balanced the accuracy and speed of model detection by improving the structure of the model, which improved the practical performance of the model to a certain extent. However, most of the above studies are based on the detection of leaf diseases in the middle and late stages of crops. At that time, the lesions are large and easy to detect and recognize, and there are few reports on the early detection of leaf diseases with small target lesions. Early leaf diseases are characterized by their small spots, spot similarity, and other characteristics, and at the same time, in the detection process, there are leaves, spikes, and other complex background interference and other problems, making the detection difficult and making it difficult to distinguish the characteristics of leaf disease. Therefore, this study proposes a YOLOv7-TMRTM rice leaf disease detection model which aims to better extract the key features of common leaf diseases of rice and to fuse the features of different sizes of leaf diseases. The main improvement points of this paper are as follows:
- (1)
- Introducing MobileNetV3 lightweight network to replace the backbone network of YOLOv7-tiny, which reduces the volume of model parameters while improving the extraction ability of features of different sizes;
- (2)
- Replacing the original ELAN-1 module with RCS-OSA to improve the extraction capability of the model for interlayer features;
- (3)
- Using TSCODE to improve the model’s detection head to enhance the model’s ability to detect small targets;
- (4)
- Using the loss function MPDIoU to improve the model convergence speed and effectiveness.
This paper introduces the experimental materials and methods, including collection and data pre-processing, YOLOv7-tiny pre-experiment for rice disease identification, and specific improvements to the model in Section 2, compares and analyzes the effects before and after improving the model in Section 3, and discusses the results of the improved model in Section 4.
2. Materials and Methods
2.1. Statistical Analysis and Result Explanation for Parameter Evaluation
In terms of the dataset, in this paper, a total of 4500 pieces of data on three rice leaf diseases, namely rice blast, rice brown spot, and rice leaf blight, were collected. To enrich the dataset, an open-source dataset was combined to train the model. To select the most suitable basic model for detecting leaf diseases, a comparative experiment was conducted on the currently popular object detection models. The results showed that in terms of mAP0.5, the YOLO series models generally performed well, among which YOLOv7-tiny achieved the highest mAP0.5 of 95.3%. Therefore, this paper chose YOLOv7-tiny as the baseline model of this paper. Then, a pre-experiment was conducted on common models for large, medium, and small targets of leaf diseases. The results showed that the mAP0.5 detection results of YOLOv7-tiny for large, medium, and small targets were 96.5%, 90.6%, and 85.7%, respectively. The results showed that the object detection results of YOLOv7-tiny for large targets were indeed relatively good, but the detection results for small and medium targets still could not meet agricultural needs. Therefore, based on YOLOv7-tiny, this paper made improvements. The improved model, YOLOv7-TMRTM, increased the mAP0.5 of detecting large, medium, and small targets by 2.4%, 5.8%, and 4.4%, respectively, and the mAP0.5 of the overall detection results increased from 2.6% to 97.9%.
2.2. Digital Image Data Acquisition and Processing
2.2.1. Experimental Design and Acquisition of Digital Images of Rice Leaf Diseases
The rice disease images for the experiment in this paper were collected from the Haicheng Experimental Base of Shenyang Agricultural University, which is located in Haicheng City, Anshan City, Liaoning Province (122°43′32.39″ N, 40°58′42.24″ E), at the northern end of the Liaodong Peninsula, and belongs to the warm-temperate monsoon climate, with a mild climate in the whole area, with an average annual temperature of 10.4 °C and an average annual rainfall of 721.3 mm.
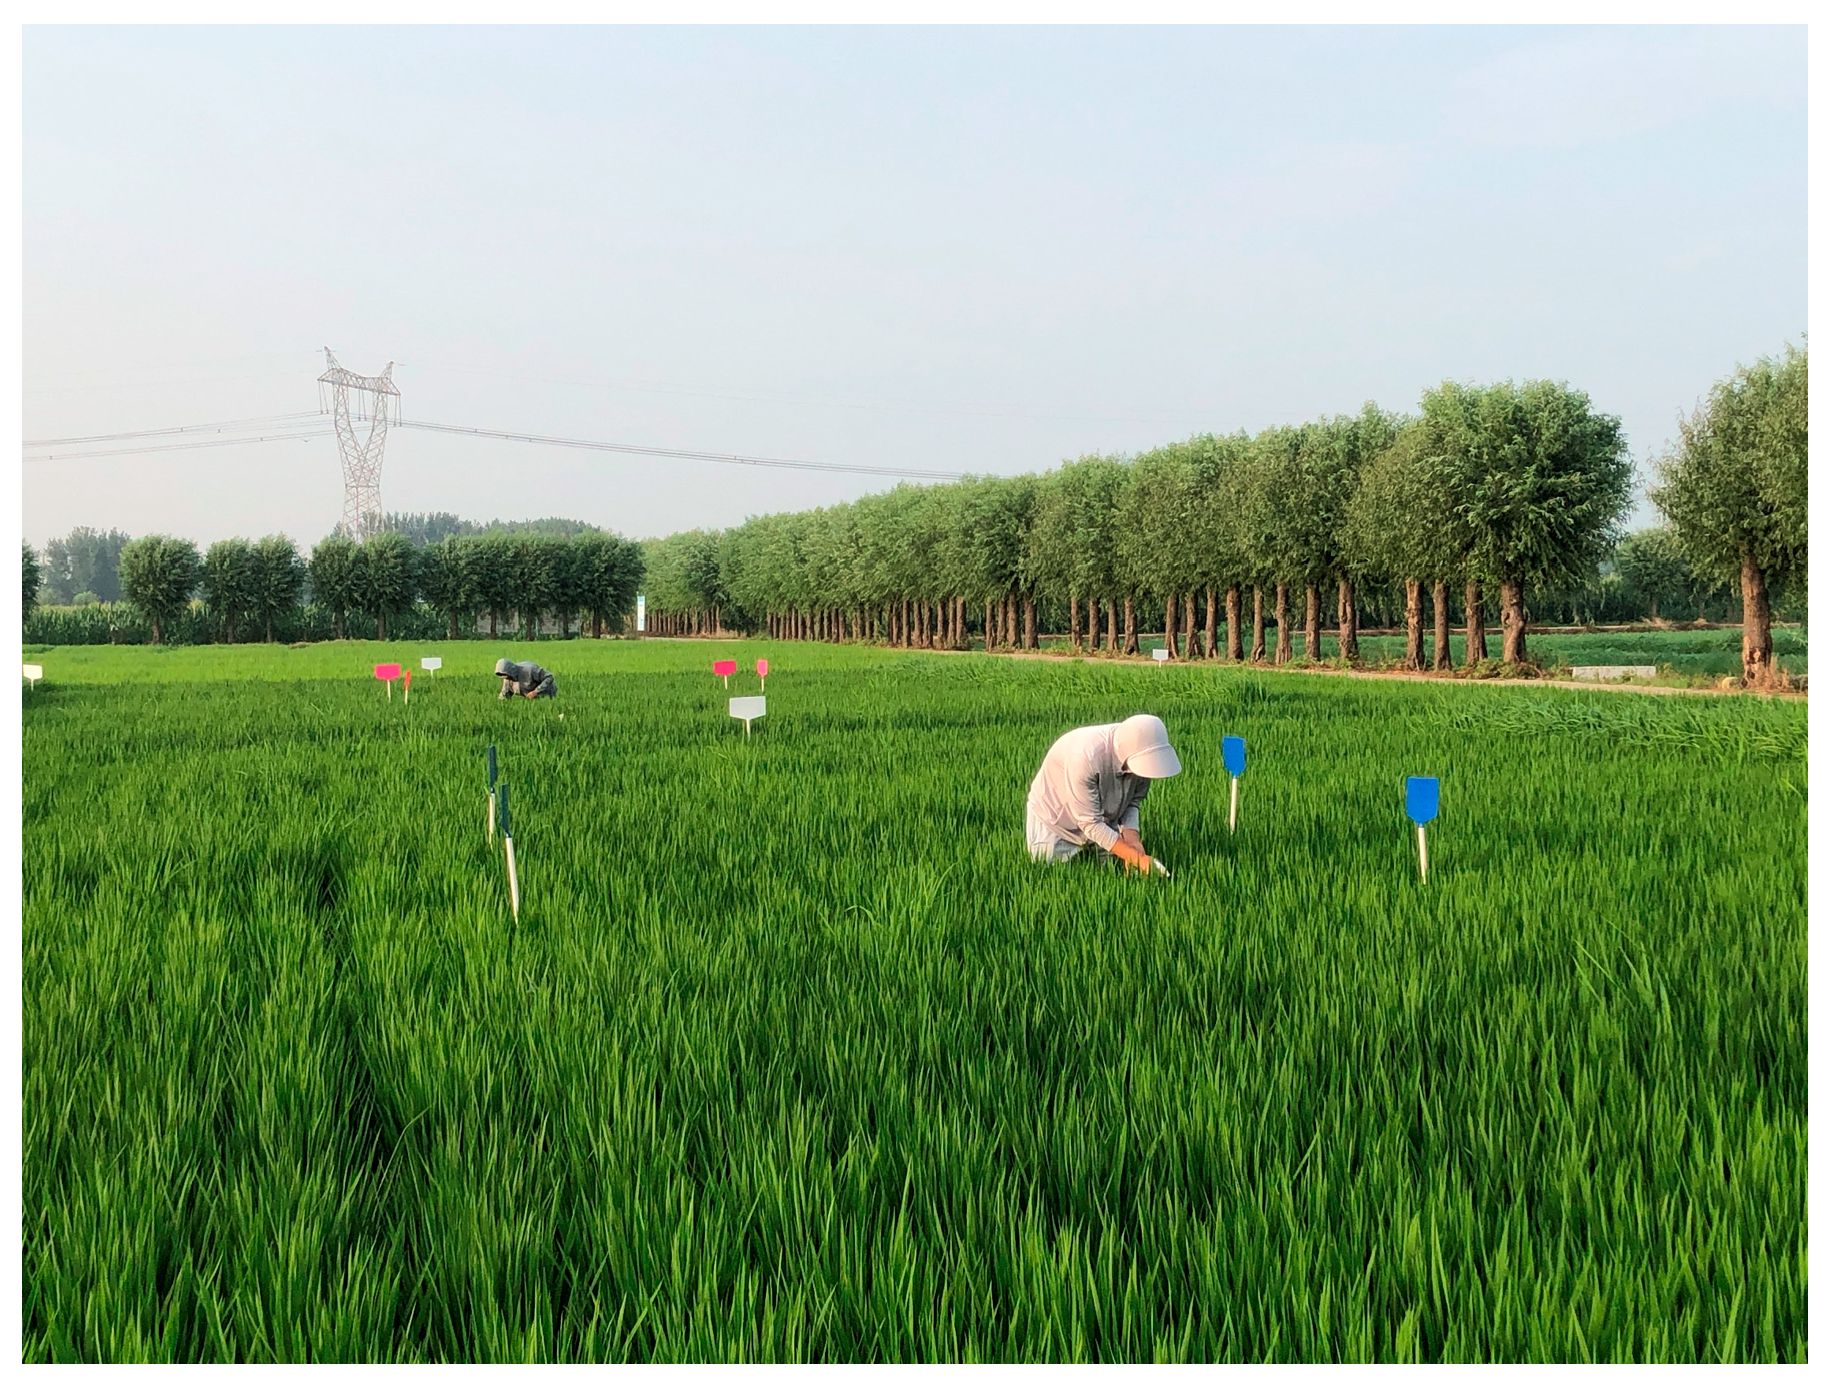
In mid-July 2023, rice was in the late tillering stage, and to obtain richer data on rice diseases, data collection of rice diseases was carried out every three days. The acquisition environment is shown in Figure 1. Considering retaining the influence of complex light in the field environment, and taking into account the differences in images due to the different weather and collection times, images were collected at other times of the day, in the morning, at midday, and in the evening, during the different growth periods of the leaves, as well as in different weather under sunny and cloudy skies, respectively, to increase the diversity of the samples. A Canon EOS1500D camera (The manufacturer is Canon, headquartered in Tokyo, Japan) was used to capture data of various sizes in the early, middle, and late stages of rice wilt, with an image resolution of 2592 × 1936 pixels, and the images were saved in JPG format, preserving the background of the paddy field and other interfering information during the shooting. A total of 1500 pictures each of rice blast, rice hoary leaf spot, and rice leaf blight were taken by us, for a total of 4500 pictures.
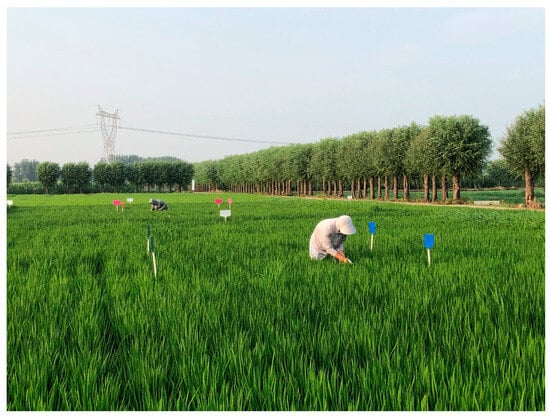
Figure 1.
On-site collection of rice disease data.
To enrich the rice disease dataset, open-source disease image samples were also collected in this paper from other websites such as the Agricultural Pest and Disease Research Gallery (http://www.icgroupcas.cn/website_bchtk/index.html (accessed on 21 July 2024)) and the Kaggle dataset competition website (https://www.kaggle.com (accessed on 21 July 2024)). A schematic sample of rice leaf disease collection is shown in Figure 2.

Figure 2.
Rice leaf disease samples.
2.2.2. Data Labeling and Dataset Construction
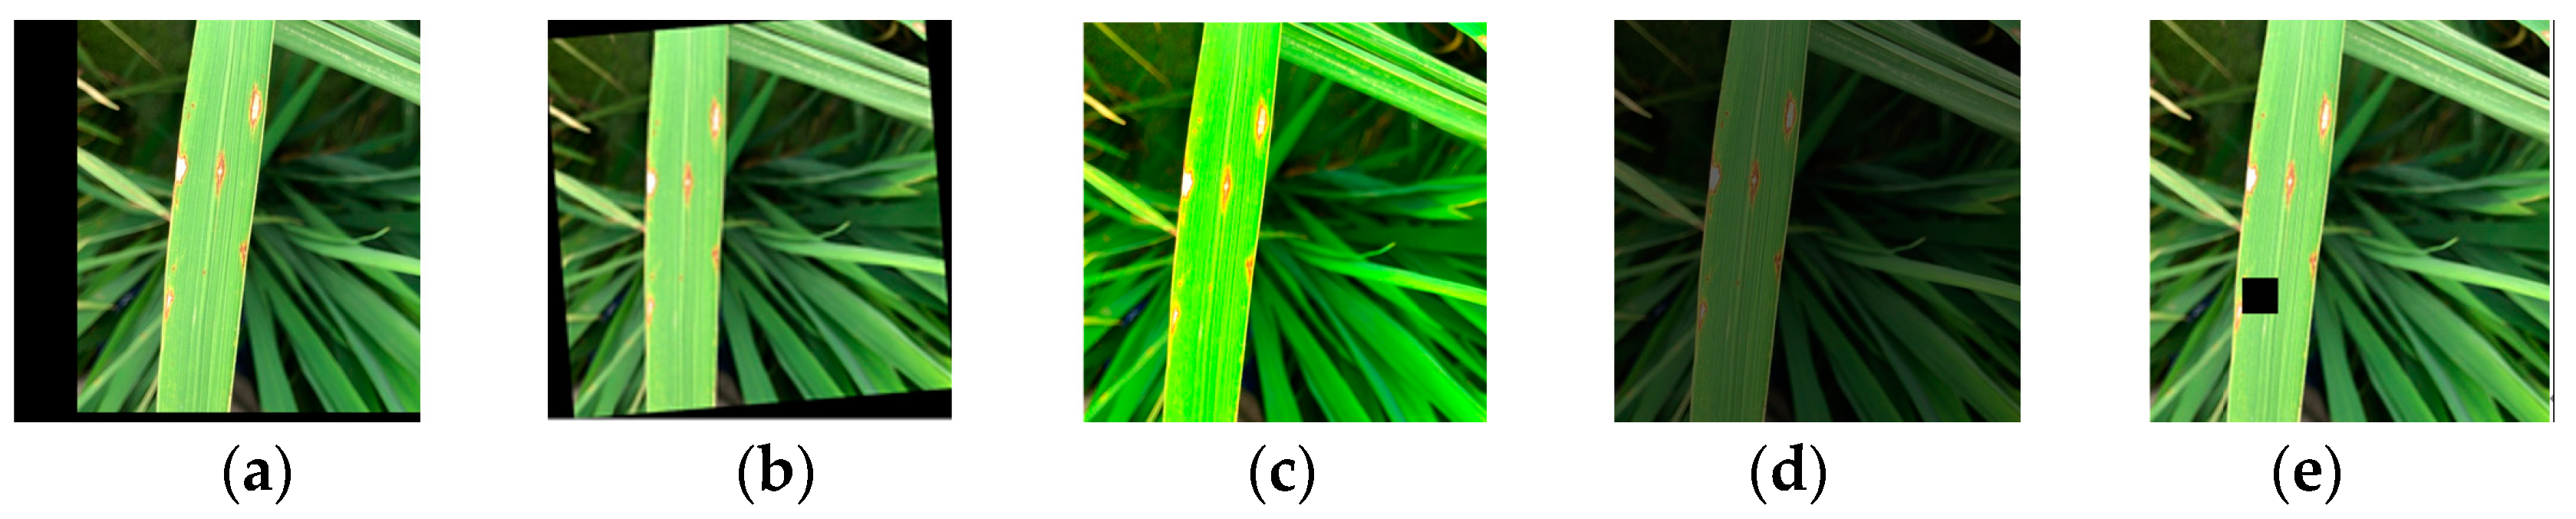
The image annotation tool Labelimg was used to annotate blast, hoary leaf spot, and white leaf blight to obtain the dataset in XML format. To avoid the model overfitting problem caused by the small number of samples and thus enhance the generalization ability of the model, random translation, rotation, mirroring, random brightness, and cut-out data enhancement operations were carried out on the samples and labels, and some of the images after enhancement are shown in Figure 3, and a total of 6485 images of rice blast, 6500 images of hoarfrost, 6520 images of leaf blight, and their corresponding label files in XML format were obtained. It was divided according to the ratio of 7:2:1 for the training set, testing set, and validation set. The specific division ratio is shown in Table 1.

Figure 3.
Partial data enhancement picture. (a) translation; (b) rotation; (c) color vibrance; (d) adjusting brightness; (e) cutout.

Table 1.
Dataset partitioning results.
2.3. Comparative Analysis of Model Performance for Rice Leaf Disease Detection
To comprehensively evaluate the performance of YOLOv7-tiny rice disease detection, this paper chose to compare the performance of YOLOv7-tiny rice disease detection with that of Faster RCNN, SSD, YOLOv4, YOLOv5s, YOLOv8s, YOLOv9t, and YOLOv10n, which are the seven mainstream target detection models, for a comparison test [32,33]. This test used the dataset constructed in Table 2 as input to ensure the accuracy and completeness of the data. Other parameter settings were the same as in Section 2.3.
Table 2.
Comparison of different models.
From the results in Table 2, the two-stage detection model Faster RCNN had the slowest detection speed of 37 f/s at the minimum, which was unsuitable for applications requiring high-speed processing. Its mAP0.5 was 86.6%, which was at a medium level. The SSD detection model not only had low detection accuracy but also a large number of parameters. Its mAP0.5 was 84.6%, the number of parameters reached as high as 20.6 M, and the model size was as large as 59.7 MB. Although the detection accuracy of Faster RCNN had some advantages over SSD, both of them still appeared to be much inferior to the YOLO series models. Specifically, when dealing with complex scenes or target occlusion, Faster R-CNN was not accurate enough in positioning diseases and not refined enough in classification. SSD still needed to be improved in feature fusion and utilization of context information, resulting in insufficient detection accuracy of diseases.
Among the YOLO series algorithms, YOLOv4 is a model proposed in 2020. Its mAP0.5 was 89.9%, the number of parameters was 14.3 M, the model size was moderate at 35.7 MB, and at the same time, it achieved 50 frames per second in processing speed. However, compared with the subsequent YOLOv5s, YOLOv7-tiny, and YOLOv8, the effect of YOLOv4 in this training was mediocre. YOLOv5s, as a lightweight model in the YOLOv5 series, showed a significant improvement in model streamlining. Its number of parameters was only 7.2 M, a significantly reduced value, and compared with YOLOv4, its mAP0.5 also increased by 2.8%. YOLOv8s had the fastest FPS of 56 f/s, but the number of parameters and model size were relatively large, at 11.1 M and 22.5 MB, respectively, and its mAP0.5 was not as good as that of YOLOv7-tiny. YOLOv7-tiny achieved the best result in model streamlining, with its number of parameters being only 6.02 M, which was the smallest among all models; and its mAP0.5 was 95.3%, which was the highest detection accuracy among all models; its FPS was 54 f/s; although the performance compared with other models was good, there was still room for improvement.
In terms of mAP0.5, the models of the YOLO series generally performed well, among which YOLOv7-tiny reached the highest value of 95.3%. In terms of the number of parameters and model size, YOLOv9t and YOLOv10n were the most lightweight, and suitable for use in resource-constrained environments. In terms of processing speed, YOLOv8s and YOLOv10n achieved the highest FPS, which was suitable for applications requiring fast responses.
In summary, by comparing the performance of the eight models, theYOLOv7-tiny model had the highest average accuracy of 95.3%, and at the same time, the model possessed higher detection accuracy and a smaller number of model parameters, which can be adapted to the application scenarios in which edge devices carry out the computation locally. Therefore, the smallest model YOLOv7-tiny was selected as the baseline model for this study based on our comprehensive consideration.
2.4. YOLOv7-Tiny Rice Spot Recognition Model Construction and Pre-Experimentation
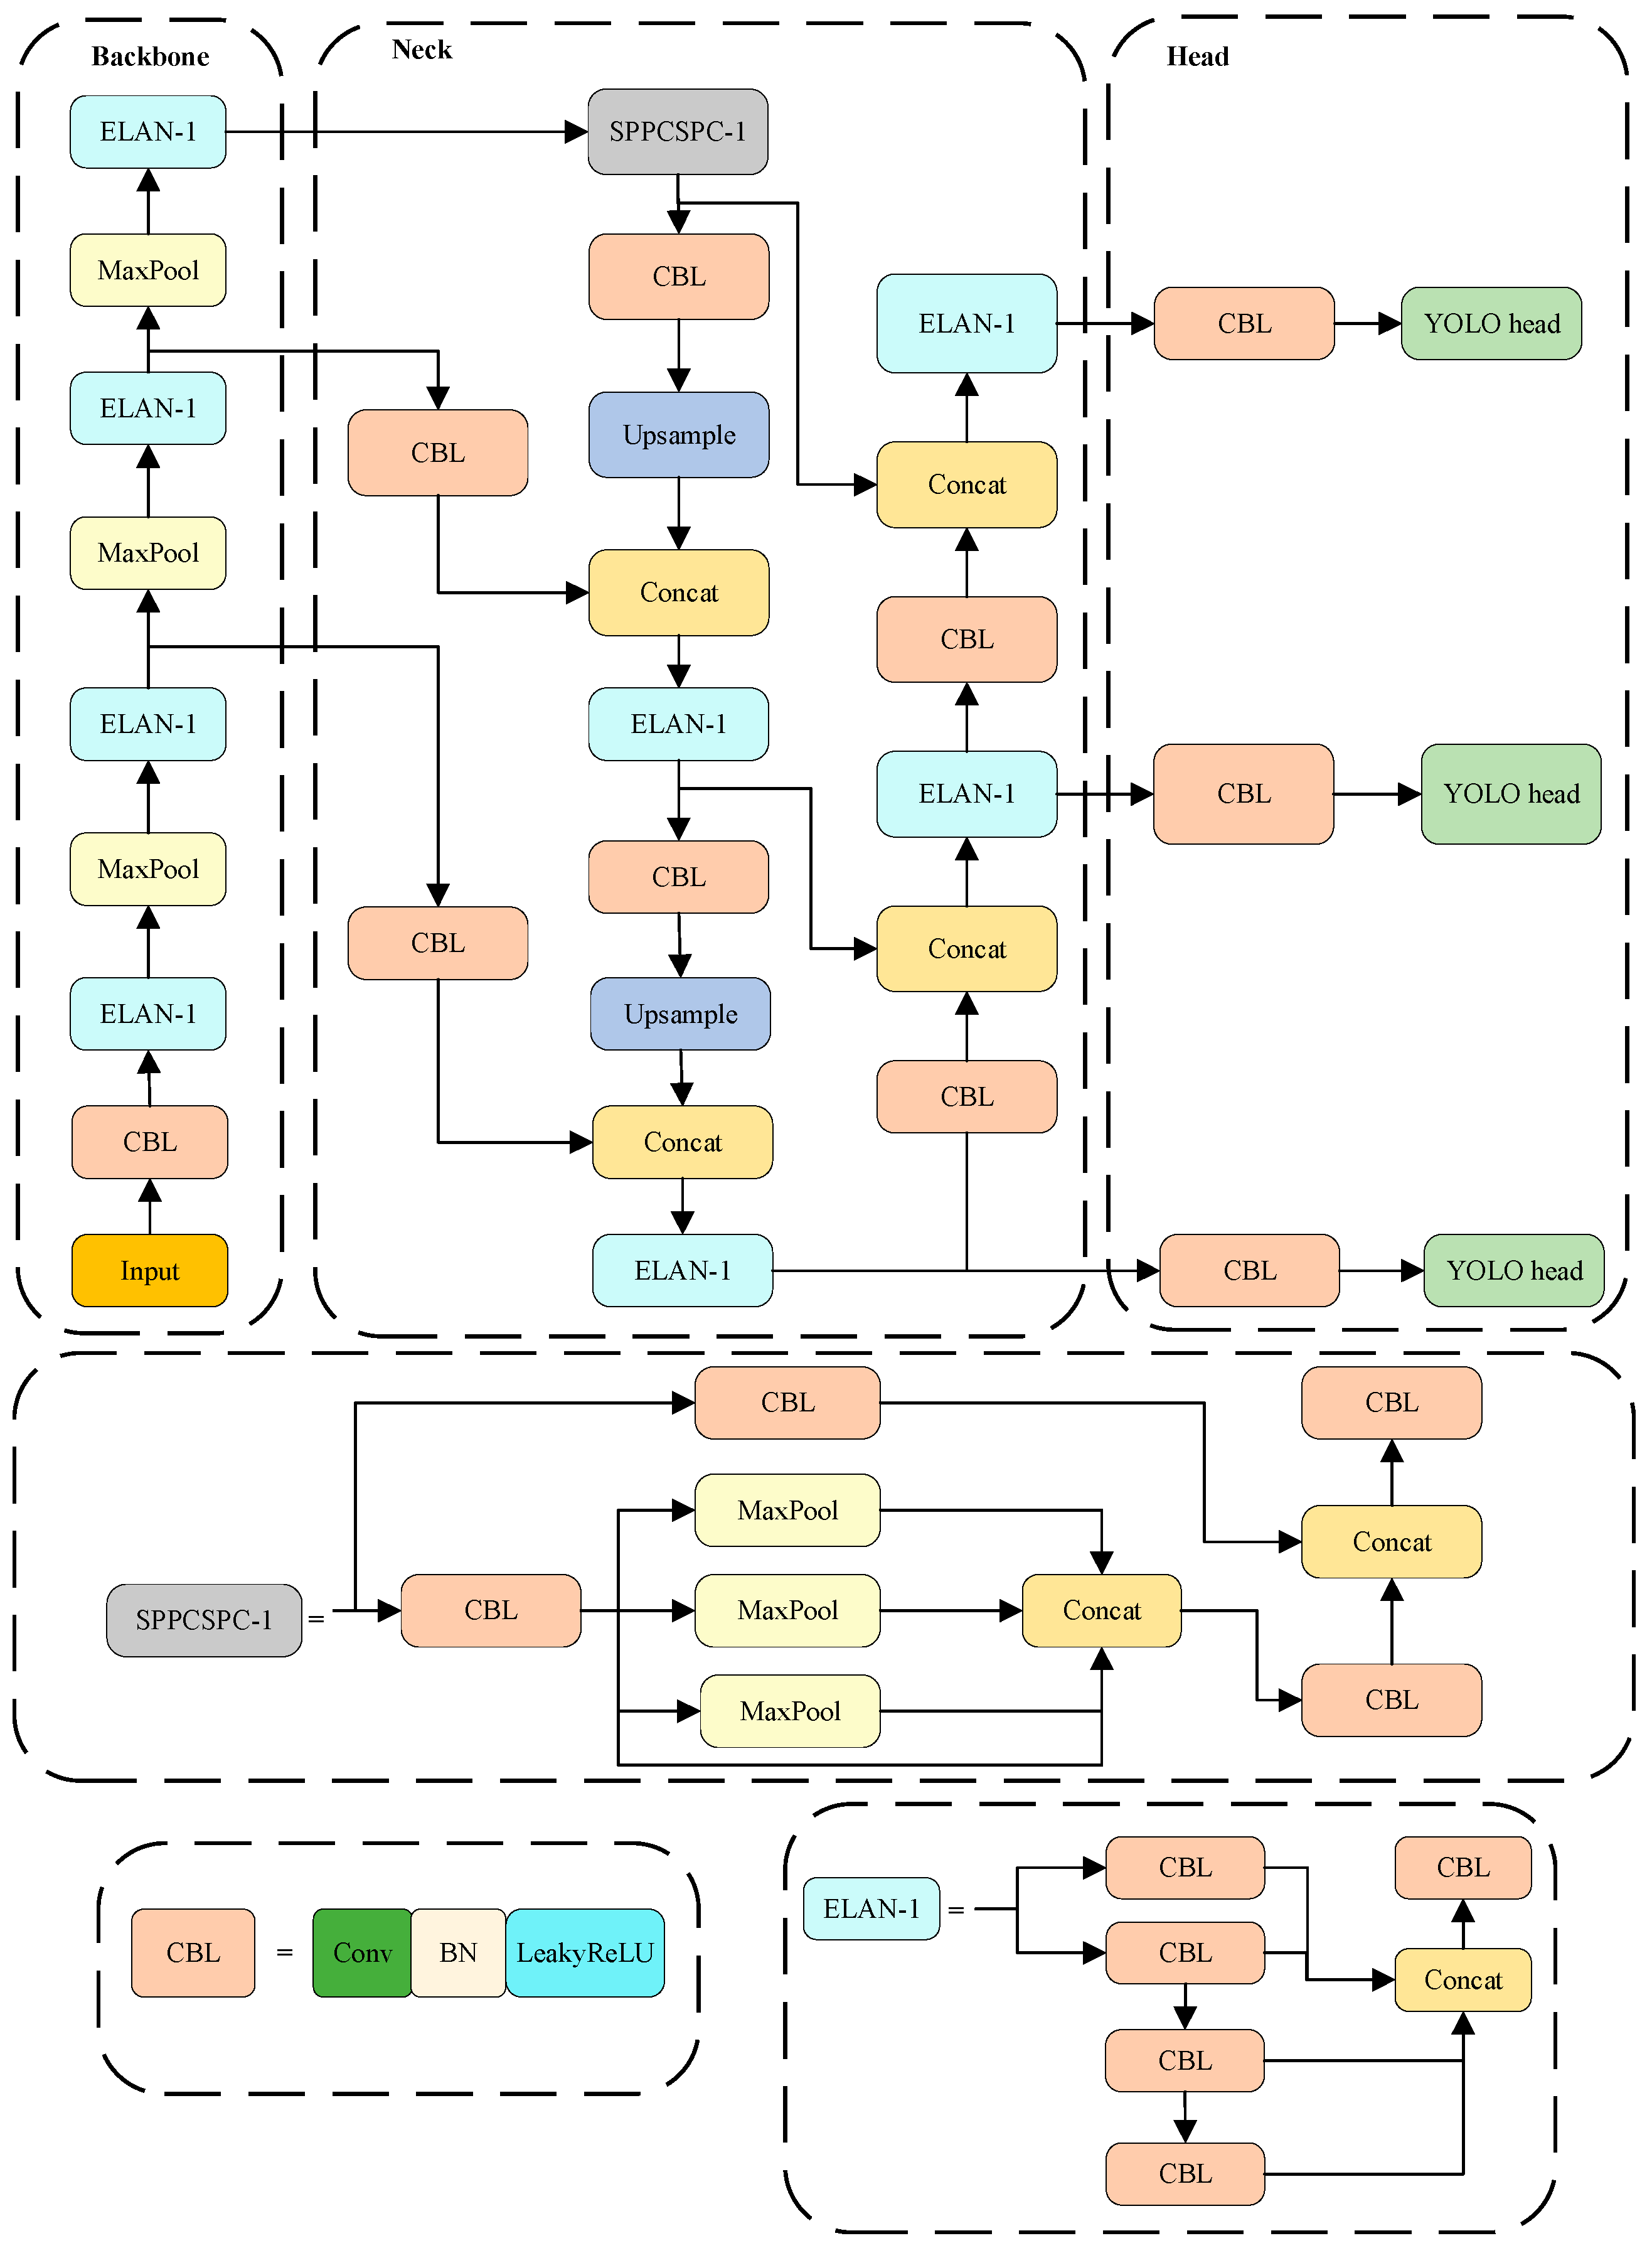
YOLOv7-tiny is a lightweight version of the YOLOv7 series. Compared with YOLOv7, YOLOv7-tiny is simpler in network structure, with fewer parameters, and therefore faster, and its model structure includes three main parts: the backbone feature network, the neck network, and the detection head [34]. Firstly, the image undergoes a series of detailed pre-processing steps before being fed into the backbone network. These steps include cropping, as well as data augmentation techniques such as mirroring, translation, and adjusting the brightness, and the backbone network part performs feature extraction on the processed image, outputting three feature maps of different sizes; subsequently, the extracted features are processed by the neck network for feature fusion, obtaining features of three sizes: large, medium, and small; finally, the fused features are fed into the detection head, which outputs the final prediction result. The structure of the YOLOv7-tiny model is shown in Figure 4.
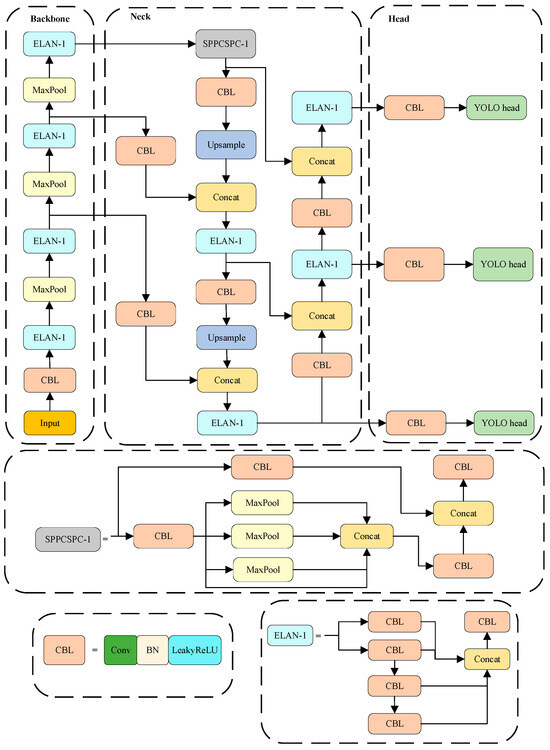
Figure 4.
Structural diagram of the YOLOv7-tiny model.
Based on the analysis of the previous experiments and reference to the existing research literature, the smaller and more accurate version of YOLOv7-tiny was optimized to make the detection model more lightweight [35]. Meanwhile, to further explore the detection effect of the model on different sizes of lesions, this experiment used YOLOv7-tiny as well as Faster RCNN, SSD, YOLOv4, YOLOv5s, and YOLOv8s detection models to test rice diseases with different size spots.
In the field of deep learning, taking into account the definition of the international organization SPIE and the definition of small targets in the COCO dataset, this paper specified that regions smaller than 25 px × 25 px were small targets, regions between 25 px × 25 px and 96 px × 96 px were medium targets, and regions larger than 96 px × 96 px were large targets.
To better evaluate and test the rice disease detection model, this paper selected 100 different sizes of spot sizes from each of the test sets of the rice leaf disease dataset in Section 2.2.2 and tested the rice disease detection model; the test results are shown in Table 3.
Table 3.
Disease test results of different sizes.
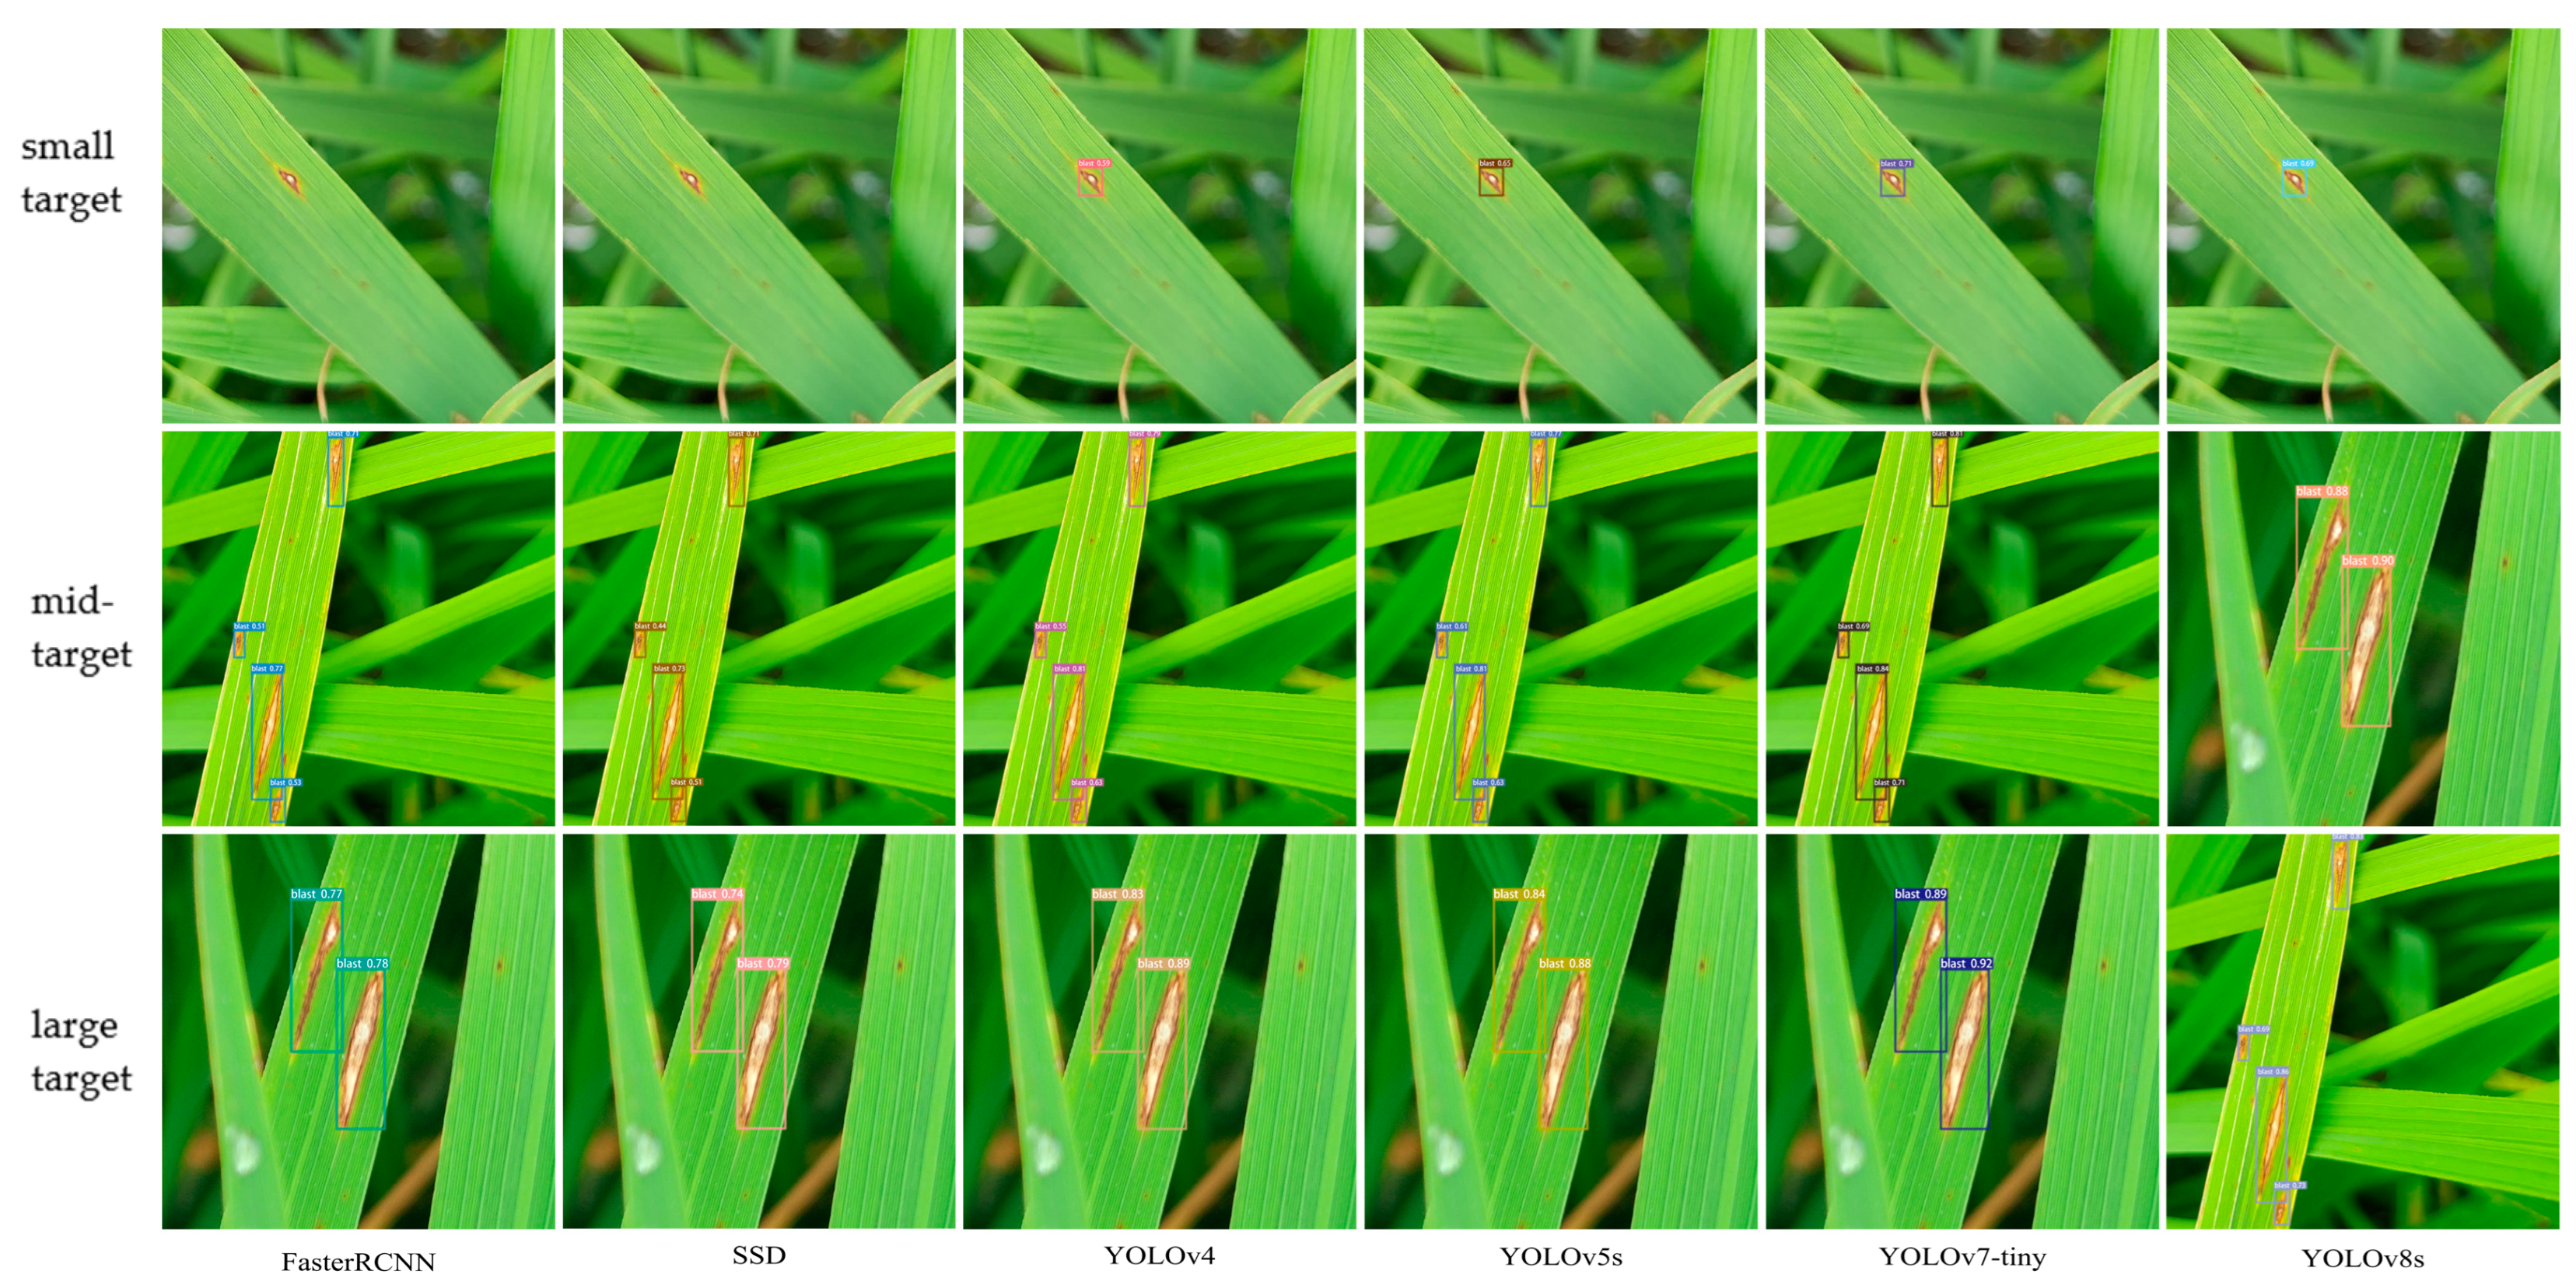
As can be seen from Table 3, The mAP0.5 detection results of YOLOv7-tiny on large, medium, and small targets were all better than those of other models. SSD had the worst detection effect on large and small targets, with 88.6% and 50.2%, respectively. Faster R-CNN had the worst detection effect on medium targets, with an mAP0.5 of only 85.2%. The detection results of YOLOv4 and YOLOv5s were similar, and only on medium targets, YOLOv5s was 2.6% higher than YOLOv4, with only 0.6% and 3.8% differences on small and large targets, respectively. YOLOv8s had a good detection effect on large targets, but its detection effect on small targets was far inferior to that of YOLOv7-tiny. YOLOv7-tiny had an mAP0.5 of 96.5% on large targets, 90.6% on medium targets, and 85.7% on small targets. In Figure 5, the results of different detection models for different sizes of spots of rice blast are shown schematically.

Figure 5.
Display of the detection results of rice blast disease.
From Figure 5, it is easy to see that Faster RCNN and SSD were very bad at detecting small targets of rice blast, while YOLOv7-tiny had better results for detecting large targets, but the results for detecting small and medium targets were still not able to meet agricultural needs.
2.5. Improved Model Design for Rice Spot Recognition with YOLOv7-Tiny
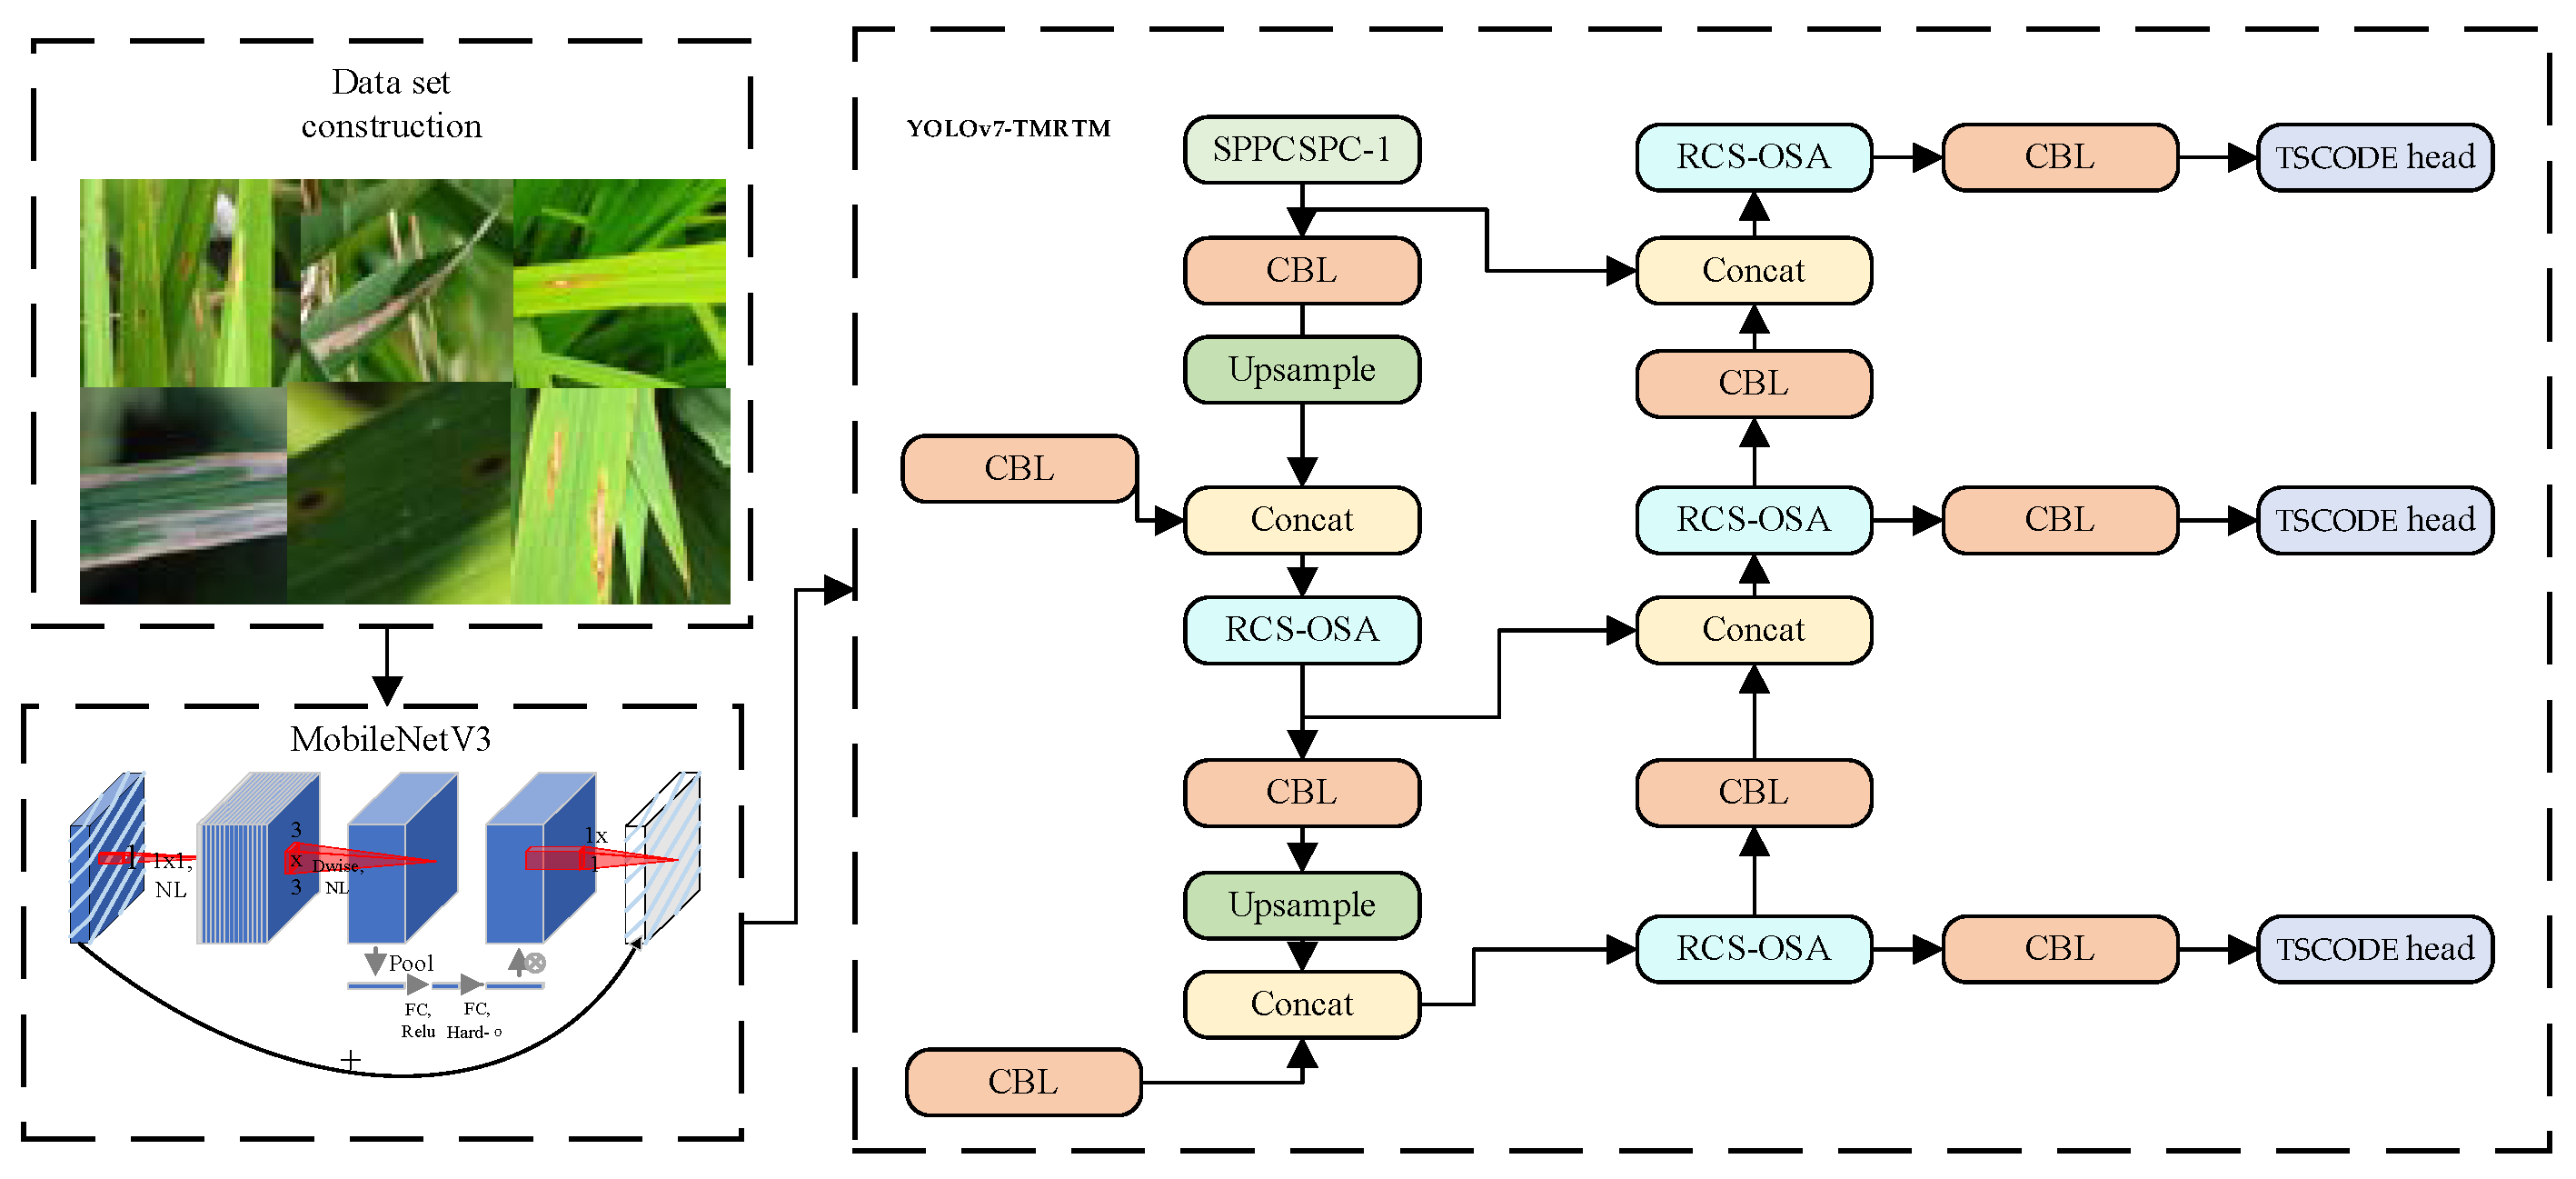
From the pre-experiment results analyzed in 2.4, it was found that although YOLOv7-tiny showed good adaptability for detecting leaf disease target identification, it still had the problem of leakage detection, especially in the detection of small target spots. Therefore, this study improved it as follows: the MobileNetV3 lightweight network was used to replace the backbone network of YOLOv7-tiny, which reduced the volume of the model parameters and improved the extraction ability of features of different sizes; the RCS-OSA was used to replace the original ELAN-1 module, which improved the model’s ability to extract interlayer features; TSCODE was used to improve the detection head of the model to enhance the model’s ability to detect small targets; the loss function MPDIoU was used to improve the convergence speed and effect of the model. The overall model modification method is shown in Figure 6.
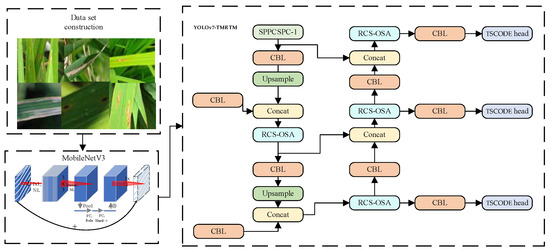
Figure 6.
YOLOv7-TMRTM structure diagram.
2.5.1. Lightweight Backbone Network Design Based onMobileNetV3
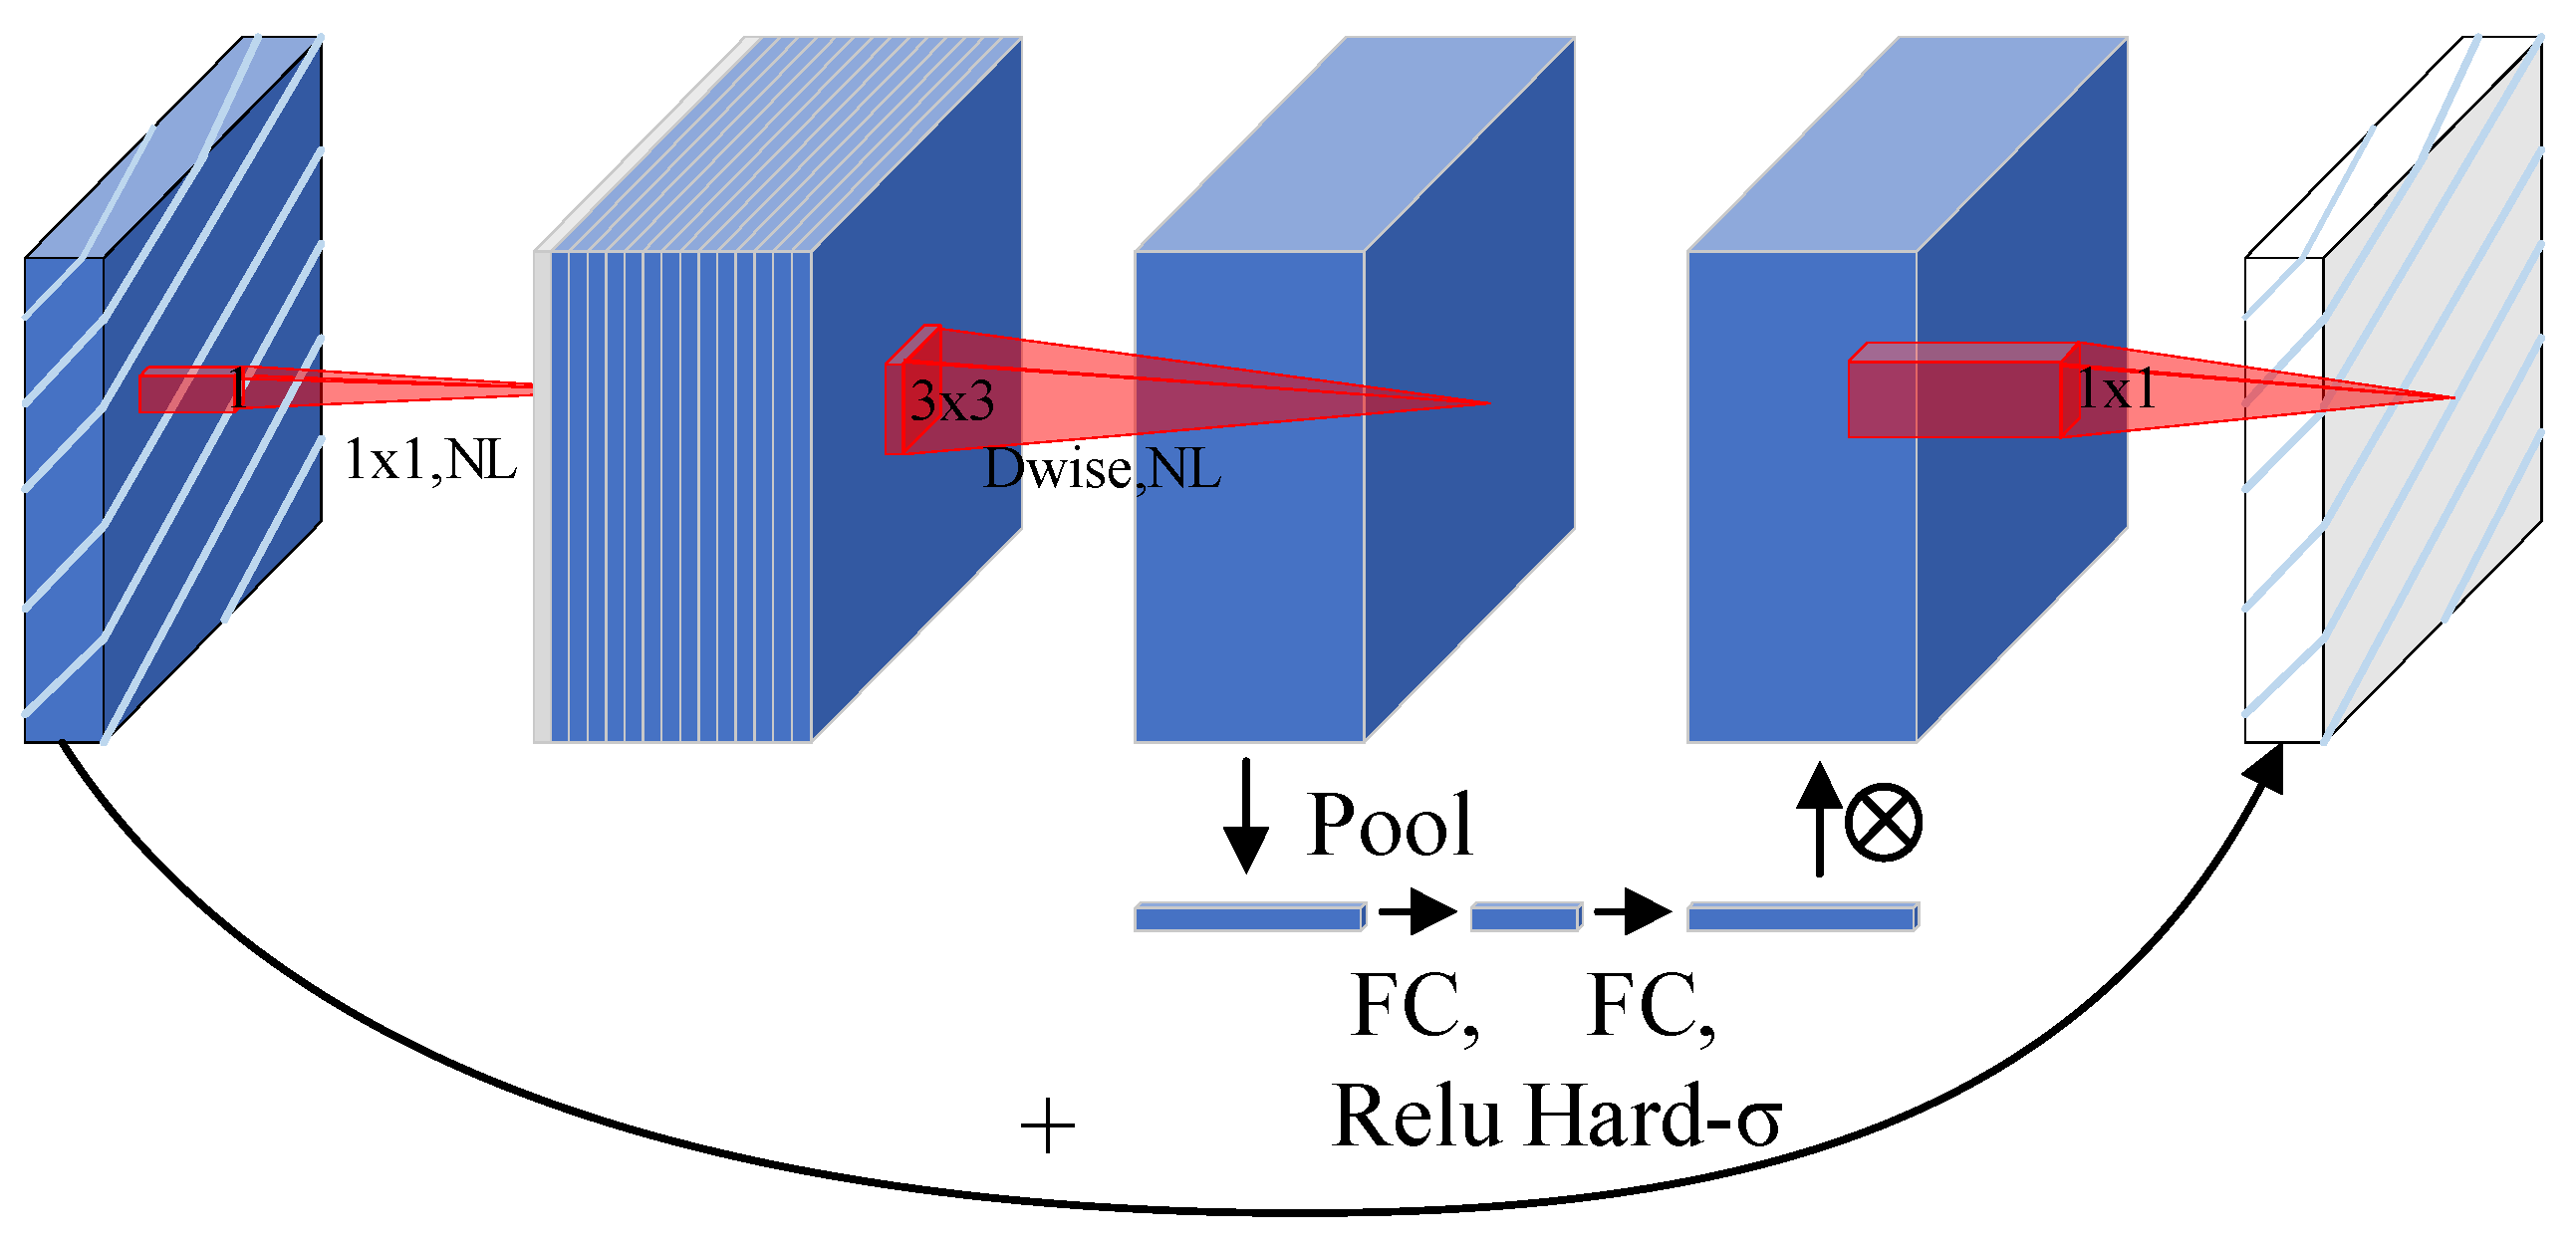
Aiming at the problems of redundancy of channel information and poor extraction of targets of different sizes in the trunk network in YOLOv7-tiny when extracting leaf disease features, we propose to adopt a lightweight trunk networkMobileNetV3. The network structure is shown in Figure 7. The network is based on MobileNetV1 and MobileNetV2, an optimization of and improvement to the lightweight network model introduced in [36,37]; in addition to ordinary convolution, depth separable convolution, an attention mechanism module, and an optimized activation function were also added.

Figure 7.
The network structure of the MobileNetV3.
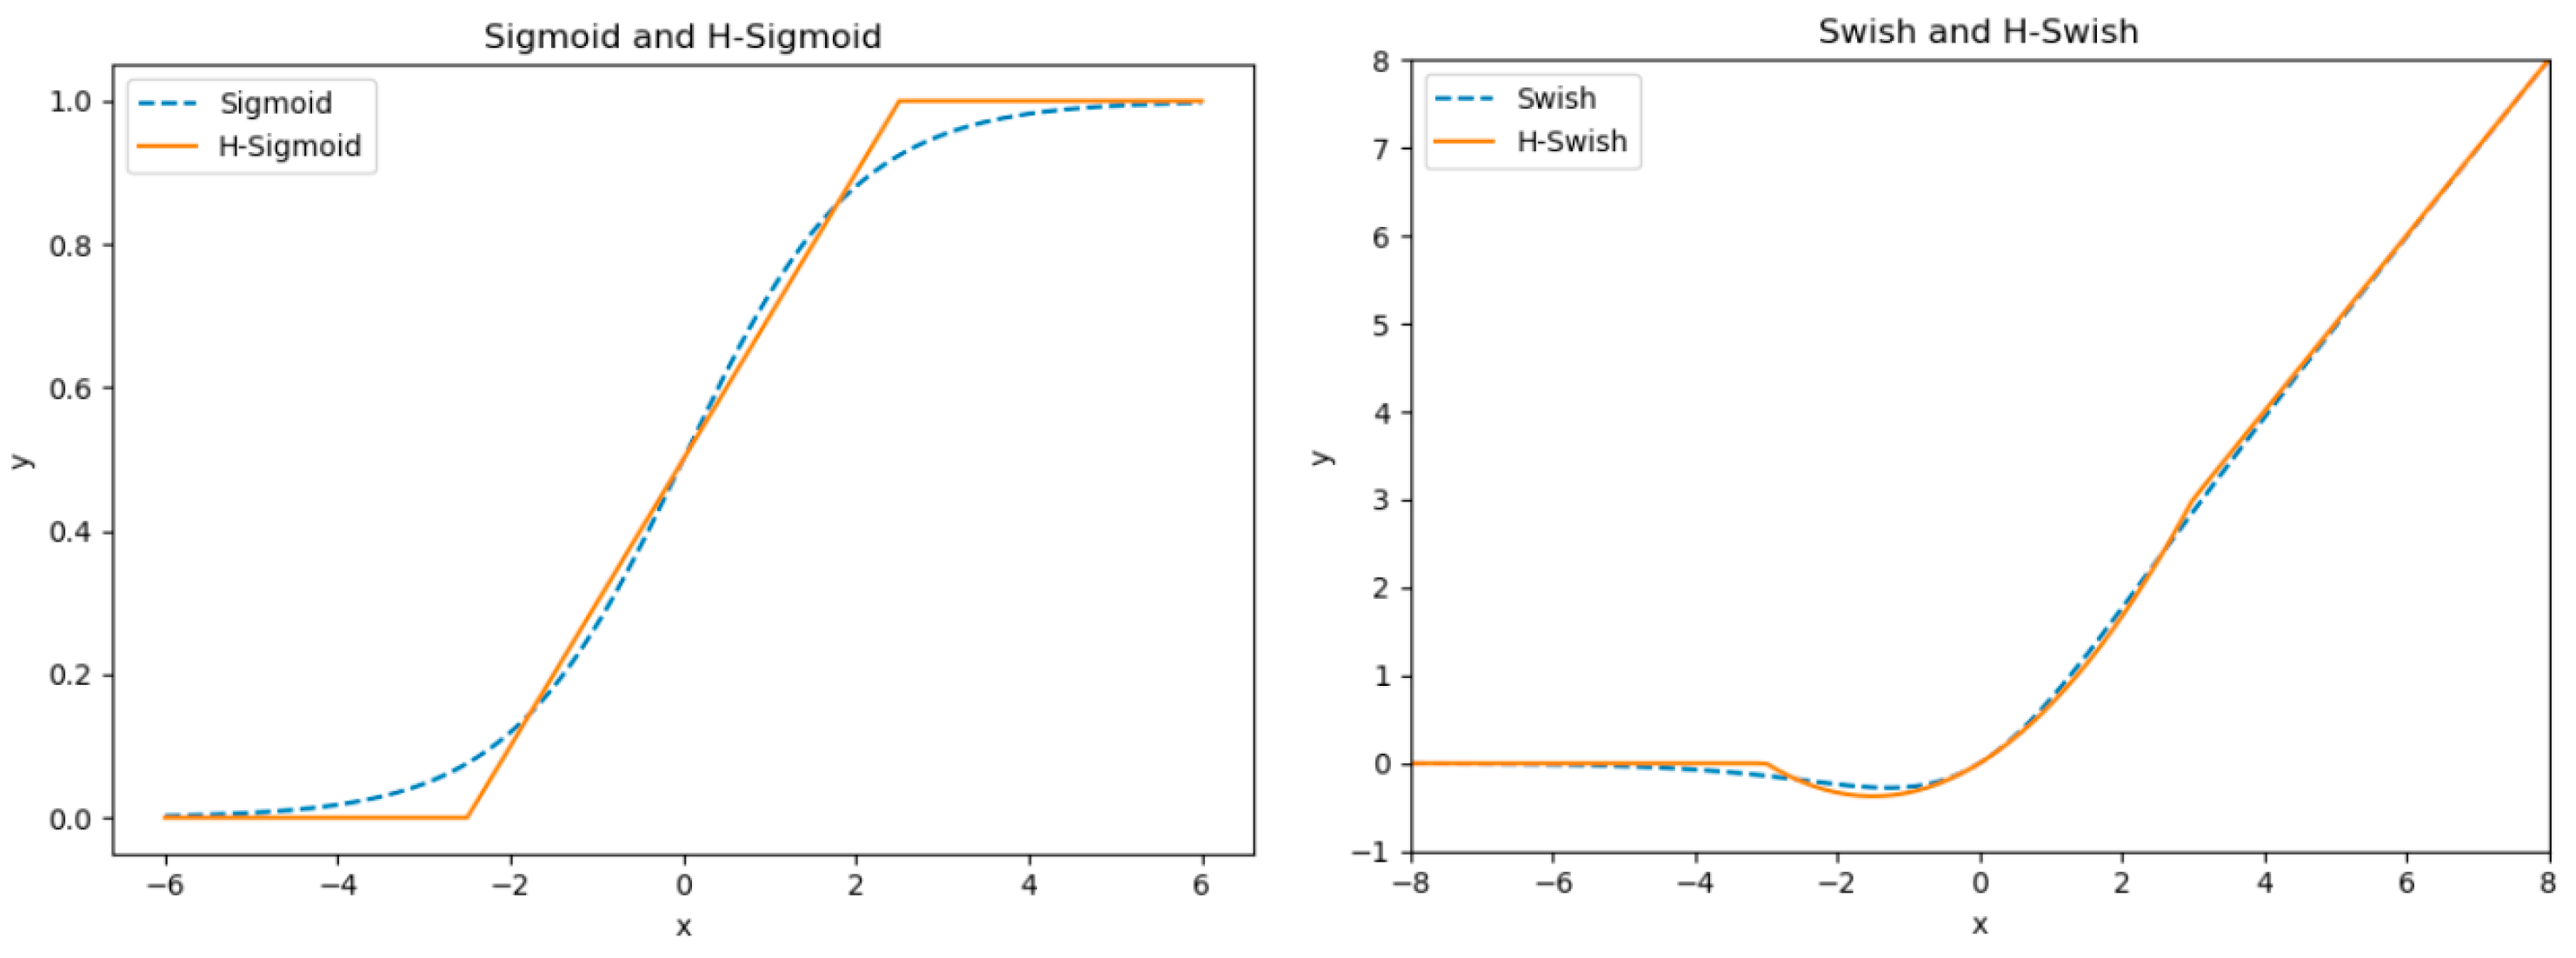
MobileNetV3 proposes the H-Swish activation function by combining the ReLU6 activation function and the Sigmoid activation function.
Although the Sigmoid function compresses the inputs and makes the neural network robust to larger or smaller inputs, it suffers from the gradient vanishing problem, making the training of deep networks difficult. Its expression is shown in (1).
Although ReLU6 can control the range of output values, truncated output values may cause loss of information, especially when processing data such as images, which are not conducive to conveying important information [38]. Its expression is shown in (2):
Although the Swish function can avoid the problem of vanishing gradient, the use of the Swish function in large-scale neural networks may bring some computational complexity. Its expression is shown in (3):
where H-Swish is x multiplied by H-Sigmoid. The formula and the derivation process are simpler. The expression is shown in (4) and (5):
The activation function images of H-sigmoid and H-switch are shown in Figure 8.
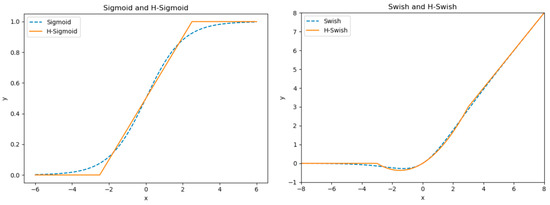
Figure 8.
Activation function images for H-sigmoid and H-switch.
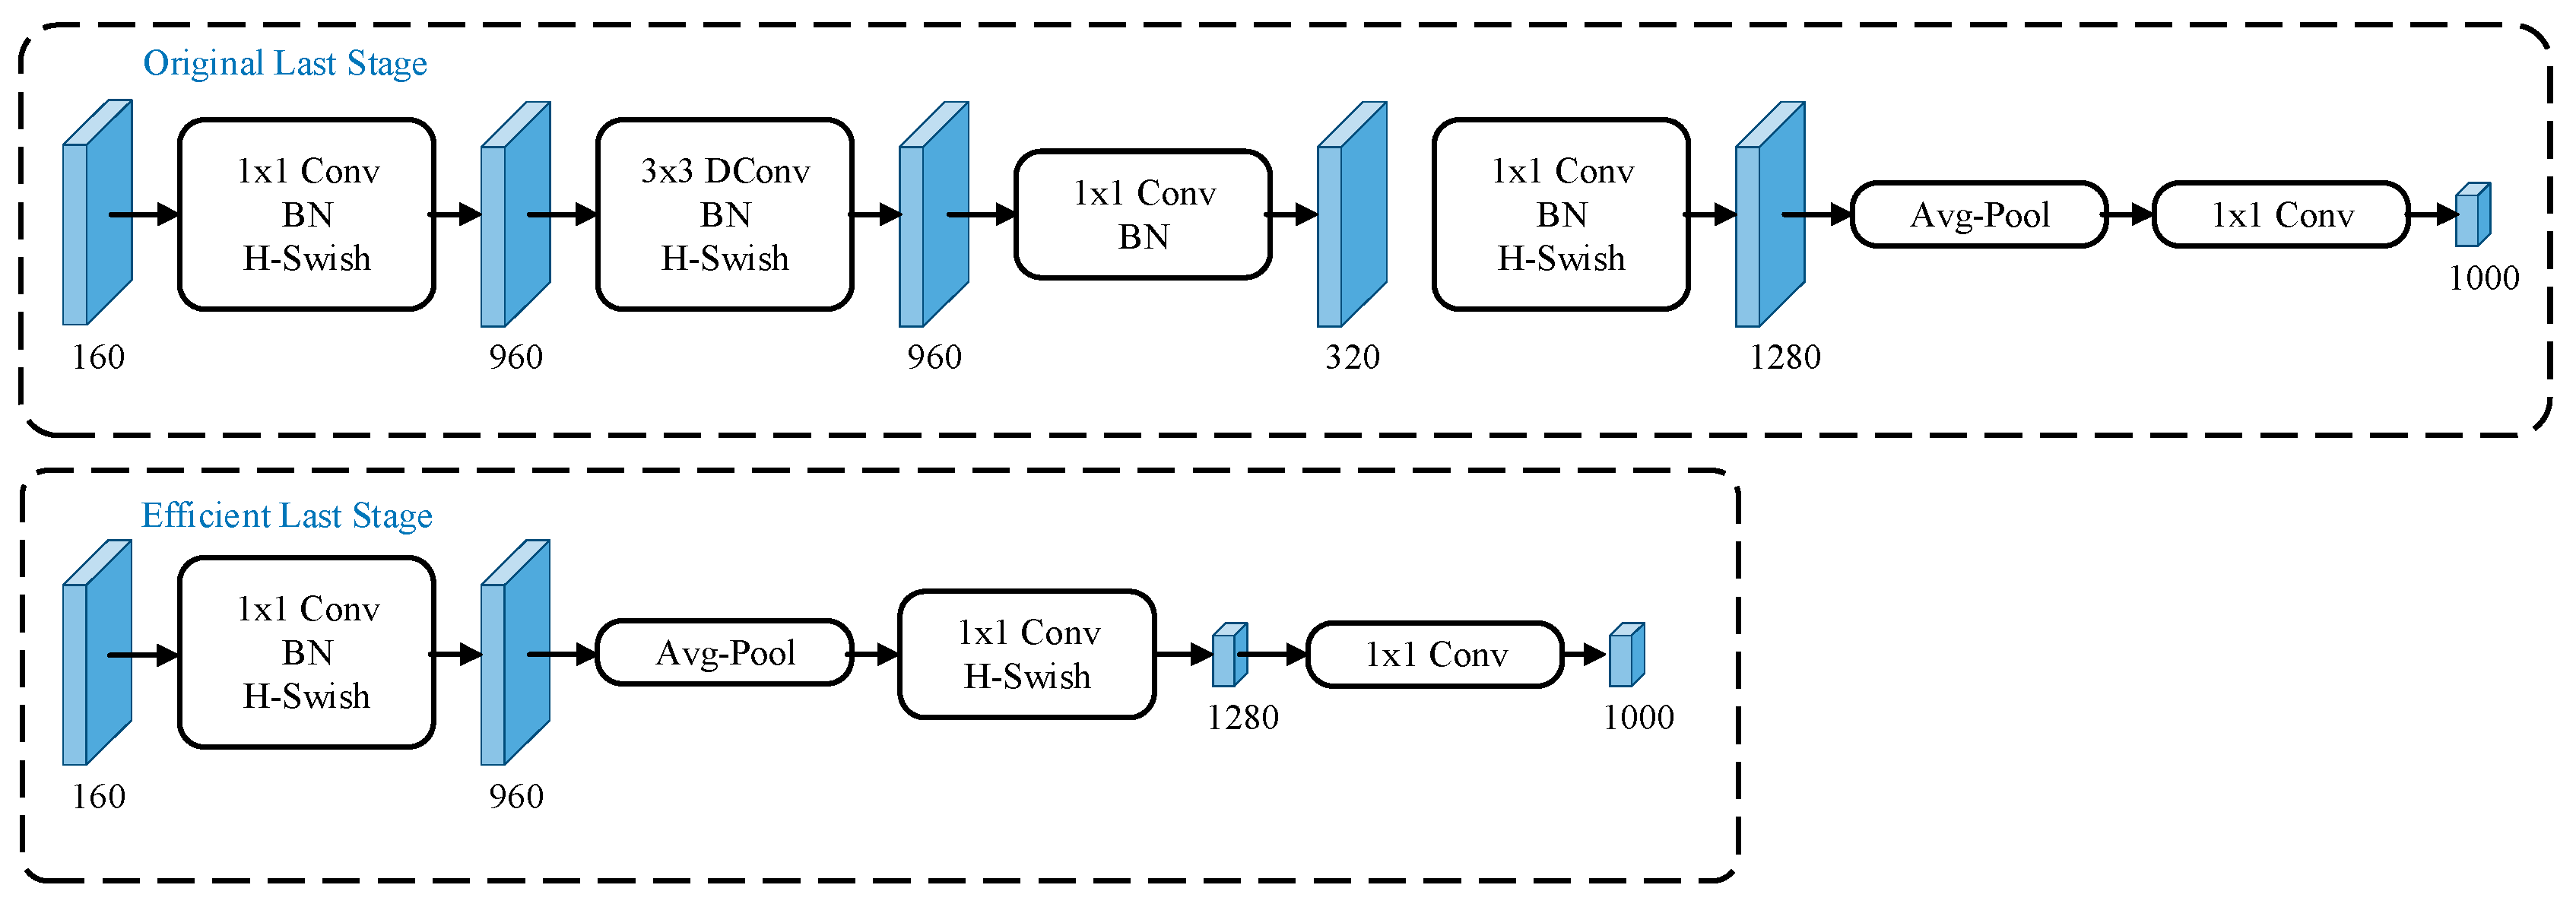
MobileNetV3 reduces the amount of computation by simplifying the time-consuming layer, making the model lighter. Efficient Last Stage is a new module that improves on the original output structure and provides a significant speed-up compared to the Original Last Stage module. A comparison of the time-consuming layer structure is shown in Figure 9; it does not degrade accuracy. The Original Last Stage module is dimensionally upgraded by multiple convolutions, and then outputs are produced by using an average pooling operation and a convolution operation. Efficient Last Stage performs only a small number of convolution operations, followed by average pooling, and then a small number of convolution operations. MobileNetV3 uses a convolutional layer instead of a fully connected layer, thus preserving the spatial connection of the image feature information [18].
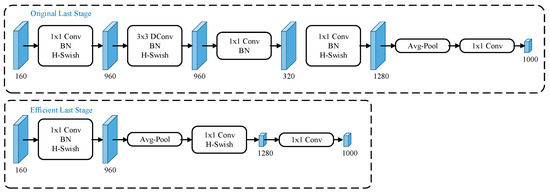
Figure 9.
Comparison of the time-consuming layer structure.
2.5.2. Design of Feature Fusion Module Based on RCS-OSA
Given the lightweight nature of the YOLOv7-tiny model, it is heavily simplified in the feature extraction module, which results in the model not being able to obtain sufficient and detailed information in capturing the edge features of rice disease spots. To overcome this limitation, this study proposes the use of One-Shot Aggregation of Reparameterized Convolution based on the Channel Shuffle module to replace the original feature extraction module. The introduction of this new module aims to extract the texture and color features of rice diseases more comprehensively to provide a more accurate basis for subsequent disease localization and classification.
The RCS-OSA module is a combination of the RCS (Reparameterized Convolution based on channel Shuffle) and OSA (One-Shot Aggregation) architectures [39]. The structure of RCS is shown in Figure 10.
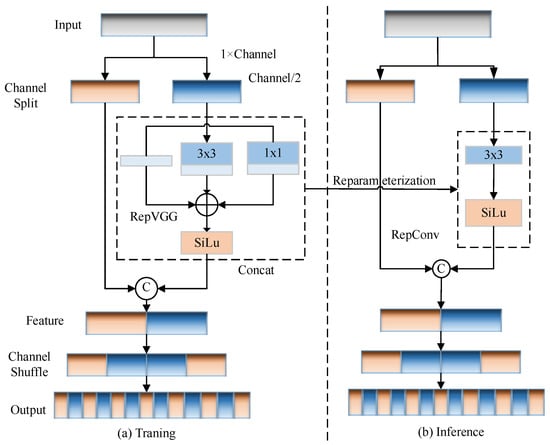
Figure 10.
RCS assumption diagram.
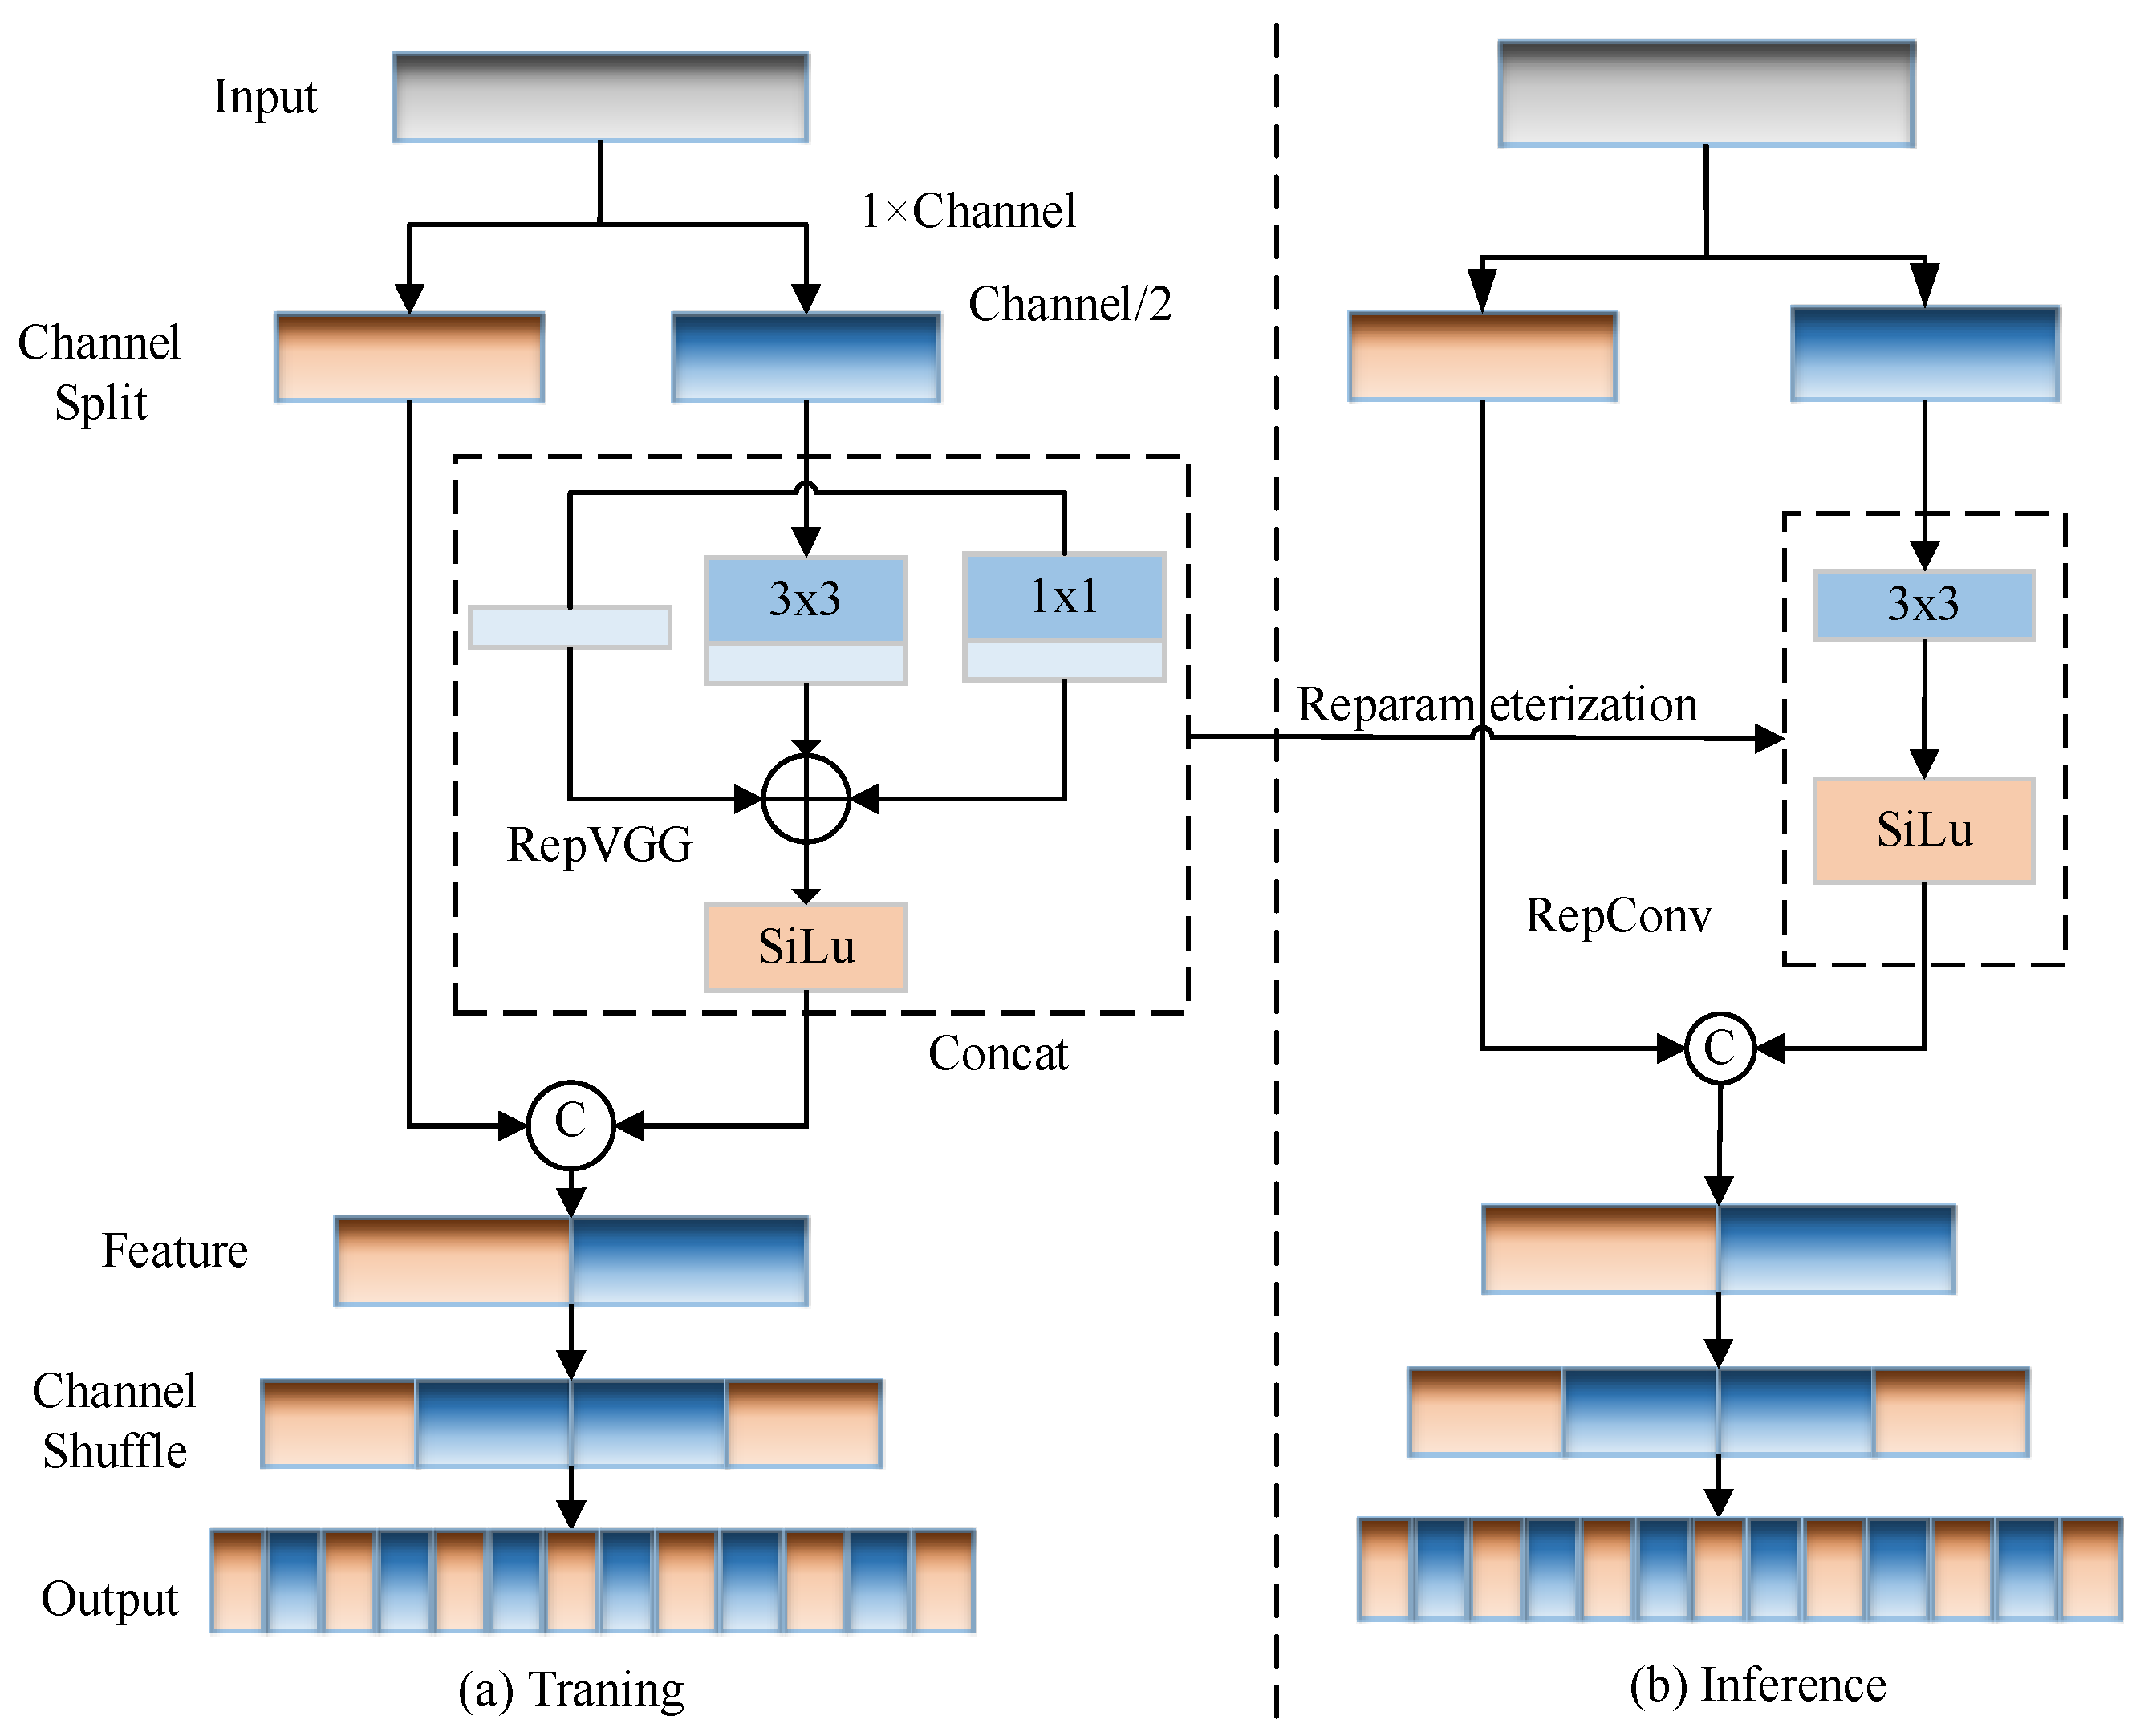
The input tensor of RCS has a feature dimension of C × H × W, which is divided into two different channel tensors with dimensions of C × H × W after the channel splitting (Channel Split) operator. One of the tensors trains the RCS through three branches, namely, a 3 × 3 convolution, a 1 × 1 convolution, and no change, respectively. In the inference phase, the three branches, namely, the 3 × 3 convolution, 1 × 1 convolution, and no change, are converted to 3 × 3 RepConv through structural reparameterization. The purpose of this design is that the multi-branch topology can learn rich feature information in the training phase, while the simple single-branch structure can save memory consumption in the inference phase and achieve fast inference. After multi-branch training of one of the tensors, it is stacked onto another tensor in a channel manner. The Channel Shuffle operation is also used to enhance the fusion of information between two tensors so that depth measurements between different channel features of the inputs can be achieved with low computational complexity.
When there is no channel rearrangement, the output features of each group are only related to the input features within the grouped convolution. This blocks the flow of information between channel groups and weakens feature extraction. When channel rearrangement is used, the input and output features are fully correlated and one of the convolutional groups obtains data from the other groups, resulting in a more efficient exchange of feature information between the different groups. Channel rearrangement operates on stacked grouped convolutions and allows for more informative feature representations. In the inference phase, RCS uses operators such as channel splitting and channel rearrangement to alleviate the computational complexity while maintaining the exchange of information between channels.
The OSA module, where only the input of the last layer is a stack of all the previous feature layers, can overcome the inefficiency of dense connectivity by representing different features with multiple acceptor domains and aggregating all the features only once in the final feature mapping. The RCS-OSA structure is shown in Figure 11. Repeated stacking of RCS modules ensures the reuse of features and enhances the information exchange between different channels between neighboring features.
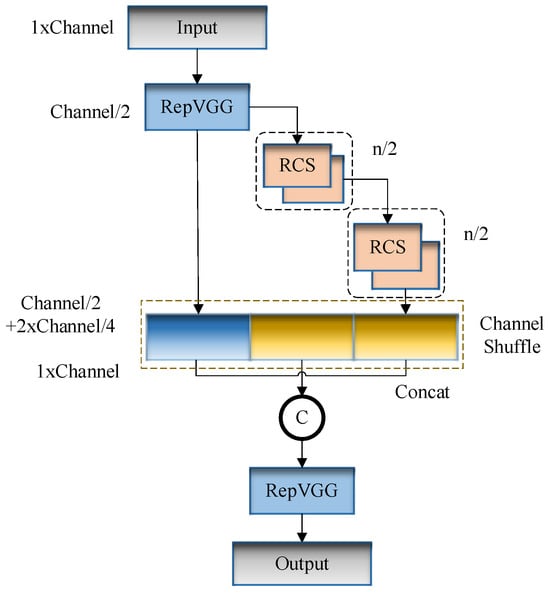
Figure 11.
The RCS-OSA structure.
2.5.3. TSCODE-Based Detection Head Design
Although YOLOv7-tiny performs well in many scenarios, since YOLOv7-tiny is a lightweight target detection model, its design focuses on maintaining the speed and small size of the model, which leads to poor performance in small target detection. For this reason, this study proposes a Task-Specific Context Decoupling (TSCODE) semantic coding model, which is based on the idea that learning for classification tasks is carried out through a feature layer that possesses a high level of semantic information, and for localization tasks, a high resolution that provides more edge information is required for features to regress object boundaries more accurately [40]. The TSCODE model structure is shown in Figure 12.
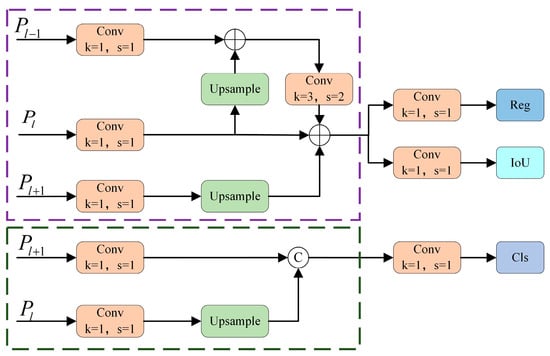
Figure 12.
TSCODE Structure Diagram.
Classification and localization are two highly related but conflicting tasks in target detection. For each object, classification is coarse-grained and requires richer semantic context, while localization is fine-grained and requires more detailed boundary information. In TSCODE, for the classification branch, the Semantic Context Encoding (SCE) module is introduced, which is capable of generating spatially coarser but semantically richer feature representations. For the localization branch, TSCODE employs the Detail-Preserving Encoding (DPE) module, which provides a feature representation specifically for this branch, containing more detailed texture and boundary information. In this way, each branch can be optimized for its unique task requirements, reducing potential conflicts and ultimately improving the overall performance of the detector.
2.5.4. MPDIoU-Based Loss Function Design
In the YOLOv7-tiny model, the CIoU loss function is used to calculate the regression loss, which not only needs to calculate the distance from the centroid of the target frame to the centroid of the prediction frame but also needs to calculate parameters such as the diagonal length of the minimum closure area of the real frame, the prediction frame, the angle, and other parameters; thus, the calculation process is more complicated. For this reason, this paper proposes to use MPDIoU instead of CIoU, which combines the concepts of minimum point distance and intersection and concurrency ratio and can solve the problem that the existing loss function cannot be effectively optimized when the predicted bounding box has the same aspect ratio as the true bounding box, but the values of the width and height are completely different.
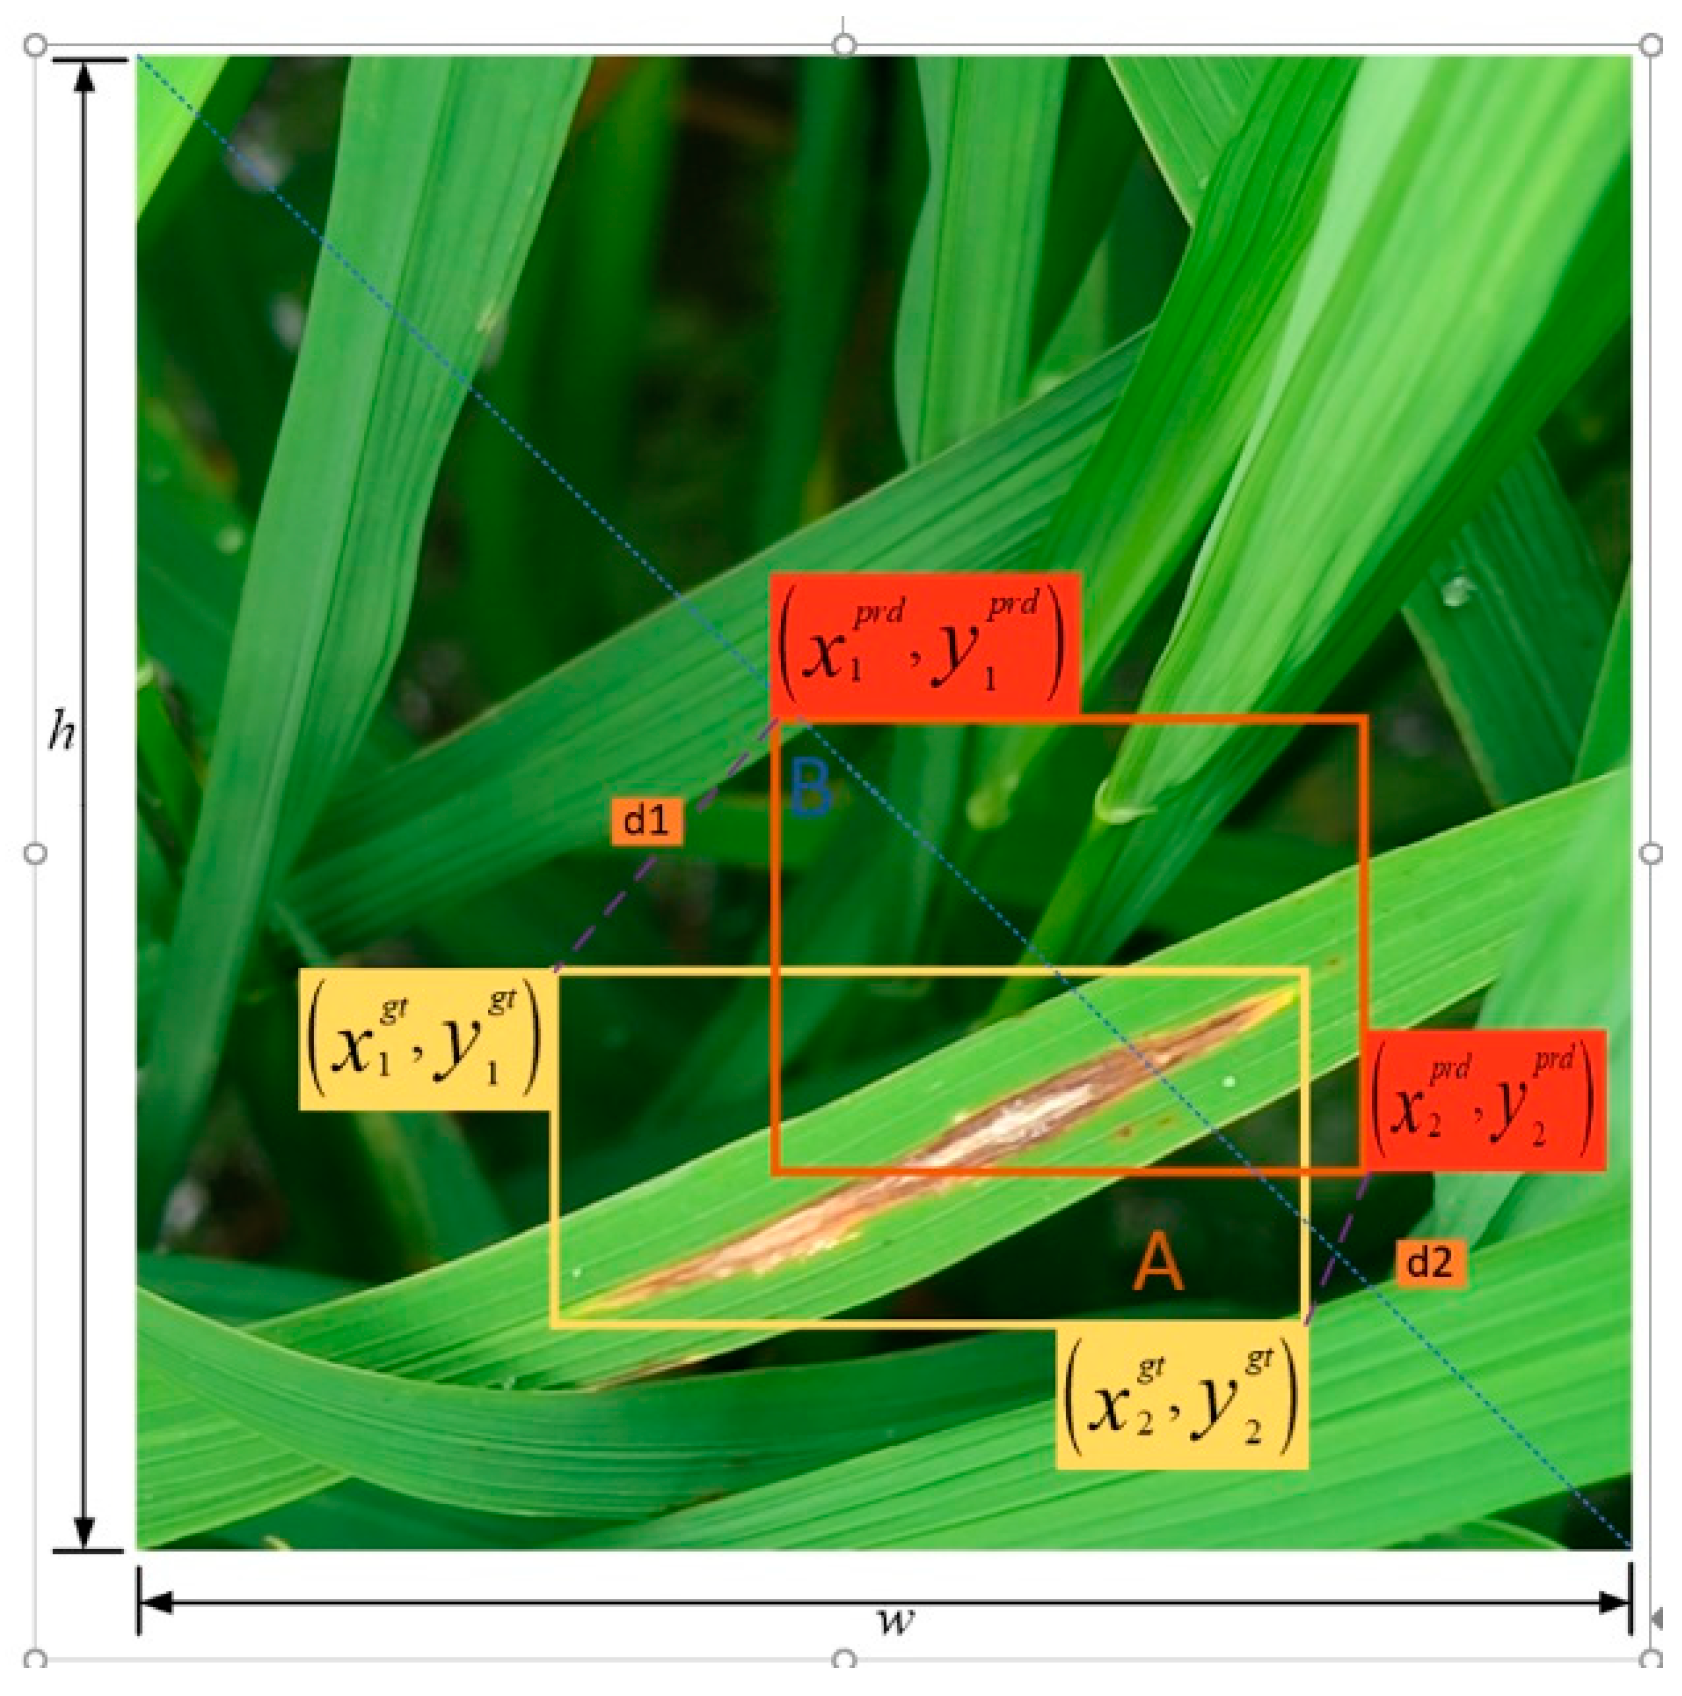
MPDIoU contains three key factors: overlapping or non-overlapping regions, centroid distances, and deviations in width and height. It simplifies the computation process by minimizing the point distance between the prediction bounding box and the true value bounding box to compute the IoU [41]. The expressions for the MPDIoU loss function are shown in Equations (6) and (7):
In the above equation, denotes the coverage of and which is the area of the smallest enclosing rectangle, as shown in Figure 13 with a schematic diagram of the relationship between the position of each parameter. Box A denotes the true box and box B denotes the predicted box.
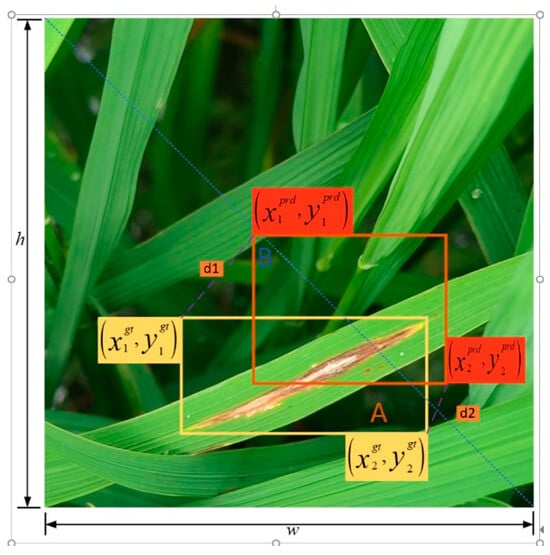
Figure 13.
MPDIoU position relationships.
Compared with the CIoU loss function, the MPDIoU loss function directly calculates the point distance between the predicted frame and the actual frame without calculating parameters such as complex geometries and angles, simplifying the calculation process. By minimizing the point distance between the predicted frame and the actual frame, the MPDIoU loss function can locate the position of the target frame more accurately and improve the positioning accuracy.
2.6. Test Environment Configuration and Parameter Setting
The experimental processing platform used the Intel (R) Xeon (R) Platinum 8260@2.30 GHz CPU (The manufacturer is Intel Corporation, and its headquarters is located in Santa Clara, CA, USA), 64 G of memory, an NVIDIA Tesla P100 GPU model, the software environment used pytorch1.12.1 + Cuda11.3 + Python3.9 to build, and the operating system was Linux. The input image size was (640 px × 640 px), and the number of epochs was 300. The Adam gradient optimization algorithm was used with an initial learning rate of 0.001 and a momentum factor of 0.937. The hyperparameter settings for the test are shown in Table 4.
Table 4.
Training of the hyperparameter settings.
2.7. Evaluation Indicators
To better evaluate the detection performance of the improved detection model on the rice disease dataset, this study used precision, recall, Mean Average Precision (mAP0.5), number of parameters, and model size to evaluate the performance of the model.
Precision assesses how many of the results predicted as positive in the model were correct, calculated by dividing the results that were correctly predicted by all results predicted as positive. The formula is shown in Equation (8):
Recall measures the proportion of samples that are positive examples that are correctly predicted by the model. The formula is shown in Equation (9):
mAP0.5 is the average of the Average Precision (AP) of all categories, and AP is the area enclosed by the P-R (precision–recall) curve and the horizontal and vertical axes. The calculation formula is shown in Equations (10) and (11):
Params represent the size of the storage space occupied by the model file and is a metric used to assess model complexity and calculate model size in MB.
2.8. Ablation Test
To explore in depth the specific contribution of the model improvements to the performance enhancement and to verify the effectiveness of each improvement component, an exhaustive ablation test was specifically designed. The ablation test served as an effective means of assessing the importance of each component of the model, and by removing or replacing specific parts of the model one by one, it was possible to observe the impact of these changes on the overall performance of the model. This not only helped to understand how the model worked but also provided strong data support for subsequent model optimization.
In this section, ablation tests were designed so that the impact of the improved part on the model detection performance could be visualized. Using YOLOv7-tiny as the base model, the lightweight networkMobileNetv3 was designed to replace the backbone network; to improve the exchange of information on different channels between neighboring features, RCS-OSA was used to replace the original ELAN-1module to improve the model’s extraction of interlayer features; to improve the model’s detection of small targets, TSCODE was used to improve the model’s detection head. Finally, the loss function MPDIoU was used to improve the model convergence speed and effectiveness. A comparison of the ablation test results is shown in Table 5.
Table 5.
Comparison of the results of the ablation test.
From Table 5, it can be seen that after replacing the lightweight MobileNetV3 network with YOLOv7-TM, mAP0.5 was only improved by 0.5% compared with the original model, but the number of model parameters decreased by 25.2%, indicating an improved lightweight network. This indicated that the improved lightweight network could effectively reduce the number of parameters of the model without losing the detection accuracy of the model. After adding the RCS-OSA module to YOLOv7-TR, the mAP0.5 increased by 1.2% compared with the original model, which showed that adding this improvement strategy could make the model pay more attention to the lesion characteristics of rice leaves, but the model’s Params increased by 4.28 M compared with the original model, and the model size increased by 8.4 MB because this feature extraction method used multiple channel rearrangements. The model’s Params increased by 4.28 M and 8.4 MB in model size, because this feature extraction method used multiple channel rearrangement and stacking, so there was a certain impact on the model’s Params and model size. TheYOLOv7-TTmodule used the TSCODE module to optimize the detection header with a 0.7% improvement in mAP0.5 and a 3.08 M increase in Params. After the YOLOv7-TMP model was optimized with the loss function, mAP0.5 was improved by 0.8%, Params was reduced by 0.81 M, and the model size was reduced by 0.3 MB, which indicated that the loss function reduced the model Params and reduced the model size. The YOLOv7-TMR model reached an mAP0.5 of 96.9% after adding the lightweight network and RCS-OSA, which was a 1.6% improvement over the original model. The YOLOv7-TMRT module reached an mAP0.5 of 97.1% after adding the lightweight network, RCS-OSA, and TSCODE module. The YOLOv7-TMRTP module reached an mAP0.5 of 97.9% after adding the lightweight network, RCS-OSA, TSCODE, and optimized loss function, which was a 2.6% improvement over the original model. Both Params and model size increased by 2.48 M and 4.4 MB, respectively. From mAP0.5, the YOLOv7-TMRTM model proposed in this paper improved by 2.6% compared with the original model, which could meet the requirements of the rice disease detection task and was more suitable than the original model for use in the rice disease detection task.
Figure 14 shows the YOLOv7-tiny model and the YOLOv7-TMRTMSchematic of the detection results of the model. By optimizing the feature extraction module as well as the detection head module, the accuracy of the model for disease detection was improved.

Figure 14.
Effect diagram of rice disease detection before and after model improvement.
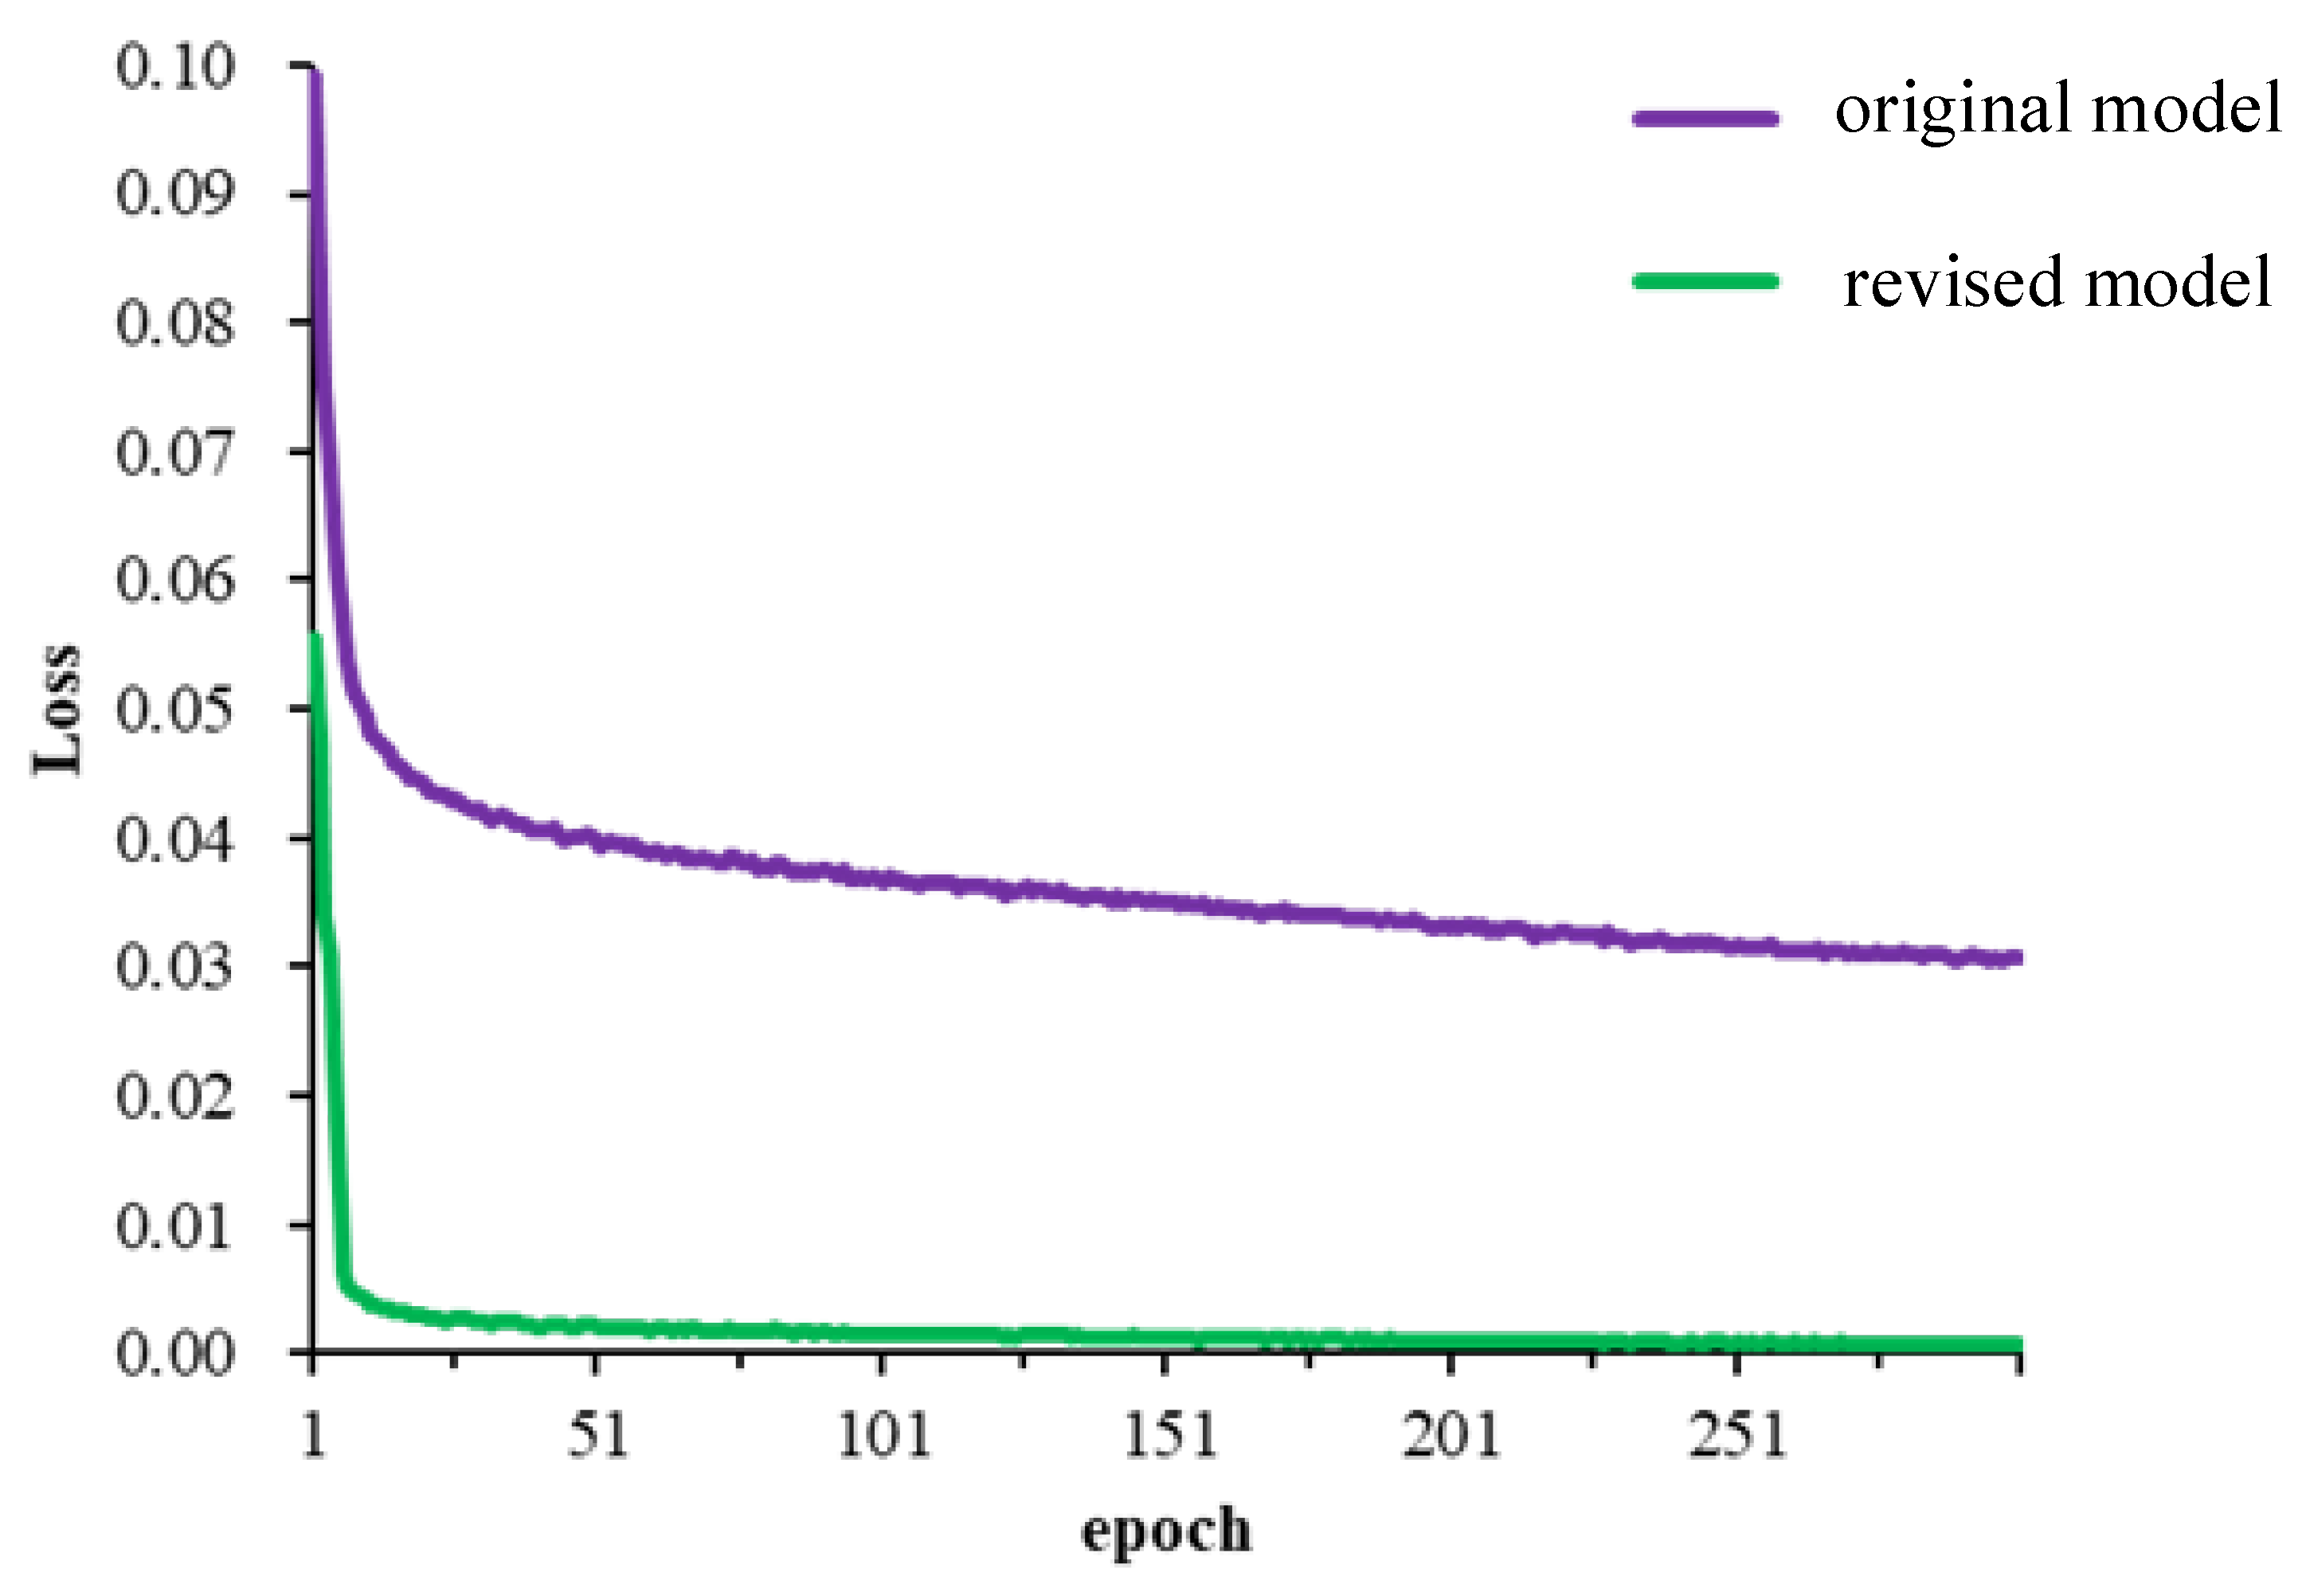
The loss value (Loss) comparison curves of the original model and the improved model during the training process are shown in Figure 15. The horizontal coordinate represents the epochs, the vertical coordinate represents the Loss value, the purple curve represents the change in Loss value of the original rice disease detection model, and the green curve represents the change in Loss value of the improved model.
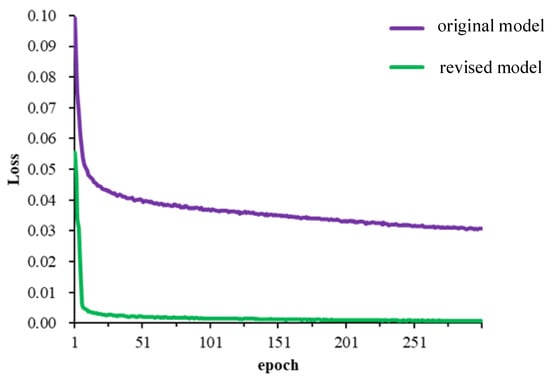
Figure 15.
Loss comparison between before and after improved models.
As can be seen from Figure 15, both the original model and the improved model trained relatively well, and neither of them had overfitting or underfitting problems. The initial loss value of the original model was 0.09902, and the initial loss value of the improved model was 0.0554. With the continuous increase in number of epochs, the loss value of the original model gradually decreased to a stable value after 260 rounds, and the final loss value stabilized at around 0.03; while the loss value of the improved model gradually decreased to a stable value after 200 rounds, and the final loss value stabilized at around 0.0007.
The experimental results showed that the improved algorithm using MPDIoU as the loss function had better convergence speed and convergence effect than the original YOLOv7-tiny algorithm, proving the feasibility of the improved strategy.
3. Results
3.1. Comparison of Detection Performance of Different Models
The improved YOLOv7-TMRTM model was trained and tested with YOLOv7-tiny, Faster RCNN, SSD, YOLOv4, YOLOv5s, YOLOv8s, YOLOv9t, and YOLOv10n mainstream target detection models, respectively, on the same in-field rice leaf disease dataset. Model performance was evaluated based on model recall, mAP 0.5, mAP 0.5–0.95, number of parameters, model weight size, and FPS. The comparison results are summarized in Table 6.
Table 6.
Test results of the YOLOv7-TMRTM mode.
The YOLOv7-TMRTM showed significant advantages in the task of object detection. In terms of average accuracy, its mAP@0.5 reached as high as 97.9%, ranking first among all the compared models and far surpassing other models. For example, it was 2.6 percentage points higher than YOLOv7-tiny. Its mAP@0.5–0.95 was 70.2%, also ranking among the top among all models. Regarding the model size, the YOLOv7-TMRTM was only 16.1 MB. In comparison, this value was much smaller than that of models such as SSD (59.3 MB) and Faster-RCNN (38.1 MB), indicating excellent performance in model size. Although its number of parameters was 8.5 M, which was at a medium level, this did not affect its outstanding performance in accuracy. In addition, its number of frames per second (FPS) was 53, which could ensure detection efficiency while maintaining a relatively good running speed. It was close to the 54 FPS of YOLOv7-tiny, achieving a good balance in comprehensive performance.
3.2. Analysis of the Effectiveness of the Model in Detecting Different Diseases Before and After Improvement
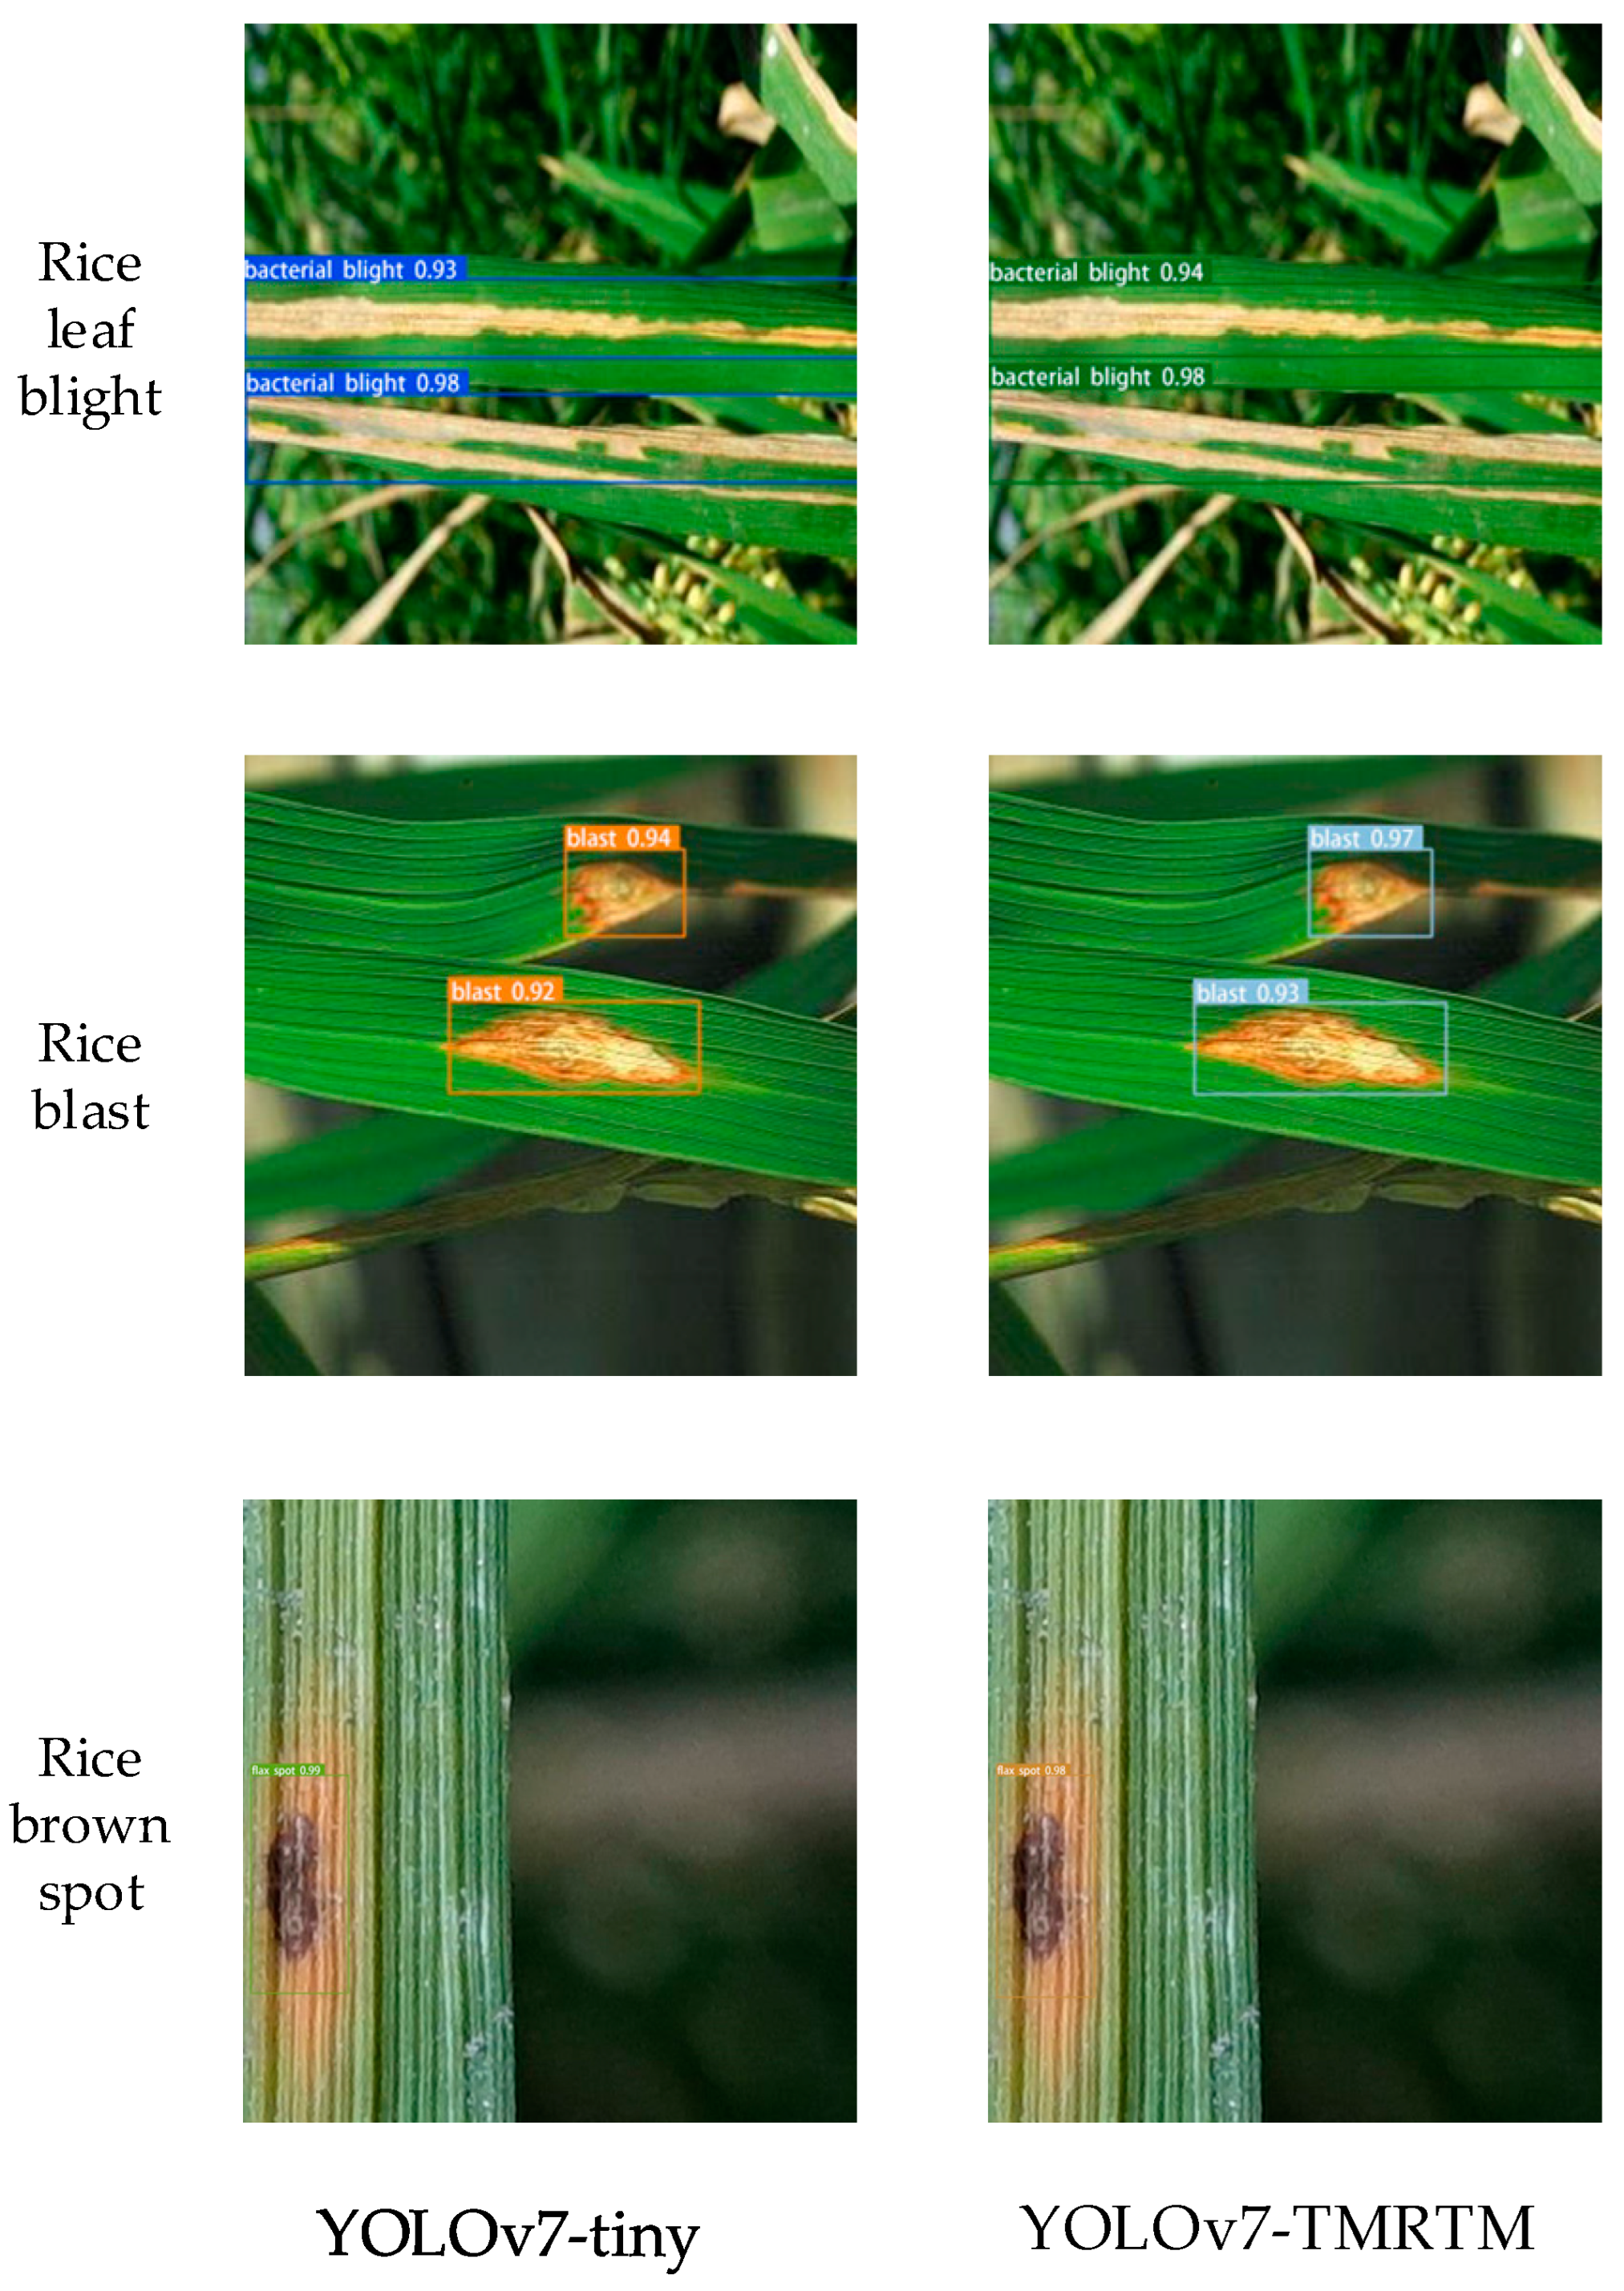
To comprehensively evaluate the detection performance of the YOLOv7-TMRTM detection model for different diseases, three diseases were detected using the YOLOv7-tiny detection model and the YOLOv7-TMRTM detection model, respectively, in this section. The detection results are shown in Table 7 and Table 8.
Table 7.
Test Results of the YOLOv7-tiny model.
Table 8.
Test results of the YOLOv7-TMRTM model.
By comparing the data in Table 7 and Table 8, it can be found that the detection results of the YOLOv7-TMRTM model for different rice diseases were all improved to different degrees compared to the original YOLOv7-tiny model. The precision of rice blast was improved by 1.8%, the mAP0.5 by 2.5%, and the recall by 4.8%. The precision of rice hoary mottle disease was improved by 2% and the mAP0.5 by 3.2% over the original model; because the recall under the training of the original model was already as high as 97.3%, it was improved by only 0.1% under training. The precision of rice leaf blight was improved by 3.3%, its mAP0.5 by 2.3%, and recall by 2.5%. Thus, the improved model could also identify different rice diseases quickly and accurately, proving that the improvement to the original model in this paper was very effective.
In summary, after the in-depth improvement to the YOLOv7-tiny model, the detection effect of the model on the three rice diseases was successfully improved. Compared with the original model, the improved model achieved significant improvement in both detection accuracy and recognition rate, which fully demonstrated the effectiveness of the model improvement.
3.3. Analysis of the Effectiveness of theYOLOv7-TMRTM Model in Detecting Spots of Different Sizes
To fully verify the performance of the improved model, in this section, we tested different sizes of leaf lesions. By testing different sizes of lesions, the performance of the models could be more accurately assessed in various situations, thus ensuring that they could operate stably and reliably in practical applications. In this section, the YOLOv7-tiny detection model and theYOLOv7-TMRTM detection model were used to test the dataset of different sizes of lesions delineated in Section 2.2.2, respectively, and the results of the tests are shown in Table 9 and Table 10.
Table 9.
YOLOv7-tiny detection results for diseases of different sizes.
Table 10.
YOLOv7-TMRTM detection results for diseases of different sizes.
From Table 9 and Table 10, there were significant differences in the detection results of diseases with different target sizes between YOLOv7-TMRM and YOLOv7-tiny. In terms of large-target detection, the mAP0.5 of YOLOv7-tiny was 96.5%, the recall was 94.2%, and the precision was 95.1%, while the corresponding indicators of YOLOv7-TMRM were 98.9%, 95.9%, and 97.5%. The mAP0.5 of YOLOv7-TMRM in large-target detection was 2.4% higher than that of YOLOv7-tiny, the recall was 1.7% higher, and the precision was 2.4% higher.
For medium-target detection, the mAP0.5 of YOLOv7-tiny is 90.6%, the Recall is 89.6%, and the Precision is 88.5%. The mAP0.5 of YOLOv7-TMRM reached 96.4%, the recall was 92.1%, and the precision was 93.4%. The mAP0.5 of YOLOv7-TMRM in medium-target detection was 5.8% higher than that of YOLOv7-tiny, the recall was 2.5% higher, and the precision was 4.9% higher.
In small-target detection, the mAP0.5 of YOLOv7-tiny was 85.7%, the recall was 83.7%, and the precision was 80.8%. The mAP0.5 of YOLOv7-TMRM was 90.1%, the recall was 88.4%, and the precision was 89.6%. The mAP0.5 of YOLOv7-TMRM in small-target detection was 4.4% higher than that of YOLOv7-tiny, the recall was 4.7% higher, and the precision was 8.8% higher.
Overall, in the detection of all target sizes, the indicators of the YOLOv7-TMRM model were better than those of the YOLOv7-tiny model. Especially in small-target detection, the improvement in YOLOv7-TMRM compared to YOLOv7-tiny was the most prominent. The significant increase in the precision indicator indicated that this model could more accurately distinguish between diseased and non-diseased targets in small-target detection. In medium-target detection, the significant increase in the mAP0.5 of YOLOv7-TMRM reflected its better ability to identify the characteristics of medium-target diseases. Although there was also a certain improvement in the detection of large targets by YOLOv7-TMRM, it was relatively small, which may be because large targets are easier to detect.
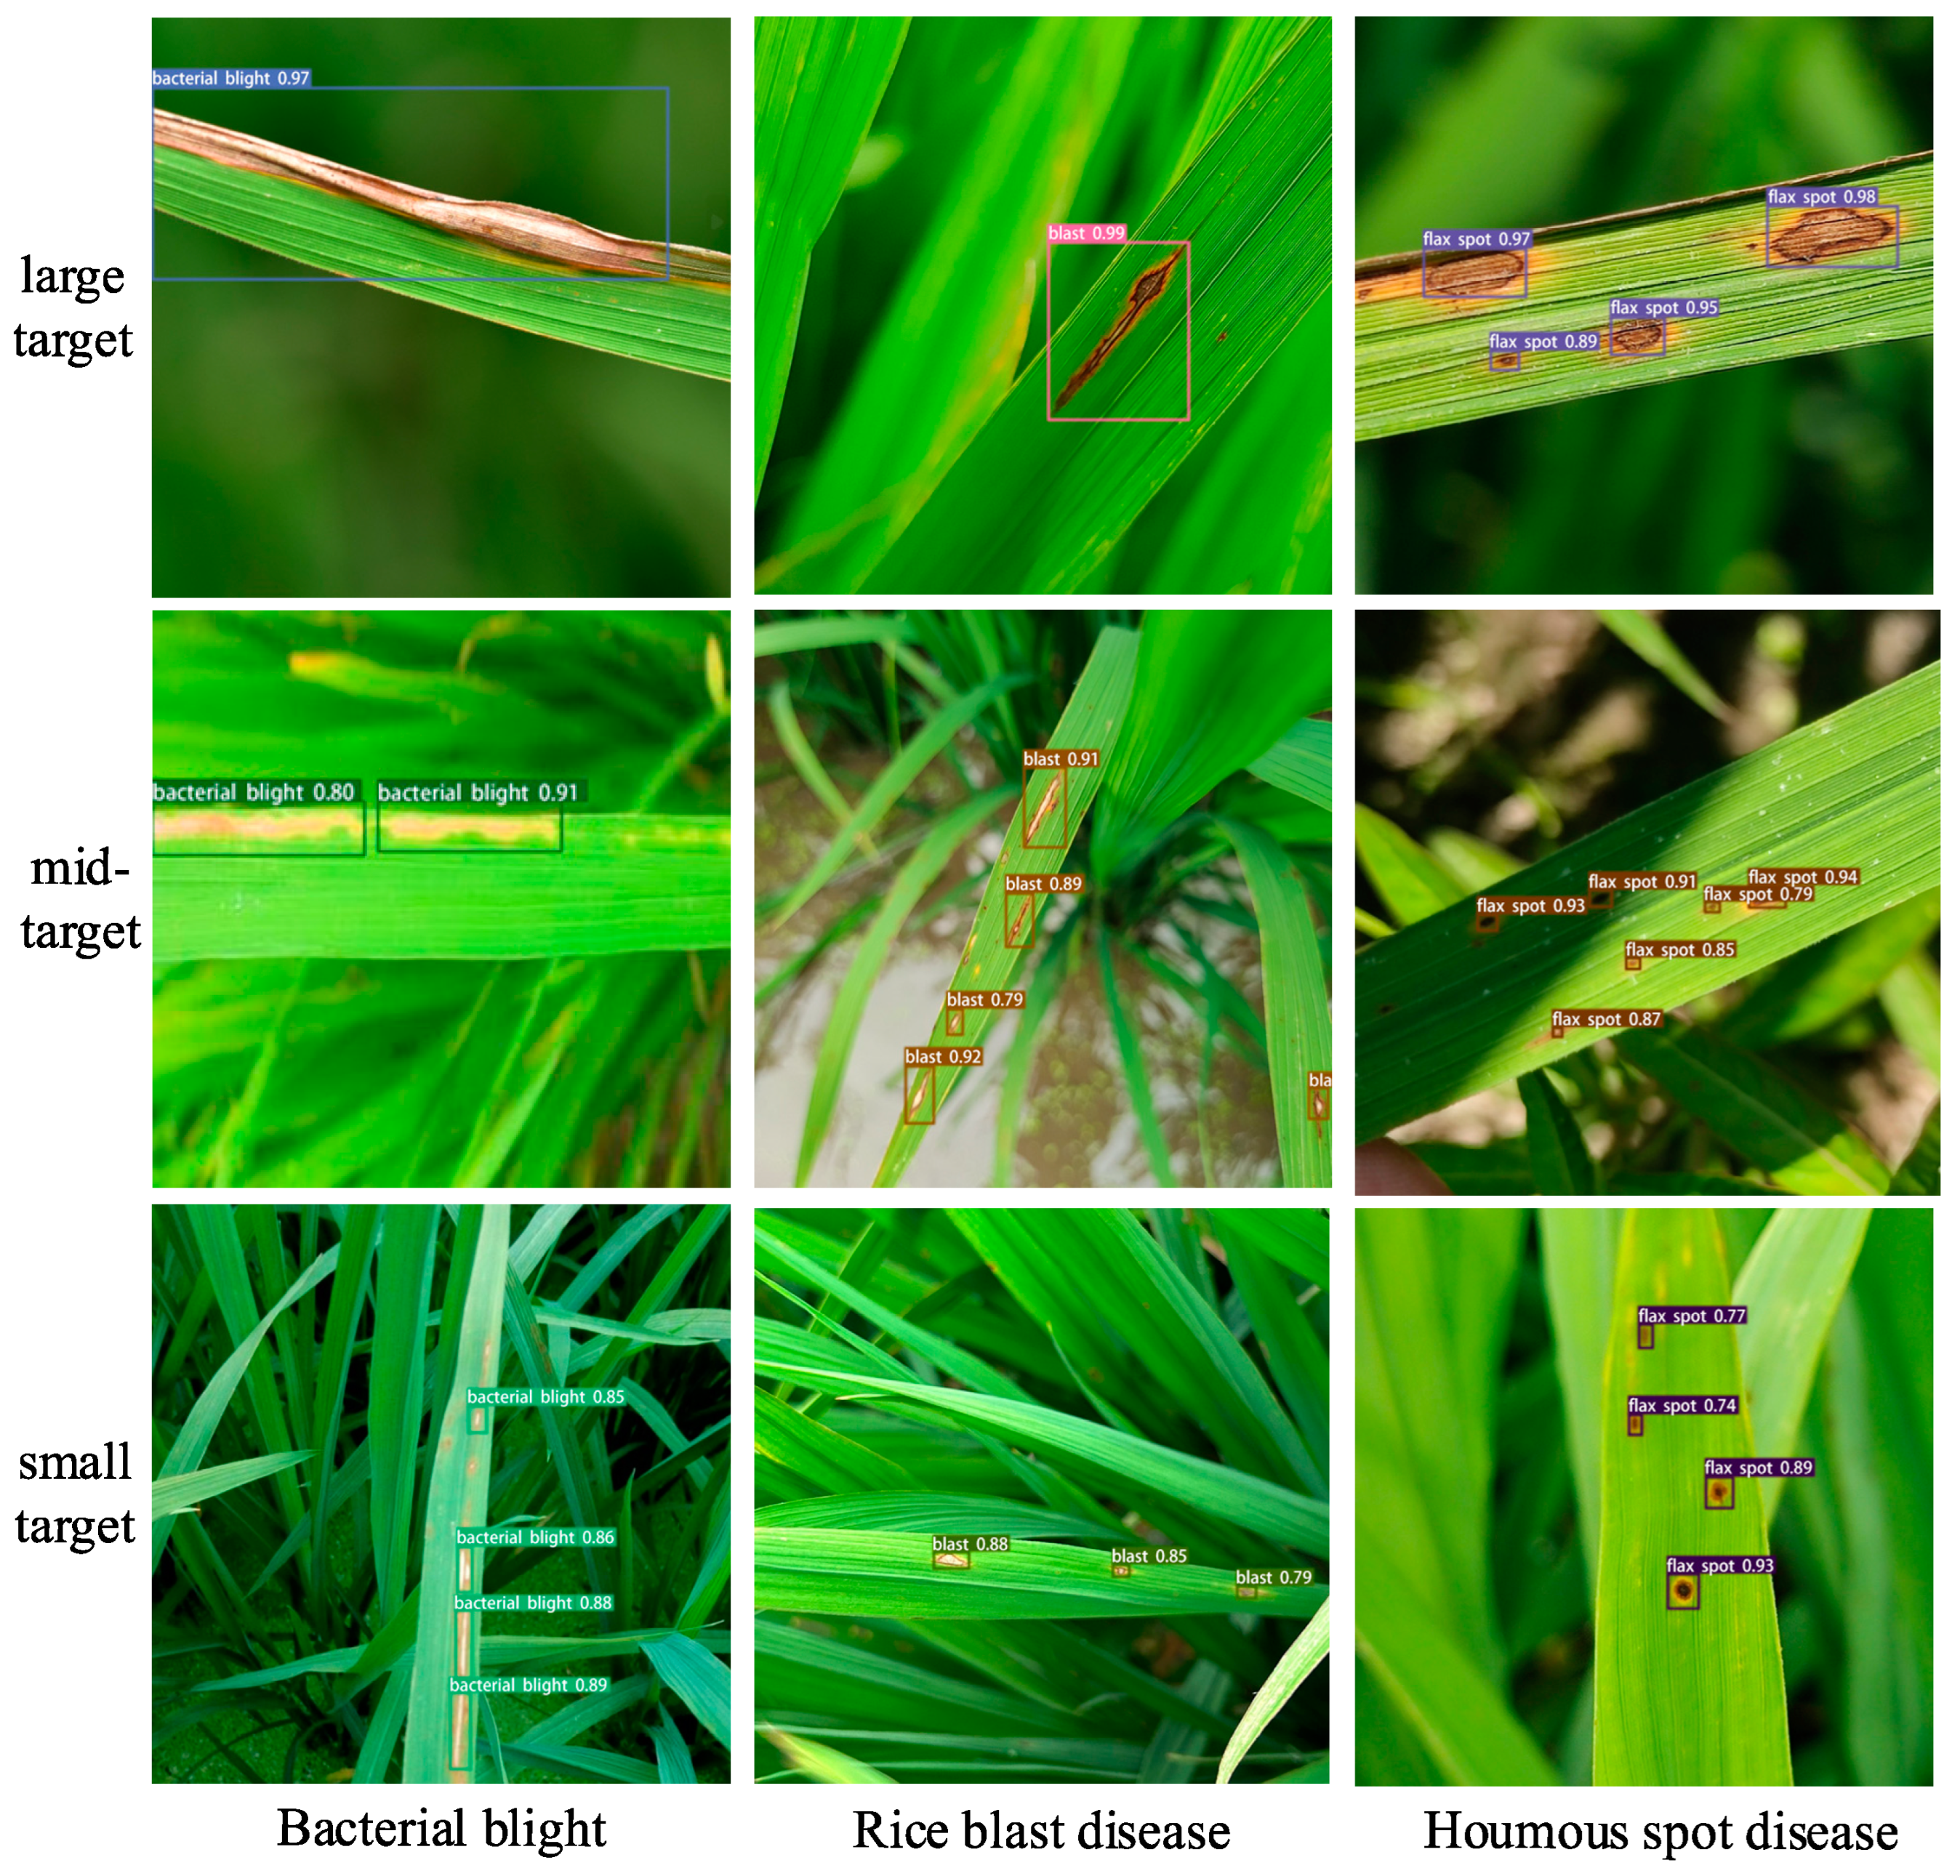
A further analysis showed that the improvement strategies adopted by YOLOv7-TMRM, such as the RCS-OSA feature extraction network and the TSCODE detection head optimization of the original model, were effective. These improvements made YOLOv7-TMRM more accurate in detecting diseases of large, medium, and small targets in actual rice disease detection scenarios, thus having higher application value and being better able to meet the requirements of rice disease detection tasks. Specific tests are shown in Figure 16.
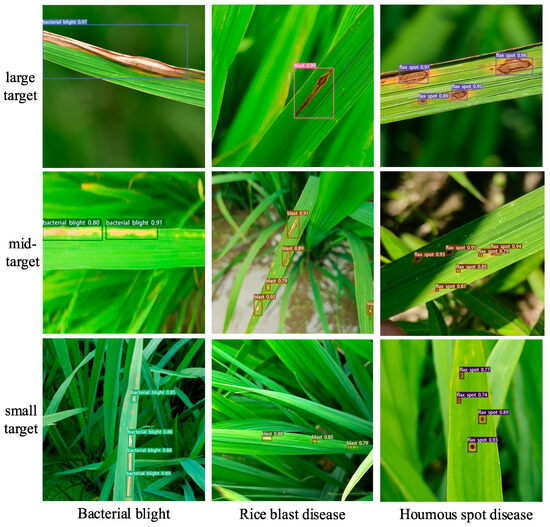
Figure 16.
Target detection results of different sizes.
From the detection results, it was clear that the YOLOv7-TMRTM model worked well for detecting lesions in small targets.
3.4. Feature Visualization Network
In order to better demonstrate the effect of the model in this study in practical applications, Figure 17 shows an example of the Grad-GAM [42] class activation mapping visualization for small target images of rice leaf diseases. To respond more directly to the importance of the target object, the last layer of the convolutional module of the network was chosen as the target detection layer for calculation. This choice was based on the hierarchical nature of convolutional neural networks in processing images, and the last layer of the convolutional modules often contains the richest and most abstract feature information; this can more directly reflect the model’s attention to the target object. The experimental results showed that compared with the original baseline model, the location and color of small target diseases in rice leaf diseases were more consistent in the visualization results obtained by this research method, which better highlighted the key locations where the diseases were located, indicating that the improved network could better focus on the feature points of small target diseases in rice leaf diseases. Therefore, Grad-GAM technology showed excellent performance in the target detection of rice leaf diseases, providing a new idea and tool for the intelligent diagnosis of agricultural diseases.
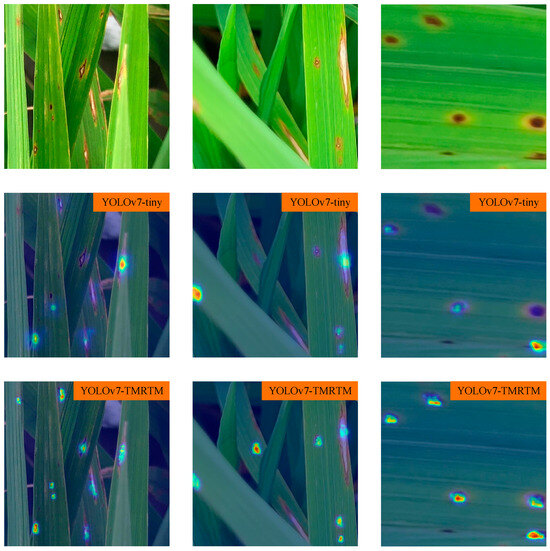
Figure 17.
Feature visualization heat.
4. Discussion
- Compared with the traditional backbone networks used in some previous studies, such as the VGG series networks [43], MobileNetV3 has obvious advantages in processing rice leaf disease images. The VGG series networks have a deeper structure and many parameters, which are prone to overfitting phenomena and consume a lot of computational resources when dealing with complex field environment images. The lightweight design of MobileNetV3 enables it to greatly reduce the number of model parameters and improve the operation efficiency of the model while ensuring a good feature extraction effect. In similar crop disease detection studies, the model using VGG16 as the backbone network has relatively low accuracy and long model training time when dealing with small target disease features. In contrast, the MobileNetV3 in this study can better adapt to the feature extraction of different-sized targets in rice leaf disease images, especially for extracting early small spot disease features. Meanwhile, the improvement in the activation function in this study is also different from that of some previous studies. Some studies may only use a single activation function, such as ReLU, while the H-Swish activation function adopted in this study combines the advantages of multiple activation functions and performs better in solving the problems of vanishing gradient and information loss, which further improves the feature extraction ability of the model.
- Compared with traditional feature fusion methods, such as simple feature splicing or some earlier fusion methods based on a single convolutional structure, the RCS-OSA module has a more powerful feature fusion capability. In some previous studies, when dealing with crop disease images, different levels of feature maps were simply spliced together, ignoring the correlation and complementarity between the features, which resulted in poor results in detecting complex disease features and capturing the edge features of the diseased spots in an inaccurate way, which could not effectively differentiate between different types of diseases. The RCS-OSA module, however, through its unique structural design, fully considers the rearrangement of channel information and the advantages of different branching structures and can better integrate multiple-feature information such as texture and color, thus improving the recognition ability of rice spot edge features. Meanwhile, compared with some other feature fusion modules based on complex network structures, the RCS-OSA module ensures the fusion effect without significantly increasing the computational complexity and the number of parameters of the model due to its lightweight design concept, which is more suitable for application in actual agricultural disease detection scenarios, which is consistent with the trend of simplifying the structure of the model under the premise of guaranteeing the performance as emphasized in some current studies.
- The TSCODE model has obvious advantages over traditional target detection head designs. In the past, some detection head designs often did not fully consider the different requirements of classification and localization tasks, resulting in limited performance when dealing with small targets. Some traditional convolutional neural network-based detection heads are unable to accurately identify the boundaries and categories of the spots when detecting small spots of rice leaf diseases due to the lack of targeted optimization for the classification and localization tasks, resulting in low detection accuracy. The TSCODE model can be better adapted to the detection of small spots of rice leaf disease by introducing the SCE and DPE modules, which are optimized for classification and localization, respectively. The TSCODE model ensures the effectiveness of detecting small spots without introducing excessive computational complexity or increasing the number of parameters, which is more in line with the design concept of a lightweight model and can be efficiently operated in the detection of agricultural diseases in practice.
- In terms of loss function selection, the MPDIoU in this study has unique advantages over some of the previously commonly used loss functions. The traditional mean square error (MSE) loss function is ineffective for the regression of bounding boxes in the target detection task, especially when dealing with small targets, and fails to accurately reflect the difference between the predicted and real boxes. CIoU, on the other hand, although it takes into account the geometrical relationship of the target box to some extent, is computationally complex and in some cases provides a limited improvement in model performance. MPDIoU can optimize model performance in small target detection more effectively by simplifying the computational process and taking into account key geometrical factors. MPDIoU has a simpler form of computation and wider applicability while guaranteeing the effectiveness of small-target detection, which can better adapt to the needs of model training in different scenarios in rice leaf disease detection.
5. Conclusions
In this paper, a YOLOv7-TMRTM model was proposed to focus on three major diseases, namely, rice blast, rice leaf blight, and rice leaf blight, combining deep learning target detection techniques with model compression techniques to ensure the model’s accuracy in detecting targets of multiple sizes while also focusing on controlling the detection speed as well as the number of model parameters. In this study, while there were some positive results, there were also some disadvantages. Although the accuracy of the model for small target detection was improved, there is still room for improvement in the model speed and the number of parameters.
However, the model had significant advantages. The model introduced the MobileNetV3 lightweight network to replace the backbone network of YOLOv7-tiny, which reduced the volume of the model parameters, improved the extraction capability of different size features and different kinds of diseases, and was able to better solve the problem of difficult model extraction due to different morphological sizes, improved the feature fusion capability on the detection of various diseases, and reduced the leakage and misdetection. Replacing the original ELAN-1 module with RCS-OSA improved the model’s interlayer feature extraction ability; meanwhile, using TSCODE to improve the model’s detection head enhanced the model’s ability to detect small targets; finally, the MPDIoU loss function was used to improve the model’s convergence speed and effect.
The experimental results showed that the average accuracy of YOLOv7-TMRTM was 97.9%, the number of parameters was 8.5 M, and the model size was 16.1 MB. Compared with the baseline YOLOv7-tiny model, it improved the accuracy of detecting leaf spots of different sizes and species while ensuring that the model parameters satisfied agricultural needs, and in terms of the detection results of small targets, the mAP0.5 of the YOLOv7-TMRTM model was 0.5 higher than that of the YOLOv7-tiny, with a 4.7% higher recall and 8.8% higher accuracy, which greatly solved the problem of small spots and fuzzy edges of rice diseases captured in the field environment.
This paper is currently limited to rice disease detection at the leaf level. In the future, the experiment will be extended to the canopy scale, and it is expected to be able to rapidly collect real-time image and video data from the rice field using intelligent monitoring devices in the field and quickly upload them to the server to achieve real-time monitoring and accurate diagnosis of the disease condition in the rice field, and ultimately to achieve the goal of highly efficient, accurate, and intelligent monitoring and management.
Author Contributions
F.G.: methodology, software, validation, formal analysis, visualization, investigation, data curation, resources, writing—original draft, writing—review and editing. J.L.: data curation, validation. X.L.: data curation, validation. S.C.: visualization, data curation. H.Z.: investigation, data curation. Y.C.: methodology, validation, investigation, funding acquisition, project administration, supervision. S.W.: data curation, resources, validation, software. All authors have read and agreed to the published version of the manuscript.
Funding
This study was supported by the National Rice Industry Technology System (CARS-01).
Data Availability Statement
The original contributions presented in the study are included in the article, further inquiries can be directed to the corresponding authors.
Conflicts of Interest
The authors declare that they have no known competing financial interests or personal relationships that could have appeared to influence the work reported in this paper.
References
- Chen, B.; Ao, H.; Zeng, X. Analysis of the changes in sown area and yield of rice in China from 2009 to 2018. J. Hunan Agric. Univ. 2021, 47, 495–500. [Google Scholar] [CrossRef]
- García, S.; Heredia, N. Mycotoxins in Mexico: Epidemiology, management, and control strategies. Mycopathologia 2006, 162, 255–264. [Google Scholar] [CrossRef]
- Liu, B.; Zhang, Y.; He, D.; Li, Y. Identification of Apple Leaf Diseases Based on Deep Convolutional Neural Networks. Symmetry 2018, 10, 11. [Google Scholar] [CrossRef]
- Vithu, P.; Moses, J.A. Machine vision system for food grain quality evaluation: A review. Trends Food Sci. Technol. 2016, 56, 13–20. [Google Scholar] [CrossRef]
- Dutot, M.; Nelson, L.M.; Tyson, R.C. Predicting the spread of postharvest disease in stored fruit, with application to apples. Postharvest Technol. 2013, 85, 45–56. [Google Scholar] [CrossRef]
- Sujatha, R.; Chatterjee, J.M.; Jhanjhi, N.Z.; Brohi, S.N. Performance of deep learning vs. machine learning in plant leaf disease detection. Microprocess. Microsyst. 2021, 80, 103615. [Google Scholar] [CrossRef]
- Zhonghua, Y.E.; Mingxia, Z.H.O.; Lu, J.I. Research on image recognition of complex background crop diseases. Trans. Chin. Soc. Agric. Mach. 2021, 52, 118–124. [Google Scholar] [CrossRef]
- Guo, X.-Y.; Yu, S.-Q.; Shen, H.-C.; Li, L.; Du, J.-J. A crop disease identification model based on global feature extraction. Trans. Chin. Soc. Agric. Mach. 2022, 53, 301–307. [Google Scholar]
- Sun, J.; Zhu, W.; Luo, Y. Identification of field crop leaf diseases based on improved MobileNet-V2. Trans. Chin. Soc. Agric. Eng. (Trans. CSAE) 2021, 37, 161–169. [Google Scholar]
- Du, T.; Nan, X.; Huang, J.; Zhang, W.; Ma, Z. Improving RegNet to identify the damage degree of various crop diseases. Trans. Chin. Soc. Agric. Eng. (Trans. CSAE) 2022, 38, 150–158. [Google Scholar]
- Sun, F.; Wang, Y.; Lan, P.; Zhang, X.; Chen, X.; Wang, Z. Identification method of apple fruit diseases based on improved YOLOv5s and transfer learning. Trans. Chin. Soc. Agric. Eng. (Trans. CSAE) 2022, 38, 171–179. [Google Scholar]
- Cao, Y.; Zhang, H.; Guo, F.; Feng, S.; Yang, L.; Wei, S. Research progress of uav remote sensing in crop disease monitoring. J. Shenyang Agric. Univ. 2024, 55, 616–628. [Google Scholar] [CrossRef]
- Ahmad, I.; Hamid, M.; Yousaf, S.; Shah, S.T.; Ahmad, M.O. Optimizing pre-trained convolutional neural networks for tomato leaf disease detection. Complexity 2020, 2020, 8812019. [Google Scholar] [CrossRef]
- Ramesh, S.; Vydeki, D. Recognition and classification of paddy leaf diseases using optimized deep neural network with Jaya algorithm. Inf. Process. Agric. 2020, 7, 249–260. [Google Scholar] [CrossRef]
- Wan, Y.; Yang, H.; Wang, Y.; Luo, J.; Mei, M. Recognition of Rice Disease Based on Image Segmentation and Convolution Neural Network. Acta Agric. Boreali-Occident. Sin. 2022, 31, 246–256. [Google Scholar] [CrossRef]
- Tarek, H.; Aly, H.; Eisa, S.; Abul-Soud, M. Optimized Deep Learning Algorithms for Tomato Leaf Disease Detection with Hardware Deployment. Electronics 2022, 11, 140. [Google Scholar] [CrossRef]
- Cai, J.; Pan, R.; Lin, J.; Liu, J.; Zhang, L.; Wen, X.; Chen, X.; Zhang, X. Improved EfficientNet for corn disease identification. Front. Plant Sci. 2023, 14, 1224385. [Google Scholar] [CrossRef] [PubMed]
- Sun, J.; Zhu, W.; Luo, Y.; Jifeng, S.; Yide, C.; Xin, Z. Recognizing the diseases of crop leaves in fields using improved Mobilenet-V2. Trans. Chin. Soc. Agric. Eng. (Trans. CSAE) 2021, 37, 161–169. [Google Scholar] [CrossRef]
- Zhou, Q.; Ma, L.; Cao, L.; Yu, H. Identification of Tomato Leaf Diseases Based on Improved Lightweight Convolutional Neural Networks MobileNetV3. Smart Agric. 2022, 4, 47–56. [Google Scholar] [CrossRef]
- Wang, R.; Chen, F.; Zhu, X.; Zhang, X. Identifying apple leaf diseases using improved EfficientNet. Trans. Chin. Soc. Agric. Eng. (Trans. CSAE) 2023, 39, 201–210. [Google Scholar] [CrossRef]
- Kumar, V.S.; Jaganathan, M.; Viswanathan, A.; Umamaheswari, M.; Vignesh, J. Rice leaf disease detection based on bidirectional feature attention pyramid network with YOLOv5 model. Environ. Res. Commun. 2023, 5, 065014. [Google Scholar] [CrossRef]
- Wen, B.; Cao, R.; Yang, Q.; Zhang, J.; Zhu, H.; Li, Z. Detecting leaf disease for Panax notoginseng using an improved YOLOv3 algorithm. Trans. Chin. Soc. Agric. Eng. (Trans. CSAE) 2022, 38, 164–172. [Google Scholar] [CrossRef]
- Wang, J.; Zhou, J.; Zhang, Y.; Hu, H. Multi-pose dragon fruit detection system for picking robots based on the optimal YOLOv7 model. Trans. Chin. Soc. Agric. Eng. (Trans. CSAE) 2023, 39, 276–283. [Google Scholar] [CrossRef]
- Zhao, P.; Qian, M.; Zhou, K.; Shan, Y.; Wu, H. Improvement of Sweet Pepper Fruit Detection in YOLOv7-Tiny Farming Environment. Comput. Eng. Appl. 2023, 59, 329–340. [Google Scholar] [CrossRef]
- Wang, X.; Xu, Y.; Zhou, J.; Chen, J. Safflower picking recognition in complex environments based on an improved YOLOv7. Trans. Chin. Soc. Agric. Eng. (Trans. CSAE) 2023, 39, 169–176. [Google Scholar] [CrossRef]
- Zheng, G.; Jiang, Y.; Shen, Y. Recognition of rice pests based on improved YOLOv7. J. Huazhong Agric. Univ. 2023, 42, 143–151. [Google Scholar] [CrossRef]
- Tao, Z.; Shi, X.; Wang, Y.; Wu, Y.; Wu, H. Tomato Leaf Diseases Detection Method Based on Improved YOLOv5s. J. Shenyang Agric. Univ. 2023, 54, 712–721. [Google Scholar] [CrossRef]
- Zhu, R.; Hao, F.; Ma, D. Research on Polygon Pest-Infected Leaf Region Detection Based on YOLOv8. Agriculture 2023, 13, 2253. [Google Scholar] [CrossRef]
- Yang, Z.; Feng, H.; Ruan, Y.; Weng, X. Tea Tree Pest Detection Algorithm Based on Improved Yolov7-Tiny. Agriculture 2023, 13, 1031. [Google Scholar] [CrossRef]
- Zhang, J.; Yang, W.; Lu, Z.; Chen, D. HR-YOLOv8: A Crop Growth Status Object Detection Method Based on YOLOv8. Electronics 2024, 13, 1620. [Google Scholar] [CrossRef]
- Ye, R.; Ma, Z.; Gao, Q.; Li, T.; Shao, G.; Wang, B. Target detection of tea disease based on improved YOLOv5s-ECA-ASFF algorithm. J. Chin. Agric. Mech. 2024, 45, 244–251. [Google Scholar] [CrossRef]
- Liu, W.; Anguelov, D.; Erhan, D.; Szegedy, C.; Reed, S.; Fu, C.Y.; Berg, A.C. SSD: Single Shot Multibox Detector. In Proceedings of the Computer Vision ECCV European Conference, Amsterdam, The Netherlands, 11–14 October 2016; Springer: Berlin/Heidelberg, Germany, 2016; pp. 21–37. [Google Scholar]
- Bochkovskiy, A.; Wang, C.Y.; Liao, H.Y.M. Yolov4: Optimal speed and accuracy of object detection. In Proceedings of the IEEE Conference on Computer Vision and Pattern Recognition (CVPR), Taipei, Taiwan, 14–19 June 2020; pp. 1–17. [Google Scholar] [CrossRef]
- Bochkovskiy, A.; Wang, C.Y.; Liao, H.Y.M. YOLOv7: Trainable bag-of-freebies sets new state-of-the-art for real-time object detectors. In Proceedings of the IEEE Conference on Computer Vision and Pattern Recognition (CVPR), Seattle, WA, USA, 10–17 June 2023; pp. 7464–7475. [Google Scholar]
- Wang, Q.; Zhang, Z.; Chen, Q.; Zhang, J.; Kang, S. Lightweight Transmission Line Fault Detection Method Based on Leaner YOLOv7-Tiny. Sensors 2024, 24, 565. [Google Scholar] [CrossRef] [PubMed]
- Sandler, M.; Howard, A.; Zhu, M.; Zhmoginov, A.; Chen, L.C. MobileNetV2: Inverted residuals and linear bottlenecks. In Proceedings of the 2018 IEEE Conference on Computer Vision and Pattern Recognition (CVPR), Salt Lake City, UT, USA, 18–23 June 2018; pp. 4510–4520. [Google Scholar]
- Howard, A.; Sandler, M.; Chu, G.; Chen, L.C.; Chen, B.; Tan, M.; Wang, W.; Zhu, Y.; Pang, R.; Vasudevan, V.; et al. Searching for MobileNetv3. In Proceedings of the 2019 IEEE Conference on Computer Vision and Pattern Recognition (CVPR), Seoul, Republic of Korea, 27 October–2 November 2019; pp. 1314–1324. [Google Scholar]
- Cui, J.; Wei, W.; Zhao, M. Rice Disease Identification Model Based on Improved MobileNetV3. Trans. Chin. Soc. Agric. Mach. 2023, 54, 217–224. [Google Scholar] [CrossRef]
- Hang, M.; Ting, C.M.; Ting, F.F.; Phan, R.C.W. RCS-YOLO: A Fast and High-accuracy Object Detector for Brain Tumor Detection. In Proceedings of the International Conference on Medical Image Computing and Computer-Assisted Intervention, Vancouver, BC, Canada, 8–12 October 2023; Springer Nature: Cham, Switzerland, 2013; pp. 600–610. [Google Scholar] [CrossRef]
- Zhuang, J.; Qin, Z.; Yu, H.; Chen, X. Task-specific context decoupling for object detection. Computer vision and pattern recognition. arXiv 2023, arXiv:2303.01047. [Google Scholar] [CrossRef]
- Siliang, M.; Yong, X. MPDIoU: A Loss for Efficient and Accurate Bounding Box Regression. Procedia Computer Science. arXiv 2023, arXiv:2307.07662. [Google Scholar] [CrossRef]
- Selvaraju, R.R.; Cogswell, M.; Das, A.; Vedantam, R.; Parikh, D.; Batra, D. Grad-CAM: Visual Explanations from Deep Networks via Gradient-Based Localization. Int. J. Comput. Vis. 2020, 128, 336–359. [Google Scholar] [CrossRef]
- Campos-Leal, J.A.; Yee-Rendón, A.; Vega-López, I.F. Simplifying VGG-16 for Plant Species Identification. IEEE Lat. Am. Trans. 2022, 20, 2330–2338. [Google Scholar] [CrossRef]


Disclaimer/Publisher’s Note: The statements, opinions and data contained in all publications are solely those of the individual author(s) and contributor(s) and not of MDPI and/or the editor(s). MDPI and/or the editor(s) disclaim responsibility for any injury to people or property resulting from any ideas, methods, instructions or products referred to in the content. |
© 2024 by the authors. Licensee MDPI, Basel, Switzerland. This article is an open access article distributed under the terms and conditions of the Creative Commons Attribution (CC BY) license (https://creativecommons.org/licenses/by/4.0/).