Article

Integrative Analysis of Metabolome and Transcriptome Profiles to Evaluate the Response Mechanisms of Carex adrienii to Shade Conditions

1
Chongqing Key Laboratory of Germplasm Innovation and Utilization of Native Plants, Chongqing Landscape and Gardening Research Institute, Chongqing 401329, China
2
College of Horticulture and Landscape Architecture, Southwest University, Chongqing 400715, China
3
Chongqing Engineering Research Center for Floriculture, Key Laboratory of Agricultural Biosafety and Green Production of Upper Yangtze River (Ministry of Education), Southwest University, Chongqing 400715, China
4
Nanshan Botanical Garden Management Office, Chongqing 400065, China
*
Author to whom correspondence should be addressed.
Agronomy 2024, 14(12), 2800; https://doi.org/10.3390/agronomy14122800
Submission received: 15 October 2024 / Revised: 4 November 2024 / Accepted: 21 November 2024 / Published: 25 November 2024
(This article belongs to the Section Horticultural and Floricultural Crops)

Abstract

:
Carex is a type of herbaceous plant with high application value, playing an important role in the urban periphery. Due to its unique morphology and ecological characteristics, Carex is widely used in various fields, such as landscaping, ecological restoration and soil and water conservation, which help to maintain the balance of the ecosystem. In order to explore the potential molecular mechanisms of shade tolerance in Carex, transcriptome and metabolome sequencing were performed on the leaves of the shade = tolerant species Carex adrienii E. G. Camus. under 80% shade and no shade conditions. Compared to control group (CK), the total chlorophyll, chlorophyll a, chlorophyll b and total carotenoid content in the C. adrienii leaves of the shading treatment were significantly upregulated. The antioxidant enzyme activity of the leaves, including superoxide dismutase (SOD), peroxidase (POD), and catalase (CAT), were also remarkably upregulated in the shading treatment groups. In addition, the net photosynthesis rate (Pn), stomatal conductance (Gs) and transpiration rate (Tr) of the leaves were reduced, and the intercellular CO2 concentration (Ci) of the leaves was increased under shade. The transcriptome identified 5056 differentially expressed genes (DEGs) and the metabolome identified 889 differential accumulated metabolites (DAMs) in three treated samples. The integrated transcriptomic and metabolomic analyses results showed that the DEGs and DAMs were enriched in photosynthesis, plant hormone signal transduction and flavonoid biosynthesis synthesis pathways. The ABA content of the C. adrienii leaves was significantly increased under shade. Therefore, the shading conditions led to changes in chlorophyll and abscisic acid (ABA), as well as the accumulation of flavonoids in C. adrienii, both of which were achieved by regulating genes involved in photosynthesis, plant hormone signal transduction and flavonoid biosynthesis molecular networks. Our results provide new knowledge for the molecular response and metabolic regulatory mechanisms of C. adrienii to shade stress, and valuable genetic resources for C. adrienii shade tolerance molecular breeding.

1. Introduction

Environmental capacity is one of the basic criteria for determining the positioning and scale of a city, and it is closely related to the green space coverage rate of the city [1]. Improving the green space coverage rate can enhance the environment’s ability to purify and accommodate pollutants. Long-term low-light conditions can have a negative impact on green space. Some ground cover plants located in the lower levels of urban green areas are in a shaded environment. The plants in these areas receive severe low light, leading to a decrease in green space coverage. Light not only affects the growth and morphological characteristics of plants, but also affects their physiological metabolism, ultimately affecting the quality and ecological benefits of ground cover plants. Therefore, the screening and application of shade-tolerant ground cover plants can satisfy the practical needs of landscaping, and also can improve the ecological benefits of green space greening per unit area [2].
Shade tolerance is generally considered as one of the effective strategies for plants to respond to shading [3]. Plants with good shade tolerance exhibit an increase in specific leaf area (SLA), and a decrease in chlorophyll a/b ratio. Shade-tolerant plants can increase the acquisition of carbon sources, through an increase in the ratio of photosynthetic system II to photosynthetic system I [4]. When the ratio of red light to far red light (R/FR) in the environment decreases, shade-tolerant plants will inhibit their shade avoidance response, through the synthesis and response of different plant hormones. The inhibition also triggers some antagonistic regulatory factors of shade avoidance response [5]. Shading conditions not only affect the photosynthetic efficiency of plants, but also lead to leaf senescence. Severe shading can trigger leaf senescence, whereas plants in mild shading conditions will adapt by adjusting photosynthesis and optimizing carbon source allocation [6]. Shading can have a significant impact on the content of metabolites in plants. Shading on sweet cherry leaves or fruits significantly reduces the content of sugar and vitamin C in the fruit, affecting the quality of sweet cherry fruits [7]. After dark shading, the content of alkaloids, catechins and catechin dimers in tea significantly increased, while the content of amino acids significantly decreased and the phenol ammonia ratio significantly increased [8].
Carex belongs to Cyperaceae, is a type of herbaceous plant with high application value, playing an important role in the urban periphery. Due to its unique morphology and ecological characteristics, Carex is widely used in various fields, such as landscaping, ecological restoration and soil and water conservation. It plays an important role in maintaining the balance of the ecosystem. Previous studies have shown that some germplasm resources of Carex have good shade tolerance characteristics [9]. There are differences in the demand for light among different types of Carex. Some species can grow normally under shaded conditions, while others prefer a fully lit environment. The light intensity affects the growth rate and plant height of Carex, but there are also differences in the response of different types of Carex to light intensity. These studies provide a theoretical basis for the application of Carex in environments with low light.
Although many studies on the shade tolerance of Carex have been conducted, they mostly focused on changes in agronomic traits and physiological indicators after shading conditions, lacking research on the overall metabolic pathway changes. The excellent characteristics of shade-tolerant Carex species, and how environmental factors affect its physiological and bio-chemical processes, needed to be further explored. In our previous research, shade tolerance evaluation on the collected Carex germplasm resources was conducted, and Carex adrienii E. G. Camus. was found to have stronger shade tolerance. In order to demonstrate the better adaptability of C. adrienii to shaded environments from the perspective of gene and metabolite expression levels, a combined analysis of the metabolome and transcriptome was used to comprehensively explain the molecular regulatory mechanism of C. adrienii shade tolerance. In order to simulate the living environment of Carex in practical applications, a shading net with a shading rate of 80% was selected for the shading treatment of Carex, and plants without shading treatment were selected as the control group. By combining functional gene analysis, differentially expressed genes (DEGs) analysis and transcription factor analysis, we aim to explore the key metabolic pathways and regulatory genes of C. adrienii in response to shading. The results will help to understand the shading response mechanism, and provide a theoretical reference for the molecular breeding of shade tolerance in Carex.

2. Materials and Methods

2.1. Plant Materials and Treatment

This study was conducted at the pilot test base of the Chongqing Landscape and Gardening Research Institute. C. adrienii is preserved by the Chongqing Landscape and Gardening Research Institute and was selected as experimental material. C. adrienii was potted after asexual reproduction on February 10th and grew for three months before being used for experiments. In order to simulate the living environment of Carex in practical applications, a shading net with shading rate of 80% was selected for shading treatment experiment, and plants without shading treatment were selected as the control group (CK). On the 15th (HS) and 60th (TS) day after shading treatment, 10 C. adrienii plants were randomly selected as biological samples for the control group and treatment group, respectively. A total of 3 biological replicate samples were established for physiological indicators, transcriptomics and metabolomics analysis. The leaves that grew well were taken for sequencing experiments. The indicators, including net photosynthesis rate (Pn), stomatal conductance (Gs), intercellular CO2 concentration (Ci), transpiration rate (Tr), total chlorophyll content, chlorophyll a and chlorophyll b content, total carotenoid content, superoxide dismutase (SOD) activity, peroxidase (POD) activity and catalase (CAT) activity, were first detected. On this basis, shading treatment and CK samples were selected for further transcriptomics and metabolomics analysis.

2.2. Measurement of Physiological Indices and Photosynthetic Parameters

The SOD, POD and CAT activity was measured using the Plant SOD, POD and CAT Activating Enzyme Assay kits (Solarbio Life Sciences, Beijing, China), respectively. The operating procedure was carried out according to the instructions. Photosynthetic parameters of C. adrienii leaves were measured using Li-6400 portable photosynthetic analyzer (Li-COR, Lincoln, NE, USA), which included Pn, Gs, Ci and Tr. The measurement was implemented from 7:00 and 17:00 on sunny days. Chlorophyll content was measured using a spectrophotometer. The 0.1 g C. adrienii leaves were weighed and cut into blocks, fully immersed in 10 mL anhydrous ethanol and placed under dark conditions until the leaves turned white. The light absorption values of chlorophyll ethanol solution at 663 nm, 645 nm and 470 nm were determined by spectrophotometry. The total chlorophyll content, chlorophyll a, chlorophyll b and total carotenoid content were calculated according to the following formula [10]:
Chlorophyll a content (Ca) (mg/g) = (12.7 × A663 − 2.69 × A645) × 10 mL/1000 × 0.1 g,
Chlorophyll b content (Cb) (mg/g) = (22.9 × A645 − 4.68 × A663) × 10 mL/1000 × 0.1 g,
Total chlorophyll content (mg/g) = Chlorophyll a content + Chlorophyll b content,
Total carotenoid content (mg/g) = [(1000 × A470 − 3.27 × Ca – 104 × Cb) ÷ 229] × 10 mL/1000 × 0.1 g.

2.3. RNA Extraction, Library Construction and Squencing Analysis

Mag-Bind Tissue Direct mRNA Kit (OMEGA, Norwalk, CT, USA) was used to extract total mRNA from C. adrienii. RNA integrity and DNA contamination were detected by 1% agarose gel electrophoresis. RNA concentration was measured using Qubit4.0 Fluorometer. RNA integrity was detected using Qsep400 bioanalyzer. Fragmentation buffer was used to break down the extracted mRNA into short fragments. Using short RNA fragments as templates, the first stranded cDNA was synthesized using random hexamers. Next, buffer, dNTPS and DNA polymerase I were added to synthesize the second stranded cDNA. The double-stranded cDNA was purified using DNA purification magnetic beads. The purified double-stranded cDNA was subjected to end repair, followed by adding an A-tail and connecting the sequencing adapter. Next, approximately 200bp of cDNA was selected using DNA purification magnetic beads, and the final cDNA library was obtained through PCR enrichment. The cDNA Library was constructed using NEBNext® UltraTM RNA Library Prep Kit (Illumina, San Diego, CA, USA) protocol. After passing the cDNA library detection, the raw data were obtained by sequencing on the Illumina HiSeq 4000 platform.
The original sequencing data were filtered through Fastp (v0.23.2) to obtain clean reads, which were concatenated by Trinity (v2.13.2) to obtain transcripts of C. adrienii. Corset (v1.09) was used to cluster and remove redundancy from the assembled transcripts. High-quality reads were compared with spliced transcripts and gene expression levels were calculated. Next, the DEGs between different groups of samples were calculated using DESeq2 (v1.22.2) with condition of false discovery rate (FDR) < 0.05 and |log2 (ratio)| ≥ 1, and the DEGs (p-value ≤ 0.05) were annotated and subjected to GO and KEGG enrichment analysis. The raw data of RNA-seq were stored in NCBI (PRJNA1140402).

2.4. Metabolite Extraction and UPLC-MS/MS Analysis

The samples (50 mg) were vacuum-freeze-dried using a freeze dryer and ground to powder using a grinder. They were vortexed 6 times with pre-cooled 70% methanol, each time lasting for 30 s. After centrifugation, the supernatant was aspirated and the sample was filtered using a microporous filter membrane (0.22 μm pore size), and then stored in an injection bottle for further analysis. The Ultra Performance Liquid Chromatography and Tandem Mass Spectrometry (UPLC-MS/MS) system (ExionLC™ AD, Troy, MI, USA) was used for data collection. Analyst (v1.6.3) was used to process mass spectrometry data. Based on the Metware database, secondary spectral information was used for substance qualitative analysis, and MRM (Multiple Reaction Monitoring) mode was applied for metabolite quantification. At the same time, mixed samples were used for quality control to monitor consistency from extraction to detection. The peak area of detected metabolites was standardized using R package (v3.5.1). For two-group analysis, differential metabolites were determined by VIP > 1 (Variable Importance in Projection) and |Log2FC| ≥ 1.0. Significant differences in metabolites were subsequently used for principal component analysis (PCA) and KEGG enrichment analysis.

2.5. qRT-PCR Validation of DEGs

The cDNA was used as template for real-time quantitative RT-PCR (qRT-PCR) analysis. The C. adrienii housekeeping gene, Actin, was used as the internal reference, and the relative expression levels of genes were determined by 2−ΔΔCT method. Three biological repeats were performed. See Supplementary Table S1 for primer sequence.

3. Results

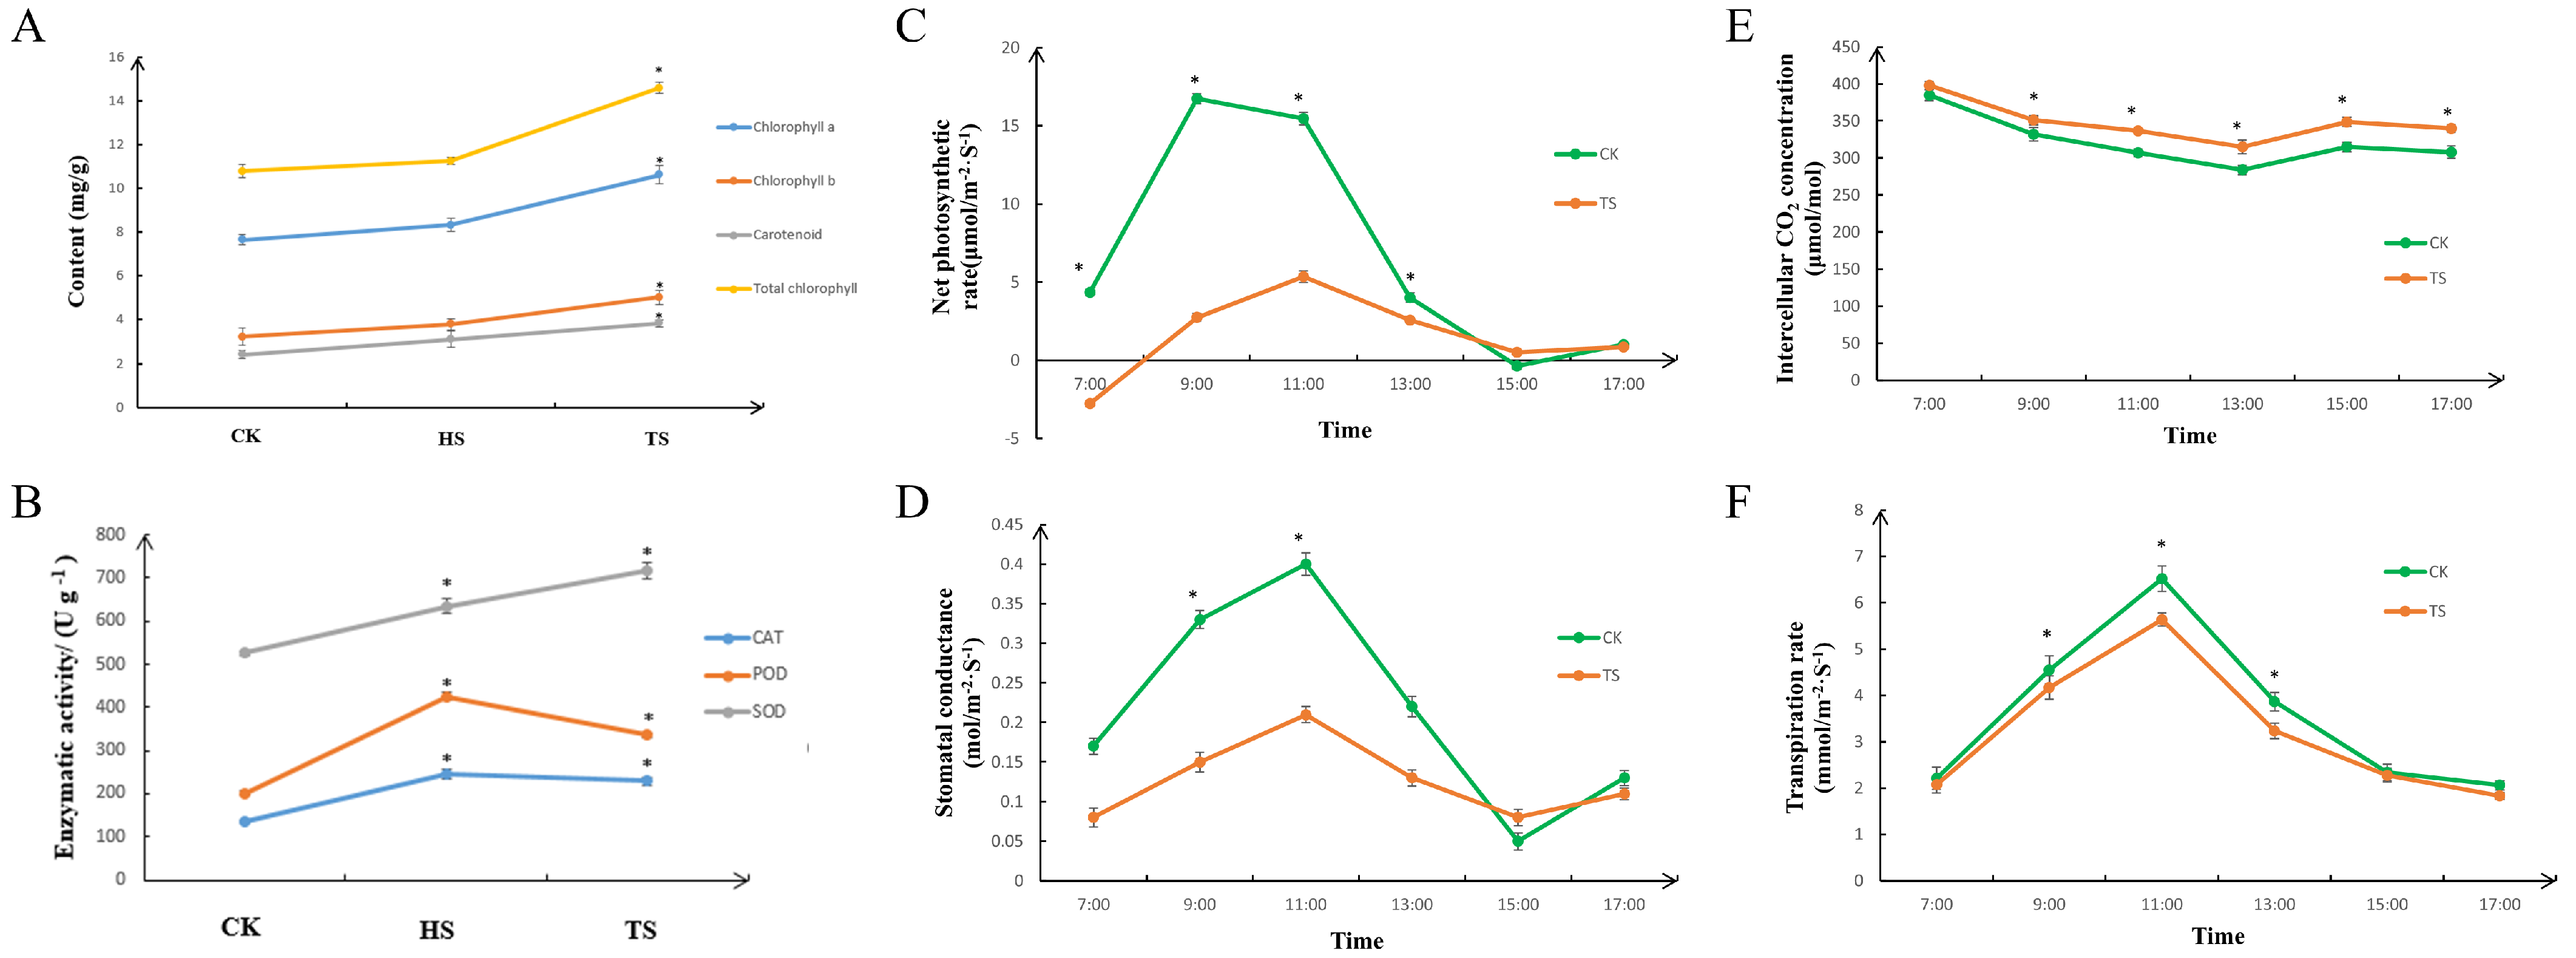
3.1. Physiological and Photosynthetic Characteristics of Carex adrienii Leaves Under Shading Treatment

The physiological characteristics of C. adrienii leaves in the CK and shade groups were analyzed. After shading, the total chlorophyll, chlorophyll a, chlorophyll b, and carotenoid contents in the TS group were significantly higher than those in the HS and CK groups (Figure 1A). All the photosynthetic pigment contents gradually increased with the extension of the shading treatment time. The increases (%) relative to the control for the photosynthetic pigment content of the Carex leaves under the HS treatment were 8.6% (chlorophyll a), 17.8% (chlorophyll b), 28.9% (total carotenoid) and 4.2% (total chlorophyll). Additionally, the increases (%) relative to the control for those under the TS treatment were 38.5% (chlorophyll a), 56% (chlorophyll b), 59.8% (total carotenoid) and 35.2% (total chlorophyll). The chlorophyll a/b ratios were 2.37 (CK), 2.18 (HS) and 2.10 (TS). Compared to CK, the POD, CAT, and SOD activities in HS and TS were significantly increased (Figure 1B).
Light intensity has a certain impact on the photosynthesis of C. adrienii. We detected the photosynthetic parameters of C. adrienii leaves in the CK and shade groups at different time points from 7:00 a.m. to 17:00 p.m. (Figure 1C–F). These four photosynthetic parameters (Pn, Tr, Ci and Gs) displayed significant differences between shade treatment and CK. The values of Pn, Gs and Tr exhibited an initial increase followed by a decrease, while the value of Ci showed a trend of first decreasing and then increasing. The Pn value of the shading treatment was significantly lower than that of the CK at 7:00, 9:00 and 11:00. The CK group had the highest Pn value at 9:00 a.m., while the C. adrienii under shading treatment had the highest Pn at 11:00 a.m. At 11:00, the Gs values of both CK and the shading treatment reached their maxima, but the value of the shading treatment was significantly lower than that of CK. At different time points, all the Ci values of CK were lower than those of the shading treatment, and all the Tr values of the C. adrienii leaves under the shading treatment were also lower than those of CK.

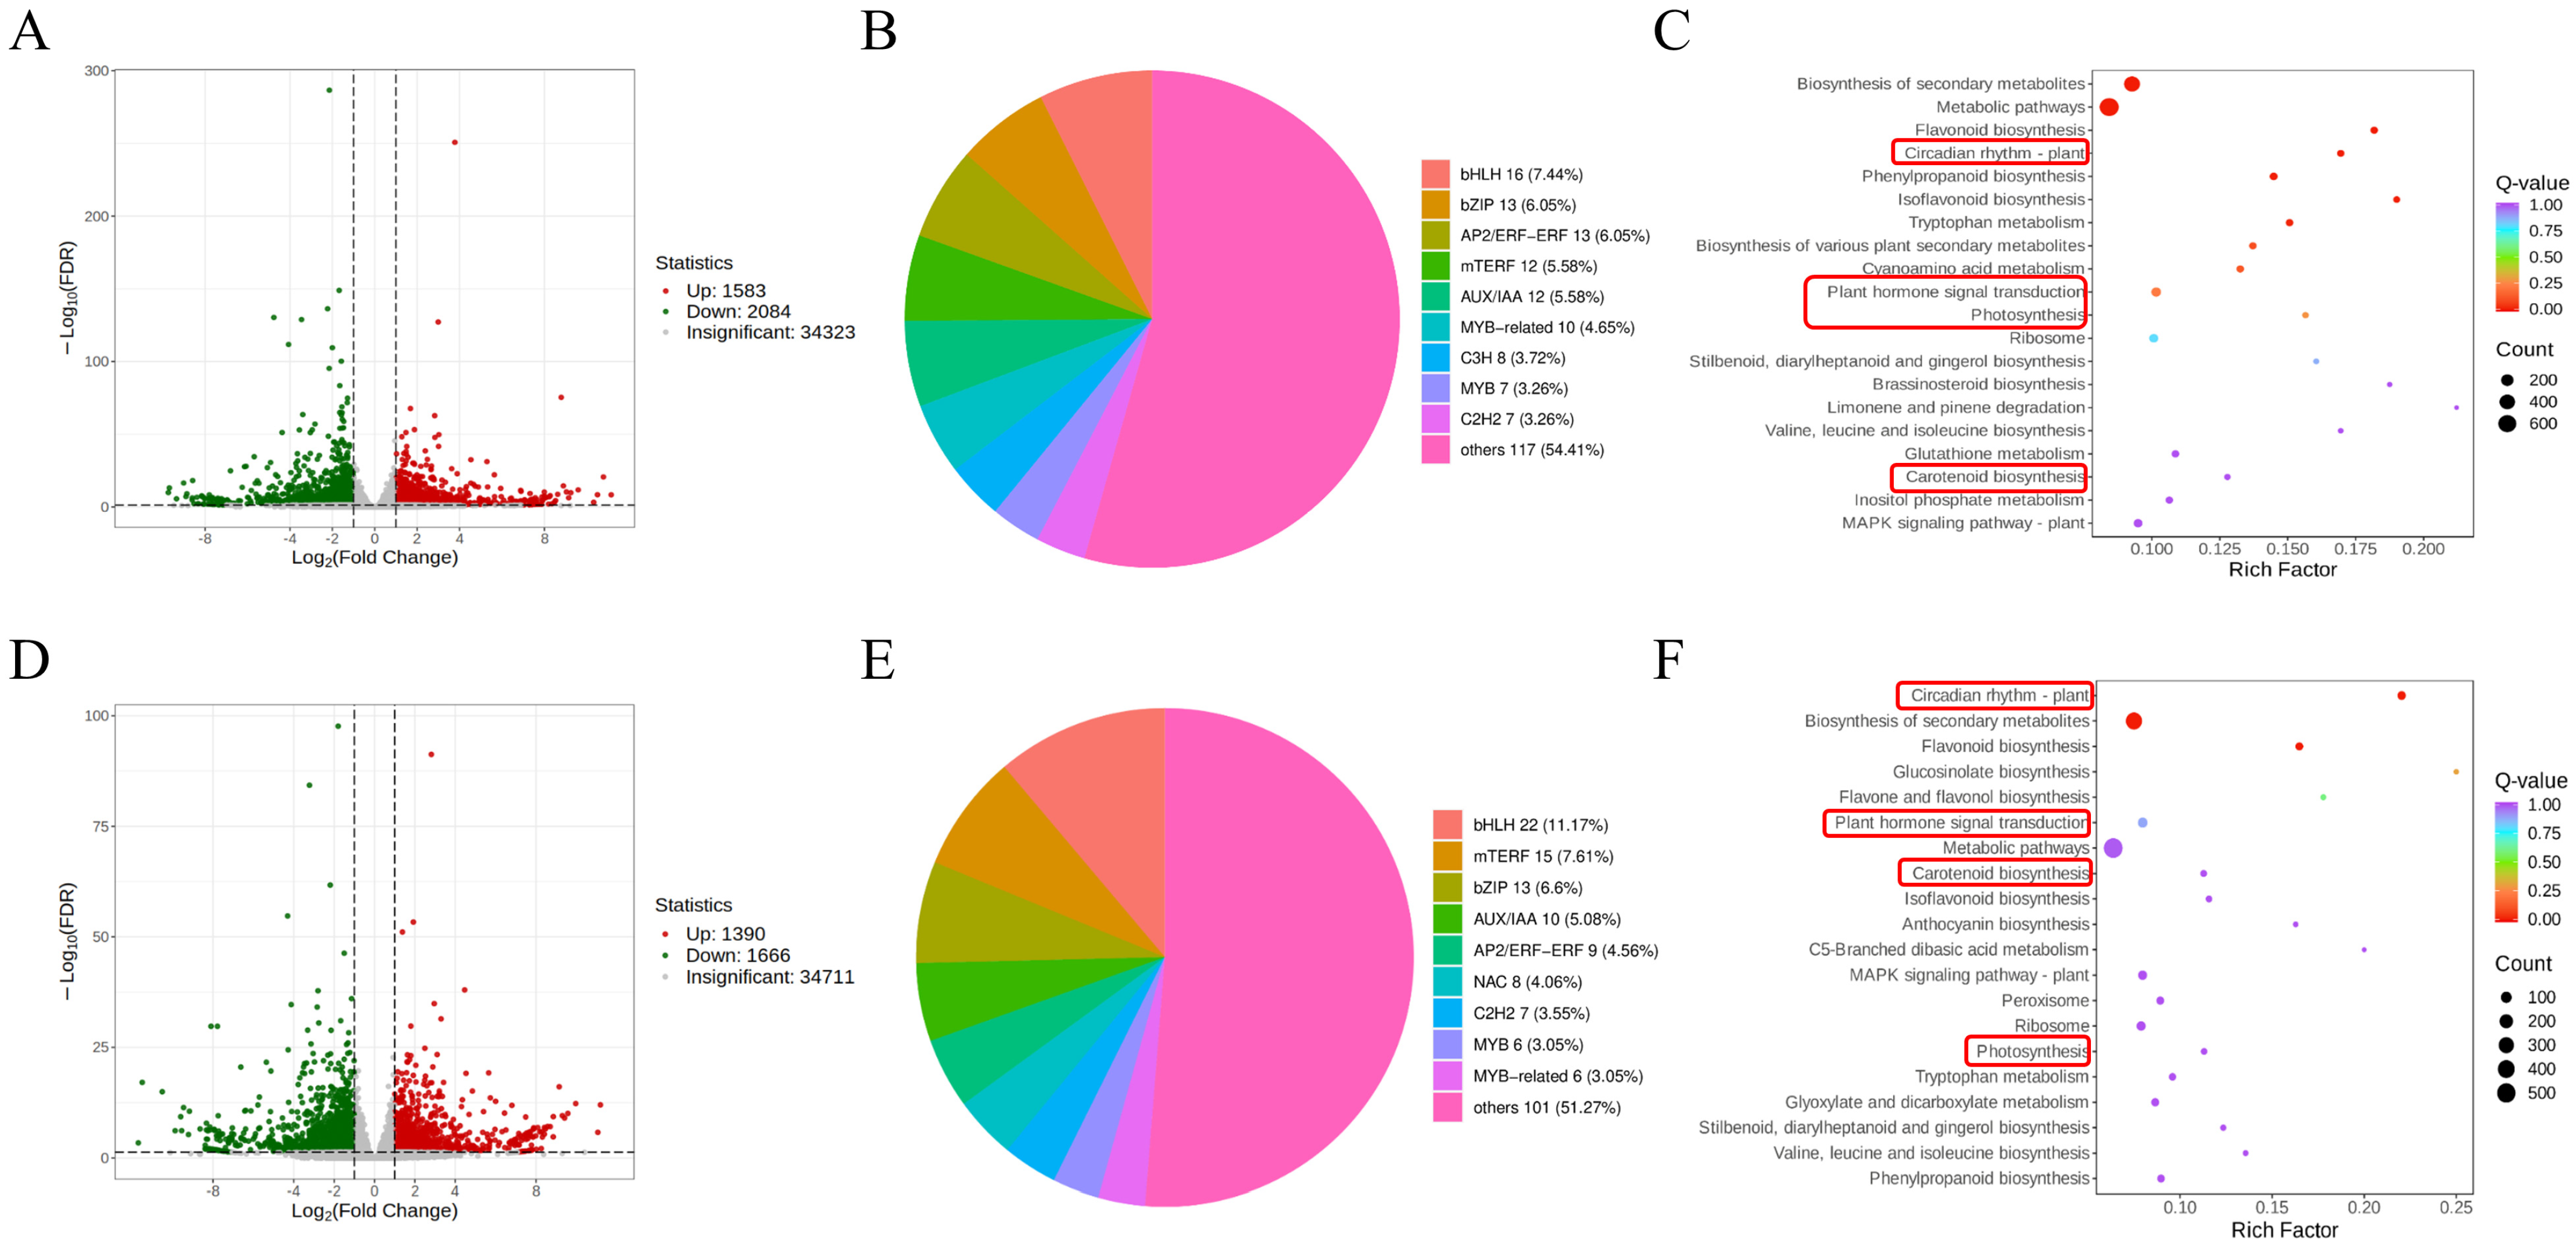
3.2. Transcriptome Sequencing and Overview of DEGs

According to the statistical analysis of the physiological characteristics, transcriptome sequencing was performed on the C. adrienii leaves, including HS, TS and CK group samples. A total of nine libraries were constructed and sequenced using the Illumina HiSeq 4000 platform. A total of 61.03GB clean reads were obtained from nine samples. Clean reads were spliced to obtain reference sequences for the subsequent analysis. The percentage of Q30 bases in each sample ranged from 93.56% to 93.87%, and the GC content ranged from 46.3% to 47.03% (Supplementary Figure S2).
The transcriptome analysis showed that the shading treatment resulted in significant changes in the gene expression level of C. adrienii. The statistical analysis results of the DEGs for the shading and CK group are shown in Figure 2A,D. Among the 3667 DEGs for HST vs. CKT, 1583 genes showed increased expression and 2084 genes showed decreased expression. Among the 3056 DEGs of the TST vs. CKT, 1390 genes were upregulated and 1666 genes were downregulated. In the DEGs of HST vs. CKT, transcription factors accounted for 45.58%, while in TST vs. CKT, this proportion was 48.73% (Figure 2B,E), and the bHLH family had the highest proportion of transcription factors. These results indicated that transcription factors were active in the response to the shade stress of C. adrienii, and bHLH family transcription factors might play significant regulatory roles. The KEGG enrichment analysis showed that the DEGs were significantly enriched in circadian rhythm, plant hormone signal translation, photosynthesis and carotenoid biosynthesis (Figure 2C,F).

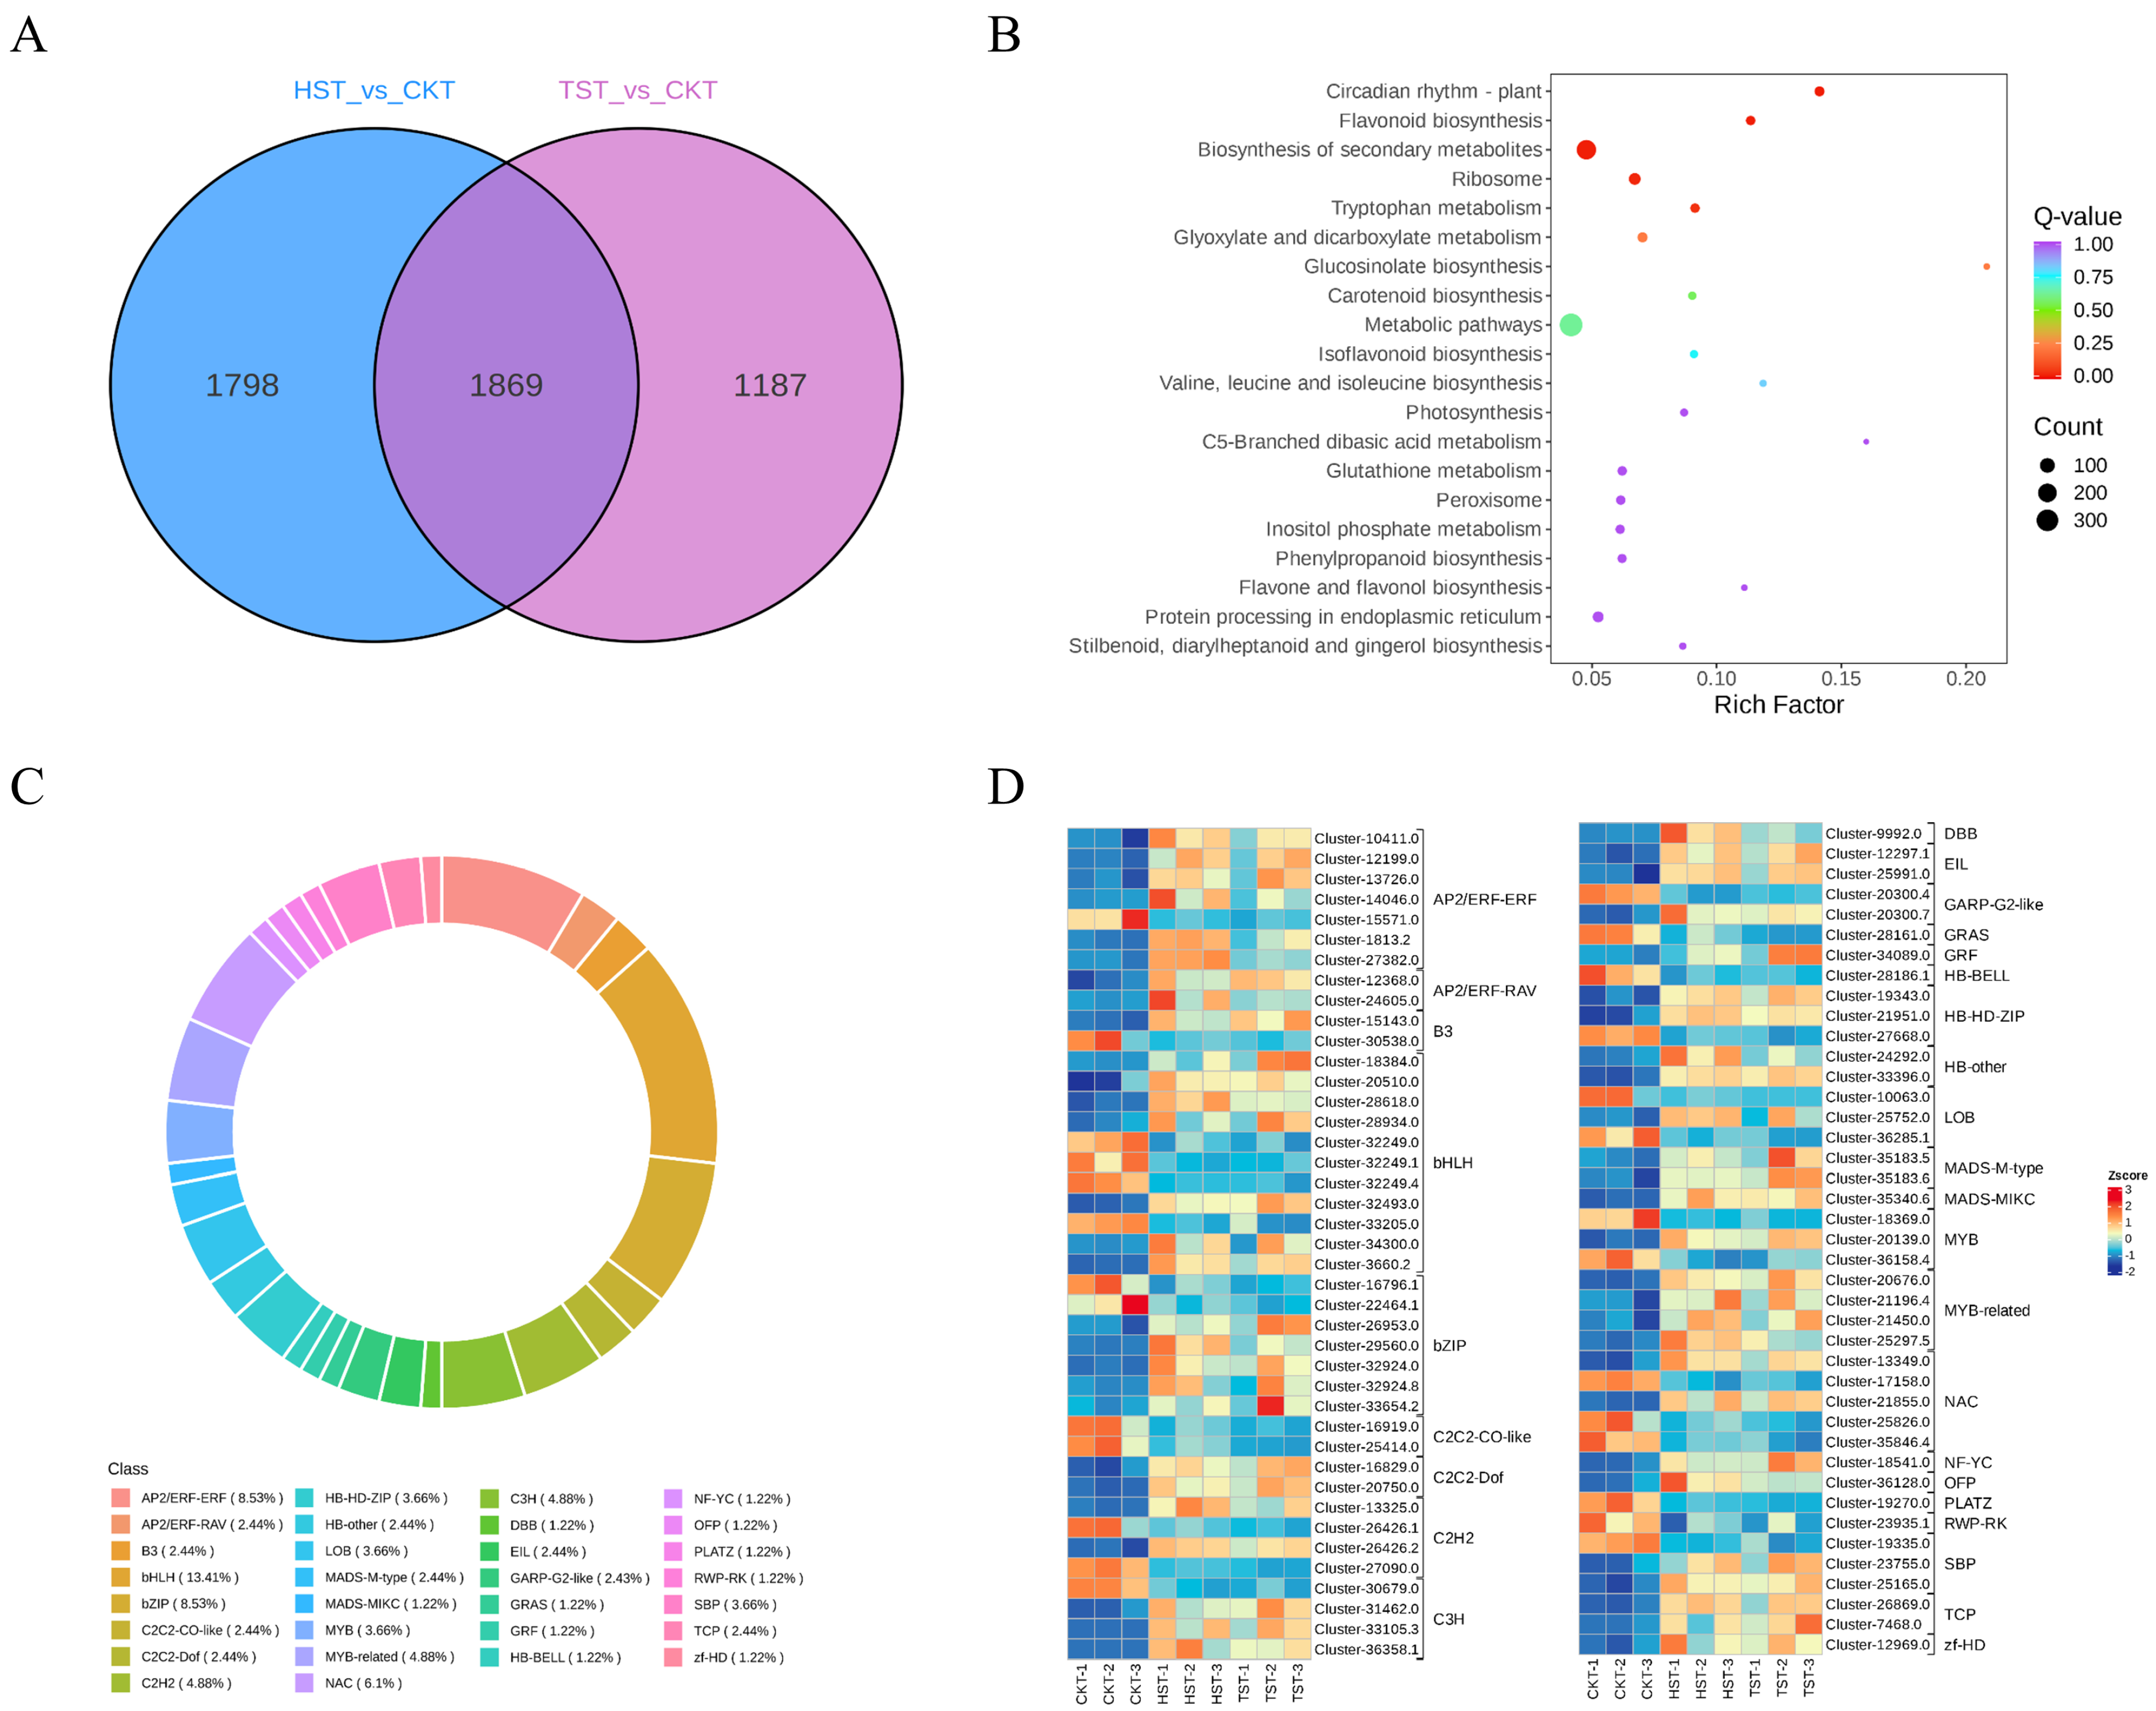
3.3. GO Enrichment Analysis of DEGs

The GO enrichment analysis of DEGs is shown in Figure 3A,C. The DEGs in HST vs. CKT were mainly enriched in antioxidant activity, peroxidase activity, catalase activity, oxidoreductase activity, acting on peroxides as acceptors and hydrogen peroxide catabolic process (Figure 3A). The DEGs in TST vs. CKT were also mainly enriched in antioxidant activity, peroxidase activity and catalase activity pathways (Figure 3C). The GO enrichment chord plot (Figure 3B) of DEGs in HST vs. CKT showed the nine most significantly enriched pathways and the 10 genes with the highest multiple of differences in each pathway. Among them, Cluster-27043.2, Cluster-27043.1, Cluster-27043.5, Cluster-27043.3, Cluster-27043.0, Cluster-32830.6, Cluster-27043.4 and Cluster-32830.1 were catalase isozyme genes, with significantly upregulated expression. Cluster-35654.0, Cluster-27740.0 and Cluster-33340.0 were peroxidase genes with significantly upregulated expression. The GO enrichment chord plot (Figure 3D) of the DEGs in TST vs. CKT showed that Cluster-27043.1, Cluster-27043.2, Cluster-27043.5, Cluster-27043.0, Cluster-32830.6, Cluster-27043.4, Cluster-27043.3, Cluster-32830.3, Cluster-32830.1, all catalase isozyme genes, were significantly upregulated. Cluster-35654.0, a peroxidase gene, was significantly upregulated in its expression level. Cluster-34914.4 belonging to the superoxide dismutase gene, was also significantly upregulated in its expression level. These results show that the significant increases in the expression levels of antioxidant-related genes helped to respond to low-light conditions.

3.4. Analysis of Differentially Expressed Transcription Factors

The Venn plot shows that the intersection of the DEGs in HST vs. CKT and TST vs. CKT contained 1869 genes (Figure 4A), and the KEGG enrichment analysis showed that these DEGs were enriched in pathways such as metabolic pathways, biosynthesis of secondary metabolites, circadian rhythm, flavonoid biosynthesis, peroxisome and photosynthesis (Figure 4B). A total of 82 transcription factors were selected from 1869 DEGs, and were mainly distributed in six families, including AP2/ERF (nine), bHLH (11), bZIP (seven), NAC (five), B3 (2) and C2H2 (four) (Figure 4C). Among them, two RAV (Cluster-12368.0, Cluster-24605.0), one MYB (Cluster-20139.0), one NAC (Cluster-21855.0) and three bHLH (Cluster-20510.0, Cluster-28618.0 and Cluster-28934.0) were all upregulated after shading (Figure 4D), which might be related to shade stress.

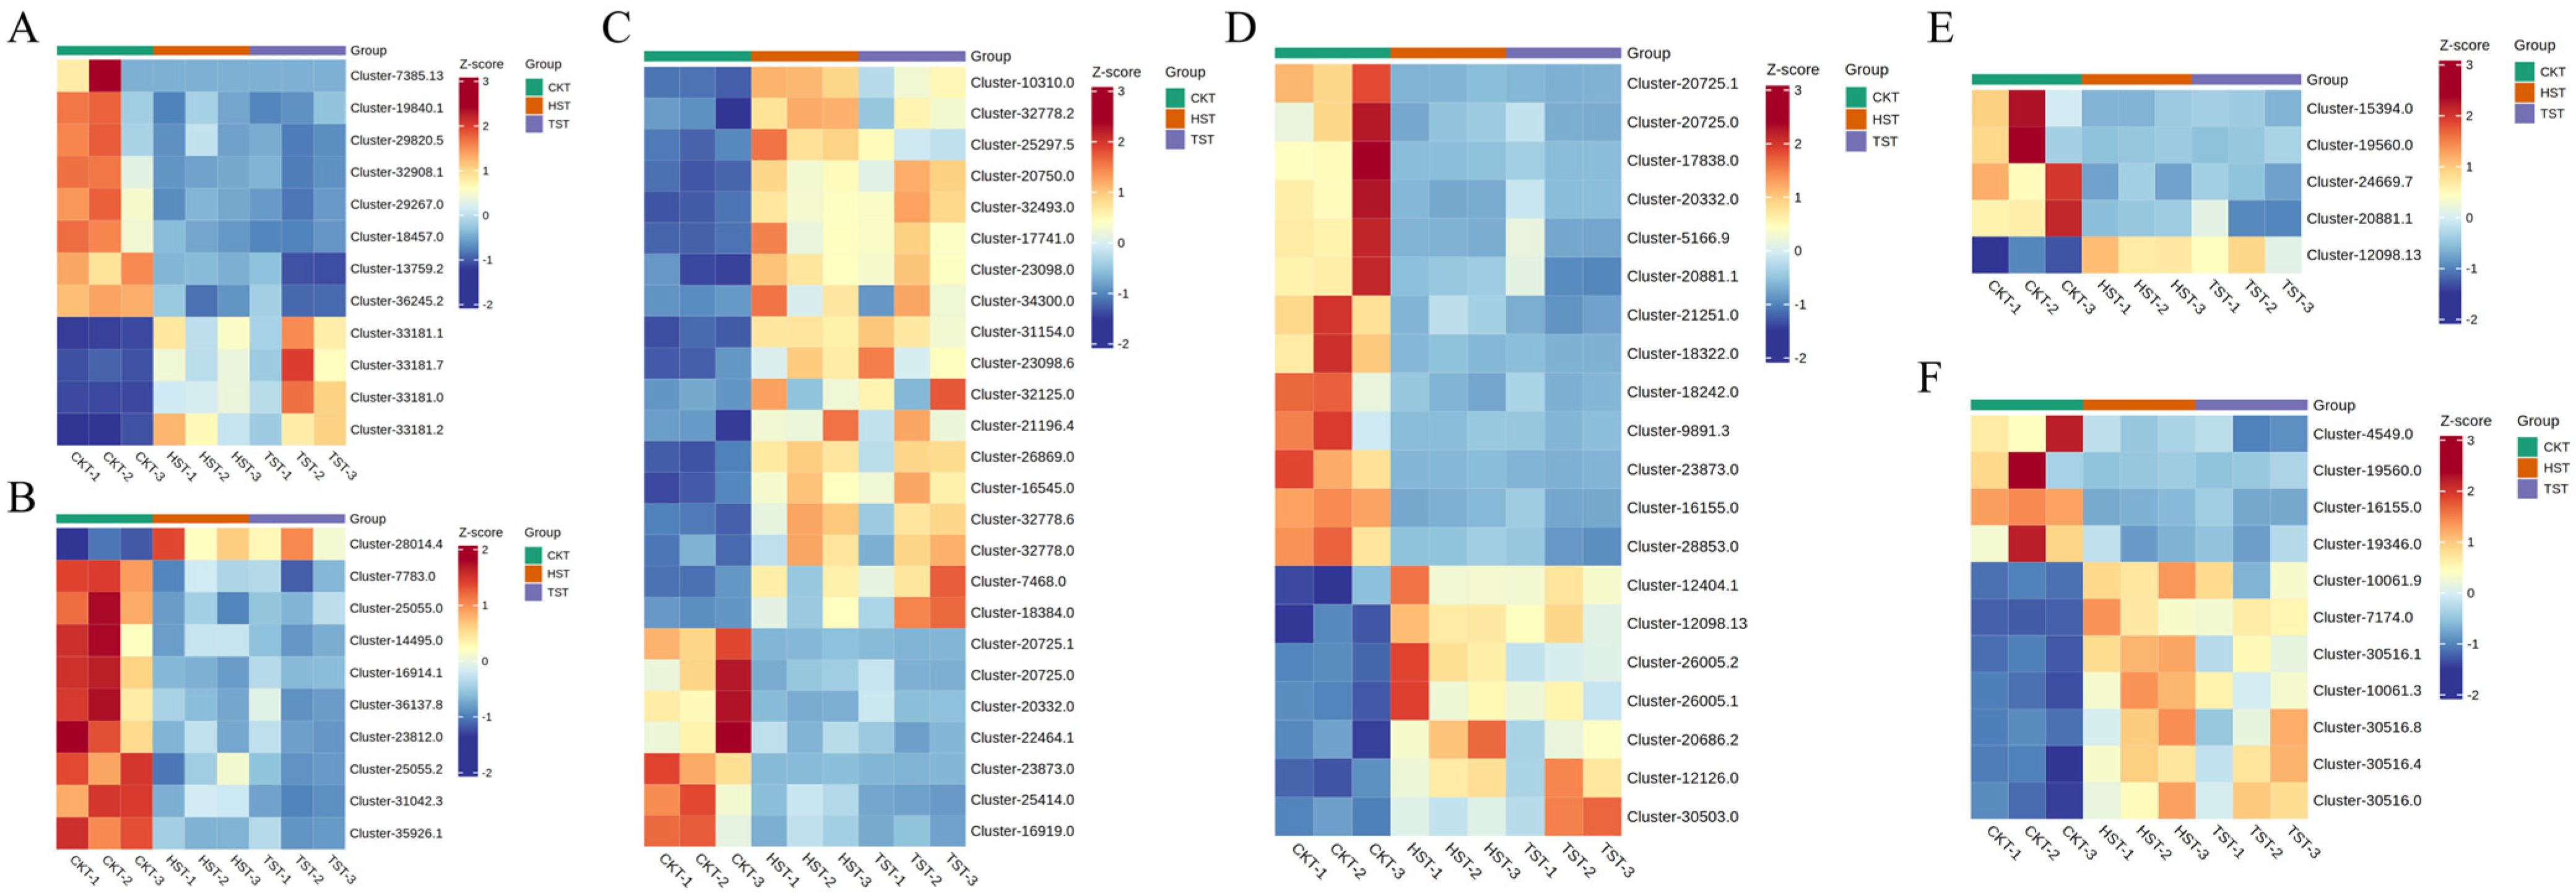
3.5. Analysis of DEGs Involved in Photosynthesis and Flavonoids Biosynthesis

In order to explore the key genes of C. adrienii in response to shading stress, genes related to the carotenoid, photosynthesis, circadian rhythm, flavonoid biosynthesis, flavone and flavonol biosynthesis and isoflavonoid biosynthesis pathways were screened and analyzed from 1869 DEGs in the intersection of the Venn plot (Figure 4A). Four genes (Cluster-33181.1, Cluster-33181.7, Cluster-33181.0 and Cluster-33181.2) associated with the carotenoid pathway, which belong to the Cytochrome P450 family, were significantly upregulated in response to both HS and TS treatments (Figure 5A). Among the 10 genes related to the photosynthesis pathway (Figure 5B), only the PsBR (Cluster-28014.4) in Photosystem II was significantly upregulated under the shading treatment, while the expression levels of the remaining nine genes were downregulated, including PsbB (Cluster-16914.1, Photosystem II), PsbJ (Cluster-31042.3, Photosystem II), PsbP (Cluster-36137.8 and Cluster-14495.0, Photosystem II), PsbQ (Cluster-7783.0, Photosystem II), the PsbS (Cluster-35926.1, Photosystem II), PsaA (Cluster-23812.0, Photosystem I) and PetA (Cluster-25055.0 and Cluster-25055.2, Cytochrome b6/f complex). Among the 25 genes related to the circadian rhythm pathway, Cluster-25297.5 and Cluster-21196.4 encoded MYB transcription factors, Cluster-32493.0 and Cluster-34300.0 belonged to the bHLH family, and Cluster-26869.0 and Cluster-7468.0 belonged to the TCP family. These genes were significantly upregulated under the shading treatment (Figure 5C). These results indicated that the shading treatment affected the photosynthesis and circadian rhythm regulation of C. adrienii. The CYP2 subfamily genes (Cluster-12098.13, Cluster-10061.9, Cluster-30516.1, Cluster-10061.3, Cluster-30516.8, Cluster-30516.4, Cluster-30516.0) of the Cytochrome P450 family related to the flavonoid biosynthesis, flavone and flavonol biosynthesis and isoflavonoid biosynthesis pathways were significantly upregulated under the shading treatment. This indicated that the CYP2 subfamilyparticipated in the stress resistance of C. adrienii in the shaded environments (Figure 5D–F).

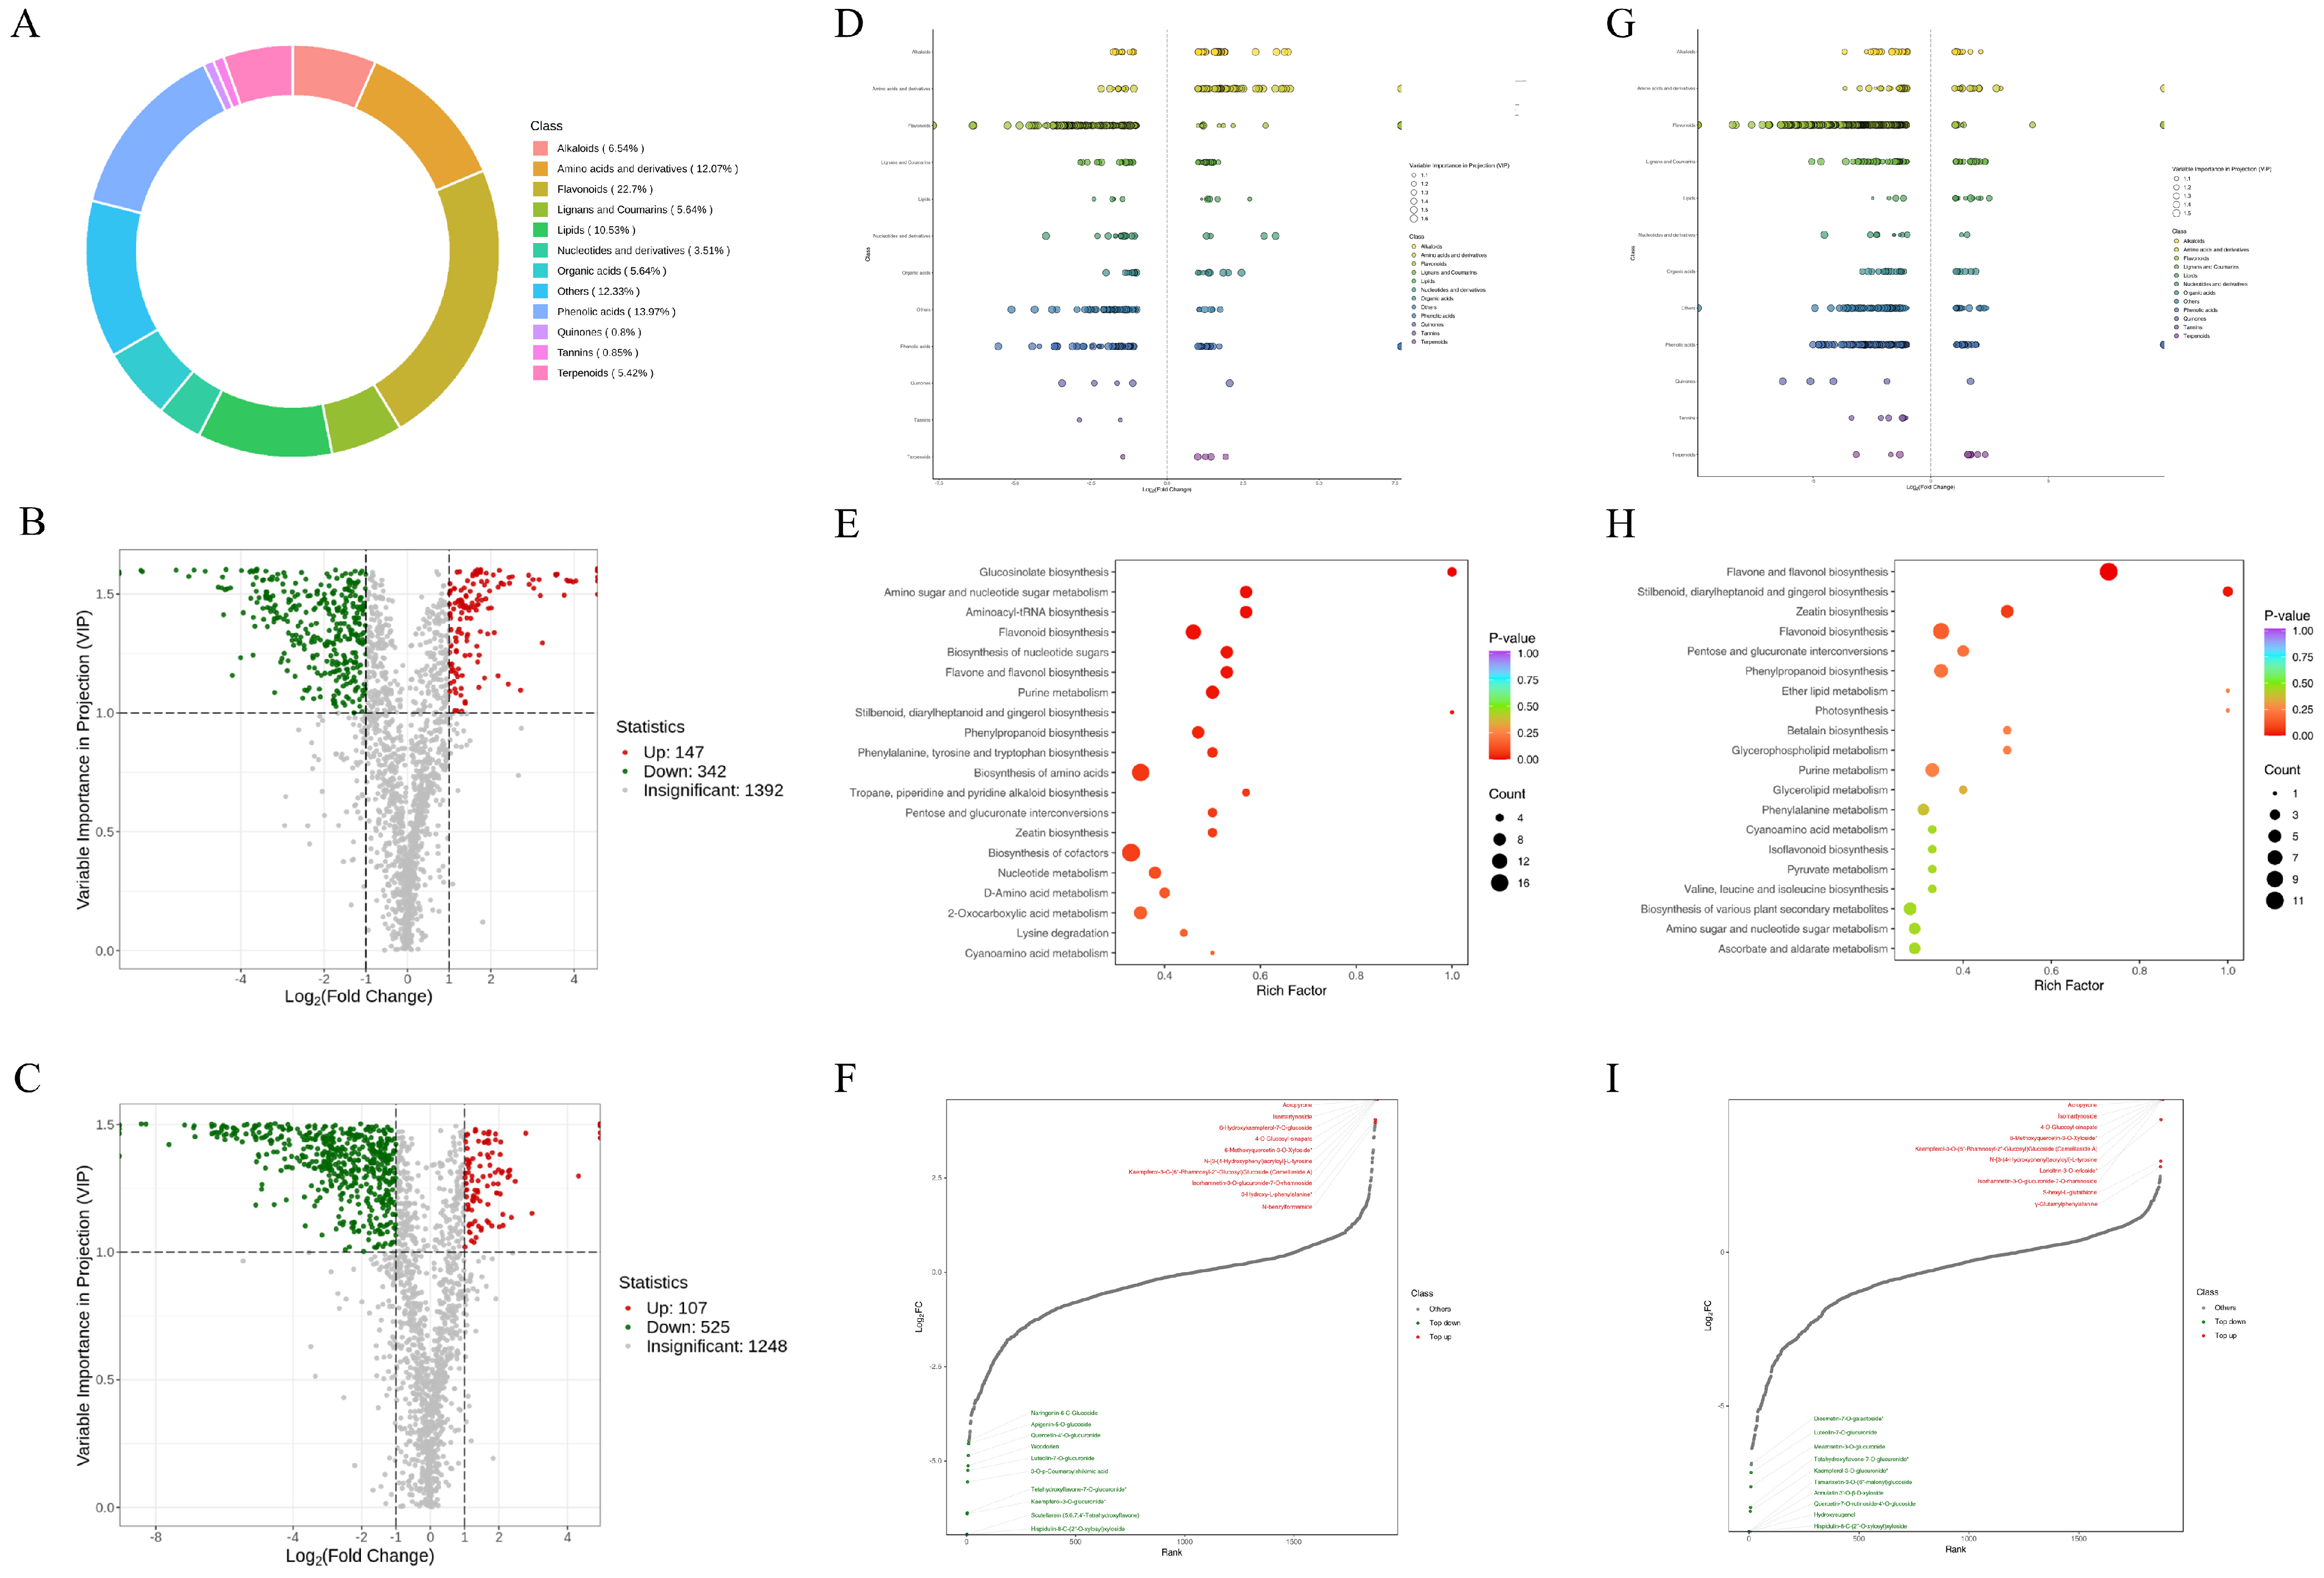
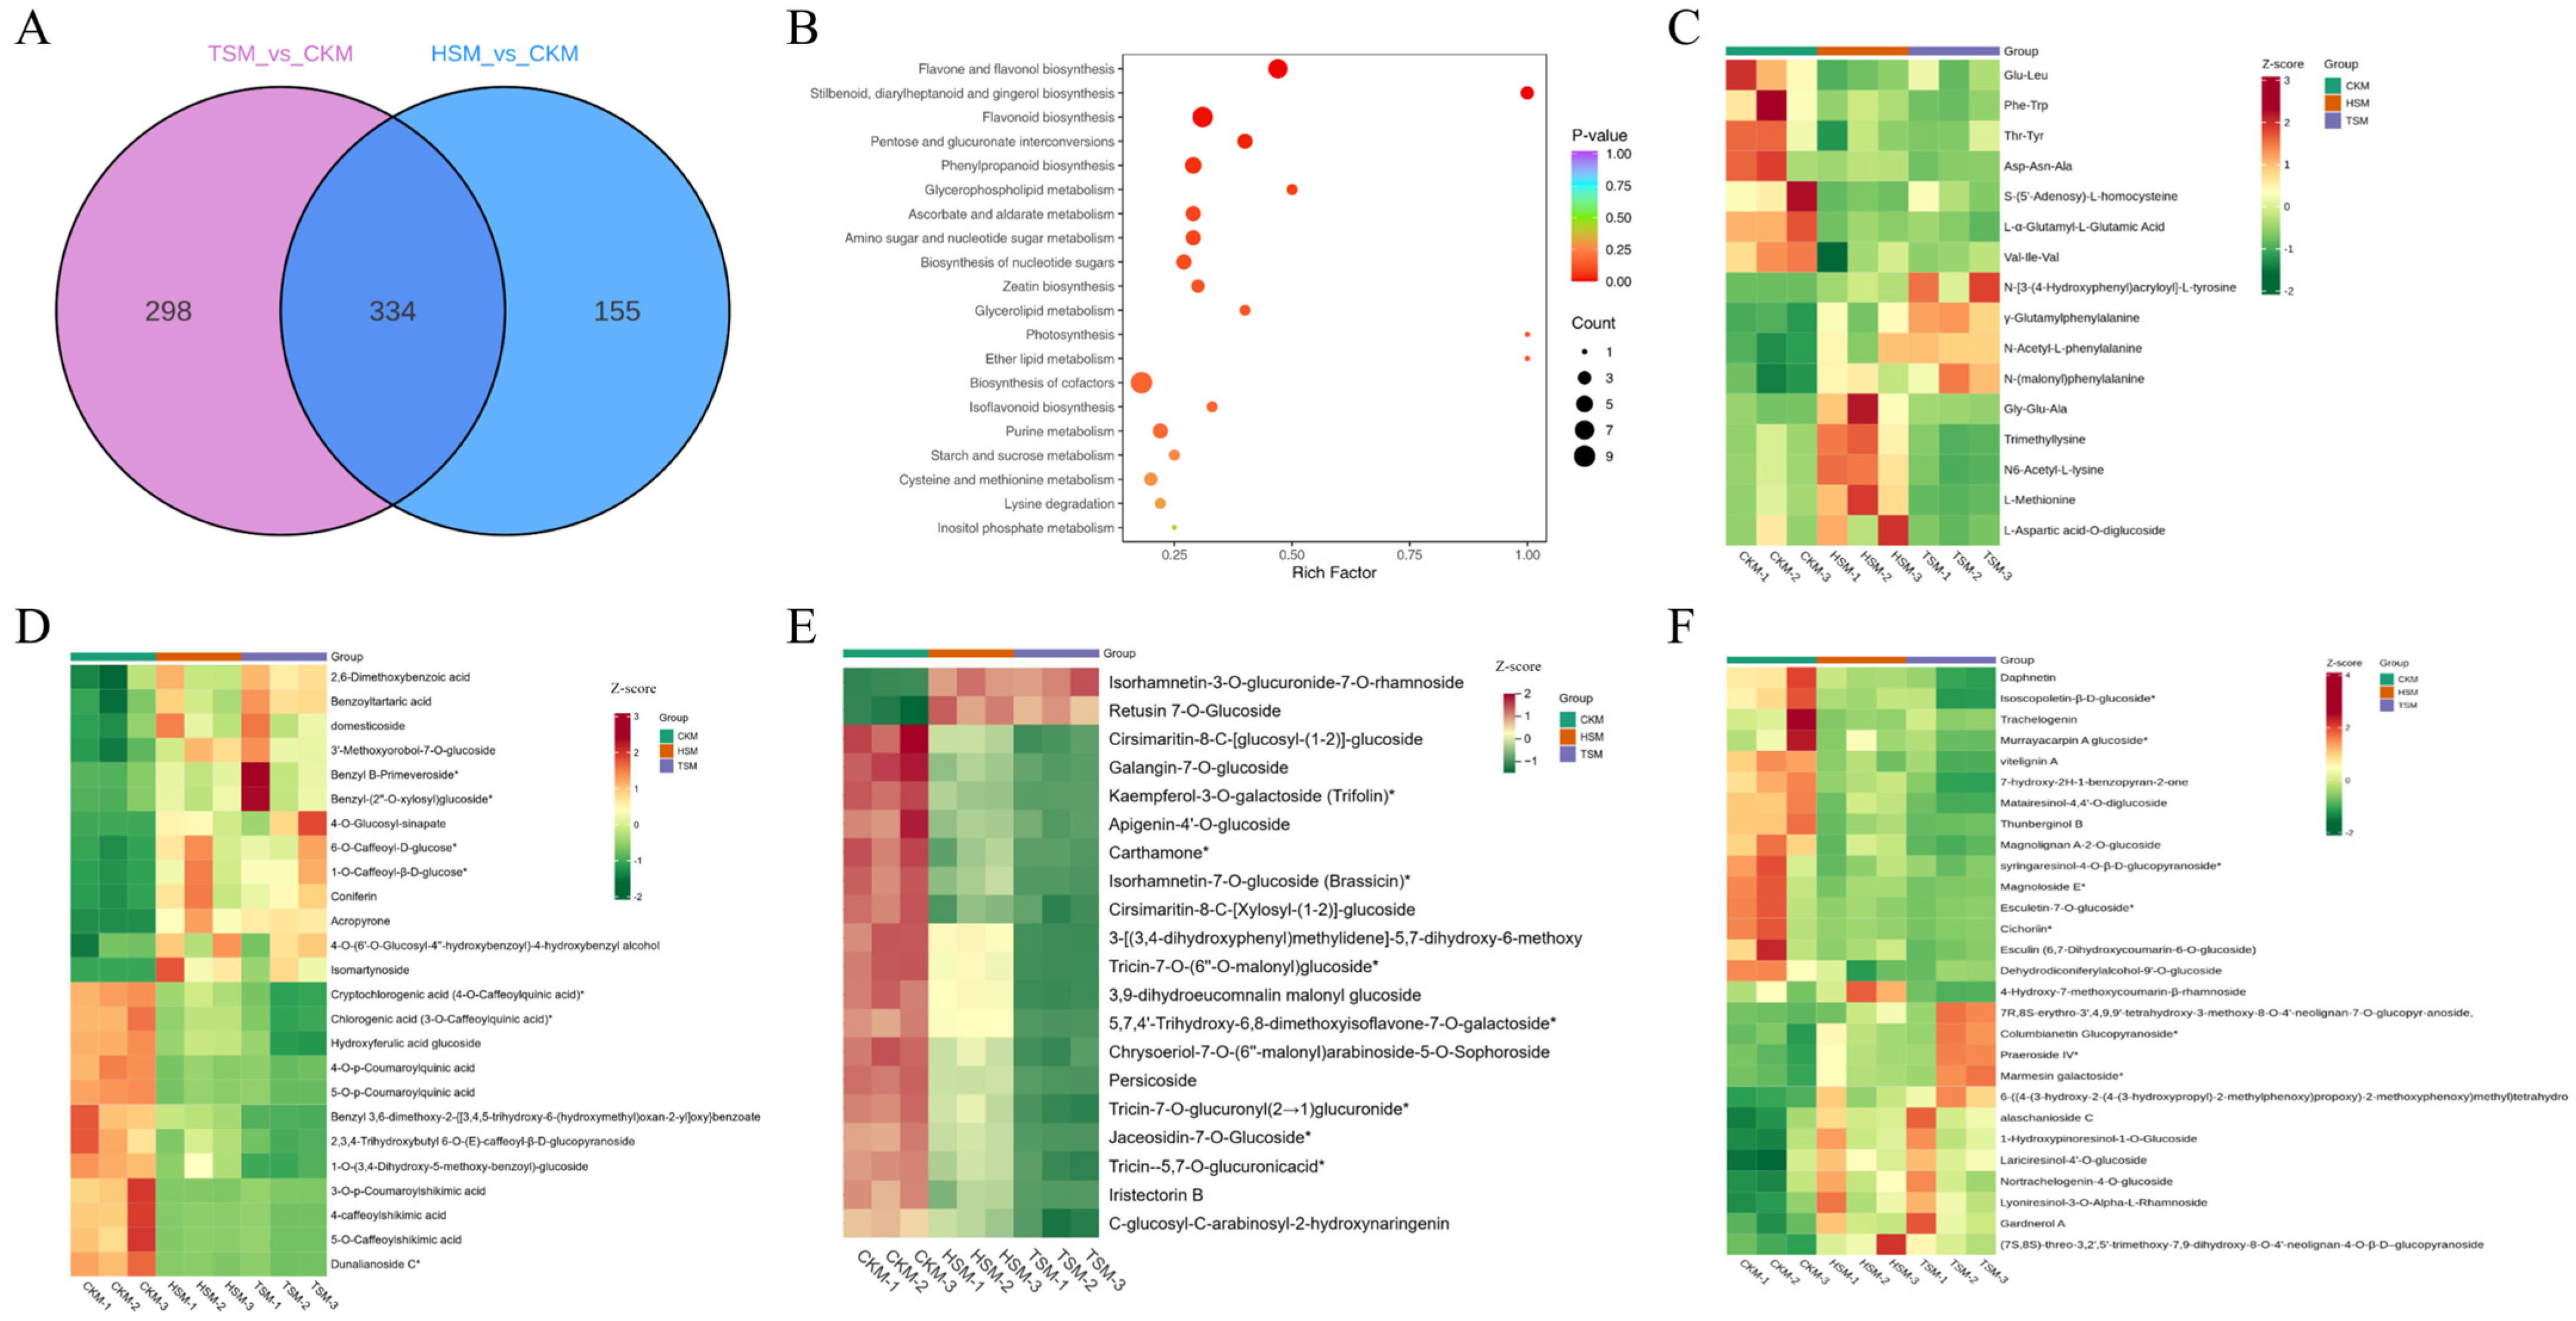
3.6. Metabolomic Analysis

The metabolite type analysis showed that flavonoids accounted for the highest proportion of metabolites in C. adrienii after the shading treatment, followed closely by lipids (10.53%) and alkaloids (6.54%). In total, 1881 differential accumulated metabolites (DAMs) were detected in HSM vs. CKM, including 147 upregulated metabolites and 342 downregulated metabolites (Figure 6B). In TSM vs. CKM, 1880 DAMs were detected, including 107 upregulated metabolites and 525 downregulated metabolites (Figure 6C). In the DAMs of HSM vs. CKM, the number of significantly upregulated alkaloids, amino acids and derivatives was higher than that of those that were significantly downregulated, while the opposite result was observed for flavonoids. However, this situation was different in TSM vs. CKM, where the number of significantly downregulated alkaloids, amino acids and derivatives and flavonoids was higher than that of those that were upregulated. The DAMs were enriched in the pathways of flavonoid biosynthesis, flavone and flavonol biosynthesis and phenylalanine metabolism in both HSM vs. CKM and TSM vs. CKM (Figure 6E,H). The dynamic distribution map of the metabolite content differences showed that kaempferol-3-O-(6″-Rhamnosyl-2″-Glucosyl)Glucoside (flavonols), 6-Methoxyquercetin-3-O-Xyloside* (flavonols), isorhamnetin-3-O-glucuronide-7-O-rhamnoside (flavonols), acropyrone (phenolic acids), isomartynosid (phenolic acids) and 4-O-Glucosyl-sinapate (Phenolic acids), as well as N-[3-(4-Hydroxyphenyl)acyl]-L-tyrosine (amino acids and derivatives), were significantly upregulated in both HSM and TSM, which might be beneficial for the tolerance of C. adrienii to shade stress (Figure 6F,I).
The Venn diagram of the DAMs showed that there were 334 overlapping DAMs between HSM vs. CKM and TSM vs. CKM (Figure 7A). The KEGG enrichment analysis showed that these metabolites were significantly enrichmed in pathways such as flavone and flavonol biosynthesis, flavonoid biosynthesis, phenolpropanoid biosynthesis and biosynthesis of cofactors (Figure 7B). Furthermore, according to the classification of metabolites, we analyzed the content changes of amino acids and derivatives, phenolic acids, flavonoids, lignans and coumarins metabolites in the CK, HS and TS samples. In the HS and TS treatment samples, amino acids and derivative metabolites N-[3-(4-Hydroxyphenyl) acryloyl]-L-tyrosine, γ-Glutamylphenylalanine and N-Acetyl-L-phenylalanine, N-(malonyl) phenylalanine were significantly higher than those in CK. The metabolites of the phenolic acids (4-O-Glucosyl-sinapate, coniferin, benzyl B-Primeveroside*, 3′-Methoxyorobol-7-O-glucoside, benzoyltartaric acid and domesticoside) exhibit antioxidant properties and inhibitory effects against bacteria or fungi, and their contents were upregulated under shading conditions. The contents of the flavonoids metabolites isorhamnetin-3-O-glucuronide-7-O-rhamnoside and retusin-7-O-Glucoside were significantly upregulated under the shading treatment. Columbianetin glucopyranoside*, lariciresinol-4′-O-glucoside, nortrachelogenin-4-O-glucoside and Gardnerol A, which belong to ligan and coumarin metabolites, have antiviral and bactericidal effects. These were also upregulated under the shading induction. These results indicated that the upregulation of metabolites such as phenolic acids, flavonoids, lignans and coumarins might be involved in the response of C. adrienii to shade tolerance.

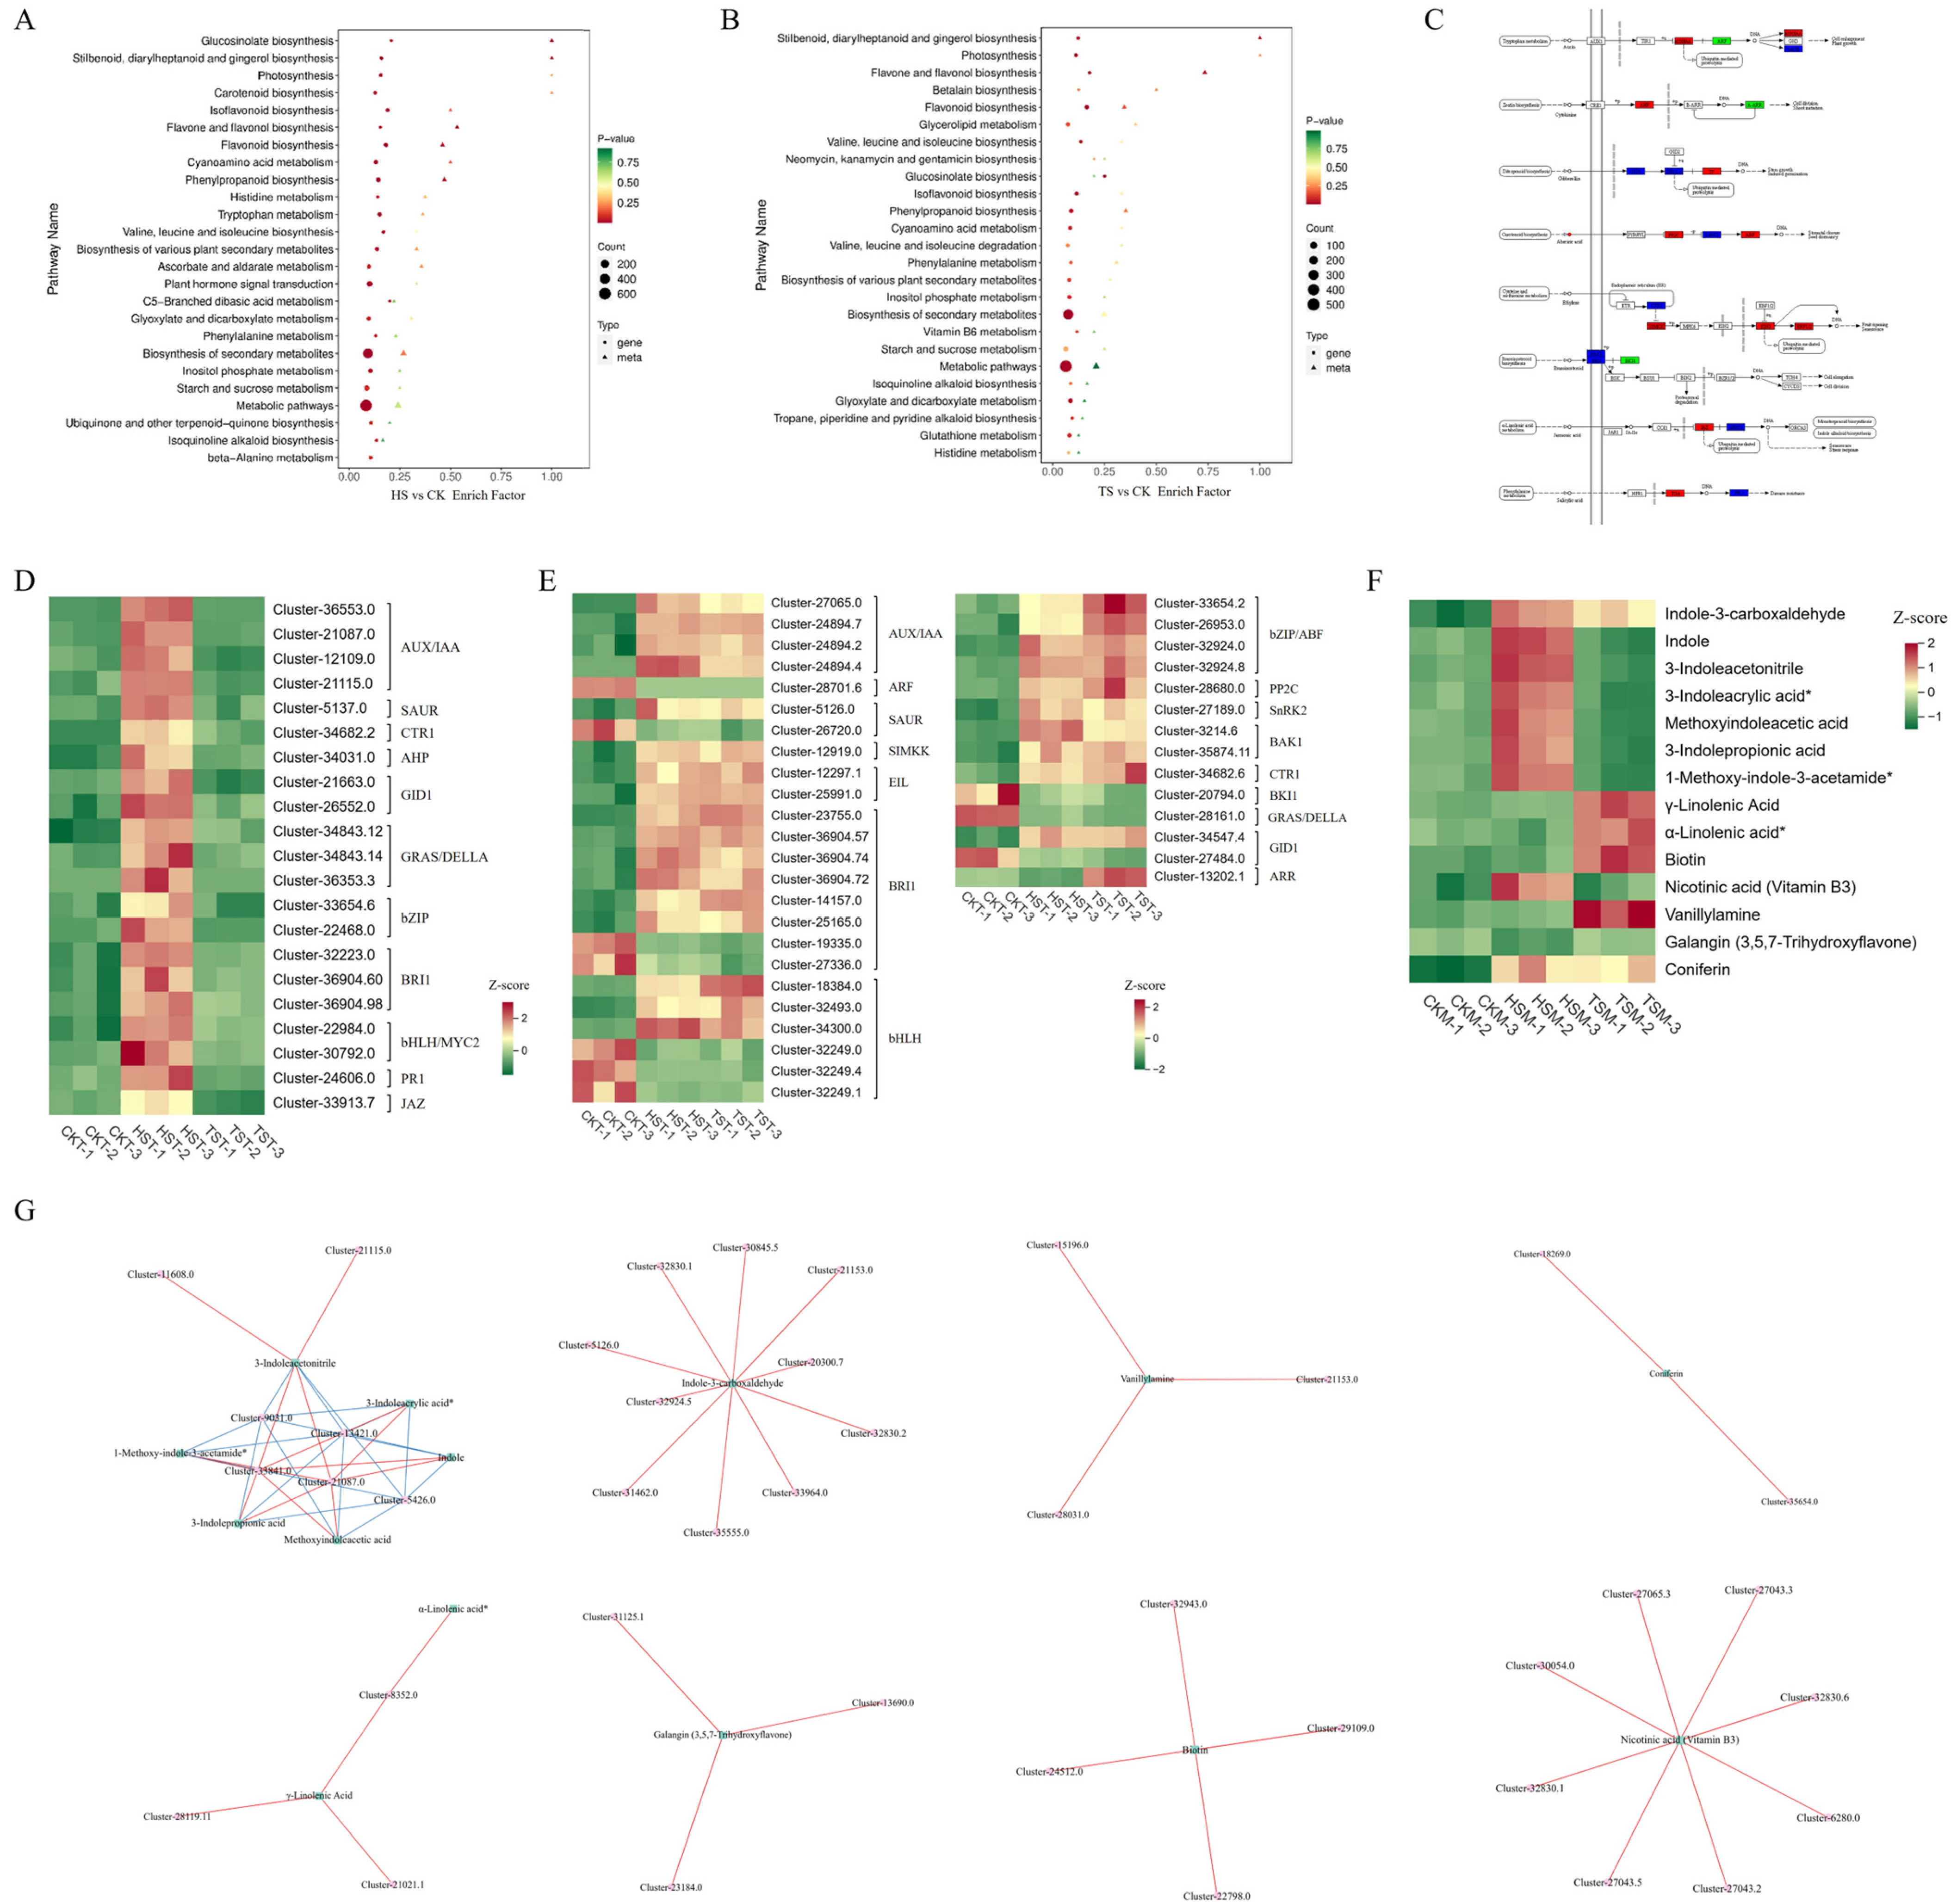
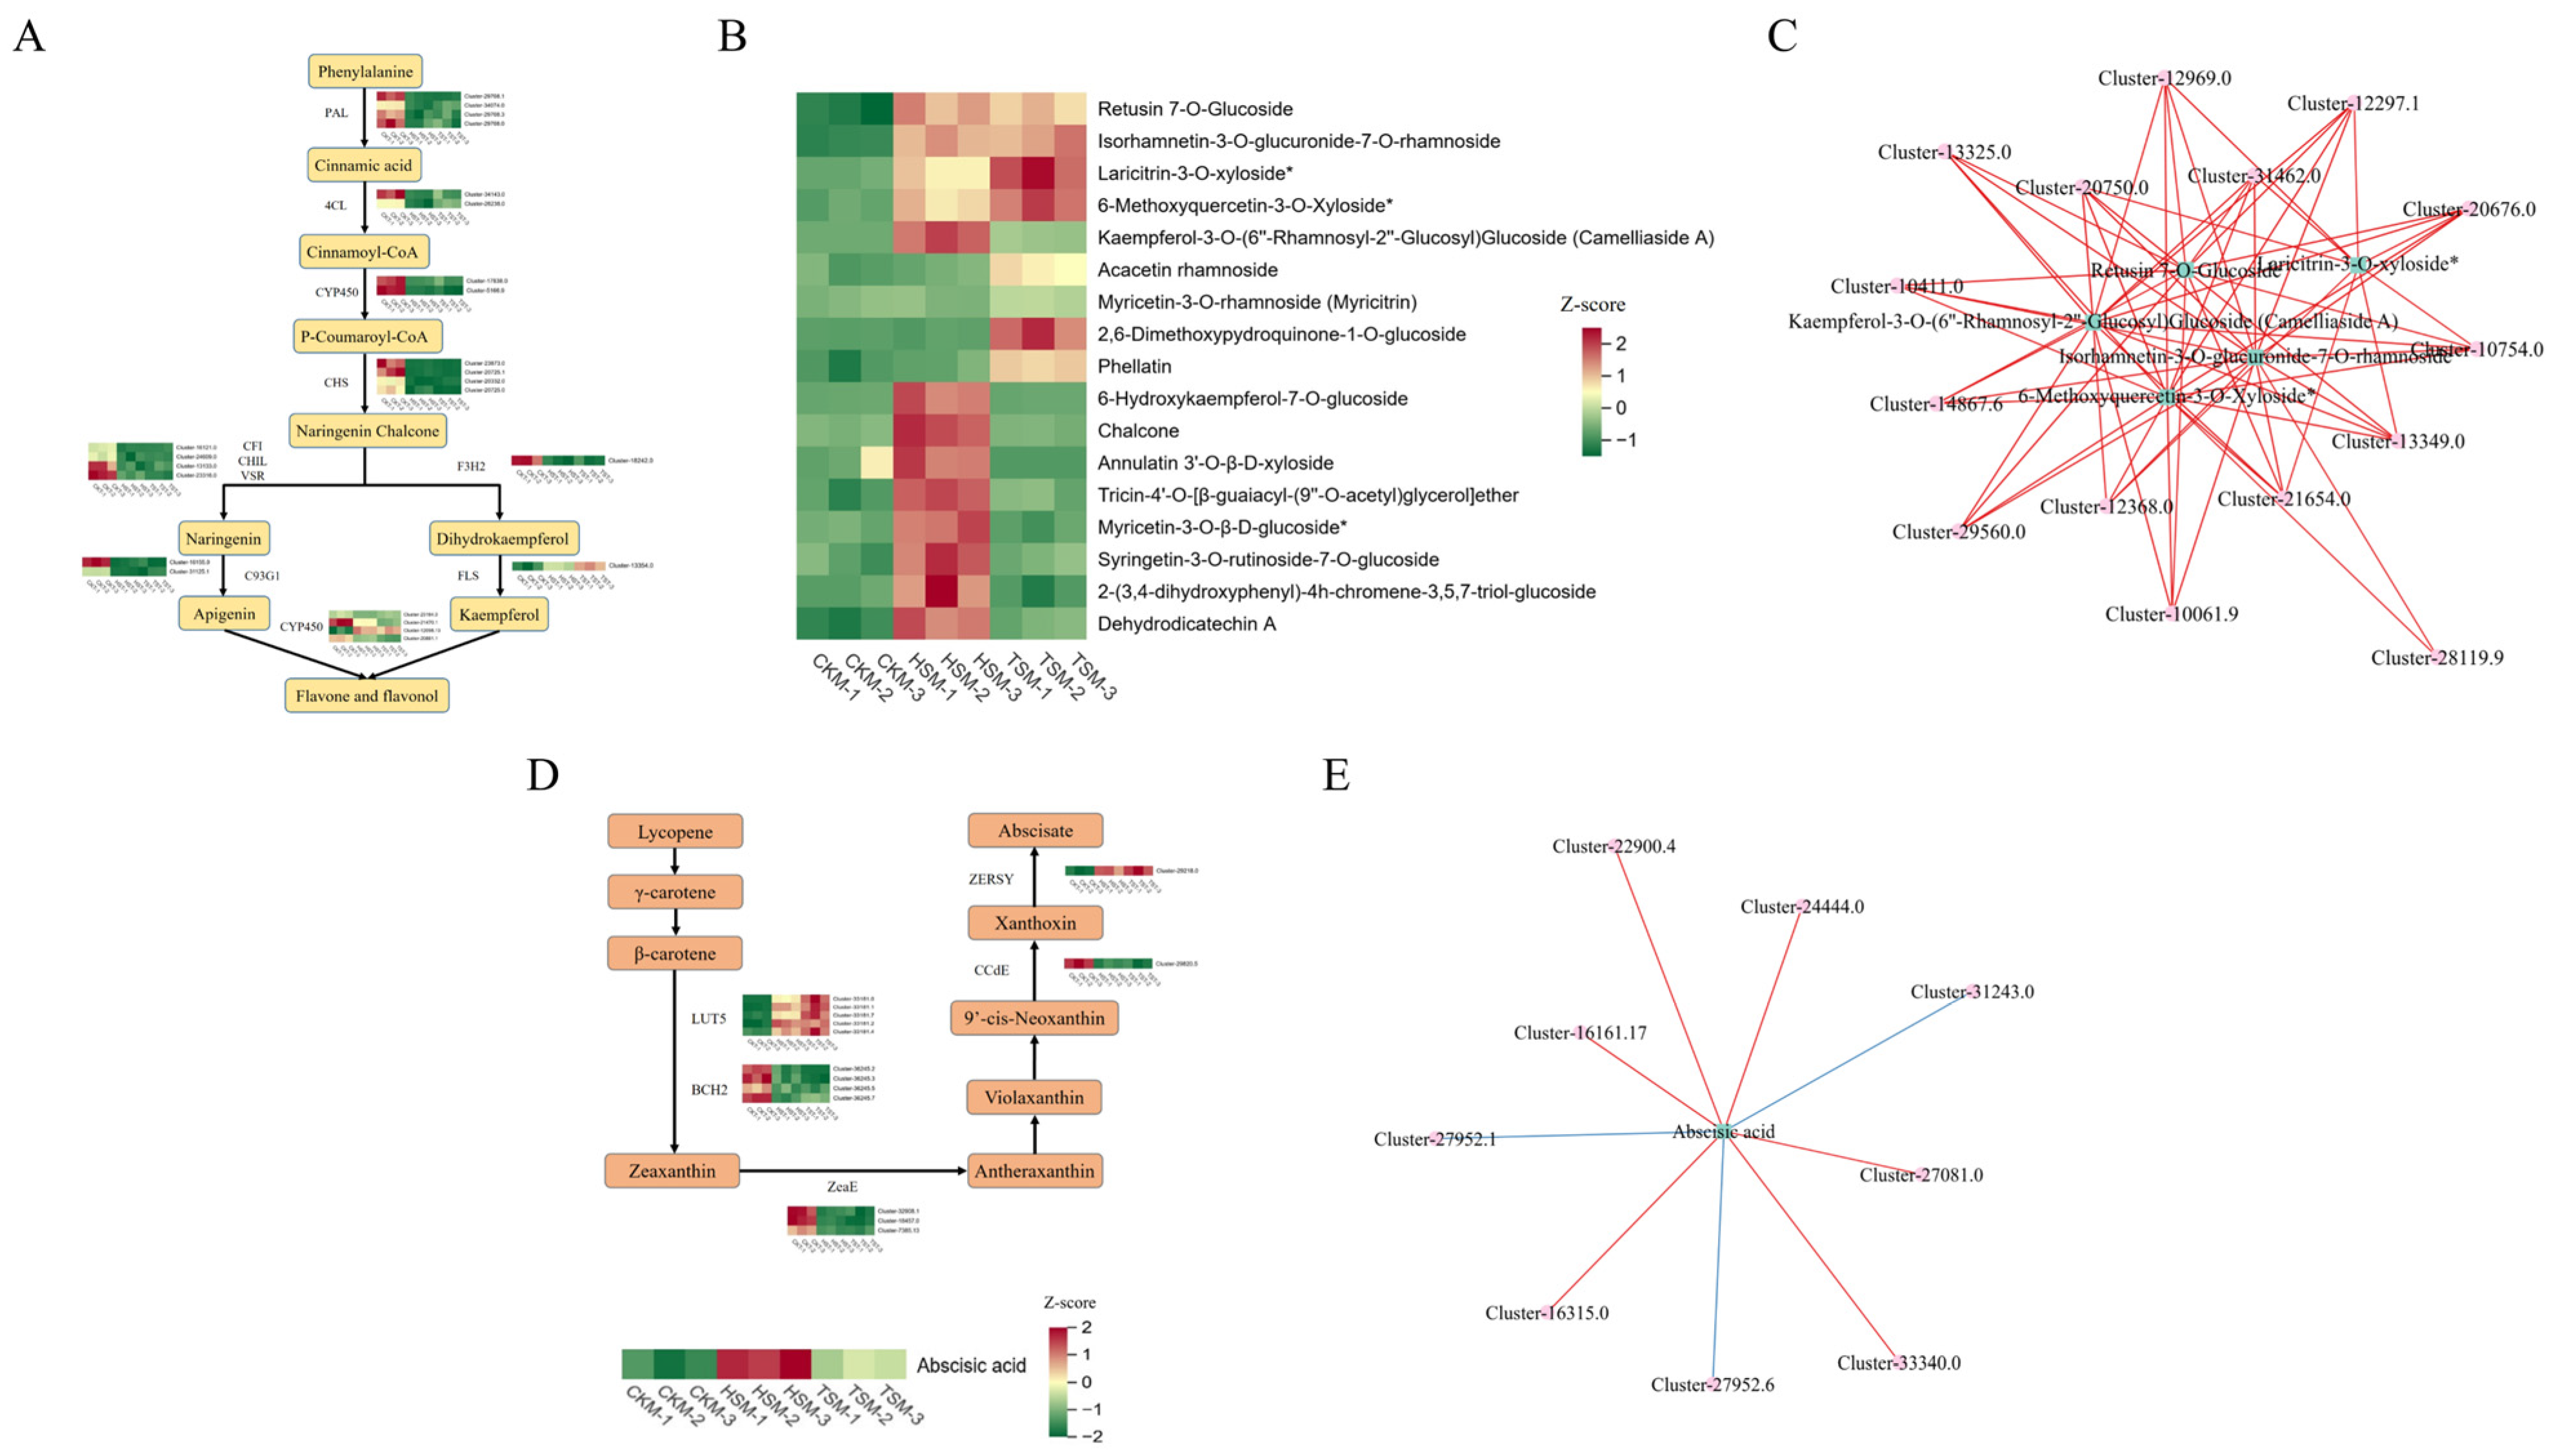
3.7. Combined Transcriptomic and Metabolomic Analyses

The KEGG enrichment analysis bubble plot showed that the DEGs and DAMs were enriched in flavonoid biosynthesis, flavone and flavonol biosynthesis, isoflavonoid biosynthesis, plant hormone signal transduction and carotenoid biosynthesis (Figure 8A,B). There were a total of 88 DEGs (62 upregulated and 26 downregulated) involved in the plant hormone signaling transduction in HST vs. CKT, and a total of 69 DEGs (48 upregulated and 21 downregulated) were in TST vs. CKT. Among the 1869 genes on the Venn plot (Figure 4A), 28 genes related to plant hormone signaling transduction were significantly upregulated due to shading induction, while 10 genes were significantly downregulated. The upregulated genes included four AUX/IAA and one SAUR in the auxin signaling pathway, three bHLH and one GID1 in the gibberellin signaling pathway, one PP2C in the ABA signaling pathway, one SnRK2, one SIMKK and four ABF/bZIP in the ethylene signaling pathway and one CTR1, two EIL/EIN3, six BRI and two BAK1 in the brassinosteroid signaling pathway. The ARR of the cytokinin signaling pathway was downregulated under the HS treatment and upregulated under the TS treatment, respectively. In addition, 21 genes related to plant hormone signaling transduction were identified as significantly upregulated only under the HS treatment (Figure 8D).
The widely targeted metabolomic analysis revealed that the auxin metabolite indole-3-carbaxaldehide was significantly upregulated under both HS and TS treatments. Indole, 3-Indoleacetotrigine, 3-Indoleacrylic acid*, methodyindoleacetic acid, 3-Indolepropionic acid, and 1-Methody-indole-3-acetamide* were significantly upregulated under the HS treatment compared to CK (Figure 8F). To determine the correlation between DAMs and DEGs, the correlation analysis of the metabolome and transcriptome was conducted. The results showed that Cluster-21087.0 and Cluster-33841.0 were positively correlated with the regulation of 3-Indoleacetonitrile, 3-Indoleacrylic acid*, indole, 3-Indoleprotonic acid, methodyindoleacetic acid and 1-Methody-indole-3-acetamide*. Cluster-13421.0, Cluster-5426.0 and Cluster-9031.0 were negatively correlated with the regulation of 3-Indoleacetonitile, 3-Indoleacrylic acid*, indole, 3-Indoleprotonic acid, methodyindoleacetic acid and 1-Methody-indole-3-acetamide*. Cluster-11608.0 and Cluster-21115.0 were also positively correlated with the regulation of 3-Indoleacetonile. Cluster-20300.7, Cluster-21153.0, Cluster-30845.5, Cluster-31462.0, Cluster-32830.1, Cluster-32830.2, Cluster-32924.5, Cluster-33964.0, Cluster-35555.0 and Cluster-5126.0 were positively correlated with the regulation of Indole-3-carboxaldehyde.
The content of ABA was upregulated under shading, and the highest value was observed under the HS treatment. In the carotenoid pathway, β-carotene was gradually transformed into abscisate, through the regulation of beta carotene 3-hydroxylase 2 (BCH2), lutein deficient 5 (LUT5), zeaxanthin epoxidase (ZeaE), carotenoid cleavage dioxygenase 4 (CCdE) and zero bone synthesis (ZERSY) genes (Figure 9D). In the correlation analysis with the transcriptome, it was found that Cluster-16161.17, Cluster-16315.0, Cluster-22900.4, Cluster-24444.0, Cluster-27081.0 and Cluster-33340.0 were positively correlated with the regulation of abscisic acid, and Cluster-27952.1, Cluster-27952.6, and Cluster-31243.0 were negatively correlated with abscisic acid regulation (Figure 9E).
In the flavonoid metabolite synthesis pathway (Figure 9A), phenylalanine ammonia lyase (PAL), 4-coumarite CoA ligase (4CL), cytochrome P450 (CYP450), chalcone synthesis (CHS), chalcone flavone isomerase (CFI), chalcone isomerase like protein (CHIL), vacuum sorting receiver (VSR), flavanone 3-dioxygenase (F3H2), cytochrome P450 93G1 (C93G1) and flavonol synthase (FLS) genes played important regulatory roles. Flavonoids such as retusin 7-O-Glucoside, isorhamnetin-3-O-glucuronide-7-O-rhamnoside, laricitrin-3-O-xyloside* and 6-Methoxyquercetin-3-O-Xyloside* were significantly upregulated compared to CK under the HS and TS treatments. Kaempferol-3-O-(6″-Rhamnosyl-2″-Glucosyl) glucoside (camelliaside A) was significantly upregulated under the HS treatment. Acacitinin rhamnoside, myricetin-3-O-rhamnoside (myricitrin), 2,6-Dimethoxypyridine-1-O-glucose and phelatin were significantly upregulated under the TS treatment. Furthermore, 6-Hydroxykaempferol-7-O-glucoside, chalcone, annulatin 3′-O-β-D-xyloside, tricin 4′-O-[β-guaiacyl-(9″-O-acetyl) glycerol] ether, myricetin-3-O-β-D-glucoside*, syringetin-3-O-rutinoside-7-O-glucoside, 2-(3,4-dihydroxyphenyl)-4h-chromene-3,5,7-triol-glucoside and dehydroditechin A were significantly upregulated under the HS treatment (Figure 9B).
The correlation analysis with the transcriptome data displayed that Cluster-10061.9, Cluster-29560.0, Cluster-14867.6, Cluster-13325.0, Cluster-10411.0, Cluster-10754.0, Cluster-13349.0, Cluster-20676.0, Cluster-31462.0, Cluster-20750.0, Cluster-21654.0, Cluster-12297.1 and Cluster-12969.0 were positively correlated with retusin 7-O-Glucoside, isorhamnetin-3-O-glucuronide-7-O-rhamnoside, 6-Methodquercetin-3-O-Xyloside* and kaempferol-3-O-(6″-Rhamnosyl-2″-Glucosyl) glucoside (Camelliaside A) regulation; Cluster-12368.0 was also positively correlated with kaempferol-3-O-(6″-Rhamnosyl-2″-Glucosyl)Glucoside (Camelliaside A) regulation; Cluster-10754.0, Cluster-13349.0, Cluster-20676.0, Cluster-31462.0, Cluster-20750.0, Cluster-21654.0, Cluster-12297.1, Cluster-12368.0 and Cluster-12969.0 with laricitrin-3-O-xyloside* also showed a positive correlation regulation; and Cluster-28119.9 and Cluster-12368.0 were positively correlated with isorhamnetin-3-O-glucuronide-7-O-rhamnoside and 6-Methodyquercetin-3-O-Xyloside* regulation. In addition, the alkaloids (vanillylamine), vitamins (biotin and nicotinic acid), phenolic acids (coniferin), and lipids (γ-linolenic acid and α-linolenic acid*) and flavonoids (galangin) were also found to be correlated with some genes involved in the KEGG pathway (Figure 8G). However, the detailed metabolic regulatory pathways of these genes and metabolites have not yet been discovered, and further exploration will be needed.

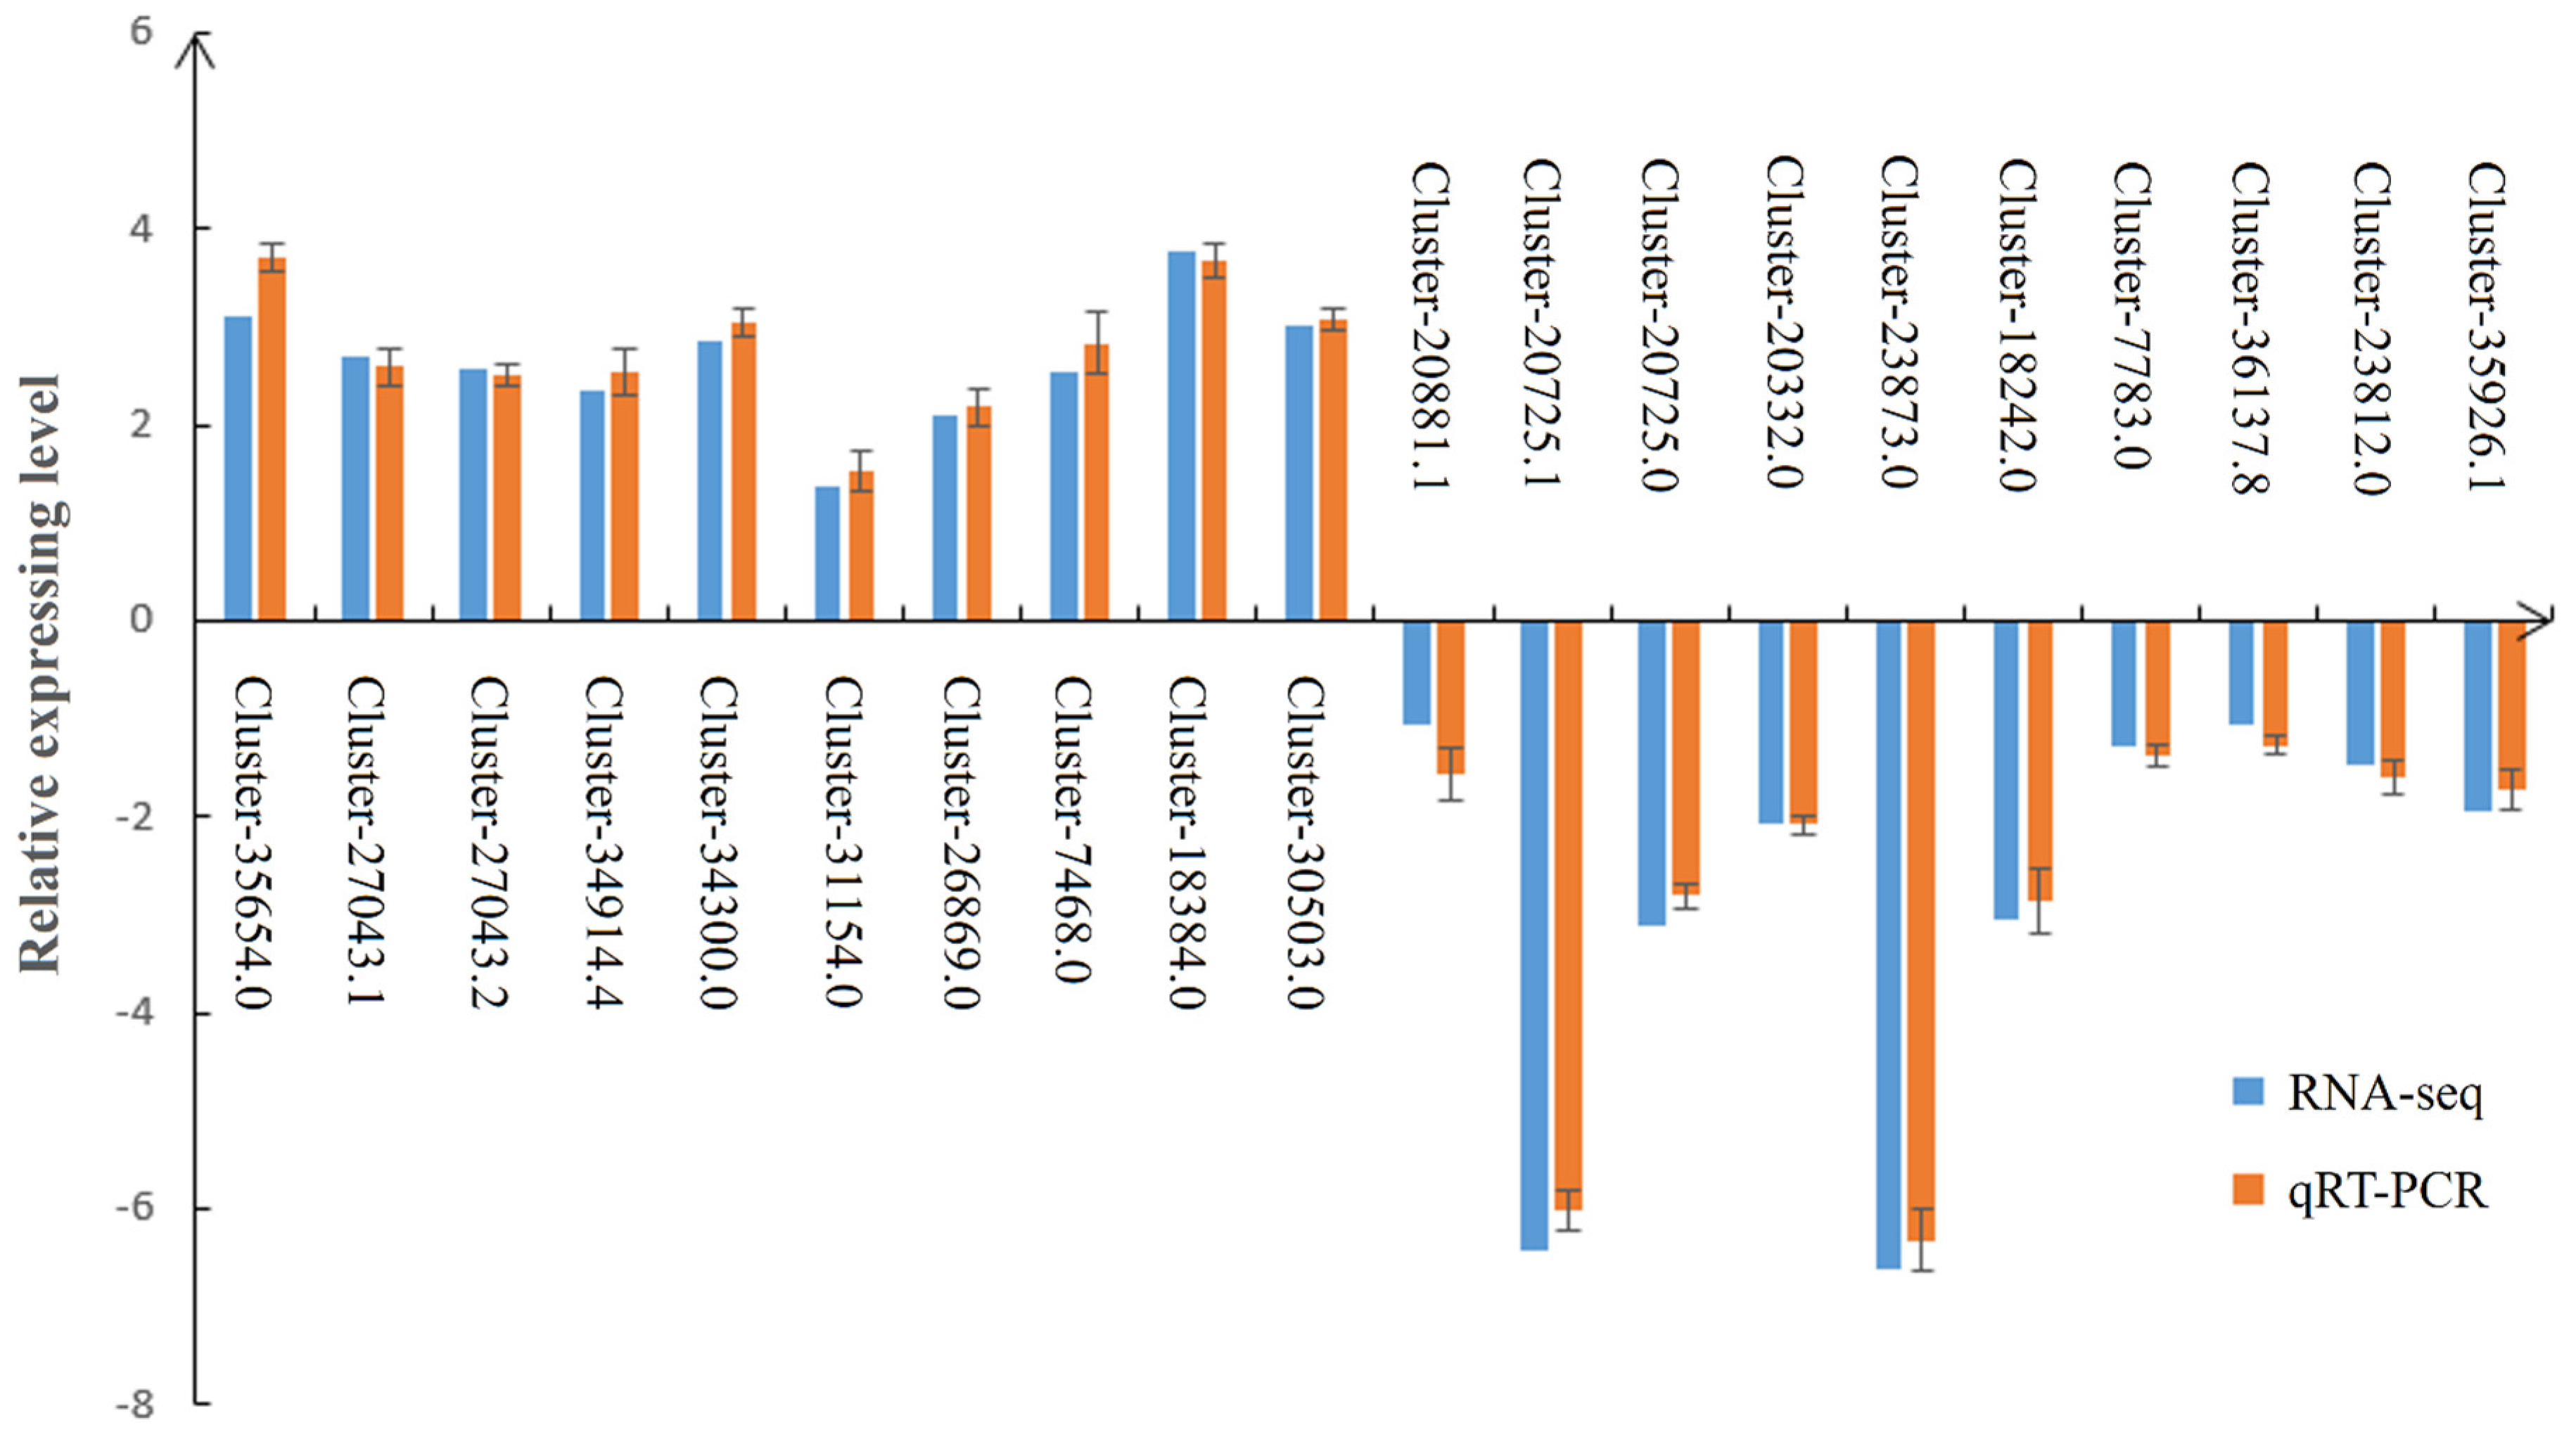
3.8. Expression Validation of RNA-Seq Data by Real-Time PCR (qRT-PCR)

Based on the above analysis, 20 DEGs obtained from RNA-Seq were selected for qRT-PCR analysis that appeared in multiple pathways and had significant differences in expression levels between the TS and CK treatments. The detailed primers used for the qRT-PCR analysis are listed in Supplementary Table S1. The expression levels of these DEGs detected by qRT-PCR were consistent with the FPKM values detected by RNA-Seq (Figure 10). These results confirmed the reliability of the transcriptome analysis data.

4. Discussion

4.1. Effects of Shading on the Physiological Indicators and Photosynthesis of Carex adrienii

In landscape green spaces and urban roads, large amounts of tree planting form shading space [11]. The light supply for plants in these spaces is only 30–80% of the normal light intensity, and about 20–30% of shaded areas are not covered by plants. Shade-enduring plants, due to their inherent characteristics, can grow in shaded environments and provide green materials for these shaded areas [12]. Carex is a type of herbaceous plant with high application value, widely used in various fields, such as landscaping and soil and water conservation. In the intercropping cultivation mode, it is generally used under low-light conditions, which affect the growth, development and survival of plants. Some Carex varieties have specific adaptive responses to shading conditions [13], with plants exhibiting no (or very thin) cuticle layers, large leaf areas, lush leaves, and few stomata and chloroplasts. In our previous research, we found that C. adrienii exhibits strong shade tolerance. In this study, C. adrienii was selected as the experimental material. Subsequently, transcriptome and metabolome sequencing were conducted following shading treatment to explore the molecular mechanisms of shade tolerance in C. adrienii and identify key genes and metabolites involved in its response to shade stress.
Light serves as the primary energy source for plants’ growth and as one of the external signals they perceive. The majority of higher plants are capable of growing under continuously changing light conditions. When light conditions change, plants adjust to shaded environments by modifying the content and composition of pigments [14]. The change in chlorophyll content reflects the ability of plants to absorb light sources in different lighting environments. It is generally believed that the pigment content typically undergoes changes from high to low or from low to high with the extension of shading time, rather than continuously increasing or decreasing, because pigments require an adaptation period to changes in light. It has also been reported that the plants adapt to low-light environments by increasing chlorophyll content to obtain more light sources [15]. Several studies indicate that upon initial placement in shaded environments, plant chlorophyll content may either decrease or remain stable in the short term, subsequently increasing as the duration of shading prolongs [16]. In this study, the total chlorophyll content and chlorophyll a and chlorophyll b content in the TS treatment group were significantly higher than those in the HS treatment group and the CK group. The chlorophyll content gradually increased with the extension of the shading treatment time. This was similar to previous results, which indicated that C. adrienii had strong adaptability to shading and might obtain more light sources by increasing chlorophyll content.
Photosynthetic organisms maximize their photosynthetic activity under low-light conditions through genetic regulation. The different values of Tr and Gs lead to different light compensation points and light saturation points, and drive multiple organs to make up photosynthesis. The shade stress can also cause a balance change in photosynthesis I and II [17]. In walnuts, shade treatment resulted in a decrease in Pn, GS and Tr compared to a control, while the CI level was significantly higher than that of the CK group [18]. Similar results have also been found in Juglans mandshurica [19]. In our study, the Pn, GS, Tr and CI level sof C. adrienii leaves also showed similar changes. Plants convert light energy into chemical energy through a series of reactions, such as electron transfer and water splitting, in photosystem I and photosystem II [20]. In this study, a total of 54 DEGs were identified in the photosynthesis and carbon fixation in photosynthetic organism pathways. There were 10 upregulated genes (Supplementary Figure S3), including Photosystem I reaction center subunit N, cytochrome b6-f complex iron–sulfur subunit, ribulose bisphosphate carboxylase, ribose 5-phosphate isomerase A, fructose-biphosphate aldolase, malate dehydrogenase, NADP+-dependent malic enzyme, ribulose-phosphate 3-epimerase and triosephosphate isomerase, which affect the capture and conversion of light energy in photosynthetic systems I and II [21]. These genes provide strong support for the normal growth and development of C. adrienii under shading conditions. The stress resistance in plants is typically closely linked to the activity of antioxidant enzymes [22]. Under adversity, SOD, CAT, POD and other enzymes coordinate and cooperate with each other to effectively eliminate active oxygen produced during metabolic processes, maintaining low levels of active oxygen in plants and preventing membrane lipid peroxidation and other harmful processes caused by active oxygen [23]. In this experiment, compared with CK, the activity of POD, CAT and SOD in HS and TS significantly increased. Many catalase isozyme genes, peroxidase genes and superoxide dismutase genes in shaded C. adrienii leaves also displayed upregulated expression levels compared to those of the unshaded CK group. This indicated that C. adrienii adapted to low-light conditions by adjusting the activity of antioxidant enzymes.

4.2. Responses of Hormone-Related Pathways to Shading Stress in Carex adrienii

In the process of adapting to the external environment, plants construct complex signal networks, in which plant hormones play important roles. Hormone-related signaling pathways perceive, transduce and integrate environmental signals, leading to corresponding adaptive responses in plants [24]. Meanwhile, plants adjust their architectures to adapt to environmental changes via hormonal regulation. Previous studies have shown that auxin (AUX), gibberellin (GA), cytokinin (CTK), brassinolide (BR) and ethylene played important roles in the responses of plants to shade stress [25]. In this paper, the transcriptome and metabolome analysis of C. adrienii under shaded conditions showed that genes and corresponding metabolites related to hormones were expressed at different levels under low-light conditions. The previous studies have also shown the changes in light signals can directly affect downstream gene expression through PIFs, including genes related to the synthesis of plant hormones, ultimately affecting hormone levels in plants [26]. Under shade conditions, a significant amount of auxin was synthesized in the cotyledons of plants, which was then transported to the hypocotyl and acted on epidermal cells, promoting excessive elongation of the hypocotyl [27]. The changes in light signals under shade conditions promoted an increase in GA content, weakened the inhibitory effect of DELLA protein on growth, and promoted hypocotyl elongation [28]. Ethylene also plays a positive regulatory role in plants’ responses to shading, and the transcription factor EIN3 in the ethylene signaling pathway can promote the expression of PIF3, which regulates the length of hypocotyls [29]. Meanwhile, studies have shown that under shade stress, the content of abscisic acid in leaves was significantly increased [30]. However, as an important hormone regulating abiotic stress, the molecular mechanism of abscisic acid in response to shade stress has not been thoroughly studied. The same situation also occurred in hormones such as CKT [31], salicylic acid and jasmonic acid [32]. Additionally, plant hormones are not solely affected by light signals. They also interact with each other, evolving a singular signaling pathway into a complex signaling network. The low-light environment significantly affected the levels of hormone-related genes and metabolites in C. adrienii, indicating that these hormones play important roles in the adaptation of C. adrienii to low-light environments.

4.3. Induction of Flavonoids in Carex adrienii Leaves Under Shading Conditions

Flavonoids are effective antioxidant substances widely present in plants, participating in plant responses to biotic and abiotic stress, and playing important roles in plant resistance to stress [33]. The results of our study showed that a total of 303 types of flavonoids in nine categories displayed significant changes in C. adrienii leaves under shade. The vast majority of the flavonoids showed a relative decrease in content under shaded conditions; some key genes in the flavonoid pathway, including PAL, 4CL, CYP450, CHS, CFI, CHIL, VSR and F3H2, were significantly differentially expressed in the different treatment groups. This was similar to previous research results, according to which shading greatly reduced the total content of flavonoids in C. adrienii, and changes in lighting conditions could affect the accumulation pattern and amount of flavonoids [34]. However, there were differences in the responses of different flavonoids to light intensity [35]. Research on Camellia sinensis has shown that the decrease in flavonoid glycosides in leaves after shading treatment was greater than that of other flavonoid compounds, and different catechins also had different responses to light [36]. This study confirmed the aforementioned viewpoint, indicating that long-term and short-term shading could lead to varying degrees of increase in flavonoid metabolite content; isorhamnetin-3-O-glucuronide-7-O-rhamnoside, retusin 7-O-Glucoside, laricitrin-3-O-xyloside* and 6-Methoxyquercetin-3-O-Xyloside exhibited heightened contents in both periods, suggesting that these metabolites played significant roles in the adaptation of Camellia sinensis to low light.
In addition, the transcription factor analysis revealed significant changes in the expression levels of MYB and bHLH transcription factors. The biosynthesis of flavonoids was regulated by MYB, which guided flavonoid accumulation by controlling a set of structural genes [37]. The CsMYB4a from Camellia sinensis can negatively regulate the transcription of the structural genes CsC4H, Cs4CL, CsCHS, CsLAR and CsANR2 [38]. Furthermore, flavonoid biosynthesis was regulated by bHLH [39]. CsbHLH62 and CsWRKY57-like can interact with the promoters of CsDFR, CsLAR and CCoAOMT, respectively, and participate in the synthesis regulation of methylated EGCG [40]. The MYB-bHLH-WD40 complex (MBW complex) was involved in the transcriptional regulation of downstream structural genes in the flavonoid biosynthesis pathway, regulating the synthesis of anthocyanidin [41,42]. In our study, MYB and bHLH were the most abundant transcription factor families besides AP2/ERF, with a total of five MYB genes and seven bHLH genes upregulated after shading, playing important roles in both short-term and long-term shading. Additionally, the MYB and bHLH transcription factors exhibited varying expression levels under different shading conditions, aligning with other research findings [43].
Research has shown that flavonoids have potential protective effects on plants under environmental stress. An increase in flavonoid content can enhance a plant’s tolerance to cold and salt stress [44,45]. Flavonoids have been recognized as having multiple functions in photoprotection. In addition, the accumulation of flavonoids varied with the degree and duration of stress [46]. It can be seen that the accumulation of flavonoids may enhance shade tolerance under low-light conditions. Therefore, flavonoids play extremely critical roles in the shading stress response of C. adrienii.

5. Conclusions

In summary, the conjoined analysis of transcriptome metabolism data helped us to explore metabolic regulatory networks and laid the foundation for understanding the adaptability of Carex to low-lighting conditions. The shading conditions led to changes in chlorophyll and hormone substances, as well as the accumulation of flavonoids in C. adrienii, both of which were achieved by regulating genes involved in photosynthesis and flavonoid biosynthesis molecular networks. Research into the shade responses of C. adrienii offers a theoretical foundation for its cultivation and application in low-light environments. In addition, this work also provided insights into the regulatory functions of some genes in shade tolerance, which will be beneficial for further exploration of gene function in Carex.

Supplementary Materials

The following supporting information can be downloaded at: https://www.mdpi.com/article/10.3390/agronomy14122800/s1, Figure S1: Shade setup conditions for Carex adrienii; Figure S2: Data quality control; Figure S3: The heatmap of 10 upregulated genes identified in the photosynthesis and carbon fixation in photosynthetic organism pathways; Figure S4: Asexual reproduction of Carex germplasm resources; Table S1: Primer sequences used for qRT-PCR; Table S2: Meteorological data during the experimental execution period.

Author Contributions

Conceptualization, T.G.; Data curation, S.C. and S.Z.; Formal analysis, X.L. and Z.T. (Zhijian Tan); Funding acquisition, L.A. and S.S.; Methodology, S.W. (Shumin Wang); Project administration, L.A. and S.S.; Resources, Z.T. (Zhong Tian); Software, X.L. and Z.T. (Zhijian Tan); Validation, J.W.; Writing—original draft, T.G. and S.W. (Shumin Wang); Writing—review and editing, S.W. (Sheng Wang). All authors have read and agreed to the published version of the manuscript.

Funding

This research was funded by Incentive and Guidance Special Project of Scientific Research Institution, Chongqing Science and Technology Committee (cstc2022jxjl80019), Chongqing Urban Management Research Project (2021-39) and Special support for Chongqing Postdoctoral Research Project (2021XM3086).

Data Availability Statement

The raw data from RNA-seq were stored in NCBI (PRJNA1140402).

Conflicts of Interest

The authors declare no conflicts of interest.

References

  1. Wu, Z.; Man, W.; Ren, Y. Influence of tree coverage and micro-topography on the thermal environment within and beyond a green space. Agric. For. Meteorol. 2022, 316, 108846. [Google Scholar] [CrossRef]
  2. Cerqueira, A.F.; Rocha-Santos, L.; Benchimol, M.; Mielke, M.S. Habitat loss and canopy openness mediate leaf trait plasticity of an endangered palm in the Brazilian Atlantic Forest. Oecologia 2021, 196, 619–631. [Google Scholar] [CrossRef] [PubMed]
  3. Tucker, G.F.; Maguire, D.A.; Tupinambá Simões, F. Associations between shade tolerance and wood specific gravity for conifers in contrast to angiosperm trees: Foundations of the conifer fitness-enhancing shade tolerance hypothesis. Plant-Environ. Interact. 2024, 5, e10131. [Google Scholar] [CrossRef]
  4. Valladares, F.; Niinemets, U. Shade tolerance, a key plant feature of complex nature and consequences. Annu. Rev. Ecol. Evol. Syst. 2008, 39, 237–257. [Google Scholar] [CrossRef]
  5. Lyu, X.; Mu, R.; Liu, B. Shade avoidance syndrome in soybean and ideotype toward shade tolerance. Mol. Breed. 2023, 43, 31. [Google Scholar] [CrossRef]
  6. Li, Z.; Zhao, T.; Liu, J.; Li, H.; Liu, B. Shade-induced leaf senescence in plants. Plants 2023, 12, 1550. [Google Scholar] [CrossRef]
  7. Tang, W.; Chen, C.; Zhang, Y.; Chu, Y.; Yang, W.; Cui, Y.; Gong, R. Effect of low-light stress on sugar and acid accumulation during fruit development and ripening of sweet cherry. Horticulturae 2023, 9, 654. [Google Scholar] [CrossRef]
  8. Hu, Z.; Yao, X.; Chen, H.; Li, F.; Zhao, H.; Tang, H.; Lu, L. Changes and dynamics of the main quality components in tea leaves of 4 tea cultivars during the shading process. Sci. Hortic. 2024, 333, 113242. [Google Scholar] [CrossRef]
  9. Shokoya, G.; Fontanier, C.; Martin, D.L.; Dunn, B.L. Evaluation of sedges and nimblewill as low-input, shaded Lawns in Oklahoma, USA. HortTechnology 2022, 32, 567–577. [Google Scholar] [CrossRef]
  10. Arnon, D.I. Copper Enzymes in Isolated Chloroplasts. Polyphenoloxidase in Beta vulgaris. Plant Physiol. 1949, 24, 1–15. [Google Scholar] [CrossRef]
  11. Tabatabaie, S.; Litt, J.S.; Muller, B.H.F. Sidewalks, trees and shade matter: A visual landscape assessment approach to understanding people’s preferences for walking. Urban For. Urban Green. 2023, 84, 127931. [Google Scholar] [CrossRef]
  12. Yu, Q.; Ji, W.; Pu, R.; Landry, S.; Acheampong, M.; O’Neil-Dunne, J.; Tanim, S.H. A preliminary exploration of the cooling effect of tree shade in urban landscapes. Int. J. Appl. Earth Obs. Geoinf. 2020, 92, 102161. [Google Scholar] [CrossRef]
  13. Zhang, C.T.; Zhu, X.L.; Cai, K.F.; Yu, Y.G. Evaluation of shade tolerance of Carex species available for garden-environment planting. J. Beijing For. Univ. 2010, 32, 207–212. [Google Scholar]
  14. Jung, C.; Arar, M. Natural vs. Artificial Light: A study on the influence of light source on chlorophyll content and photosynthetic rates on indoor Plants. Buildings 2023, 13, 1482. [Google Scholar] [CrossRef]
  15. Fatemeh, I.; Katja, F.; Soltani, F.; Baldermann, S. Effects of Shading on Plant Growth, Chlorophylls and carotenoids in florets of differently coloured cauliflowers (Brassica oleracea L. ssp. botrytis). Lebensmittelchemie 2021, 75, S1–S61. [Google Scholar] [CrossRef]
  16. Hayashi, A.; Sonobe, R.; Sano, T.; Horie, H. Estimating leaf chlorophyll content of shade grown tea based on PROSPECT model inversion. J. Jpn. Soc. Photogramm. Remote Sens. 2019, 58, 260–264. [Google Scholar] [CrossRef]
  17. Casal, J.J. Photoreceptor signaling networks in plant responses to shade. Annu. Rev. Plant Biol. 2013, 64, 403–427. [Google Scholar] [CrossRef]
  18. Liang, M.; Dong, Q.; Zhang, X.; Liu, Y.; Li, H.; Guo, S.; Qi, G. Metabolomics and transcriptomics analyses reveals the molecular regulatory mechanisms of Walnut (Juglans regia L.) Embryos in response to shade treatment. Int. J. Mol. Sci. 2023, 24, 10871. [Google Scholar] [CrossRef]
  19. Zhang, X.; Li, Y.; Yan, H.; Cai, K.; Li, H.; Wu, Z.; Zhao, X. Integrated metabolomic and transcriptomic analyses reveal different metabolite biosynthesis profiles of Juglans mandshurica in shade. Front. Plant Sci. 2022, 13, 991874. [Google Scholar] [CrossRef]
  20. Bernal-Bayard, P.; Pallara, C.; Carmen Castell, M.; Molina-Heredia, F.P.; Fernández-Recio, J.; Hervás, M.; Navarro, J.A. Interaction of photosystem I from Phaeodactylum tricornutum with plastocyanins as compared with its native cytochrome c6: Reunion with a lost donor. Biochim. Biophys. Acta 2015, 1847, 1549–1559. [Google Scholar] [CrossRef]
  21. Alboresi, A.; Le Quiniou, C.; Yadav, S.K.N.; Scholz, M.; Meneghesso, A.; Gerotto, C.; Morosinotto, T. Conservation of core complex subunits shaped the structure and function of photosystem I in the secondary endosymbiont alga Nannochloropsis gaditana. New Phytol. 2017, 213, 714–726. [Google Scholar] [CrossRef] [PubMed]
  22. Bela, K.; Horváth, E.; Gallé, Á.; Szabados, L.; Tari, I.; Csiszár, J. Plant glutathione peroxidases: Emerging role of the antioxidant enzymes in plant development and stress responses. J. Plant Physiol. 2015, 176, 192–201. [Google Scholar] [CrossRef] [PubMed]
  23. Møller, I.M.; Jensen, P.E.; Hansson, A. Oxidative modifications to cellular components in plants. Annu. Rev. Plant Biol. 2007, 58, 459–481. [Google Scholar] [CrossRef] [PubMed]
  24. Finlayson, S.A.; Krishnareddy, S.R.; Kebrom, T.H.; Casal, J.J. Phytochrome regulation of branching in Arabidopsis. Plant Physiol. 2010, 152, 1914–1927. [Google Scholar] [CrossRef]
  25. Stamm, P.; Kumar, P.P. Phytohormone signal network regulating elongation growth during shade avoidance. J. Exp. Bot. 2010, 61, 2889–2903. [Google Scholar] [CrossRef]
  26. Li, G.; Kazmi, A.; Feng, M.; Hou, H. Phytochrome-interacting factors (PIFs) regulate phytohormone-mediated plant environmental adaptation. Environ. Exp. Bot. 2024, 218, 105610. [Google Scholar] [CrossRef]
  27. Procko, C.; Burko, Y.; Jaillais, Y.; Ljung, K.; Long, J.A.; Chory, J.; Sveriges, L. The epidermis coordinates auxin-induced stem growth in response to shade. Genes Dev. 2016, 30, 1529–1541. [Google Scholar] [CrossRef]
  28. Zhao, Q.P.; Zhu, J.D.; Li, N.N.; Wang, X.N.; Zhao, X.; Zhang, X. Cryptochrome-mediated hypocotyl phototropism was regulated antagonistically by gibberellic acid and sucrose in Arabidopsis. J. Integr. Plant Biol. 2020, 62, 614–630. [Google Scholar] [CrossRef]
  29. Pierik, R.; Djakovic-Petrovic, T.; Keuskamp, D.H.; de Wit, M.; Voesenek, L.A.C.J. Auxin and ethylene regulate elongation responses to neighbor proximity signals independent of gibberellin and DELLA proteins in Arabidopsis. Plant Physiol. 2009, 149, 1701–1712. [Google Scholar] [CrossRef]
  30. Kim, B.B.; Brownlee, S.N.; Grant, J.S.; Cannon, A.B. Gene expression characteristics in response to abscisic acid under shade. Plant Mol. Biol. Report. 2022, 40, 43–67. [Google Scholar] [CrossRef]
  31. Panigrahy, M.; Ranga, A.; Das, J.; Panigrahi, K.C.S. Shade tolerance in Swarnaprabha rice is associated with higher rate of panicle emergence and positively regulated by genes of ethylene and cytokinin pathway. Sci. Rep. 2019, 9, 6817. [Google Scholar] [CrossRef] [PubMed]
  32. Sun, Y.; Zheng, Y.; Yao, H.; Ma, Z.; Xiao, M.; Wang, H.; Liu, Y. Light and jasmonic acid coordinately regulate the phosphate responses under shade and phosphate starvation conditions in Arabidopsis. Plant Direct 2023, 7, e504. [Google Scholar] [CrossRef] [PubMed]
  33. Wang, M.; Zhang, Y.; Zhu, C.; Yao, X.; Zheng, Z.; Tian, Z.; Cai, X. EkFLS overexpression promotes flavonoid accumulation and abiotic stress tolerance in plant. Physiol. Plant. 2021, 172, 1966–1982. [Google Scholar] [CrossRef] [PubMed]
  34. Jaakola, L.; Hohtola, A. Effect of latitude on flavonoid biosynthesis in plants. Plant Cell Environ. 2010, 33, 1239–1247. [Google Scholar] [CrossRef]
  35. Zhao, X.; Zeng, X.; Lin, N.; Yu, S.; Fernie, A.R.; Zhao, J. CsbZIP1-CsMYB12 mediates the production of bitter-tasting flavonols in tea plants (Camellia sinensis) through a coordinated activator-repressor network. Hortic. Res. 2021, 8, 110. [Google Scholar] [CrossRef]
  36. Wang, Y.; Gao, L.; Shan, Y.; Liu, Y.; Tian, Y.; Xia, T. Influence of shade on flavonoid biosynthesis in tea (Camellia sinensis (L.) O. Kuntze). Sci. Hortic. 2012, 141, 7–16. [Google Scholar] [CrossRef]
  37. Yan, H.; Pei, X.; Zhang, H.; Li, X.; Zhang, X.; Zhao, M.; Zhao, X. MYB-Mediated Regulation of Anthocyanin Biosynthesis. Int. J. Mol. Sci. 2021, 22, 3103. [Google Scholar] [CrossRef]
  38. Li, M.; Li, Y.; Guo, L.; Gong, N.; Pang, Y.; Jiang, W.; Xia, T. Functional characterization of tea (Camellia sinensis) MYB4a transcription factor using an integrative approach. Front. Plant Sci. 2017, 8, 943. [Google Scholar] [CrossRef]
  39. Li, M.; Sun, L.; Gu, H.; Cheng, D.; Guo, X.; Chen, R.; Chen, J. Genome-wide characterization and analysis of bHLH transcription factors related to anthocyanin biosynthesis in spine grapes (Vitis davidii). Sci. Rep. 2021, 11, 6863. [Google Scholar] [CrossRef]
  40. Luo, Y.; Yu, S.; Li, J.; Li, Q.; Wang, K.; Huang, J.; Liu, Z. Characterization of the transcriptional regulator CsbHLH62 that negatively regulates EGCG3” Me biosynthesis in Camellia sinensis. Gene 2019, 699, 8–15. [Google Scholar] [CrossRef]
  41. Li, P.; Xia, E.; Fu, J.; Xu, Y.; Zhao, X.; Tong, W.; Zhao, J. Diverse roles of MYB transcription factors in regulating secondary metabolite biosynthesis, shoot development, and stress responses in tea plants (Camellia sinensis). Plant J. For. Cell Mol. Biol. 2022, 110, 1144–1165. [Google Scholar] [CrossRef] [PubMed]
  42. Xu, W.; Dubos, C.; Lepiniec, L. Transcriptional control of flavonoid biosynthesis by MYB-bHLH-WDR complexes. Trends Plant Sci. 2015, 20, 176–185. [Google Scholar] [CrossRef] [PubMed]
  43. Xu, W.; Grain, D.; Bobet, S.; Le Gourrierec, J.; Thévenin, J.; Kelemen, Z.; Dubos, C. Complexity and robustness of the flavonoid transcriptional regulatory network revealed by comprehensive analyses of MYB-bHLH-WDR complexes and their targets in Arabidopsis seed. New Phytol. 2014, 202, 132–144. [Google Scholar] [CrossRef]
  44. Schulz, E.; Tohge, T.; Winkler, J.B.; Albert, A.; Schäffner, A.R.; Fernie, A.R.; Hincha, D.K. Natural variation among Arabidopsis accessions in the regulation of flavonoid metabolism and stress gene expression by combined UV radiation and cold. Plant Cell Physiol. 2021, 62, 502–514. [Google Scholar] [CrossRef]
  45. Yastreb, T.O.; Kolupaev, Y.E.; Lugovaya, A.A.; Dmitriev, A.P. Content of osmolytes and flavonoids under salt stress in Arabidopsis thaliana plants defective in jasmonate signaling. Appl. Biochem. Microbiol. 2016, 52, 210–215. [Google Scholar] [CrossRef]
  46. Fini, A.; Brunetti, C.; Di Ferdinando, M.; Ferrini, F.; Tattini, M. Stress-induced flavonoid biosynthesis and the antioxidant machinery of plants. Plant Signal. Behav. 2011, 6, 709–711. [Google Scholar] [CrossRef]
Figure 1. Physiological and photosynthetic characteristics of Carex adrienii leaves under shading. (A) The content of chlorophyll a, chlorophyll b, total carotenoid and total chlorophyll. (B) The activity of superoxide dismutase (SOD), peroxidase (POD) and catalase (CAT) in leaves. (C) The net photosynthesis rate (Pn) of C. adrienii leaves in the shade and control group (CK) groups. (D) The stomatal conductance (Gs) of C. adrienii leaves. (E) The intercellular CO2 concentra-tion (Ci) of C. adrienii leaves. (F) The transpiration rate (Tr) of C. adrienii leaves. * represents significant differences at p < 0.05.
Agronomy 14 02800 g001
Figure 2. Analysis of differentially expressed genes (DEGs) of shaded C. adrienii. (A) The volcano map of DEGs in HST vs. CKT. Each dot represents one gene, with green dots representing downregulated DEGs, red dots representing upregulated DEGs, and gray dots representing insignificant expressed genes. (B) The DEGs classification in HST vs. CKT. (C) KEGG enrichment analysis of DEGs in HST vs. CKT. (D) The volcano map of DEGs in TST vs. CKT. (E) The DEGs classification in TST vs. CKT. (F) KEGG enrichment analysis of DEGs in TST vs. CKT. The red boxes highlight some relevant pathways for studied.
Agronomy 14 02800 g002
Figure 3. GO enrichment analysis of DEGs. (A) GO analysis enriched pathway of DEGs in HST vs. CKT. The red boxes highlight the antioxidant regulatory pathway of DEGs enrichment. (B) GO enrichment chord plot of DEGs in HST vs. CKT. The red boxes highlight the DEGs of antioxidant regulatory pathway. (C) GO analysis enriched pathway of DEGs in TST vs. CKT. The red boxes highlight the antioxidant regulatory pathway of DEGs enrichment. (D) GO enrichment chord plot of DEGs in TST vs. CKT. The red boxes highlight the DEGs of antioxidant regulatory pathway. On the right side of the chord plot are the 9 most significantly enriched pathways, and on the left are the 10 genes with the highest multiples of differences in each pathway. The line represents the correspondence between pathways and genes.
Agronomy 14 02800 g003
Figure 4. Transcription factor identification in the intersection of DEGs. (A) Venn diagram of DEGs in shade and CK groups. (B) KEGG enrichment analysis of 1869 DEGs. (C) Classification of transcription factors in 1869 DEGs. (D) Heatmap of the differentially expressed transcription factors.
Agronomy 14 02800 g004
Figure 5. Heatmap of DEGs involved in photosynthesis and flavonoids biosynthesis. (A) Carotenoid-related genes. (B) Photosynthesis-related genes. (C) Circadian-rhythm-related genes. (D) Flavonoid-biosynthesis-related genes. (E) Flavone- and flavonol-biosynthesis-related genes. (F) Isoflavonoid-biosynthesis-related genes.
Agronomy 14 02800 g005
Figure 6. Analysis of metabolome sequencing between shaded and CK groups. (A) Circular diagram of metabolite category composition. (B) Volcano plot of differential accumulated metabolites (DAMs) in HSM vs. CKM, red dots representing upregulated DAMs, green dots representing downregulated DAMs and gray dots representing insignificant DAMs. (C) Volcano plot of DAMs in TSM vs. CKM. (D) Scatter plot of DAMs in HSM vs. CKM. (E) KEGG enrichment pathway of DAMs in HSM vs. CKM. (F) Dynamic distribution map of differences in metabolite content in HSM vs. CKM, red dots representing the top 10 substances upregulated and green dots representing the top 10 substances downregulated. (G) Scatter plot of DAMs in TSM vs. CKM. (H) KEGG enrichment pathway of DAMs in TSM vs. CKM. (I) Dynamic distribution map of differences in metabolite content in TSM vs. CKM.
Agronomy 14 02800 g006
Figure 7. Analysis of DAMs in the intersection of HSM vs. CKM and TSM vs. CKM. (A) Venn diagram of DAMs in shaded groups vs. control groups. (B) KEGG enrichment analysis of 334 DAMs. (C) Heatmap of DAMs involved in amino acids and derivatives. (D) Heatmap of DAMs involved in phenolic acids. (E) Heatmap of DAMs involved in flavonoids. (F) Heatmap of DAMs involved in Lignans and Coumarins.
Agronomy 14 02800 g007
Figure 8. Integrated analysis between transcriptomic and metabolomes. (A) KEGG enrichment analysis bubble plot in HS vs. CK. (B) KEGG enrichment analysis bubble plot in TS vs. CK. (C) Plant hormone signal transduction pathway (D) The heatmap of gene expression upregulated only under HS treatment in the DEGs related to plant hormone signal transduction pathways. (E) The heatmap of DEGs related to plant hormone signal transduction pathways in 1869 DEGs in Figure 4A. (F) Heatmap analysis of metabolites related to the plant auxin metabolic pathway, as well as alkaloids (vanillylamine), vitamins (biotin and nicotinic acid), flavonoids (galangin), phenolic acids (coniferin) and lipids (γ-linolenic acid and α-linolenic acid*). (G) Correlation Network Diagram for metabolites in F and some DEGs. Genes in figure: Cluster-21087.0 and Cluster-21115.0, AUX/IAA; Cluster-33841.0, disease resistance protein RPH8A; Cluster-13421.0, indole-3-pyruvate monooxygenase; Cluster-5426.0, Cluster-30845.5 and Cluster-11608.0, cytochrome P450; Cluster-9031.0, aldehyde dehydrogenase; Cluster-20300.7, GARP; Cluster-21153.0, peroxidase; Cluster-31462.0, C3H; Cluster-32830.1 and Cluster-32830.2, catalase; Cluster-32924.5, bZIP; Cluster-33964.0, MYB; Cluster-35555.0, bHLH; Cluster-5126.0, SAUR32-like; Cluster-21153.0, Cluster-21021.1, Cluster-22798.0, Cluster-18269.0 and Cluster-35654.0, peroxidase; Cluster-28031.0, protochlorophyllide reductase; Cluster-15196.0, glycosyl hydrolases; Cluster-28119.11, MYB; Cluster-8352.0, Photosystem I reaction center subunit N; Cluster-13690.0 and Cluster-23184.0, flavonoid 3′,5′-hydroxylase 1; Cluster-31125.1, cytochrome P450 93A2-like protein; Cluster-24512.0, hexokinase; Cluster-29109.0, polyamine oxidase-like protein; Cluster-32943.0, cytochrome P450; Cluster-27043.2, Cluster-27043.3, Cluster-27043.5, Cluster-32830.1 and Cluster-32830.6, catalase; Cluster-27065.3, AUX/IAA; Cluster-30054.0, sucrose synthase; Cluster-6280.0, alpha-trehalose-phosphate synthase.
Agronomy 14 02800 g008
Figure 9. Integrated analysis of transcriptome and metabolome in the flavonoid and carotenoid biosynthetic pathways. (A) The expression of genes in the flavonoid biosynthetic pathways of C. adrienii under shade. (B) The heatmap of all upregulated flavonoids in 334 intersection DAMs. (C) Correlation Network Diagram between 5 metabolites in B and some DEGs. These 5 metabolites showed upregulated levels compared to CK under HS and TS treatment. (D) The expression of genes in the carotenoid biosynthetic pathways of C. adrienii under shade, and the heatmap of ABA content. (E) Correlation Network Diagram for ABA and some DEGs. Genes in figure: Cluster-10061.9, cytochrome P450; Cluster-29560.0, bZIP; Cluster-14867.6, MADS; Cluster-13325.0, C2H2; Cluster-10411.0, ERF; Cluster-10754.0, bHLH; Cluster-13349.0, NAC; Cluster-20676.0, MYB; Cluster-31462.0, C3H; Cluster-20750.0, Dof; Cluster-21654.0, AUX/IAA; Cluster-12297.1, EIL; Cluster-12969.0, zf-HD; Cluster-28119.9, GARP; Cluster-12368.0, RAV; Cluster-16161.17, GRAS; Cluster-16315.0, salt-tolerance-like protein; Cluster-22900.4, cytochrome P450; Cluster-24444.0, glycosyltransferase family 92; Cluster-27081.0, B3; Cluster-33340.0, peroxidase; Cluster-27952.1 and Cluster-27952.6, starch synthase IIa-2; Cluster-31243.0, catalase.
Agronomy 14 02800 g009
Figure 10. qRT-PCR validation of 20 C. adrienii DEGs. Cluster-35654.0, peroxidase; Cluster-27043.1 and Cluster-27043.2, catalase; Cluster-34914.4, superoxide dismutase; Cluster-34300.0 and Cluster-18384.0, bHLH; Cluster-31154.0, phytochrome B; Cluster-26869.0, TCP8; Cluster-7468.0, TCP14; Cluster-30503.0, anthocyanidin reductase; Cluster-20881.1, flavonoid 3′-hydroxylase; Cluster-20725.1, Cluster-20725.0, Cluster-20332.0 and Cluster-23873.0, chalcone synthase 1; Cluster-18242.0, flavanone 3-dioxygenase; Cluster-7783.0, psbQ-like protein; Cluster-36137.8, photosynthetic NDH subunit; Cluster-23812.0, photosystem I psaA/psaB protein; Cluster-35926.1, chlorophyll a-b binding protein.
Agronomy 14 02800 g010
Disclaimer/Publisher’s Note: The statements, opinions and data contained in all publications are solely those of the individual author(s) and contributor(s) and not of MDPI and/or the editor(s). MDPI and/or the editor(s) disclaim responsibility for any injury to people or property resulting from any ideas, methods, instructions or products referred to in the content.

