Effect of Cytoplasm Types T and D on Quantitative Trait Loci for Chip Color and Proline Content in Potato Tubers in a Diploid Potato Population
Abstract
1. Introduction
2. Materials and Methods
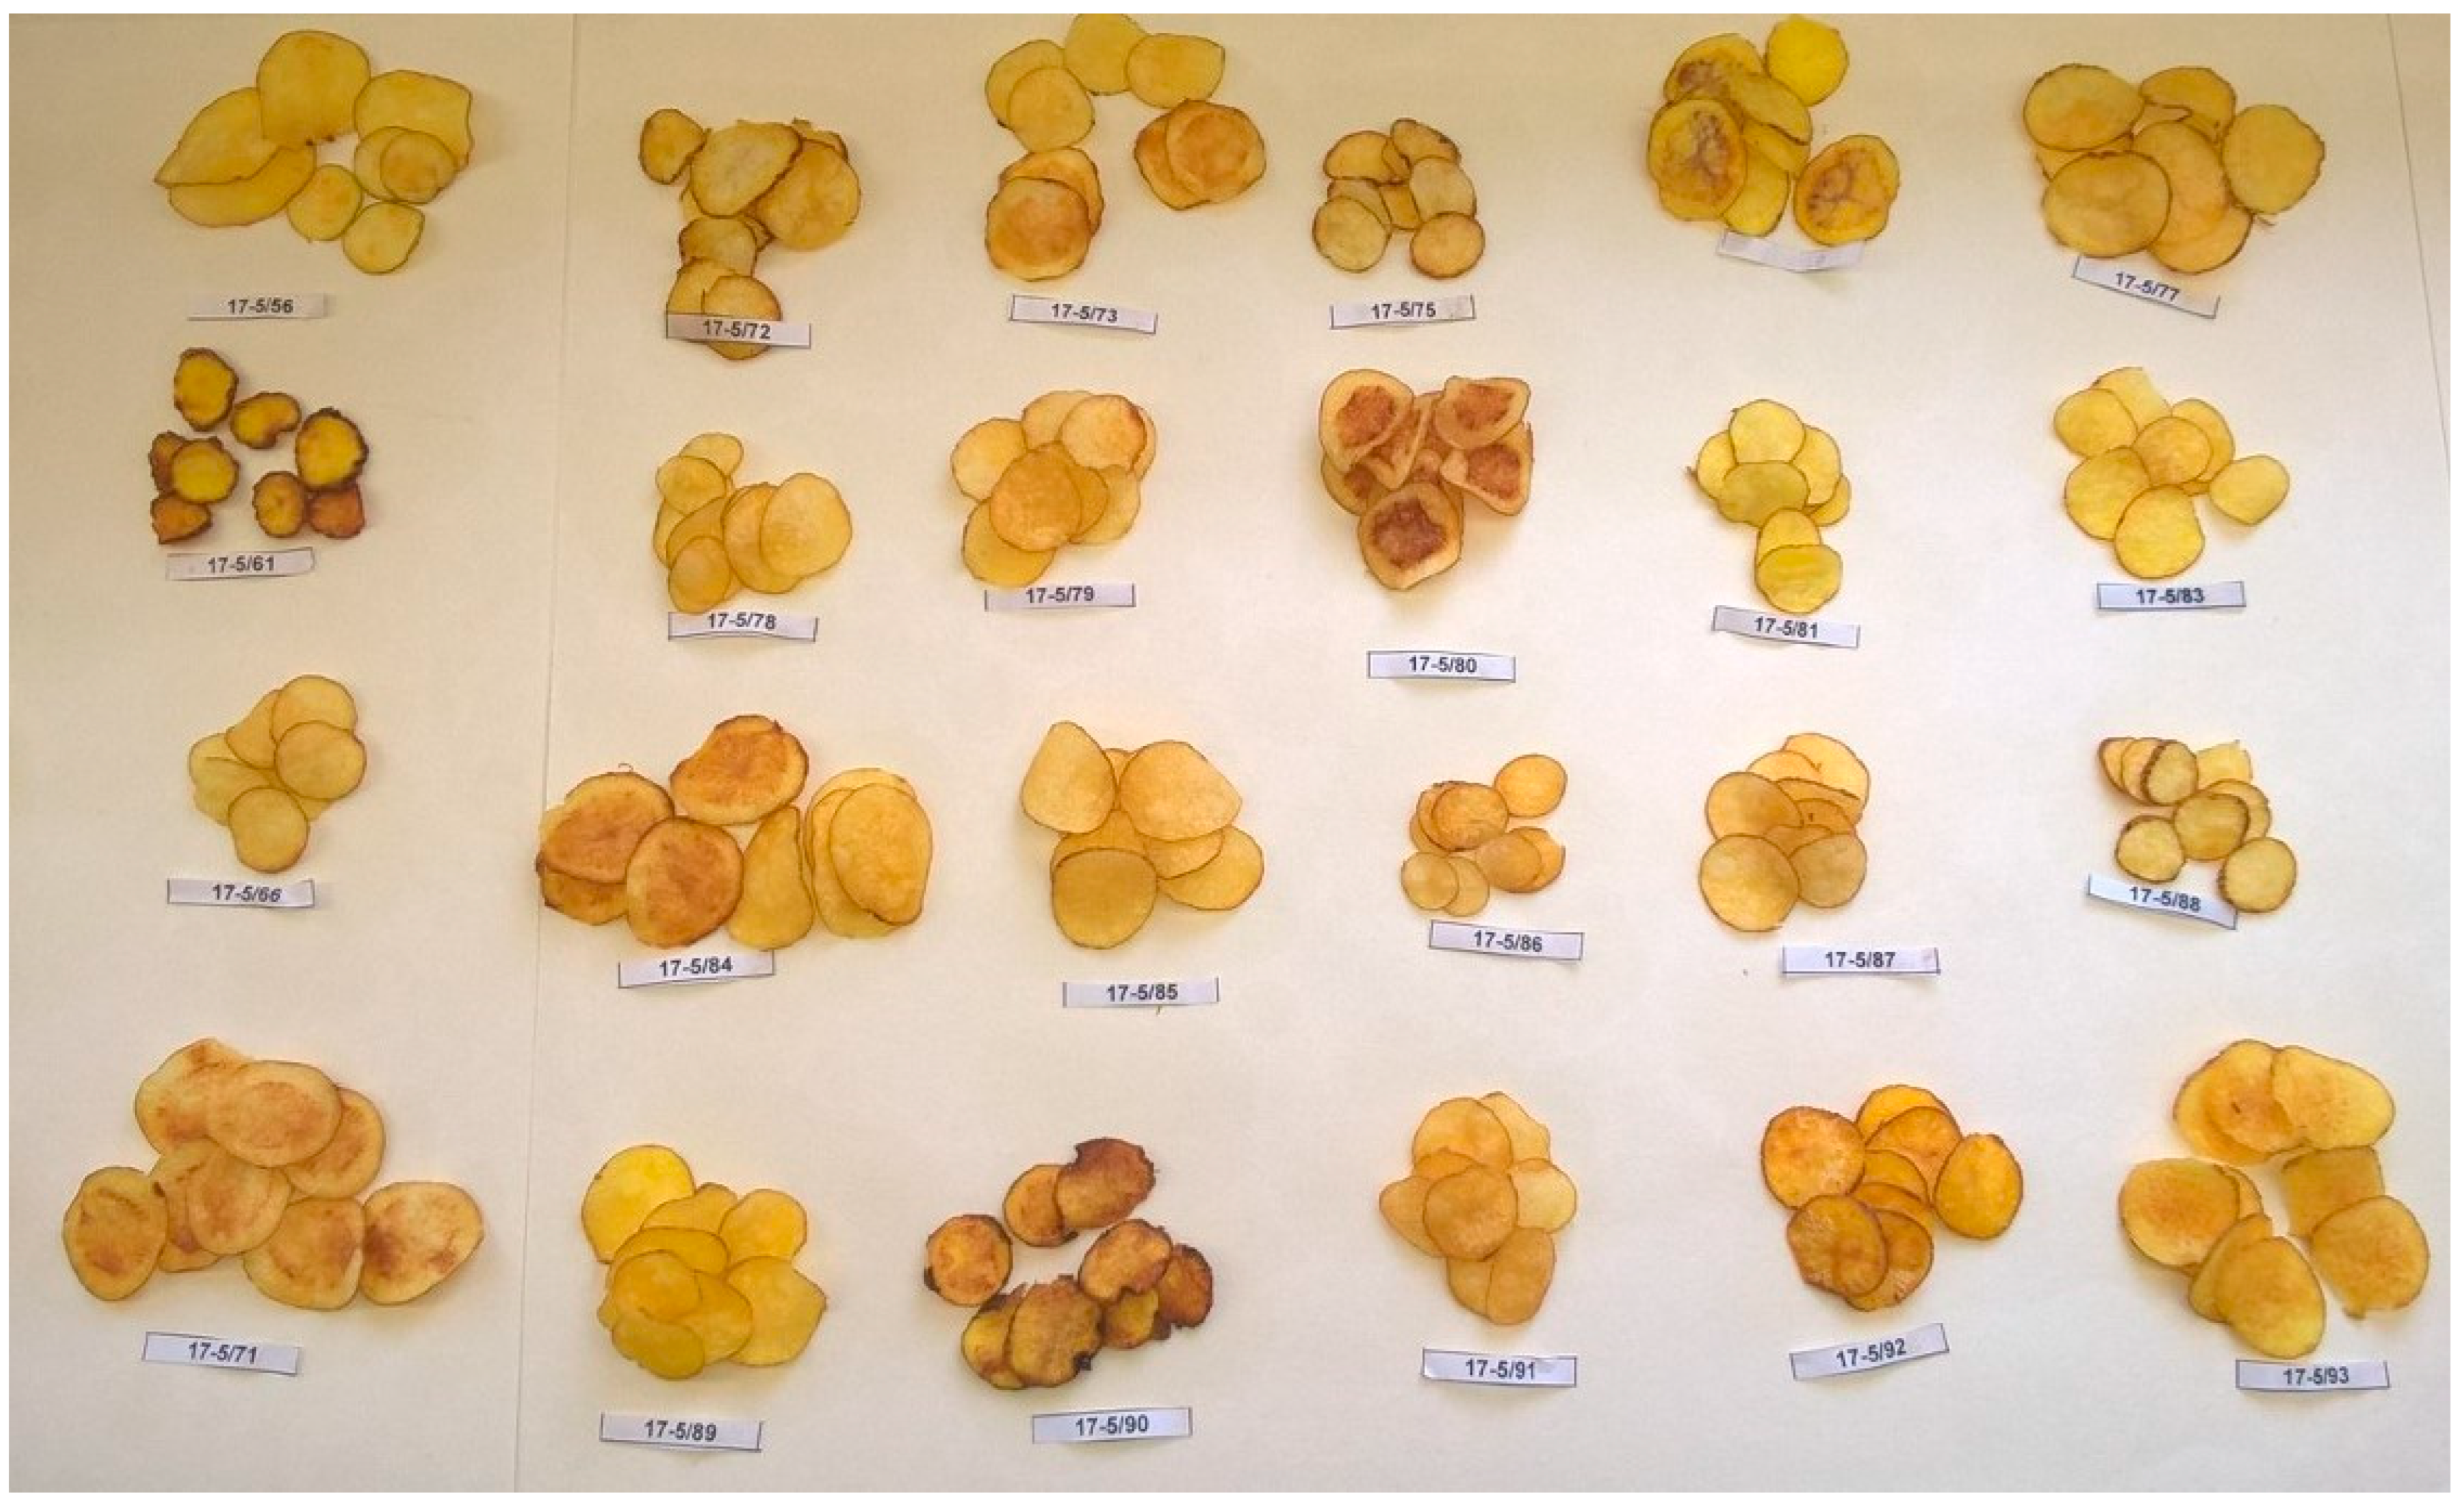
2.1. Plant Material and Assessment of Chip Color
2.2. Proline Content Assessment
2.3. Genetic Mapping and QTL Analysis
3. Results
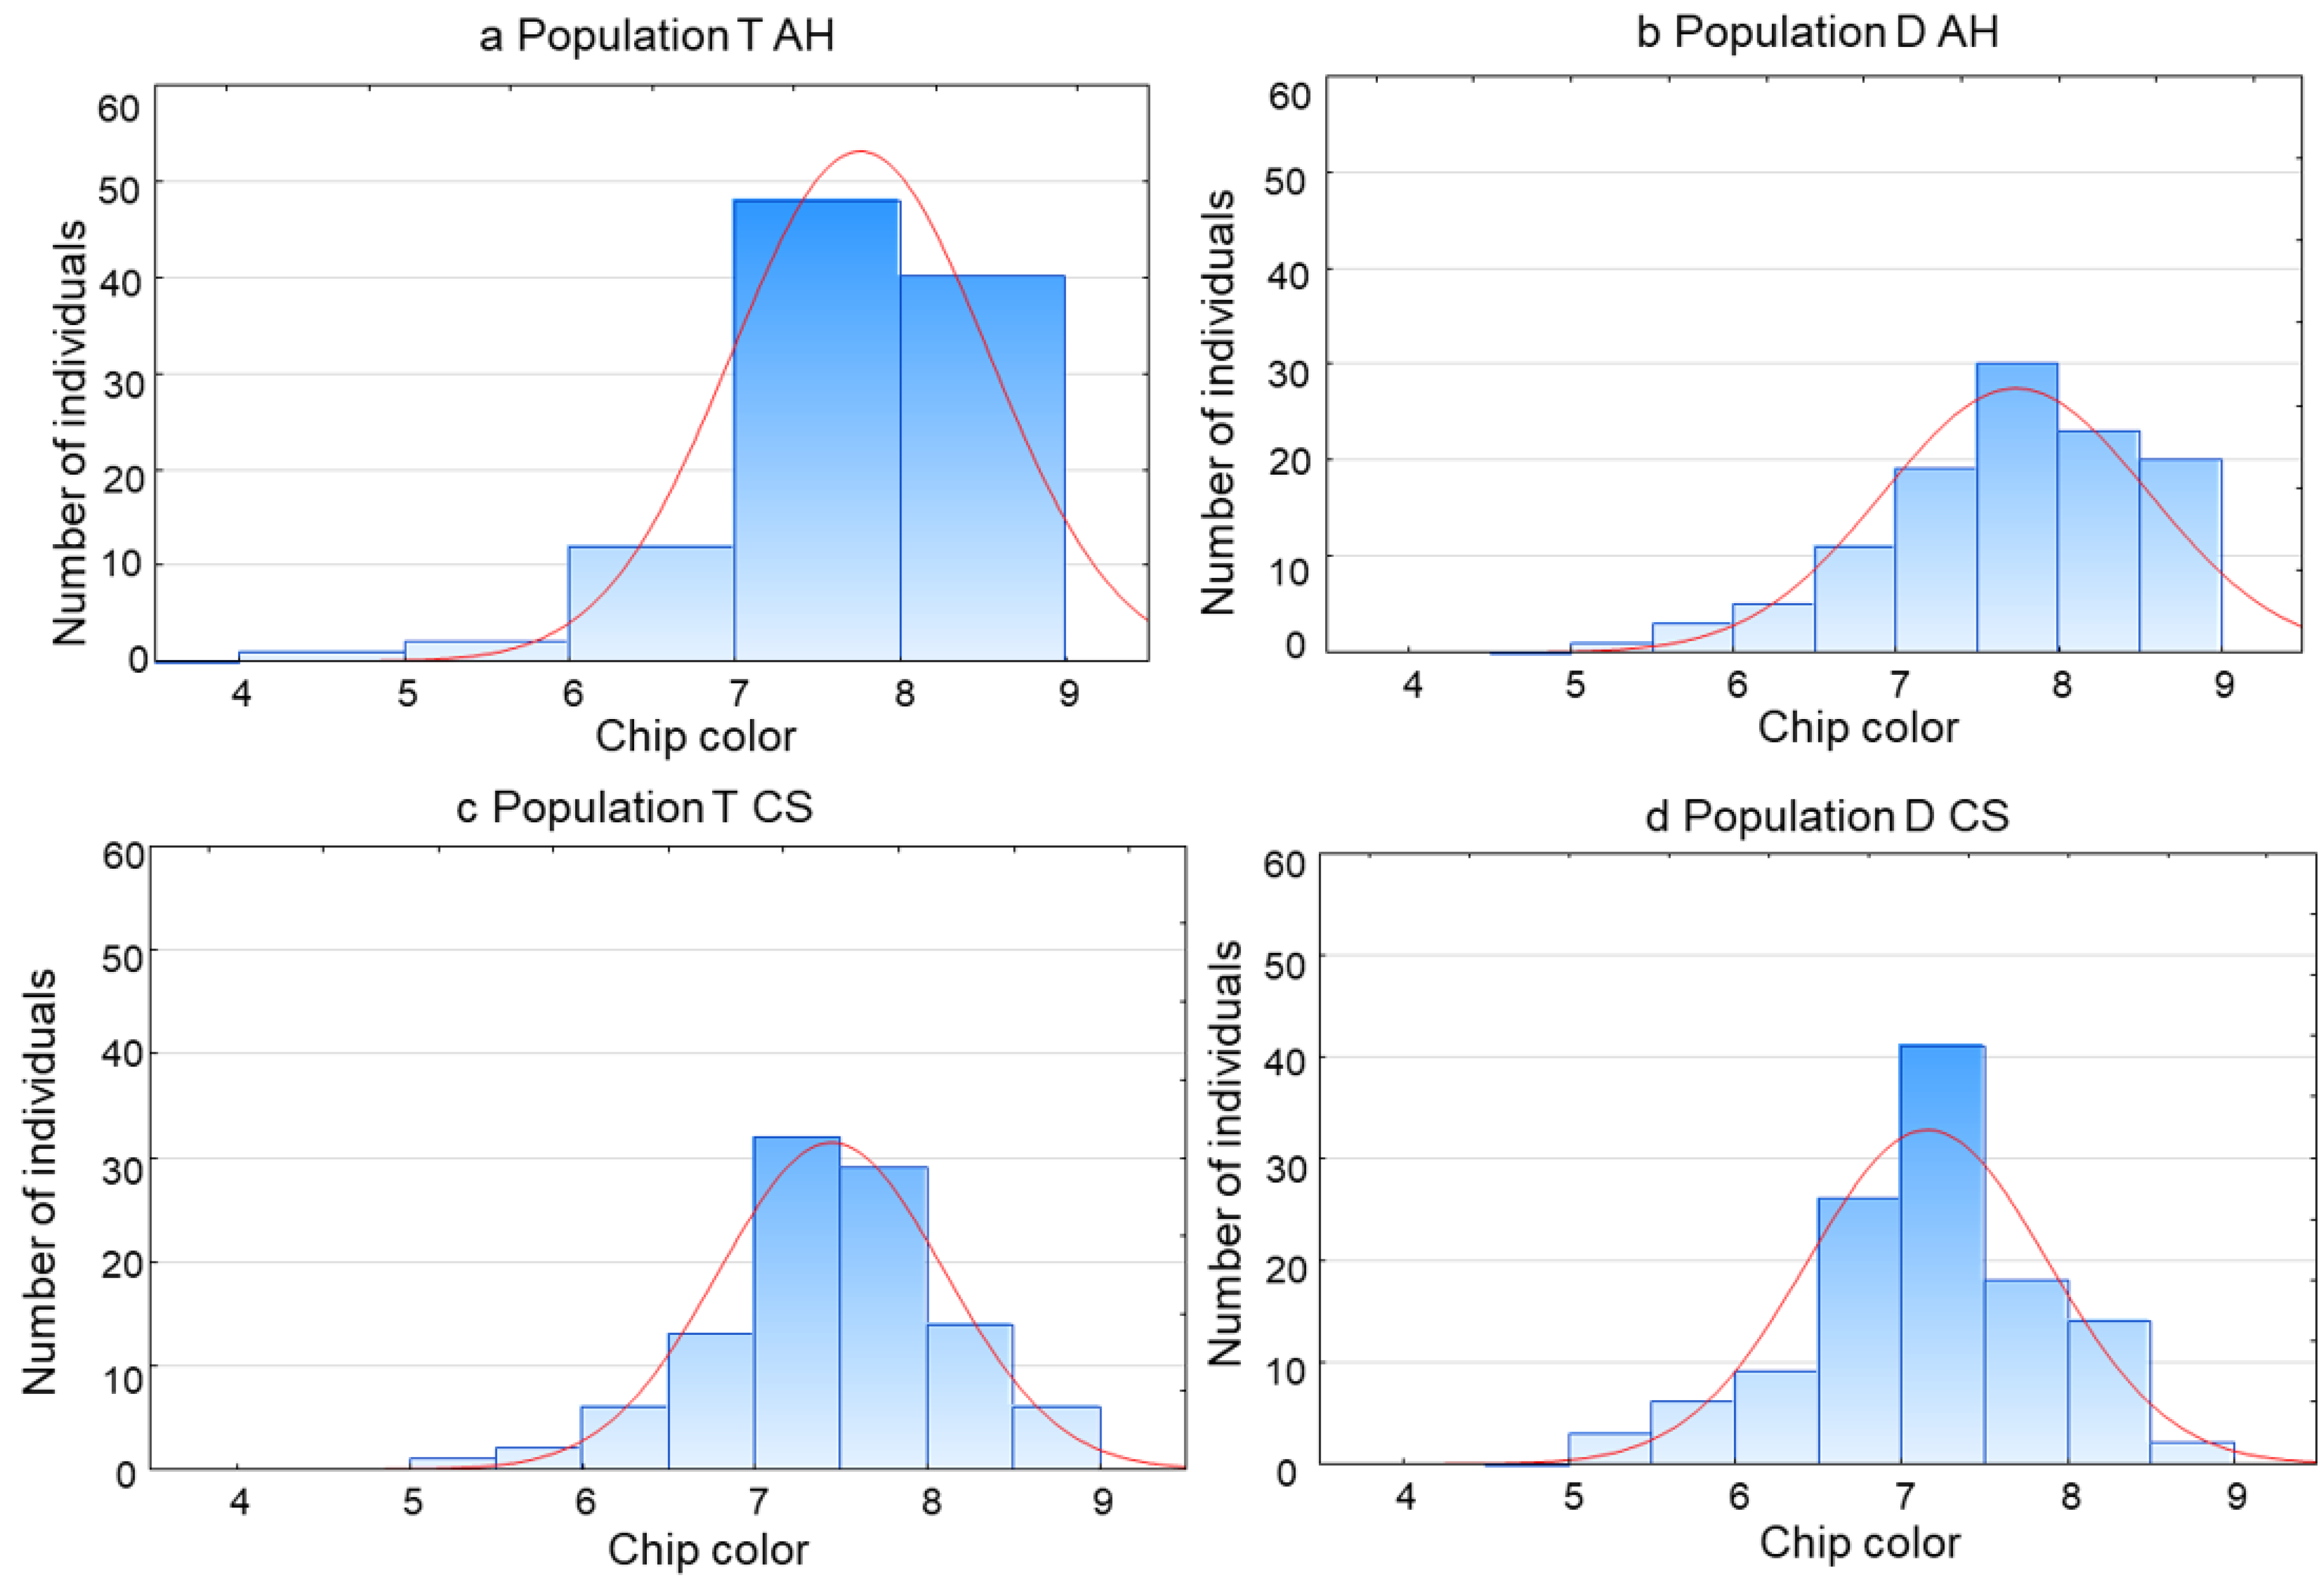
3.1. Chip Color and Proline Assessment
3.2. Genetic Mapping and QTL Analysis
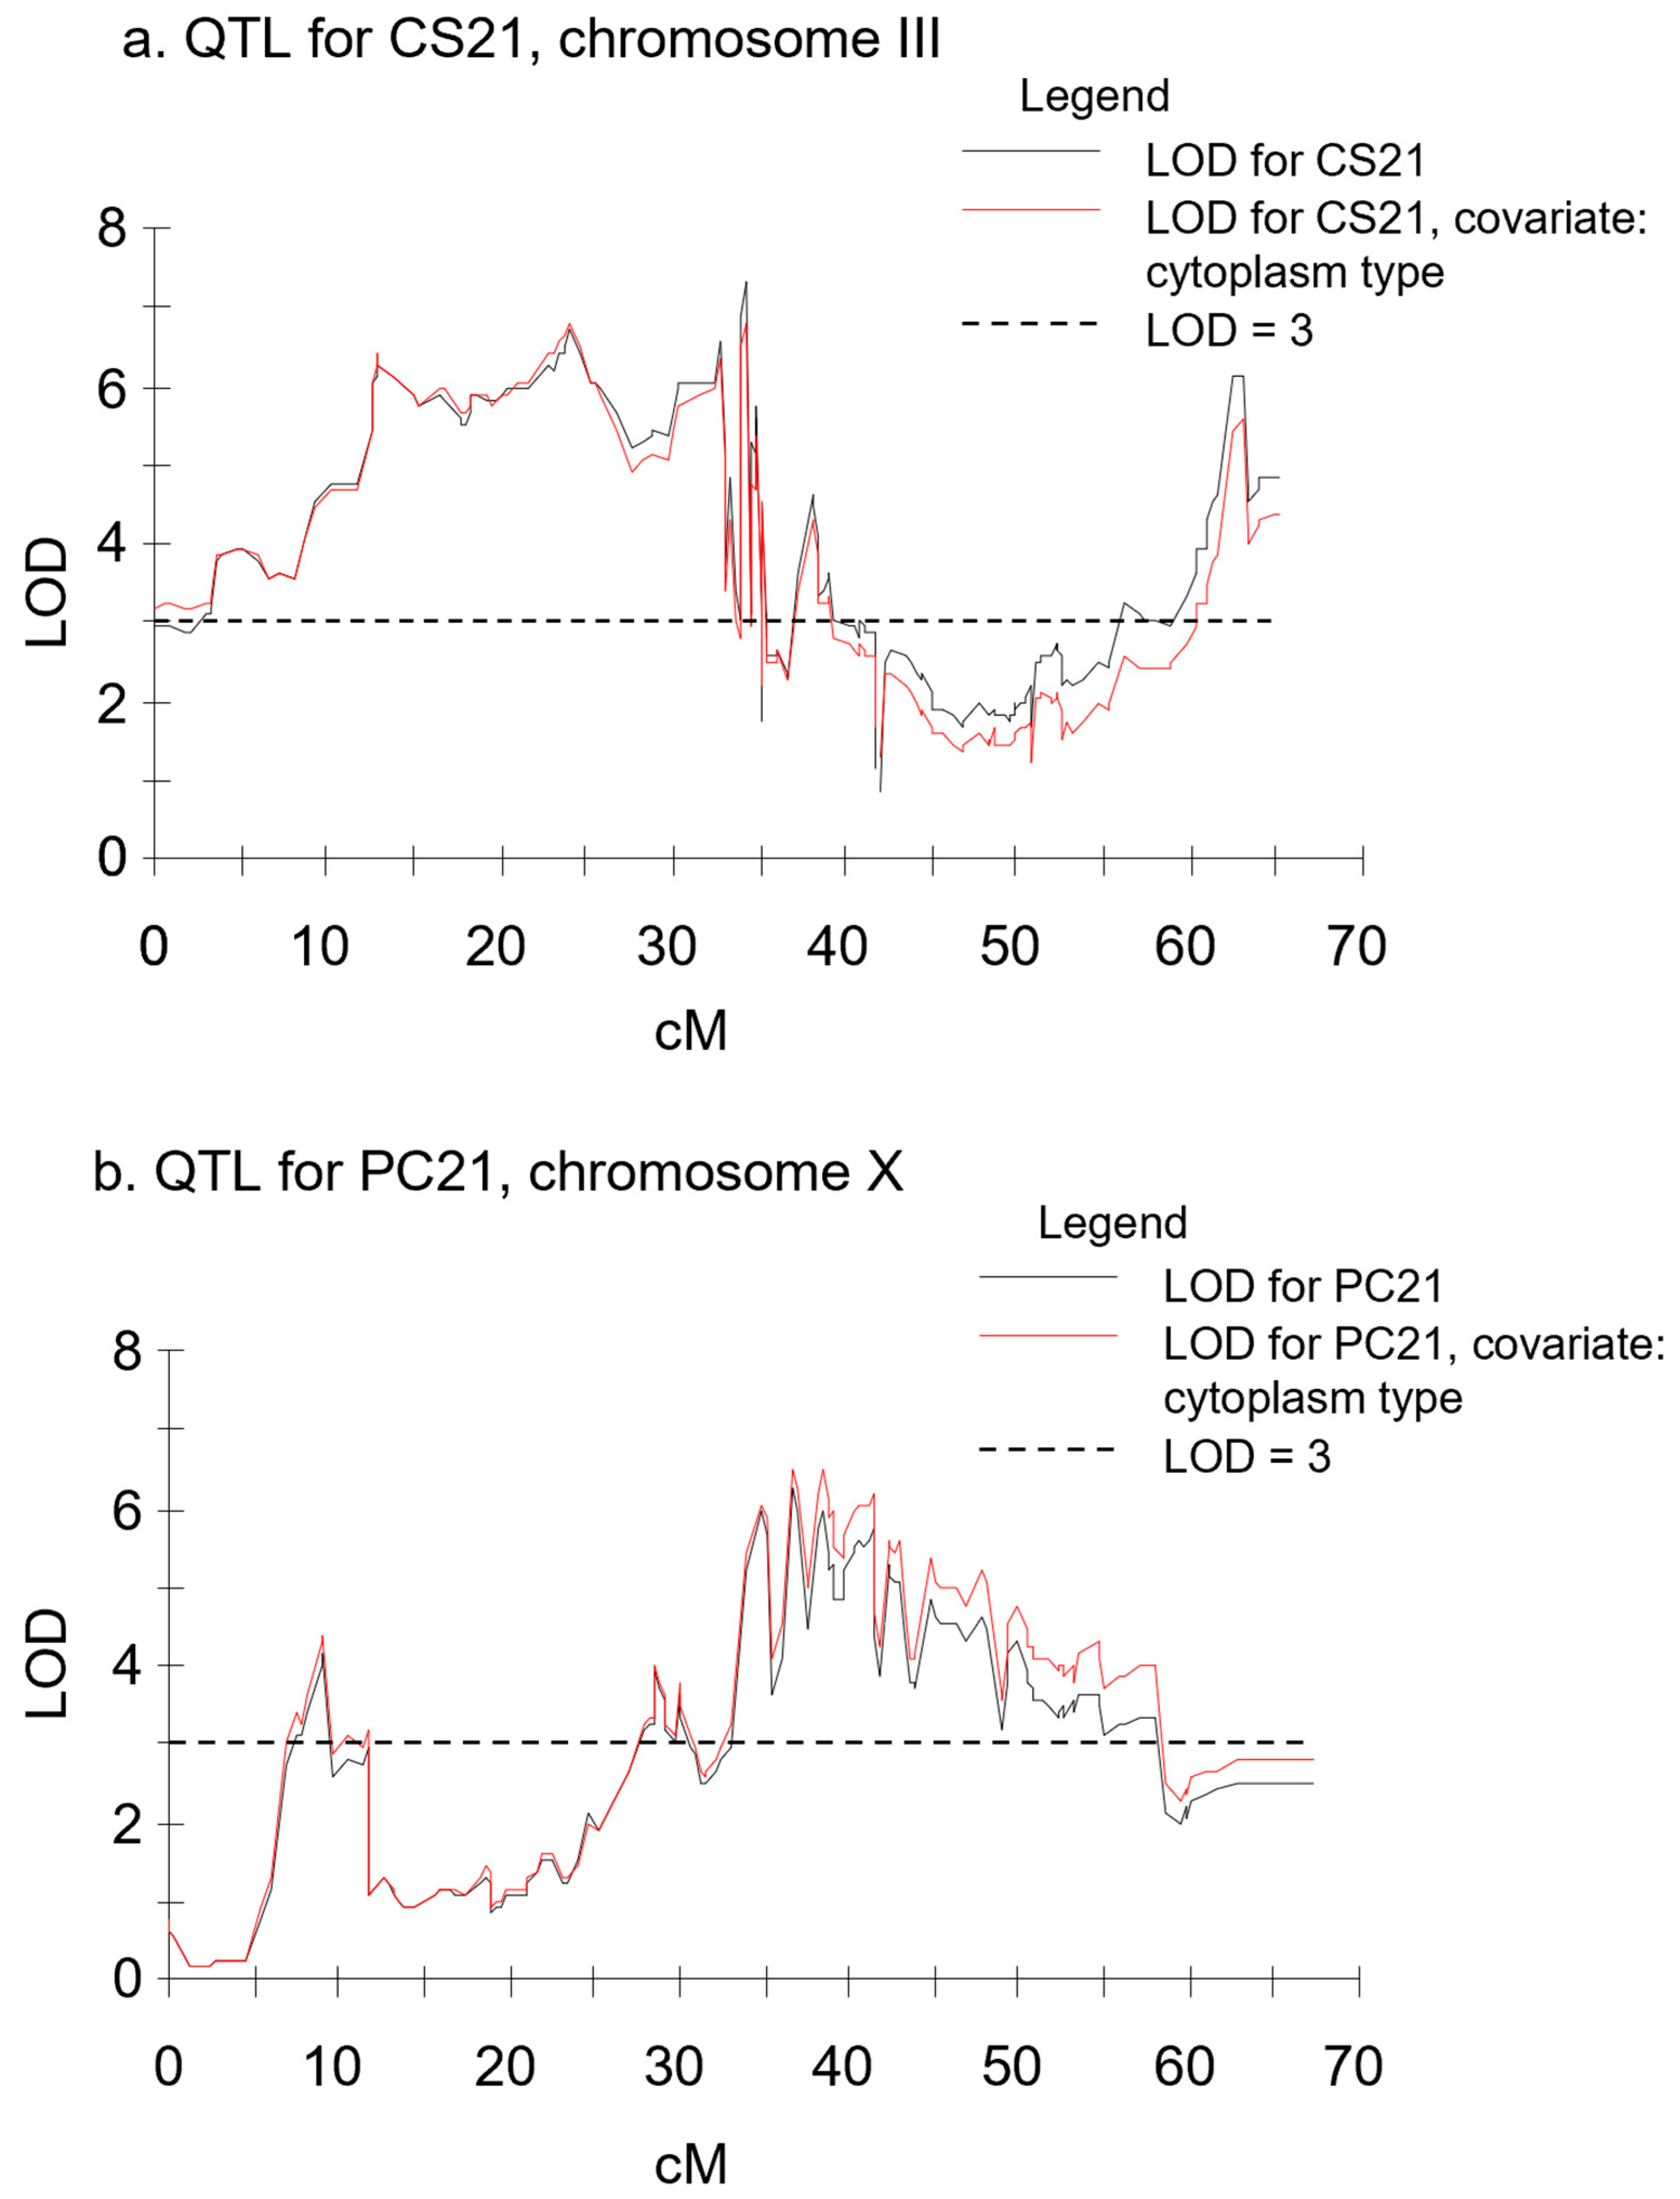
3.3. QTL Analyses
4. Discussion
5. Conclusions
Supplementary Materials
Author Contributions
Funding
Data Availability Statement
Conflicts of Interest
References
- Hou, J.; Zhang, H.; Liu, J.; Reid, S.; Liu, T.; Xu, S.; Tian, Z.; Sonnewald, U.; Song, B.; Xie, C. Amylases StAmy23, StBAM1 and StBAM9 regulate cold-induced sweetening of potato tubers in distinct ways. J. Exp. Bot. 2017, 68, 2317–2331. [Google Scholar] [CrossRef] [PubMed]
- FAOSTAT. 2022. Available online: https://www.fao.org/faostat (accessed on 16 September 2024).
- Isherwood, F.A. Starch-sugar interconversion in Solanum tuberosum. Phytochemistry 1973, 12, 2579–2591. [Google Scholar] [CrossRef]
- Shallenberger, R.S.; Smith, O.; Treadway, R.H. Food color changes, role of the sugars in the browning reaction in potato chips. J. Agric. Food. Chem. 1959, 7, 274–277. [Google Scholar] [CrossRef]
- Mottram, D.S.; Wedzicha, B.L.; Dodson, A.T. Acrylamide is formed in the Maillard reaction. Nature 2002, 419, 448–449. [Google Scholar] [CrossRef]
- Datir, S.S.; Yousf, S.; Sharma, S.; Kochle, M.; Ravikumar, A.; Chugh, J. Cold storage reveals distinct metabolic perturbations in processing and non-processing cultivars of potato (Solanum tuberosum L.). Sci. Rep. 2020, 10, 6268. [Google Scholar] [CrossRef] [PubMed]
- Bhaskar, P.B.; Wu, L.; Busse, J.S.; Whitty, B.R.; Hamernik, A.J.; Jansky, S.H.; Buell, C.R.; Bethke, P.C.; Jiang, J. Suppression of the vacuolar invertase gene prevents cold-induced sweetening in potato. Plant Physiol. 2010, 154, 939–948. [Google Scholar] [CrossRef]
- Jansky, S.H.; Hamernik, A.; Bethke, P.C. Germplasm release: Tetraploid lines with resistance to cold-induced sweetening. Am. J. Potato Res. 2011, 88, 218–225. [Google Scholar] [CrossRef]
- Werij, J.S.; Furrer, H.; van Eck, H.J.; Visser, R.G.F.; Bachem, G.W.B. A limited set of starch related genes explain several interrelated traits in potato. Euphytica 2012, 186, 501–516. [Google Scholar] [CrossRef]
- Sołtys-Kalina, D.; Szajko, K.; Sierocka, I.; Śliwka, J.; Strzelczyk-Żyta, D.; Wasilewicz-Flis, I.; Jakuczun, H.; Szweykowska-Kulinska, Z.; Marczewski, W. Novel candidate genes AuxRP and Hsp90 influence the chip color of potato tubers. Mol. Breed. 2015, 35, 224. [Google Scholar] [CrossRef] [PubMed][Green Version]
- Sołtys-Kalina, D.; Szajko, K.; Wasilewicz-Flis, I.; Mańkowski, D.; Marczewski, W.; Śliwka, J. Quantitative trait loci for starch-corrected chip color after harvest, cold storage and after reconditioning mapped in diploid potato. Mol. Genet. Genom. 2020, 295, 209–219. [Google Scholar] [CrossRef] [PubMed]
- Vexler, L.; Leyva-Perez, M.; Konkolewska, A.; Clot, C.R.; Byrne, S.; Griffin, D.; Ruttink, T.; Hutten, R.C.B.; Engelen, C.; Visser, R.G.F.; et al. QTL discovery for agronomic and quality traits in diploid potato clones using PotatoMASH amplicon sequencing. G3, 2024; 14, jkae164. [Google Scholar] [CrossRef]
- Hosaka, K.; Sanetomo, R. Development of a rapid identification method for potato cytoplasm and its use for evaluating Japanese collections. Theor. Appl. Genet. 2012, 125, 1237–1251. [Google Scholar] [CrossRef]
- Smyda-Dajmund, P.; Śliwka, J.; Janiszewska, M.; Zimnoch-Guzowska, E. Cytoplasmic diversity of potato relatives preserved at Plant Breeding and Acclimatization Institute in Poland. Mol. Biol. Rep. 2020, 47, 3929–3935. [Google Scholar] [CrossRef]
- Bradshaw, J.E. Lack of diversity in cytoplasms of potato. In Potato breeding: Theory and Practice; Bradshaw, J.H., Ed.; Springer Nature: Cham, Switzerland, 2021; pp. 30–31. [Google Scholar]
- Sanetomo, R.; Gebhardt, C. Cytoplasmic genome types of European potatoes and their effects on complex agronomic traits. BMC Plant Biol. 2015, 15, 162. [Google Scholar] [CrossRef] [PubMed]
- Jakuczun, H.; Zimnoch-Guzowska, E. Inheritance of glucose content in tubers of diploid potato families. Am. J. Pot. Res. 2004, 81, 359–370. [Google Scholar] [CrossRef]
- Wu, G.-Z.; Meyer, E.H.; Richter, A.S.; Schuster, M.; Ling, Q.; Schöttler, M.A.; Walther, D.; Zoschke, R.; Grimm, B.; Jarvis, R.P.; et al. Control of retrograde signalling by protein import and cytosolic folding stress. Nat. Plants 2019, 5, 525–538. [Google Scholar] [CrossRef] [PubMed]
- Wang, Y.; Selinski, J.; Mao, C.; Zhu, Y.; Berkowitz, O.; Whelan, J. Linking mitochondrial and chloroplast retrograde signalling in plants. Philos. Trans. R. Soc. B 2020, 375, 20190410. [Google Scholar] [CrossRef]
- Satyakam Zinta, G.; Singh, R.K.; Kumar, R. Cold adaptation strategies in plants—An emerging role of epigenetics and antifreeze proteins to engineer cold resilient plants. Front. Genet. 2022, 13, 909007. [Google Scholar] [CrossRef] [PubMed]
- Alvarez, M.E.; Savouré, A.; Szabados, L. Proline metabolism as regulatory hub. Trends Plant Sci. 2022, 27, 39–55. [Google Scholar] [CrossRef]
- Hosseinifard, M.; Stefaniak, S.; Ghorbani Javid, M.; Soltani, E.; Wojtyla, Ł.; Garnczarska, M. Contribution of exogenous proline to abiotic stresses tolerance in plants: A review. Int. J. Mol. Sci. 2022, 23, 5186. [Google Scholar] [CrossRef]
- Ghosh, U.K.; Islam, M.N.; Siddiqui, M.N.; Cao, X.; Khan, M.A.R. Proline, a multifaceted signalling molecule in plant responses to abiotic stress: Understanding the physiological mechanisms. Plant Biol. 2022, 24, 227–239. [Google Scholar] [CrossRef]
- Raza, A.; Charagh, S.; Abbas, S.; Hassan, M.U.; Saeed, F.; Haider, S.; Sharif, R.; Anand, A.; Corpas, F.J.; Jin, W.; et al. Assessment of proline function in higher plants under extreme temperatures. Plant Biol. 2023, 25, 379–395. [Google Scholar] [CrossRef] [PubMed]
- Schafleitner, R.; Gaudin, A.; Oscar, R.; Rosales, G.; Alvarado, C.A.A.; Bonierbale, M. Proline accumulation and real time PCR expression analysis of genes encoding enzymes of proline metabolism in relation to drought tolerance in Andean potato. Acta Physiol. Plant. 2007, 29, 19–26. [Google Scholar] [CrossRef]
- Liu, Y.; Wang, L.; Li, Y.; Li, X.; Zhang, J. Proline metabolism-related gene expression in four potato genotypes in response to drought stress. Biol. Plant. 2019, 63, 757–764. [Google Scholar] [CrossRef]
- Szajko, K.; Sołtys-Kalina, D.; Heidorn-Czarna, M.; Smyda-Dajmund, P.; Wasilewicz-Flis, I.; Jańska, H.; Marczewski, W. Transcriptomic and proteomic data provide new insights into cold-treated potato tubers with T- and D-type cytoplasm. Planta 2022, 255, 97. [Google Scholar] [CrossRef] [PubMed]
- Jakuczun, H.; Zgórska, K.; Zimnoch-Guzowska, E. An investigation of the level of reducing sugars in diploid potatoes before and after cold storage. Potato Res. 1995, 38, 331–338. [Google Scholar] [CrossRef]
- Bates, L.S.; Waldren, R.P.; Teare, D. Rapid determination of free proline for water-stress studies. Plant Soil 1973, 39, 205–207. [Google Scholar] [CrossRef]
- Lebecka, R.; Śliwka, J.; Grupa-Urbańska, A.; Szajko, K.; Marczewski, W. QTLs for potato tuber resistance to Dickeya solani are located on chromosomes II and IV. Plant Pathol. 2021, 70, 1745–1756. [Google Scholar] [CrossRef]
- Pham, G.M.; Hamilton, J.P.; Wood, J.C.; Burke, J.T.; Zhao, H.N.; Vaillancourt, B.; Ou, S.J.; Jiang, J.M.; Buell, C.R. Construction of a chromosome-scale long-read reference genome assembly for potato. Gigascience 2020, 9, 1–11. [Google Scholar] [CrossRef] [PubMed]
- Van Ooijen, J.W. JoinMap® 4.1. Software for the Calculation of the Genetic Linkage Maps in Experimental Populations of Diploid Species; Kyazma BV.: Wageningen, The Netherlands, 2012. [Google Scholar]
- Van Ooijen, J.W. MapQTL® 6. Software for Mapping of Quantitative Trait Loci in Experimental Populations of Diploid Species; Kyazma BV.: Wageningen, The Netherlands, 2009. [Google Scholar]
- Van Ooijen, J.W. LOD significance thresholds for QTL analysis in experimental populations of diploid species. Heredity 1999, 83, 613–624. [Google Scholar] [CrossRef]
- Gusain, S.; Shubham, J.; Joshi, R. Sensing, signalling, and regulatory mechanism of cold-stress tolerance in plants. Plant Physiol. Biochem. 2023, 197, 107646. [Google Scholar] [CrossRef] [PubMed]
- Li, H.; Luo, W.; Ji, R.; Xu, Y.; Xu, G.; Qiu, S.; Tang, H. A comparative proteomic study of cold responses in potato leaves. Heliyon 2021, 7, e06002. [Google Scholar] [CrossRef] [PubMed]
- Gebhardt, C. Potato Genetics: Molecular maps and more. In Molecular Marker Systems in Plant Breeding and Crop Improvement; Nagata, T., Lörz, H., Widholm, J.M., Eds.; Springer: Berlin, Germany, 2005; Volume 55, pp. 221–224. [Google Scholar]
- Iqbal, Z.; Memon, A.G.; Ahmad, A.; Iqbal, M.S. Calcium mediated cold acclimation in plants: Underlying signaling and molecular mechanisms. Front. Plant Sci. 2022, 13, 855559. [Google Scholar] [CrossRef]


| T | D | |||||||||
|---|---|---|---|---|---|---|---|---|---|---|
| Trait | N | Population Mean | Range of Variation | W Value Shapiro–Wilk Test | p Value | N | Population Mean | Range of Variation | W Value Shapiro-Wilk Test | p Value |
| (a) | ||||||||||
| AH | 103 | 7.8 | 4.3–9.0 | 0.9385 * | 0.0001 | 112 | 7.7 | 5.1–9.0 | 0.9632 * | 0.0036 |
| CS | 103 | 7.4 | 5.5–8.8 | 0.9849 | 0.2931 | 119 | 7.1 | 5.0–8.5 | 0.9782 | 0.0504 |
| (b) | ||||||||||
| CS21 | 99 | 7.8 | 5.1–9.0 | 0.9538 * | 0.0016 | 113 | 7.4 | 4.5–9.0 | 0.9597 * | 0.0018 |
| PC21 | 98 | 15.9 | 5.1–52.8 | 0.8171 * | 0.0000 | 115 | 17.6 | 5.0–69.5 | 0.7910 * | 0.0000 |
| Trait and Dataset | Chromosome | QTL Peak (cM) | Marker or Marker Interval at Peak | LOD | R2 (%) | Marker Origin a | Peak Position DM1-3 v6.1 b | QTL Range (cM) | |
|---|---|---|---|---|---|---|---|---|---|
| Chromosome | bp | ||||||||
| (a) | |||||||||
| AH | I | 119.2 | 58168279c0184 | 3.48 | 7.1 | P2 | chr01 | 83,957,884 | 114.8–120.8 |
| CS | II | 38.5 | 3719288c0235 | 3.18 | 6.4 | P2 | chr02 | 35,196,853 | 38.3–38.5 |
| AH | III | 24.1 | 3688134c0339 | 6.71 | 13.4 | P1 | chr03 | 38,774,708 | 0.0–35.0 |
| CS | III | 12.9 | 5750470 | 6.60 | 12.9 | H | NF c | 0.0–65.1 | |
| AH | IV | 7.3 | 3694144c041 | 3.04 | 6.3 | P1 | chr04 | 1,163,357 | 7.3 |
| AH | IV | 41.8 | 4450983c0456 | 3.01 | 6.2 | P1 | chr04 | 55,674,229 | 41.7–42.4 |
| CS | IV | 38.3 | 3723612c0443 | 4.93 | 9.7 | P2 | chr04 | 42,669,500 | 27.9–38.3 |
| AH | X | 52.6 | 5748594 | 3.17 | 6.6 | P1 | NF | 52.6–53.2 | |
| CS | X | 11.7 | 5714844 | 4.18 | 8.3 | P2 | NF | 9.1–14.5 | |
| CS | X | 52.3 | 5733100c1046 | 3.14 | 6.3 | P1 | chr10 | 46,488,902 | 51.6–52.3 |
| CS | XII | 12.1 | 3690083c123 | 3.69 | 7.4 | P1 | chr12 | 2,975,932 | 7.4–21.3 |
| (b) | |||||||||
| AH | I | 119.2 | 58168279c0184 | 3.66 | 7.5 | P2 | chr01 | 83,957,884 | 114.6–120.8 |
| AH | III | 24.1 | 3688134c0339 | 6.70 | 13.4 | P1 | chr03 | 38,774,708 | 0.0–35.0 |
| CS | III | 12.8 | 3693458c037 | 6.47 | 12.0 | P2 | chr03 | 6,699,744 | 0.0–65.1 |
| AH | IV | 7.3 | 3694144c041 | 3.03 | 6.3 | P1 | chr04 | 1,163,357 | 7.3 |
| AH | IV | 41.8 | 4450983c0456 | 3.01 | 6.2 | P1 | chr04 | 55,674,229 | 41.7–42.4 |
| CS | IV | 38.3 | 3723612c0443 | 5.16 | 9.7 | P2 | chr04 | 42,669,500 | 21.1–45.1 |
| AH | X | 52.6 | 5748594 | 3.17 | 6.6 | P1 | NF | 52.6–53.2 | |
| CS | X | 11.7 | 5714844 | 4.11 | 7.8 | P2 | NF | 9.1–14.5 | |
| CS | X | 52.2 | 3724650 | 3.06 | 5.9 | P1 | NF | 52.2–52.3 | |
| CS | XII | 12.1 | 3690083c123 | 3.71 | 7.1 | P1 | chr12 | 2,975,932 | 7.4–21.3 |
| Trait and Dataset | Chromosome | QTL Peak (cM) | Marker or Marker Interval at Peak | LOD | R2 (%) | Marker Origin a | Peak Position DM1-3 v6.1 b | QTL Range (cM) | |
|---|---|---|---|---|---|---|---|---|---|
| Chromosome | bp | ||||||||
| (a) | |||||||||
| CS21 | II | 38.5 | 3719288c0235 | 3.03 | 6.4 | P2 | chr02 | 35,196,853 | 38.4–38.5 |
| CS21 | III | 34.1 | 4504190c0342 | 7.31 | 14.7 | P2 | chr03 | 41,576,761 | 3.1–65.1 |
| PC21 | V | 46.6 | 3678154c0550 | 4.70 | 9.7 | P2 | chr05 | 50,090,721 | 40.9–54.6 |
| CS21 | X | 51.6 | 3724239c1044 | 3.09 | 6.5 | P1 | chr10 | 44,437,803 | 51.6–52.1 |
| PC21 | X | 9.1 | 3698078c101 | 4.13 | 8.5 | H | chr10 | 618,308 | 7.5–9.1 |
| PC21 | X | 36.7 | 58168117 | 6.26 | 12.7 | P1 | NF c | 27.9–58.0 | |
| CS21 | XII | 18.3 | 3696170c123 | 3.66 | 7.6 | P1 | chr12 | 3,429,191 | 6.7–21.3 |
| PC21 | XII | 46.8 | 3725047c1211 | 4.82 | 9.9 | P2 | chr12 | 11,433,467 | 46.1–47.2 |
| PC21 | XII | 71.2 | 29296287c1256 | 3.99 | 8.3 | P1 | chr12 | 56,477,975 | 58.2–74.8 |
| (b) | |||||||||
| CS21 | III | 24.1 | 3688134c0339 | 6.83 | 13.4 | P1 | chr03 | 38,774,708 | 0.0–65.1 |
| PC21 | V | 46.6 | 3678154c0550 | 4.96 | 10.1 | P2 | chr05 | 50,090,721 | 40.9–54.6 |
| CS21 | X | 8.2 | 5739767c100 | 3.04 | 6.2 | H | chr10 | 100,825 | 8.2–9.0 |
| PC21 | X | 9.1 | 3698078c101 | 4.36 | 8.9 | H | chr10 | 618,308 | 6.9–11.7 |
| PC21 | X | 36.7 | 58168117 | 6.48 | 13.0 | P1 | NF | 27.9–58.0 | |
| CS21 | XII | 6.7 | 3689672c122 | 3.63 | 7.4 | P1 | chr12 | 1,696,039 | 9.0–20.3 |
| PC21 | XII | 46.8 | 3725047c1211 | 4.83 | 9.8 | P2 | chr12 | 11,433,467 | 46.1–47.2 |
| PC21 | XII | 71.2 | 29296287c1256 | 3.90 | 8.0 | P1 | chr12 | 56,477,975 | 60.5–74.8 |
Disclaimer/Publisher’s Note: The statements, opinions and data contained in all publications are solely those of the individual author(s) and contributor(s) and not of MDPI and/or the editor(s). MDPI and/or the editor(s) disclaim responsibility for any injury to people or property resulting from any ideas, methods, instructions or products referred to in the content. |
© 2024 by the authors. Licensee MDPI, Basel, Switzerland. This article is an open access article distributed under the terms and conditions of the Creative Commons Attribution (CC BY) license (https://creativecommons.org/licenses/by/4.0/).
Share and Cite
Smyda-Dajmund, P.; Szajko, K.; Sołtys-Kalina, D.; Marczewski, W.; Śliwka, J. Effect of Cytoplasm Types T and D on Quantitative Trait Loci for Chip Color and Proline Content in Potato Tubers in a Diploid Potato Population. Agronomy 2024, 14, 2853. https://doi.org/10.3390/agronomy14122853
Smyda-Dajmund P, Szajko K, Sołtys-Kalina D, Marczewski W, Śliwka J. Effect of Cytoplasm Types T and D on Quantitative Trait Loci for Chip Color and Proline Content in Potato Tubers in a Diploid Potato Population. Agronomy. 2024; 14(12):2853. https://doi.org/10.3390/agronomy14122853
Chicago/Turabian StyleSmyda-Dajmund, Paulina, Katarzyna Szajko, Dorota Sołtys-Kalina, Waldemar Marczewski, and Jadwiga Śliwka. 2024. "Effect of Cytoplasm Types T and D on Quantitative Trait Loci for Chip Color and Proline Content in Potato Tubers in a Diploid Potato Population" Agronomy 14, no. 12: 2853. https://doi.org/10.3390/agronomy14122853
APA StyleSmyda-Dajmund, P., Szajko, K., Sołtys-Kalina, D., Marczewski, W., & Śliwka, J. (2024). Effect of Cytoplasm Types T and D on Quantitative Trait Loci for Chip Color and Proline Content in Potato Tubers in a Diploid Potato Population. Agronomy, 14(12), 2853. https://doi.org/10.3390/agronomy14122853


