Article

Genome-Wide Association Analysis Identifies Loci and Candidate Genes for 100-Kernel Weight in Maize

1
College of Agronomy, Shanxi Agricultural University, Jinzhong 030801, China
2
Shanxi Institute of Organic Dryland Farming, Shanxi Agricultural University, Taiyuan 030031, China
*
Author to whom correspondence should be addressed.
Agronomy 2024, 14(12), 2954; https://doi.org/10.3390/agronomy14122954
Submission received: 19 October 2024 / Revised: 5 December 2024 / Accepted: 8 December 2024 / Published: 11 December 2024
(This article belongs to the Section Crop Breeding and Genetics)

Abstract

:
Maize is an important food crop, and 100-kernel weight (HKW) is one of the three key components of yield. In this study, 200 maize inbred lines were used as the material, and HKW was evaluated over three consecutive years in two environments. A genome-wide association study (GWAS) was conducted using the Blink and FarmCPU models with 44,935 SNP markers evenly distributed across the maize genome. A total of 25 SNPs significantly associated with HKW were identified, with three SNPs detected in both models. Six significant SNPs were located within previously mapped QTL bins associated with grain weight. In the linkage disequilibrium (LD) regions of the significant SNP loci, 198 candidate genes were identified, of which 74 had annotation information. Further analysis revealed 21 candidate genes related to HKW, such as GRMZM2G010555 (alternative oxidase), GRMZM2G102471 (ubiquitin-conjugating enzyme), GRMZM2G060669 (histone deacetylase), GRMZM2G090156 (methyltransferase), GRMZM2G002075 (BZIP transcription factor), and GRMZM2G138454 (bHLH transcription factor). The SNP loci and candidate genes identified in this study provide important references for marker-assisted selection, fine mapping, and gene cloning related to HKW in maize.

1. Introduction

Maize (Zea mays L.) is the most important grain crop in China and serves as a critical raw material for feed, food, bioenergy, and industrial production. It plays a pivotal role in national food security and economic development [1]. Yield is the primary breeding target for maize breeders. However, yield is a quantitative trait with low heritability and is significantly influenced by environmental factors, making its direct genetic analysis challenging. Kernel traits, such as kernel weight (KW), are key components of yield and are less affected by the environment [2,3]. Therefore, enhancing the genetic analysis of kernel-related traits and identifying genes associated with kernel weight is of great practical significance for elucidating the molecular mechanisms of maize kernel development and increasing maize yield through molecular methods.
Significant progress has been made in identifying QTLs associated with kernel weight in crops such as soybean, rice, and wheat [4,5]. In rice, several key grain weight-related genes have been cloned, including GS3, GS5, qGL3, and GW2 [6,7,8]. In maize, hundreds of QTLs associated with 100-kernel weight have been identified. For example, Raihan et al. [9] mapped 16 major QTLs controlling kernel weight and size across multiple environments using an RIL population. Liu et al. [10] identified 729 QTLs associated with kernel traits and weight using three statistical models across 10 RIL populations. Zhao et al. [11] identified 13 QTLs related to grain weight in two F2:3 populations across eight water conditions using composite interval mapping. Su et al. [12] used the Genotyping-by-Sequencing (GBS) method to genotype 199 F2 individuals derived from a cross between the maize inbred lines SG-5 and SG-7, constructing a genetic linkage map and identifying four QTLs associated with 100-kernel weight. However, only a few grain weight-related genes have been cloned and studied in detail [13,14].
Genome-wide association studies (GWASs) have become an essential tool for systematically dissecting the genetic mechanisms underlying complex quantitative traits [15]. GWAS was first applied to maize to study the Dwarf8 gene, revealing the association between polymorphisms in this gene and flowering time [16]. Maize inbred lines are highly genetically diverse, and their linkage disequilibrium (LD) decays rapidly, making them particularly suitable for GWAS analysis. Studies have shown that the resolution of GWASs is 5000 times higher than that of traditional linkage mapping [16,17]. GWAS has been widely used to identify QTLs associated with complex traits such as plant architecture, yield, and stress resistance [18]. For example, Peng et al. [19] used GWAS to analyze 285 maize inbred lines and detected 27 SNPs significantly associated with leaf angle, explaining 5.54–8.73% of the phenotypic variance. Ma et al. [20] used GWAS to analyze 309 maize inbred lines and identified 12 SNPs significantly associated with ear shaft diameter, uncovering 17 candidate genes. Qu et al. [21] used GWAS to analyze the genetic structure of kernel size in 212 maize inbred lines and identified 38 significant SNPs, leading to the discovery of 58 candidate genes related to kernel development.
Currently, there are relatively few studies utilizing GWAS to analyze the genetic basis of 100-kernel weight in maize. In this study, a GWAS was conducted using 200 maize inbred lines, with phenotypic data collected over three years across two environments. Using 44,935 SNP markers covering the entire maize genome, significant loci associated with kernel weight were identified, and candidate genes were predicted. This study provides an important reference for breeding high-yield maize varieties and for further cloning of kernel weight-related genes.

2. Materials and Methods

2.1. Experimental Materials and Field Design

The 200 maize inbred lines used in this study were sourced from the molecular breeding group at the Institute of Organic Dryland Agriculture, Shanxi Agricultural University, including 13 parents of major expanded hybrids, 26 US imported lines and 161 newly developed inbred lines from different breeding institutions of China. Detailed information of accessions is listed in Supplementary File S1. The field trials were conducted over three years (2019, 2020, and 2021) at two locations: Jinzhong (Shanxi Province, 112.69° E, 37.56° N) and Xinzhou (Shanxi Province, 110.53° E, 38.60° N). A randomized complete block design (RCBD) was used with two replications. Each inbred line was planted in two rows of 5 m in length, with a spacing of 50 cm between rows and 23 individual plants per row. The planting density was around 6000 plants per mu. Standard field management practices were followed throughout the growing season.

2.2. Phenotypic Data Collection and Statistical Analysis

During the silking stage, 10 uniformly growing plants were selected from each plot and bagged for self-pollination, which was performed 1–2 days after silking. These plants were used for TKW determination. After the maize matured, five ears of similar size and shape from healthy plants in each plot were harvested. The kernels from the middle section of each ear were mixed, and 100 kernels were randomly selected and weighed. This process was repeated three times, and the average weight was used for further analysis. A mixed linear model was constructed using the R package lme4 to estimate the Best Linear Unbiased Prediction (BLUP) values for HKW. The broad-sense heritability (H2) across multiple years and locations was calculated using the formula:
H 2 = V g V g + V g l L + V g y Y + V n L Y
where Vg is the genetic variance, Vgl is the variance of genotype-by-location interaction, Vgy is the variance of genotype-by-year interaction, VΣ is the residual variance, and n, L, and Y are the number of replications, locations, and years, respectively [22]. The R package Performance Analytics was used to perform correlation analysis on the TKW data and BLUP values across different years and locations.

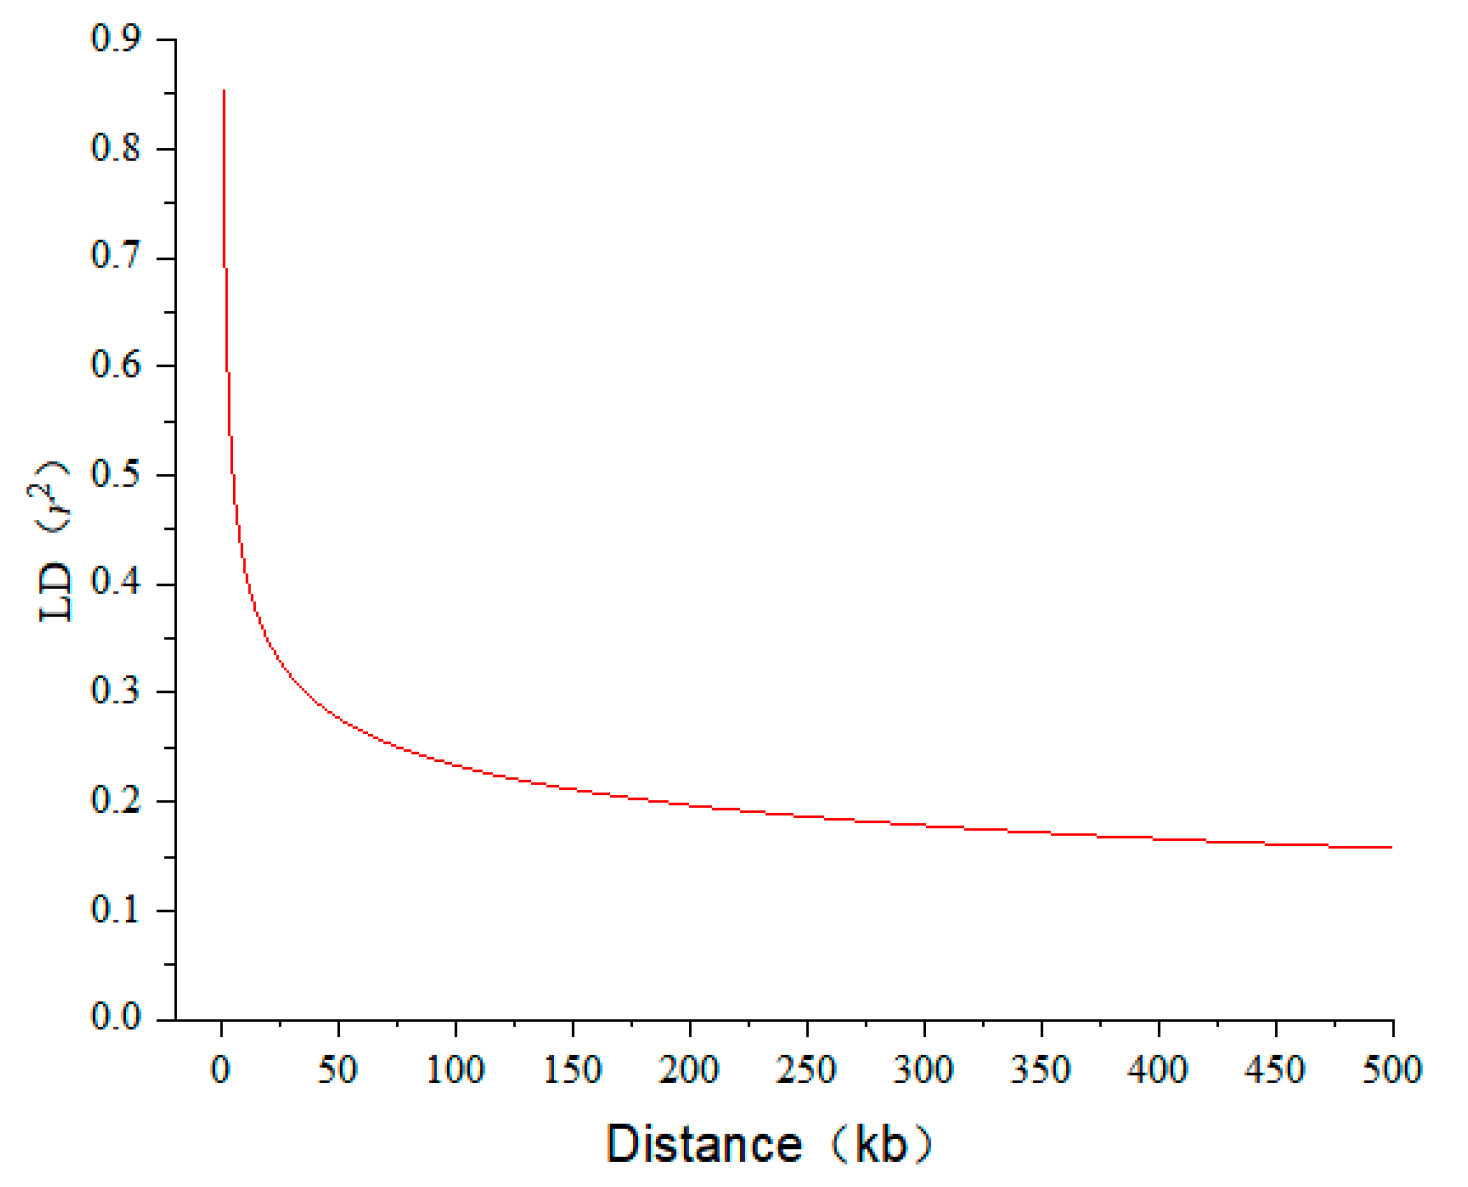
2.3. Genotyping and Quality Control

Genomic DNA was extracted from fresh young leaves using a EasyPure® Plant Genomic DNA Kit (TransGEN Biotech., Beijing, China). The purity and integrity were assessed using 1% agarose gel electrophoresis, and the DNA concentration was quantified using Qubit2.0 (ThermoFisher Scientific Inc., Waltham, MA, USA). The genotyping was performed via a GenoBaits® Maize 40K Panel (Boruidi Biotech., Beijing, China) with 44,935 SNPs. The raw data were filtered for quality using the FASTQ software [23] and then aligned to the maize reference genome (B73 RefGen_v3) using the BWA software (v0.1.17) [24]. The software GATK 4.0 was employed for SNP detection [25]. After removing the low-quality or SNPs with missing rate > 50% and minor allele frequency (MAF) <0.01 with the PLINK tool [26], 43,034 high-quality SNPs remained. Genotype imputation was performed using Beagle (V4.1).

2.4. Genome-Wide Association Analysis

Two models, linkage-disequilibrium iteratively nested keyway (Blink) and fixed and random model circulating probability unification (FarmCPU) in the GAPIT version 3.0, were employed for the genome-wide association study (GWAS) of HKW and BLUP for HKW. The population structure was controlled by the first three PCs. The phenotypic variation explained (PVE) by each SNP was calculated using a mixed linear model (MLM) conducted in GAPIT V3.0 R software. Q-Q and Manhattan plots were generated using the R package CMplot based on the GWAS results. A Bonferroni-corrected p-value of 2.32 × 10⁻⁵ (1/total number of markers) was employed as the significant threshold, with a −log10 (p-value) of 4.63.

2.5. Candidate Gene Identification

The linkage disequilibrium (LD) decay distance and the square of the correlation coefficient (r2) was calculated using the PopLDdecay software (v3.42). LD decay plots were generated using the Origin software (v2019b). In our study, the LD decay distance was 200 kb when r2 = 0.2. Genes located within 200 kb upstream and downstream of a significant SNP were retrieved as candidate genes for HKW based on the reference genome (B73 RefGen_v3, available at http://plants.ensembl.org (accessed on 12 May 2023)). Candidate genes were further annotated using databases MaizeGDB (https://staging.maizegdb.org/ (accessed on 10 January 2024)), NCBI (https://blast.ncbi.nlm.nih.gov/ (accessed on 10 January 2024 )), and UniProt (https://www.uniprot.org/ (accessed on 10 January 2024)).

3. Results

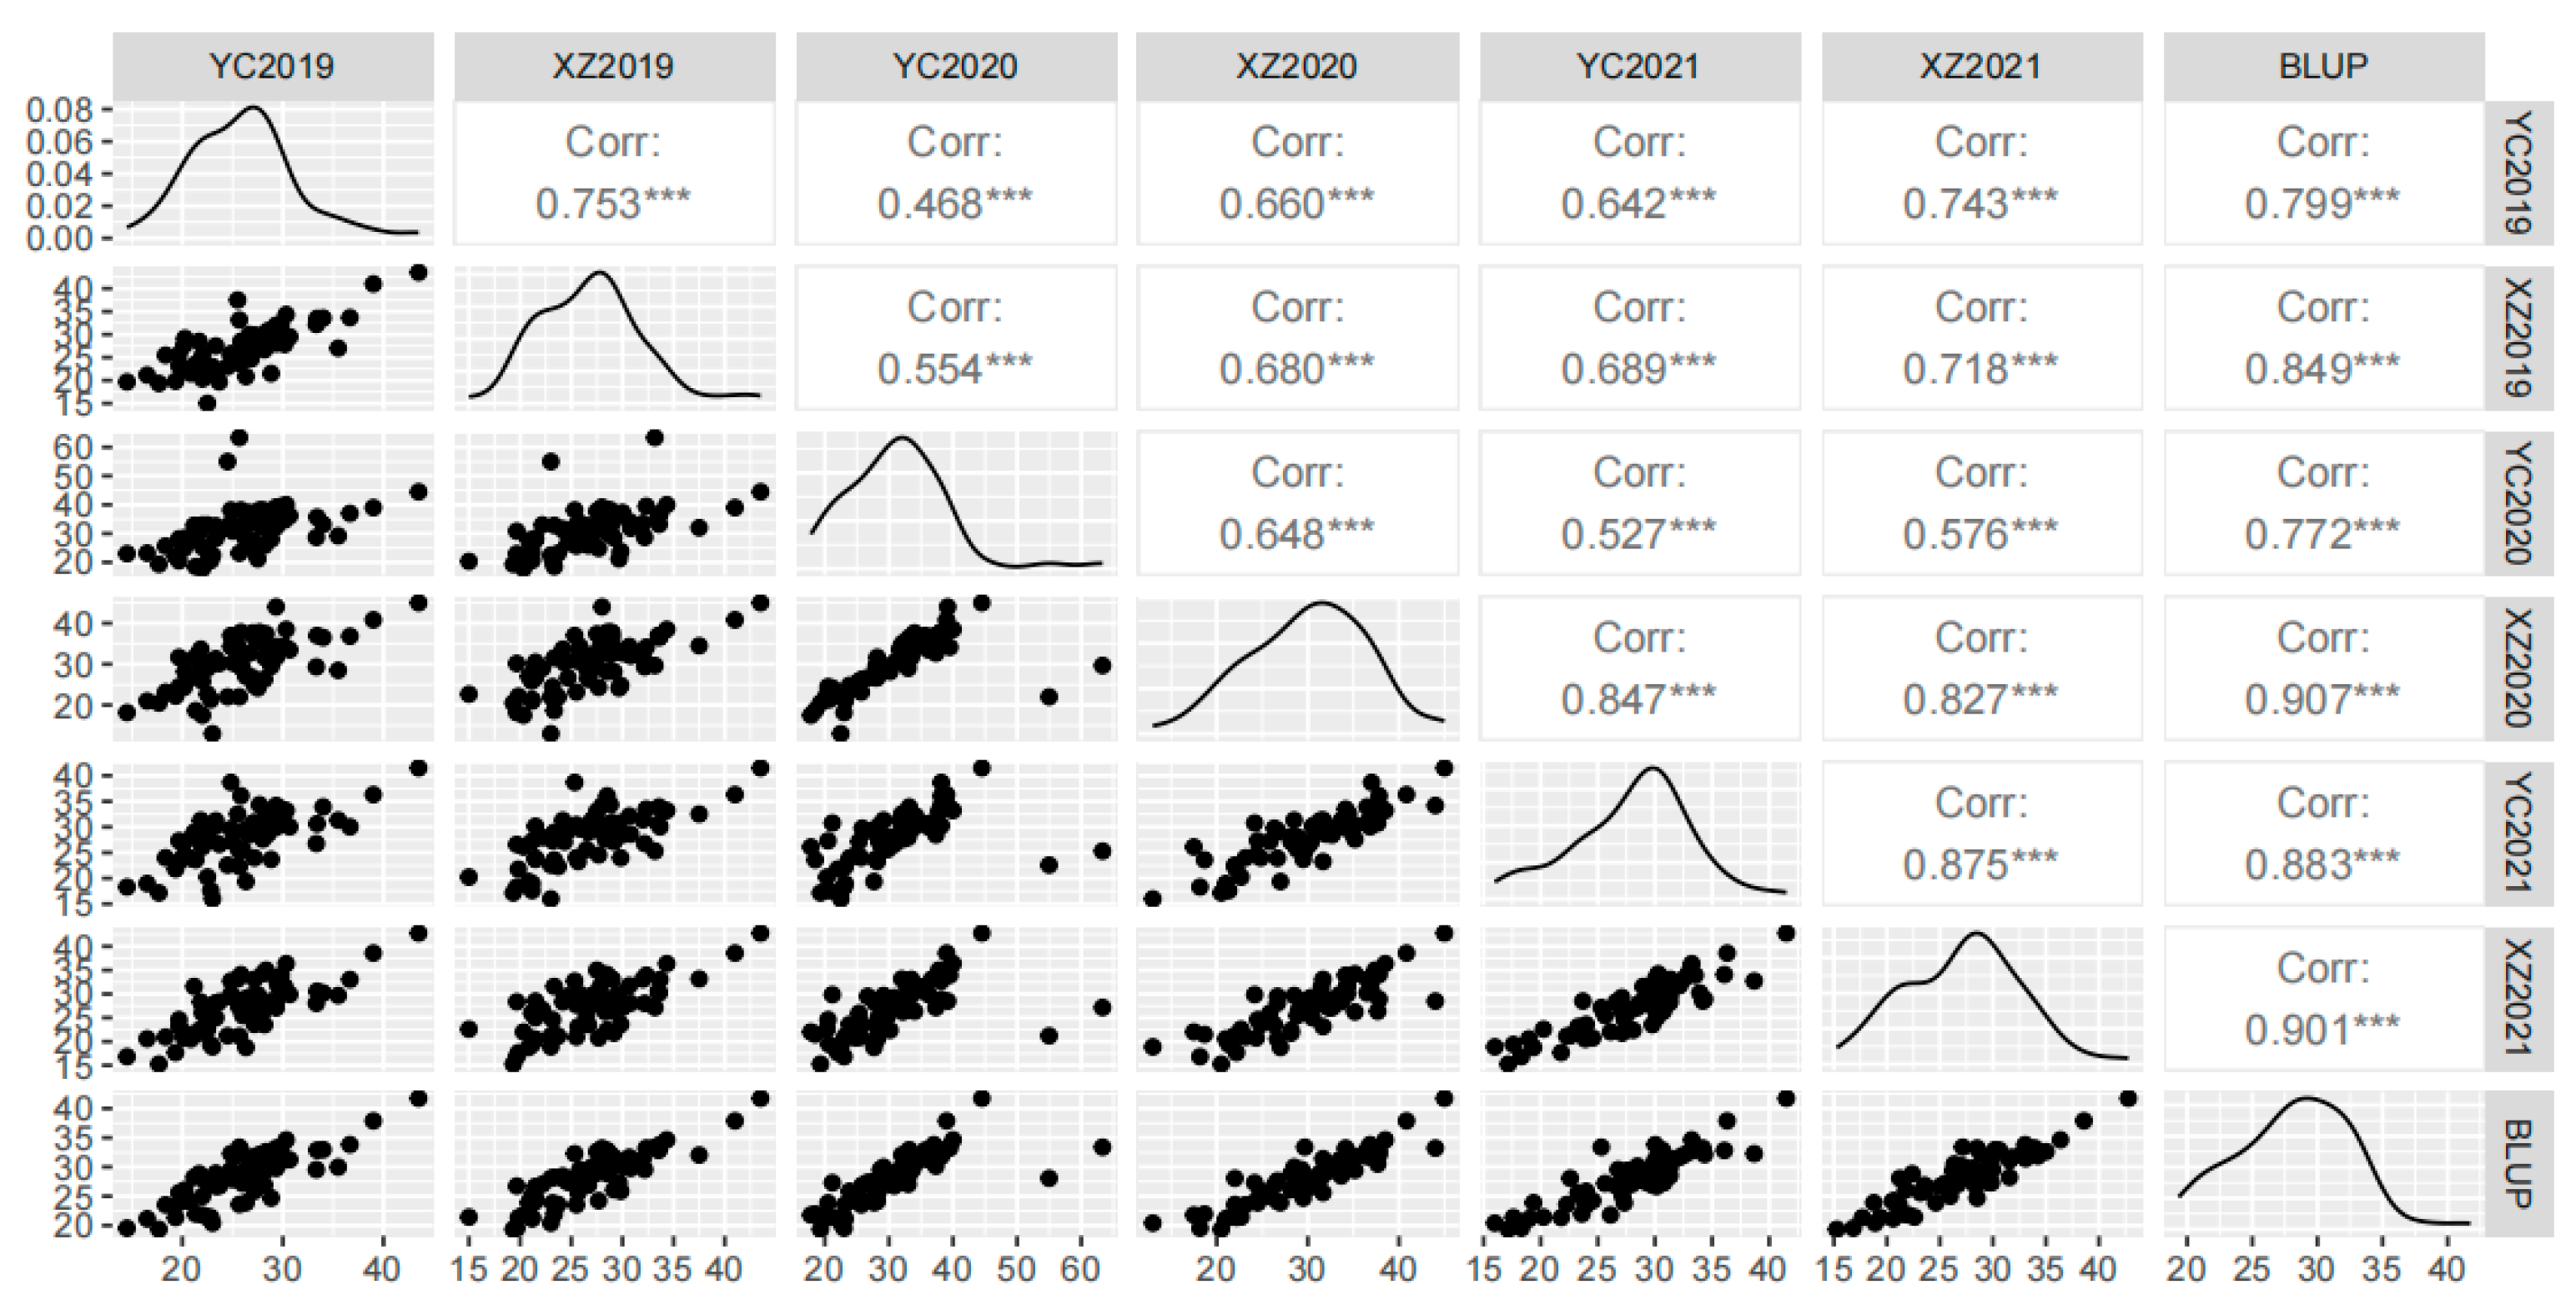
3.1. Phenotypic Analysis of 100-Kernel Weight

The HKW of the 200 maize inbred lines was analyzed over three years at two locations. The broad-sense heritability of HKW across three years and two locations was 80.78%. The phenotypic variation ranged from 14.23 g to 55.00 g. The highest HKW was observed in 2020 at both Yuci and Xinzhou, with means of 30.79 g and 30.02 g, respectively. The inbred line DH103-3 had the highest HKW across all years and locations, ranging between 39.46 g and 45.00 g. The coefficients of variation for HKW across different years and locations ranged from 16.17% to 22.49%, with the largest variation observed in Yuci in 2020. The skewness and kurtosis values of HKW in all environments were less than 1, indicating the HKW followed a normal distribution (Table 1). The combined variance analysis demonstrates that the effects of year, genotype, Y × L interaction, and Y × G interaction have all achieved extremely significant levels. However, the location, L × G interaction, and Y × L × G interaction had a relatively minor impact on the HKW (Table 2).
Correlation analysis showed significant positive correlations (p < 0.001) between the HKW values of the 200 maize inbred lines across multiple years and locations, with correlation coefficients ranging from 0.468 to 0.901. The highest correlations were observed between the BLUP values and the HKW from Xinzhou in 2021 and 2020, with correlation coefficients of 0.901 and 0.907, respectively. The lowest correlation was found between the HKW data from Yuci in 2019 and 2020, with a correlation coefficient of 0.468 (Figure 1).
The diagonal in the figure represents the traits, and the upper triangle represents the correlation coefficient and the degree of significance. The significance levels of 0.05, 0.01 and 0.001 are marked with *, **, ***, respectively. The lower triangle is a scatter plot of the weight per hundred grains in different years and environments. YC and XZ represent Yuci and Xinzhou, respectively, and 2019–2021 represent the years.

3.2. Genome-Wide Association Analysis of 100-Kernel Weight

To accurately identify the significant loci associated with maize TKW, two models, Blink and FarmCPU, were employed for GWAS. With the threshold at −log10 p > 4.63, a total of 25 SNPs significantly associated with HKW were detected across chromosomes 1 to 5 (Figure 2). The Blink model detected 15 significant loci, with the p-values ranging from 5.34 × 10⁻¹⁴ to 9.97 × 10⁻⁶. The SNP 4_228498570 located on chromosome 4 had the lowest p-value of 5.34 × 10⁻¹⁴. Four significant SNP loci were identified based on BLUP values. The SNP with the largest phenotypic variance explained (PVE) in the Blink model was 2_186957636 located on chromosome 2, explaining 10.77% of phenotypic variation. The FarmCPU model detected 13 significant SNPs, with the p-values ranging from 7.45 × 10⁻¹⁰ to 1.93 × 10⁻⁵. The most significant SNP 5_142616635, which explained 9.05% of the phenotypic variance, was detected in both XZ and YC in 2021. One significant SNP was detected based on BLUP values under this model. SNPs 3_125129946, 4_238711294 and 5_142616635 were co-located by both models.

3.3. HKW Candidate Gene Analysis

According to the significant SNP combined with the linkage disequilibrium (LD) decay distance of 200 kb (r2 = 0.2) (Figure 3), candidate genes were searched in B73_RefGen_v3 reference genome. A total of 198 candidate genes were identified. Functional annotation revealed that 74 of these genes had annotation information. Through literature retrieval, 21 candidate genes affecting HKW were identified (Table 3), including 3 transcription factor genes: GRMZM2G002075 (BZIP transcription factor) and GRMZM2G138454 (bHLH transcription factor) on chromosome 2 and GRMZM2G061292 (Dof transcription factor) on chromosome 5. Additionally, two cytochrome P450-encoding genes were identified: GRMZM2G159353 on chromosome 1 and GRMZM2G015232 on chromosome 4. Other key candidate genes identified included those encoding important plant enzymes such as GRMZM2G010555 (alternative oxidase) and GRMZM2G102471 (ubiquitin-conjugating enzyme) on chromosome 2 and GRMZM2G060669 (histone deacetylase) and GRMZM2G090156 (methyltransferase) on chromosome 4.
The horizontal axis represents the physical distance between single nucleotide loci (SNP) on the same chromosome, and the vertical axis represents the linkage disequilibrium parameter r2 value.

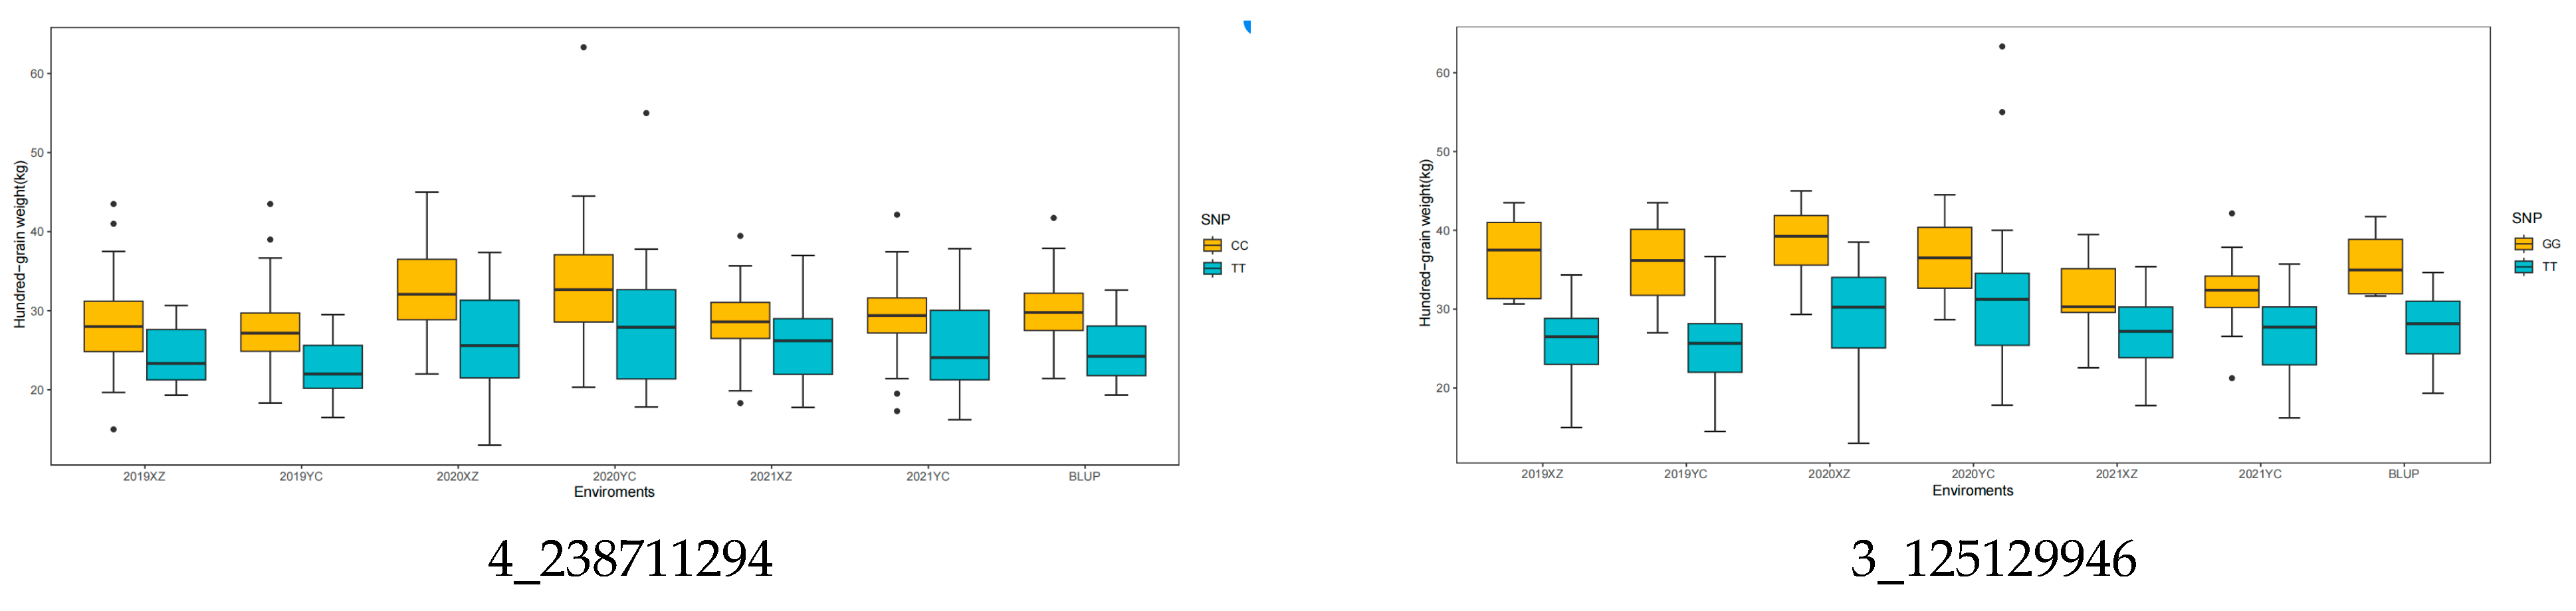
3.4. Allelic Variation Effects

Four significant SNPs with a larger PVE were selected for allelic effect analysis, including 2_186957636 (10.77%), 3_125129946 (8.12%), 4_238711294 (7.44%), and 5_142616635 (9.05%). These four loci showed a significantly affected HKW across all seven environments (Figure 4). For instance, the G/G allele of 2_186957636 increased the HKW by 1.12–10.37 g compared to the C/C allele across all seven environments, identifying G/G as the superior allele. Similarly, the G/G allele of 3_125129946 increased the HKW by 4.44–10.84 g compared to the T/T allele, thus identifying G/G as the superior allelic variant, while the C/C allele of 4_238711294 and the T/T allele of 5_142616635 also contributed to increased HKW.

4. Discussion

High grain yield is one of the most important goals persistently pursued by breeders in their professional endeavors. However, maize yield is an extremely intricate quantitative trait regulated by numerous genes with minor effects. Compared to other quantitative traits, it manifests a lower heritability (H2). Owing to its complexity, yield has often been replaced by ear traits in genetic studies, such as HKW which has a higher H2 [27]. In this study, HKW was evaluated over three consecutive years in two environments. The H2 of HKW was 85.64%, indicating that HKW is mainly controlled by genetic factors and is suitable for early generation selection [28,29]. The ANOVA indicated highly significant differences among genotypes (p < 0.001). The high genetic variation that exists among genotypes is very useful for maize breeders to select the highest HKW genotypes efficiently. Genotype (G) × Location (L) interactions (GLIs) were significant (p < 0.001) for HKW, inferring that the different genotypes exhibit variable responses to environmental conditions at each location. Genotype (G) × year (Y) was not significant, suggesting that the impact of years on HKW is relatively small.
Genome-wide association studies (GWASs) are an effective method for analyzing the genetic mechanisms underlying complex quantitative traits [30]. In this study, 25 SNPs significantly associated with HKW were identified. The Blink model detected 14 SNPs, and the FarmCPU model detected 16 SNPs. Several of these SNPs were located in regions consistent with previously identified QTLs. For example, the two SNPs on chromosome 1 (1_274302441 and 1_298487278) were located in bins 1.10 and 1.12, explaining 4.91% and 7.28% of the phenotypic variation. Previous studies have also detected grain weight-related QTLs in this region using different populations [31,32]. For instance, Peng et al. [33] identified a kernel density QTL (Qqkden1) and a kernel thickness (Yqkthi1) in bin 1.10. Similarly, the significant SNPs on chromosome 4 (4_188053528 and 4_228498570) located in bins 4.08 and 4.09 explained 1.34% and 6.75% of the phenotypic variation. Zhao et al. [34] mapped three stable QTLs controlling ear weight, cob weight, and HKW under different water stress conditions in this region. Additionally, the significant SNP 3_229327953 was located in bin 3.09. Within this interval, a QTL controlling grain protein and starch content was identified using three RIL populations in three different environments [35]. The significant SNP 5_142616635 was located in bin 5.04, and it accounts for 9.05% of the total phenotypic variation. Previous research indicated this area contains QTLs that control yield and starch content, which can be utilized for yield-related genetic improvement [36,37]. Five significant SNPs (3_122617408, 3_122617431, 3_122928920, 3_122929643, and 3_125129946) located in bin 3.04 explained a maximum phenotypic variation of 7.01%. However, no previously reported QTLs have been found in this region, suggesting that they might be novel loci associated with HKW.
Based on the physical locations of the significant SNPs and LD decay distances, 180 candidate genes for HKW were identified. Candidate genes for the significant SNP 2_2636802 include GRMZM2G010555 (alternative oxidase, AOX) and GRMZM2G102471 (encoding ubiquitin-conjugating enzyme). GRMZM2G010555 encodes an alternative oxidase (AOX), which is upregulated under low nitrogen conditions [38]. Mutations in these genes can alter the absorption efficiency of nitrogen and carbon in Arabidopsis [39]. Knockdown of the GmAOX2b gene leads to a reduction in seed yield [40]. GRMZM2G102471 encodes a ubiquitin-conjugating enzyme. Relevant studies have indicated that the ubiquity–proteasome pathway plays a critical role in regulating and controlling the grain size [41]. Overexpression of the rice ubiquitin-conjugating enzyme gene OsUBC45 enhanced disease resistance and increased grain size, thus improving yield [42]. The candidate genes for SNP 4_238711294 include GRMZM2G060669 and GRMZM2G090156. GRMZM2G060669 encodes a histone deacetylase (SAP18), which is involved in the regulation process of seed dormancy, maturity, and germination in maize [43]. Overexpression of hda101 in maize led to a reduced grain size [44]. GRMZM2G090156 encodes methyltransferase. Overexpression of a caffeic acid O-methyltransferase (OsCOMT) gene increases grain yield per plant even in a high-yield variety background [45], and silencing of the wheat SAM-dependent methyltransferases enzymes (TaSAM) can result in reduced grain yield [46].
As for SNP 5_18123084, candidate gene GRMZM2G061292 encodes a Dof transcription factor. These transcription factors are involved in the accumulation of endosperm storage proteins and starch, which are closely related to seed yield and quality. For instance, ZmDOF36 positively regulates starch accumulation in maize kernels [47]. GRMZM2G002075 and GRMZM2G138454, associated with SNP 2_186957636, are BZIP and bHLH transcription factors, respectively, and both are associated with grain development. ZmbZIP22 negatively regulates starch synthesis in maize kernels, and overexpression of ZmbZIP22 results in smaller grains and reduced grain weight [48]. Overexpression of the bHLH transcription factor ZmBES1/BZR1 significantly increases seed size and weight in Arabidopsis and rice [49]. All of the above genes are important candidate genes that control the hundred-grain weight of maize. This research provides information for the fine mapping and cloning of 100-kernel weight genes, contributing to the understanding of the developmental mechanism of maize kernels.

5. Conclusions

A genome-wide association study (GWAS) was conducted in this study using two models with 44,935 SNP markers. A total of 25 SNPs significantly associated with HKW were identified. Six significant loci were located within previously mapped QTL bins associated with grain weight. Further analysis revealed 98 candidate genes related to HKW. Among them, 21 candidate genes are most likely be related to HKW, such as GRMZM2G010555, GRMZM2G102471, GRMZM2G060669, GRMZM2G090156, GRMZM2G002075 and GRMZM2G138454. The SNP loci and candidate genes identified in this study provide important references for marker-assisted selection, fine mapping, and gene cloning related to HKW in maize.

Supplementary Materials

The following supporting information can be downloaded at: https://www.mdpi.com/article/10.3390/agronomy14122954/s1.

Author Contributions

Conceptualization, J.C.; Validation, R.W.; Formal analysis, M.W., D.C. and R.W.; Investigation, M.W., D.C., H.R., H.L. and R.W.; Resources, M.W. and C.D.; Data curation, D.C., H.R. and H.L.; Writing—Original draft, M.W.; Writing—Review & editing, C.D. and J.C.; Visualization, H.R. and H.L.; Project administration, C.D.; Funding acquisition, J.C. All authors have read and agreed to the published version of the manuscript.

Funding

This work was supported by the research program sponsored by the Central Guiding Local Development Fund Project (YDZJSX2022A036), a sub-project of the Shanxi Provincial Science and Technology Major Special Project (202201140601025-01-03), the modern agricultural industry technology system in Shanxi Province (2024CYJSTX01-09), and the Biological Breeding Engineering Project of Shanxi Agricultural University (YZGC146).

Data Availability Statement

The data are contained within the article. Further inquiries can be directed to the corresponding author.

Acknowledgments

We thank all the colleagues in our laboratory for providing useful discussions and technical assistance.

Conflicts of Interest

The authors declare no conflicts of interest.

References

  1. Shen, T.L. Development of corn industry and food security in China. Agr. Econ. 2021, 5, 44–49. [Google Scholar]
  2. Alvarez Prado, S.; Sadras, V.O.; Borrás, L. Independent genetic control of maize (Zea mays L.) kernel weight determination and its phenotypic plasticity. J. Exp. Bot. 2014, 65, 4479–4487. [Google Scholar] [CrossRef] [PubMed]
  3. Sadras, V.O. Evolutionary aspects of the trade-off between seed size and number in crops. Field Crop Res. 2007, 100, 125–138. [Google Scholar] [CrossRef]
  4. Han, Y.; Li, D.; Zhu, D.; Li, H.; Li, X.; Teng, W.; Li, W. QTL analysis of soybean seed weight across multi-genetic backgrounds and environments. Theor. Appl. Genet. 2012, 125, 671–683. [Google Scholar] [CrossRef]
  5. Kang, Y.J.; Shim, K.C.; Lee, H.S.; Jeon, Y.A.; Kim, S.H.; Kang, J.W.; Yun, Y.T.; Park, I.K.; Ahn, S.N. Fine mapping and candidate gene analysis of the quantitative trait locus gw8.1 associated with grain length in rice. Genes Genom. 2018, 40, 389–397. [Google Scholar] [CrossRef]
  6. Li, Y.; Fan, C.; Xing, Y.; Jiang, Y.; Luo, L.; Sun, L.; Shao, D.; Xu, C.; Li, X.; Xiao, J.; et al. Natural variation in GS5 plays an important role in regulating grain size and yield in rice. Nat. Genet. 2011, 43, 1266. [Google Scholar] [CrossRef]
  7. Zhang, X.; Wang, J.; Huang, J.; Lan, H.; Wang, C.; Yin, C.; Wu, Y.; Tang, H.; Qian, Q.; Li, J. Rare allele of OsPPKL1 associated with grain length causes extra-large grain and a significant yield increase in rice. Proc. Natl. Acad. Sci. USA 2012, 109, 21534–21539. [Google Scholar] [CrossRef]
  8. Song, X.-J.; Huang, W.; Shi, M.; Zhu, M.-Z.; Lin, H.-X. A QTL for rice grain width and weight encodes a previously unknown RING-type E3 ubiquitin ligase. Nat. Genet. 2007, 39, 623. [Google Scholar] [CrossRef]
  9. Raihan, M.S.; Liu, J.; Huang, J.; Guo, H.; Pan, Q.; Yan, J. Multi-environment QTL analysis of grain morphology traits and fine mapping of a kernel-width QTL in Zheng58 x SK maize population. Theor. Appl. Genet. 2016, 129, 1465–1477. [Google Scholar] [CrossRef]
  10. Liu, J.; Huang, J.; Guo, H.; Lan, L.; Wang, H.; Xu, Y.; Yang, X.; Li, W.; Tong, H.; Xiao, Y.; et al. The Conserved and Unique Genetic Architecture of Kernel Size and Weight in Maize and Rice. Plant Physiol. 2017, 175, 774–785. [Google Scholar] [CrossRef]
  11. Zhao, X.; Zhang, J.; Fang, P.; Peng, Y. Comparative QTL analysis for yield components and morphological traits in maize (Zea mays L.)under water-stressed and well-watered conditions. Breed Sci. 2019, 69, 621–632. [Google Scholar] [CrossRef] [PubMed]
  12. Su, C.; Wang, W.; Gong, S.; Zuo, J.; Li, S.; Xu, S. High Density Linkage Map Construction and Mapping of Yield Trait QTLs in Maize (Zea mays L.) Using the Genotyping-by-Sequencing (GBS) Technology. Front. Plant Sci. 2017, 8, 706. [Google Scholar] [CrossRef] [PubMed]
  13. Huang, J.; Lu, G.; Liu, L.; Raihan, M.S.; Xu, J.; Jian, L.; Zhao, L.; Tran, T.M.; Zhang, Q.; Liu, J.; et al. The kernel size-related quantitative trait locus qKW9 encodes a pentatricopeptide repeat protein that affects photosynthesis and grain flling. Plant Physiol. 2020, 183, 1696–1709. [Google Scholar] [CrossRef] [PubMed]
  14. Chen, L.; Li, Y.X.; Li, C.; Shi, Y.; Song, Y.; Zhang, D.; Wang, H.; Li, Y.; Wang, T. The retromer protein ZmVPS29 regulates maize kernel morphology likely through an auxin-dependent process(es). Plant Biotechnol. J. 2020, 18, 1004–1014. [Google Scholar] [CrossRef]
  15. Pasam, R.K.; Sharma, R.; Malosetti, M.; van Eeuwijk, F.A.; Haseneyer, G.; Kilian, B.; Graner, A. Genome-wide association studies for agronomical traits in a world wide spring barley collection. BMC Plant Biol. 2012, 12, 16. [Google Scholar] [CrossRef]
  16. Thornsberry, J.M.; Goodman, M.M.; Doebley, J.; Kresovich, S.; Nielsen, D.; Buckler, E.S. Dwarf8 polymorphisms associate with variation in flowering time. Nat. Genet. 2001, 28, 286–289. [Google Scholar] [CrossRef]
  17. Wilson, L.M.; Whitt, S.R.; Ibáñez, A.M.; Rocheford, T.R.; Goodman, M.M.; Buckler, E.S., IV. Dissection of maize kernel composition and starch production by candidate gene associations. Plant Cell 2004, 16, 2719–2733. [Google Scholar] [CrossRef]
  18. Godfray, H.C.; Beddington, J.R.; Crute, I.R.; Haddad, L.; Lawrence, D.; Muir, J.F.; Pretty, J.; Robinson, S.; Thomas, S.M.; Toulmin, C. Food security: The challenge of feeding 9 billion people. Science 2010, 327, 812–818. [Google Scholar] [CrossRef]
  19. Peng, B.; Zhao, X.L.; Wang, W.Y.; Li, C.H.; Li, Y.X.; Zhang, D.F.; Shi, Y.S.; Song, C.Y.; Wang, T.Y.; Li, Y. Genome wide association analysis of leaf orientation values in Maize. Crop J. 2020, 46, 819–831. [Google Scholar]
  20. Ma, J.; Cao, Y.Y.; Li, H.Y. Genome wide association analysis of corn cob diameter. Crop J. 2021, 47, 1228–1238. [Google Scholar]
  21. Qu, J.Z.; Feng, W.H.; Zhang, X.H.; Xu, S.T.; Xue, J.Q. Genome wide association analysis of maize grain size. Crop J. 2022, 48, 304–319. [Google Scholar]
  22. Knapp, S.J.; Stroup, W.W.; Ross, W.M. Exact confidence intervals for heritability on a progeny mean basis. Crop Sci. 1985, 25, 192–194. [Google Scholar] [CrossRef]
  23. Chen, S.; Zhou, Y.; Chen, Y.; Gu, J. fastp: An ultra-fast all-in-one FASTQ preprocessor. Bioinformatics 2018, 34, i884–i890. [Google Scholar] [CrossRef] [PubMed]
  24. Li, H.; Durbin, R. Fast and accurate short read alignment with Burrows-Wheeler transform. Bioinformatics 2009, 25, 1754–1760. [Google Scholar] [CrossRef] [PubMed]
  25. McKenna, A.; Hanna, M.; Banks, E.; Sivachenko, A.; Cibulskis, K.; Kernytsky, A.; Garimella, K.; Altshuler, D.; Gabriel, S.; Daly, M.; et al. The Genome Analysis Toolkit: A MapReduce framework for analyzing next-generation DNA sequencing data. Genome Res. 2010, 20, 1297–1303. [Google Scholar] [CrossRef]
  26. Purcell, S.; Neale, B.; Todd-Brown, K.; Thomas, L.; Ferreira, M.A.; Bender, D.; Maller, J.; Sklar, P.; de Bakker, P.I.; Daly, M.J.; et al. PLINK: A tool set for whole-genome association and population-based linkage analyses. Am. J. Hum. Genet. 2007, 81, 559–575. [Google Scholar] [CrossRef]
  27. Yang, L.; Li, T.; Tian, X.; Yang, B.; Lao, Y.; Wang, Y.; Zhang, X.; Xue, J.; Xu, S. Genome-wide association study (GWAS) reveals genetic basis of ear-related traits in maize. Euphytica 2020, 216, 172. [Google Scholar] [CrossRef]
  28. Zhu, X.M.; Shao, X.Y.; Pei, Y.H.; Guo, X.M.; Li, J.; Song, X.Y.; Zhao, M.A. Genetic diversity and genome-wide association study of major ear quantitative traits using high-density SNPs in maize. Front. Plant Sci. 2018, 9, 966. [Google Scholar] [CrossRef]
  29. Xiao, Y.; Tong, H.; Yang, X.; Xu, S.; Pan, Q.; Qiao, F.; Raihan, M.S.; Luo, Y.; Liu, H.; Zhang, X.; et al. Genome-wide dissection of the maize ear genetic architecture using multiple populations. New Phytol. 2016, 210, 1095–1106. [Google Scholar] [CrossRef]
  30. Xiao, Y.; Liu, H.; Wu, L.; Warburton, M.; Yan, J. Genome-wide Association Studies in maize: Praise and Stargaze. Mol. Plant. 2017, 10, 359–374. [Google Scholar] [CrossRef]
  31. Melchinger, A.E.; Utz, H.F.; Schön, C.C. Quantitative trait locus (QTL) mapping using different testers and independent population samples in maize reveals low power of QTL detection and large bias in estimates of QTL effects. Genetics 1998, 149, 383–403. [Google Scholar] [CrossRef] [PubMed]
  32. Ribaut, J.M.; Jiang, C.; Gonzalez-de-Leon, D.; Edmeades, G.O.; Hoisington, D. A Identification of quantitative trait loci under drought conditions in tropical maize. 2. Yield components and marker-assisted selection strategies. Theor. Appl. Genet. 1997, 94, 887–896. [Google Scholar] [CrossRef]
  33. Peng, B.; Li, Y.; Wang, Y.; Liu, C.; Liu, Z.; Tan, W.; Zhang, Y.; Wang, D.; Shi, Y.; Sun, B.; et al. QTL analysis for yield components and kernel-related traits in maize across multi-environments. Theor. Appl. Genet. 2011, 122, 1305–1320. [Google Scholar] [CrossRef] [PubMed]
  34. Zhao, X.; Peng, Y.; Zhang, J.; Fang, P.; Wu, B. Identification of QTLs and meta-QTLs for seven agronomic traits in multiple maize populations under well-watered and water-stressed conditions. Crop Sci. 2018, 58, 507–520. [Google Scholar] [CrossRef]
  35. Wang, Z.; Liu, N.; Ku, L.; Tian, Z.; Shi, Y.; Guo, S.; Su, H.; Zhang, L.; Ren, Z.; Li, G.; et al. Dissection of the genetic architecture for grain quality-related traits in three RIL populations of maize (Zea mays L.). Plant Breed. 2016, 135, 38–46. [Google Scholar] [CrossRef]
  36. Yang, G.; Dong, Y.; Li, Y.; Wang, Q.; Shi, Q.; Zhou, Q. Verification of QTL for grain starch content and its genetic correlation with oil content using two connected RIL populations in high-oil maize. PLoS ONE 2013, 8, e53770. [Google Scholar] [CrossRef]
  37. Jiménez-Galindo, J.C.; Ordás, B.; Butrón, A.; Samayoa, L.F.; Malvar, R.A. QTL mapping for yield and resistance against mediterranean corn borer in maize. Front. Plant Sci. 2017, 8, 698. [Google Scholar] [CrossRef]
  38. Watanabe, C.K.; Hachiya, T.; Takahara, K. Effects of AOX1a deficiency on plant growth, gene expression of respiratory components and metabolic profile under low-nitrogen stress in Arabidopsis thaliana. Plant Cell Physiol. 2010, 51, 810–822. [Google Scholar] [CrossRef]
  39. Gandin, A.; Denysyuk, M.; Cousins, A.B. Disruption of the mitochondrial alternative oxidase (AOX) and uncoupling protein (UCP) alters rates of foliar nitrate and carbon assimilation in Arabidopsis thaliana. J. Exp. Bot. 2014, 65, 3133–3142. [Google Scholar] [CrossRef]
  40. Chai, T.T.; Simmonds, D.; Day, D.A.; Colmer, T.D.; Finnegan, P.M. A GmAOX2b antisense gene compromises vegetative growth and seed production in soybean. Planta 2012, 236, 199–207. [Google Scholar] [CrossRef]
  41. Li, N.; Xu, R.; Li, Y. Molecular networks of seed size control in plants. Annu. Rev. Plant Biol. 2019, 70, 435–463. [Google Scholar] [CrossRef] [PubMed]
  42. Wang, Y.; Yue, J.; Yang, N.; Chuan, Z.; Zheng, C.; Zheng, Y.N.; Wu, X.; Yang, J.; Zhang, H.W.; Liu, L.L.; et al. An ERAD-related ubiquitin-conjugating enzyme boosts broad-spectrum disease resistance and yield in rice. Nat. Food 2023, 4, 774–787. [Google Scholar] [CrossRef] [PubMed]
  43. Wang, Z.; Cao, H.; Chen, F.; Liu, Y. The roles of histone acetylation in seed performance and plant development. Plant Physiol. Biochem. 2014, 84, 125–133. [Google Scholar] [CrossRef]
  44. Rossi, V.; Locatelli, S.; Varotto, S.; Donn, G.; Pirona, R.; Henderson, D.A.; Hartings, H.; Motto, M. Maize histone deacetylase hda101 is involved in plant development, gene transcription, and sequence-specific modulation of histone modification of genes and repeats. Plant Cell 2007, 19, 1145–1162. [Google Scholar] [CrossRef]
  45. Huangfu, L.; Chen, R.; Lu, Y.; Zhang, E.; Miao, J.; Zuo, Z.; Zhao, Y.; Zhu, M.; Zhang, Z.; Li, P. OsCOMT, encoding a caffeic acid O-methyltransferase in melatonin biosynthesis, increases rice grain yield through dual regulation of leaf senescence and vascular development. Plant Biotechnol. J. 2022, 20, 1122–1139. [Google Scholar] [CrossRef]
  46. Malla, K.B.; Thapa, G.; Doohan, F.M. Mitochondrial phosphate transporter and methyltransferase genes contribute to Fusarium head blight Type II disease resistance and grain development in wheat. PLoS ONE 2021, 16, e0258726. [Google Scholar] [CrossRef]
  47. Qi, X.; Li, S.; Zhu, Y.; Zhao, Q.; Zhu, D.; Yu, J. ZmDof3, a maize endosperm-specific Dof protein gene, regulates starch accumulation and aleurone development in maize endosperm. Plant Mol. Biol. 2017, 93, 7–20. [Google Scholar] [CrossRef]
  48. Dong, Q.; Xu, Q.; Kong, J.; Peng, X.; Zhou, W.; Chen, L.; Wu, J.; Xiang, Y.; Jiang, H.; Cheng, B. Overexpression of ZmbZIP22 gene alters endosperm starch content and composition in maize and rice. Plant Sci. 2019, 283, 407–415. [Google Scholar] [CrossRef]
  49. Sun, F.; Ding, L.; Feng, W.Q.; Cao, Y.; Lu, F.Z.; Yang, Q.Q.; Li, W.C.; Lu, Y.L.; Shabek, N.; Fu, F.L.; et al. Maize transcription factor ZmBES1/BZR1-5 positively regulates kernel size. J. Exp. Bot. 2021, 72, 1714–1726. [Google Scholar] [CrossRef]
Figure 1. Correlation analysis for 100-grain weight. The significance levels of 0.001 are marked with ***.
Agronomy 14 02954 g001
Figure 2. Manhattan and QQ plots of significant SNP for 100-kernel weight. XZ, Xinzhou; YC, Yuci; B, Blink; F, FarmCPU.
Agronomy 14 02954 g002
Figure 3. Population linkage disequilibrium (LD).
Agronomy 14 02954 g003
Figure 4. Allelic effects analysis of significant SNPs associated with HKW.
Agronomy 14 02954 g004aAgronomy 14 02954 g004b
Table 1. Statistical analysis of 100-grain weight in different years and locations.
YearLocationMeanMaxMinKURTSKEWSDCV (%)H2 (%)
2019YC26.0144.5215.810.790.585.3020.3585.64
XZ26.9744.5816.720.770.485.2219.35
2020YC30.7955.0017.830.440.386.9222.49
XZ30.0244.2114.23−0.17−0.296.4721.54
2021YC28.1242.5416.76−0.150.345.1918.46
XZ29.3441.5616.340.08−0.245.4219.93
BLUP28.2442.3418.430.120.414.5616.17
Note: The units of the mean, maximum and minimum values are grams (g); YC and XZ represent the Yuci test area and Xinzhou test area.
Table 2. The joint variance analysis of 200 maize inbred lines’ HKW.
Source of VariationSum of SquaresDFMean SquaresF-Value
Location (L)660413302149.803 ***
Year (Y)162160.710
Genotype (G)49,54919825011.352 ***
Y × L545227312.368 ***
L × G11,372330341.563 ***
Y × G311916819.000.842
Y × L × G6867326210.969
Residuals21,69198422
Note: The significance levels of 0.001 are marked with ***.
Table 3. Candidate genes for 100-kernel weight and functional annotation.
MethodSNPIDChr.p-ValueR2 (%)Envir.Candidate Genes
FarmCPU1_27430244111.09 × 10−84.912021YCGRMZM2G135283 (Serine hydroxymethyltransferase)
FarmCPU2_263680221.17 × 10−51.022020YCGRMZM2G010555 (alternative oxidase); GRMZM2G102471 (ubiquitin-conjugating enzyme 30)
FarmCPU3_12261740831.93 × 10−51.502019XZ--
FarmCPU3_12261743131.93 × 10−57.012019XZ--
FarmCPU3_12292892031.93 × 10−52.102019XZGRMZM2G045435 (beta-1,4-N-acetylglucosaminyltransferase family protein)
FarmCPU3_12292964331.93 × 10−54.012019XZ-
FarmCPU/Blink3_12512994631.88 × 10−58.122019XZ,2019XZ-
FarmCPU3_22932795332.22 × 10−60.012021YCGRMZM2G093175 (Asparagine synthetase); GRMZM2G354558 (Omega-3 fatty acid desaturase)
FarmCPU3_3600992631.74 × 10−52.222021YC
FarmCPU/Blink4_23871129448.27 × 10−6/1.47 × 10−87.44BLUP/2019YCGRMZM2G060669 (Histone deacetylase complex subunit SAP18, GRMZM2G090156 (Methyltransferases)
FarmCPU/Blink5_14261663557.45 × 10−10/1.27 × 10−69.052021XZ/2021YCGRMZM2G162748 (Cytochrome b6-f complex iron-sulfur subunit)
FarmCPU5_1812308451.63 × 10−61.322019XZGRMZM2G061292 (Dof transcription factor gene); GRMZM2G320754 (B3 domain transcription factors)
FarmCPU5_20109230755.99 × 10−70.152020YCGRMZM2G101287 (Adenine nucleotide alpha hydrolases-like superfamily protein); GRMZM2G347767 (Isoflavone reductase)
Blink1_5086406615.66 × 10−87.172019XZ-
Blink4_149046144.10 × 10−64.462019XZGRMZM2G015232 (Putative cytochrome P450 superfamily protein); GRMZM2G349791(O-methyltransferase ZRP4)
Blink5_21035419359.97 × 10−61.062019XZGRMZM2G113418 (Glutaredoxin 2); GRMZM2G154332 (SAUR12-auxin-responsive SAUR family member)
Blink2_18695763623.55 × 10−710.772019YCGRMZM2G002075 (BZIP transcription factor;); GRMZM2G138454 (bHLH transcription factor)
Blink1_29848727813.54 × 10−77.282021XZGRMZM2G159353 (putative cytochrome P450 superfamily protein)
Blink2_6560203921.19 × 10−76.052021XZGRMZM2G015024 (50S ribosomal protein L22,ribosomal protein L22)
Blink2_7933507122.076 × 10−66.552021XZ-
Blink3_17754342634.31 × 10−76.172021XZ-
Blink4_18805352841.16 × 10−61.342021YC-
Blink3_17877923931.35 × 10−87.31BLUP-
Blink4_22849857045.34 × 10−146.75BLUP-
Blink5_6845559051.12 × 10−94.95BLUP-
Disclaimer/Publisher’s Note: The statements, opinions and data contained in all publications are solely those of the individual author(s) and contributor(s) and not of MDPI and/or the editor(s). MDPI and/or the editor(s) disclaim responsibility for any injury to people or property resulting from any ideas, methods, instructions or products referred to in the content.

